Monthly Labor Review • March 2011 39 Manufacturing in China Judith Banister and George Cook I n 2006, China became the United States’ second-largest trading partner in manufactured goods behind Can- ada. 1 Only 4 years later, China surpassed Japan as the second-largest economy in the world. 2 Because of China’s growing impor- tance to the U.S. and global economies, there has been great demand for statistics about China’s manufacturing sector, par- ticularly employment statistics and com- parable labor-cost measurements. In 2005, the Bureau of Labor Statistics sponsored a baseline research project to assess the qual- ity of China’s data on employment and labor compensation in manufacturing. e result- ing report contains estimates of compensa- tion costs in China’s manufacturing sector for the base year of 2002. 3 e data sources and estimation procedures used in that original work have been the basis for updates through 2006 and, in this article, through 2008. 4 Building on the baseline report and subsequent articles, this article documents and analyzes changes in China’s manufacturing employment and hourly labor compensation costs on the basis of official data through 2008 and anecdotal reports from China since then. e recent global economic crisis, which escalated rapidly in the second half of 2008, has contributed to jolting shifts in the man- ufacturing sector in the United States and China as well as many other developed and developing economies. Even so, China’s manufacturing employment continued to grow from a total of 97.91 million at the end of 2007 to 99.01 million at yearend 2008. ough manufacturing workers in China are earning more than ever before, average hourly compensation costs were only $1.36 in 2008. China’s hourly compensation costs remain far below those of many of its East Asian neighbors like Japan ($27.80) and Taiwan ($8.68), but are roughly on par with those of others like the Philippines ($1.68). 5 is article first reviews sources of data on China’s manufacturing sector and then presents recent trends in China’s employ- ment and labor compensation in manufac- turing through 2008. e article updates the previous BLS estimates of hourly earn- ings and hourly compensation costs in man- ufacturing and highlights ongoing changes for workers in China’s manufacturing sec- tor. Comparisons of China’s hourly manu- facturing compensation costs with those of other nations around the world, including the United States, India, and a number of Judith Banister is a senior consultant with Javelin Investments. She is the former head of the International Programs Center at the U.S. Census Bureau. Dr. Banister may be reached by email at judith_banister@yahoo. com. George Cook is an economist formerly in the Division of International Labor Comparisons, Bureau of Labor Statistics. China’s employment and compensation costs in manufacturing through 2008 Despite large increases in recent years, hourly compensation costs in China’s manufacturing sector remained only 4 percent of those in the United States in 2008; that year, hourly compensation costs rose to $1.36, as China’s manufacturing employment continued to increase despite the beginning of the global economic downturn
Transcript
Monthly Labor Review • March 2011 39
Manufacturing in China
Judith Banister andGeorge Cook In 2006, China became the United
States’ second-largest trading partner in manufactured goods behind Can-
ada.1 Only 4 years later, China surpassed Japan as the second-largest economy in the world.2 Because of China’s growing impor-tance to the U.S. and global economies, there has been great demand for statistics about China’s manufacturing sector, par-ticularly employment statistics and com-parable labor-cost measurements. In 2005, the Bureau of Labor Statistics sponsored a baseline research project to assess the qual-ity of China’s data on employment and labor compensation in manufacturing. The result-ing report contains estimates of compensa-tion costs in China’s manufacturing sector for the base year of 2002.3
The data sources and estimation procedures used in that original work have been the basis for updates through 2006 and, in this article, through 2008.4 Building on the baseline report and subsequent articles, this article documents and analyzes changes in China’s manufacturing employment and hourly labor compensation costs on the basis of official data through 2008 and anecdotal reports from China since then.
The recent global economic crisis, which
escalated rapidly in the second half of 2008, has contributed to jolting shifts in the man-ufacturing sector in the United States and China as well as many other developed and developing economies. Even so, China’s manufacturing employment continued to grow from a total of 97.91 million at the end of 2007 to 99.01 million at yearend 2008. Though manufacturing workers in China are earning more than ever before, average hourly compensation costs were only $1.36 in 2008. China’s hourly compensation costs remain far below those of many of its East Asian neighbors like Japan ($27.80) and Taiwan ($8.68), but are roughly on par with those of others like the Philippines ($1.68).5
This article first reviews sources of data on China’s manufacturing sector and then presents recent trends in China’s employ-ment and labor compensation in manufac-turing through 2008. The article updates the previous BLS estimates of hourly earn-ings and hourly compensation costs in man-ufacturing and highlights ongoing changes for workers in China’s manufacturing sec-tor. Comparisons of China’s hourly manu-facturing compensation costs with those of other nations around the world, including the United States, India, and a number of
Judith Banister is a senior consultant with Javelin Investments. She is the former head of the International Programs Center at the U.S. Census Bureau. Dr. Banister may be reached by email at [email protected]. George Cook is an economist formerly in the Division of International Labor Comparisons, Bureau of Labor Statistics.
China’s employment and compensation costs in manufacturing through 2008
Despite large increases in recent years, hourly compensation costs in China’s manufacturing sector remained only 4 percent of those in the United States in 2008; that year, hourly compensation costs rose to $1.36, as China’s manufacturing employment continued to increase despite the beginning of the global economic downturn
Manufacturing in China
40 Monthly Labor Review • March 2011
East Asian economies, also are included.
Available data sources
China’s published statistics on employment and wages in manufacturing do not meet international standards. No source of frequently published, official data provides nationwide employment and labor compensation statistics on Chinese manufacturing. To obtain reliable, annually updated, national employment and earnings numbers, data must be drawn from two sources. Data for formal, urban enterprises are collected and reported by the Ministry of Human Resources and Social Security (formerly called the Ministry of Labor and Social Security), while data for other manufacturing units —that is, town and village enterprise (TVE) data6—are compiled and reported by the Ministry of Agriculture. TVEs were originally established in China’s Maoist Communist period to give rural peasants and town dwellers jobs outside subsistence agriculture without any need for them to migrate to large cities. The primary purpose was rural industrialization in China, to prevent overurbanization of the population and massive urban slums. Because of this policy, almost two-thirds of China’s manufacturing workers are now employed in TVEs, while just over one-third work in urban units.
The published annual data on China’s employment and wages in manufacturing are based on an annual reporting system from work units that originally reflected a planned Marxist economy and that emphasized urban data over rural data. In the decades from 1949 to the economic reforms beginning in 1978, essentially all industries in China’s cities were state owned and state run, and the government focused on documenting industrialization and progress in the cities. During that time, rural China was organized into collectives that owned and ran the TVEs; few data were collected from the collectives in the countryside. Today, there continue to be comparatively detailed yearly figures on employment and earnings in urban manufacturing units that are published in easily accessible statistical volumes.
In contrast, only a small number of labor-related statistics are published describing China’s large network of factories and small manufacturing units besides urban units. The majority of China’s manufacturing workers are employed in TVEs, yet each year only two official relevant figures are published about them: the total number of manufacturing employees who work in TVEs and the total annual wage bill for those manufacturing workers.7
Estimates for total employment and average hourly
compensation costs for China’s manufacturing sector are constructed by combining the ample urban data with the less plentiful figures on TVE manufacturing. Important gaps in the TVE data are filled by estimating nonwage components of labor compensation as well as the number of hours worked per year. These national estimates for China cannot be considered as robust as the manufacturing statistics for most developed economies, but the accumulated evidence to date supports the general validity of the BLS calculations on China’s employment and labor compensation in manufacturing.8
Total yearend manufacturing employment
Total yearend manufacturing employment in China is derived by adding manufacturing employment in urban units to manufacturing employment in TVEs (table 1). These figures are far higher than the official data on total manufacturing employment, which were last published in 2002. The official published yearend total of 83.07 million workers for 2002 comprised 29.81 million manufacturing employees in urban units, 45.06 million manufacturing employees of registered manufacturing enterprises outside of areas classified as urban (the more formal component of TVE manufacturing), and another 8.21 million informal manufacturing workers said to be located in urban areas but operating outside of established enterprises.9 The sum of manufacturing employment from urban units (29.81 million) and TVEs (70.87 million) was 100.67 million at yearend 2002, more than 17 million higher than the official reported number (table 1).
In this article, total manufacturing employment for China is calculated by combining TVE (rather than “rural”) manufacturing employment with manufacturing employment in urban units. This procedure is necessary in order to calculate annual updates for China’s nationwide employment and labor compensation in manufacturing. The reasons that the procedure is necessary are twofold. First, though yearly data are published on employment and wages in urban manufacturing units, China’s National Bureau of Statistics stopped publishing a number for “rural” manufacturing employment after 2002, as mentioned earlier. Second, China’s official sources have never published corresponding wage data for “rural” manufacturing employees, whereas annual earnings data are published for TVE employees. For these reasons, TVE data from the Ministry of Agriculture are used to represent groups other than urban units.
Readers will note a sudden discontinuity in table 1 in the series for the total yearend manufacturing employment
Monthly Labor Review • March 2011 41
Table 1. Yearend manufacturing employment in China, 1978–2008[In millions]
1 This is a translation of the Chinese “gongye,” which refers to manufactur-ing, mining, and the production and supply of electricity, gas, and water.
NOTE: Dashes indicate data not available. There is a long time series for TVE “industry” (manufacturing, mining, and utilities) data, but separate reporting of the manufacturing component of TVE industry began only in 2002. For the purpose of constructing a longer time series, TVE manufac-turing employment during each of the years 1990–2001 is assumed to be 92.4 percent of TVE industry employment as calculated with the published figures for 2002. Manufacturing employment in urban units has been pub-lished for 1994–2008. Figures for years before 1994 are estimated by using the trend found among urban “staff and workers” in manufacturing, a sub-group that accounts for 99 percent of urban manufacturing employees be-tween 1994 and 1997. There is a break in the series for TVE manufacturing and “industry” employment in 1997, 1998, and 2007, and there is therefore also a break in the series for manufacturing employment in urban units and
SOURCES: Data for 1978–2006 are taken from Erin Lett and Judith Ban-ister, “China’s manufacturing employment and compensation costs: 2002–06,” Monthly Labor Review, April 2009, p.32; China National Bureau of Statis-tics and China Ministry of Human Resources and Social Security, compilers, China Labor Statistical Yearbook 2009 (Beijing, China Statistics Press, 2009), p. 12; China Ministry of Agriculture, China Agriculture Yearbook, 2008 [in Chi-nese] (Beijing, China Agriculture Press, 2008), p. 232; China Ministry of Agri-culture and China TVE Yearbook Editorial Committee, editors, China Village and Town Enterprise Yearbook, 2009 [in Chinese] (Beijing, China Agriculture Publishing House, 2009), p. 99.
TVEs (yearend and average) for the same years. There is a break in the series for urban units manufacturing employment in 1998, and therefore also in the series for manufacturing employment in urban units and TVEs (yearend and average) for the same year.
(comprising urban units and TVEs). The yearend total was increasing from 2002 through 2006, likely representing a real trend of rising manufacturing employment in China. Then, the total number dropped by about 15 million from 2006 to 2007. Table 1 shows that there was no apparent
disruption in urban units’ employment figures and that the entire decline came from TVE employment. The em-ployment and earnings tables for TVEs in the China La-bor Statistical Yearbook 2008 include a footnote indicating that official statistical organizations decided to drop self-
Manufacturing in China
42 Monthly Labor Review • March 2011
employed workers from the TVE manufacturing employ-ment series for 2007 and subsequent years. 10 Because of the change, the TVE employment series showed a drop of 16 million from yearend 2006 (79.11 million) to yearend 2007 (63.26 million). This numerical change is not part of a real trend but instead constitutes a break in the series. Breaks in series are not unfamiliar in Chinese manufac-turing employment data; similar breaks can be seen in TVE data from 1996 to 1998 and in data on urban units from 1997 and 1998.11 Despite the statistical breaks, it is still clear that the actual trend for the whole decade from 1999 to 2008 is that TVE manufacturing employment in-creased every year from yearend 1998 to 2006 and that the rising trend continued (after the most recent change
in statistical concepts) from yearend 2007 to yearend 2008 (table 1).
From yearend 2007 to yearend 2008, China’s total manufacturing employment (no longer including self-employed manufacturing workers) increased by 1.1 mil-lion, from 97.91 million to 99.01 million, but the rise in manufacturing employment was all in TVEs. Urban manufacturing units registered a drop in employment of 311,000 over the same period (tables 1 and 2).
Table 2 shows annual employment in urban manufactur-ing units from 2002 through yearend 2008 by subsector. From 2003 through 2007, total manufacturing employ-ment in urban units rose every year. A few urban manu-facturing subsectors had declining employment numbers
Table 2. Urban manufacturing employment in China, by subsector, 2002–08
NOTE: The data in this table refer only to urban manufacturing employ-ment. The subsectors listed here do not sum to the total manufacturing in urban units, but the difference between total manufacturing employment and the sum of manufacturing employment in the listed industries is less than 2 percent in all years.
SOURCES: Data for all years were collected by the China National Bureau of Statistics and China Ministry of Human Resources and Social Security. Data for 2002 through 2004 are from Erin Lett and Judith Banister, “Labor
costs of manufacturing employees in China: an update to 2003–04,” Month-ly Labor Review, November 2006, p 45. Data for 2005 are from China Labor Statistical Yearbook 2006 (Beijing, China Statistics Press, 2006), pp. 185–200. Data for 2006 are from China Labor Statistical Yearbook 2007 (Beijing, China Statistics Press, 2007), pp. 203–218. Data for 2007 are from China Labor Sta-tistical Yearbook 2008 (Beijing, China Statistics Press, 2008), pp. 179–194. Data for 2008 are from China Labor Statistical Yearbook 2009 (Beijing, China Statistics Press, 2009), pp. 193–208.
Monthly Labor Review • March 2011 43
in several or all of those years (for example, printing and record medium production, and tobacco processing), but most urban manufacturing subsectors were hiring steadily throughout much of the period from 2002 to 2007. Then the global economic downturn caused shrinking markets for Chinese exports in the United States and Europe,12 resulting in a decline in employment in the urban Chi-nese manufacturing sector in 2008. The largest reduc-tions in urban manufacturing employment from 2007 to the end of 2008 were in textiles; nonmetal mineral prod-ucts; leather, fur, and down products; timber and bam-boo processing; ordinary machinery manufacturing; and smelting and pressing of ferrous metals (table 2). Some of China’s manufacturing subsectors appeared to be unaf-fected by the global downturn; in 2008, several indus-tries within urban manufacturing added employees—for example, medical and pharmaceutical products, beverage manufacturing, tobacco processing (which previously had been reducing employment), garments and other fiber product manufacturing, smelting and pressing of nonfer-rous metals, special purpose equipment manufacturing, transportation equipment manufacturing, and electrical equipment and machinery manufacturing. These more resilient sectors may be those with a strong domestic Chinese market. This is demonstrated in the sales values of China’s domestic trade (wholesale and retail) in phar-maceuticals, beverages, tobacco, garments, vehicles, and household electrical appliances, which rose steeply from 2007 to 2008 (after adjustments for price changes for these goods in Chinese yuan).13
Calculating compensation costs
Manufacturing employment is of course an important factor in understanding China’s international trade com-petitiveness, but it is critical to couple this information with labor costs. The following sections update previ-ous articles from the Monthly Labor Review with hourly compensation data from 2007 and 2008. The estimates are based on the same statistical sources as the employ-ment data constructed in the previous section and there-fore reflect compensation for China’s total manufacturing employment—that is, the sum of employment in manu-facturing urban units and employment in manufacturing TVEs. As with the employment data described earlier, both the Ministry of Human Resources and Social Secu-rity (urban units) and the Ministry of Agriculture (TVEs) publish an annual earnings figure that includes wages, bonuses, and allowances paid to employees in cash or in kind. Aggregate earnings data for urban units and TVEs
are combined to construct an estimate of direct labor costs in China’s manufacturing sector.14
Direct labor costs are combined with nonwage com-pensation costs to attain total annual compensation costs for manufacturing workers in both TVEs and urban units. Annual compensation data are then divided by an-nual hours to create an estimate of hourly compensation. Hourly compensation is a preferred measurement of com-pensation costs across countries, because hours can vary widely from one country to another and hourly compen-sation data account for that. The following two sections respectively discuss how estimates for hours worked and nonwage compensation costs are derived.
Hours worked
A detailed description of the methods used to calculate the original 2002 estimates of hours worked for China can be found in Judith Banister’s August 2005 Monthly Labor Review article.15 For the 2002 estimate of hour-ly compensation costs in China’s manufacturing sector, the annual number of hours that urban manufacturing employees worked was derived from the Ministry of La-bor’s labor force survey. In 2002, the Ministry of Labor published two weekly hours-worked estimates for urban areas—one referring to a week in spring and the other referring to a week in autumn. These two estimates were averaged and then adjusted to an annual basis by using an estimate of the average number of weeks worked per year by urban manufacturing employees.16 For 2003 and be-yond, hours-worked data for the spring reference period have not been published. The estimates of hours worked by urban employees for these years are based on percent changes in the number of hours worked in the autumn reference period relative to the same reference period in the previous year. These percent changes are then applied to the previous year’s annual-hours-worked estimate to derive an estimate of annual hours worked from 2003 through 2008.
The published data on average weekly hours worked in China’s urban manufacturing sector at the beginning of November each year show a decrease from 50.4 hours per week in 2006 to 47.9 hours per week in 2008.17 Because there are no published data to update the estimate of hours worked by TVE manufacturing employees, the per-cent changes used for urban areas are applied to the 2002 TVE annual hours worked estimate for each of the sub-sequent years. For the purposes of this article, from 2003 onward, data on hours worked by both urban and TVE employees have been estimated on the basis of changes in
Manufacturing in China
44 Monthly Labor Review • March 2011
the number of hours worked in the autumn reference pe-riod relative to the same reference period in the previous year from China’s urban labor force survey. These percent changes are then applied to the previous year’s annual-hours-worked estimate to derive an estimate of annual hours worked for the year in question.18
Nonwage compensation costs
In order to estimate total compensation costs for China’s manufacturing employees, employer payments for so-cial benefits such as workers’ compensation, unemploy-ment insurance, medical insurance, and old-age pension funds must be added to the published earnings figures. For urban establishments, the relevant data for calculat-ing social benefits as a percentage of total earnings are from a survey that China’s Ministry of Labor conducted with reference to 2002. Social benefits as a percentage of total earnings for TVE employees, on the other hand, was based on a survey of large manufacturing enterprises in Nanjing Municipality for the years 1994–2001 as well as assumptions about the level of benefits in large versus small establishments and between enterprises located in suburban areas and those in rural areas. The results of these surveys were used to construct the original 2002 estimates of China’s manufacturing compensation costs.19 The authors have been unable to find published data from any subsequent surveys of urban establishments or busi-
Table 3. Estimated compensation costs of manufacturing employees in China, 2007–08
Category of manufacturing
Average number of employees
(in millions)
Annual earnings per em-ployee
(in yuan)
Annual compensation per employee
Monthly compensation per employee
Hourly compensation per employee
yuan U.S. dollars yuan U.S. dollars yuan U.S. dollars
2007
Urban units and TVEs (town and village enterprises)........................ 96.65 14,382 18,948 2,491 1,579 208 8.06 1.06Urban units..................................... 34.08 21,144 32,519 4,276 2,710 356 13.89 1.83TVEs................................................... 62.56 10,698 11,554 1,519 963 127 4.89 0.64
NOTE: Total compensation costs are 1.538 times earnings for urban workers and 1.080 times earnings for TVE workers. U.S. dollars are calcu-lated at the prevailing market exchange rate: 7.6058 yuan = 1 U.S. dollar in 2007 and 6.9477 yuan = 1 U.S. dollar in 2008.
SOURCES: Employment data are from table 1 of this article. Earnings data for 2007 are from China National Bureau of Statistics and China Minis-try of Human Resources and Social Security, compilers, China Labor Statisti-cal Yearbook 2008 (Beijing, China Statistics Press, 2008), p. 179; and China
Ministry of Agriculture, China TVE Yearbook Editorial Committee, eds., Chi-na Agricultural Yearbook 2008 [in Chinese] (Beijing, China Agriculture Press, 2008), p. 233. Earnings data for 2008 are from China National Bureau of Statistics and China Ministry of Human Resources and Social Security, com-pilers, China Labor Statistical Yearbook 2009 (Beijing, China Statistics Press, 2009), p. 193; and China Ministry of Agriculture, compiler, China Village and Town Enterprise Yearbook 2009 [in Chinese] (Beijing, China Agriculture Pub-lishing House, 2009), p. 100.
nesses outside the cities in the aforementioned survey that would adequately update the information on labor com-pensation costs beyond the wage. Therefore, the ratio of employer expenditures for social benefits to direct labor costs is held constant, at the 2002 level, for the 2003–08 estimates.
Results
Table 3 shows average annual earnings, adjusted by add-ing estimates for additional components of total labor cost, such as required social insurance payments. The table also displays annual, monthly, and hourly compen-sation figures in both yuan and U.S. dollars, calculated at the market exchange rate for each year. Employment in Chinese manufacturing averaged 96.65 million during 2007, rising to an average of 98.46 million during 2008. Average yearly earnings (the basic wage in cash and in kind) totaled 14,382 yuan for 2007 and 16,367 yuan in 2008 (table 3).
The earnings data for TVEs (table 4), like the employ-ment data discussed earlier, include a break in series caused by the exclusion of the self-employed after 2006. Because of this break, earnings data from before 2007 for total manufacturing and TVEs are not directly compara-ble to data from 2007 and beyond.20 This recent statistical change improves the quality of TVE data by creating data that are more comparable with data for Chinese urban
Monthly Labor Review • March 2011 45
1 Before 2007, self-employed workers were included in TVE manufactur-ing data; since 2007, these workers have been excluded. This causes a break in 2007 in the series for hourly compensation in TVEs and in the series for hourly compensation in both urban units and TVEs.
NOTE: All figures are nominal. Exchange rate calculations were done at
the market exchange rate for the year in question.
SOURCES: Table 3 of this article; and Erin Lett and Judith Banister, “China’s manufacturing employment and compensation costs: 2002–06,” Monthly Labor Review, April 2009, p. 35.
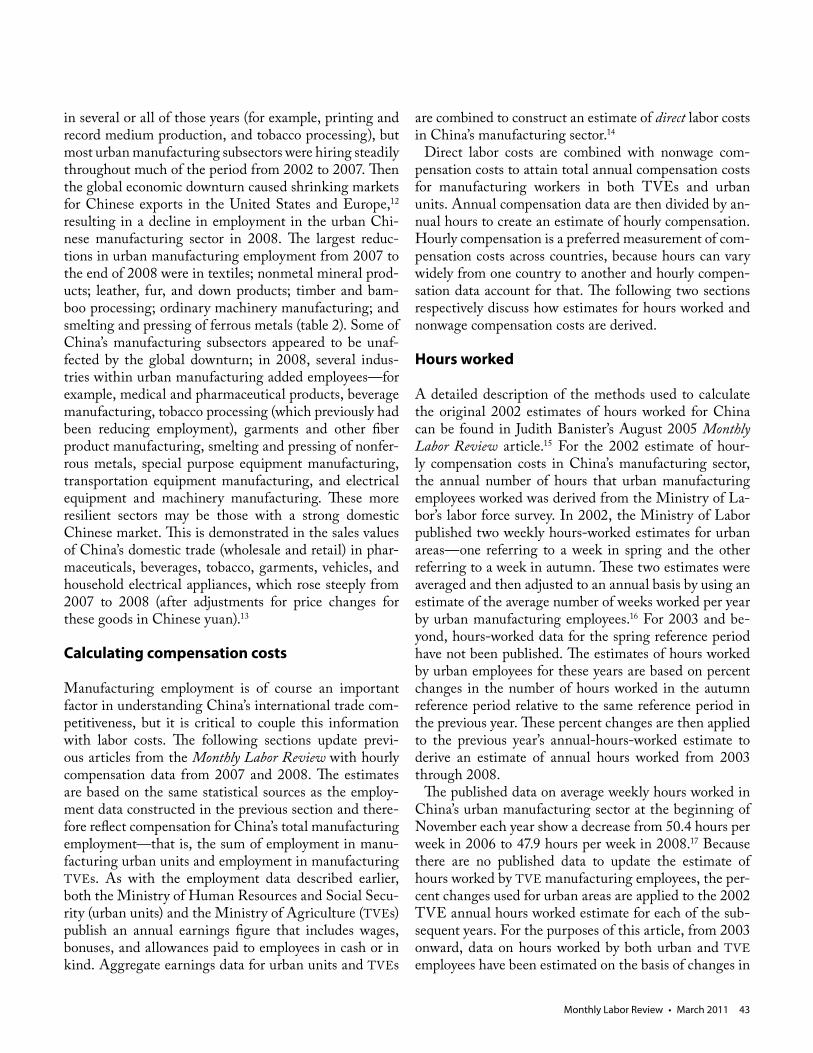
Table 4. Estimated hourly compensation costs of manufacturing employees in China, 2002–08
Category of manufacturing
Hourly compensation per employee
yuan
2002 2003 2004 2005 2006 2007 2008
Total for urban units and TVEs1....................................................... 4.74 5.17 5.50 5.95 6.44 8.06 9.48 Urban units............................................................................................ 7.87 8.86 9.86 10.63 11.73 13.89 16.53 TVEs1........................................................................................................ 3.40 3.63 3.73 4.05 4.24 4.89 5.67
U.S. dollars
2002 2003 2004 2005 2006 2007 2008
Total for urban units and TVEs........................................................ 0.57 0.62 0.66 0.73 0.81 1.06 1.36 Urban units............................................................................................ 0.95 1.07 1.19 1.30 1.47 1.83 2.38 TVEs.......................................................................................................... 0.41 0.44 0.45 0.49 0.53 0.64 0.82
units, as well as with data from other countries in the BLS international hourly compensation series. The data for the urban units in China remain comparable with one an-other over the entire series.
Hourly compensation growth rates in China’s manufac-turing sector have been rising steadily, and comparatively quickly. Consider that, from 2002 to 2008, hourly labor costs in the manufacturing sector in the United States in-creased by 19 percent, while the corresponding figure in China grew 100 percent.21 The following section explores some of the contributing factors to rising labor costs in Chinese manufacturing.
Rising compensation costs
Inflation in China has been substantial. Consumer prices in urban areas increased an average of 3.3 percent annu-ally from 2005 through 2008. Consumer prices in rural areas increased even more rapidly, at an average annual rate of 3.9 percent.22 Even after an adjustment for con-sumer price inflation, the rise in compensation costs for manufacturing workers in Chinese currency is real and rapid in urban manufacturing units. All earnings data calculated in this article are nominal values and therefore have not been adjusted for inflation.
One reason for the surging manufacturing labor com-pensation costs in China is the rising literacy, numeracy, and educational attainment of even unskilled and semi-skilled employees from rural as well as urban areas, and even greater increases in the human capital embodied in skilled workers and high-talent employees.23 The in-
creased education and skill level of Chinese workers has helped to increase labor productivity in China’s secondary industry, especially in manufacturing. Labor productivity in China’s secondary industry (which is primarily manu-facturing, but also includes construction, mining, and utilities) has risen about 10 percent per year since 1991 (4–26 percent each year over the 1991–2008 period), due to technological progress, increased capital investment, and rising human capital.24
Another reason for the surging cost of labor in Chinese manufacturing today is a new employment contract law (also called a labor contract law) that came into effect at the beginning of 2008.25 The law gives workers the right to have a signed labor contract, protects the working conditions and timely payment of wages to employees, limits overtime work, requires payments to compulsory social insurance schemes for employees, and makes it much more difficult to fire workers. This law, along with minimum-wage laws, appears to be strengthening the bargaining power of employees and contributing to wage increases, especially in foreign-owned factories where China’s authorities recently are tolerating strikes by workers.26 It is likely that the labor contract law will also cause the amount of social insurance paid by employers relative to wages to increase, but BLS has been unable to locate recent national-level data to quantify the effects of this law on nonwage compensation.
Reported manufacturing labor shortages
A third reason for rising compensation costs in China is
Manufacturing in China
46 Monthly Labor Review • March 2011
the growing shortage of workers. In recent decades, em-ployers became accustomed to having a seemingly unlim-ited supply of very cheap labor, and being able to insist on certain qualities in their workers.27 Through the turn of the millennium, China had an ample reserve supply of laborers, partly because young-adult farmers were moving out of agriculture into industry for the first time. Reports of emerging shortages of manufacturing workers began in the Pearl River Delta of Guangdong Province in about 2003 and have since spread.28
From a macroscopic perspective, China, the world’s most populous country with the world’s largest labor force, seems an unlikely candidate for a labor shortage.29 In fact, the bulk of China’s population (73 percent) is in the cohorts considered to be of working age—that is, the cohorts with people at least 15 years of age but younger than 65—providing a massive pool of potential employees and talent (chart 1).30 As of yearend 2008, China’s employed population was reported to be 775 million, constituting 58 percent of the country’s total population.31 Of the population ages 15–64, 77 percent was employed, which is high from an international comparative perspective.32
Nevertheless, as shown in chart 1, most of China’s young-adult age groups are smaller than the groups in their late 30s and early 40s. In addition, the youth popula-
tion ages 0–14 has shrunk to an unusually small propor-tion of the population for a developing country. Indeed, a key determinant of China’s paradoxically tightening labor market is low fertility. China’s family planning and one-child policies have significantly reduced fertility and kept it low during most years since the 1970s.
The tight labor situation in manufacturing was tempo-rarily eased by the global economic crisis. In late 2008 and early 2009, export markets for Chinese manufactured goods crashed because of the weak global economy. Large numbers of migrant manufacturing workers were sud-denly laid off, and many of these workers moved back to the countryside.33 China’s government instituted a mas-sive infusion of money to reinvigorate the economy.34 Export markets began to recover during 2009; renewed hiring followed. But now, manufacturing employers are reporting that they cannot get the rural migrant workers to return to urban units, and are having difficulty luring new employees as well.
In response to the current labor shortages, manufactur-ing employers are raising wages, improving working con-ditions, hiring workers in a wider age range, increasing promised benefits, and generally doing what they can to attract enough workers. The tight labor market is there-fore contributing to increasing labor costs in manufactur-
Chart 1. Population of China, by sex and by age group, in millions, 2010
NOTE: Data were compiled by the U.S. Census Bureau from public and private data sources. Values for 2010 are estimated on the basis of sampling done in previous years.
SOURCE: U.S. Census Bureau, International Database, www.census.gov/ipc/www/idb/
Monthly Labor Review • March 2011 47
ing.35 The next section will discuss the difference between hourly labor costs in urban units and those in TVEs and how the tightening labor market affects this relationship.
Compensation in urban units versus TVEs
A continuing feature of manufacturing labor compensa-tion in China is the large and growing differential be-tween average hourly compensation costs for employees in urban units and those for employees in TVEs. (Chart 2 illustrates the differential in U.S. dollars.) By 2002, hourly labor compensation in urban units was 2.3 times the compensation in TVEs; as of 2008, even after the re-moval of the self-employed (a group with low wages over-all) from the TVE series, hourly labor compensation in urban units had jumped to 2.9 times that in TVEs. (See the compensation data in Chinese yuan in table 4).36 One key reason for this increasing disparity is restrictions on geographical labor mobility. It remains difficult for ru-ral laborers to move from the villages to the cities and reestablish their families and households there, a factor contributing to perceived labor shortages in the urban ar-eas. There are legal, administrative, informational, finan-cial, educational, social, housing, and other formal and informal barriers to permanent rural-to-city migration.37
Therefore, labor shortages are more acute in the cities, driving up wages.
Because of China’s strict family planning and one-child policies, most cohorts of workers that have entered China’s labor force since the beginning of the 1990s have been much smaller than the cohorts now in their late 30s and early 40s (chart 1).38 To meet labor demand in the cities, employers are utilizing the city-born supply of young adult workers as well as drawing rural-to-urban migrant workers on a steady basis.
Villages throughout China report that most of the young adults who want to migrate out of the village for nonagricultural work have already done so. Though China has hundreds of millions of workers, they are now becoming more demanding about what jobs they pursue and where. If potential labor migrants are not impressed with what they have experienced or what they hear about pay and working conditions in the urban factories, they may be unwilling to migrate over a long distance to take up such jobs.39
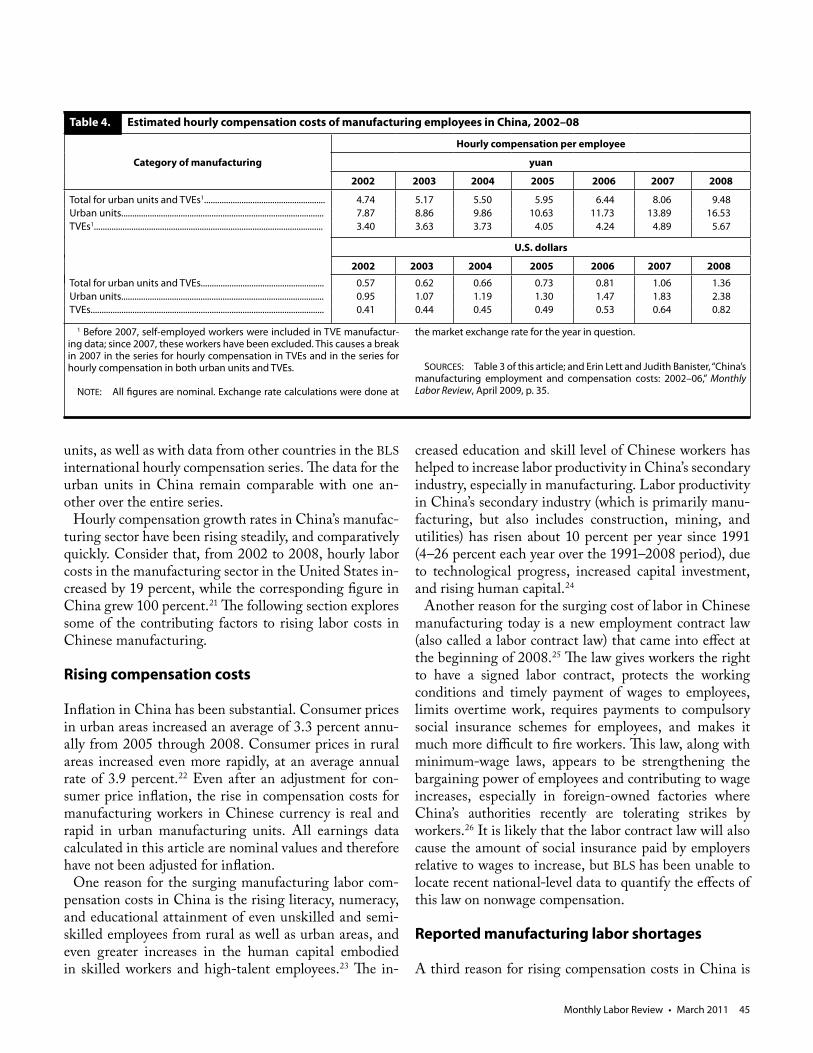
China’s official statistical publications report the aver-age annual earnings per employee in urban units in each subsector of manufacturing (table 5). This is the basic an-nual wage, and does not include additional labor compen-sation costs such as required social insurance payments to
Chart 2. Average hourly compensation costs in urban units and TVEs (town and village enterprises) in manufacturing, in U.S. dollars, 2002–08
CostCost
$2.50
2.00
1.50
1.00
0.50
0.00
$2.50
2.00
1.50
1.00
0.50
0.002002 2003 2004 2005 2006 2007 2008
TVEs TotalUrban units
NOTE: Break in series for total average hourly compensation and TVE average hourly compensation at 2007.
SOURCE: Table 4 of this article.
Manufacturing in China
48 Monthly Labor Review • March 2011
Table 5. Earnings in urban manufacturing units in China, by subsector, 2002–08
NOTE: The data in this table refer only to the earnings of manufactur-ing employees in urban units. Within each subsector, rural manufacturing workers likely have lower earnings than those shown here. The earnings figures in the table do not include required employer social insurance pay-ments or other nonwage labor costs. All currencies represented in current values.
SOURCES: Data for all years were collected by the China National Bureau of Statistics and the China Ministry of Human Resources and Social Security.
Data for 2002 through 2004 are from Erin Lett and Judith Banister, “Labor costs of manufacturing employees in China: an update to 2003–04,” Month-ly Labor Review, November 2006, p 45. Data for 2005 are from China Labor Statistical Yearbook 2006 (Beijing, China Statistics Press, 2006), pp. 185–200. Data for 2006 are from China Labor Statistical Yearbook 2007 (Beijing, China Statistics Press, 2007), pp. 203–18. Data for 2007 are from China Labor Statis-tical Yearbook 2008 (Beijing, China Statistics Press, 2008), pp. 179–194. Data for 2008 are from China Labor Statistical Yearbook 2009 (Beijing, China Sta-tistics Press, 2009), pp. 193–208.
municipalities. There was a surge in the average wage in every urban manufacturing subsector in 2007 and 2008, as shown in table 5. Broad and strong manufacturing earnings growth in China’s cities is fueled in large part by urban labor shortages, labor productivity growth, and rapidly rising educational attainment in the cities. Pres-sure to keep up with higher inflation rates in 2007 and 2008 than in earlier years also is a major factor.
Even while domestic differences in Chinese labor costs have grown, China’s overall manufacturing labor com-pensation costs have risen every year, affecting China’s global competitiveness in manufacturing. The next sec-tion will explore how Chinese hourly compensation costs
measured in U.S. dollars compare with costs in both de-veloped and developing economies.
Compensation measured in U.S. dollars
Hourly manufacturing compensation costs in China are increasing at an even faster rate in U.S. dollars than in Chinese yuan. Hourly compensation costs expressed in a domestic currency (in this case, yuan) can show trends in labor costs within a country, but they do not allow for comparisons across countries. For this reason, table 4 expresses Chinese compensation costs in both Chinese yuan and U.S. dollars.
Monthly Labor Review • March 2011 49
The exchange rate between the yuan and the dollar has become an important and at times contentious issue.40 During 2002–04, the first 3 years of the hourly compen-sation series measured in this article, the Chinese central bank (the People’s Bank of China) pegged the yuan to the U.S. dollar at a rate of 8.28 yuan per dollar. Beginning in July 2005 the People’s Bank of China began a series of adjustments to the yuan–dollar exchange rate. Initially the new rate was set at 8.11 yuan per dollar with some small fluctuation allowed; later, the yuan was pegged to a basket of currencies instead of strictly to the U.S. dollar, allowing even further fluctuation between the yuan and the dollar.41
In 2008, the most recent year in the Chinese hourly manufacturing compensation series, the yuan traded at an average of 6.95 yuan to 1 dollar.42 The yuan’s apprecia-tion with respect to the dollar during the period covered in this report contributed 19 percent to growth in Chi-nese manufacturing labor costs in U.S. dollar terms.
China in the global economy
Even as China ascends as a major economic player in the global economy, its position in the international landscape
Chart 3. Index of hourly compensation costs in manufacturing, selected countries and areas, 2008
NOTE: Data are not strictly comparable. Direct comparisons should be made with caution.
SOURCES: Data for China are from table 4 of this article. Data for
other countries and areas are from International comparisons of hourly compensation costs in manufacturing, 2008, USDL 10–1173 (Bureau of Labor Statistics), Aug. 26, 2010.
United States China Philippines Mexico East Asiaexcluding Japan
Japan Euro area
140
120
100
80
60
40
20
0
140
120
100
80
60
40
20
0
Index (U.S. = 100) Index (U.S. = 100)
of labor costs has not changed dramatically. As measured in U.S. dollars, Chinese hourly labor compensation costs in manufacturing were roughly 4 percent of those in the United States and about 3 percent of those in the Euro Area in 2008 (chart 3). China’s costs were roughly on par with those of some developing countries like the Philip-pines, but lagged noticeably behind those of other coun-tries like Mexico and Brazil.
The Division of International Labor Comparisons at BLS recently released the results of a special study on la-bor costs in the formal manufacturing sector in India. The data from the study go through 2005 and are presented separately from the main BLS series because of compa-rability issues. Hourly compensation costs in Chinese manufacturing as a whole were slightly lower than those in India’s formal manufacturing sector in 2005. However, when hourly compensation costs in India’s formal manu-facturing sector are compared with those in Chinese ur-ban manufacturing units, a comparison of establishments that are more similar, Chinese compensation costs are slightly higher (chart 4).43 These differences are dwarfed, however, when labor costs in China or India are com-pared with those in developed countries. For example, as of 2005, total hourly compensation costs in Chinese man-
Manufacturing in China
50 Monthly Labor Review • March 2011
ufacturing (for TVEs and urban units) represented about 2.5 percent of those in the United States, while the cor-responding percentages for the Indian formal sector and Chinese urban units were only slightly higher, at about 3.1 percent and 4.4 percent, respectively.
Looking forward
Growth in China’s labor costs and employment in man-ufacturing from 2007 to 2008 suggests some resilience
Chart 4. Average hourly compensation costs in manufacturing in China and India, U.S. dollars, 2002–05
CostCost
2002 2003 2004 2005
IndiaChina totalChina urban
$1.40
1.20
1.00
0.80
0.60
0.40
0.20
0.00
$1.40
1.20
1.00
0.80
0.60
0.40
0.20
0.00
NOTE: Data are not strictly comparable. Data for India include only the formal sector and exclude the informal sector. Direct compari-sons should be made with caution.
SOURCES: Data for China are from table 4 of this article. Data for In-dia are from Jessica Sincavage, Carl Haub, and O.P. Sharma, “Labor costs in India’s organized manufacturing sector” Monthly Labor Review, May 2010, p. 10.
in the Chinese economy to withstand a major economic downturn. This growth is largely due to expanding do-mestic demand from a nation with rapidly rising per-cap-ita income. Factors such as the gradual recovery in the global economy and renewed global demand for manu-factured goods, as well as the growing shortage of labor in China, will likely put upward pressure on wages and compensation in China’s manufacturing sector in the fu-ture. These changes could fundamentally shape the global market for manufactured goods for decades to come.
Notes
ACKNOWLEDGMENTS: The authors would like to thank Constance Sorrentino and Jessica Sincavage for their comments on previous drafts of this article, Xing Shuqin and Song Jintao for their assistance in locating and procuring statistical volumes necessary for this analy-sis, and Ian Glennon and Jacob Kirchmer for verifying the accuracy of the data.
1 “TopTrading Partners - Surplus, Deficit, Total Trade,” U.S. Cen-sus Bureau, Foreign Trade Division, on the Internet at www.census.gov/foreign-trade/top/ (visited Feb. 7, 2011).
2 Tomoko A. Hosaka, “China surpasses Japan as world’s No. 2
economy,” Washington Post, Aug. 16, 2010, on the Internet at www.washingtonpost.com/wp-dyn/content/article/2010/08/15/AR2010081503697.html?hpid=topnews (visited Feb. 7, 2011).
3 For the original report on 2002 employment and labor compensation in manufacturing, see Judith Banister, “Manufacturing Employment and Compensation in China,” on the Internet at www.bls.gov/fls/chinareport.pdf (visited Feb. 7, 2011). See also two Monthly Labor Review articles based on this report: Judith Banister, “Manufacturing employment in China,” Monthly Labor Review, July 2005, pp. 11–29, on the Internet at www.bls.gov/opub/mlr/2005/07/art2full.pdf (visited Feb. 7, 2011); and Judith Banister, “Manufacturing earnings and compensation in China,” Monthly Labor Review, August 2005, pp. 22–40 on the Internet at www.bls.gov/opub/mlr/2005/08/art3full.pdf (visited Feb. 7, 2011).
Monthly Labor Review • March 2011 51
informally reported that weekly-hours-worked data are collected in China’s annual rural labor force survey, but these results have never been released.
19 For more information about these sources, see Banister, “Manu-facturing earnings and compensation in China.”
20 For details on the compensation of self-employed versus enterprise manufacturing workers, see Judith Banister, “Manufacturing in China today: Employment and labor compensation,” The Conference Board Economics Program Working Paper Series, report number E-0021-07-WP, November 2007, pp. 23–26, and see especially table 7 on p. 26; on the Internet at www.conference-board.org/publications/publicationdetail.cfm?publicationid=1377 (visited Feb. 15, 2011).
21 The U.S. figure represents nominal growth in dollars, and the Chinese figure represents nominal growth in yuan. The Chinese figure was calculated with data from table 4 of this article, and the U.S. figure was calculated with data from “Table 1.2: All Employ-ees: Hourly compensation costs in U.S. dollars in manufacturing, 33 countries or areas and selected economic groups, 1996-2008” (Bureau of Labor Statistics, August 2010), on the Internet at ftp://ftp.bls.gov/pub/suppl/ichcc.ichccaesuppt1_2.txt (visited Mar. 4, 2011).
22 Price inflation for urban households was 1.5–1.6 percent annu-ally in 2005 and 2006, but escalated to 4.5 percent in 2007 and 5.6 percent in 2008. Consumer prices for rural households rose by 2.2 percent in 2005, 1.5 percent in 2006, 5.4 percent in 2007, and 6.5 percent in 2008. See China Statistical Yearbook 2009, Table 8-1, p. 281.
23 Hongbin Li, Pak Wai Liu, Ning Ma, and Junsesn Zhang, Does Education Pay in Urban China? Estimating Returns to Education Using Twins (Sept. 23, 2005), on the Internet at http://iis-db.stanford.edu/docs/270/hongbin-Does-Education-Pay-in-Urban-China.pdf (visited Feb. 16, 2011).
24 Carsten A. Holz, Measuring Chinese Productivity Growth, 1952–2005 (Hong Kong, July 2006), Tables 22–23 and Figures 33–34, on the Internet at http://hussonet.free.fr/chprodu.pdf; “Labor sup-ply to become a constraint on economic growth in China—Policies focus to shift from job creation to increasing productivity,” (Japan, Research Institute of Economy, Trade, and Industry, 2009); Xin Yong-rong, Chen Qil, and Xiao Jun-Zhe, “The Decomposition of Labor Productivity Factors of Chinese Manufacturing Industry: A Dynamic Study Based on DEA method” (China, 2008); and Vin-cent Fernando, “Why China’s Labor Cost Advantage Is About to Disappear,” Business Insider, June 8, 2010, on the Internet at www.businessinsider.com/china-labor-cost-inflation-2010-6 (visited Feb. 16, 2011).
25 Jian Qiao, “Labor Contract Law in China: Changes and Impli-cations.” Paper presented at the conference Breaking Down Chinese Walls: The Changing Faces of Labor and Employment in China, Cornell University, September 2008.
26 Shinning Zhao and Jie Zhang, “Impact of employment contracts law on employment relations in China,” April 2010, on the Internet at www.thefreelibrary.com/Impact+of+employment+contracts+law+on+employment+relations+in+China.-a0228172472; “China’s labour market,” The Economist, July 29, 2010; and Tini Tran, “China’s workers force unions to speak up,” The Globe and Mail, Toronto, Aug. 5, 2010, p. B7.
27 Examples of such specifications for workers at particular factories might include good health, good eyesight, a strong body, the age of young adult, an unmarried status with no children or other dependents, a compliant and flexible personality, and the willingness to work very long hours, live in a group dormitory, and migrate far
4 The baseline research for the year 2002 was updated through 2004 in Erin Lett and Judith Banister, “Labor costs of manufactur-ing employees in China: an update to 2003–04,” Monthly Labor Re-view, November 2006, pp. 40–45, on the Internet at www.bls.gov/opub/mlr/2006/11/art4full.pdf (visited Feb. 7, 2011). Manufactur-ing employment and compensation estimates were extended from 2002 through 2006 in Erin Lett and Judith Banister, “China’s manu-facturing employment and compensation costs: 2002–06,” Monthly Labor Review, April 2009, pp. 30–38, on the Internet at www.bls.gov/opub/mlr/2009/04/art3full.pdf (visited Feb. 7, 2011).
5 International Comparisons of Hourly Compensation Costs in Manu-facturing, 2008, USDL 10-1173 (Bureau of Labor Statistics), Aug. 26, 2010, on the Internet at www.bls.gov/news.release/pdf/ichcc.pdf (visited Feb. 14, 2011).
6 For a discussion of TVEs, see Banister, “Manufacturing Employ-ment and Compensation in China.”
7 See years 2003–09 of the China Town and Village Enterprise Year-book (in Chinese) (Beijing, China Ministry of Agriculture).
8 For example, analysis of results from China’s first economic cen-sus, with data from 2004, supported the validity of the independently derived BLS estimates of China’s 2004 employment and labor com-pensation in manufacturing. See Lett and Banister, “China’s manu-facturing employment and compensation costs: 2002–06,” p. 37.
9 Banister, “Manufacturing employment in China.”10 China Labor Statistical Yearbook 2008 (Beijing, China National
Bureau of Statistics and China Ministry of Human Resources and Social Security), Table 7-1, p. 465.
11 Banister, “Manufacturing employment in China.”12 Michael Schuman, “How Will China Weather the Financial
Storm?” Time, Oct. 23, 2008, on the Internet at www.time.com/time/business/article/0,8599,1853112,00.html (visited Feb. 28, 2011).
13 China Statistical Yearbook 2008, Table 16-9; and China Statistical Yearbook 2009 (Beijing, China National Bureau of Statistics), Tables 8-1, 8-3, 8-4, 8-12, 16-9, and 16-13.
14 For the original hourly compensation costs estimates and a de-tailed explanation of the methods used, see Banister, “Manufacturing earnings and compensation in China.” For the hourly compensation cost data updated to 2003–04, see Lett and Banister, “Labor costs of manufacturing employees in China: an update to 2003–04.” Com-pensation estimates were updated through 2006 in Lett and Ban-ister, “China’s manufacturing employment and compensation costs: 2002–06.”
15 Banister, “Manufacturing earnings and compensation in China.” 16 Ibid., pp. 30–31. 17 The workers employed by urban manufacturing corporations
continue to put in a heavy workweek. As of late 2008, 5 percent of China’s urban manufacturing employees worked 20–39 hours in a week, 33 percent worked 40 hours weekly, 25 percent were on the job 41–48 hours, and 36 percent worked 48 hours or more per week. See the China Labor Statistical Yearbook 2009, Tables 1-70 and 1-77 (Beijing, China National Bureau of Statistics and China Ministry of Human Resources and Social Security), pp. 112, 120, and 121.
18 When China’s statistical organizations dropped self-employed manufacturing workers from the TVE employment data, effective for 2007 and subsequent years, it is possible that this adjustment changed the actual average weekly hours worked by TVE manu-facturing workers in China. However, the authors have no way of determining the impact of the absence of such published data. It is
Manufacturing in China
52 Monthly Labor Review • March 2011
from home for a job. See “How Rising Wages Are Changing The Game In China,” Bloomberg Businessweek, Mar. 27, 2006, on the Internet at www.businessweek.com/magazine/content/06_13/b3977049.htm (visited Feb. 17, 2011); David Barboza, “Labor Shortage in China May Lead to Trade Shift,” New York Times, Apr. 3, 2006, on the Internet at www.nytimes.com/2006/04/03/business/03labor.html (visited Feb. 17, 2011); Jim Jubak, “A 15% raise? Try China or India,” MSN Money, Jan. 5, 2007, on the Internet at http://articles.moneycentral.msn.com/Investing/JubaksJournal/A15RaiseTryChinaOrIndia.aspx (visited Feb. 17, 2011); and Andrew Jacobs, “Chinese Factories Now Compete to Woo Laborers,” New York Times, July 10, 2010, on the Internet at www.nytimes.com/2010/07/13/world/asia/13factory.html (visited Feb. 17, 2011).
28 See, for example, “How Rising Wages Are Changing The Game in China”; Barboza, “Labor Shortage in China May Lead to Trade Shift”; and Alan Wheatley, “Wage pressures hit Chinese city,” The China Post, June 14, 2007, on the Internet at www.chinapost.com.tw/editorial/112324.htm (visited Feb. 28, 2011).
29 See the International Labour Organization database on total and economically active populations by country, on the Internet at http://laborsta.ilo.org (visited Feb. 17, 2011).
30 China Population & Employment Statistics Yearbook 2009 (Beijing, China National Bureau of Statistics), Table 1-3.
31 China Statistical Yearbook 2009, Table 1-2.32 China Population & Employment Statistics Yearbook 2009, Tables
1-3, 1-10, and 3-5. 33 Jane Macartney, “China’s migrant workers hit by economic
pinch as 20 million lose jobs,” The Times, Feb. 3, 2009, on the Internet at http://business.timesonline.co.uk/tol/business/economics/article5638893.ece (visited Feb. 17, 2011).
34 “China’s economic stimulus creates 22m jobs,” China Daily, Sept. 16, 2010, on the Internet at www.chinadaily.com.cn/
bizchina/2010-09/16/content_11313345.htm (visited Feb. 17, 2011). 35 Barboza, “Labor Shortage in China May Lead to Trade Shift.” 36 For discussion of compensation costs in urban units and TVEs,
see Lett and Banister, “China’s manufacturing employment and compensation costs: 2002–06,” table 3, chart 3, and p. 36.
37 John Knight, Deng Quheng, and Li Shi, The Puzzle of Migrant Labour Shortage and Rural Labour Surplus in China (Oxford, England, Oxford University Discussion Paper Series, number 494, July 2010), on the Internet at www.economics.ox.ac.uk/Research/wp/pdf/paper494.pdf (visited Feb. 17, 2011).
38 The exception is the cohort born in the late 1980s during a tem-porary easing of the implementation of family-planning regulations. Children born at that time are now in their early 20s.
39 Jubak, “A 15% raise? Try China or India”; Jacobs, “Chinese Fac-tories Now Compete to Woo Laborers.”
40 Christopher A. McNally, “Defusing Tensions over China’s Ex-change Rate Policy,” Asia Pacific Bulletin, Feb. 18, 2010, on the Inter-net at www.eastwestcenter.org/fileadmin/stored/pdfs/apb048_3.pdf (visited Feb. 18, 2011).
41 People’s Bank of China, “Public Announcement of the People’s Bank of China on Reforming the RMB Exchange Rate Regime,” July 21, 2005, on the Internet at www.pbc.gov.cn/publish/english/955/2001/20014/20014_.html (visited Feb. 28, 2011).
42 “Foreign Exchange Rates (Annual),” Board of Governors of the Federal Reserve System, Jan. 3, 2011, on the Internet at www.federalreserve.gov/releases/g5a (visited Feb. 18, 2011).
43 Note that Indian and Chinese data are not strictly comparable because each country has its particular data limitations. The Indian data are from Jessica R. Sincavage, Carl Haub, and O.P. Sharma, “Labor costs in India’s organized manufacturing sector,” Monthly La-bor Review, May 2010, pp. 3–22, on the Internet at www.bls.gov/opub/mlr/2010/05/art1full.pdf (visited Feb. 18, 2011).