104
Moorebank Intermodal Terminal Project Environmental Impact Statement Volume 6 October 2014
| Date post: | 27-Jul-2019 |
| Category: |
Documents |
| Upload: | phungquynh |
| View: | 225 times |
| Download: | 0 times |
Moorebank Intermodal Terminal Project Environmental Impact Statement
Volume 6October 2014


Technical Pap
er 6 - Surface W
ater Assessm
ent
Technical Paper 6 Surface Water Assessment


VO
LUM
E 1
a
Chapter 1 – IntroductionChapter 2 – Site context and environmental valuesChapter 3 – Strategic context and need for the ProjectChapter 4 – Planning and statutory requirementsChapter 5 – Stakeholder and community consultationChapter 6 – Project development and alternativesChapter 7 – Project built form and operationsChapter 8 – Project development phasing and constructionChapter 9 – Project sustainabilityChapter 10 – Impact assessment approachChapter 11 – Traffic, transport and accessChapter 12 – Noise and vibrationChapter 13 – BiodiversityChapter 14 – Hazards and risksChapter 15 – Contamination and soils
VO
LUM
E 2
Appendix A – EIS Project teamAppendix B – EIS guidelines and requirementsAppendix C – Compliance with the Georges River REP principlesAppendix D – Consultation information, materials and outcomesAppendix E – MCA criteria relating to Project objectivesAppendix F – Layouts of shortlisted Project alternativesAppendix G – Peer review endorsement lettersAppendix H – Provisional EMPsAppendix I – Environmental record of ProponentAppendix J – Compliance with Schedule 1, Part 1 and 2 of the (NSW) Environmental Planning and Assessment Regulation 2000Appendix K – Tenure history of the Project site
VO
LUM
E 1
b
Chapter 16 – Hydrology, groundwater and water qualityChapter 17 – Local air qualityChapter 18 – Regional air qualityChapter 19 – Greenhouse gas assessmentChapter 20 – Aboriginal heritageChapter 21 – European heritageChapter 22 – Visual and urban designChapter 23 – Property and infrastructureChapter 24 – Social and economic impactsChapter 25 – Human health risks and impactsChapter 26 – Waste and resource managementChapter 27 – Cumulative impactsChapter 28 – Environmental management frameworkChapter 29 – Environmental risk analysisChapter 30 – Project justification and conclusionsChapter 31 – References
EIS Volume 31 – Traffic and Transport Impact Assessment2 – Noise and Vibration Impact Assessment
EIS Volume 43 – Ecological Impact Assessment (with associated Biodiversity Offset Strategy)4 – Preliminary Risk Assessment
EIS Volume 5a5 – Environmental Site Assessment (Phase 2)
EIS Volume 5b5 – Environmental Site Assessment (Phase 2) Appendices C to F
EIS Volume 66 – Surface Water Assessment7 – Local Air Quality Impact Assessment8 – Regional Air Quality Impact Assessment9 – Greenhouse Gas Assessment
EIS Volume 710 – Aboriginal Heritage Impact Assessment
EIS Volume 811 – European Heritage Impact Assessment12 – Visual Impact Assessment
EIS Volume 913 – Light Spill Impact Assessment14 – Social Impact Assessment15 – Human Health Risk Assessment16 – Health Impact Assessment
Contents of the EIS
EIS Summary
TECHNICAL PAPERS

Parsons Brinckerhoff i
Contents VOLUME 1A – MAIN VOLUME
Declaration
Glossary and abbreviations
Executive summary
Chapter 1 Introduction
Chapter 2 Site context and environmental values
Chapter 3 Strategic context and need for the Project
Chapter 4 Planning and statutory requirements
Chapter 5 Stakeholder and community consultation
Chapter 6 Project development and alternatives
Chapter 7 Project built form and operations
Chapter 8 Project development phasing and construction
Chapter 9 Project sustainability
Chapter 10 Impact assessment approach
Chapter 11 Traffic, transport and access
Chapter 12 Noise and vibration
Chapter 13 Biodiversity
Chapter 14 Hazards and risks
Chapter 15 Contamination and soils
VOLUME 1B – MAIN VOLUME
Chapter 16 Hydrology, groundwater and water quality
Chapter 17 Local air quality
Chapter 18 Regional air quality
Chapter 19 Greenhouse gas assessment
Chapter 20 Aboriginal heritage
Chapter 21 European heritage
Chapter 22 Visual and urban design
Chapter 23 Property and infrastructure
Chapter 24 Social and economic impacts
Chapter 25 Human health risks and impacts
Chapter 26 Waste and resource management

Parsons Brinckerhoff ii
Chapter 27 Cumulative impacts
Chapter 28 Environmental management framework
Chapter 29 Environmental risk analysis
Chapter 30 Project justification and conclusions
Chapter 31 References
VOLUME 2 – APPENDICES
Appendix A EIS Project team
Appendix B EIS guidelines and requirements
Appendix C Compliance with the Georges River Regional Environment Plan (REP) principles
Appendix D Consultation information, materials and outcomes
Appendix E MCA criteria relating to Project objectives
Appendix F Layouts of shortlisted Project alternatives
Appendix G Peer review endorsements
Appendix H Provisional EMPs
Appendix I Environmental record of Proponent
Appendix J Compliance with Schedule 1, Part 1 and 2 of the Environmental Planning and Assessment Regulation 2000 (NSW)
Appendix K Tenure history of the Project site
VOLUME 3
Technical Paper 1 Traffic and Transport Impact Assessment
Technical Paper 2 Noise and Vibration Impact Assessment
VOLUME 4
Technical Paper 3 Ecological Impact Assessment (with associated Biodiversity Offset Strategy)
Technical Paper 4 Preliminary Risk Assessment
VOLUME 5A
Technical Paper 5 Environment Site Assessment (Phase 2)

Parsons Brinckerhoff iii
VOLUME 5B
Technical Paper 5 Environment Site Assessment (Phase 2) – Appendices C-F
VOLUME 6
Technical Paper 6 Surface Water Assessment
Technical Paper 7 Local Air Quality Impact Assessment
Technical Paper 8 Regional Air Quality Impact Assessment
Technical Paper 9 Greenhouse Gas Assessment
VOLUME 7
Technical Paper 10 Aboriginal Heritage Impact Assessment
VOLUME 8
Technical Paper 11 European Heritage Impact Assessment
Technical Paper 12 Visual Impact Assessment
VOLUME 9
Technical Paper 13 Light Spill Impact Assessment
Technical Paper 14 Social Impact Assessment
Technical Paper 15 Human Health Risk Assessment
Technical Paper 16 Health Impact Assessment

Moorebank Intermodal Company
Moorebank Intermodal Terminal
Surface water assessment25 June 2014
Parsons Brinckerhoff | 2103829E-TPT-REP-003 RevA i
Moorebank Intermodal Company Moorebank Intermodal Terminal - Surface water assessment
ContentsPage number
Abbreviations iii
1. Introduction 5
1.1 The Moorebank Intermodal Terminal Project 5
1.2 Rail access options and layouts 6
1.3 The project site 6
1.4 Project delivery 8
1.5 Planning and assessment process 10
1.6 Report outline 10
1.7 Assessment criteria 11
1.8 Assessment methodology 13
2. Existing environment 15
2.1 Regional surface water environment 15
2.2 Local surface water environment 19
3. Impact assessment 27
3.1 Proposed project works 27
3.2 Regional flooding impacts 30
3.3 Local stormwater catchment impacts 36
3.4 Surface water quality impacts 38
4. Mitigation measures 43
4.1 Early works 43
4.2 Regional flooding mitigation measures 43
4.3 On-site stormwater management 44
5. Conclusions 49
6. References 51
Parsons Brinckerhoff | 2103829E-TPT-REP-003 RevA ii
Moorebank Intermodal Company Moorebank Intermodal Terminal - Surface water assessment
List of tablesPage number
Table 1.1 Secretary for the NSW DP&E’s Environmental Assessment Requirements 11Table 1.2 Commonwealth EIS requirements 11Table 2.1 Project site flood risk zones 16Table 2.2 Existing water quality data 26Table 3.1 Northern rail access option 1% AEP flood levels and afflux results 32Table 3.2 Central rail access option 1% AEP flood levels and afflux results 33Table 3.3 Southern rail access 1% AEP flood levels and afflux 33Table 3.4 1% AEP flood levels and afflux results with climate change allowance for the
northern rail access option 35Table 3.5 Northern rail connection stormwater runoff estimation 37Table 3.6 Central rail connection option stormwater runoff estimation 37Table 3.7 Southern rail connection stormwater runoff estimation 37Table 3.8 MUSIC modelling of stormwater pollutants 40Table 3.9 Northern rail connection option treatment area requirement estimation 40Table 3.10 Central rail connection option treatment area requirement estimation 41Table 3.11 Southern rail connection option treatment area requirement estimation 41
List of figuresPage number
Figure 1.1 Project site location 7Figure 1.2 Project development phasing 9Figure 2.1 Existing flood risk probability map 18Figure 2.2 Existing water bodies and surface drainage 21Figure 2.3 Existing water quality sampling sites 25
List of appendicesAppendix A Design Flood Impact AssessmentAppendix B Stormwater Management PlanAppendix C Figures

Parsons Brinckerhoff | 2103829E-TPT-REP-003 RevA iii
Moorebank Intermodal Company Moorebank Intermodal Terminal - Surface water assessment
AbbreviationsAEP Annual Exceedance Probability
ARI ARI – Average Recurrence Interval
CERAT Coastal Eutrophication Risk Assessment Tool
DA Development Assessment
DGR Director General’s Requirements
DNSDC Defence National Storage and Distribution Centre
DoD Department of Defence
EC Electrical Conductivity
EIS Environmental Impact Statement
ESA Environmental Site Assessment
EV Environmental values
GRCCC Georges River Combined Council Committee
Ha Hectares
LCC Liverpool City Council
OEH NSW Office of Environment and Heritage
OSD On-Site Detention
m AHD Metres Australian Height Datum
MIMT Moorebank Intermodal Terminal
MIC Moorebank Intermodal Company
NOW New South Wales Office of Water
RCP Reinforced concrete pipe
SEWPaC Sustainability, Environment, Water, Population and Communities
SSD State significant development
SSFL Southern Sydney Freight Line
TN Total nitrogen
WQOs Water Quality Objectives

Parsons Brinckerhoff | 2103829E-TPT-REP-003 RevA 5
Moorebank Intermodal Company Moorebank Intermodal Terminal - Surface water assessment
1. Introduction1.1 The Moorebank Intermodal Terminal ProjectThe Moorebank Intermodal Terminal (MIMT) Project (the Project) involves the development of approximately220 hectares (ha) of land at the Project site (refer to Figure 1.1) for the construction and operation of an IMTand associated infrastructure, facilities and warehousing. The Project includes a rail link connecting theProject site to the Southern Sydney Freight Line (SSFL) and road entry and exit points from MoorebankAvenue.
The primary function of the MIMT is to be a transfer point in the logistics chain for shipping containers and tohandle both international IMEX cargo, and domestic interstate and intrastate (regional) cargo. The key aimsof the Project are to increase Sydney’s rail freight mode share including: promoting the movement ofcontainer freight by rail between Port Botany and western and south-western Sydney; and reducing roadfreight on Sydney’s congested road network.
The Project proponent is Moorebank Intermodal Company (MIC), a Government Business Enterprise set upto facilitate the development of the Project.
The Project site is currently largely occupied by the Department of Defence’s (Defence) School of MilitaryEngineering (SME). Under the approved Moorebank Units Relocation (MUR) Project, the SME is planned tobe relocated to Holsworthy Barracks by mid-2015, which would enable the construction of the Project tocommence.
The key features/components of the Project comprise:
an IMEX freight terminal – designed to handle up to 1.05 million TEU per annum (525,000 TEU inboundand 525,000 TEU outbound) of IMEX containerised freight to service ‘port shuttle’ train servicesbetween Port Botany and the Project
an Interstate freight terminal – designed to handle up to 500,000 TEU per annum (250,000 TEUinbound and 250,000 TEU outbound) of interstate containerised freight to service freight trains travellingto and from regional and interstate destinations
warehousing facilities – with capacity for up to 300,000 square metres (m2) of warehousing to providean interface between the MIMT and commercial users of the facilities such as freight forwarders,logistics facilities and retail distribution centres.
The proposal concept described in the main Environmental Impact Statement (EIS) (refer Chapters 7 and 8)provides an indicative layout and operational concept for the Project, while retaining flexibility for futuredevelopers and operators of the Project. The proposal concept is indicative only and subject to furtherrefinement during detailed design.
Parsons Brinckerhoff | 2103829E-TPT-REP-003 RevA 6
Moorebank Intermodal Company Moorebank Intermodal Terminal - Surface water assessment
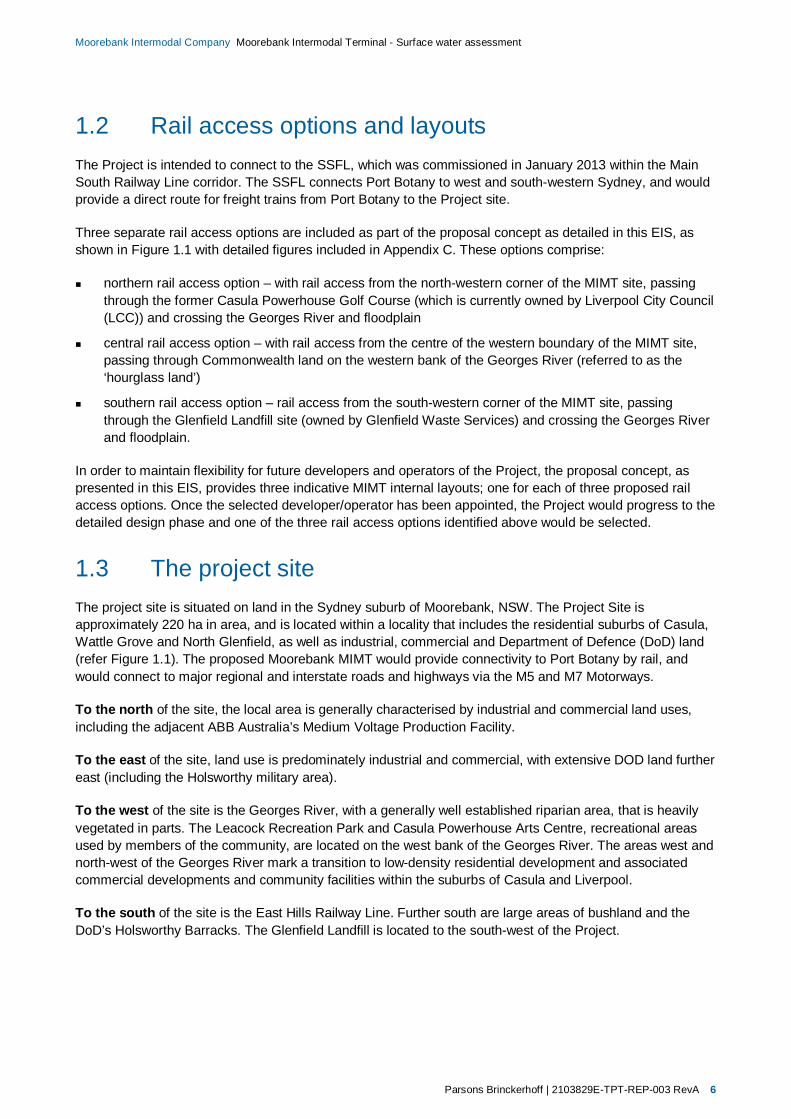
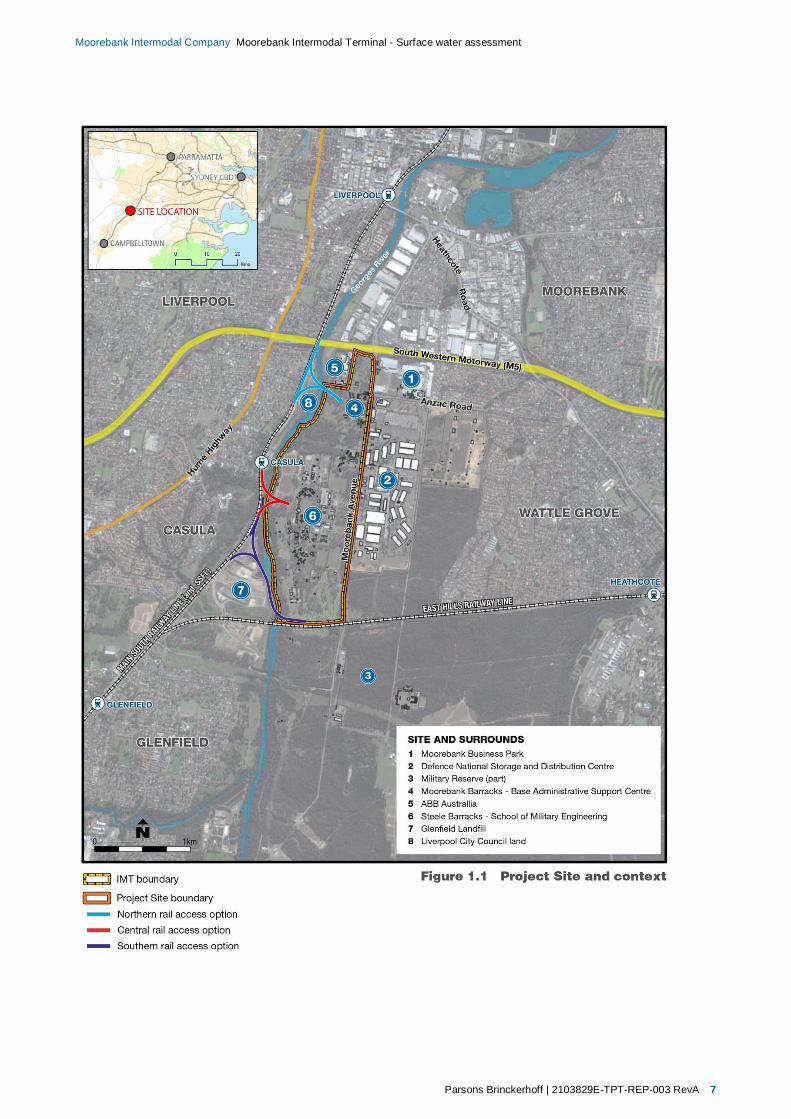
1.2 Rail access options and layoutsThe Project is intended to connect to the SSFL, which was commissioned in January 2013 within the MainSouth Railway Line corridor. The SSFL connects Port Botany to west and south-western Sydney, and wouldprovide a direct route for freight trains from Port Botany to the Project site.
Three separate rail access options are included as part of the proposal concept as detailed in this EIS, asshown in Figure 1.1 with detailed figures included in Appendix C. These options comprise:
northern rail access option – with rail access from the north-western corner of the MIMT site, passingthrough the former Casula Powerhouse Golf Course (which is currently owned by Liverpool City Council(LCC)) and crossing the Georges River and floodplain
central rail access option – with rail access from the centre of the western boundary of the MIMT site,passing through Commonwealth land on the western bank of the Georges River (referred to as the‘hourglass land’)
southern rail access option – rail access from the south-western corner of the MIMT site, passingthrough the Glenfield Landfill site (owned by Glenfield Waste Services) and crossing the Georges Riverand floodplain.
In order to maintain flexibility for future developers and operators of the Project, the proposal concept, aspresented in this EIS, provides three indicative MIMT internal layouts; one for each of three proposed railaccess options. Once the selected developer/operator has been appointed, the Project would progress to thedetailed design phase and one of the three rail access options identified above would be selected.
1.3 The project siteThe project site is situated on land in the Sydney suburb of Moorebank, NSW. The Project Site isapproximately 220 ha in area, and is located within a locality that includes the residential suburbs of Casula,Wattle Grove and North Glenfield, as well as industrial, commercial and Department of Defence (DoD) land(refer Figure 1.1). The proposed Moorebank MIMT would provide connectivity to Port Botany by rail, andwould connect to major regional and interstate roads and highways via the M5 and M7 Motorways.
To the north of the site, the local area is generally characterised by industrial and commercial land uses,including the adjacent ABB Australia’s Medium Voltage Production Facility.
To the east of the site, land use is predominately industrial and commercial, with extensive DOD land furthereast (including the Holsworthy military area).
To the west of the site is the Georges River, with a generally well established riparian area, that is heavilyvegetated in parts. The Leacock Recreation Park and Casula Powerhouse Arts Centre, recreational areasused by members of the community, are located on the west bank of the Georges River. The areas west andnorth-west of the Georges River mark a transition to low-density residential development and associatedcommercial developments and community facilities within the suburbs of Casula and Liverpool.
To the south of the site is the East Hills Railway Line. Further south are large areas of bushland and theDoD’s Holsworthy Barracks. The Glenfield Landfill is located to the south-west of the Project.
Parsons Brinckerhoff | 2103829E-TPT-REP-003 RevA 7
Moorebank Intermodal Company Moorebank Intermodal Terminal - Surface water assessment

Parsons Brinckerhoff | 2103829E-TPT-REP-003 RevA 8
Moorebank Intermodal Company Moorebank Intermodal Terminal - Surface water assessment
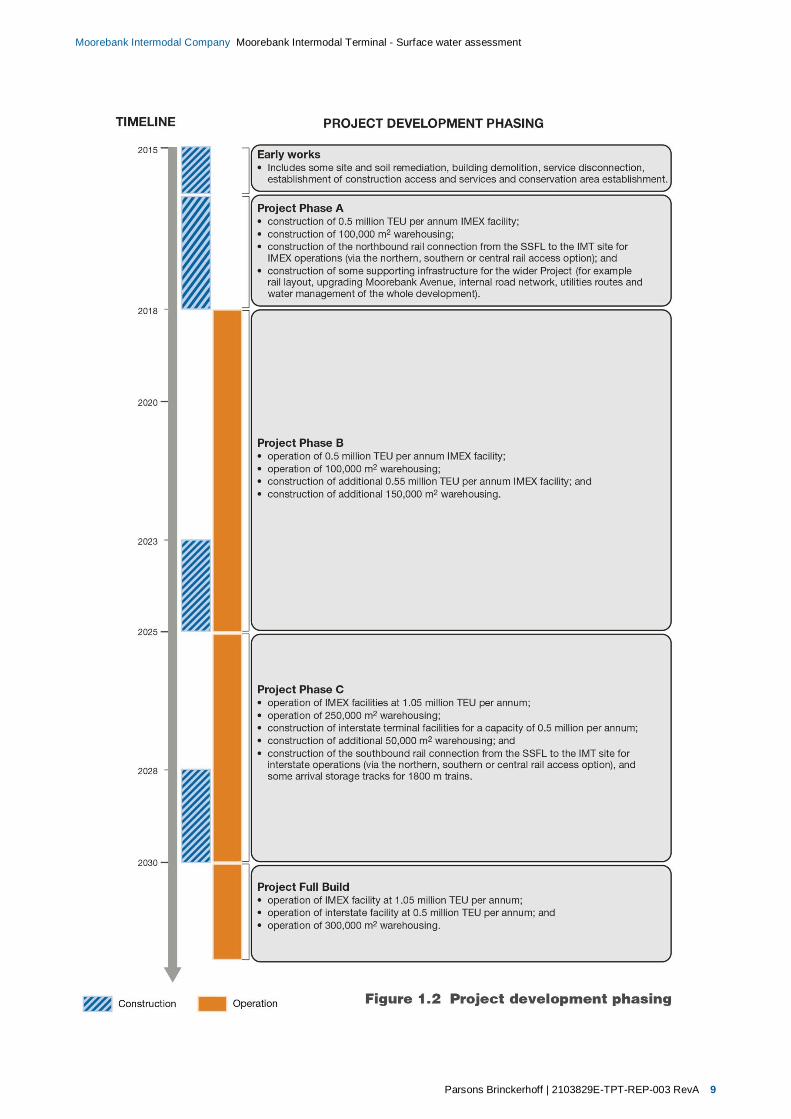
1.4 Project deliveryThe Project is proposed to be phased (staged) in its development, as summarised in Figure 1.2. Theproposed indicative phasing includes both construction and operational phases, which are likely to overlap atcertain times. For the purposes of assessment of the Project, five project development phases have beenidentified and detailed in this EIS however for this technical assessment only three phases have beenassessed, early works, construction and full build. These are indicative only, but illustrate the type ofconstruction and operation activities that would occur over time at the Project site.
The Project would likely commence in 2015 with the Early Works development phase and would progresswith concurrent construction and operation through to the Project Full Build Phase (operation of full IMEXterminal, warehousing and interstate terminal) by approximately 2030.
The development phasing is proposed in line with the forecast market demand for processing of containersthrough the Project.
Parsons Brinckerhoff | 2103829E-TPT-REP-003 RevA 9
Moorebank Intermodal Company Moorebank Intermodal Terminal - Surface water assessment
Parsons Brinckerhoff | 2103829E-TPT-REP-003 RevA 10
Moorebank Intermodal Company Moorebank Intermodal Terminal - Surface water assessment
1.5 Planning and assessment processThe Project is subject to both Commonwealth and NSW State Government approvals, and this technicalassessment has been prepared to support the Environmental Impact Statement (EIS). The Project is a‘controlled action’ under the (Commonwealth) Environment Protection and Biodiversity Conservation Act1999 (EPBC Act). Therefore, MIC is seeking approval for the construction and operation of the Project fromthe (Commonwealth) Department of the Environment (DoE) under Part 9 of the EPBC Act.
Under the (NSW) Environmental Planning and Assessment Act 1979 (EP&A Act), MIC is seeking a stageddevelopment approval for the Project as State significant development (SSD). At this stage, MIC is seekingStage 1 SSD development approval for the proposal concept (as described in EIS) from NSW Planning andInfrastructure (NSW P&I) under Part 4, Division 4.1 of the EP&A Act (hereafter referred to as the Stage 1SSD development approval). The Stage 1 SSD development approval application also includes a package of‘early works’ that comprises remediation, clean-up and demolition or relocation of existing buildings, andestablishment of a conservation area. The EIS is seeking approval for these early works without the need forany further approvals. Subject to Stage 1 SSD development approval being received, the Project (with theexclusion of the early works) will be subject to further development applications and environmentalassessment under the EP&A Act (hereafter referred to as the Stage 2 SSD development approvals).
This Technical Paper and accompanying appendices assesses the impacts of the proposed development atfull build to a concept level. Both construction and operation phase impacts based on the concepts for thethree options have been assessed and are presented. Further details of the Project would be the subject offuture development applications as those details are developed, with environmental impact assessments tobe conducted in detail at that time.
1.6 Report outlineThis report provides a surface water assessment to address the requirements defined in the Secretary forthe NSW Department of Planning and Environment’s (NSW DP&E’s) Environmental AssessmentRequirements (NSW SEARs) (refer Section 1.7.1) and the Commonwealth EIS requirements (referSection 1.7.2). The report covers surface water related aspects such as flooding, stormwater and waterquality of surface water resources. In addition, the impacts of climate change for each of these aspects of theassessment have been considered. Other water related aspects such as water supply, wastewatermanagement and sewerage servicing are not covered in this assessment.
This assessment has been based on concept design layouts for three alternative site and rail access layouts.These are presented below and have been prepared in order to allow flexibility in the site layout and obtainfinal approval for an early works package under Part 4.1 of the EP&A Act. The concept designs consider andaddress the requirements of Liverpool City Council and particular requirements relating to discharge ofstormwater to the Georges River and surface water management relating to the proposed rail corridors.These relevant requirements are included in section 1.7.4 below. It is anticipated that impacts and mitigationmeasures relating to surface water would be confirmed following detailed design and during future phases ofthe project.
Parsons Brinckerhoff | 2103829E-TPT-REP-003 RevA 11
Moorebank Intermodal Company Moorebank Intermodal Terminal - Surface water assessment
1.7 Assessment criteria
1.7.1 NSW SEARs
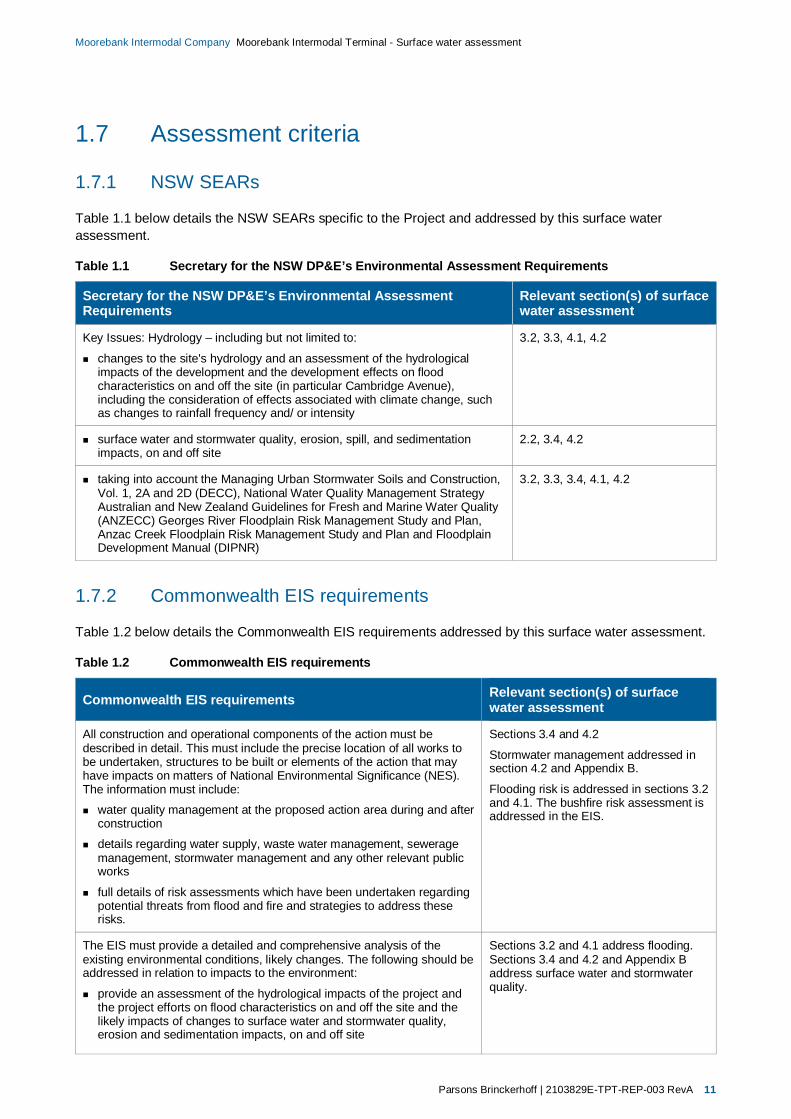
Table 1.1 below details the NSW SEARs specific to the Project and addressed by this surface waterassessment.
Table 1.1 Secretary for the NSW DP&E’s Environmental Assessment Requirements
Secretary for the NSW DP&E’s Environmental AssessmentRequirements
Relevant section(s) of surfacewater assessment
Key Issues: Hydrology – including but not limited to:
changes to the site's hydrology and an assessment of the hydrologicalimpacts of the development and the development effects on floodcharacteristics on and off the site (in particular Cambridge Avenue),including the consideration of effects associated with climate change, suchas changes to rainfall frequency and/ or intensity
3.2, 3.3, 4.1, 4.2
surface water and stormwater quality, erosion, spill, and sedimentationimpacts, on and off site
2.2, 3.4, 4.2
taking into account the Managing Urban Stormwater Soils and Construction,Vol. 1, 2A and 2D (DECC), National Water Quality Management StrategyAustralian and New Zealand Guidelines for Fresh and Marine Water Quality(ANZECC) Georges River Floodplain Risk Management Study and Plan,Anzac Creek Floodplain Risk Management Study and Plan and FloodplainDevelopment Manual (DIPNR)
3.2, 3.3, 3.4, 4.1, 4.2
1.7.2 Commonwealth EIS requirements
Table 1.2 below details the Commonwealth EIS requirements addressed by this surface water assessment.
Table 1.2 Commonwealth EIS requirements
Commonwealth EIS requirements Relevant section(s) of surfacewater assessment
All construction and operational components of the action must bedescribed in detail. This must include the precise location of all works tobe undertaken, structures to be built or elements of the action that mayhave impacts on matters of National Environmental Significance (NES).The information must include:
water quality management at the proposed action area during and afterconstruction
details regarding water supply, waste water management, seweragemanagement, stormwater management and any other relevant publicworks
full details of risk assessments which have been undertaken regardingpotential threats from flood and fire and strategies to address theserisks.
Sections 3.4 and 4.2
Stormwater management addressed insection 4.2 and Appendix B.
Flooding risk is addressed in sections 3.2and 4.1. The bushfire risk assessment isaddressed in the EIS.
The EIS must provide a detailed and comprehensive analysis of theexisting environmental conditions, likely changes. The following should beaddressed in relation to impacts to the environment:
provide an assessment of the hydrological impacts of the project andthe project efforts on flood characteristics on and off the site and thelikely impacts of changes to surface water and stormwater quality,erosion and sedimentation impacts, on and off site
Sections 3.2 and 4.1 address flooding.Sections 3.4 and 4.2 and Appendix Baddress surface water and stormwaterquality.
Parsons Brinckerhoff | 2103829E-TPT-REP-003 RevA 12
Moorebank Intermodal Company Moorebank Intermodal Terminal - Surface water assessment
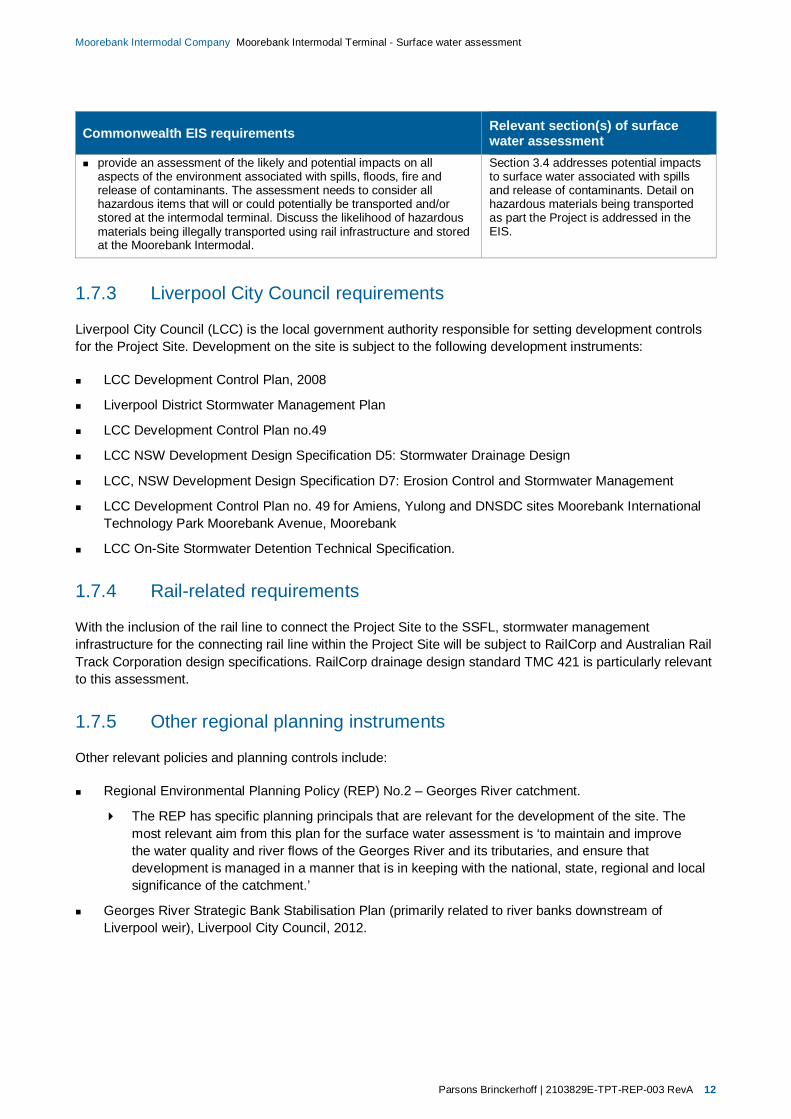
Commonwealth EIS requirements Relevant section(s) of surfacewater assessment
provide an assessment of the likely and potential impacts on allaspects of the environment associated with spills, floods, fire andrelease of contaminants. The assessment needs to consider allhazardous items that will or could potentially be transported and/orstored at the intermodal terminal. Discuss the likelihood of hazardousmaterials being illegally transported using rail infrastructure and storedat the Moorebank Intermodal.
Section 3.4 addresses potential impactsto surface water associated with spillsand release of contaminants. Detail onhazardous materials being transportedas part the Project is addressed in theEIS.
1.7.3 Liverpool City Council requirements
Liverpool City Council (LCC) is the local government authority responsible for setting development controlsfor the Project Site. Development on the site is subject to the following development instruments:
LCC Development Control Plan, 2008
Liverpool District Stormwater Management Plan
LCC Development Control Plan no.49
LCC NSW Development Design Specification D5: Stormwater Drainage Design
LCC, NSW Development Design Specification D7: Erosion Control and Stormwater Management
LCC Development Control Plan no. 49 for Amiens, Yulong and DNSDC sites Moorebank InternationalTechnology Park Moorebank Avenue, Moorebank
LCC On-Site Stormwater Detention Technical Specification.
1.7.4 Rail-related requirements
With the inclusion of the rail line to connect the Project Site to the SSFL, stormwater managementinfrastructure for the connecting rail line within the Project Site will be subject to RailCorp and Australian RailTrack Corporation design specifications. RailCorp drainage design standard TMC 421 is particularly relevantto this assessment.
1.7.5 Other regional planning instruments
Other relevant policies and planning controls include:
Regional Environmental Planning Policy (REP) No.2 – Georges River catchment.
The REP has specific planning principals that are relevant for the development of the site. Themost relevant aim from this plan for the surface water assessment is ‘to maintain and improvethe water quality and river flows of the Georges River and its tributaries, and ensure thatdevelopment is managed in a manner that is in keeping with the national, state, regional and localsignificance of the catchment.’
Georges River Strategic Bank Stabilisation Plan (primarily related to river banks downstream ofLiverpool weir), Liverpool City Council, 2012.
Parsons Brinckerhoff | 2103829E-TPT-REP-003 RevA 13
Moorebank Intermodal Company Moorebank Intermodal Terminal - Surface water assessment
1.8 Assessment methodologyIn order to address the NSW SEARs and Commonwealth EIS requirements an assessment of the impacts ofthe project on the surface water environment was undertaken. To understand the impacts of the proposeddevelopment a series of investigations were undertaken.
These investigations have been based on the three concept site layouts provided. As required, assumptionshave been made in order to identify all potential impacts for each concept and therefore identify mitigationmeasures in order to ensure the development has the least impact.
The latest advice outlined in the Floodplain Risk Management Guideline: Practical Consideration of ClimateChange (DECC, 2007 regarding climate change predictions has also been considered in this impactassessment.
With respect to the NSW SEARs and Commonwealth EIS requirements, the following key potential impactsneed to be assessed, both within the site and external to the site:
change in hydrologic regime, in particular, change in flooding, stormwater runoff quantity
impact of project on water quality, including sediment and erosion, stormwater quality, stormwaterpollution (accidental spills etc.).
These key potential impacts are addressed in this report for the early works, the construction and operationalphases of the project. Assessment of the operational phase impacts has been based on conceptualproposed stormwater management measures and assumed bridge configurations for the crossing of theGeorges River.
The methodology primarily involved desktop assessments supplemented by site walkover inspections. Thedesktop assessments utilised information and analyses from the available concept designs and flood dataand water quality data available from the local council and other organisations. Impacts on the surfaceenvironment were assessed at the regional scale, which addressed the Georges River floodplain andcatchment adjacent to the site, and at the local scale, which addressed the surface water environment on thesite itself.
Regional scale flooding impacts were identified from the flood impact assessment for the three options forbridge crossing locations – refer to Appendix A. This involved development of a hydraulic model of theGeorges River and floodplain system local to the site and simulation of existing and developed scenarios todetermine the impact of the crossing on flood levels and velocities.
Regional scale water quality impacts and mitigation measures were identified and a series of stormwatermanagement features are proposed in order to detain and treat site runoff. Details of these are included inAppendix B.
Local scale impacts and mitigation measures relating to the surface water environment of the site itself werealso identified. Where possible stormwater management features have been located as part of the site layoutand specific design criteria detailed to avoid adverse impacts on the local environment.
Construction phase impacts were assessed based on assumed worst case disturbance of the local surfacewater catchments.
The assessment of operational phase impacts has been undertaken to identify the potential worst caseimpacts of the Project as opposed to identification of impacts from each development phase. For all threeconceptual layout options the potential worst case impacts would occur for the Project once full build iscompleted and the project is operating to full capacity.


Parsons Brinckerhoff | 2103829E-TPT-REP-003 RevA 15
Moorebank Intermodal Company Moorebank Intermodal Terminal - Surface water assessment
2. Existing environmentThis chapter provides an outline of the existing environment and the surrounding catchment for the proposedproject site.
2.1 Regional surface water environmentThe project site is located within the Georges River catchment, with the river forming the western boundaryof the site. The Georges River rises approximately 60 km south-west of Sydney near Appin. From here theriver flows north towards Liverpool, through the Chipping Norton Lakes Scheme, then east until it reachesBotany Bay.
The total catchment area for the Georges River is 960 km2 and lies between the altitudes of 440 m AHD andsea level. Land use within the catchment is mixed and includes residential, industrial, agricultural, mining,Defence land and protected areas such as drinking water catchments and conservation areas. Thecatchment area contains nearly 1.2 million people (GRCCC 2011) and approximately 45% of the catchmentremains in natural or near natural conditions.
The project site is located in the upper section of what is referred to as the mid Georges River. Thecatchment area upstream of the project site is largely undeveloped but is under development pressures. Themid Georges River catchment begins at Cambridge Avenue (upstream of the Project Site and immediately tothe south) and from here development within the catchment continues and increases through to Botany Bay.The section of river adjacent to the project site is not subject to tidal influences, with the Liverpool weir,located approximately 2 km downstream (to the north of the site), governing minimum water levels. Floodingin this reach of the river is therefore a fluvial process, i.e. it is caused by the catchment’s runoff response torainfall.
The project site is generally flat to gently undulating and is bounded by the Georges River to the west, intowhich the majority of the site currently drains. Adjacent to the project site the river is well defined withvegetated banks on both sides of the river (see Photograph 2.1). The eastern floodplain of the river (part ofthe project site) has a terrace area at a relatively low elevation. East of this terrace area the ground levelsrise steadily up to the higher level where the developed part of the site is locate.
A small portion of the south eastern part of the site drains to Anzac Creek, which is an ephemeral tributary ofGeorges River with a catchment area of 10.6 km2. This creek flows in a north-westerly direction andultimately drains to Lake Moore on the Georges River, some 3 km downstream of the project site. In thesouth-west corner of the site a number of linked ponds form the headwaters of Anzac Creek within theexisting Royal Australian Engineers golf course. From these ponds the creek flows east under MoorebankAvenue via culverts.
The area has historically been subject to flooding from the Georges River. Regionally, historical flood recordsdate back as far as the 1860s, with most records relating to flood levels recorded at Liverpool Weir. The mostrecent major flood occurred in 1988 and was estimated to have an annual exceedance probability (AEP) of5%. The 1988 flood resulted in over 1,000 properties being inundated along the Georges River and anestimated $18 million in damages.
Parsons Brinckerhoff | 2103829E-TPT-REP-003 RevA 16
Moorebank Intermodal Company Moorebank Intermodal Terminal - Surface water assessment
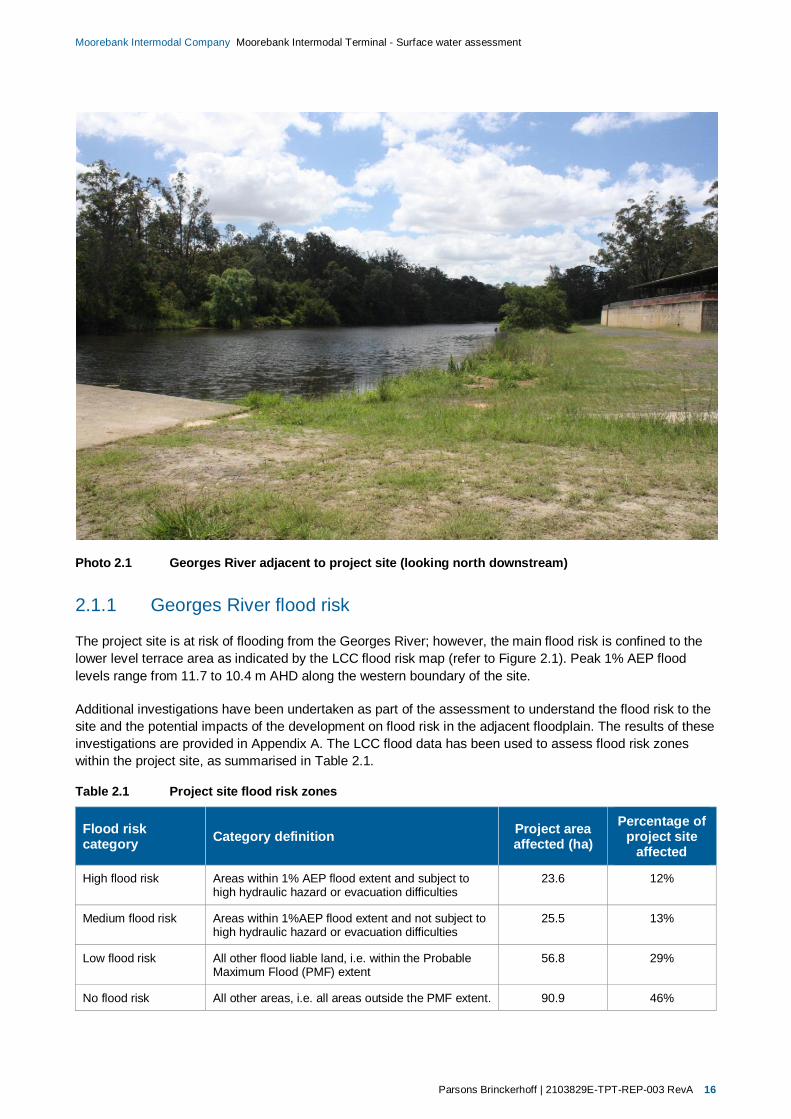
Photo 2.1 Georges River adjacent to project site (looking north downstream)
2.1.1 Georges River flood risk
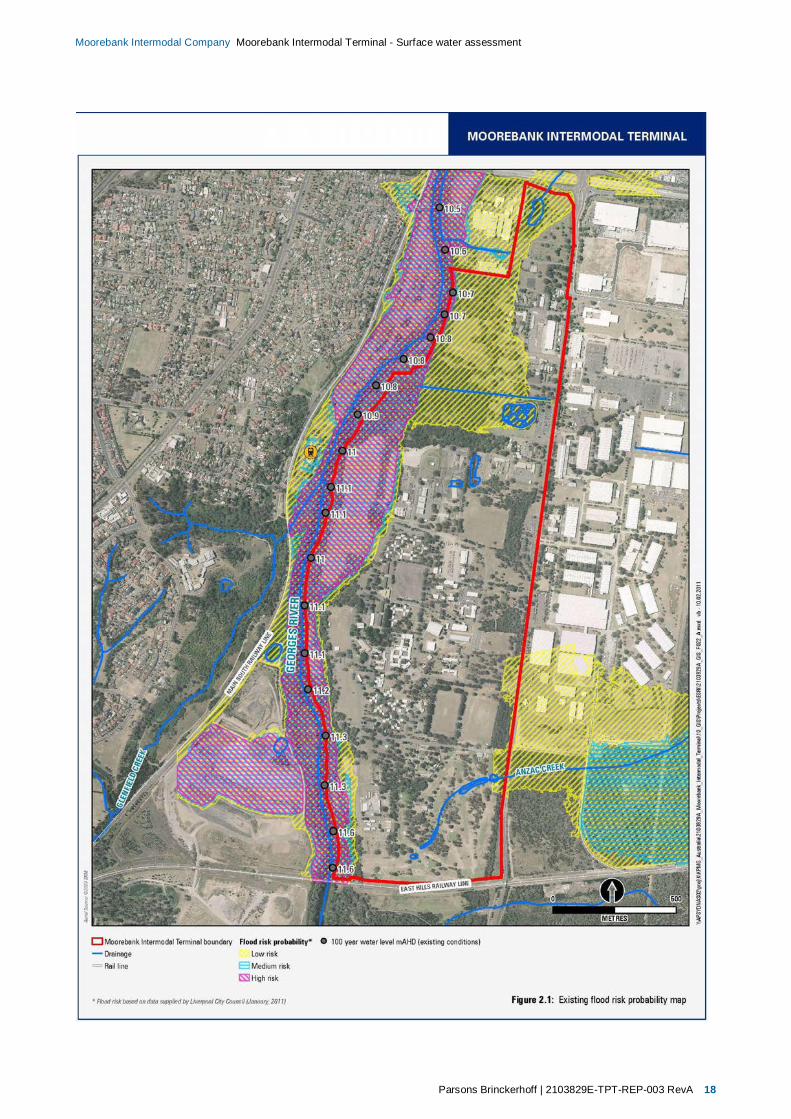
The project site is at risk of flooding from the Georges River; however, the main flood risk is confined to thelower level terrace area as indicated by the LCC flood risk map (refer to Figure 2.1). Peak 1% AEP floodlevels range from 11.7 to 10.4 m AHD along the western boundary of the site.
Additional investigations have been undertaken as part of the assessment to understand the flood risk to thesite and the potential impacts of the development on flood risk in the adjacent floodplain. The results of theseinvestigations are provided in Appendix A. The LCC flood data has been used to assess flood risk zoneswithin the project site, as summarised in Table 2.1.
Table 2.1 Project site flood risk zones
Flood riskcategory Category definition Project area
affected (ha)Percentage of
project siteaffected
High flood risk Areas within 1% AEP flood extent and subject tohigh hydraulic hazard or evacuation difficulties
23.6 12%
Medium flood risk Areas within 1%AEP flood extent and not subject tohigh hydraulic hazard or evacuation difficulties
25.5 13%
Low flood risk All other flood liable land, i.e. within the ProbableMaximum Flood (PMF) extent
56.8 29%
No flood risk All other areas, i.e. all areas outside the PMF extent. 90.9 46%

Parsons Brinckerhoff | 2103829E-TPT-REP-003 RevA 17
Moorebank Intermodal Company Moorebank Intermodal Terminal - Surface water assessment
Figure 2.1 shows these flood risk zones for the Project Site. The flood risk zone mapping is based on LCC’sflood modelling results (using the MIKE11 software package) from the Upper Georges River Flood Study(Department of Land and Water Conservation and Liverpool City Council, 2000) and the modelling of AnzacCreek completed for the Anzac Creek Floodplain Risk Management Study and Plan (BMT WBM 2008).
The Georges River Flood Study predicts that the critical storm duration for flooding at the Project Site is36 hours for the 1% AEP flood event. Thus, flood levels resulting from the critical storm would persist for arelatively long duration in the medium and high flood risk zones within the site. For this storm duration, areasonable warning time is available and the close proximity of the river would allow visual warning of risingflood levels.
Currently evacuation of the Project Site under extreme flood events is possible via the portion of the site thatlies outside the probable maximum flood (PMF) extent as there is direct access to Moorebank Avenue whichremains flood free under this maximum event.
Parsons Brinckerhoff | 2103829E-TPT-REP-003 RevA 18
Moorebank Intermodal Company Moorebank Intermodal Terminal - Surface water assessment
Parsons Brinckerhoff | 2103829E-TPT-REP-003 RevA 19
Moorebank Intermodal Company Moorebank Intermodal Terminal - Surface water assessment
2.1.2 Anzac Creek flood risk
Flood extents and potential flood risks from Anzac Creek on the existing project site were also consideredthrough a review of the Anzac Creek Floodplain Risk Management Study and Plan (BMT WBM 2008). Theproject site is at the headwaters of Anzac Creek. The BMT WBM report presents a series of flood risk mapsthat have been developed from detailed modelling of the hydrological characteristics influencing the AnzacCreek catchment, including peak flood levels, flows and inundation extents for a range of events includingthe PMF.
The Anzac Creek Floodplain Risk Management Study and Plan (BMT WBM 2008) identifies that flooding isgenerally confined within the main channel of Anzac Creek upstream of the M5 Motorway. Effectiveconveyance of flood discharges in the main channel up to the 1% AEP flood event results in very littlefloodplain inundation. Existing culverts through the M5 Motorway embankment can convey the 1%AEP floodevent to the downstream reaches of the Anzac Creek catchment, without causing substantial backwateraccumulation assuming no blockage of the culverts.
Only a minor portion of the existing project site (approximately 9%) lies within and drains to the Anzac Creekcatchment. Under existing conditions the flood risk to the project site from Anzac Creek is negligible, asdocumented in the BMT WBM report, which states ‘Even up to the 100 year ARI flood event there is verylittle floodplain inundation’ (BMT WBM 2008).
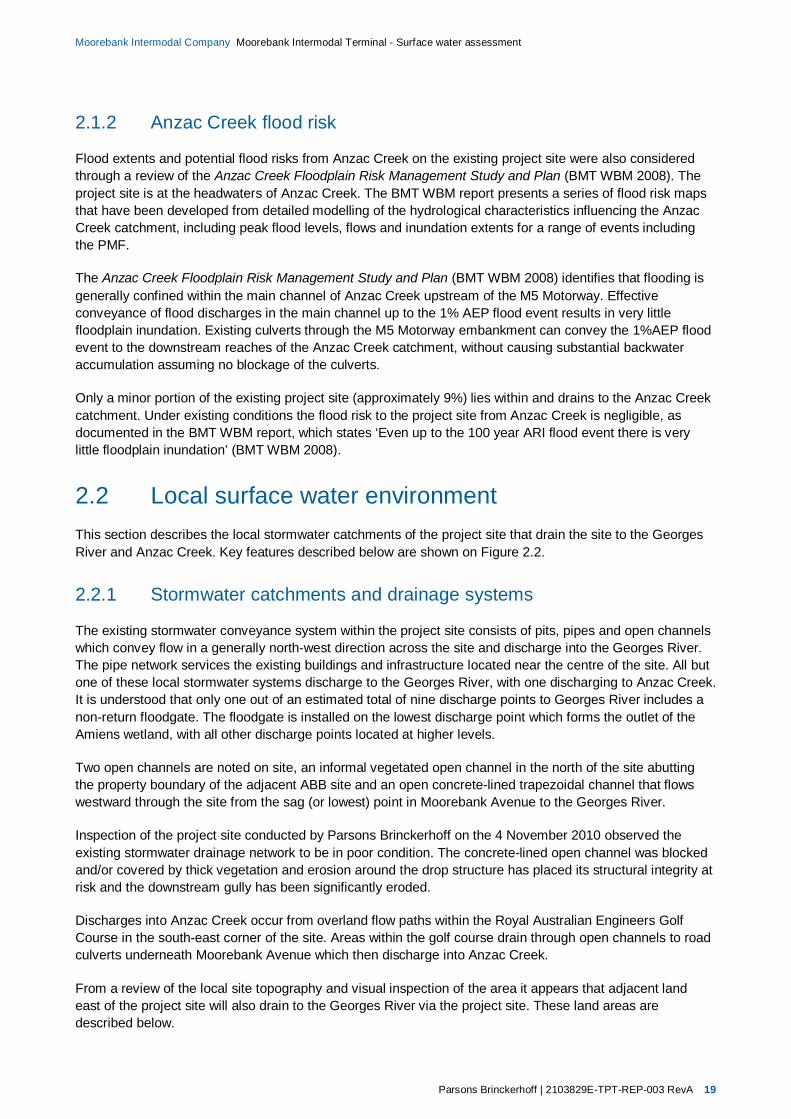
2.2 Local surface water environmentThis section describes the local stormwater catchments of the project site that drain the site to the GeorgesRiver and Anzac Creek. Key features described below are shown on Figure 2.2.
2.2.1 Stormwater catchments and drainage systems
The existing stormwater conveyance system within the project site consists of pits, pipes and open channelswhich convey flow in a generally north-west direction across the site and discharge into the Georges River.The pipe network services the existing buildings and infrastructure located near the centre of the site. All butone of these local stormwater systems discharge to the Georges River, with one discharging to Anzac Creek.It is understood that only one out of an estimated total of nine discharge points to Georges River includes anon-return floodgate. The floodgate is installed on the lowest discharge point which forms the outlet of theAmiens wetland, with all other discharge points located at higher levels.
Two open channels are noted on site, an informal vegetated open channel in the north of the site abuttingthe property boundary of the adjacent ABB site and an open concrete-lined trapezoidal channel that flowswestward through the site from the sag (or lowest) point in Moorebank Avenue to the Georges River.
Inspection of the project site conducted by Parsons Brinckerhoff on the 4 November 2010 observed theexisting stormwater drainage network to be in poor condition. The concrete-lined open channel was blockedand/or covered by thick vegetation and erosion around the drop structure has placed its structural integrity atrisk and the downstream gully has been significantly eroded.
Discharges into Anzac Creek occur from overland flow paths within the Royal Australian Engineers GolfCourse in the south-east corner of the site. Areas within the golf course drain through open channels to roadculverts underneath Moorebank Avenue which then discharge into Anzac Creek.
From a review of the local site topography and visual inspection of the area it appears that adjacent landeast of the project site will also drain to the Georges River via the project site. These land areas aredescribed below.

Parsons Brinckerhoff | 2103829E-TPT-REP-003 RevA 20
Moorebank Intermodal Company Moorebank Intermodal Terminal - Surface water assessment
2.2.1.1 Defence National Storage and Distribution Centre
The Defence National Storage and Distribution Centre (DNSDC) is located on the eastern side of MoorebankAvenue on land leased from the Sydney Intermodal Terminal Alliance. The stormwater drainage networkwithin this site currently discharges stormwater runoff via drainage infrastructure into the existing project siteat two locations. The first discharge location is through the box culverts underneath Moorebank Avenue thatconnect to the open channel flowing west across the existing project site. The second discharge location is a600mm diameter pipe that connects to grated pits on either side of the Moorebank Avenue road reservelocated approximately 210 m north of Chatham Avenue.
Parsons Brinckerhoff | 2103829E-TPT-REP-003 RevA 21
Moorebank Intermodal Company Moorebank Intermodal Terminal - Surface water assessment
Parsons Brinckerhoff | 2103829E-TPT-REP-003 RevA 22
Moorebank Intermodal Company Moorebank Intermodal Terminal - Surface water assessment
Existing topography within the DNSDC site shows that the western side of the DNSDC produces overlandstormwater flows towards Moorebank Avenue and is either intercepted by open channels on the eastern sideof Moorebank Avenue or flows over Moorebank Avenue into the existing project site. The drainage channelon the eastern side of Moorebank Avenue connecting to the open channel through the project site has ashallow grade (<0.5%) and it is assumed that it does not have capacity to convey the 1% AEP flood event.It is therefore considered likely that runoff under extreme events will overtop the channel and spill overMoorebank Avenue onto the existing project site. The eastern side of the DNSDC produces overland flowsaway from the project site and into Anzac Creek.
The current road grading along Moorebank Avenue has very little fall (<0.5%) and it is assumed that verylittle flow travels along Moorebank Avenue and instead large storm events overflow from the DNSDC directlyonto the project site.
2.2.1.2 M5 south-west motorway
The stormwater drainage from the M5 south-west motorway intersection with Moorebank Avenue(M5 intersection) to the north of the project site has been designed to discharge into the existing project sitein events greater than or equal to the 1% AEP event. In events less than the 1% AEP event theM5 intersection drainage system has been designed to discharge to the Georges River via dedicated1500 mm and 2100 mm diameter pipes fitted with non-return outlet floodgates. Flows exceeding the capacityof the drainage system have been designed to discharge from a surcharge pit within the road reserve andspill into the existing Amiens wetland which is situated to the north of the project site. However, it is notknown if the system was designed to account for elevated tail water conditions in the Georges River thatwould occur during a flood event. Flood events within the Georges River will close the floodgates on theoutlet pipes from the M5 intersection drainage and may cause flows to discharge from the surcharge pit inevents more frequent than the 1% AEP event.
2.2.1.3 Moorebank Business Park
Based on available topographic information, the south-western corner of the Moorebank Business Park(approximately ¼ of the business park area) will contribute overland flows onto Moorebank Avenue andAnzac Avenue. Overland flows are expected to flow across and down the road to the primary sag point alongMoorebank Avenue and subsequently onto the project site before discharging into the Georges River.
2.2.1.4 ABB site
A vegetated swale abutting the southern boundary of the ABB site runs beneath an overhead power line thatcrosses the Georges River. Based on the existing contours, this channel appears to convey surface flowsfrom the surrounding area including the project site and may also collect surface runoff from the ABB site.
2.2.2 Stormwater and downstream receptor water quality
Surface flows and stormwater runoff from the Project Site currently drain to the Georges River and AnzacCreek (section 2.2.1). The quality of the stormwater discharging from the existing site to the Georges River iscurrently influenced by the developed areas of the site, site activities and several small to medium sizedwater bodies located within the site. These water bodies and site surface flows are shown on Figure 2.2.
A detailed assessment of the local and regional surface water quality is included in the StormwaterManagement Plan (SMP) included in Appendix B. A summary of the on-site water bodies’ water quality andthe regional (Georges River) water quality is included below.
Parsons Brinckerhoff | 2103829E-TPT-REP-003 RevA 23
Moorebank Intermodal Company Moorebank Intermodal Terminal - Surface water assessment
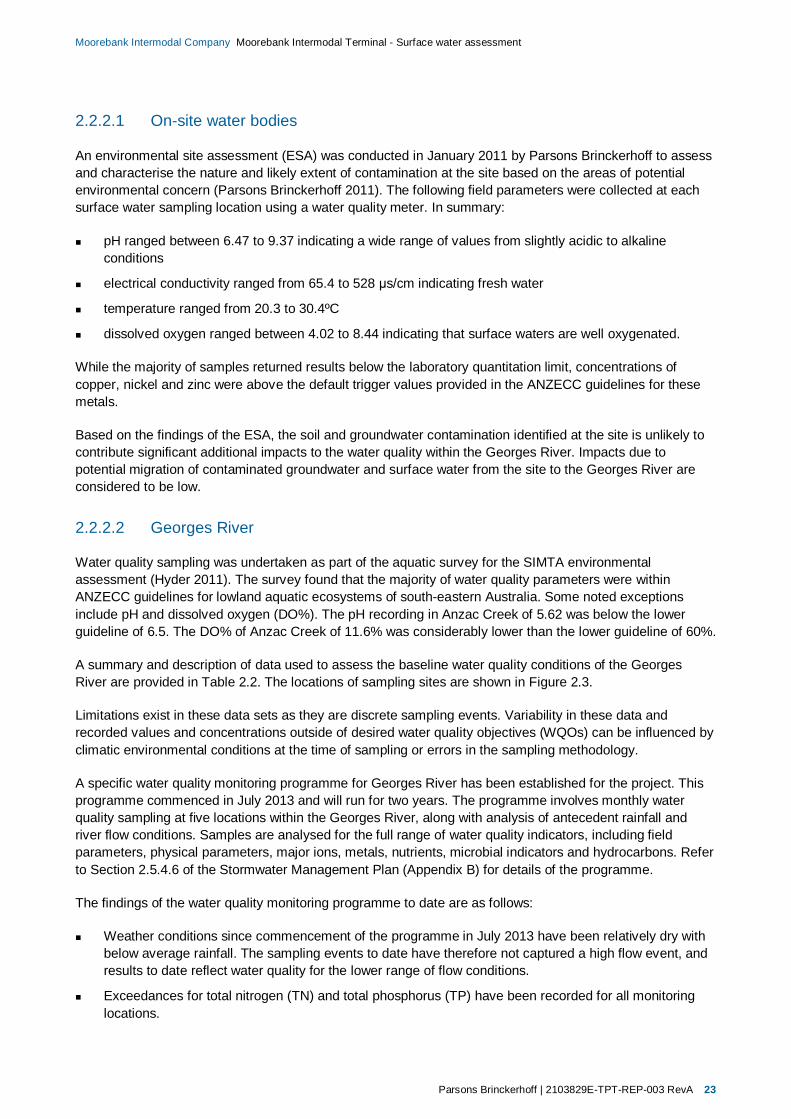
2.2.2.1 On-site water bodies
An environmental site assessment (ESA) was conducted in January 2011 by Parsons Brinckerhoff to assessand characterise the nature and likely extent of contamination at the site based on the areas of potentialenvironmental concern (Parsons Brinckerhoff 2011). The following field parameters were collected at eachsurface water sampling location using a water quality meter. In summary:
pH ranged between 6.47 to 9.37 indicating a wide range of values from slightly acidic to alkalineconditions
electrical conductivity ranged from 65.4 to 528 s/cm indicating fresh water
temperature ranged from 20.3 to 30.4ºC
dissolved oxygen ranged between 4.02 to 8.44 indicating that surface waters are well oxygenated.
While the majority of samples returned results below the laboratory quantitation limit, concentrations ofcopper, nickel and zinc were above the default trigger values provided in the ANZECC guidelines for thesemetals.
Based on the findings of the ESA, the soil and groundwater contamination identified at the site is unlikely tocontribute significant additional impacts to the water quality within the Georges River. Impacts due topotential migration of contaminated groundwater and surface water from the site to the Georges River areconsidered to be low.
2.2.2.2 Georges River
Water quality sampling was undertaken as part of the aquatic survey for the SIMTA environmentalassessment (Hyder 2011). The survey found that the majority of water quality parameters were withinANZECC guidelines for lowland aquatic ecosystems of south-eastern Australia. Some noted exceptionsinclude pH and dissolved oxygen (DO%). The pH recording in Anzac Creek of 5.62 was below the lowerguideline of 6.5. The DO% of Anzac Creek of 11.6% was considerably lower than the lower guideline of 60%.
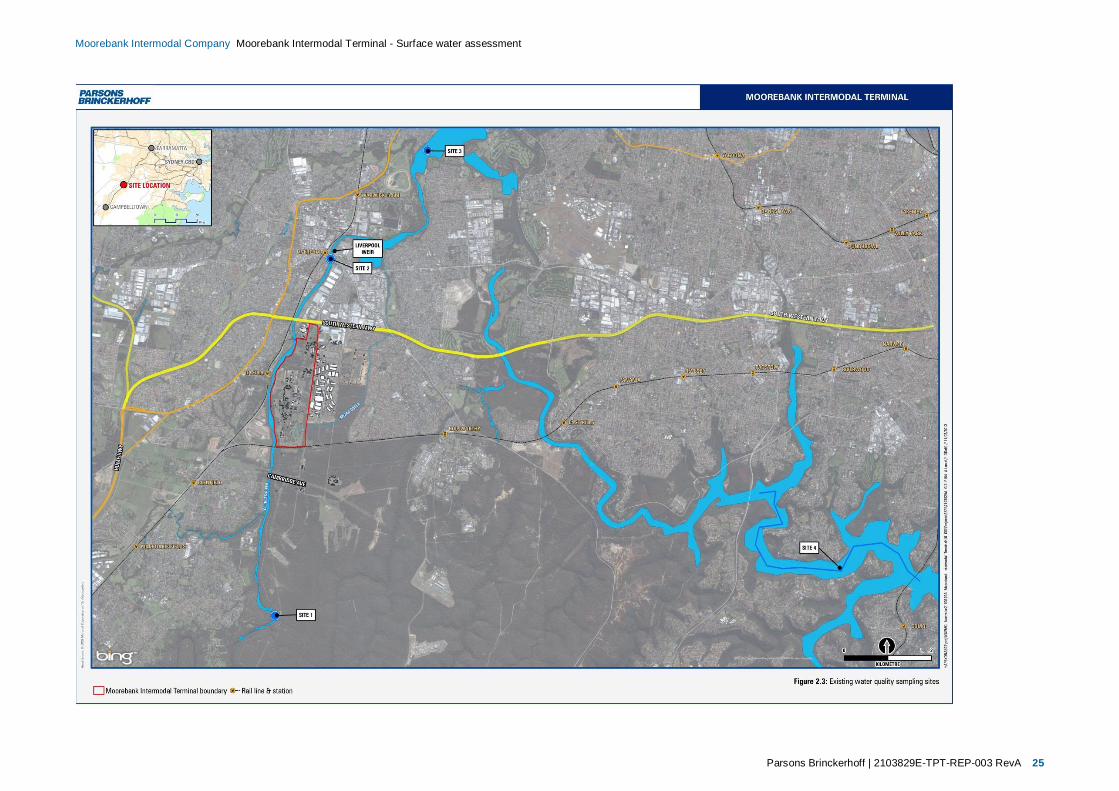
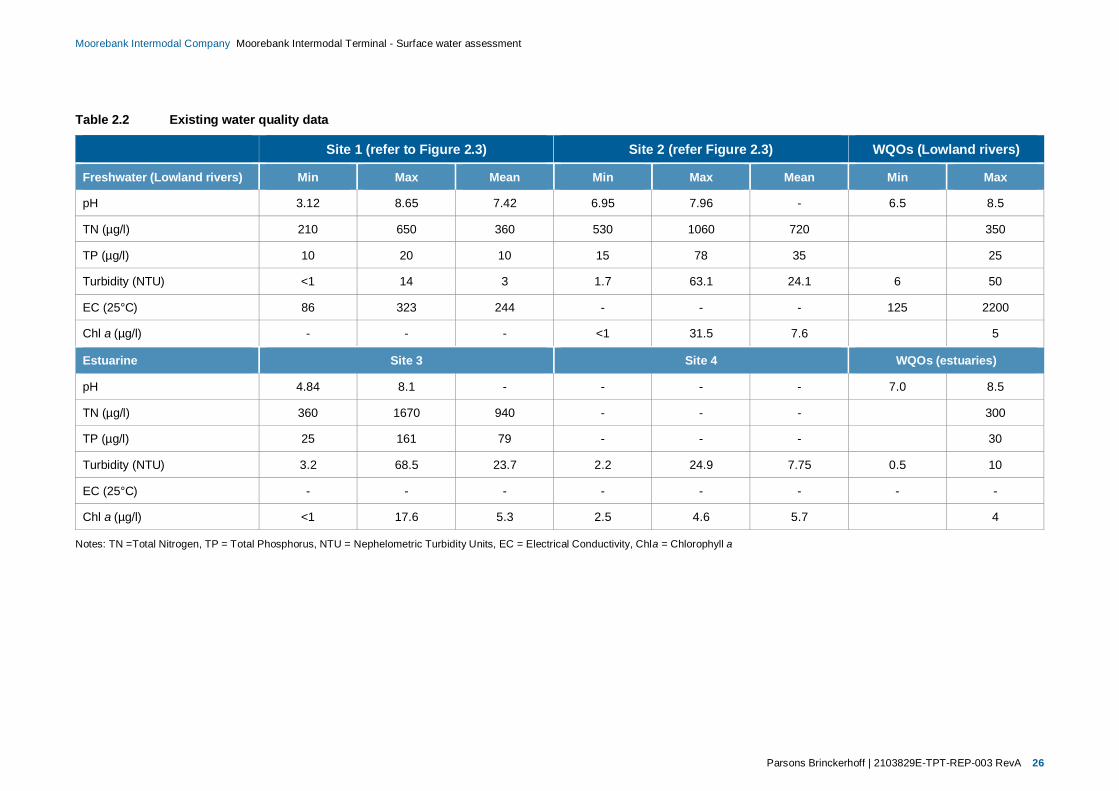
A summary and description of data used to assess the baseline water quality conditions of the GeorgesRiver are provided in Table 2.2. The locations of sampling sites are shown in Figure 2.3.
Limitations exist in these data sets as they are discrete sampling events. Variability in these data andrecorded values and concentrations outside of desired water quality objectives (WQOs) can be influenced byclimatic environmental conditions at the time of sampling or errors in the sampling methodology.
A specific water quality monitoring programme for Georges River has been established for the project. Thisprogramme commenced in July 2013 and will run for two years. The programme involves monthly waterquality sampling at five locations within the Georges River, along with analysis of antecedent rainfall andriver flow conditions. Samples are analysed for the full range of water quality indicators, including fieldparameters, physical parameters, major ions, metals, nutrients, microbial indicators and hydrocarbons. Referto Section 2.5.4.6 of the Stormwater Management Plan (Appendix B) for details of the programme.
The findings of the water quality monitoring programme to date are as follows:
Weather conditions since commencement of the programme in July 2013 have been relatively dry withbelow average rainfall. The sampling events to date have therefore not captured a high flow event, andresults to date reflect water quality for the lower range of flow conditions.
Exceedances for total nitrogen (TN) and total phosphorus (TP) have been recorded for all monitoringlocations.

Parsons Brinckerhoff | 2103829E-TPT-REP-003 RevA 24
Moorebank Intermodal Company Moorebank Intermodal Terminal - Surface water assessment
The single sampling location on Anzac Creek most commonly exceeds TN and TP trigger values, likelyto be due to fertilisers used at the Golf Course.
No major exceedances for metals have been recorded.
Other exceedances have been recorded but none indicating unusual or long term trends of concern.
In general the results to date reflect the prevailing low flow conditions.
As the programme is approximately 50% complete and has been operating during predominantly lowflow conditions, it is recommended that summary statistics from the programme be prepared at a moreadvanced stage of the programme when a longer term record is available that captures more variabilityin flow conditions.
Parsons Brinckerhoff | 2103829E-TPT-REP-003 RevA 25
Moorebank Intermodal Company Moorebank Intermodal Terminal - Surface water assessment
Parsons Brinckerhoff | 2103829E-TPT-REP-003 RevA 26
Moorebank Intermodal Company Moorebank Intermodal Terminal - Surface water assessment
Table 2.2 Existing water quality data
Site 1 (refer to Figure 2.3) Site 2 (refer Figure 2.3) WQOs (Lowland rivers)
Freshwater (Lowland rivers) Min Max Mean Min Max Mean Min Max
pH 3.12 8.65 7.42 6.95 7.96 - 6.5 8.5
TN (µg/l) 210 650 360 530 1060 720 350
TP (µg/l) 10 20 10 15 78 35 25
Turbidity (NTU) <1 14 3 1.7 63.1 24.1 6 50
EC (25°C) 86 323 244 - - - 125 2200
Chl a (µg/l) - - - <1 31.5 7.6 5
Estuarine Site 3 Site 4 WQOs (estuaries)
pH 4.84 8.1 - - - - 7.0 8.5
TN (µg/l) 360 1670 940 - - - 300
TP (µg/l) 25 161 79 - - - 30
Turbidity (NTU) 3.2 68.5 23.7 2.2 24.9 7.75 0.5 10
EC (25°C) - - - - - - - -
Chl a (µg/l) <1 17.6 5.3 2.5 4.6 5.7 4
Notes: TN =Total Nitrogen, TP = Total Phosphorus, NTU = Nephelometric Turbidity Units, EC = Electrical Conductivity, Chla = Chlorophyll a

Parsons Brinckerhoff | 2103829E-TPT-REP-003 RevA 27
Moorebank Intermodal Company Moorebank Intermodal Terminal - Surface water assessment
3. Impact assessmentThis chapter outlines the potential impacts of the project for the early works, construction and operationalphases. Where possible, individual impacts relating to a specific layout (northern, central and southern) havebeen identified but many of the impacts will be applicable for all the proposed layouts. Details of the projectworks are firstly outlined below then the impact assessment with respect to regional flooding and localstormwater are discussed. Measures to mitigate and manage the identified impacts are provided inChapter 4 of this report.
3.1 Proposed project works
3.1.1 Early works
Early works will consist of the following:
establishment of construction facilities, which may include a construction laydown area, site offices,hygiene units, kitchen facilities and wheel wash, if it is necessary to establish these facilities in adifferent location from that initially set up as part of the site rehabilitation works (refer section 8.1.2above);
demolition or relocation of existing buildings, structures and contaminated buildings not being removedas part of the MUR Project or the site rehabilitation works (refer section 8.1.1 and 8.1.2 above);
some contaminated land remediation including removal of unexploded ordnance (UXO) and explosiveordnance waste (EXO) if found, removal of asbestos contaminated buildings and remediation of an areaknown to contain asbestos (as shown in Figure 8.2);
relocation of trees, including hollow bearing trees (i.e. those that provide ecologically important roostinghabitats);
service utility terminations and diversions;
establishment of the conservation area within the Project site including seed banking and planting; and
heritage impact mitigation works including archaeological salvage of Aboriginal and European potentialarchaeological deposit (PAD) sites.
3.1.1.1 Conservation area
The project would establish the riparian vegetation between the Georges River and the 1% AEP flood levelas a dedicated conservation area as part of early works. With the exception of the rail links and bridges overGeorges River proposed to connect the MIMT site to the SSFL and the establishment of stormwaterdrainage channels, no further development is proposed in this area. The conservation area will beapproximately 2.5 km in length and may be up to 250 m wide in some areas.
The conservation area would comprise vegetation that is to be retained and areas which are currently weedinfested or cleared, which require rehabilitation.
Parsons Brinckerhoff | 2103829E-TPT-REP-003 RevA 28
Moorebank Intermodal Company Moorebank Intermodal Terminal - Surface water assessment
3.1.2 Rail access connections and Georges River crossing
The project requires development of a rail crossing over the Georges River to connect the main project railinfrastructure to the SSFL (refer to Appendix C for detailed presentation of layouts). Three crossing optionshave been proposed and these include:
Northern rail access option (crosses LCC land)
Central rail access option (crosses Commonwealth Land (Lot 4 DP1130937))
Southern rail access option (crosses Glenfield Landfill).
Each of these options have north and south bound connections to the SSFL. The development of the bridgecrossing has the potential to have adverse impacts on flooding in the vicinity of the new structure. Hydraulicinvestigations have been undertaken to assess the afflux generated by each of the proposed rail crossingoptions and their associated piers within the Georges River and its floodplain adjacent to the Project site(refer Appendix A to this report).
Given that the options are still at the conceptual design stage, it is assumed that the crossing will consist oftwo single track rail bridges that converge near the crossing of the Georges River. The bridges would havemultiple piers located both within the Georges River and within the Georges River floodplain. None of the railaccess option bridges would orientate perpendicular to the river and instead would cross the main channeland floodplain at an oblique angle to the main flow direction. The piers, however, would be designed so thatthey are orientated in the direction of flow as far as possible to minimise afflux impacts.
Generally the bridge piers would be 1.8 m in diameter. In the floodplain these piers would extend belowground to their founding depth. The piers would be designed to be streamlined in shape to minimise affluxand scour of the bed and banks of the waterway. For the purposes of this assessment the piers have beenassumed to be 1.8 m in diameter (as per the existing East Hills Rail Bridge) and located at 20 m intervals asa minimum. Piers located within the river channel would terminate above normal water level where theywould be supported on a pile cap and a raft of piles. The bridge deck soffit would be set a minimum of500 mm above the predicted 1% AEP flood level although headstocks would be partially submerged duringthis event.
The following sections outline the concept bridge layouts considered in this report. Further modelling of floodimpacts would be undertaken during detailed design of the bridge to ensure flood impacts are minimised.
3.1.2.1 Northern rail access option
The northern rail access option proposes constructing a rail bridge to the northern area of the Project Site.The concept plan shows two separate single track rail bridges crossing the river that converge into a singledouble track structure on the eastern bank of the Georges River. The bridges would require a number ofpiers located both within the Georges River and within the Georges River floodplain. The bridge does notorientate perpendicular to the river and instead forms two arcs across the floodplain.
3.1.2.2 Central rail access option
The central rail access option proposes constructing a rail bridge in the central area of the Project site. Theconcept plan proposes two separate single track rail bridges crossing the Georges River before converginginto a single double track arrangement within the main Moorebank IMT Project site. The bridges are likely tohave piers located both within the Georges River and within the Georges River floodplain. The bridge doesnot orientate perpendicular to the river and instead forms two arcs across the floodplain.
Parsons Brinckerhoff | 2103829E-TPT-REP-003 RevA 29
Moorebank Intermodal Company Moorebank Intermodal Terminal - Surface water assessment
3.1.2.3 Southern rail access option
The southern rail access option proposes constructing a rail bridge adjacent to the existing East Hills RailBridge, crossing the Georges River at the Southern end of the Project site. The concept plan showstwo separate single track rails that cross the western floodplain of the Georges River through the GlenfieldLandfill site before converging into a single double track bridge to cross the Georges River immediatelydownstream from the existing rail bridge.
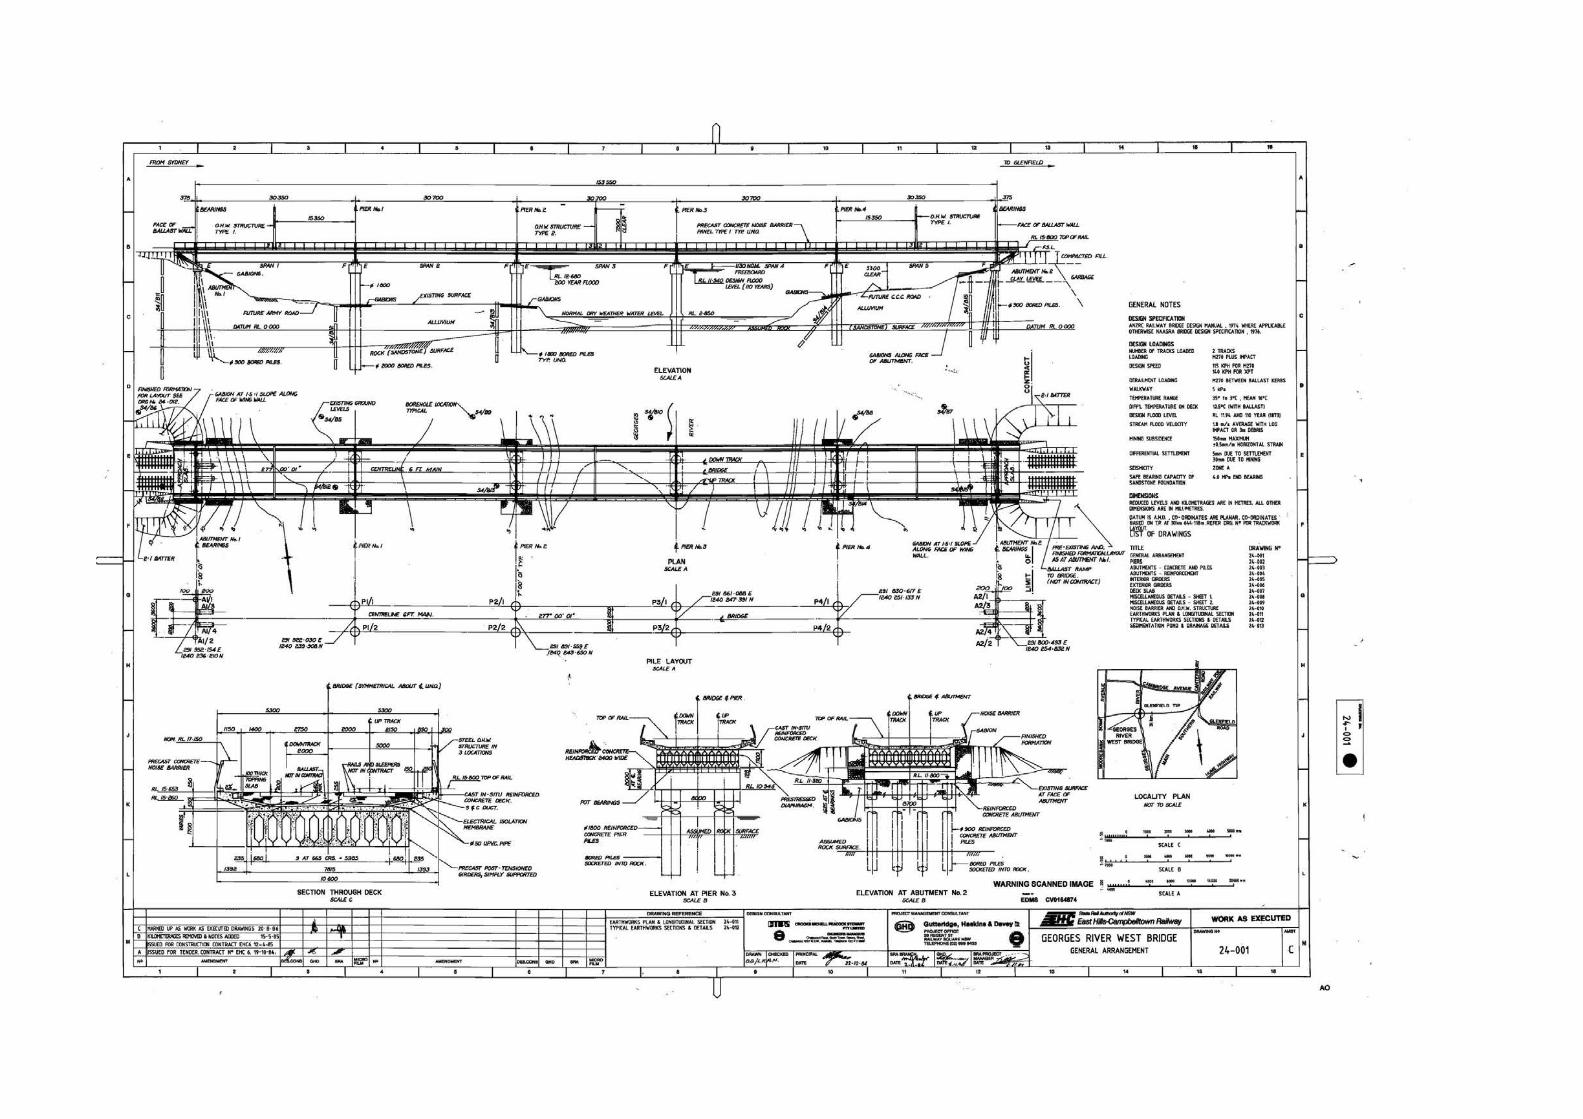
To minimise potential flood impacts the bridge has been designed to hydraulically replicate the existing railbridge (refer Appendix A for existing bridge ‘Work as Executed Drawings’).
3.1.3 General project infrastructure
The project will require the construction of warehouses, administration buildings, hardstand areas, roads,parking areas, the rail corridor, and container transfer and storage areas. With the exception of theconservation area it is anticipated that a majority of the Project Site will be utilised for the facilities andsubsequently the percentage of impervious surfaces will be greatly increased from present conditions.
Stormwater quality and quantity will need to be managed so that proposed discharges have no impact on thedownstream receiving environment, the Georges River and Anzac Creek. For each rail crossing option aconceptual stormwater flow breakdown has been developed in order to identify the minimum stormwatermanagement infrastructure required. As all flows from the developed site will discharge directly into theGeorges River and Anzac Creek, there are no stormwater pollution impacts on adjacent lands and theimpact assessment has focused on the receiving waterways.
The key elements of the Project system include:
piped 10% AEP drainage capacity from all hard stand areas
piped 2% AEP drainage capacity from all rail corridors
1% AEP overland flows across the site
direct piped drainage from upstream catchments across the developed site to Georges River
direct piped drainage at the southern end of the site to Anzac Creek
diversion of M5 surcharge to the developed site drainage and detention system
diversion of runoff from Moorebank Business Park through open channels or box culverts crossing thedeveloped site
provision of overland flow paths across the site to detention basins which will discharge to GeorgesRiver
constructed biofiltration/wetlands along the east bank of Georges River to treat site runoff prior todischarge to Georges River
stormwater pollution prevention and treatment systems distributed across the site.
The proposed site drainage strategy has been developed to contain stormwater runoff for all events up toand including the 10% AEP design event in an underground piped network. Runoff from higher order eventswill surcharge the network and travel overland via the road network, dedicated open channels or via gradedchannels across the site. The proposed system should be designed to minimise disturbance to siteoperations as a result of a rainfall event or from a flood event within the Georges River. All outlets from theproject stormwater system should be set above the 1% AEP design flood level in the Georges River.
Parsons Brinckerhoff | 2103829E-TPT-REP-003 RevA 30
Moorebank Intermodal Company Moorebank Intermodal Terminal - Surface water assessment
Detention basins have been sized for each layout to detain stormwater runoff and reduce peak dischargeflow rates to pre-development conditions (as required by LCC). Stormwater treatment measures will beincluded in the layout where possible and some measures include:
grassed swales
rain gardens
sedimentation basins (at detention basin inlets)
biofiltration basins and permanent ponds (at detention basin inlets).
The final stormwater treatment system should contain these or other approved equivalent measures in orderto address LCC requirements for managing the quality of stormwater runoff from the site. The proposedstormwater management strategy has estimated the sizes of detention and biofiltration for each layoutoption.
For the construction phase of the project it is proposed that temporary sedimentation basins be built in thelocations of the permanent basins then converted to permanent structures for the operational phase.
3.2 Regional flooding impactsDevelopment of the project site has been planned around existing regional flooding constraints which are inline with the NSW Flood Prone Land policy as outlined in the NSW Floodplain Development Manual(DIPNR 2005). As such infrastructure and changes to ground levels are only proposed within the low floodrisk or no flood risk zones (refer to Figure 2.1). The areas of the site within the medium and high risk zonesare primarily contained within the proposed conservation zone as identified in section 3.1.1. The exception tothis is the rail bridge crossings of the Georges River which connects the site with the SSFL.
The bridge crossings can potentially have adverse impacts on flooding in the vicinity of the structure and theupstream catchment. A hydraulic investigation has been undertaken to assess the potential afflux(i.e. increase in flood levels) generated by the proposed rail crossings and associated piers within theGeorges River and floodplain (refer to Appendix A).
3.2.1 Early works impacts
The impact of the early works on regional flooding is negligible. Establishment of the conservation area is theonly works to take place within the flood affected area. As long as the materials and equipment for theconservation area is to be stored outside the flood zone then there will be no impact to regional flooding.
3.2.2 Construction phase impacts
Temporary works for the construction of the bridge piers and their foundations will likely involve temporarylocalised obstructions to flood flow within the main channel of the Georges River and on the floodplain. Theoccurrence of a large flood (greater than a 5% AEP) during construction when these temporary works arepresent in the channel and/or floodplain has the potential to increase flood levels locally upstream of theworks. Occurrence of a large (greater than 5% AEP) flood during construction also has the potential to causedamage to the temporary works and result in debris from the works contributing to flood damage to land andproperty downstream. These impacts can be minimised through appropriate staging of the temporary worksand employing a flood emergency plan which details the disassembly of works, preparation for flood watersprior to large flood event peaks reaching the site and recovery actions to enable works to resume as quicklyas possible following the event. At this stage details of construction techniques to be employed are unknownand the effects of various flood events on construction phase works requires further investigation.
Parsons Brinckerhoff | 2103829E-TPT-REP-003 RevA 31
Moorebank Intermodal Company Moorebank Intermodal Terminal - Surface water assessment
Construction of the remainder of the site will have minimal to no impact on regional flooding as these worksare located out of the flood affected land.
3.2.3 Operational phase impacts
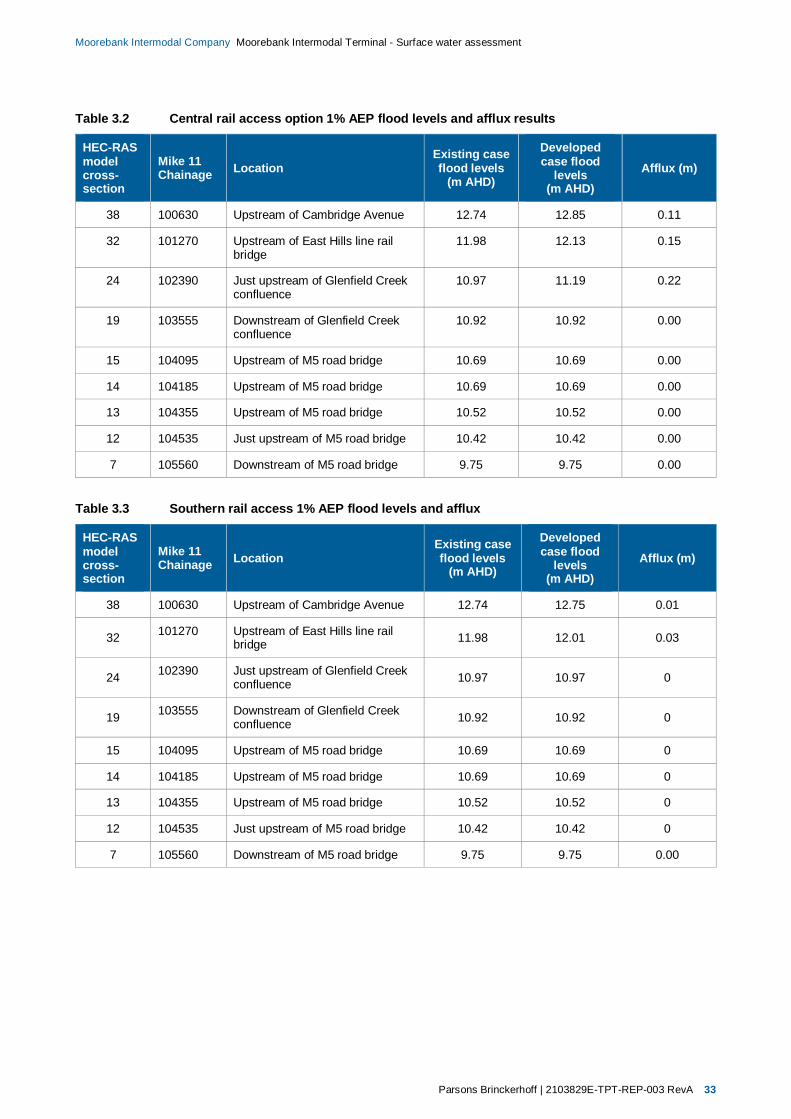
During the operation of the site the main potential impacts on regional flooding will be due to the new railbridges required for the project. In order to assess these impacts the one-dimensional hydraulic modellingsoftware package HEC-RAS was used to undertake the impact assessment. LCC’s larger scale MIKE11hydraulic model of the Georges River was available for the assessment and was used to verify the HEC-RASmodel results, but was not possible to adapt for use in assessing impacts of any of the proposed rail accessoptions (refer to Appendix A for details). The investigation was focussed on the 1% AEP design flood eventas this is the key event for bridge serviceability and assessment of impacts of the bridge on regional flooding.The 1% AEP design flood event is also the principal flood planning event adopted by LCC and stipulated inthe Georges River Floodplain Risk Management Study and Plan (Bewsher 2004).
The hydraulic modelling results are presented in Tables 3.1 to 3.3 below for the northern, central andsouthern rail access options.
The hydraulic modelling indicates that the maximum afflux for a 1% AEP event would occur immediatelyupstream of the proposed rail bridges for each option and would be limited to:
30 mm for the southern option
150 mm for the northern option
220 mm for the central option.
Upstream of the project site the southern option has the lowest afflux (despite having the bridge located atthe upstream extent of the project site) with an afflux of 20 mm noted at the upstream cross section of themodel. This compares to an afflux of 60 mm for the northern option and 90 mm for the central option. Due tolimited modelling inputs, (the model has been built using cross sections at varied spacing of no less than100 m which limits the definition of the flowpaths and may not account for all storage available) theseestimated affluxes are likely to be larger than would actually occur and should be verified with more detailedmodelling at detailed design.
The central and northern rail access options present new hydraulic restrictions across the floodplain incomparison to the southern rail access option which is located adjacent to and designed hydraulically similarto the existing East Hills Rail bridge. The location of the proposed southern bridge option adjacent to theexisting rail bridge, and bridge design being hydraulically similar to the rail bridge are key reasons forthe lesser impact on flood levels associated with this option in comparison with the northern and central railaccess options.
The central option has the largest impact at the upstream model extent. This estimated impact would requirefurther investigation and refinement through the development of the bridge design. As currently modelled itindicates a potential change to the flood level at the upstream extent of the model which could in turn affectflood planning considerations.
The southern rail access option traverses the western floodplain through the Glenfield Landfill. It is expectedthat an embankment and or a bridges/embankment formation for this crossing will have an impact on floodlevels in the landfill. The flood risking mapping indicates that the landfill site is high flood risk hazard. Closerreview of the flood risk mapping shows a similarity in the mapped extent of both the low and high hazardareas which suggests that any change to flood levels in the landfill would not change the flood extent andwould affect only the depth of flooding. There may also be some impact on flood levels in the main riverchannel however, the alignment of the embankment (parallel) to the Georges River means that theseimpacts will be minor and are not likely to extend beyond the project boundary.
Parsons Brinckerhoff | 2103829E-TPT-REP-003 RevA 32
Moorebank Intermodal Company Moorebank Intermodal Terminal - Surface water assessment
There are residences located upstream of the project site and it will be critical to ensure that flood impacts donot negatively affect these properties. The modelling indicates that none of the three rail access bridgeoptions considered would increase the flood risk to these properties during a 1% AEP event as theseproperties are beyond the 1% AEP flood extent.
The flood investigation provided in Appendix A includes a series of hydraulic model cross-sections withsuperimposed flood levels for the existing and developed cases. The cross sections show that the increasesin flood level do not translate to a significant increase in flood extent due to the flow being confined within arelatively steep-sided valley. The flood modelling results also indicate that flow velocities in the river aregenerally unaffected, with negligible increases predicted in the immediate vicinity of the proposed bridge.
This means that for land upstream of Cambridge Avenue, there are no changes to the floodplain riskmanagement planning considerations as outlined in the Georges River Floodplain Management Study(Bewsher 2004). The river is confined to a narrow channel and the currently developed land is beyond the1% AEP flood extent.
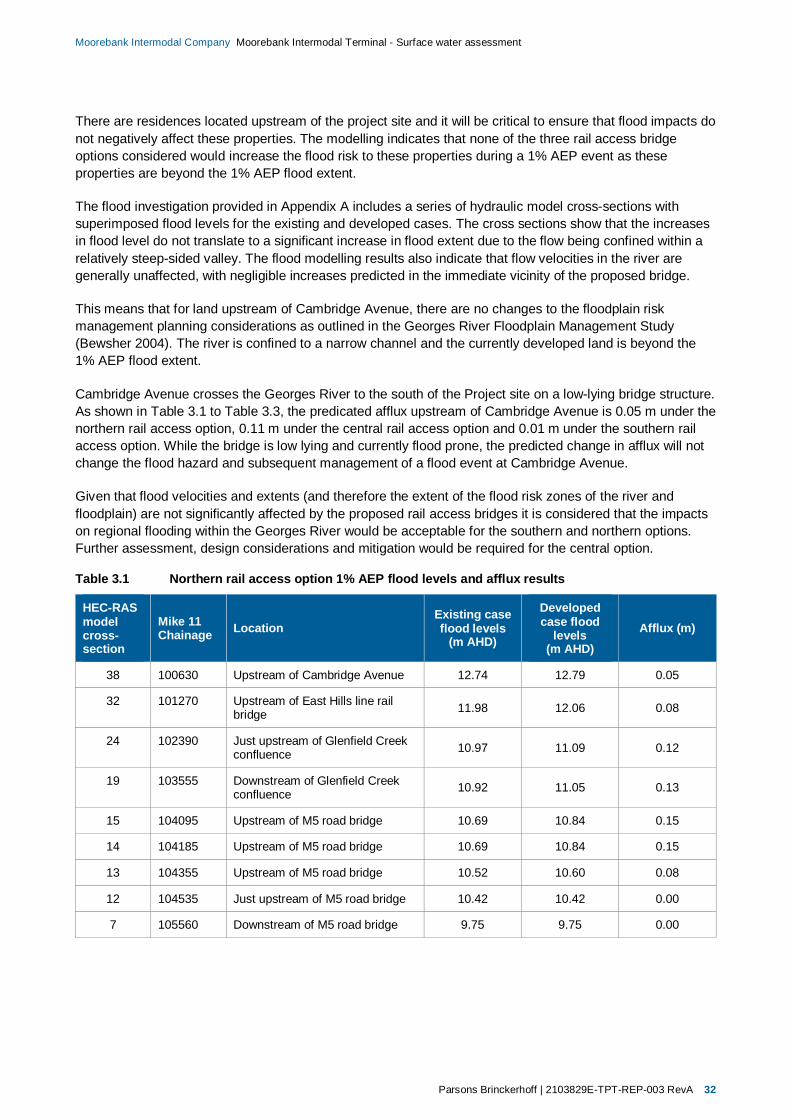
Cambridge Avenue crosses the Georges River to the south of the Project site on a low-lying bridge structure.As shown in Table 3.1 to Table 3.3, the predicated afflux upstream of Cambridge Avenue is 0.05 m under thenorthern rail access option, 0.11 m under the central rail access option and 0.01 m under the southern railaccess option. While the bridge is low lying and currently flood prone, the predicted change in afflux will notchange the flood hazard and subsequent management of a flood event at Cambridge Avenue.
Given that flood velocities and extents (and therefore the extent of the flood risk zones of the river andfloodplain) are not significantly affected by the proposed rail access bridges it is considered that the impactson regional flooding within the Georges River would be acceptable for the southern and northern options.Further assessment, design considerations and mitigation would be required for the central option.
Table 3.1 Northern rail access option 1% AEP flood levels and afflux results
HEC-RASmodelcross-section
Mike 11Chainage Location
Existing caseflood levels
(m AHD)
Developedcase flood
levels(m AHD)
Afflux (m)
38 100630 Upstream of Cambridge Avenue 12.74 12.79 0.05
32 101270 Upstream of East Hills line railbridge 11.98 12.06 0.08
24 102390 Just upstream of Glenfield Creekconfluence 10.97 11.09 0.12
19 103555 Downstream of Glenfield Creekconfluence 10.92 11.05 0.13
15 104095 Upstream of M5 road bridge 10.69 10.84 0.15
14 104185 Upstream of M5 road bridge 10.69 10.84 0.15
13 104355 Upstream of M5 road bridge 10.52 10.60 0.08
12 104535 Just upstream of M5 road bridge 10.42 10.42 0.00
7 105560 Downstream of M5 road bridge 9.75 9.75 0.00
Parsons Brinckerhoff | 2103829E-TPT-REP-003 RevA 33
Moorebank Intermodal Company Moorebank Intermodal Terminal - Surface water assessment
Table 3.2 Central rail access option 1% AEP flood levels and afflux results
HEC-RASmodelcross-section
Mike 11Chainage Location
Existing caseflood levels
(m AHD)
Developedcase flood
levels(m AHD)
Afflux (m)
38 100630 Upstream of Cambridge Avenue 12.74 12.85 0.11
32 101270 Upstream of East Hills line railbridge
11.98 12.13 0.15
24 102390 Just upstream of Glenfield Creekconfluence
10.97 11.19 0.22
19 103555 Downstream of Glenfield Creekconfluence
10.92 10.92 0.00
15 104095 Upstream of M5 road bridge 10.69 10.69 0.00
14 104185 Upstream of M5 road bridge 10.69 10.69 0.00
13 104355 Upstream of M5 road bridge 10.52 10.52 0.00
12 104535 Just upstream of M5 road bridge 10.42 10.42 0.00
7 105560 Downstream of M5 road bridge 9.75 9.75 0.00
Table 3.3 Southern rail access 1% AEP flood levels and afflux
HEC-RASmodelcross-section
Mike 11Chainage Location
Existing caseflood levels
(m AHD)
Developedcase flood
levels(m AHD)
Afflux (m)
38 100630 Upstream of Cambridge Avenue 12.74 12.75 0.01
32 101270 Upstream of East Hills line railbridge 11.98 12.01 0.03
24 102390 Just upstream of Glenfield Creekconfluence 10.97 10.97 0
19 103555 Downstream of Glenfield Creekconfluence 10.92 10.92 0
15 104095 Upstream of M5 road bridge 10.69 10.69 0
14 104185 Upstream of M5 road bridge 10.69 10.69 0
13 104355 Upstream of M5 road bridge 10.52 10.52 0
12 104535 Just upstream of M5 road bridge 10.42 10.42 0
7 105560 Downstream of M5 road bridge 9.75 9.75 0.00
Parsons Brinckerhoff | 2103829E-TPT-REP-003 RevA 34
Moorebank Intermodal Company Moorebank Intermodal Terminal - Surface water assessment
3.2.4 Potential impacts of climate change on regional flooding
State Government and local council policy requires that new development be planned to cope with potentialfuture climatic conditions. The frequency and intensity of extreme rainfall events in the Sydney area arepredicted to increase as a result of climate change (Rafter and Abbs, 2009). This will result in an increase inthe frequency and magnitude of flood events in the Georges River catchment.
The NSW Government’s Floodplain Risk Management Guideline: Practical Consideration of Climate Change(DECC 2007) recommends assessment of 10, 20 and 30% increases in rainfall depths when makingallowance for climate change. For this assessment, however, the rainfall depths input to the hydrologicalmodel developed for LCC were not available so the middle level of an increase to flows by 20% wasadopted.
A qualitative assessment of the changed regional flooding impacts of the proposed rail bridge or of thechanged flood risk to the developed site under climate change scenarios based on the proposed conceptoptions (northern, central and southern rail access options) is presented as follows:
Increases in rainfall intensity will cause increases in the magnitude of flood events for a given designflood in the Georges River. Increases in rainfall intensity do not necessarily cause a direct equivalentincrease in peak flow for a given event as the flow response will depend on the catchmentcharacteristics.
Correspondingly, significant increases in flow do not necessarily cause significant increases in floodlevel or extent, as the flood level response in a large connected river channel and floodplain systemmay be relatively insensitive to changes in flow.
For the Georges River adjacent to the Project Site, climate change would be expected to raise floodlevels and extents to some degree, but the changes in flood levels are likely to be in the order ofcentimetres rather than metres for high order events such as the 1% AEP event.
Under climate change scenarios the afflux caused by the new rail bridge for the 1% AEP event would beexpected to be similar to that assessed without climate change in section 3.3.2. This is because the500 mm clearance of the bridge soffit above the 1% AEP flood level without climate change allowanceshould accommodate the likely increase in the flood level under the climate change scenario.
Due to the steep valley topography on the eastern floodplain, increases in flow due to climate changewill not significantly affect the extent of the flood risk zones for most of the Project Site (refer toFigure 2.1). For the northern portion of the site the low flood risk zone extends across the site, indicatingthat the valley topography is flatter at this location. In this area the increased flow due to climate changeis likely to result in an increase in the extent of the high and medium flood risk zones. However, asnoted in section 3.1.1, this area will be a key part of the conservation zone set aside for rehabilitatedvegetated areas and will not contain critical project infrastructure.
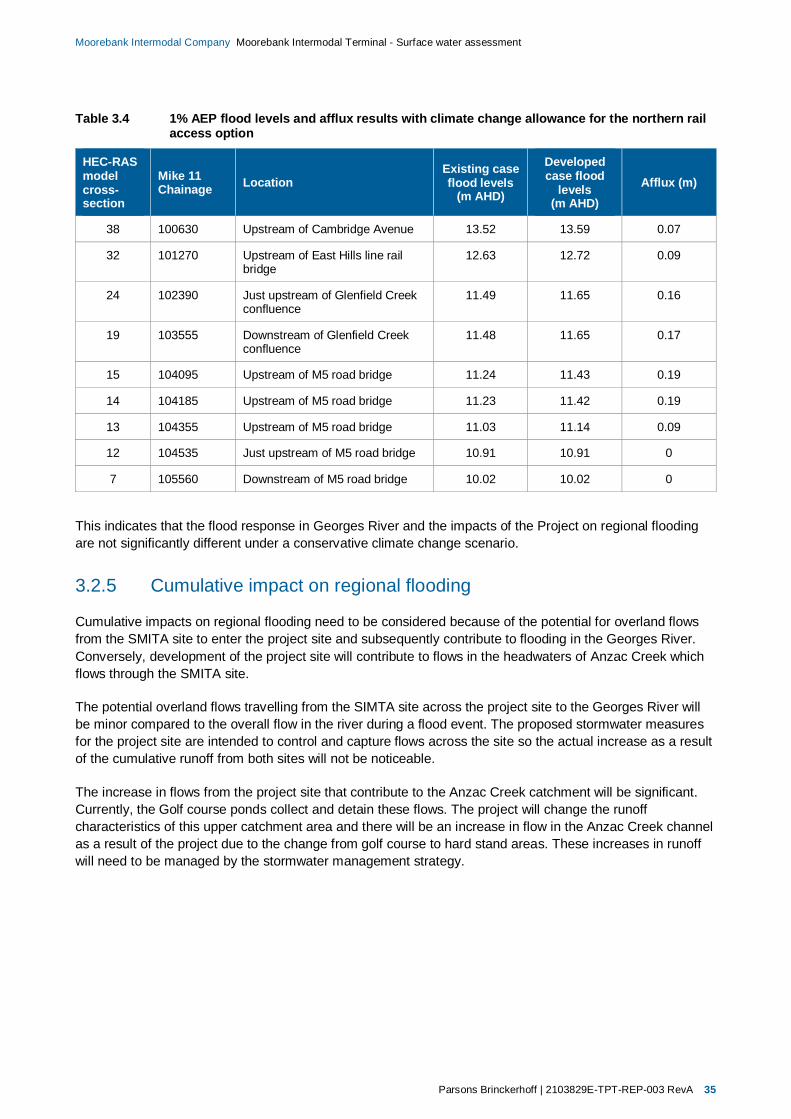
The following quantitative impact assessment (refer Table 3.4) for the northern rail access option wascompleted using the MIKE11 flood model, as the afflux from this option was between the southern andcentral options. The climate change assessment considered a 20% increase in flow. Results show amaximum 0.19 m afflux in the vicinity of the northern rail access option bridges, which is 0.04 m greater thanthe predicted afflux for the no climate change scenario.
Parsons Brinckerhoff | 2103829E-TPT-REP-003 RevA 35
Moorebank Intermodal Company Moorebank Intermodal Terminal - Surface water assessment
Table 3.4 1% AEP flood levels and afflux results with climate change allowance for the northern railaccess option
HEC-RASmodelcross-section
Mike 11Chainage Location
Existing caseflood levels
(m AHD)
Developedcase flood
levels(m AHD)
Afflux (m)
38 100630 Upstream of Cambridge Avenue 13.52 13.59 0.07
32 101270 Upstream of East Hills line railbridge
12.63 12.72 0.09
24 102390 Just upstream of Glenfield Creekconfluence
11.49 11.65 0.16
19 103555 Downstream of Glenfield Creekconfluence
11.48 11.65 0.17
15 104095 Upstream of M5 road bridge 11.24 11.43 0.19
14 104185 Upstream of M5 road bridge 11.23 11.42 0.19
13 104355 Upstream of M5 road bridge 11.03 11.14 0.09
12 104535 Just upstream of M5 road bridge 10.91 10.91 0
7 105560 Downstream of M5 road bridge 10.02 10.02 0
This indicates that the flood response in Georges River and the impacts of the Project on regional floodingare not significantly different under a conservative climate change scenario.
3.2.5 Cumulative impact on regional flooding
Cumulative impacts on regional flooding need to be considered because of the potential for overland flowsfrom the SMITA site to enter the project site and subsequently contribute to flooding in the Georges River.Conversely, development of the project site will contribute to flows in the headwaters of Anzac Creek whichflows through the SMITA site.
The potential overland flows travelling from the SIMTA site across the project site to the Georges River willbe minor compared to the overall flow in the river during a flood event. The proposed stormwater measuresfor the project site are intended to control and capture flows across the site so the actual increase as a resultof the cumulative runoff from both sites will not be noticeable.
The increase in flows from the project site that contribute to the Anzac Creek catchment will be significant.Currently, the Golf course ponds collect and detain these flows. The project will change the runoffcharacteristics of this upper catchment area and there will be an increase in flow in the Anzac Creek channelas a result of the project due to the change from golf course to hard stand areas. These increases in runoffwill need to be managed by the stormwater management strategy.
Parsons Brinckerhoff | 2103829E-TPT-REP-003 RevA 36
Moorebank Intermodal Company Moorebank Intermodal Terminal - Surface water assessment
3.3 Local stormwater catchment impactsThe project will involve a considerable increase in impervious surfaces at the site compared to currentconditions. This section of impacts focuses on the local project site catchments and the Anzac Creekcatchment with respect to stormwater quantity.
3.3.1 Early Works
The Early Works would not be expected to impact on the local stormwater catchments as existing drainagewould continue to be used during this phase. If required, temporary basins for on-site detention would beconstructed to manage runoff in line with erosion and sediment control plans. This would ensure that anydischarge to receiving watercourses (Georges River) would be maintained at pre-development levels.
3.3.2 Construction phase impacts
Stormwater runoff from the site during construction will increase as the vegetation and topsoil isprogressively cleared to construct the internal precincts, road network and other impervious areas. Theconstruction phase will not be critical for increased runoff from the site however construction managementtechniques will be applied to reduce peak stormwater flows and velocities. These mitigation measures arecovered further in the following section, and will employ temporary construction phase flow paths andcombined onsite detention and sedimentation ponds to manage local flows and flooding events. Thenominated contractor should also be required to develop a flood emergency plan involving the cessation ofworks and prevention of site works and debris from entering flood waters. The designation of flood eventsand warnings that will invoke the emergency flood plan should be addressed in the flood emergency planand be determined by the contractor. The determination of these ‘significant flood’ events will vary across thesite depending on the location and stage of works being undertaken.
3.3.3 Operational phase impacts
An assessment has been made of the increases in runoff rates from the developed site as part of theconcept design Stormwater Management Plan (SWMP) (refer to Appendix 2).Tables 3.5, 3.6 and 3.7 belowpresents the peak flow estimates for the 1%, 2% and 10% AEP design storm events for the existing anddeveloped site layouts. The sub-catchment areas are shown in the drawings provided with Appendix B.
The results for each layout shows that the rates of runoff from the developed site far exceed those for theexisting site due to the considerable increase in impervious area, with a 300% increase in peak flows for thesub-catchments.
Without mitigation, this increase in runoff rate from the site would have the potential to increase flooding onthe site itself and in the downstream receiving system of Georges River. Management of increasedstormwater runoff flows and velocity are discussed in section 4.2.
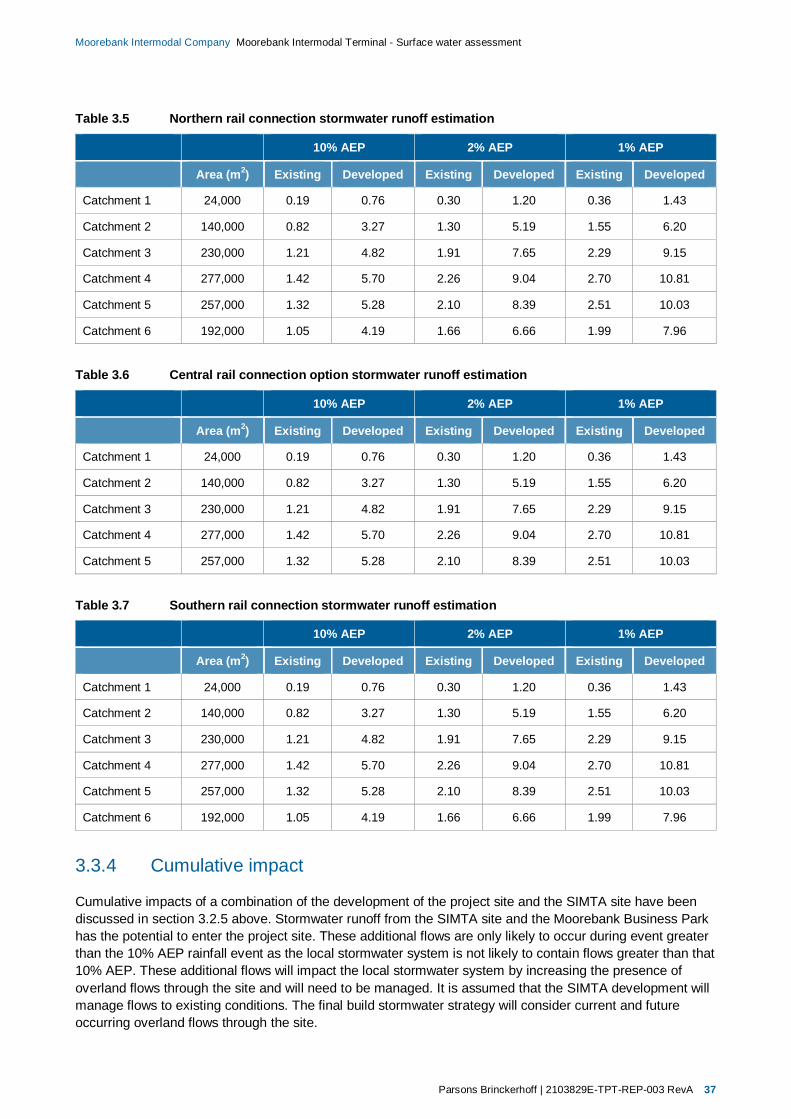
Parsons Brinckerhoff | 2103829E-TPT-REP-003 RevA 37
Moorebank Intermodal Company Moorebank Intermodal Terminal - Surface water assessment
Table 3.5 Northern rail connection stormwater runoff estimation
10% AEP 2% AEP 1% AEP
Area (m2) Existing Developed Existing Developed Existing Developed
Catchment 1 24,000 0.19 0.76 0.30 1.20 0.36 1.43
Catchment 2 140,000 0.82 3.27 1.30 5.19 1.55 6.20
Catchment 3 230,000 1.21 4.82 1.91 7.65 2.29 9.15
Catchment 4 277,000 1.42 5.70 2.26 9.04 2.70 10.81
Catchment 5 257,000 1.32 5.28 2.10 8.39 2.51 10.03
Catchment 6 192,000 1.05 4.19 1.66 6.66 1.99 7.96
Table 3.6 Central rail connection option stormwater runoff estimation
10% AEP 2% AEP 1% AEP
Area (m2) Existing Developed Existing Developed Existing Developed
Catchment 1 24,000 0.19 0.76 0.30 1.20 0.36 1.43
Catchment 2 140,000 0.82 3.27 1.30 5.19 1.55 6.20
Catchment 3 230,000 1.21 4.82 1.91 7.65 2.29 9.15
Catchment 4 277,000 1.42 5.70 2.26 9.04 2.70 10.81
Catchment 5 257,000 1.32 5.28 2.10 8.39 2.51 10.03
Table 3.7 Southern rail connection stormwater runoff estimation
10% AEP 2% AEP 1% AEP
Area (m2) Existing Developed Existing Developed Existing Developed
Catchment 1 24,000 0.19 0.76 0.30 1.20 0.36 1.43
Catchment 2 140,000 0.82 3.27 1.30 5.19 1.55 6.20
Catchment 3 230,000 1.21 4.82 1.91 7.65 2.29 9.15
Catchment 4 277,000 1.42 5.70 2.26 9.04 2.70 10.81
Catchment 5 257,000 1.32 5.28 2.10 8.39 2.51 10.03
Catchment 6 192,000 1.05 4.19 1.66 6.66 1.99 7.96
3.3.4 Cumulative impact
Cumulative impacts of a combination of the development of the project site and the SIMTA site have beendiscussed in section 3.2.5 above. Stormwater runoff from the SIMTA site and the Moorebank Business Parkhas the potential to enter the project site. These additional flows are only likely to occur during event greaterthan the 10% AEP rainfall event as the local stormwater system is not likely to contain flows greater than that10% AEP. These additional flows will impact the local stormwater system by increasing the presence ofoverland flows through the site and will need to be managed. It is assumed that the SIMTA development willmanage flows to existing conditions. The final build stormwater strategy will consider current and futureoccurring overland flows through the site.

Parsons Brinckerhoff | 2103829E-TPT-REP-003 RevA 38
Moorebank Intermodal Company Moorebank Intermodal Terminal - Surface water assessment
3.3.5 Potential impacts of climate change on local stormwater catchmentflooding
As discussed in section 3.2.4, the relevant climate change scenarios to consider for impacts on site runoffare increases in flow up to 30%. In the absence of rainfall depth data relating to this model, a 20% increasein flow has been considered. Such increases in rainfall intensity will produce similar increases in rates ofrunoff from the developed impervious areas of the site.
Without mitigation, these increases in runoff from the site drainage catchments would increase the frequencyof surcharging of the site drainage system and nuisance flooding of the site that would be manifested bylocalised ponding of stormwater in depressions and sag points of roads, surcharging of stormwater pits andovertopping of drainage channels and ponds/basins.
3.4 Surface water quality impactsConstruction and operation of the Project have the potential to impact water quality in the Georges Rivercatchment if appropriate management and mitigation measures are not applied. The following processeshave the potential to impact water quality in downstream receptors:
changes to the physical properties of water, such as:
increased sediment load
change in flow regimes in the Georges River
increase in gross pollutants such as litter
changes to the chemical properties of water, such as:
increased nutrient concentration
increased toxicants
changes to biological properties, such as:
pathogens and bacteria in the water as a result of accidental spillage/leaks of wastewater from sitefacilities
macro algae and phytoplankton, as a result of nutrient enrichment.
Various design measures and management and mitigation measures are proposed to avoid and mitigatewater quality impacts, as discussed below and in section 4.2.
3.4.1 Early works
The development of the conservation area within the flood risk zone may have an impact to downstreamwater quality if a flood event occurs. Should a flood event occur during establishment of this area could resultin significant loss of topsoil and vegetation which will pollute the Georges River, being the downstreamwaterway. The impacts of the early works on the local stormwater catchments will be minor as along ascomprehensive erosion and sediment control plan is developed for the site. This is discussed further insection 4.
Parsons Brinckerhoff | 2103829E-TPT-REP-003 RevA 39
Moorebank Intermodal Company Moorebank Intermodal Terminal - Surface water assessment
3.4.2 Construction phase impacts
Construction activities have the potential to influence water quality. During construction the key impacts onstormwater quality would include the potential mobilisation and erosion of soils on the Project site due to landdisturbance. Mobilised soils have the potential to increase sediment loads and sedimentation of receivingwater bodies.
To effectively manage and mitigate potential construction phase impacts, stormwater infrastructure andsediment basins designed to capture surface water and stormwater runoff from the Project site would beconstructed from the outset during the construction works. This will enable any stormwater pollutants tobe treated on site prior to discharge to the Georges River.
Piling activities in the Georges River for the construction of the railway bridge has the potential to mobilisesediment on the river bed and expose potential acid sulphate soils. Accidental spills of chemicals and otherhazardous construction materials and potential uncontrolled discharge of contaminants to receivingwaterways also have the potential to impact water quality.
Construction activities that have the potential to influence storm water quality include vegetation removal,earthworks (cut and fill), dewatering excavations, piling, stockpiling of spoil and construction materials,construction of fill and embankments, and fuel and oil spills. If uncontrolled and not managed correctly, theseactivities have the potential to result in the following impacts to local storm water quality:
increased turbidity of waterways and drainage lines
increased nutrient loads to receiving waterways
changes to groundwater levels and systems
changed concentration of stormwater pollutants
changes to volume and velocities of surface water drainage
sedimentation of creeks and drainage lines.
An increase in suspended sediment loads in surface water runoff would increase the turbidity of nearbywaterways potentially resulting in sedimentation which can smother aquatic vegetation and habitat. Nutrients,heavy metals and pesticides typically occur in the particulate phase which in turn can have an impact on thechemical processes that influence water quality.
In order to manage and mitigate potential impacts to water quality, appropriate erosion and sediment controlsmeasures would be implemented during the construction phase of the Project (section 4.3.1).
3.4.3 Operational phase impacts
During the operational phase of the MIMT, land use changes and site activities have the potential to impactthe Georges River and Anzac Creek water quality through surface water discharge. Key surface waterimpacts during the operational phase include a potential increase in stormwater pollutants and changes tothe discharge volume and velocities.
Uncontrolled spills and leaks of fuels or oils associated with vehicle and rail transport and the use andstorage of chemicals and hazardous substances could potentially contaminate stormwater runoff. The impactof accidental spills could be substantial depending on the volume of the spill and the nature of the substance.
Broad brush MUSIC modelling was undertaken for the northern layout (since the layouts are conceptual) todetermine the likely annual pollutant loading contribution of the MIMT through stormwater discharges.Estimated annual loads were compared between the pre-developed site and the developed site with andwithout typical types of stormwater treatment. The results of this modelling are shown in Table 3.8 below.

Parsons Brinckerhoff | 2103829E-TPT-REP-003 RevA 40
Moorebank Intermodal Company Moorebank Intermodal Terminal - Surface water assessment
Total suspended solids, hydrocarbons and total phosphorus annual loads from the developed site are allestimated to decrease when compared to the pre-developed site due to the use of stormwater treatmentmeasures (of which there are currently none). The one exception is an increase in the total nitrogen annualload. It should be noted that this is an estimate of annual loads over a typical year of rainfall in NSW. As theannual volume of stormwater will also increase, the pollutant concentrations will be significantly less thanpredevelopment concentrations due to dilution and therefore no increases in existing stormwater pollutantconcentrations in downstream waterways is expected from the developed site for these common stormwaterpollutants. It is noted that the Healthy Rivers Commission inquiry report (HRC, 2001) noted that numericWQOs for nutrients (including total nitrogen) should not, as a general rule, be used for regulatory purposes;and the naturally turbid Georges River would be able to sustain higher nutrient loads without thedevelopment of algal blooms (HRC, 2001).
Table 3.8 MUSIC modelling of stormwater pollutants
Stormwater variable Pre-developed Site Developed Site(pre-treatment)
Developed Site(post-treatment)
% Reduction frompre-developed site
runoff
Total Suspended Solids(kg/yr)
161,000 370,000 90,500 44%
Hydrocarbons (kg/yr) 315 484 270 14%
Total Phosphorus(kg/yr)
256 741 234 9%
Total Nitrogen (kg/yr) 2,000 3,770 2,330 -17%
The proposed measures are intended to be effective for reducing the key water pollutants identified for thesite. The ANZECC Guidelines and the Georges River Health Monitoring Program (GRCC 2011) will both beconsidered before finalisation of the proposed measures.
Preliminary calculations have been undertaken to estimate the area of water quality treatment required tomeet best management objectives. In NSW these objectives are generally accepted as 90% removal ofgross pollutants, 80% removal of Total Suspended Solids (TSS), 55% removal of Total Nitrogen (TN) and40% removal of Total Phosphorus (TP). The following Tables 3.9, 3.10 and 3.11 summarise the area oftreatment required for each layout.
Table 3.9 Northern rail connection option treatment area requirement estimation
Drainage sub-catchment areareference Catchment area (m2) Approx. treatment area
requirement (m2)
Catchment 1 24,000 60
Catchment 2 140,000 350
Catchment 3 230,000 575
Catchment 4 277,000 692.5
Catchment 5 257,000 642.5
Catchment 6 192,000 480
Total 1,120,000 2,800

Parsons Brinckerhoff | 2103829E-TPT-REP-003 RevA 41
Moorebank Intermodal Company Moorebank Intermodal Terminal - Surface water assessment
Table 3.10 Central rail connection option treatment area requirement estimation
Drainage sub-catchment areareference Catchment area (m2) Approx. treatment area
requirement (m2)
Catchment 1 24,000 60
Catchment 2 173,000 432.5
Catchment 3 560,000 1,400
Catchment 4 292,000 730
Catchment 5 234,000 585
Total 1,283,000 3,208
Table 3.11 Southern rail connection option treatment area requirement estimation
Drainage sub-catchment areareference Catchment area (m2) Approx. treatment area
requirement (m2)
Catchment 1 24,000 60
Catchment 2 190,000 475
Catchment 3 190,000 475
Catchment 4 440,000 1,100
Catchment 5 223,000 557.5
Catchment 6 288,000 720
Total 1,355,000 3,388
Stormwater treatment systems, designed in accordance with NSW best practice guidelines, would function toretain and reduce stormwater pollutants and improve the stormwater quality discharging from the MIMT.Substantial reductions in pollutant concentrations can be obtained through the use of stormwaterimprovement devices. The Project should include a treatment train approach of catchpits, raingardens,swales, bio-filtration and detention basins to treat stormwater before discharging to the Georges River andAnzac Creek (section 4.2).
Without stormwater treatment, the quality of the stormwater runoff from the developed site that is dischargedto the Georges River will be considerably worse than under existing conditions and could lead to furtherdegradation of the downstream water quality in the Georges River system. The implementation ofstormwater treatment at the developed MIMT would reduce the annual stormwater pollutant loads that arecurrently discharging from site. Further, stormwater treatment on the developed MIMT site would improvestormwater quality currently discharging from the site.
The improved quality of stormwater discharging from site supports the objectives of the environmental valuesfor waterways affected by urban development in the Georges River catchment in that the water quality ismaintained or improved throughout the catchment.
3.4.4 Cumulative impacts
As identified above, cumulative impacts will be a result of both developments of this project as well as theSIMTA site. In terms of cumulative water quality impacts, these are likely to be minor as they will beassociated with an increase in runoff volumes and therefore concentrations will be less. However, shouldrunoff from both sites not be managed effectively then there will be an impact to pollutant loads that needs tobe mitigated.

Parsons Brinckerhoff | 2103829E-TPT-REP-003 RevA 43
Moorebank Intermodal Company Moorebank Intermodal Terminal - Surface water assessment
4. Mitigation measuresThis chapter outlines mitigation measures to minimise and prevent impacts both within the project site andexternal to the project site. As previously indicated, there are three layout options currently proposed for thesite so the mitigation measures have been developed such that they could be applied to each proposedlayout. Further details of the stormwater management measures are given in Appendix B.
4.1 Early worksThe early works will mainly take place outside of the flood affected areas except for the development of theconservation area. The following measures would be implemented during the early works to minimiseimpacts to the Georges River, Anzac Creek, local and regional water quality and to minimise the impact of aflood event on the early works program. Measures include:
A soil and water management plan would be developed prior to starting works in the conversation area.This plan would include erosion and sediment control plans and procedures to manage and minimisepotential environmental impacts associated with developing this area.
Locate site compounds, stockpiling areas and storage areas for sensitive plant, equipment andhazardous materials above an appropriate design flood level, to be determined based on the duration ofthe construction works.
Implement a flood emergency response and evacuation plan for the conservation area works that allowsworks sites to be safely evacuated and secured in advance of flooding occurring at the site. This planshould also include recovery actions to be implemented following a flood and therefore allow the siteworks to resume as quickly as possible following a flood event.
4.2 Regional flooding mitigation measuresAs discussed in section 1, development of the project site has been planned around existing regionalflooding constraints, and the only element of the project that has a potential impact on regional flooding is theconstruction and operation of the rail bridge crossing of the Georges River which connects the site with theSSFL. Mitigation measures are therefore focussed on the rail access bridge.
4.2.1 Construction phase mitigation
The following measures would be implemented to avoid adverse flooding impacts in the Georges Riversystem during construction of the rail bridge crossing:
Locate site compounds, stockpiling areas and storage areas for sensitive plant, equipment andhazardous materials above an appropriate design flood level, to be determined based on the duration ofthe construction works.
Implement a flood emergency response and evacuation plan for the works that allows works sites to besafely evacuated and secured in advance of flooding occurring at the site.
For the building of the bridges implement a staged construction process that minimises temporaryobstruction of flow in the main channel and floodplain at all times.
For the building of the bridges design temporary works to resist forces and pressures that could occurduring the appropriate design flood event adopted for the construction project.

Parsons Brinckerhoff | 2103829E-TPT-REP-003 RevA 44
Moorebank Intermodal Company Moorebank Intermodal Terminal - Surface water assessment
For the site in general, provide temporary diversion channels around temporary works obstructions toallow low and normal flows to safely bypass the works areas.
4.2.2 Operational phase mitigation
During detailed design the following measures should be considered to ensure bridge crossing result inminimal impact to the existing flood risk in the Georges River channel and floodplain. The following furtherdesign considerations and investigations are recommended as part of the detailed design to ensure adverseimpacts continue to be avoided:
The design of the bridges should ensure structural stability under an appropriate upper limiting floodevent, typically the 1 in 2000 year AEP event or other event of similar magnitude.
A detailed scour assessment of the structures should be undertaken and a scour protection scheme forthe bridge abutments and piers should be designed to ensure structural stability and avoid erosion ofthe channel and floodplain bed local to the structures.
Further design optimisation of the bridges should consider reducing the afflux impacts as far aspossible. The bridge piers should be designed to minimise obstruction to flow and associated affluxunder potential blockage and/or debris build-up scenarios.
Further hydraulic modelling should be undertaken to quantify the impact of climate change on affluxcaused by the bridges and on hydraulic loading on the bridge structures.
For the central option, further design of the structure and alignment and/or consideration ofcompensatory measures will need to be undertaken to reduce the impact of this option.
4.3 On-site stormwater management
4.3.1 Construction phase mitigation
A key feature of the on-site stormwater management measures during construction will be installation of site-wide temporary erosion and sediment controls. The design and performance criteria for these measuresshould be detailed within an Erosion and Sediment Control Plan (ESCP) for the site. The ESCPs will bedesigned in accordance with best management practices and the relevant stormwater managementpublications including:
Managing Urban Stormwater: Soils and Construction (‘the Blue Book’), Volume 1 (Landcom 2004)
Managing Urban Stormwater: Soils and Construction - Installation of Services, Volume 2A (OEH 2008)
Managing Urban Stormwater: Soils and Construction - Main Road Construction, Volume 2D (OEH2008).
Biofiltration and detention basins which form part of the proposed stormwater management strategy shouldbe excavated at the outset of the early works with the intention of the excavated basins being used fortemporary construction phase sedimentation basins. Once the early works have been completed, thesetemporary construction phase sedimentation basins can be developed into the permanent biofiltration anddetention basins as site development requires them.
During Project Phase A, all major stormwater pipes and culverts (600 mm diameter and larger) and mainchannels and outlets should be installed. Minor drainage and upstream systems will then be progressivelyconnected to the major drainage elements during each phase of construction as required.

Parsons Brinckerhoff | 2103829E-TPT-REP-003 RevA 45
Moorebank Intermodal Company Moorebank Intermodal Terminal - Surface water assessment
The general principles of soils and water management are provided in the Blue Book (Landcom 2004) andwould be adopted during the construction phase of the Project. A soil and water management plan would bedeveloped prior to land disturbance that would include erosion and sediment control plans and procedures tomanage and minimise potential environmental impacts associated with construction of the Project.
The following management and mitigation measures would be implemented during construction to minimisesoil and water impacts:
An ESCP would be prepared in accordance with Volume 1 of Managing Urban Stormwater: Soils andConstruction (Landcom 2004). The ESCP would be established prior to the commencement ofconstruction of each stage of development and be updated as relevant to the changing constructionactivities.
Clean runoff from upstream undisturbed areas would be diverted around the site to minimise overlandflow through the disturbed areas.
Stabilised surfaces would be reinstated as quickly as practicable after construction.
All stockpiled materials would be stored in bunded areas and away from waterways to avoid sediment-laden runoff potentially entering the waterways.
Sediment would be prevented from moving off-site and sediment-laden water prevented from enteringany watercourse, drainage line or drainage inlet.
Erosion and sediment control measures would be regularly inspected (particularly following rainfallevents) to monitor their effectiveness and stability.
Erosion and sediment control measures would be left in place until the works are complete or areas arestabilised.
Temporary erosion control and energy dissipation measures would be installed to protect receivingenvironments from erosion.
Works would be managed during rainfall (or whilst the ground remains sodden) to minimise vehicledisturbance to the topsoil.
Procedures to maintain acceptable water quality and for the management of chemicals and hazardousmaterials (including spill management procedures, use of spill kits and procedures for refuelling andmaintaining construction vehicles/equipment) would be implemented during construction.
Vehicles and machinery would be properly maintained to minimise the risk of fuel/oil leaks.
Routine inspections of all construction vehicles and equipment would be undertaken for evidence offuel/oil leaks.
All fuels, chemicals and hazardous liquids would be stored within an impervious bunded area inaccordance with Australian standards and Environmental Protection Authority Guidelines.
Emergency spill kits would be kept on-site at all times. All staff would be made aware of the location ofthe spill kits and be trained in their use.
Construction plant, vehicles and equipment would be refuelled off-site, or in designated re-fuelling areaslocated at a minimum distance of 50 metres from drainage lines or waterways.
If landfill cells at the Glenfield Landfill are to be affected then prepare site specific erosion and sedimentcontrol measures to ensure pollutants do not enter the Georges River.
Parsons Brinckerhoff | 2103829E-TPT-REP-003 RevA 46
Moorebank Intermodal Company Moorebank Intermodal Terminal - Surface water assessment
4.3.2 Operational phase mitigation
A key design criterion adopted in the stormwater strategy is that the rate of stormwater runoff from thedeveloped site should not exceed the pre-developed (existing) site rate of stormwater runoff, as required byLCC. The stormwater strategy has been (refer to Appendix B) developed to consider all LCC designspecifications and relevant RailCorp and ARTC design requirements associated with the project. Whereidentifiable, upstream inflows have been considered as part of the design in order to address potentialcumulative impacts of nearby development. Therefore, there are no adverse impacts on peak flow rates andflow volumes for runoff from the developed site. Key features of the system that allow this to be achieved andwhich would be included within the detailed design are as follows:
The stormwater system should be designed such that flow from low order events (up to and includingthe 10% AEP event from the main part of the site and up to and including the 2% AEP event for the railcorridor) would be conveyed within the formal drainage systems and flows from rarer events (up to the1% AEP event) would be conveyed in controlled overland flow paths.
An on-site detention system is proposed that would detain flow and control discharge rates to GeorgesRiver at pre-development rates.
The system should also incorporate extensive measures to control the water quality of runoff from the siteprior to discharge to the Georges River. These include:
A stormwater treatment system incorporating sedimentation and bio-filtration basins upstream of thestormwater detention basins.
The use of on-site infiltration has been incorporated into the design through the distribution of swaledrains and rain gardens across the site.
There are opportunities for further mitigation measures to be incorporated into the stormwater managementsystem. The Liverpool Development Control Plan, Part 2.4, Development in Moorebank Defence Lands(Liverpool City Council, 2008) provides the following suggestions, which would be considered during detaileddesign:
Polish water from on-site runoff by directing runoff into on-site dry creek gravel beds with macrophyteplants.
Use drainage swales adjacent to entry roads instead of kerbs to slow down stormwater runoff andincrease on-site infiltration.
Collection of roof rainwater for re-use on site.
Other opportunities for the site include the installation of gross pollutant traps (GPTs) at the outlets of thepipe system before discharge into the sedimentation basins.
Given the intended purpose of the site, the extent of impervious surfaces, such as roads, pavement androofing, would increase substantially. Impervious surfaces and vegetated areas should be encouraged andincorporated into the design at any opportunity. This will increase sub-surface water flow during rain eventsand reduce the discharge of stormwater pollutants. Also, disturbance at the outlets from the on-site detentionbasins should be minimised by considering measures proposed in the Georges River Strategic BankStabilisation Plan (LCC 2012).
As the project will contain a number of different land uses, specific stormwater treatment systems may berequired as pre-treatment to protect the integrity of the downstream sedimentation and biofiltration basins.The best practice pre-treatment systems will need to address potential contaminants associated with eachland use at the detailed design stage. In addition to this, rain gardens and swales should be incorporatedwhere area permits. In particular, specific treatment measures may be required on the Glenfield Landfill siteif landfill cells are to be impacted.

Parsons Brinckerhoff | 2103829E-TPT-REP-003 RevA 47
Moorebank Intermodal Company Moorebank Intermodal Terminal - Surface water assessment
Additional runoff from the future development of the Sydney Intermodal Terminal Alliance (SIMTA) site(currently occupied by the existing DNSDC) should also be taken into consideration at the detailed designstage. The three 2700 mm x 1500 mm culverts that allow runoff from the existing DNSDC area to passthrough the Project Site should be reassessed should any SIMTA development increase impervious areas.The impacts of the SIMTA have not been assessed at this stage as detailed design details of the SIMTAdevelopment are not currently available. In addition, ensuring runoff rates do not exceed existing conditionswill ensure there are no changes to flood flows within the Anzac Creek catchment. The 1% AEP flood isconfined to the channel for the upper reaches of the Anzac Creek catchment and subsequently the AnzacCreek Floodplain Management Study did not identify any risk management measures (BMTWBM 2005).

Parsons Brinckerhoff | 2103829E-TPT-REP-003 RevA 49
Moorebank Intermodal Company Moorebank Intermodal Terminal - Surface water assessment
5. ConclusionsThe proposed Moorebank Intermodal Terminal project is located on the eastern bank of the Georges River insouth west Sydney, a major watercourse for both environmental and social aspect that governs flooding on aregional scale within south west Sydney. It has therefore been important to assess the impact of the projectof both the regional and local surface water environments. This report specifically addresses the NSW EARsand the Commonwealth EIS requirements. The report covers surface water related aspects such as floodingand site stormwater quantity and quality.
Following a review of all the requirements there were several key areas that were critical for the surfacewater assessment, these included:
change in hydrologic regime, in particular, change in flooding, stormwater runoff quantity
impact of project on water quality, including sediment and erosion, stormwater quality, stormwaterpollution (accidental spills etc.).
Design assumptions relating to the rail bridge crossings of the Georges River (for all three layouts) and astormwater strategy have been developed to address the requirements of LCC and particular requirementsrelating to discharge of stormwater to the Georges River and surface water management relating to theproposed rail corridor.
The assessment has identified that the impacts from the project on regional flooding are relatively minor forthe southern and northern option and do not significantly affect the existing flood risk associated with theGeorges River and its floodplain. The rail bridge crossings do cause minor afflux upstream however, it isrecommended that these impacts be further minimised through design refinement of the bridge and bridgerelated infrastructure at a later stages of design. For the central rail crossing, further assessment is requiredand mitigation measures required to reduce the afflux resulting from this option.
The proposed stormwater drainage system has incorporated an on-site detention system to maintain existingpeak flow rates so there would be no net increase in stormwater runoff from the Project Site. Furtherdevelopment of the stormwater management system during detailed design should consider water re-useopportunities.
Stormwater runoff quality from the site is a critical issue due the current ‘stressed’ condition of the mid andlower Georges River catchment. Best practice stormwater treatment features including sedimentation andbio-retention basins have been incorporated into the stormwater management strategy to ensure adverseimpacts on water quality in the Georges River are avoided. Further opportunities would also be investigatedduring detailed design and will need to consider potential contaminants from disturbing landfill cells on theGlenfield Landfill site.
During construction, stormwater management, both quantity and quality, will be the key issues requiringmanagement. Appropriate application of the best construction practices through development andimplementation of an ESCP would minimise pollution incidents from the site. Also locating stockpiles, storageareas and sensitive plant and equipment out of high and medium flood risk zones would minimise the risk offlood damage during construction.
Further refinement of the design and development of maintenance plans for the site would ensure surfacewater related impacts are minimised and managed appropriately.


Parsons Brinckerhoff | 2103829E-TPT-REP-003 RevA 51
Moorebank Intermodal Company Moorebank Intermodal Terminal - Surface water assessment
6. ReferencesAustralia New Zealand Environment Conservation Council, National Water Quality Management StrategyAustralian and New Zealand Guidelines for Fresh and Marine Water Quality, 2000.
Bewsher Consulting, Georges River Floodplain Risk Management Study, May 2004.
BMT WBM, Anzac Creek Floodplain Risk Management Study and Plan, May 2008.
Department of Environment and Conservation (DEC) 2006, Using the ANZECC guidelines and water qualityobjectives in NSW.
Department of Environment and Climate Change (DECC) 2007, Floodplain Risk Management Guideline:Practical Consideration of Climate Change.
Environmental Protection Agency (EPA), Results of the Nationwide Urban Runoff Program, Volume 1 – FinalReport, December 1983.
Georges River Combined Councils Committee (GRCCC), Community River Health Monitoring ProgramReport Card Autumn 2011, http://www.georgesriver.org.au/.
Healthy Rivers Commission (HRC) Independent Inquiry into the Georges River – Botany Bay System – FinalReport 2001.
Hyder Consulting, Stormwater and Flooding Environmental Assessment SIMTA, 2011.
KPMG, Parsons Brinckerhoff and Deloitte, Moorebank Intermodal Terminal Project Summary: DetailedBusiness Case (April 2012).
Landcom 2004, Managing Urban Stormwater – Soils and Construction Volume 1.
Liverpool City Council development control plan no. 49 for Amiens, Yulong and DNSDC sites Moorebankinternational technology park Moorebank Avenue, Moorebank, 2008,http://www.liverpool.nsw.gov.au/developmentcontrolplans.htm.
Liverpool City Council, NSW Development Design Specification D5: Stormwater Drainage Design. January2003, http://www.liverpool.nsw.gov.au/constructionanddesignspecifications.htm.
Liverpool City Council, NSW Development Design Specification D7: Erosion Control and StormwaterManagement. October 2003, http://www.liverpool.nsw.gov.au/constructionanddesignspecifications.htm.
Liverpool City Council On-Site Stormwater Detention Technical Specification, January 2003,http://www.liverpool.nsw.gov.au/constructionanddesignspecifications.htm.
NSW Office of Water, NSW Water Quality and River Flow Objectives, Catchment at a glance, 2013(http://www.environment.nsw.gov.au/ieo/GeorgesRiver/caag.htm).
Pilgrim, DH, (ed)., Australian Rainfall and Runoff - A Guide to Flood Estimation, Institution of Engineers,Australia, Barton, ACT, 1987.
Rafter, T and D Abbs, 2009, Calculation of Australian extreme rainfall within GCM simulations using ExtremeValue Analysis.

Parsons Brinckerhoff | 2103829E-TPT-REP-003 RevA 52
Moorebank Intermodal Company Moorebank Intermodal Terminal - Surface water assessment
RailCorp TMC 421, Track Drainage, Version 1.2, December 2009.http://engineering.railcorp.nsw.gov.au/Disciplines/Civil/TMC_421_V1_2.pdf.
Regional Environmental Planning Policy (REP) No.2 – Georges River catchment,http://www.planning.nsw.gov.au/list-of-regional-plans.
Upper Georges River Flood Study, Department of Land and Water Conservation in conjunction withLiverpool City Council, December 2000.
Appendix ADesign Flood Impact Assessment

Moorebank Intermodal Company
Moorebank Intermodal Transport Project
Flood Impact Assessment25 June 2014
Parsons Brinckerhoff | 2103829E-TPT-REP-002 RevA i
Moorebank Intermodal Company Moorebank Intermodal Transport Project - Flood Impact Assessment
ContentsPage number
1. Introduction 1
2. Background 3
2.1 Flood history 3
2.2 Existing hydraulic models 3
2.3 Rail bridge design 5
3. Flood risk zones 11
3.1 Development constraints 13
4. Assessment of flood impacts 15
4.1 Overview 15
4.2 Assessment methodology 15
5. Results 19
5.1 Existing flood levels 19
5.2 Impact assessment 22
5.3 Sensitivity testing 25
6. Conclusions 27
7. References 29
ii 2103829E-TPT-REP-002 RevA | Parsons Brinckerhoff
Moorebank Intermodal Company Moorebank Intermodal Transport Project - Flood Impact Assessment
List of tablesPage number
Table 3.1 Project site flood risk category breakdown 11Table 3.2 Key flood risk zone development constraints (Liverpool DCP (2008)) 13Table 5.1 Comparison between Mike11 and HECRAS baseline 1% AEP river levels 19Table 5.2 Comparison between baseline HEC RAS model and HEC RAS model with addition
of existing rail bridge for 1% AEP river levels 20Table 5.3 Existing flood levels 21Table 5.4 Southern option flood levels and afflux 22Table 5.5 Northern option (Method 1) flood levels and afflux 23Table 5.6 Northern option (Method 2) flood levels and afflux 23Table 5.7 Central option flood levels and afflux 24Table 5.8 Sensitivity of afflux results to reduced tailwater level 25
List of figuresPage number
Figure 2.1 Georges River Mike11 flood model cross sections in the vicinity of the proposedMoorebank IMT site (extracted from Figure 2.2, Georges River Model Study,Liverpool City Council, 1999) 4
Figure 2.2 Southern Rail Connection Concept Layout 7Figure 2.3 Northern Rail Connection Concept Layout 8Figure 2.4 Central Rail Connection Concept Layout 9Figure 3.1 Existing flood risk probability map 12
List of appendicesAppendix A East Hills Rail Bridge work as executed drawingsAppendix B HECRAS results

Parsons Brinckerhoff | 2103829E-TPT-REP-002 RevA 1
Moorebank Intermodal Company Moorebank Intermodal Transport Project - Flood Impact Assessment
1. IntroductionMoorebank, located in South-West Sydney, is being considered as a future site for an intermodal terminal(IMT) planned to handle container traffic from Port Botany and interstate rail freight. The Moorebank IMT (orthe ‘Project’) will provide an integrated transport solution for the movement of freight to, from and within theSydney basin.
The primary function of the Moorebank IMT is to be a transfer point in the logistics chain for shippingcontainers and to handle both international import/export cargo (IMEX) and domestic interstate and intrastate(regional) cargo.
The Project requires the development of a rail crossing of the Georges River connecting the main IMT site tothe Southern Sydney Freight Line (SSFL). Three options have been proposed for this crossing; a northernoption; a central option; and a southern option.
The development of a new bridge crossing can potentially have adverse impacts on flooding in the vicinity ofthe new structure. A hydraulic investigation has been undertaken to assess the afflux generated by each ofthe three potential locations of the proposed rail crossing and its associated piers within the Georges Riverand its floodplain adjacent to the Project site. The investigation is based upon Mike11 hydraulic model datareceived from Liverpool City Council and assumed bridge geometry aimed at minimising potential floodimpacts. Analysis has been performed for the 1% Annual Exceedence Probability (AEP) storm event and an‘extreme flood’ event.

Parsons Brinckerhoff | 2103829E-TPT-REP-002 RevA 3
Moorebank Intermodal Company Moorebank Intermodal Transport Project - Flood Impact Assessment
2. Background2.1 Flood historyThe Georges River has a history of flooding. Historical records date back as far as the 1860's, with mostrecords relating to levels recorded at the Liverpool Weir, located approximately 2 km downstream of thenorthern boundary of the Project site. The most recent major flood occurred in 1988 and was estimated tohave a 5% AEP. The 1988 flood resulted in over 1,000 properties being inundated along the Georges Riverand an estimated $18M in damages.
The Georges River catchment is one of Australia’s most populated catchments. The history of flooding fromthe Georges River and the high level of development within the river floodplain has resulted in the floodbehaviour being extensively studied. Flood studies have included construction of a scale physical model ofthe river as well as mathematical and hydraulic modelling. Several hydraulic models of the Upper and LowerGeorges River system were combined to form one overall Georges River flood model. This model has beenused for this project and is further discussed in section 2.2.
2.2 Existing hydraulic modelsThe Georges River Model Study (Liverpool City Council, 1999) developed a MIKE11 hydraulic model of theGeorges River, extending 46 km from the Georges River confluence with Bunbury Curran Creek(approximately 2 km upstream of the southern boundary of the Project site) to Botany Bay.
This model is essentially an amalgamation of two earlier MIKE11 flood models developed for the UpperGeorges River Flood Study, (DLWC, 1998) and the Georges River Mathematical Modelling Study (PWD,1992). The section of the model running past the Project site was originally from the Upper Georges RiverFlood Study, (DLWC, 1998). The MIKE 11 model was calibrated to reproduce the results of physicalmodelling carried out for the Georges River Flood Study (PWD, 1991).
For the assessment of flood behaviour in the vicinity of the Project site the MIKE11 flood model was obtainedfrom Liverpool City Council and re-run to understand the existing flood behaviour at the Project site. Theflood model extends from 2 km upstream of the southern boundary of the site to Botany Bay approximately42 km downstream of the northern boundary of the Project site. Model cross sections are generally at aninterval of 180–230 m in the vicinity of the Project site. There are 19 cross sections (Ch. 101650–104535 m)which border the project site as shown in Figure 2.1.

4 2103829E-TPT-REP-002 RevA | Parsons Brinckerhoff
Moorebank Intermodal Company Moorebank Intermodal Transport Project - Flood Impact Assessment
Figure 2.1 Georges River Mike11 flood model cross sections in the vicinity of the proposedMoorebank IMT site (extracted from Figure 2.2, Georges River Model Study, Liverpool CityCouncil, 1999)
The model includes critical flood events for the 5%, 2% and 1% AEP storm events1 in addition to thepredicted ‘Extreme Flood Event’. Inflows used for the modelling were based on a WBNM rainfall runoff modelof the catchments upstream of Liverpool Weir for the 5%, 2% and 1% AEP events developed during theGeorges River Flood Study (PWD, 1991). The hydrographs were calibrated with hydrographs recorded atLiverpool Weir. The critical duration for the 5%, 2% and 1% AEP flood events was found to be 36 hours. TheWBNM model (PWD, 1991) also produced Extreme Flood Event (EFE) hydrographs. The flood study statedthat ‘the extreme flood event terminology was used rather than Probable Maximum Flood because theProbable Maximum Precipitation estimates provided at the time by the Bureau of Meteorology were interimvalues’ (PWD, 1991). The Georges River Flood Study (PWD, 1991) determined that the 12 hour event wascritical for the EFE at and above Liverpool and the 36 hour storm was critical further downstream. Hence, forthe Moorebank IMT site the 12 hour storm produces the highest flood levels for the EFE and is the criticalstorm.
The 1% AEP peak flow adopted from this study was 1,877 m3/s and the EFE peak flow 4,807 m3/s.
1 At the time that the Georges River Model Study was completed it was industry practice to use the terminologyAverage Recurrence Interval (ARI) instead of Annual Exceedance Probability (AEP) which is now the industrypreferred terminology for events rarer than the 10% AEP. AEP is defined as ‘The probability that an event will beexceeded in any one year.’ It is noted that the 5%, 2% and 1% AEP events are approximately equivalent to the20 year, 50 year, and 100 year ARI events respectively.
Project site boundary
Parsons Brinckerhoff | 2103829E-TPT-REP-002 RevA 5
Moorebank Intermodal Company Moorebank Intermodal Transport Project - Flood Impact Assessment
2.3 Rail bridge designThe Project requires the development of a rail crossing of the Georges River connecting to the SouthernSydney Freight Line (SSFL). Three options have been proposed for the location of this crossing; a northernoption; a central option; and a southern option (refer section 2.3.1, section 2.3.2, and section 2.3.3 for furtherdetails). The development of this bridge crossing has the potential to have adverse impacts on flooding in thevicinity of the new structure. Hydraulic investigations have been undertaken to assess the afflux generatedby each of the proposed rail crossing options and their associated piers within the Georges River and itsfloodplain adjacent to the Project site.
The following sections describe the ‘concept’ bridge designs as assessed for this flood impact assessment.Further modelling of flood impacts will be required to be undertaken during detailed design of the bridge toensure flood impacts are minimised.
2.3.1 Southern option
The ‘Southern Option’ proposes constructing a rail bridge adjacent to the existing East Hills Rail Bridge,crossing the Georges River at the Southern end of the Project site (refer to Figure 2.2). The bridge designshows two separate single track rails that cross the western floodplain of the Georges River through theGlenfield Landfill site before converging into a single double track bridge to cross the Georges Riverimmediately downstream from the existing rail bridge.
To minimise potential flood impacts the bridge has been designed to hydraulically replicate the existing railbridge (refer Appendix A for existing bridge ‘Work as Executed Drawings’). Key design principles include:
the proposed bridge deck and noise barriers are to be set at the same level as the existing rail bridge.The soffit of these bridge decks is noted to be approximately 1.3 m above the 1% AEP flood level
piers and abutments are to be the same size, shape and hydraulically aligned with the existing railbridge to minimise afflux and scour of the bed and banks of the waterway. It is noted that the existingbridge has 1.8 m diameter piers located at 30.7 m intervals.
2.3.2 Northern option
The ‘Northern Option’ proposes constructing a rail bridge to the northern area of the Project Site (refer toFigure 2.3). The bridge design shows two separate single track rail bridges that converge into a singledouble track bridge on the eastern bank of the Georges River. The bridges would require numerous pierslocated both within the Georges River and within the Georges River floodplain. The bridge does not orientateperpendicular to the river and instead forms two arcs across the floodplain.
To minimise potential flood impacts the bridge design incorporates the following key principles:
the proposed soffit of the bridge deck is to be set at a minimum of 500 mm above the predicted 1% AEPflood level
bridge abutments should not encroach on the waterway areas of the Georges River
piers should be designed to be streamlined in shape to minimise afflux and scour of the bed and banksof the waterway. For the purposes of this assessment the piers have been assumed to be 1.8 m indiameter (as per the existing East Hills Rail Bridge) and located at 20 m intervals.

6 2103829E-TPT-REP-002 RevA | Parsons Brinckerhoff
Moorebank Intermodal Company Moorebank Intermodal Transport Project - Flood Impact Assessment
2.3.3 Central option
The ‘Central Option’ proposes constructing a rail bridge in the central area of the Project site (refer toFigure 2.4). The bridge design proposes two separate single track rail bridges that converge into a singledouble track bridge on the eastern bank of the Georges River. The bridges have many piers located bothwithin the Georges River and within the Georges River floodplain. The bridge does not orientateperpendicular to the river and instead forms two arcs across the floodplain.
To minimise potential flood impacts the bridge design incorporates the following key principles:
the proposed soffit of the bridge deck is to be set at a minimum of 500 mm above the predicted 1% AEPflood level
bridge abutments should not encroach on the waterway areas of the Georges River
piers should be designed to be streamlined in shape to minimise afflux and scour of the bed and banksof the waterway. For the purposes of this assessment the piers have been assumed to be 1.8 m indiameter (as per the existing East Hills Rail Bridge) and located at 20 m intervals.

Parsons Brinckerhoff | 2103829E-TPT-REP-002 RevA 7
Moorebank Intermodal Company Moorebank Intermodal Transport Project - Flood Impact Assessment
Figure 2.2 Southern Rail Connection Concept Layout
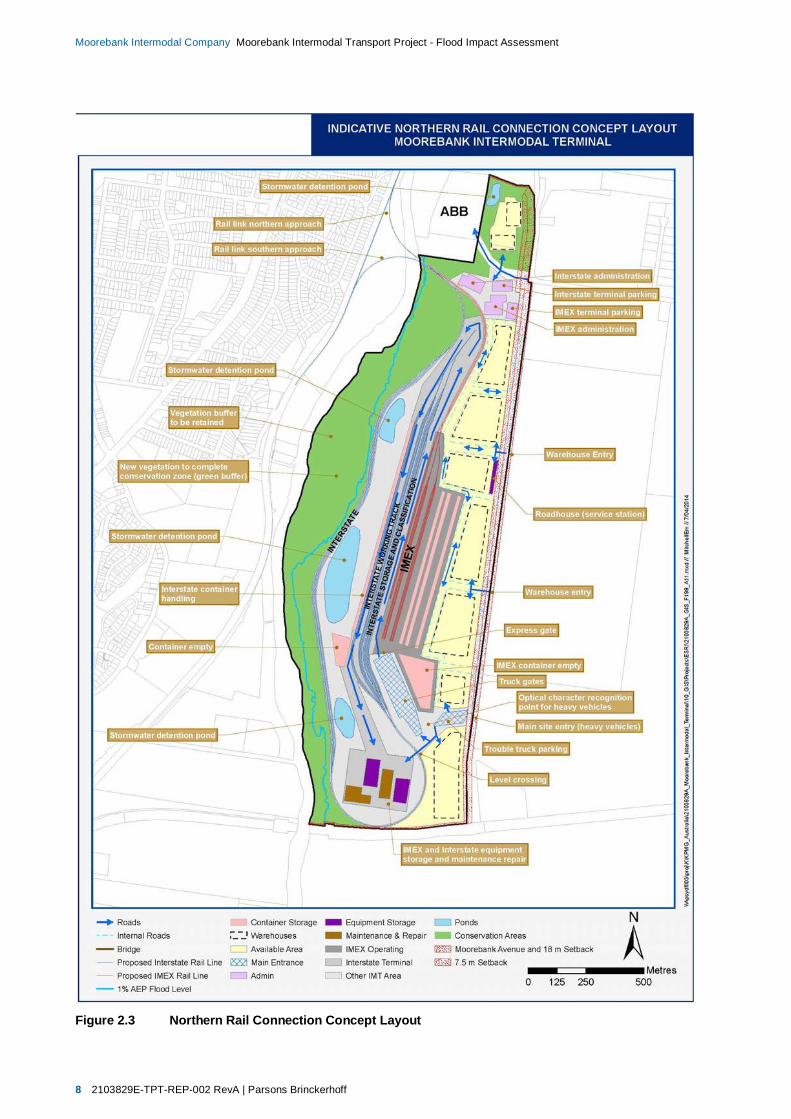
8 2103829E-TPT-REP-002 RevA | Parsons Brinckerhoff
Moorebank Intermodal Company Moorebank Intermodal Transport Project - Flood Impact Assessment
Figure 2.3 Northern Rail Connection Concept Layout
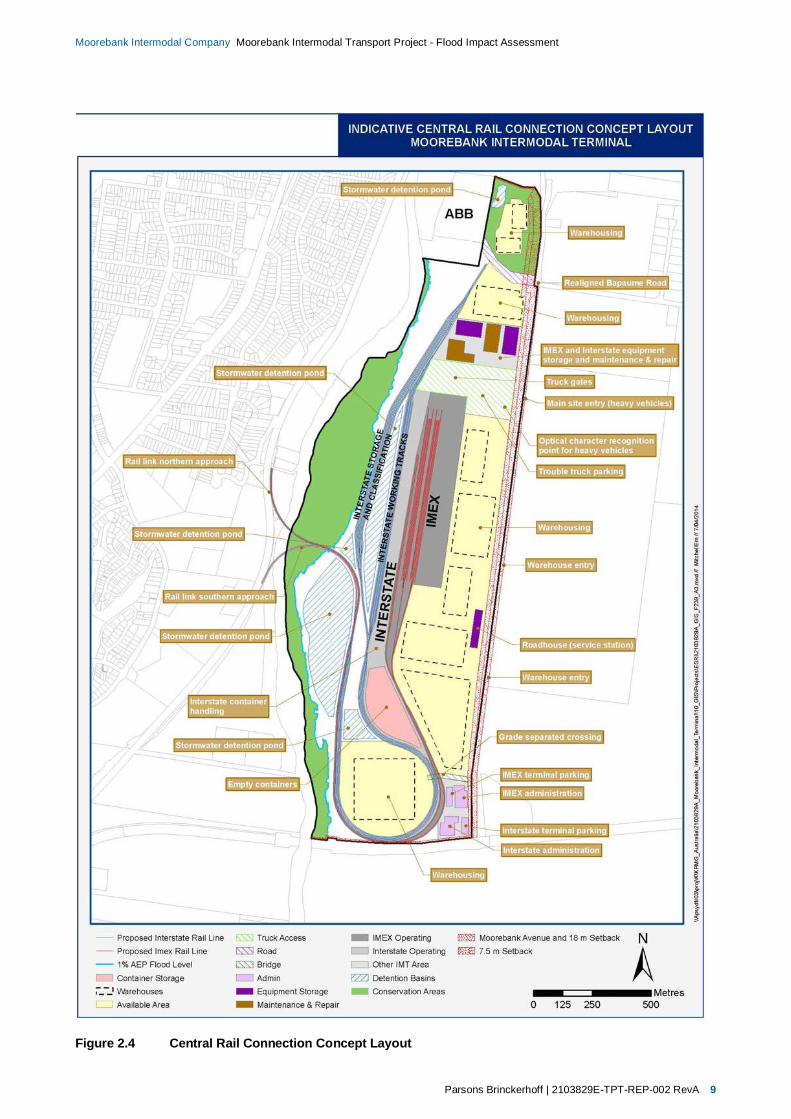
Parsons Brinckerhoff | 2103829E-TPT-REP-002 RevA 9
Moorebank Intermodal Company Moorebank Intermodal Transport Project - Flood Impact Assessment
Figure 2.4 Central Rail Connection Concept Layout

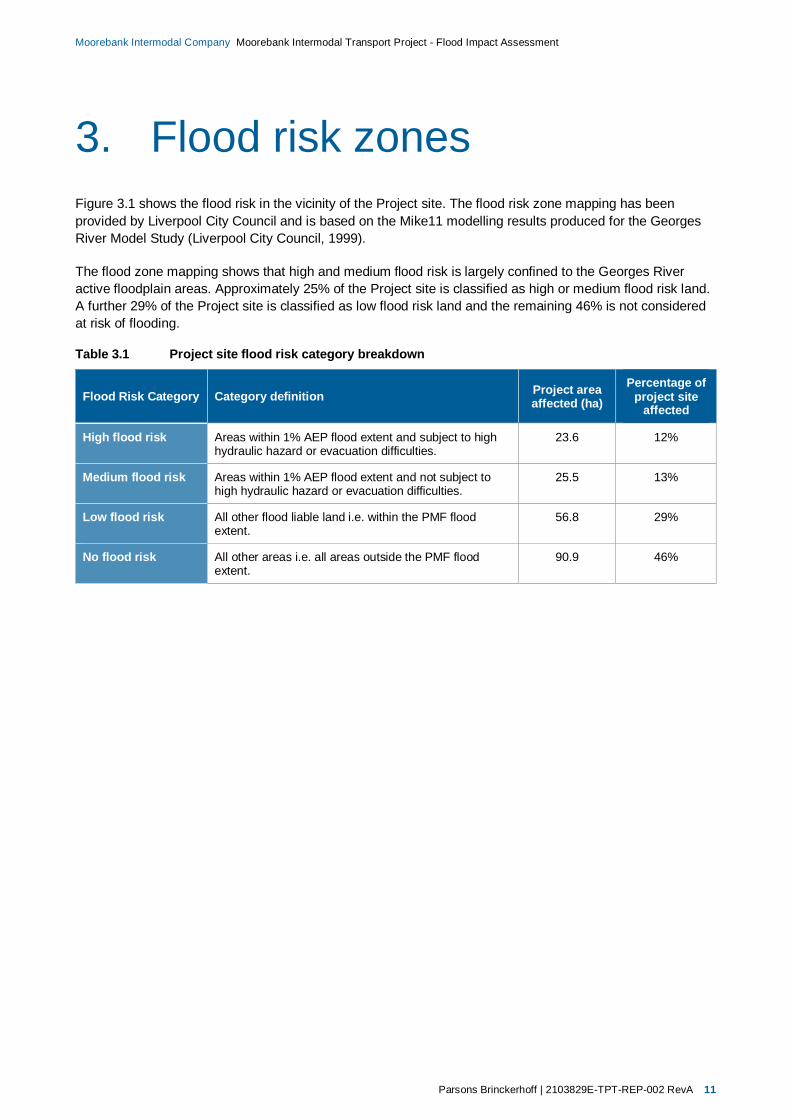
Parsons Brinckerhoff | 2103829E-TPT-REP-002 RevA 11
Moorebank Intermodal Company Moorebank Intermodal Transport Project - Flood Impact Assessment
3. Flood risk zonesFigure 3.1 shows the flood risk in the vicinity of the Project site. The flood risk zone mapping has beenprovided by Liverpool City Council and is based on the Mike11 modelling results produced for the GeorgesRiver Model Study (Liverpool City Council, 1999).
The flood zone mapping shows that high and medium flood risk is largely confined to the Georges Riveractive floodplain areas. Approximately 25% of the Project site is classified as high or medium flood risk land.A further 29% of the Project site is classified as low flood risk land and the remaining 46% is not consideredat risk of flooding.
Table 3.1 Project site flood risk category breakdown
Flood Risk Category Category definition Project areaaffected (ha)
Percentage ofproject site
affected
High flood risk Areas within 1% AEP flood extent and subject to highhydraulic hazard or evacuation difficulties.
23.6 12%
Medium flood risk Areas within 1% AEP flood extent and not subject tohigh hydraulic hazard or evacuation difficulties.
25.5 13%
Low flood risk All other flood liable land i.e. within the PMF floodextent.
56.8 29%
No flood risk All other areas i.e. all areas outside the PMF floodextent.
90.9 46%
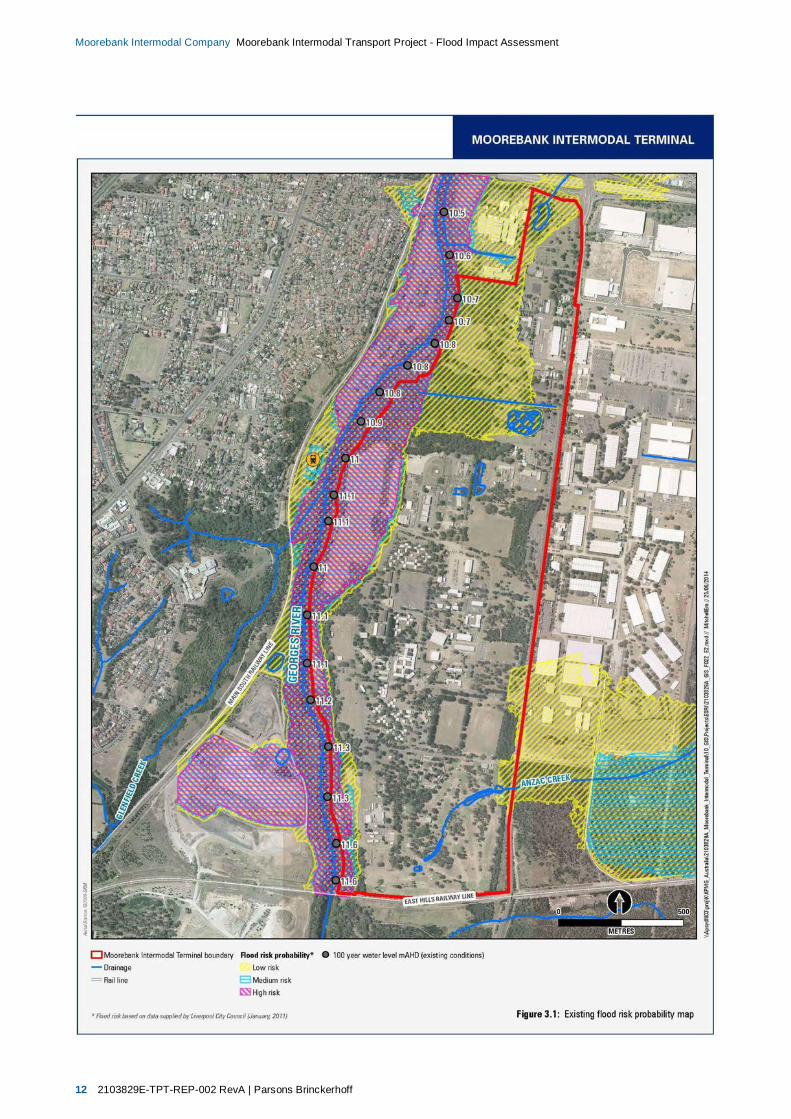
12 2103829E-TPT-REP-002 RevA | Parsons Brinckerhoff
Moorebank Intermodal Company Moorebank Intermodal Transport Project - Flood Impact Assessment
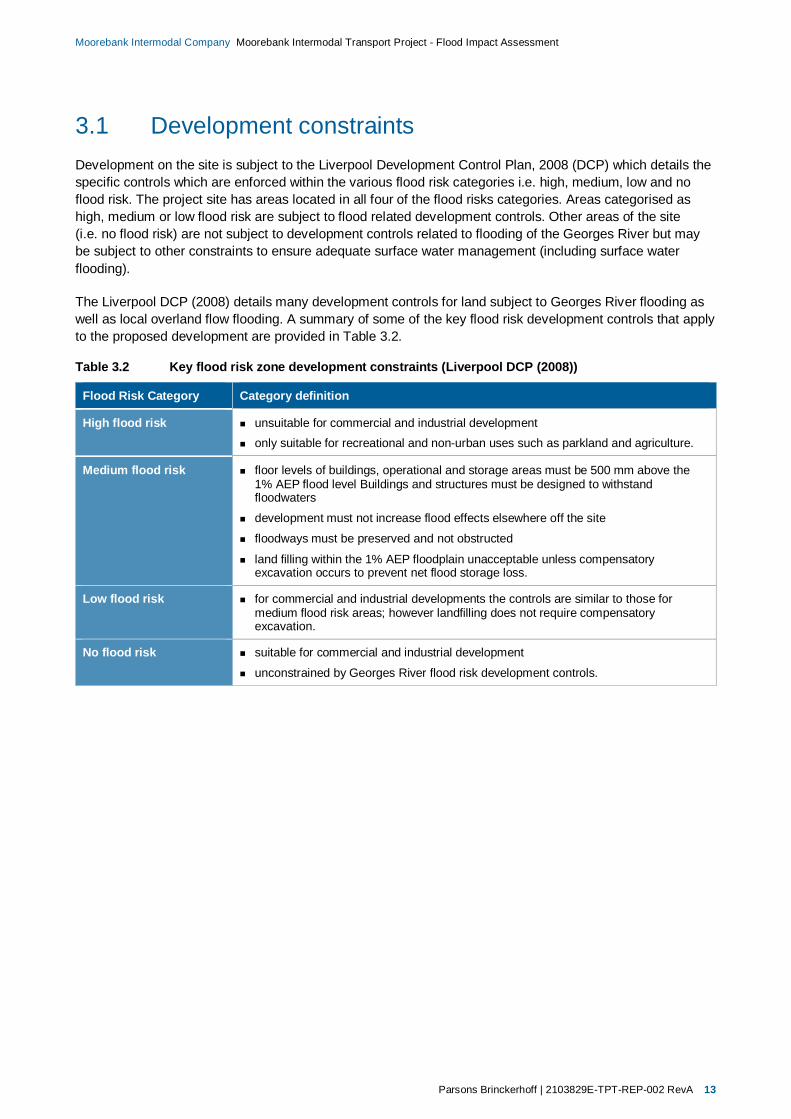
Parsons Brinckerhoff | 2103829E-TPT-REP-002 RevA 13
Moorebank Intermodal Company Moorebank Intermodal Transport Project - Flood Impact Assessment
3.1 Development constraintsDevelopment on the site is subject to the Liverpool Development Control Plan, 2008 (DCP) which details thespecific controls which are enforced within the various flood risk categories i.e. high, medium, low and noflood risk. The project site has areas located in all four of the flood risks categories. Areas categorised ashigh, medium or low flood risk are subject to flood related development controls. Other areas of the site(i.e. no flood risk) are not subject to development controls related to flooding of the Georges River but maybe subject to other constraints to ensure adequate surface water management (including surface waterflooding).
The Liverpool DCP (2008) details many development controls for land subject to Georges River flooding aswell as local overland flow flooding. A summary of some of the key flood risk development controls that applyto the proposed development are provided in Table 3.2.
Table 3.2 Key flood risk zone development constraints (Liverpool DCP (2008))
Flood Risk Category Category definition
High flood risk unsuitable for commercial and industrial developmentonly suitable for recreational and non-urban uses such as parkland and agriculture.
Medium flood risk floor levels of buildings, operational and storage areas must be 500 mm above the1% AEP flood level Buildings and structures must be designed to withstandfloodwaters
development must not increase flood effects elsewhere off the site
floodways must be preserved and not obstructed
land filling within the 1% AEP floodplain unacceptable unless compensatoryexcavation occurs to prevent net flood storage loss.
Low flood risk for commercial and industrial developments the controls are similar to those formedium flood risk areas; however landfilling does not require compensatoryexcavation.
No flood risk suitable for commercial and industrial development
unconstrained by Georges River flood risk development controls.


Parsons Brinckerhoff | 2103829E-TPT-REP-002 RevA 15
Moorebank Intermodal Company Moorebank Intermodal Transport Project - Flood Impact Assessment
4. Assessment of flood impacts4.1 OverviewDevelopment of the Project site has been planned around existing flooding constraints. As suchinfrastructure and changes to ground levels is only proposed within low flood risk or no flood risk zones. Theexception to this is the rail bridge crossing of the Georges River which connects the site with the SouthernSydney Freight Line (SSFL). Three options have been proposed for this crossing; a northern option; a centraloption; and a southern option. Further details of these proposed crossings was provided in section 2.3.
The development of the bridge crossings can potentially have adverse impacts on flooding in the vicinity ofthe new structure. A hydraulic investigation has been undertaken to assess the afflux generated by each ofthe proposed rail crossings and its associated piers within the Georges River and its floodplain adjacent tothe Project site.
4.2 Assessment methodology
4.2.1 MIKE11 model
The MIKE11 model provided by Liverpool City Council was rerun to ensure results correlated with theexisting results files provided. The model was successfully verified.
Modifications to the network component of the MIKE11 model were attempted. Despite numerous attempts,run simulations of this model could not be successfully generated due to the incomplete set of MIKE11 filesreceived from Liverpool City Council.
The large size and complexity of the model and incomplete set of model files received made achievingstability in the model at the beginning of simulations difficult.
4.2.2 HEC RAS model development
As documented above, the MIKE11 model was not able to be manipulated to assess the impacts of theproposed Georges River railway crossings. The intent of the assessment was to assess the impact so adecision was thereby made to replicate the model using an alternative one-dimensional hydrologicalmodelling software, HECRAS. The model was truncated to represent a shorter reach of the Georges River inthe vicinity of the Project site, therefore providing a more practical tool for assessing impacts associated withthe proposed rail crossing.
4.2.2.1 Cross sections
Forty one cross-sections from the Liverpool City Council Mike11 model were copied into HECRAS for theUpper Georges River reach from cross section 100000 to 106540 (just downstream of the Liverpool Weir).These cross-sections were renamed to conform to HEC RAS naming conventions and were renameddescending from 41 to 1 (see Appendix B for each corresponding cross section name).

16 2103829E-TPT-REP-002 RevA | Parsons Brinckerhoff
Moorebank Intermodal Company Moorebank Intermodal Transport Project - Flood Impact Assessment
4.2.2.2 Manning’s roughness
Manning’s ‘n’ roughness coefficients were translated from the MIKE11 model to the HEC RAS model.MIKE11 uses a global coefficient (unless specified otherwise) and applies ratios to each cross-section.These ratios were converted into manning’s ‘n’ values for entry into the HEC RAS cross-sections.
4.2.2.3 Structures and floodplain storages
The existing East Hills railway bridge was excluded from the Liverpool City Council MIKE11 model. Whilstthe reason for this is not known, this bridge is very high and it is assumed that it would have minimal impacton flood levels for regular flood events. For this assessment this structure was added to the HEC RASmodel based on ‘Work As Executed’ drawings of the structure (refer to Appendix A) to assess the impacts forthe 1% AEP flood event.
The road crossing at MIKE11 model cross-section 101057 (Cambridge Avenue) was entered into theHECRAS model as a twin culvert. This has been represented in a HEC RAS in a similar manner to how it isrepresented in the MIKE11 model.
The ‘east basin’ and ‘west basin’ in the MIKE11 model representing the Georges River floodplain storageareas were represented in the HECRAS cross section geometry rather than as storages.
4.2.2.4 Boundary conditions
The HEC RAS model was run as a steady state model. The peak flow rates from the 1% AEP hydrographand the EFE hydrograph used in the MIKE11 model were applied to the HECRAS model. This peak flow ratefor the 1% AEP event is 1,877 m3/s and for the EFE is 4,807 m3/s.
The peak water level at Liverpool Weir (MIKE11 cross-section 106535) represents a reasonable estimate ofthe downstream water levels on the truncated HEC RAS river reach and has been used as a downstreamboundary. The peak water levels (9.2 mAHD for the 1% AEP event and 11.8 mAHD for the EFE) wereapplied at the downstream boundary of the truncated HECRAS model.
4.2.3 HEC RAS modelling scenarios and calibration
4.2.3.1 Model calibration
The HEC RAS model was run (steady state) using the above parameters to attempt to match the MIKE11model results. The HEC RAS model generally predicted water levels approximately 500 mm higher than theMIKE11 model for the 1% AEP event. This can likely be attributed to the HEC RAS model being run insteady state and therefore not able to account for the flow attenuating effect of floodplain storage areasincluded in the MIKE11 model.
To counter the differences observed between the HEC RAS and Mike11 models, the manning’s ‘n’ values inthe HEC RAS model were reduced by 25%. While this approach would not normally be considered anappropriate method to calibrate the HEC RAS model; it does however provide a way to at least providesimilar flood levels at the point of interest and allow for reasonable comparison of results. Followingadjustment of the Manning’s ‘n’ values the results showed that the flood levels are similar at the northern(downstream) end of the Project site (HEC RAS cross-section 14, MIKE11 cross-section 104185) and variesless than 160 mm up at the southern (upstream) end of the Project Site.

Parsons Brinckerhoff | 2103829E-TPT-REP-002 RevA 17
Moorebank Intermodal Company Moorebank Intermodal Transport Project - Flood Impact Assessment
4.2.3.2 Existing scenario
The above comparisons/model calibration were made prior to adding the existing East Hill Rail Bridge to themodel to ensure a comparative representation of the floodplain was in both models. Addition of the existingrail bridge to the model resulted in no change to flood levels downstream of the rail bridge, but an increase inflood levels immediately upstream of the rail bridge by 70 mm in comparison to the HEC RAS model resultswithout this bridge included. This flood level increase reduced to 40 mm by the upstream extent of the model(approximately 1.4 km upstream of the Project site).
This model, inclusive of the rail bridge was adopted as the existing case HEC RAS model.
4.2.3.3 Southern option
To represent the proposed bridge, the existing East Hills Rail Bridge has been duplicated in the model. Theproposed bridge deck and noise barriers have been represented at the same level as the existing rail bridge.Piers and abutments have been represented as the same size and shape and in the same locations acrossthe waterway as those for the existing rail bridge to minimise afflux and scour of the bed and banks of thewaterway. It is noted that the existing bridge has 1.8 m diameter piers located at 30.7 m intervals.
4.2.3.4 Northern option
There are a number of different approaches that can be adopted to model the effect of the northern optionbridge in the model. Due to the complexity of the bridge design (refer to section 2.3.2) two different methodshave been adopted to assess the afflux and the results compared. In each of these methods, each pier isassumed to be round and 1.8 m in diameter and therefore bridge skew has no impact on the pier width inrelation to the flow direction. The double piers at the dual rail part of the bridge are aligned perpendicular tothe flow.
Method 1 – Projection of piers onto existing cross sections
The location of each pier was projected onto the nearest upstream and downstream cross-sections. In someinstances, the projection of piers in the northern single rail branch coincide with the projection of piers in thesouthern single rail branch and therefore overlap on a single cross section. Since the bridge extends overthree cross-sections (HECRAS cross-sections 12, 13, and 14), two separate bridge structures wererepresented.
The eccentricity of the bridge and its piers has not been allowed for and cannot be allowed for in HECRASwithout creating a number of interpolated cross-sections between each of the piers (this is provided inMethod 2).
Method 2 – Insertion of interpolated sections
Ten interpolated sections were created between cross-section 13 and cross-section 14 and a further tenbetween cross-section 12 and cross-section 13. This allows for the piers to be better represented accordingto their longitudinal position. Overlapping piers, as referred to in Method 1, are able to be representedindividually due to the increase in cross-sections.

18 2103829E-TPT-REP-002 RevA | Parsons Brinckerhoff
Moorebank Intermodal Company Moorebank Intermodal Transport Project - Flood Impact Assessment
4.2.3.5 Central Option
To represent the central option bridge crossing a similar approach has been taken to representation of thenorthern option crossing. Each pier is assumed to be round and 1.8 m in diameter and therefore bridge skewhas no impact on the pier width in relation to the flow direction. The double piers at the dual rail part of thebridge are assumed to be aligned perpendicular to the flow.
Based on the results of the assessment of the Northern Option (refer section 4.2.3.4 and resultssection 5.2.2.) the central option bridge has been represented following Method 2 – insertion of interpolatedcross sections.
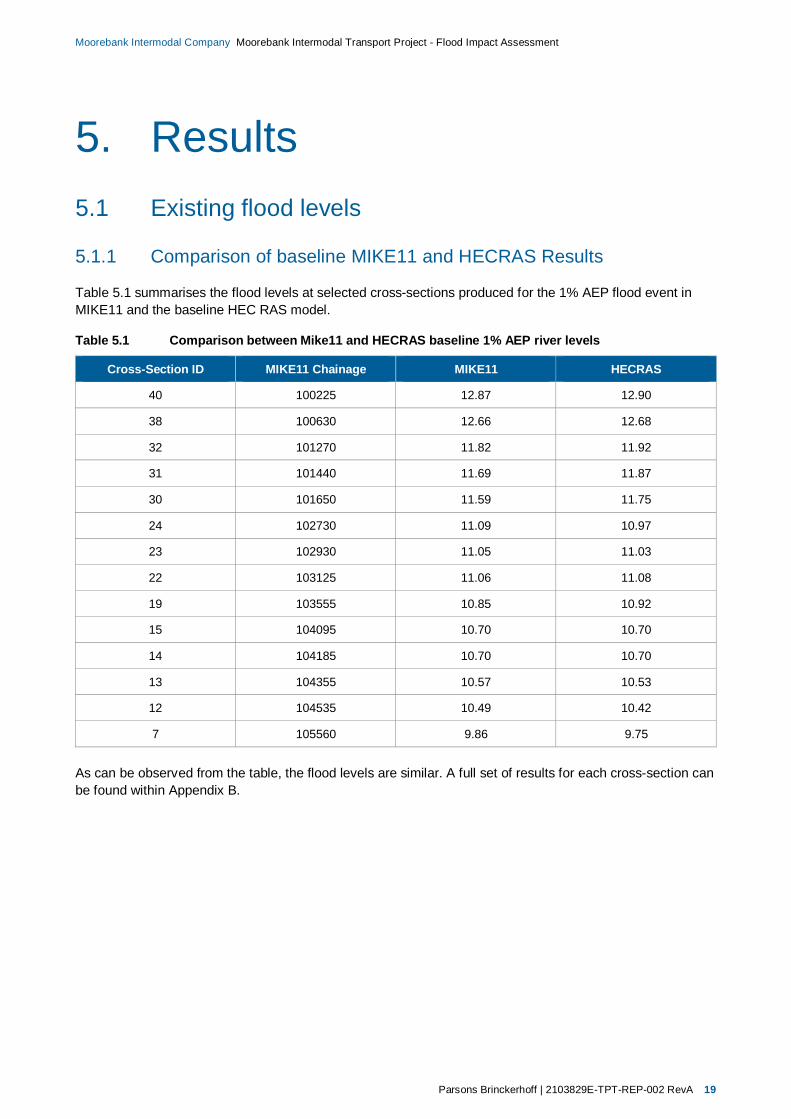
Parsons Brinckerhoff | 2103829E-TPT-REP-002 RevA 19
Moorebank Intermodal Company Moorebank Intermodal Transport Project - Flood Impact Assessment
5. Results5.1 Existing flood levels
5.1.1 Comparison of baseline MIKE11 and HECRAS Results
Table 5.1 summarises the flood levels at selected cross-sections produced for the 1% AEP flood event inMIKE11 and the baseline HEC RAS model.
Table 5.1 Comparison between Mike11 and HECRAS baseline 1% AEP river levels
Cross-Section ID MIKE11 Chainage MIKE11 HECRAS
40 100225 12.87 12.90
38 100630 12.66 12.68
32 101270 11.82 11.92
31 101440 11.69 11.87
30 101650 11.59 11.75
24 102730 11.09 10.97
23 102930 11.05 11.03
22 103125 11.06 11.08
19 103555 10.85 10.92
15 104095 10.70 10.70
14 104185 10.70 10.70
13 104355 10.57 10.53
12 104535 10.49 10.42
7 105560 9.86 9.75
As can be observed from the table, the flood levels are similar. A full set of results for each cross-section canbe found within Appendix B.
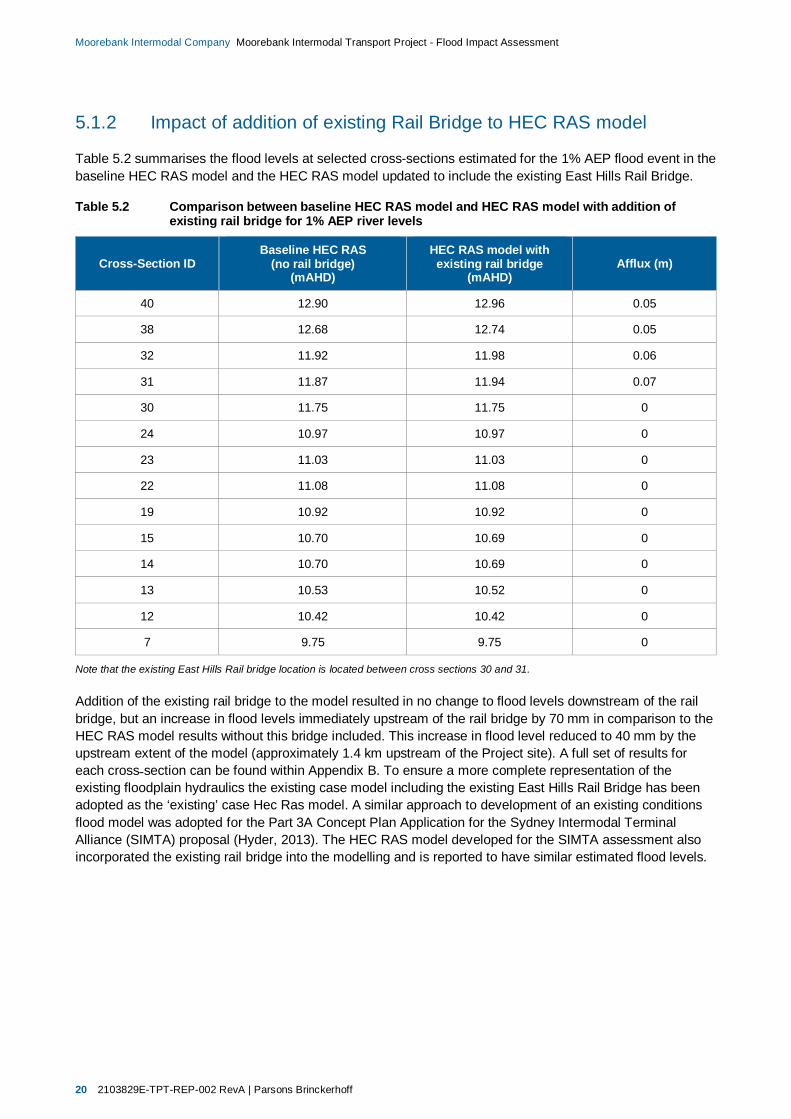
20 2103829E-TPT-REP-002 RevA | Parsons Brinckerhoff
Moorebank Intermodal Company Moorebank Intermodal Transport Project - Flood Impact Assessment
5.1.2 Impact of addition of existing Rail Bridge to HEC RAS model
Table 5.2 summarises the flood levels at selected cross-sections estimated for the 1% AEP flood event in thebaseline HEC RAS model and the HEC RAS model updated to include the existing East Hills Rail Bridge.
Table 5.2 Comparison between baseline HEC RAS model and HEC RAS model with addition ofexisting rail bridge for 1% AEP river levels
Cross-Section IDBaseline HEC RAS
(no rail bridge)(mAHD)
HEC RAS model withexisting rail bridge
(mAHD)Afflux (m)
40 12.90 12.96 0.05
38 12.68 12.74 0.05
32 11.92 11.98 0.06
31 11.87 11.94 0.07
30 11.75 11.75 0
24 10.97 10.97 0
23 11.03 11.03 0
22 11.08 11.08 0
19 10.92 10.92 0
15 10.70 10.69 0
14 10.70 10.69 0
13 10.53 10.52 0
12 10.42 10.42 0
7 9.75 9.75 0
Note that the existing East Hills Rail bridge location is located between cross sections 30 and 31.
Addition of the existing rail bridge to the model resulted in no change to flood levels downstream of the railbridge, but an increase in flood levels immediately upstream of the rail bridge by 70 mm in comparison to theHEC RAS model results without this bridge included. This increase in flood level reduced to 40 mm by theupstream extent of the model (approximately 1.4 km upstream of the Project site). A full set of results foreach cross section can be found within Appendix B. To ensure a more complete representation of theexisting floodplain hydraulics the existing case model including the existing East Hills Rail Bridge has beenadopted as the ‘existing’ case Hec Ras model. A similar approach to development of an existing conditionsflood model was adopted for the Part 3A Concept Plan Application for the Sydney Intermodal TerminalAlliance (SIMTA) proposal (Hyder, 2013). The HEC RAS model developed for the SIMTA assessment alsoincorporated the existing rail bridge into the modelling and is reported to have similar estimated flood levels.
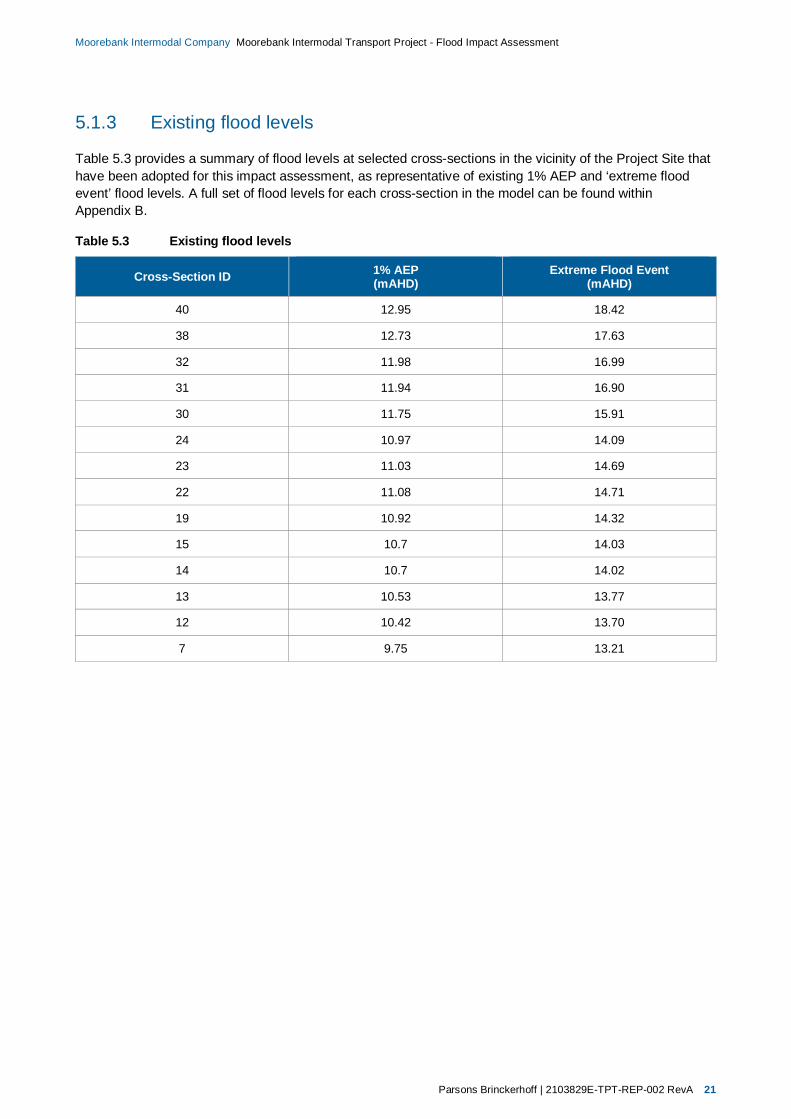
Parsons Brinckerhoff | 2103829E-TPT-REP-002 RevA 21
Moorebank Intermodal Company Moorebank Intermodal Transport Project - Flood Impact Assessment
5.1.3 Existing flood levels
Table 5.3 provides a summary of flood levels at selected cross-sections in the vicinity of the Project Site thathave been adopted for this impact assessment, as representative of existing 1% AEP and ‘extreme floodevent’ flood levels. A full set of flood levels for each cross-section in the model can be found withinAppendix B.
Table 5.3 Existing flood levels
Cross-Section ID 1% AEP(mAHD)
Extreme Flood Event(mAHD)
40 12.95 18.42
38 12.73 17.63
32 11.98 16.99
31 11.94 16.90
30 11.75 15.91
24 10.97 14.09
23 11.03 14.69
22 11.08 14.71
19 10.92 14.32
15 10.7 14.03
14 10.7 14.02
13 10.53 13.77
12 10.42 13.70
7 9.75 13.21
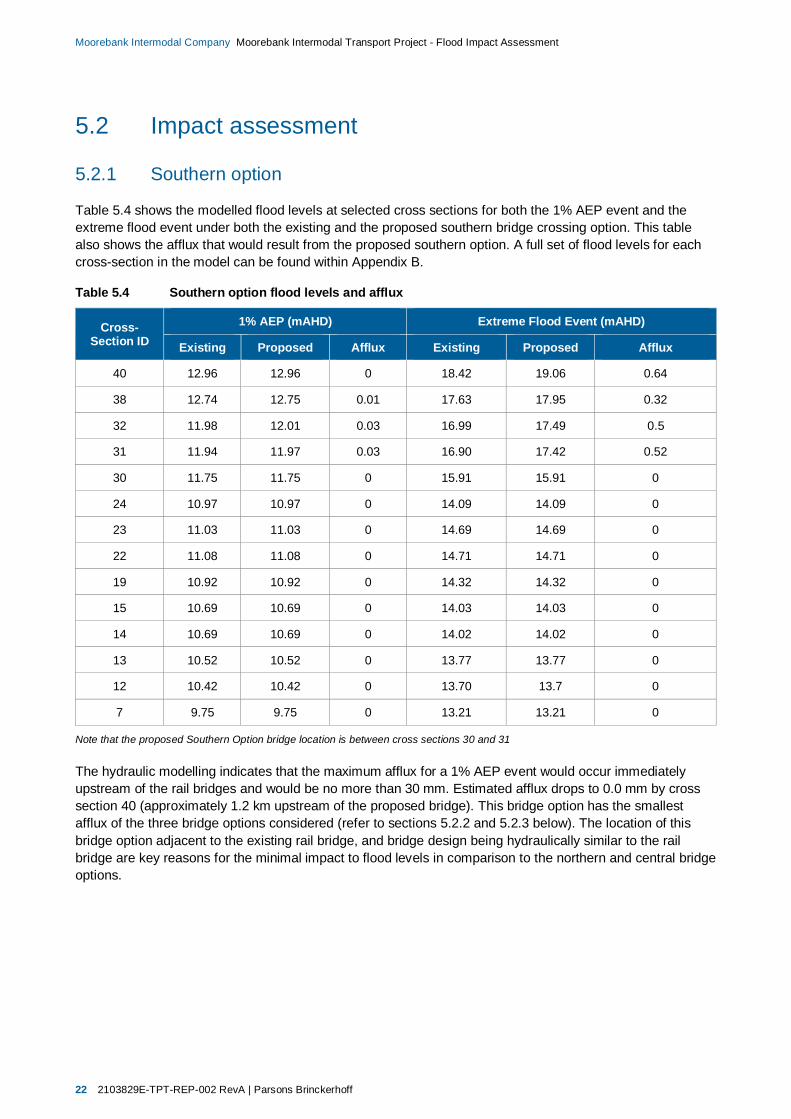
22 2103829E-TPT-REP-002 RevA | Parsons Brinckerhoff
Moorebank Intermodal Company Moorebank Intermodal Transport Project - Flood Impact Assessment
5.2 Impact assessment
5.2.1 Southern option
Table 5.4 shows the modelled flood levels at selected cross sections for both the 1% AEP event and theextreme flood event under both the existing and the proposed southern bridge crossing option. This tablealso shows the afflux that would result from the proposed southern option. A full set of flood levels for eachcross-section in the model can be found within Appendix B.
Table 5.4 Southern option flood levels and afflux
Cross-Section ID
1% AEP (mAHD) Extreme Flood Event (mAHD)
Existing Proposed Afflux Existing Proposed Afflux
40 12.96 12.96 0 18.42 19.06 0.64
38 12.74 12.75 0.01 17.63 17.95 0.32
32 11.98 12.01 0.03 16.99 17.49 0.5
31 11.94 11.97 0.03 16.90 17.42 0.52
30 11.75 11.75 0 15.91 15.91 0
24 10.97 10.97 0 14.09 14.09 0
23 11.03 11.03 0 14.69 14.69 0
22 11.08 11.08 0 14.71 14.71 0
19 10.92 10.92 0 14.32 14.32 0
15 10.69 10.69 0 14.03 14.03 0
14 10.69 10.69 0 14.02 14.02 0
13 10.52 10.52 0 13.77 13.77 0
12 10.42 10.42 0 13.70 13.7 0
7 9.75 9.75 0 13.21 13.21 0
Note that the proposed Southern Option bridge location is between cross sections 30 and 31
The hydraulic modelling indicates that the maximum afflux for a 1% AEP event would occur immediatelyupstream of the rail bridges and would be no more than 30 mm. Estimated afflux drops to 0.0 mm by crosssection 40 (approximately 1.2 km upstream of the proposed bridge). This bridge option has the smallestafflux of the three bridge options considered (refer to sections 5.2.2 and 5.2.3 below). The location of thisbridge option adjacent to the existing rail bridge, and bridge design being hydraulically similar to the railbridge are key reasons for the minimal impact to flood levels in comparison to the northern and central bridgeoptions.
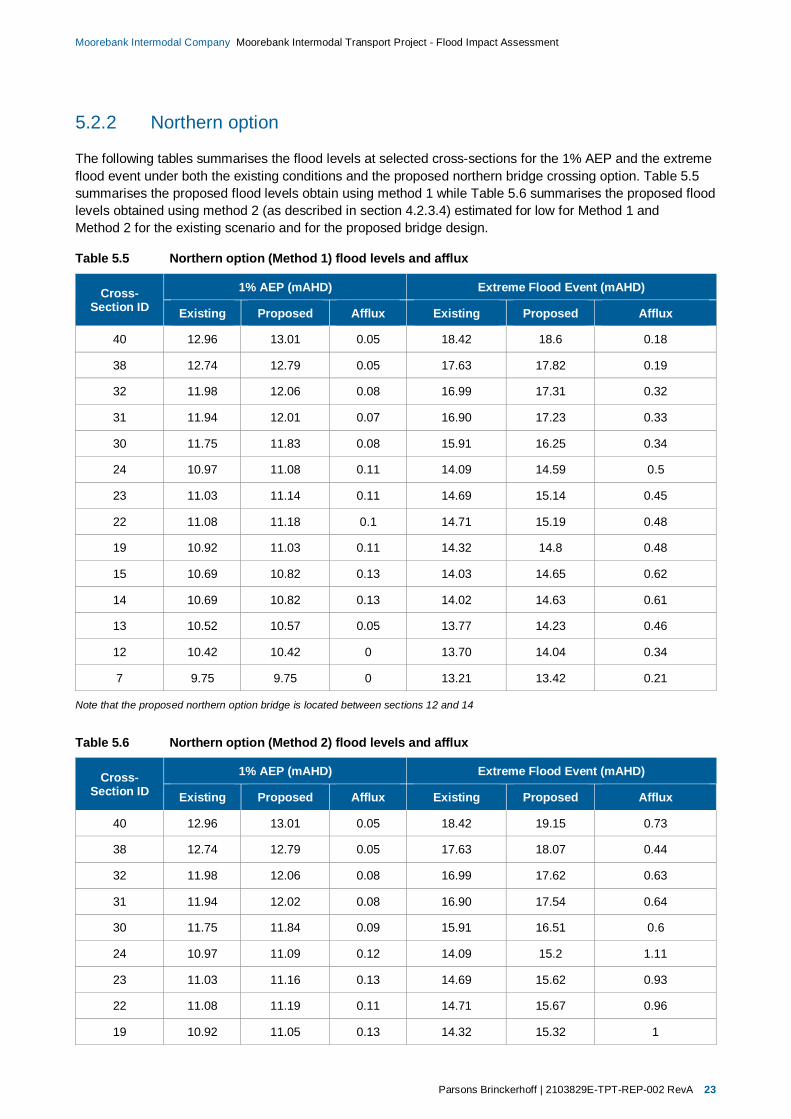
Parsons Brinckerhoff | 2103829E-TPT-REP-002 RevA 23
Moorebank Intermodal Company Moorebank Intermodal Transport Project - Flood Impact Assessment
5.2.2 Northern option
The following tables summarises the flood levels at selected cross-sections for the 1% AEP and the extremeflood event under both the existing conditions and the proposed northern bridge crossing option. Table 5.5summarises the proposed flood levels obtain using method 1 while Table 5.6 summarises the proposed floodlevels obtained using method 2 (as described in section 4.2.3.4) estimated for low for Method 1 andMethod 2 for the existing scenario and for the proposed bridge design.
Table 5.5 Northern option (Method 1) flood levels and afflux
Cross-Section ID
1% AEP (mAHD) Extreme Flood Event (mAHD)
Existing Proposed Afflux Existing Proposed Afflux
40 12.96 13.01 0.05 18.42 18.6 0.18
38 12.74 12.79 0.05 17.63 17.82 0.19
32 11.98 12.06 0.08 16.99 17.31 0.32
31 11.94 12.01 0.07 16.90 17.23 0.33
30 11.75 11.83 0.08 15.91 16.25 0.34
24 10.97 11.08 0.11 14.09 14.59 0.5
23 11.03 11.14 0.11 14.69 15.14 0.45
22 11.08 11.18 0.1 14.71 15.19 0.48
19 10.92 11.03 0.11 14.32 14.8 0.48
15 10.69 10.82 0.13 14.03 14.65 0.62
14 10.69 10.82 0.13 14.02 14.63 0.61
13 10.52 10.57 0.05 13.77 14.23 0.46
12 10.42 10.42 0 13.70 14.04 0.34
7 9.75 9.75 0 13.21 13.42 0.21
Note that the proposed northern option bridge is located between sections 12 and 14
Table 5.6 Northern option (Method 2) flood levels and afflux
Cross-Section ID
1% AEP (mAHD) Extreme Flood Event (mAHD)
Existing Proposed Afflux Existing Proposed Afflux
40 12.96 13.01 0.05 18.42 19.15 0.73
38 12.74 12.79 0.05 17.63 18.07 0.44
32 11.98 12.06 0.08 16.99 17.62 0.63
31 11.94 12.02 0.08 16.90 17.54 0.64
30 11.75 11.84 0.09 15.91 16.51 0.6
24 10.97 11.09 0.12 14.09 15.2 1.11
23 11.03 11.16 0.13 14.69 15.62 0.93
22 11.08 11.19 0.11 14.71 15.67 0.96
19 10.92 11.05 0.13 14.32 15.32 1
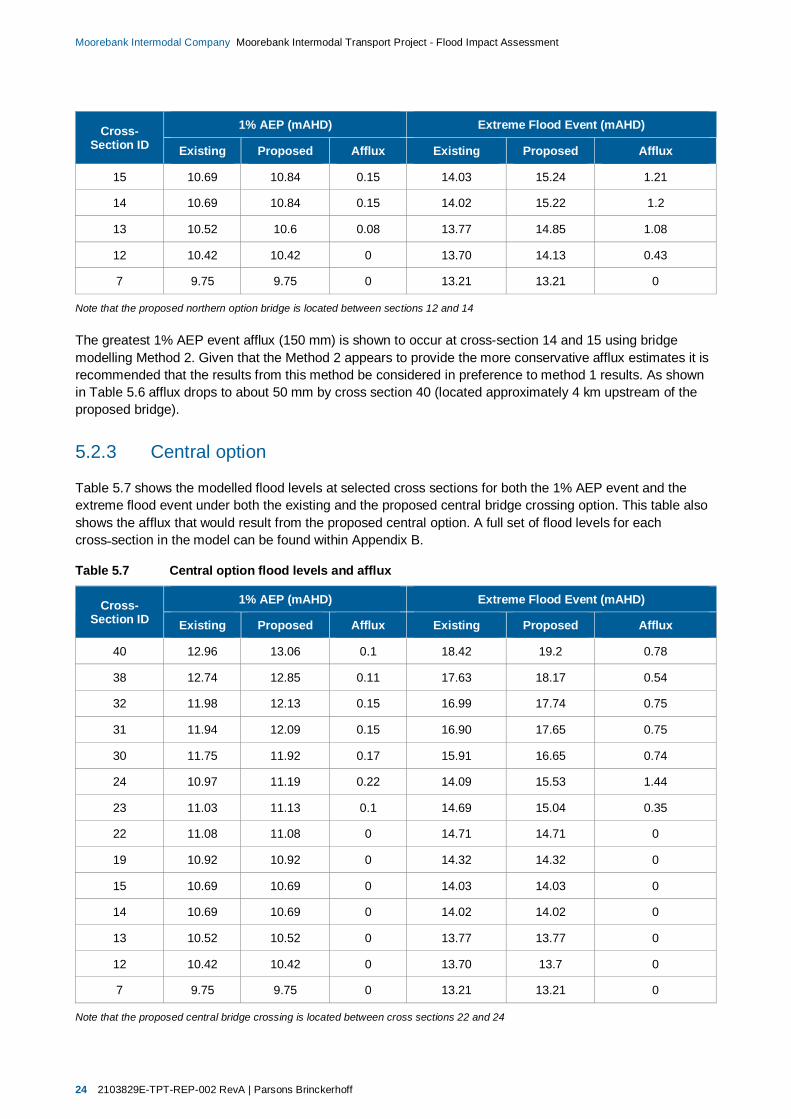
24 2103829E-TPT-REP-002 RevA | Parsons Brinckerhoff
Moorebank Intermodal Company Moorebank Intermodal Transport Project - Flood Impact Assessment
Cross-Section ID
1% AEP (mAHD) Extreme Flood Event (mAHD)
Existing Proposed Afflux Existing Proposed Afflux
15 10.69 10.84 0.15 14.03 15.24 1.21
14 10.69 10.84 0.15 14.02 15.22 1.2
13 10.52 10.6 0.08 13.77 14.85 1.08
12 10.42 10.42 0 13.70 14.13 0.43
7 9.75 9.75 0 13.21 13.21 0
Note that the proposed northern option bridge is located between sections 12 and 14
The greatest 1% AEP event afflux (150 mm) is shown to occur at cross-section 14 and 15 using bridgemodelling Method 2. Given that the Method 2 appears to provide the more conservative afflux estimates it isrecommended that the results from this method be considered in preference to method 1 results. As shownin Table 5.6 afflux drops to about 50 mm by cross section 40 (located approximately 4 km upstream of theproposed bridge).
5.2.3 Central option
Table 5.7 shows the modelled flood levels at selected cross sections for both the 1% AEP event and theextreme flood event under both the existing and the proposed central bridge crossing option. This table alsoshows the afflux that would result from the proposed central option. A full set of flood levels for eachcross section in the model can be found within Appendix B.
Table 5.7 Central option flood levels and afflux
Cross-Section ID
1% AEP (mAHD) Extreme Flood Event (mAHD)
Existing Proposed Afflux Existing Proposed Afflux
40 12.96 13.06 0.1 18.42 19.2 0.78
38 12.74 12.85 0.11 17.63 18.17 0.54
32 11.98 12.13 0.15 16.99 17.74 0.75
31 11.94 12.09 0.15 16.90 17.65 0.75
30 11.75 11.92 0.17 15.91 16.65 0.74
24 10.97 11.19 0.22 14.09 15.53 1.44
23 11.03 11.13 0.1 14.69 15.04 0.35
22 11.08 11.08 0 14.71 14.71 0
19 10.92 10.92 0 14.32 14.32 0
15 10.69 10.69 0 14.03 14.03 0
14 10.69 10.69 0 14.02 14.02 0
13 10.52 10.52 0 13.77 13.77 0
12 10.42 10.42 0 13.70 13.7 0
7 9.75 9.75 0 13.21 13.21 0
Note that the proposed central bridge crossing is located between cross sections 22 and 24
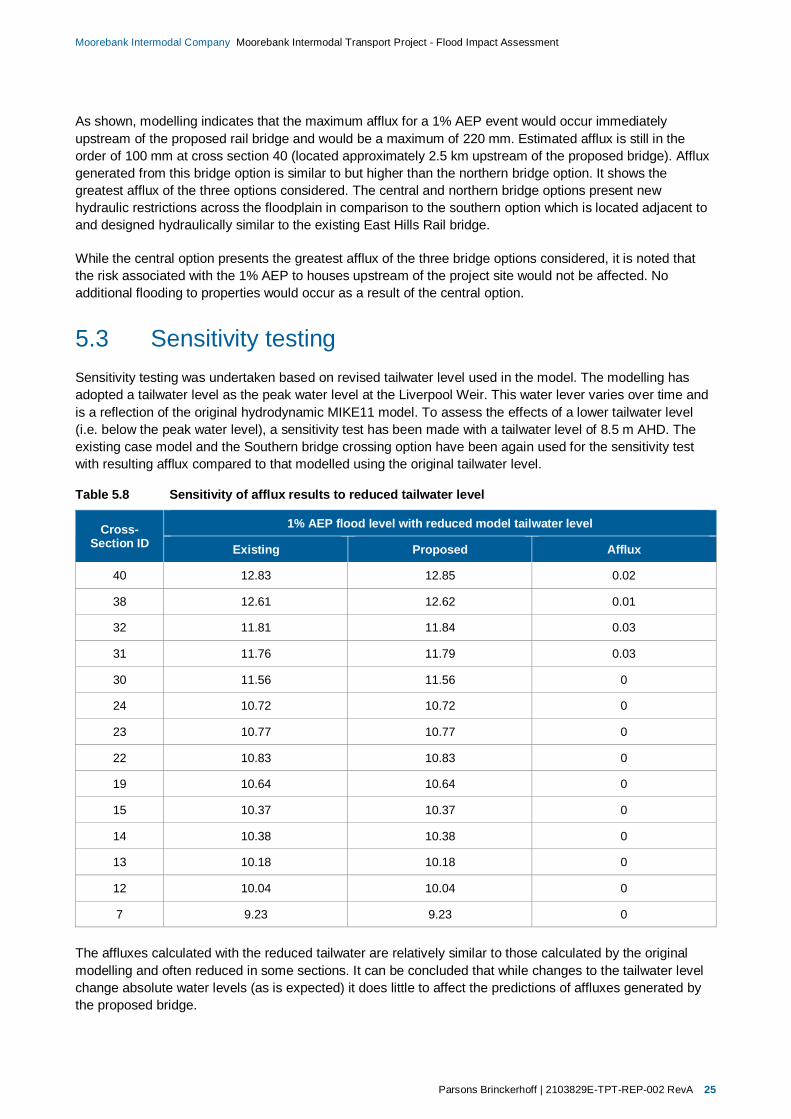
Parsons Brinckerhoff | 2103829E-TPT-REP-002 RevA 25
Moorebank Intermodal Company Moorebank Intermodal Transport Project - Flood Impact Assessment
As shown, modelling indicates that the maximum afflux for a 1% AEP event would occur immediatelyupstream of the proposed rail bridge and would be a maximum of 220 mm. Estimated afflux is still in theorder of 100 mm at cross section 40 (located approximately 2.5 km upstream of the proposed bridge). Affluxgenerated from this bridge option is similar to but higher than the northern bridge option. It shows thegreatest afflux of the three options considered. The central and northern bridge options present newhydraulic restrictions across the floodplain in comparison to the southern option which is located adjacent toand designed hydraulically similar to the existing East Hills Rail bridge.
While the central option presents the greatest afflux of the three bridge options considered, it is noted thatthe risk associated with the 1% AEP to houses upstream of the project site would not be affected. Noadditional flooding to properties would occur as a result of the central option.
5.3 Sensitivity testingSensitivity testing was undertaken based on revised tailwater level used in the model. The modelling hasadopted a tailwater level as the peak water level at the Liverpool Weir. This water lever varies over time andis a reflection of the original hydrodynamic MIKE11 model. To assess the effects of a lower tailwater level(i.e. below the peak water level), a sensitivity test has been made with a tailwater level of 8.5 m AHD. Theexisting case model and the Southern bridge crossing option have been again used for the sensitivity testwith resulting afflux compared to that modelled using the original tailwater level.
Table 5.8 Sensitivity of afflux results to reduced tailwater level
Cross-Section ID
1% AEP flood level with reduced model tailwater level
Existing Proposed Afflux
40 12.83 12.85 0.02
38 12.61 12.62 0.01
32 11.81 11.84 0.03
31 11.76 11.79 0.03
30 11.56 11.56 0
24 10.72 10.72 0
23 10.77 10.77 0
22 10.83 10.83 0
19 10.64 10.64 0
15 10.37 10.37 0
14 10.38 10.38 0
13 10.18 10.18 0
12 10.04 10.04 0
7 9.23 9.23 0
The affluxes calculated with the reduced tailwater are relatively similar to those calculated by the originalmodelling and often reduced in some sections. It can be concluded that while changes to the tailwater levelchange absolute water levels (as is expected) it does little to affect the predictions of affluxes generated bythe proposed bridge.

Parsons Brinckerhoff | 2103829E-TPT-REP-002 RevA 27
Moorebank Intermodal Company Moorebank Intermodal Transport Project - Flood Impact Assessment
6. ConclusionsThe hydraulic modelling indicates that the maximum afflux for a 1% AEP event would occur immediatelyupstream of the proposed rail bridges for each option and would be limited to:
30 mm for the southern option
150 mm for the northern option
220 mm for the central option.
Upstream of the project site the southern option has the smallest afflux (despite having the bridge located atthe upstream extent of the project site) with no afflux noted at the upstream cross section of the model. Thiscompares to an afflux of 40 mm for the northern option and 90 mm for the central option. It should be notedthat these are likely to be a conservative estimates of afflux due to limited modelling inputs.
The central and northern bridge options present new hydraulic restrictions across the floodplain incomparison to the southern option which is located adjacent to and designed hydraulically similar to theexisting East Hills Rail bridge. The location of the proposed southern bridge option adjacent to the existingrail bridge, and bridge design being hydraulically similar to the rail bridge are key reasons for the smallerimpact to flood levels associated with this option in comparison to the northern and central bridge options.
There are residences located upstream of the project site and it will be critical to ensure that flood impacts donot negatively affect these properties. The modelling indicates that none of the three bridge optionsconsidered would increase the flood risk to these properties during a 1% AEP event.
The Casula Powerhouse arts centre is in a low hazard area and above the 1% AEP flood level. The road intothe centre also appears to be above the 1% AEP flood level. Whilst some of the parkland adjacent to thecentre may be affected, the modelling indicates that none of the three bridge options considered wouldincrease the flood risk to the arts centre during a 1% AEP event.
To minimise potential flood impacts bridge design should incorporate the following key principles:
the proposed soffit of the bridge deck is to be set at a minimum of 500 mm above the predicted 1% AEPflood level (or in the case of the Southern option, the deck and noise barriers should be designed at thesame level as the existing rail bridge)
bridge abutments should not encroach on the waterway areas of the Georges River
piers should be designed to be streamlined in shape to minimise afflux and scour of the bed and banksof the waterway (the southern option should adopt piers that are the same size and shape and that arehydraulically aligned with the existing rail bridge).
Sensitivity testing has indicated that variations to the input parameters (e.g. tailwater levels) do not have asignificant impact on the affluxes predicted by the model.
As the MIKE11 model was simplified to a HECRAS model to enable afflux results to be calculated, theHECRAS model should be limited in its use to calculating afflux in the vicinity of the proposed bridge. TheMIKE11 model is a more comprehensive model and should be used to determine flood levels across thereaches modelled for the adopted design.
It is recommended that further modelling be undertaking during further design phases to confirm affluxgenerated by the proposed bridge and potential flood impacts. This future modelling may also facilitaterefinement of the bridge design to reduce impacts.

Parsons Brinckerhoff | 2103829E-TPT-REP-002 RevA 29
Moorebank Intermodal Company Moorebank Intermodal Transport Project - Flood Impact Assessment
7. ReferencesBewsher Consulting, 1999, Georges River Model Study (DRAFT).
Bewsher Consulting, 2004, Georges River Floodplain Management Study and Plan.
Hyder Consulting, August 3013, Transitional Part 3A Concept Application, SIMTA Moorebank IntermodalTerminal Facility – Flood Study and Stormwater Management.


Appendix AEast Hills Rail Bridge work as executed drawings