Supporting Information
MoP supported on reduced graphene oxide for high performance electrochemical nitrogen reduction
Yan Zhou*a, Xinping Yua,b, Fengchao Suna,b and Jun Zhang*ab
a. School of Materials Science and Engineering, China University of
Petroleum (East China), Qingdao 266580, CHINA.
b. School of Chemical Engineering, China University of Petroleum (East
China), Qingdao 266580, CHINA.
Electronic Supplementary Material (ESI) for Dalton Transactions.This journal is © The Royal Society of Chemistry 2020
Experimental section
Materials:
Molybdenum (VI) dioxyacetylacetonate (MoO2(acac)2), sodium hypophosphite
(NaH2PO2), lithium sulphate (Li2SO4) were purchased from Macklin Biochemical Co.,
Ltd., Shanghai. Ammonium chloride (NH4Cl), trisodium citrate dihydrate
(C6H5Na3O7·2H2O), ethanol (C2H5OH), hydrochloric acid (HCl) were purchased
from Sinopharm Chemical Reagent Co., Ltd., Shanghai, China. Nessler’s reagent,
potassium sodium tartrate tetrahydrate (C4H4O6KNa·4H2O), p-
dimethylaminobenzaldehyde (C9H11NO) were purchased from Aladdin Industrial
Corporation. Sodium hydroxide (NaOH) was purchased from Xilong Chemical Co.,
Ltd. Salicylic acid (C7H6O3), sodium nitprasside dehydrate (Na2[Fe(CN)5NO]·2H2O),
sodium hypochlorite solution (NaClO), hydrazine manahydrachlaride (ClH5N2) were
purchased from Saen Chemical Technology Co., Ltd., Shanghai. Carbon paper was
purchased from River's electric Co., Ltd., Shanghai. 5% Nafion solution, Proton
exchange membrane (Nafion membrane 211) were purchased from DuPont Holding
Co., Ltd., China. Distilled water (Millipore, 18.2 MΩ). All the reagents were used as
received without further purification.
Characterization
XRD images were recorded using a Philips X-Pert diffractometer with Cu Kα (40 kV,
30 mA) radiation of wavelength 0.15418 nm, XPS mea were carried out on a VG
ESCALAB MK II spectrometer using an Al Kα (1486.6 eV) photon source. Scanning
electron microscopy (SEM) images, transmission electron microscopy (TEM), high-
resolution transmission electron microscopy (HRTEM), Scanning electron microscopy
(SEM) images were recorded using a Hitachi S-4800 instrument. Energy dispersive X-
Ray spectroscopy (EDX) images were recorded using INCA Energy X-MAX-50
instrument. The absorbance data were measured with an ultraviolet-visible (UV-Vis)
spectrophotometer (General Tu-1901).
Synthesis of MoP@rGO, MoP, rGO
75 mg MoO2(acac)2 was dissolved in 30 mL ethanol/DI mixed solvent (V/V=1) under
strong agitation. 50 mg GO was then added into the above solution .Ultrasound was
then continued for 30 min to form a uniform suspension. The uniform suspension was
dried with stirring at temperature of 80 ℃ . The obtained precursor powder was
grounded and transferred into a tube furnace near the Ar outlet, and NaH2PO2 (1.0 g)
were placed near the Ar inlet. The sample was calcined at 500 ℃ for 1 h and then
calcined at 750 ℃ for another 2 h. The heating rate of the two heating processes were
2 ℃ min-1 and 5 ℃ min-1. Ar gas was continuously injected during calcination. The
sample was washed several times with deionized water, and then dried under ambient
condition. For comparison, MoP was prepared in the same process without GO. rGO
was prepared in the same process without MoP.
Electrochemical NRR measurements:
The electrochemical experiments were performed on the CHI 660E electrochemical
workstation with the standard three electrode system. MoP@rGO, MoP, rGO were
drop-casted on CP (1 cm × 1 cm × 2 sides,) and applied as the working electrode,
graphite rod as counter electrode and the saturated Ag/AgCl electrode as the reference
electrode. All potentials were converted to RHE with the following equation: ERHE =
EAg/AgCl + 0.197 +0.059pH. Before electrochemical NRR measurements, the electrolyte
(30 mL) was purged with 99.99% N2 or Ar for 30 min. Potentiostatic tests were
conducted in N2 or Ar saturated electrolyte in the two compartment cell, which was
separated by proton exchange membrane (Nafion membrane 211). During the process
of potentiostatic tests, 99.99% N2 or Ar were continuously fed into the cathodic
chamber.
Prepartion MoP@rGO/CP, MoP/CP, rGO/CP
2.5 mg MoP@rGO and 50 μL Nafion solution (5 wt%) were dispersed in 450 μL ethanol
with sonication for 30 min to form a homogeneous ink. Then 200 μL of MoP@rGO ink
was loaded on a carbon paper electrode with area of 1 cm2 and dried under ambient
condition. MoP/CP, rGO/CP was made by the same process.
Determination of NH3
The concentration of the produced NH3 during NRR was determined by the indophenol
blue method.1 Typically, 1mg mL-1 NH4+ solution was prepared and diluted to 1 µg mL-
1. Standard NH4+ solution with NH4
+ concentrations of 0.0, 0.1, 0.2, 0.4, 0.6, 0.8 and
1.0 µg mL-1 were prepared in 10 mL colorimetric tubes by diluted 0.1 M Li2SO4 (pH
= 3) . Then 500 µL of 1.0 M NaOH solution containing sodium citrate (5.0 wt%) and
salicylic (5.0 wt%) was added to the above 10 mL of sample solution. Subsequently,
100 µL of sodium nitroferricyanide solution (1.0 wt%) and 100 µL of NaClO solution
(0.55 M) were added to the above mixture. After standing at room temperature for 1 h,
the UV–vis absorption spectrum was measured at a wave length of 690 nm. After
potentiostatic tests,10 mL electrolyte was obtained from cathodic chamber and
developed color by indophenol blue method. The fitting curve (y = 0.74x+0.035, R2 =
0.999) showed good linear relation between the NH4+ concentration and absorbance
values
Determination of N2H4:
The Watt and Chrisp method was applied to analyze the N2H4 yield in the electrolyte.2
Typically, 2 mg mL-1 N2H4 solution was firstly diluted to 2 µg mL-1. Standard N2H4
solution with N2H4 concentrations of 0.2, 0.6, 1.2, 1.5 and 2.0 µg mL-1 were prepared
in 10 mL colorimetric tubes in 0.1 M Li2SO4 (pH = 3) .The p-C9H11NO (5.99 g), HCl
(30 mL), and C2H5OH (300 mL) were mixed as a color reagent. In detail, 5.0 mL
standard N2H4 solution was removed and 5.0 mL of color reagent then added with rapid
stirring for several times at room temperature. After incubation for 20 min, the mixture
was measured on an UV–Vis Tu-1901 spectrophotometer with absorbance at the
wavelength of 460 nm. The fitting curve (0.747x+0.007, R2 = 0.999) showed good
linear relation between the N2H4 concentration and absorbance values.
Calculations of NH3 yield and faradaic efficiency:
The rate of NH3 yield was calculated using the following equation:
NH3 yield rate = (CNH4+×V)/(t×mcat),
To calculate the Faradaic efficiency (FE), the following equation was applied:
FE = 3F×CNH4+×V/(18×Q),
where CNH4+ is the measured NH4
+ concentration, V is the total volume of electrolyte,
t is the duration of applied potential, mcat is the mass of catalyst loaded on the working
electrode, F is the Faradaic constant, and Q is the quantity of applied electricity.
Figure S1 Full survey of XPS spectrum of MoP@rGO.
Figure S2 (a) UV-Vis spectra of indophenol assays kept with
different concentration of NH4+
ions for 1 h at room temperature.
(b) A calibration curve used to estimate the concentrations of
NH4+
ions.
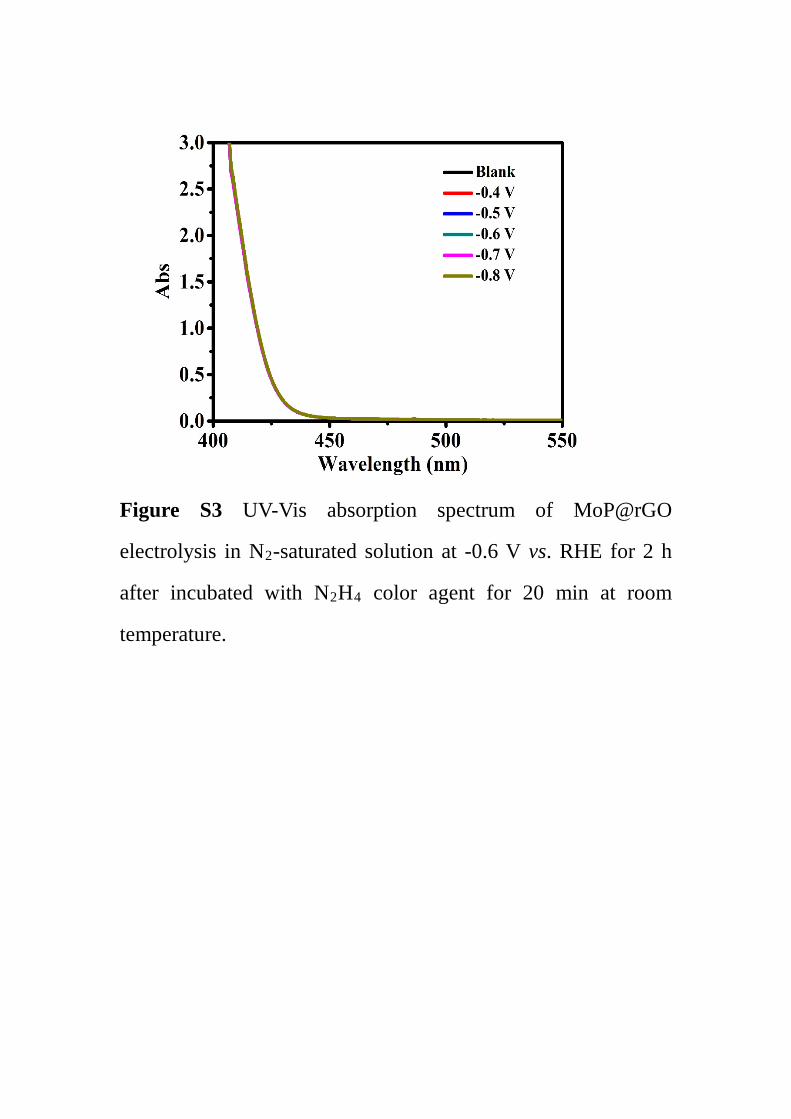
Figure S3 UV-Vis absorption spectrum of MoP@rGO
electrolysis in N2-saturated solution at -0.6 V vs. RHE for 2 h
after incubated with N2H4 color agent for 20 min at room
temperature.
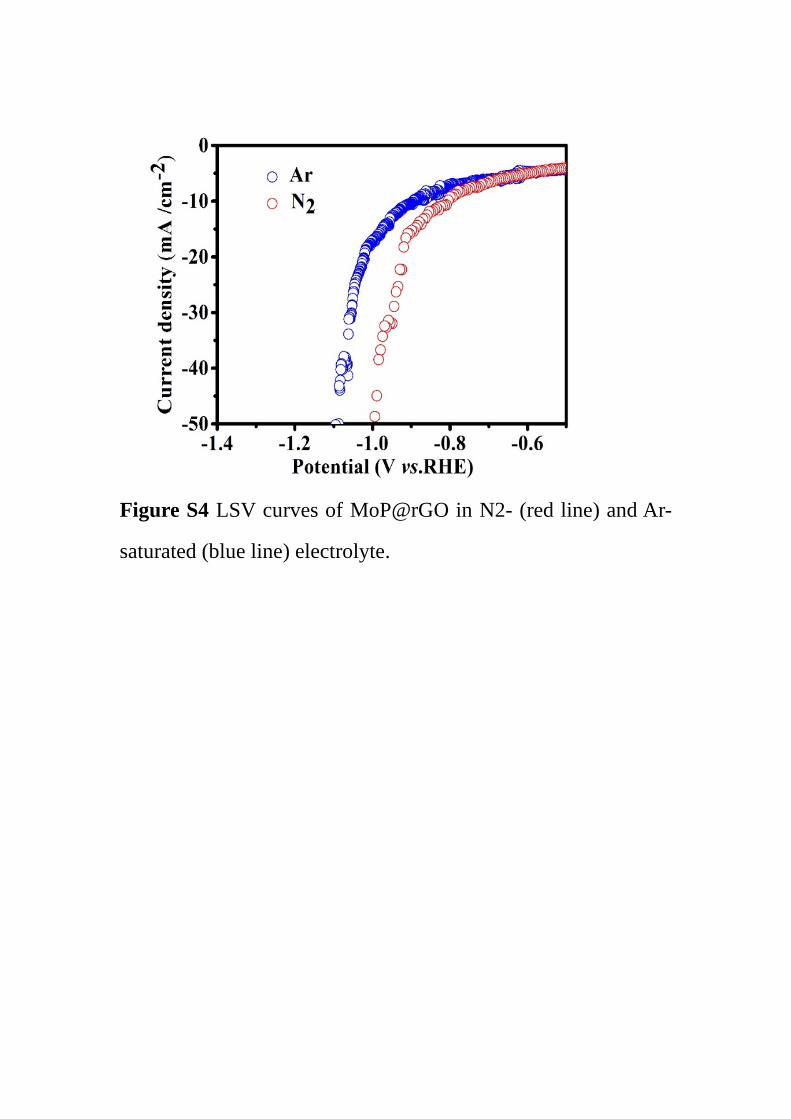
Figure S4 LSV curves of MoP@rGO in N2- (red line) and Ar-
saturated (blue line) electrolyte.
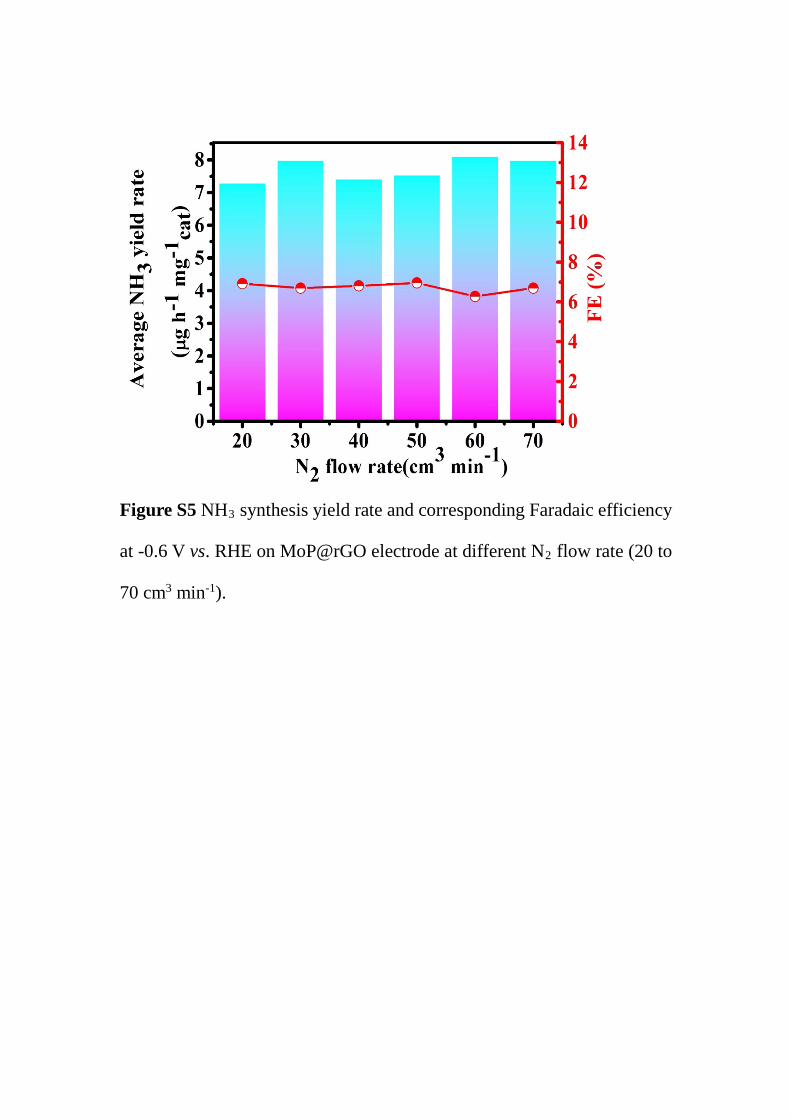
Figure S5 NH3 synthesis yield rate and corresponding Faradaic efficiency
at -0.6 V vs. RHE on MoP@rGO electrode at different N2 flow rate (20 to
70 cm3 min-1).
Figure S6 (a) Chronoamperometry curve of NRR test of MoP@rGO. (b)
UV-vis absorption spectra of electrolytes obtained with indophenol
indicator (Color code: blank line: electrolysis in N2-saturated solution at -
0.6 V vs. RHE for 2 h at MoP@rGO electrode, red line: electrolysis in N2-
saturated solution at -0.6 V vs. RHE for 2 h on MoP@rGO electrode after
24 h continuous NRR test.
Figure S7 XPS spectra of MoP@rGO hybrids after NRR tests: (a) XPS
survey spectrum for MoP@RGO, (b) Mo 3d , (c) P 2p , (d) C1s.
Figure S8 Catalytic performances of MoP in 0.1 M Li2SO4 aqueous
solution (pH=3). (a) NH3 synthesis yield rate and corresponding Faradaic
efficiency of MoP. (b) Chronoamperometry curves of continues N2
reduction on MoP electrode.
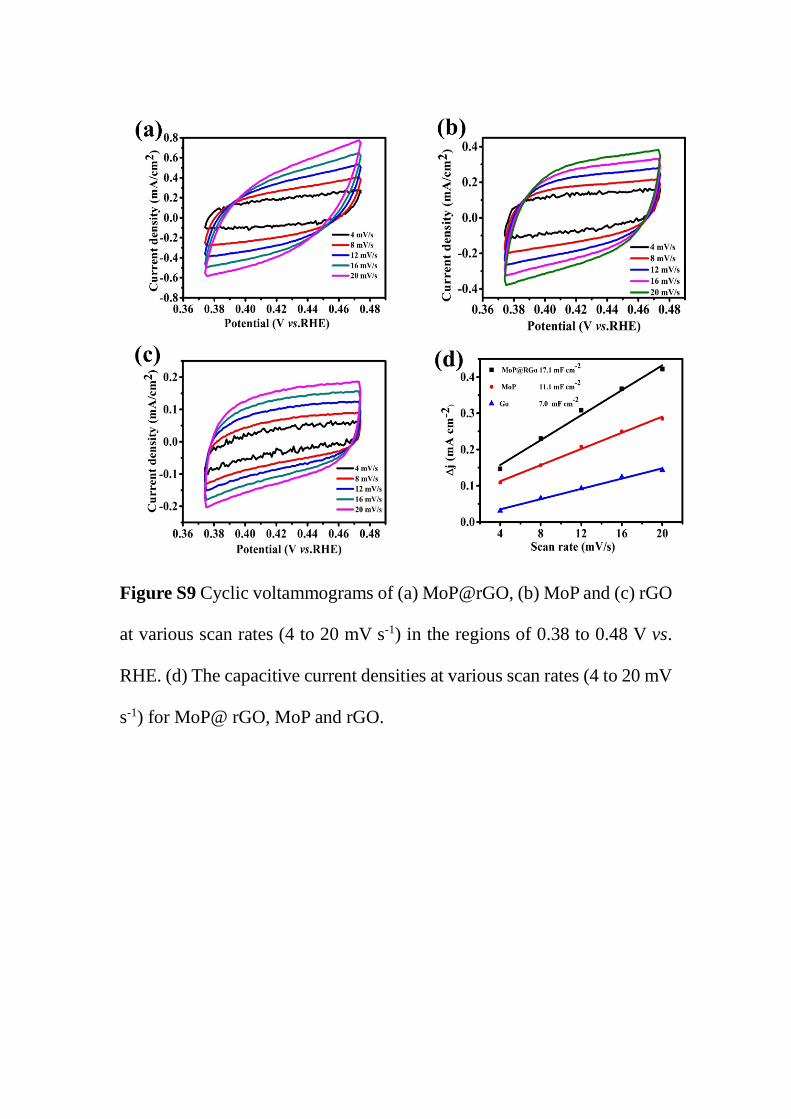
Figure S9 Cyclic voltammograms of (a) MoP@rGO, (b) MoP and (c) rGO
at various scan rates (4 to 20 mV s-1) in the regions of 0.38 to 0.48 V vs.
RHE. (d) The capacitive current densities at various scan rates (4 to 20 mV
s-1) for MoP@ rGO, MoP and rGO.
Figure S10 UV-Vis spectra of electrolytes after colored with indophenol
indicator after 2 h NRR tests under different condition. (Color code: blank
line, 0.1 M Li2SO4 aqueous solution before electrolysis; red line,
electrolysis in Ar-saturated at -0.6 V vs. RHE for 2 h; blue line, electrolysis
in N2-saturated solution at open circuit potential for 2 h. green line NRR
test at -0.6 V vs. RHE .
Figure S11 UV-Vis spectra of electrolytes after colored with indophenol
indicator under different condition.(Color code: blank line, 0.1 M Li2SO4
aqueous solution after supplying Ar for 30 min; red line 0.1 M Li2SO4
aqueous solution after supplying N2 for 30 min; blue line: 0.1 M Li2SO4
aqueous solution without any pretreatment.
References
1. Y. Liu, M. Han, Q. Xiong, S. Zhang, C. Zhao, W. Gong, G. Wang,
H. Zhang and H. Zhao, Advanced Energy Materials, 2019, 9,
1803935.
2. S. Kang, J. Wang, S. Zhang, C. Zhao, G. Wang, W. Cai and H. Zhang,
Electrochemistry Communications, 2019, 100, 90-95.