Galal Ahmed and Alipour City Territ Archit (2021) 8:12 https://doi.org/10.1186/s40410-021-00140-3
RESEARCH ARTICLE
More dense but less walkable: the impact of macroscale walkability indicators on recent designs of emirati neighborhoodsKhaled Galal Ahmed1,2* and S. M. Hossein Alipour1,3
Abstract
With the aim to enhance sustainability in general including walkability, the recent urban forms of the designs of the Emirati neighborhoods have been denser and more compact, if compared with the older design models. While there are various guidelines and regulations related to the microscale walkability measures for the urban design of neigh-borhoods in the Emirates but unfortunately the macroscale walkability measures have not received similar atten-tion. So, to investigate how would these denser and more compact recent neighborhoods designs better perform regarding walkability macroscale measures, the research utilized the urban modelling interface (UMI) walkability simulation tool to calculate the UMI Walkscores of these designs because it considers almost all macroscale factors including both urban morphology and urban planning measures and it also allows for the customization of the types, required catchment distances, and weights of the significance of locally provided amenities. The UMI Walkscores were calculated for the six recent denser and more compact neighborhoods designs and were compared with the UMI Walkscore for a conventionally designed model of urban sprawling neighborhoods. Unexpectedly, it has been found out that urban compactness per se is not a sufficient design measure for enhancing walkability in local neighborhood designs, where much higher compactness and density have achieved disappointing UMI Walkscores. So, it seems that for the recent neighborhoods’ designs, little attention was paid to the impact of the street network connectiv-ity measures of Intersection Density, Block Length and the link-to-nodes ratio, on UMI Walkscores, if compared with the main attention paid to increasing FAR through decreasing plot sizes. Meanwhile, the explicit macroscale urban planning measures including the land-use factors of the types, numbers, and the location of amenities, as well as the implicit factors of their destination and global weights seem to be more influential in enhancing the UMI Walkscores but have been less considered when planning these neighborhoods. So, besides considering well-known macroscale urban morphology aspects of street network connectivity and locational distribution of provided amenities, boost-ing walkability macroscale measures on the design level requires adopting a set of adequately customized measures including the appropriate values of their global and distribution weights. These walkability design weights should be also resilient and continuously reviewed to satisfy the changing needs of the local communities. Based on its findings, the research proposed a five-actions plan to help boost walkability macroscale measures in the design of local urban communities in the UAE.
Keywords: Walkability, UMI Walkscore, Neighborhood, Sustainability, Compact urban form, United Arab Emirates
IntroductionThe environmentally deteriorated quality of life in many of today’s urban settlements requires urgent actions that aim at generating sustainable and livable communi-ties (American Society of Landscape Architects 2015).
Open Access
*Correspondence: [email protected] Architectural Engineering Department, College of Engineering, United Arab Emirates University, P. O. Box: 13393, Al Ain, UAEFull list of author information is available at the end of the article
Page 2 of 26Galal Ahmed and Alipour City Territ Archit (2021) 8:12
Achieving a sustainable urban form is perceived as the most significant action towards attaining these sustain-able and livable communities (Burton et al. 2013; Neu-man 2005). Besides the essential aspects that contributes to the sustainability of the urban form of a settlement, including satisfying the requirements of its residents and allowing them to easily access various locally provided amenities and transport nodes (Allen 2009; Jones and MacDonald 2004; Clerk 2000), the diversified and mixed use of the urban form would satisfy the provision of a healthy mix of residential, commercial, and recreational facilities (Moreno et al. 2021).
On the other hand, urban density and compactness have been recommended in the recent discourse about sustainable urban future where urban densification is encouraged to fight against urban sprawl (URBACT 2019). Considering appropriate density in urban plan-ning, as highlighted by Moreno et al. (2021), would help define the ideal number of people that the developed project can comfortably sustain in terms of the deliv-ery of local amenities and resource consumption. It is believed that the dense and mixed-use urban develop-ment would effectively reduce automobile dependency and thus would contribute to more sustainable modes of transportation such as walking and cycling. Therefore, the utilization of high density, mixed-use and short prox-imity between locally provided amenities in a neighbor-hood are considered among possible effective strategies that decrease automobile dependency and contributes to the utilization of Human Powered Transport (HPT) that describes the transport of a person using human kinetic energy (Sustainable Design Lab 2020; Singh et al. 2018).
This research is focusing on walkability as the widely spread form of HPT and the most environmental and social friendly means of local mobility. Walkability encourages residents to abandon using their own cars to access locally provided amenities, therefore, it contrib-utes to less polluted environment and help enhance the physical and mental wellbeing of the residents. A growing body of research provides evidence about the relationship between poor walkability of the residential environment and the greater obesity prevalence (Kowaleski-Jones et al. 2018; Kiflen et al. 2018; Schiller 2015; Brookfield 2017). Moreover, it is evident now that pedestrian-friendly com-munities have enhanced community connectedness and social capital due to the initiated social interlinked rela-tions and networks among residents (Rogers et al. 2013; Masoud 2011; Paranagamage et al. 2014; Mazumdar et al. 2018). Accordingly, Annunziata et al. (2020) and Garau et al. (2020) argued that walkability has an ethical signifi-cance as it affects people’s well-being through positively shaping their physical and social capabilities and also providing them with healthy aging.
For a neighborhood to be walkable both of its ‘mac-roscale’ and ‘microscale’ walkability measures should be achieved. Annunziata et al. (2020) and Garau et al. (2020) dubbed the macroscale indicators as ‘contextual factors’ including accessibility to amenities and tran-sit, pedestrian network configuration, and land-use. Meanwhile, they described the microscale indicators as ‘intrinsic factors’ including sidewalks width and ramps, quality of walkway surfaces, and street furniture.
As for the walkability macroscale measures, Bar-ton (2000) stated that neighborhoods to be walkable they should have good pedestrian network linking the neighborhood services and facilities to houses within walkable catchment distances. Typically, the provided amenities on the neighborhood level would be located in a neighborhood service center. For its land-use, this service center would ideally encompass a public trans-port stop, a marketplace, a community park, a com-munity hall, a number of shops for daily needs, a small supermarket, a post office counter, a public house, a newsagent, a local bank, a community library, local surgeries, commercial units and other workplaces. The neighborhood services should also include a number of kindergartens, a primary school, play and sports areas for children and youngsters, and allotments (Frey 1999). Concerning the appropriate catchment distance to the locally provided amenities, a recent research revealed that pedestrians favor short, direct routes and prefer to walk no further than 500 m in ordinary daily situations (Brookfield 2017). But, it is still commonly accepted that the distance between any house front door and the local amenities or a transport node should be within maximum 10 min’ walk or about 800 m (Bar-ton 2000). Recently, Moreno et al. (2021) promoted for what they called a ‘15-min city’ and argued that this would boost walkability and achieve the desired prox-imity and social interactions within cities. For the ease of their analysis, the walkability macroscale indica-tors could be subsumed into ‘urban morphology’ and ‘urban planning’ measures, as adopted in this research. Urban morphology measures mainly encompass the street/pedestrian network characteristics such as street intersection density, bock length and link-to-nodes ratio (Labdaoui et al. 2021). It also contains the floor-area-ratio (FAR), calculated as the ratio of the gross floor area of all neighborhood buildings to the total area of the neighborhood’s site, and gross population density, calculated by dividing the total development area in hectares over the target population. Mean-while, the macroscale urban planning measures include both explicit factors, such as land-use that defines the types and numbers of provided amenities, their loca-tional distribution in the neighborhood plan and their
Page 3 of 26Galal Ahmed and Alipour City Territ Archit (2021) 8:12
catchment distances, as well as the implicit factors of the degree of importance of the amenities to the users (Sustainable Design Lab 2020).
On the other hand, the walkability microscale/fine-grain measures include mainly the urban design factors at the neighborhood scale, that help create pedestrian-friendly environment that makes walking pleasant and safe through the provision of good quality and attrac-tive pedestrian infrastructure with continuous, well-maintained, wide, and free from obstructions pedestrian walkways and greenspaces (Kowaleski-Jones et al. 2018; Brookfield 2017). Labdaoui et al. (2021) added that the careful design of these microscale measures makes them more conducive to comfortable walking. These involve main facilities, such as the ramps and sidewalk dimen-sions, encouragement facilities such as lighting posts, seating benches, soft and hard scape landscaping, and finally the convenience facilities such as toilets and drink-ing fountains.
Assessing walkability measuresAssessing walkability macroscale and/or microscale measures has been a concern for researchers and urban developers alike. Frank et al. (2021) affirmed that after almost 30 years of research about how walkability could be measured, there is still inconsistency of these research results that could be attributed to the usually conflict-ing used methods. This makes it hard to interpret and compare findings of these research works. The differ-ences among the adopted walkability measuring research methods include the use of perceived or objective envi-ronmental data, the selected spatial buffering techniques, and the sort of data used to assess types of amenities and their locations, and the scale of urban development. This, as claimed by Frank et al. (2021), has resulted in con-tradictory results leading to significant confusion over what policies should be adopted to promote walkability. So, this affirms the need for a proper objective measure-ment tool of walkability in the built environment. This research is a humble attempt to contribute to responding to this need, even partially. In the following section the currently utilized microscale and macroscale walkability assessment tools are briefly reviewed.
Walkability microscale and macroscale assessment toolsMicroscale walkability measures have been assessed through some various tools as summarized by Labdaoui et al. (2021). First is the Path Environment Audit Tool (PEAT) which utilizes various fine-grain level walkabil-ity indicators, but it lacks several comfort indicators such as sidewalk dimensions and materials, and natural shad-ing. Second is The Walking Suitability Assessment Form (WSAF) which examines a limited number of walkability
indicators including the presence of trees and street light-ing. Third is The Neighborhood Environment Walkability Survey (NEWS) which is mostly used in survey question formats but still does not cover all pedestrian comfort aspects. Fourth is the Pedestrian Environment Data Scan (PEDS) tool that consists of a wide range of indicators but still misses various comfort issues. Fifth is the Neigh-borhood Sidewalk Assessment Tool (NSAT), which con-centrates on comfort indicators that cover the needs of pedestrians with different physical abilities. Sixth is, the pedestrian level of service (PLOS) which assess the qual-ity of the street pedestrian realm. These various neigh-borhood microscale level tools have been used to satisfy the objectives of certain research as relevant.
For assessing walkability macroscale measures on the neighborhood level, Rundle et al. (2019) mentioned The Built Environment and Health-Neighborhood Walkabil-ity Index (BEH-NWI) as an assessment tool which can be utilized for local communities across the USA. The indi-cators in this tool are based on historical data between 1990 and 2010 for the gross population density that reflects the concentration of services and public transit in close proximity, street intersection density as an indicator of street network connectivity, and destination accessibil-ity including access to transportation nodes. The web-based walk scoring is another important tool assessing walkability macroscale indicators usually through quan-titative parameters including intersection density, popu-lation density, and distance from amenities (Annunziata et al. 2020 and Garau et al. 2020). Walk scoring is usu-ally utilized in assessing “walking friendless” in the design process of neighborhoods (Sustainable Design Lab 2020). As an example of these web-based walk scoring tools, the Street-Smart Walk Score (SS-WS) revealed that resi-dents living in neighborhoods with the highest walkabil-ity scores managed to meet physical activity guidelines over three times more than the neighborhoods which with lowest walkability score. Moreover, it has been found that when people moved to a neighborhood with a 10-point higher SS-WS had increase in transport walking by 16.04 min per week and a decline in their Body Mass Index (Frank et al. 2021).
In 2007, Walk Score, a free, publicly available web-based tool, was founded in the USA to promote walka-ble neighborhoods and to make it easier for individuals to evaluate walkability and transportation options in a given area (Brown 2015). Walk Score is calculated using quantitatively measurable macroscale indicators such as the types and numbers of provided amenities, catchment distances to these amenities, neighborhood block lengths, and the density of street intersections. Using a decay function, Walk Score first assigns a raw score to each location based on its network distances
Page 4 of 26Galal Ahmed and Alipour City Territ Archit (2021) 8:12
from homes to destinations such as grocery shops, restaurants, bookstores, banks, schools, fitness cent-ers, and parks within 1 mile (about 1.60 km) from that location. These raw scores are then normalized from 0 to 100 with adjustment of two street network meas-ures around each location, namely, street intersection density and block length. Higher walkability scores mostly represent areas with more local destinations nearby, where walking is an easy option for shopping and errands. The Walk Score Index assigns a walkabil-ity score to each property on a scale of 0–100 (Brown 2015). As a benchmark, a neighborhood with a Walk Score below 25 is considered a fully car dependent neighborhood, while neighborhoods with scores ranges of 25–49, 50–69, 70–89, and 90–100 are suggesting mainly car-dependent, partially walkable, very walk-able, and walkers’ paradise neighborhoods respectively (Koschinsky et al. 2017; Foundry 2018; Score 2019).
As an indication of the validity of utilizing Walk Score as a tool for assessing walkability macroscale measures, several studies have revealed positive associations of Walk Score with actual walking for transport and with recreational physical activity in small towns. A negative associations of Walk Score with body mass index was also observed (Koohsari et al. 2018). In the USA, walk-ability is continuing to be a more prevalent factor in both home buying decisions and the placement of new busi-nesses. So, Walk Score is currently considered a helpful tool for planners, realtors, and community members to depict a picture about the community’s transportation options (Brown 2015; Trimarchi 2018). Moreover, the Walk Score tool appears to be a valid measure of neigh-borhood’s macroscale walkability indicators outside the USA and Canada, where it is originally applied. In a very recent research, significant positive correlations were observed between the Walk Score tool and environmen-tal attributes relevant to walking in Japan (Koohsari et al. 2018).
While there are various guidelines and regulations related to the microscale walkability measures for the urban design of neighborhoods in the United Arab Emir-ates (UAE), such as Abu Dhabi Street Design Manuals (Abu Dhabi Urban planning Council 2015) and some Form-based Code research work (Arwa and Khaled 2019), but unfortunately the macroscale walkability measures related to the pedestrian network design and the neighborhood morphology and planning have not received similar attention. From another perspective the Walk Score tool cannot be used locally in the UAE because it is tailored to assess walkability macroscale measures in specific urban contexts. So, as discussed in the following section, the research explored a recently developed reliable walk scoring tool that is customizable
to the local urban contexts in terms of the macroscale walkability indicators.
UMI walkscore: a proper walkability macroscale measures scoring toolUrban Modeling Interface (UMI) Walkscore is the mac-roscale walkability scoring tool within the UMI computa-tional simulation plugin for Rhinoceros 3D software. The free for researchers and consultants UMI plugin was ini-tially released by the Sustainable Design Lab of the Mas-sachusetts Institute of Technology (MIT) in 2013 and was developed with support from a National Science Founda-tion EFRI_SEED project, the MIT Energy Initiative, the Kuwait-MIT Center, the Center for Complex Engineer-ing Systems (CCES) at KACST and MIT and Transsolar Climate Engineering. Its latest version (V2.6) has been recently released. The UMI Walkscore record ranges between 0 and 100 and is calculated by constructing a pedestrian travel network and performing a series of shortest-path calculations using Dijkstra’s algorithm. By default, the algorithm tests points of interest for proxim-ity to (customizable) nine North American common local community amenities, namely; schools, restaurants, cafe shops, shopping center, entertainment, parks, banks, and grocery.
The Minimum Catchment Distance in meters ‘MinD-istanceInMeters’ and the Maximum Catchment Distance in meters ‘MaxDistanceInMeters’ are customizable values that should be defined in the UMI plugin. The ‘MinDis-tanceInMeters’ is the distance at which penalties begin to be applied. Its default value of 400 m means that walking trips of 400 m or less receive perfect scores. Meanwhile, ‘MaxDistanceInMeters’ specifies the maximum distance people are willing to walk at all and thus, trips longer than this value will be ignored while trips with lengths close to this value will still receive very low scores. The standard accessibility indicator of walking distances in the UMI Walkscore is set between a quarter mile (400 m) to one and a half miles (2400 m) from houses to the pro-vided local amenities. These values, which been proven to be a good indicator of “walking environments” in the USA, are customizable where they could be easily changed to be more proper for other urban environment such as those with hot climates. In the UMI Walkscore, a polynomial distance decay function is used for assign-ing scores according to the distances between each house entrance and amenities (Sustainble Design Lab 2020).
In addition, each of the types of locally provided amen-ities has a dedicated layer generated in Rhinoceros 3D and is given four (customizable) parameters affecting the walkability scoring: Name, Uses Parks, Destination Weight, and Global Weight. ‘Uses Parks’ is expressing the allocated the layer of the parks of the neighborhood
Page 5 of 26Galal Ahmed and Alipour City Territ Archit (2021) 8:12
in the software. Unlike the ‘explicit’ customizable mac-roscale urban planning measures of the neighborhood land-use, including the types of amenities and their catchment distances, the Destination Weight and Global Weight are considered as two ‘implicit’ parameters and both are customizable depending on the urban con-text. The ‘Global Weight’ is defining the relative impor-tance of each amenity category. In the default software plugin, amenities of restaurants and groceries are having a Global Weight value of 3, while shopping centers and schools are assigned Global Weight values of 2 and 1 respectively (Sustainble Design Lab 2020). On the other hand, the ‘Destination Weight’ is another parameter that defines the number of the required destinations to achieve a perfect score for a specific amenity’s category, in a JSON array format. It also considers the impact that distances to those destinations would have on the score gained by each amenity’s category. Each amenity’s desti-nation is assigned a Destination Weight value of 1. If the number of the required amenities for a specific category is more than 1, then the Destination Weight values would have relative weights. For instance, if the cafe shop cat-egory requires 2 destinations to gain a perfect score, then the Destination Weights of them might be 10, 6. This sim-ply means that the gained score for the walk to the nearer cafe shop would be 10/6 of the walk score assigned for the walk to the farther café (Sustainble Design Lab 2020).
With all its above-mentioned walkability indicators, the UMI’s Walkscore could be considered as an ideal measuring tool for macroscale walkability in the case of Emirati neighborhoods, because it goes beyond the con-ventional macroscale measuring methods, which mainly rely on calculating catchment distances and street con-nectivity for assessing walkability. Such conventional methods might be misleading in some street network configurations. For example, loop and dead-end streets intersections do not improve connectivity despite their contribution to street intersection density (EnviroAtlas 2019). On the other hand, an important advantage of the UMI Walkscore tool over other walkability scoring tools, such as the web-based Walk Score discussed in “Walk-ability microscale and macroscale assessment tools” Sec-tion above, is that it allows for more accurate assessment for walkability through adding customizable relevant ‘weights’ and catchment distances to the locally provided amenities.
Research problem and questionsIn the last few years, the UAE’s federal and local gov-ernments have adopted sustainable development plans in various sectors. In specific, the building and urban development sectors have witnessed several sustain-ability initiatives. Estidama (sustainability in Arabic), is
the most important initiative where the Estidama Pearl Community Rating System (PCRS), was developed to help achieve livable and sustainable built environment (Abu Dhabi Urban Planning Council 2019). Another initiative is the Abu Dhabi National Housing Guide-lines for Integrated Communities (Abu Dhabi Housing Authority 2016). In these, and maybe all other initia-tives, realizing HPT friendly urban communities was an essential pillar through calling for the transition from the conventional unsustainable private car dependent sprawling communities to more compact urban form designs that encourage the utilization of all means of HPT, especially walkability.
It is maintained that the denser and more compact urban forms of the recent designs of urban neighbor-hoods in the UAE have considered sustainable urbanism principles including the provision of walkability infra-structure and networks. But, except the conventional tools for assessing walkability of neighborhood designs such as measuring catchment distances, block lengths, street network connectivity, there is a lack of a reliable and comprehensive evidence that can assess the expected effectiveness of these urban compact designs on walk-ability, while still in the design stage, and hence define the different aspects affecting it. As discussed above the UMI Walkscore tool seems capable in satisfying this need. A very recent research (Khaled 2020) has attempted to uti-lize the UMI’s Walkscore tool to investigate the relation-ship between urban compactness and both walkability and bikeability, in the UAE. Unfortunately, this research has only used FAR as a sole indicator leaving behind examining the effect of other walkability macroscale influential factors including morphological measures such as block length, street intersection density, link-to-nodes ratio. Also, the research only examined one recent neighborhood design, which would not make its results sufficiently indicative with the lack of a broader evidence. More importantly, the research has not provided enough interpretation for the recorded UMI Walkscores.
To achieve the research objective of assessing the impact of urban morphology compactness on UMI Walkscore of the recent designs of Emirati neighbor-hoods, and interpreting the impact of the macroscale Walkability indicators on the recorded scores, the research poses three main questions as follows:
1- What are the customized UMI Walkscore vari-ables for the case of the Emirati neighborhoods.2- What are the UMI Walkscore results, in com-parison to Walkscores benchmarking, for the recent designs of the denser and more compact Emirati neighborhoods, especially when compared to the conventional urban sprawling model?
Page 6 of 26Galal Ahmed and Alipour City Territ Archit (2021) 8:12
3- How do the walkability macroscale measures of both urban morphology and urban planning affect the obtained UMI Walkscores for the assessed neighborhoods? The design’s urban morphological measures are related mainly to pedestrian mobility network including FAR, Block Length, Street Con-nection Density, and Link-to-nodes ratio. The macro-scale urban planning measures include related land-use indicators of the types and numbers of provided amenities, their locational distribution, Destina-tion and Global Weights, as per the UMI Walkscore plugin.
Answering the research questions will help bridge the current gaps through perceiving the impacts that the macroscale indicators might have on walkability attain-ment/impediment in all the recent denser and more compact urban form deigns in Abu Dhabi and Dubai Emirates where they are being mostly developed. Also, this would lead to the readjustment of the macroscale indicators, while still in the design phase to enhance walkability in urban neighborhoods in the UAE and maybe other similar urban contexts in the region, to posi-tively contribute to the attainment of their sustainability goals. While the research outcomes are expected to pro-vide good qualitative assessment through the calculated UMI Walkscores that takes into consideration essential macroscale walkability indicators, it is worth mentioning that the research did not investigate other possible mac-roscale walkability measures that might be missed from the UMI Walkscore tool’s variables. In addition, with its focus on walkability macroscale measures, the microscale fine-grain urban design measures, albeit very important, is not discussed here as they are outside the scope of this research and deserve their own dedicated investigations in further research.
Research method and toolsTo meet the research objective and to answer its three posed questions, a quantitative case study method with multi-tools was utilized. But before applying the UMI Walkscore simulation on the case studies of the recent denser and more compact Emirati neighborhoods designs and comparing the recorded scores with a model design for a conventional urban sprawling neighborhood, the UMI Walkscore variables should be customized to be proper for these UAE neighborhoods’ context. First, to customize the UMI Walkscore variables of the types of provided amenities on the neighborhood level, their prospective catchment distances, and their Destination and Global Weights, the locally developed guidelines and regulations for urban neighborhoods in Abu Dhabi and Dubai Emirates were carefully reviewed for developing a
set of these UMI Walkscore customized variables. Other Emirates are usually following these guidelines as they lack their own ones, so far. These guidelines were devel-oped by the concerned urban development authorities in the two Emirates. In Abu Dhabi, most of the walkability related guidelines were issued by Abu Dhabi Urban Plan-ning Council (ADUPC) and are included in Abu Dhabi Community Facility Planning Standards Report (Abu Dhabi Urban Planning Council 2014a) and Abu Dhabi Public Realm Design Manual (Abu Dhabi Urban Plan-ning Council 2014b). In addition, Abu Dhabi Housing Authority (2016) issued Abu Dhabi National Housing Guidelines for Integrated Communities. Meanwhile, the Community Facilities Standards issued by the Planning Department (2018) was the main document developed for this purpose in Dubai.
According to Abu Dhabi’s Standards and Guidelines, the community facilities are linked with a correspond-ing community facilities hierarchy level (Fig. 1). So, for neighborhoods of 2000 residents or below no community facilities are required! But, for neighborhood populations between 2000 and 5999 residents, ‘Per Capita’ approach is recommended to calculate the number of schoolchil-dren and to determine which community facilities must be provided. For example, 1 KG + Primary School (Edu-cational Cycle 1) is needed for 14.9% of the population (1200 students), one Intermediate School (Educational Cycle 2) is needed for 6.9% of the population (1200 stu-dents), and one Secondary School (Educational Cycle 3) is needed for 5.5% of the population (1200 students). So, based on the population numbers, the type and num-bers of amenities should be decided on the neighbor-hood, district, and sub-regional levels. Meanwhile, for neighborhoods with 6000–10,000 residents, community facilities should be provided at the Neighborhood Cen-tre besides the Non-center community facilities (Fig. 1). The Neighborhood Center is assumed to serve the basic day-to-day needs of a community for religious, conveni-ence retail and recreational services. The required facili-ties include community support center, health clinic, nursery, and community police point. Non-center com-munity facilities must be provided but do not need to be located within a specific center. Non-center facili-ties have different thresholds for provision compared to the set population levels in the Neighborhood, District and Sub-regional Centers. For example, the provision of schools is based upon the number of schoolchildren in a neighborhood development proposal while a hospital, a police station, a petrol station is required on a District or a Sub-regional level depending on the number of resi-dents. The standards table in Fig. 1 also incorporates, at the end, Optional Facilities that can be provided depend-ing upon the outcomes defined by the master planner or
Page 7 of 26Galal Ahmed and Alipour City Territ Archit (2021) 8:12
developer. As for catchment distances, according to Abu Dhabi Community Facility Planning Standards, there is a need to provide Neighborhood Centers within a maxi-mum 700 m walk of all residents (Fig. 2). Meanwhile, the
appropriate catchment distance to neighborhood facili-ties is defined by 350 m in the Abu Dhabi National Hous-ing Guidelines for Integrated Communities (Fig. 3) (Abu Dhabi Housing Authority 2016).
Fig. 1 Community amenities hierarchy guidelines in Abu Dhabi ( Source: Abu Dhabi Urban Planning Council 2014a)
Fig. 2 Catchment distance for neighborhood centers in Abu Dhabi Community Facility Planning Standards ( Source: Abu Dhabi Urban Planning Council 2014a)
Page 8 of 26Galal Ahmed and Alipour City Territ Archit (2021) 8:12
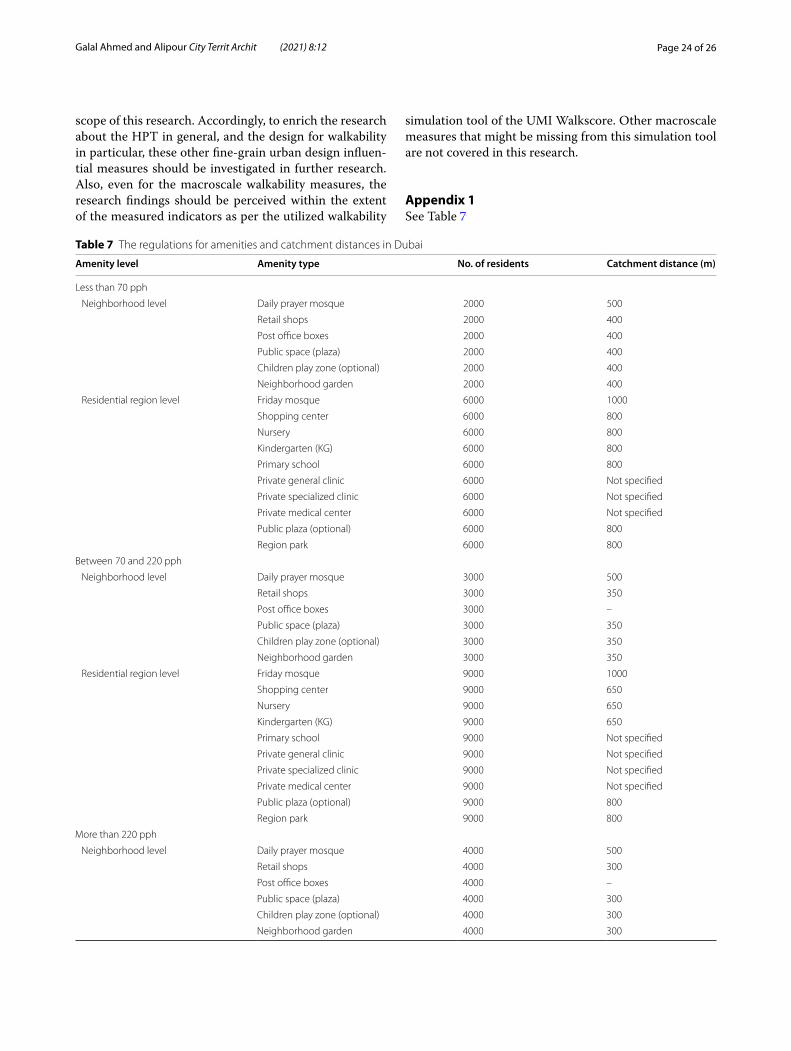
In Dubai Emirate, there is a significantly different approach for the regulations of amenities and catch-ment distances. First, there are two categories of devel-opment, the Neighborhood Level (from 2000 to 6000 residents) and the Region/District Level (from 6000 to 12,000 residents). In each of these two categories, there are three classifications based on the population density (Appendix Table 7). The first is dedicated to low population density of less than 70 person per hec-tare (pph), the second is for population densities rang-ing between 70 and 220 pph, and the third is for those above 220 pph. The types of the provided amenities are fixed for these classifications in each category, but they are just different in numbers and catchment distances that range between 400 and 1000 m for the first density classification, from 350 to 1000 m for the second cat-egory, and from 300 to 1000 m for the third one. Also, the provision of all amenities is mandatory except for the Children Play Zone in the first category (Neighbor-hood Level) and for Public Plaza in the second category (Region/District Level) (Appendix Table 7).
Apparently, the current guidelines and regulations in both Abu Dhabi and Dubai Emirates have significant differences, in a way that made it difficult to initiate a customized list of amenities and their related catch-ment distances based on them alone. Instead, the land-use plans of the investigated neighborhoods, as detailed later, were consulted to bridge this wide gap, especially in terms of the types and numbers of amenities. The same approach was adopted for defining the ‘minimum’ required numbers of each type of the defined amenities and their appropriate catchment distances. Ultimately, as shown in Table 1, the customized list of the ameni-ties’ types, minimum required numbers, and maximum catchment distances were developed, with some obvi-ous inevitable subjectivity. The suggested catchment dis-tances to the defined amenities ranged between 350 and 800 m, i.e., from about 5 to 10 min’ walk. These are close, as much as possible, to both the locally and internation-ally recognized catchment distances, as discussed above.
After defining the types and minimum number of required amenities, and their related catchment
Fig. 3 Catchment distance for neighborhood facilities in Abu Dhabi National Housing Guidelines for Integrated Communities ( Source: Abu Dhabi Housing Authority 2016)
Page 9 of 26Galal Ahmed and Alipour City Territ Archit (2021) 8:12
distances, the Global Weights and the Destination Weights of each amenity’s type were defined and cus-tomized in the UMI’s plugin. With the lack of any other reliable resource, the Global Weighting measures were mainly defined based on the results of brief consulting interviews with 6 urban planning experts and research-ers at the United Arab Emirates University. The inter-viewed planning experts were selected based on their prior experience in neighborhood planning in the UAE. They were simply asked about the “degree of impor-tance” of each of the types of the defined amenities, which was interpreted into Global Weights. As a result, the Mosque, Grocery, Kindergarten, Restaurant/Cafe Shop, and Pharmacy came first with a Global Weight of 3, followed by the Neighborhood Park, School and Convivence Retail with a Global Weight of 2. lastly came the Clinic and other types of amenities, if any, with a Global Weight of 1. Meanwhile, Destination Weights were rationally defined as per the numbers of each type of the amenities (Table 2).
After defining the customized types and numbers of local amenities, their catchment distances, and their Global and Destination Weights, digital models for the amenities’ buildings and lots, houses, and the overall neighborhoods plots were developed showing the plots boundaries and the open space/street grid of each case study. To facilitate the UMI Walkscore simulations, the pedestrian mobility networks was drawn, while each amenity was accurately located, and the customized amenities’ values were uploaded as identified in Tables 1, 2. After undertaking all the pre-simulation steps, the walkability computational simulations were conducted.
The case study quantitative method in which a conven-tional model design of an urban sprawling neighborhood (Al Dhaher neighborhood in Al Ain city (N1), Abu Dhabi Emirate) and the six recent claimed to be ‘sustainable’ designs of Emirati citizens neighborhoods, with their varying but denser and more compact urban morpholo-gies, were analyzed. The selected neighborhoods designs are showcasing the recent design trend in Abu Dhabi and Dubai Emirates, where the urban sustainability initiatives are more prominent, if compared with other UAE’s Emir-ates. They are Al Falah South (N2), Al Falah North (N3), and Watani 1 (N7) in Abu Dhabi city; Al Ghreiba (N4) and Shubat Al Woutah (N6) in Al Ain city; and Oud Al Muteena (N5) in Dubai. Figure 4 illustrates the geograph-ical locations for these neighborhoods.
Al Dhaher neighborhood in Al Ain is selected as an obvious design model of the conventional sprawl-ing urban form and low population density designs that were frequently developed in the UAE since the 1970s until almost the mid-2000s where such urban sprawls were slowly replaced by more compact and denser urban forms (Khaled 2020) (Fig. 5). Al Dhaher was designed in 2002 on a rectangular-shape lot with an area of about 285 hectares (ha). The areas of the neighborhood’s 460 two-story detached houses plots ranged between 45 × 60 m and 45 × 45 m. The estimated accommodated total pop-ulation is 3312 persons with a gross population density of as low as 11.02 pph. In the design, the housing plots are arranged in clusters of various numbers range from 10 to 16 plots congregated around communal open spaces. The main ‘gradually’ provided amenities are 9 mosques, 2 schools, a clinic, and retail shops located on both the longitudinal axial spine of the neighborhood and on its outer fringes.
Meanwhile, the designs of the six recent neighborhoods have been claimed to be sustainable with a main differ-ence form the conventional urban sprawling model in having more compact urban forms and higher population density. Table 3 summarizes the background informa-tion and the urban characteristics of the designs of these neighborhoods including their land-use plans, numbers,
Table 1 Customized types and numbers of amenities, and their catchment distances for Emirati neighborhoods
Type (Minimum) needed number
Maximum catchment distances (m)
1 Cafeteria 5 800
2 Grocery 3 600
3 Pharmacy 1 800
4 Retail 5 800
5 Primary school 1 800
6 Kindergarten 2 350
7 Mosque 1 800
8 Clinic 1 800
9 Green spaces 1 800
10 All others 1 800
Table 2 Weighted amenities in the studied neighborhoods
Type Global weight Destination/local weight
1 Cafeteria 3 10, 8, 6, 4, 2
2 Grocery 3 5, 3, 1
3 Pharmacy 3 1
4 Retail 2 10, 8, 6, 4, 2
5 Primary school 2 1
6 Kindergarten 3 5, 3
7 Mosque 3 1
8 Clinic 1 1
9 Green spaces 2 1
10 All others 1 1
Page 10 of 26Galal Ahmed and Alipour City Territ Archit (2021) 8:12
areas and types of dwellings, number of population and population densities, types and numbers of provided amenities and their locational distribution patterns. The degree of urban compactness and density of the stud-ied neighborhoods were analyzed through defining both the morphological characteristics including FAR, Street Intersection Density, Link-to-nodes ratio, as well as the expected gross population density calculated by divid-ing the total development area in ha over the expected number of population. The FAR was calculated for each studied neighborhoods through the UMI plugin soft-ware and the block lengths were mainly measured form the design drawings. Meanwhile, the street connectivity, was figured out through calculating two measures using simple formulas. First, is the Street Intersection Density of the street/pedestrian networks where the intersection density equaled the total number of street intersections (including dead ends) divided by the total neighborhood area in square kilometers. Second, is the Link-to-nodes ratio which equals the total number of road segments between intersections divided by the total number of
intersections including dead ends. Normally, the Street Intersection Density is utilized as a measure of network compactness, while the Link-to-nodes ratio is considered as a measure of network connectivity. But in practice, the Street Intersection Density is often used for measuring street network connectivity as well. It is maintained that in most cases, but not always, a high Street Intersection Density corresponds to a more walkable neighborhood as it indicates high accessibility to destinations (EnviroAtlas 2019). Moreover, a Link-to-nodes ratio of 1.40 or higher is usually used as the threshold of high street connectiv-ity (CNU 2019).
After accomplishing the above-mentioned steps, the UMI Walkscore simulation was performed on all the ana-lyzed cases and were compared to the established bench-mark for this score. Lastly, the analysis of the impact of the walkability macroscale morphological and urban planning measures on the obtained UMI Walkscores was performed. The analyzed morphological meas-ures included the calculated FARs, Street Intersection Density, Link-to-nodes ratio, and expected population
Fig. 4 The geographical locations of the case studies neighborhoods in Al Ain, Abu Dhabi and Dubai Cities, UAE
Page 11 of 26Galal Ahmed and Alipour City Territ Archit (2021) 8:12
density. Meanwhile, the analyzed macroscale urban planning measures included both the explicit indicators of the land-use (Types and Numbers of amenities, their locational distribution and catchment distances) and the Implicit indicators of the Global and Destination weights. The results of these simulations as presented in the fol-lowing sections.
ResultsMacroscale urban morphology indicators for the assessed neighborhoodsAs shown in Table 4, the experienced significant changes in the walkability macroscale morphologi-cal measures in the recent more compact and denser neighborhoods designs, if compared with the con-ventional urban sprawling neighborhood model (N1), could be represented in, first, the increased popula-tion density from 11.02 pph in the N1 to as maximum as 48.34 pph in the N7 case. The only exception was in N2 neighborhood with only 10.51 pph. Second, is the increased values of both the FAR and street network connectivity, though not consistent in all cases. The maximum FAR and Street Intersection Density values were noticed in N7 which reached to 0.41 and 197.22/km2 respectively, compared with only 0.11 and 40.20/km2 in the N1 urban sprawling N1 case. One exception again is N2, which despite having bigger FAR value of
0.18 than N1 but has slightly less value for the Street Intersection Density of 39.78/km2 than N1. The Link-to-nodes ratios have not changed significantly in the new neighborhoods’ designs, while the Block Lengths have partially decreased in all recent cases if compared to N1 neighborhood, except in N2, as well.
So, all in all, for all recent neighborhoods designs the increase of population density and urban morphology compactness (represented in the FARs and the Street Intersection Density), was noticeably significant with only one exception of N2, if compared with the earlier generation of conventionally designed neighborhoods in the UAE, such as Al Dhaher neighborhood. But, although all neighborhoods are allocated for Emirati citizens in a form of single-family housing, the population density and the degree of both compactness of these recent neighbor-hoods’ designs were also inconsistent and widely varied among the studied six cases. A big difference was noticed as well in the form of the street/pedestrian networks that varied among orthogonal grid, curvilinear grid, and a mixture of both. This has been reflected on the calculated street connectivity measures including Intersection Den-sity and the Link-to-nodes ratio. Meanwhile, little change was evident in the provided types of amenities in the new recent designs compared to the conventional case. Still, the densification of amenities was inconsistently varying among the studied cases, except the green open spaces
Fig. 5 Neighborhood N1: Al Dhaher, representing the sprawling urban morphology in the UAE
Page 12 of 26Galal Ahmed and Alipour City Territ Archit (2021) 8:12
Table 3 The land-uses and urban characteristics of the selected case studies
Case Study
Background Information Land-Use Plans
)ibahD
ubA(
htuoShalaFl
A.2N
Purpose: Social Housing Project for CitizensDeveloper: Abu Dhabi MunicipalityCompleted: 2005
Total Number of Houses: 785Total Area: 538 HectaresTotal Population: 5,652 PersonGross Population Density: 10.51 pph
Housing Type: G+1 Single Family HousePlot Sizes: 45 x 45m & 45 x 60mHousing Sizes: 963 m2 & 1181 m2
Purpose: Social Housing Project for CitizensDeveloper: Abu Dhabi MunicipalityConstruction Started: 2009, and first hand-over in 2012.
Total Number of Houses: 1010Total Area: 352 HectaresTotal Population: 7,272 PersonGross Population Density: 20.66 pph
Housing Type: G+1 Single Family HousePlot Sizes: 30 x 32m / 30 x 45mHousing Sizes: 477 m2 / 501 m2 / 582 m2
Plot Arrangements: Back-to-Back.
Number of Amenities: 3 Cafeteria, 4 Grocery, 2 Pharmacy, 3 Retail Units, 2 School, 1 Kindergarten, 5 Mosque, 1 Clinic, 13 Green Space.
)niA l
A( abierhG l
A .4N
Purpose: Social Housing Project for Citizens Developer: Abu Dhabi Municipality Completed: 2014 Total Number of Houses: 636 Total Area: 140 Hectares Total Population: 4,579 Person Gross Population Density: 32.72 pph Housing Type: G+1 Single Family House Plot Sizes: 30 x 36m Housing Sizes: 420 m2 / 500 m2 Plot Arrangements: Back-to-Back and Clustering around Pocket Parks. Amenities: 3 Cafeteria, 4 Grocery, 1 Pharmacy, 2 Retail Units, 1 School, 1 Kindergarten, 2 Mosque, 0 Clinic, 45 Green Space.
Page 13 of 26Galal Ahmed and Alipour City Territ Archit (2021) 8:12
Table 3 (continued)
)iabuD(
aneetuMl
Adu
O.5N
Purpose: Social Housing Project for CitizensDeveloper: Muhammed Bin Rashid Housing EstablishmentCompleted: 2016
Total Number of Houses: 1,596Total Area: 239 HectaresTotal Population: 11,491 PersonGross Population Density: 48.11 pph
Housing Type: G+1 Single Family Houseand G+1 Town HousesPlot Sizes: 25 x 30m / 25 x 35mTown House: 12 x 14mHousing Sizes: 309 m2/ 445 m2 / 554 m2
Fig. 6 Comparing UMI Walkscores for the conventionally designed urban sprawling neighborhood-Al Dhaher (N1) vs the six denser and more compact case studies
Page 16 of 26Galal Ahmed and Alipour City Territ Archit (2021) 8:12
urban sprawling form, reached 49. While this is indicat-ing a ‘Car-Dependent’ neighborhood, it still touches the benchmark Walkscore of 50–69 for ‘Somewhat Walkable’ neighborhoods. In Fig. 7 that shows color coded results of the UMI Walkscore simulation for all studied neigh-borhoods (the greener the better score), it is shown that
Fig. 7 Visual diagrams for the results of the computational simulations for the average UMI Walkscores for the urban sprawl (N1), and the urban compact case studies (N2–N7) (the greener the color, the better the score)
which were increased in most of the designs of the recent neighborhoods, especially in N7.
Recorded UMI walkscoresAs shown in Fig. 6, the recorded UMI Walkscore for Al Dhaher neighborhood (N1), with its conventional
Page 17 of 26Galal Ahmed and Alipour City Territ Archit (2021) 8:12
several houses in neighborhood N1, especially in the bot-tom section, are apparently getting lower Walkscores. Meanwhile, the UMI Walkscore simulation for the designs of the six denser and more compact case studies resulted in Walkscores ranging between 41 to 57 [41 Oud Al Muteena (N5), 43 Shubat Al Woutah (N6), 47 for Al Falah South (N2), 50 for Watani 1 (N7), and 57 for both of Al Falah North (N3) and Al Ghreiba (N4)].
The recorded scores indicate that three neighbor-hoods (N2, N5 and N6) are categorized as ‘Car-Depend-ent’ neighborhoods and the other three (N3, N4, and N7) are considered ‘Somewhat Walkable’ neighbor-hoods. As depicted in Fig. 7, several houses in all the six neighborhoods are considerably receiving low UMI Walkscores. This means that residents would be relying chiefly on their own cars in their mobility within their neighborhoods.
DiscussionWhile the correlation between the macroscale urban morphological and planning measures, on the one hand, and the UMI Walkscore results on the other hand, could be individually investigated for each neighborhood, still, it is believed that the comparison among all neighbor-hoods will give some overall insights about the effect of the designed urban form qualities, including those related to urban compactness, on the degree of achiev-ing satisfactorily UMI Walkscores. In the following two sections the relationships between the obtained UMI Walkscore and the two sets of the walkability macro-scale urban measures are discussed, to reveal the walk-ability macroscale measures that most affected the UMI Walkscores, thus, achieve the main research objective.
Impacts of macroscale urban morphological indicators on UMI walkscoreTable 5 illustrates the comparative correlations between the UMI Walkscore simulation results and the main urban morphology compactness indicators of the FAR
and Street Connectivity (Street Intersection Density and Link-to-nodes ratio), for each of the designs of the stud-ied neighborhood. It also presents the expected Gross Population Density in these designs.
It is unexpectedly divulged that the calculated UMI Walkscore in the urban sprawling case study of Al Dhaher (N1), despite its less dense/compact urban form, was slightly better, in average, than the cases of the denser and more compact urban forms of Al Falah South (N2), Oud Al Muteena (N5), and Shubat Al Wou-tah (N6). One would expect the results to be the opposite especially with the more compact urban forms that pre-sumably would lead to more proximity of amenities and eventually more walkable neighborhoods, i.e. with higher UMI Walkscores. The design of Watani 1 Neighbor-hood (N7) with its highest estimated population density, and urban form compactness, resulting from the highest FAR (due to decreasing the housing plot sizes) and Street Connectivity measures, achieved a UMI Walkscore value of only 50, while the most urban sprawling neighborhood (N1) with its lowest population density and lowest urban form compactness with a FAR of only 0.11 and a Street Intersection Density of only 40.20, achieved almost the same UMI Walkscore value (49). So, if the neighborhood with the best compact urban form (N7) is not performing as much better as the lowest compact urban sprawling case (N1), then the compact urban morphology indica-tors with the high FAR and Street Connectivity values are not sufficient macroscale factors leading to enhancing walkability.
For the walkability macroscale urban morpho-logical measures per se, it seems that for the recent neighborhoods’ designs little attention was paid to the significant effect of the two street network con-nectivity measures of Street Intersection Density and the Link-to-nodes ratio. For example, the calculated Street Intersection Density for N4 neighborhood was 126.429/km2. And its calculated Link-to-nodes ratio was 1.424. For N5, which has the same FAR (0.26),
Table 5 Macroscale urban morphological measures and the recorded UMI Walkscores
Neighbor Total area (ha) Total estimated population
Page 18 of 26Galal Ahmed and Alipour City Territ Archit (2021) 8:12
these figures came significantly lower as follows: 89.121/km2 for the former and 1.319 for the later (Table 5). On the other hand, regardless of the urban form pattern (orthogonal, curvilinear, or mixed), the effect of the Block Length seems to be more sig-nificant. It was spotted that the best UMI Walkscore of 57 was recorded for N4 with its least block length of 90–150 m, while the worst UMI Walkscore was recorded for N5 with its block length of 250–275 m, both with the same urban compactness indicators of FAR (0.26) but with N4 having much Street Inter-sect Density of 126.43/km2, which is directly corre-lated with Block Lengths. As shown in Figs. 8, 9a, b, these inconsistent considerations for proper walk-ability macroscale urban morphological indicators in the recent designs of the Emirati neighborhoods are depicted in the correlations between the recorded Walkscores on the one hand, and these indicators, as the measures for network compactness and connectiv-ity, on the other hand.
Therefore, it could be concluded that while the urban density and compactness were significantly increased in at least some of the newly designed neigh-borhoods, the related urban morphology indicators were not influential enough in enhancing the obtained UMI Walkscores as they were not consistently consid-ered in these designs.
Impacts of macroscale urban planning indicators on UMI walkscoreThis section discusses the impacts of the other set of the walkability macroscale measures; the urban plan-ning explicit and implicit indicators as defined in the
UMI plugin customized variables, on the recorded UMI Walkscores for the analyzed neighborhoods’ designs.
As detailed in Table 6, the explicit macroscale urban planning indicators (including Land-use factors: the types and numbers of amenities, the amenities loca-tional distribution in the neighborhood plan and their catchment distances), and the implicit macroscale urban planning measures (including Global and Destination Weights, seem to play a significant role in enhancing the recorded UMI Walkscores. For example, N7 that has the best indicators for urban morphological compactness, is having almost as low UMI Walkscore as N1 (the urban sprawling case), where it has an absent amenity (clinic) and a lower number of amenities than those with higher numbers of amenities such as N4 and N5, besides of course the Destination and Global Weights of the pro-vided amenities. The more the available types and num-bers of amenities, as well as the better locations of them in the neighborhood plan (mixed between the center and the edges of the neighborhood) reduces the catch-ment distances and thus increases the UMI Walkscore. This was noticed in N1 sprawling neighborhood rather than N7, where, strangely, N7 with its highest population density (48.34 pph) has almost the least types and num-bers of amenities, and also the least efficient distribution of them as they are mostly located by the edges of the neighbourhood plan.
As shown in Table 3; Fig. 7 above, the apparent inap-propriate locational distribution of the neighborhood amenities, even when more than enough number of amenities were locally provided (Table 6), has nega-tively affected the recorded UMI Walkscores. This is evi-dent in almost all studied neighborhoods, especially N5.
Fig. 8 Correlation results between the urban compactness ratio (FAR) of the case studies vs their simulated UMI Walkscores
Page 19 of 26Galal Ahmed and Alipour City Territ Archit (2021) 8:12
Obviously, the applied ranges of the catchment distances (between 350 and 800 m) (Table 1) made it difficult to reach to an optimal locational distribution of the locally provided amenities in the design, especially in light of the still insufficient urban compactness indicators.
On the other hand, the types and numbers of the locally provided amenities were obviously inconsistent in all studied neighborhoods’ designs (Table 6). It was expected that the more population/population density, the more
the numbers and types of amenities would be consid-ered in the design, but this was not the case. For example, in N4 neighborhood, the total population number was around 4579 persons and the provided amenities were as follows: 3 cafeterias, 4 groceries, 1 pharmacy, 2 retail shops, 1 school, 1 kindergarten, 2 mosques, 0 clinics, and 45 open/green spaces. Meanwhile, in N6, the total popu-lation number reached 12,188 person which is almost triple the number of the population in N4 neighborhood,
Fig. 9 Correlation results between the average UMI Walkscore and a Street intersection density, b Link-to-nodes ratio
Page 20 of 26Galal Ahmed and Alipour City Territ Archit (2021) 8:12
Table 6 Macroscale urban planning measures and the resulting UMI Walkscore
Neighbour Type of amenities (Min.) needed no. of amenities
Actual no. of amenities in design
Locational distribution (center/edge/mixed)
Max. required catch distances
Global weight
Destination (local) weight
Walk score
N1 Cafeteria 5 7 Mixed 800 3 10, 8, 6, 4, 2 49
Grocery 3 8 Mixed 600 3 5, 3, 1
Pharmacy 1 1 Edge 800 3 1
Retail 5 5 Edges 800 2 10, 8, 6, 4, 2
School 1 1 Center 800 2 1
Kindergarten 2 1 Edge 350 3 5, 3
Mosque 1 9 Mixed 800 3 1
Clinic 1 1 Edge 800 1 1
Green space 1 5 Edges 800 2 1
N2 Cafeteria 5 14 Mixed 800 3 10, 8, 6, 4, 2 47
Grocery 3 12 Mixed 600 3 5, 3, 1
Pharmacy 1 1 Center 800 3 1
Retail 5 9 Mixed 800 2 10, 8, 6, 4, 2
School 1 4 Mixed 800 2 1
Kindergarten 2 3 Mixed 350 3 5, 3
Mosque 1 11 Mixed 800 3 1
Clinic 1 0 – 800 1 1
Green space 1 14 Mixed 800 2 1
N3 Cafeteria 5 3 Mixed 800 3 10, 8, 6, 4, 2 57
Grocery 3 4 Mixed 600 3 5, 3, 1
Pharmacy 1 2 Center 800 3 1
Retail 5 3 Mixed 800 2 10, 8, 6, 4, 2
School 1 2 Center 800 2 1
Kindergarten 2 1 Center 350 3 5, 3
Mosque 1 5 Mixed 800 3 1
Clinic 1 1 Edge 800 1 1
Green space 1 13 Mixed 800 2 1
N4 Cafeteria 5 3 Center 800 3 10, 8, 6, 4, 2 57
Grocery 3 4 Mixed 600 3 5, 3, 1
Pharmacy 1 1 Center 800 3 1
Retail 5 2 Center 800 2 10, 8, 6, 4, 2
School 1 1 Center 800 2 1
Kindergarten 2 1 Center 350 3 5, 3
Mosque 1 2 Edge 800 3 1
Clinic 1 0 – 800 1 1
Green space 1 45 Mixed 800 2 1
N5 Cafeteria 5 2 Edged 800 3 10, 8, 6, 4, 2 41
Grocery 3 5 Mixed 600 3 5, 3, 1
Pharmacy 1 0 – 800 3 1
Retail 5 1 Center 800 2 10, 8, 6, 4, 2
School 1 0 – 800 2 1
Kindergarten 2 1 Center 350 3 5, 3
Mosque 1 5 Mixed 800 3 1
Clinic 1 0 – 800 1 1
Green space 1 5 Mixed 800 2 1
Page 21 of 26Galal Ahmed and Alipour City Territ Archit (2021) 8:12
but number of the provided amenities was almost the same or even less, except the mosques, as follows: 3 caf-eterias, 3 groceries, 1 pharmacy, 2 retail shops, 2 schools, 1 kindergarten, 8 mosques, no clinics, and only 9 open/green spaces. This inconsistency between the number of population and the number of the provided amenities in the recently designed neighborhoods might be partially referred to the remarkable absence of the consideration of the local walkability related guidelines and regulations in Abu Dhabi and Dubai (see Fig. 1; Appendix Table 7). In addition, as mentioned earlier, these local walkabil-ity related guidelines and regulations were themselves inconsistent with each other.
Inherently, population density is remarkably low in single-family housing neighborhoods in the UAE, either in the past or even in the recent designs, with some few exceptions such as in N5 and N7. In this study, popula-tion densities in the investigated neighborhoods were as low as 10.51 pph in N2 and reached to a maximum rate of 48.34 pph in N7 and 48.11 in N5 (Table 5). This would make the number and even some types of the proposed local amenities unfeasible to provide. Moreover, while being important in the UMI Walkscore calculations, the locally customized Destination and Global Weights for the different types of amenities, in both the designed
neighborhoods and the local regulations and guidelines, were not considered.
Based on the overall results of the research, some insights related to walkability macroscale measures for the design of more pedestrian-friendly neighborhoods in the UAE, or even redeveloping the existing ones, could be proposed. Beside the necessity to keep adher-ing to the current trend of increasing urban form com-pactness, a combination of actions is envisaged to help boost the macroscale walkability measures. The first is to increase population density in a way that could support the economic feasibility of the locally provided amenities. Increasing population density can be achieved through introducing more dense housing patterns beside the cur-rently inclusively developed single-family housing type. Introducing diversified types of amenities also requires introducing housing mixture that encourages social mix and, hence, different patterns of amenities would be required within the urban localities. Second, in addi-tion to increasing FAR (through mainly reducing housing plot sizes) which ranged in the case studies between 0.11 in N1 and 0.41 in N7, more attention should be paid to other urban morphology compactness indicators includ-ing reducing Block Lengths, increasing Street Intersec-tion Density, and to keep the Link-to-nodes ratio at the
Table 6 (continued)
Neighbour Type of amenities (Min.) needed no. of amenities
Actual no. of amenities in design
Locational distribution (center/edge/mixed)
Max. required catch distances
Global weight
Destination (local) weight
Walk score
N6 Cafeteria 5 3 Center 800 3 10, 8, 6, 4, 2 43
Grocery 3 3 Mixed 600 3 5, 3, 1
Pharmacy 1 1 Center 800 3 1
Retail 5 2 Center 800 2 10, 8, 6, 4, 2
School 1 2 Mixed 800 2 1
Kindergarten 2 1 Center 350 3 5, 3
Mosque 1 8 Mixed 800 3 1
Clinic 1 0 – 800 1 1
Green space 1 9 Mixed 800 2 1
N7 Cafeteria 5 2 Edges 800 3 10, 8, 6, 4, 2 50
Grocery 3 3 Edges 600 3 5, 3, 1
Pharmacy 1 1 Edge 800 3 1
Retail 5 1 Edge 800 2 10, 8, 6, 4, 2
School 1 1 Edge 800 2 1
Kindergarten 2 1 Edge 350 3 5, 3
Mosque 1 1 Edge 800 3 1
Clinic 1 0 – 800 1 1
Green space 1 44 Edge 800 2 1
Page 22 of 26Galal Ahmed and Alipour City Territ Archit (2021) 8:12
value of 1.40 or above. For example, increasing Street Intersection Density could be achieved by developing more ‘gridiron’ design pattern for pedestrian networks with minimized loops and dead-end streets (CNU 2019).
Third, is locating local amenities in more appropri-ate spots, especially in both the center and the edges, within each neighborhood. This could help overcome the problem of accessibility, even partially. Fourth, is the consideration of both the Destination Weights and Global Weights of the provided amenities after defin-ing the really needed numbers and types of these locally provided amenities, especially in light of the absence of a unified and clear definition of them either in theory (local guidelines and regulations) or practice (recent neighbor-hood designs). Accurate definition of the truly required numbers and types of local amenities with their credible Destination and Global Weights, is fundamental in urg-ing people walk to them. The obvious disparities among the regulations, guidelines and practices indicate that there is a need for a correctly ‘customized’ set of regula-tions related to the types and numbers of the amenities that credibly suite local community needs. Local commu-nity residents themselves, not the planning theories nor the theoretical local planning guidelines and regulations, should have the lead in defining these sets of amenities-related measures. Local residents should be consulted in this process through administered questionnaires and interviews. As community needs might change over time, so in response, these customized measures of amenities should be ‘resilient’. They should be re-assessed peri-odically to assure that they respond effectively to the changing needs of the local community for which they are tailored. Currently, there is a lack of such a resil-ience mechanism that would help continuously review the defined guidelines and regulations pertaining to the locally provided amenities in the Emirati neighbor-hoods. Designed to be resilient and adaptive, the use and/or location of the locally provided amenities should be effortlessly changed over time, when and where this is needed.
Fifth, is the provision of reliable, rapid and afford-able public transportation system (actually as part of the missing amenities), with accessible catchment dis-tances. Currently, there is almost total absence of public transportation nodes that penetrates inside the studied neighborhoods, except in the Dubai case, even partially. Practically speaking, some of the locally provided ameni-ties (in design) might not be actually used, due to the high car ownership rates in the UAE, which has increased the impact of ‘choice’ among residents (Barton 2000). This made it more convenient for the residents to satisfy their needs away from their own locality. So, walking to trans-portation nodes (mainly bus stops on the neighborhood
level) sounds an essential, still absent, measure that might be a good solution rather than attempting to pro-vide all needed amenities locally. This would allow peo-ple to choose among various amenities of the same types even if they were not provided locally due to the lack of economic feasibility as a result of the low population den-sity, while not using their own cars. For sure, this policy would require effective incentives to urge people to use public transportation instead of their own cars.
Finally, it might be claimed that the results of this research in terms of its in-depth investigation of the effect of walkability macroscale urban morphologi-cal and urban planning indicators on UMI Walkscores, would enrich the global debate about HPT in general and walkability in specific (for example: Brookfield 2017; Rogers et al. 2013; Paranagamage et al. 2014; Mazum-dar et al. 2018). Walkability boosting issues as discussed in this research including the need for a consistent con-sideration for dense urban morphology measures and the ‘customization’ of the required numbers, types, and Destination and Global Weights of amenities, beside the ‘resilience’ of these customized parameters, are not only beneficial for the case of the UAE but might be applicable in other parts of the world, as well.
ConclusionsAs a part of their rigorous efforts to achieve urban sus-tainability, the local and federal housing authorities in the UAE have significantly changed the morphology of the designs of recent neighborhoods into denser and more compact urban forms that have been expected to enhance walkability, through enhancing the macroscale measures. This is perceived to consequently contribute to develop-ing more environmentally, socially, and economically sus-tainable communities. Utilizing the UMI computational simulation tool with its more comprehensive and cus-tomizable walkability-related variables helped calculating and compared walkability scoring (UMI Walkscore) for the recent compact designs of neighborhoods.
The first research question about the customization of the UMI Walkscore variables, related to macroscale urban planning measures of Land-use (required types and numbers of amenities, their minimum and maxi-mum catchment distances, and their Destination and Global Weights), was answered in a way that made uti-lizing UMI Walkscore possible in the UAE context with its totally different urban context than the UMI’s default variables tailored for the USA context. Still, this was by no means easy as the fragmented, even sometime, con-flicting official regulations and guidelines made it difficult to define all these variables easily.
After customizing the Walkscore variables the sec-ond research question was answered through applying
Page 23 of 26Galal Ahmed and Alipour City Territ Archit (2021) 8:12
the UMI Walkscore simulation on the investigated case studies. The recent denser and more compact neighborhoods recorded various Walkscores, but none has exceeded the ‘somewhat walkable’ neighborhood benchmark. Some even recorded Walkscores close to the urban sprawling neighborhood model. In all cases, the recorded UMI Walkscores were much lower than the targeted ‘Walker’s Paradise’ benchmark score. So, it seems that the urban compactness of the recently designed neighborhoods in Abu Dhabi and Dubai have not satisfactorily enhanced walkability compared to the conventional urban sprawling neighborhood pattern. This would hinder the full realization of sus-tainable neighborhoods as with less walking, people encountering, social capital, sense of safety and secu-rity, and physical and mental health would be signifi-cantly absent. In addition, more reliance on private cars for comminuting to local services and amenities would adversely affect purity of air while increasing green-house gas emissions and the level of noise.
The answer for the third research question came to explain why this has happened by exploring the impact of walkability macroscale measures of both the urban morphology and urban planning on the recorded UMI Walkscores for the assessed neighborhoods. Inconsistent consideration for urban morphological compactness fac-tors of FAR, Street Intersection Density, Block Lengths, and Link-to-nodes ratio was observed among the studied neighborhoods. Reducing the housing plot sizes in the neighborhoods designs has apparently received the main attention that explains the observed increase in FAR. Meanwhile, the other important urban morphological measures which are even more influential for walkabil-ity such as Link-to-nodes ratio, Street Intersection Den-sity, and Block Length, have not apparently received the same attention. But even when most of them have been considered, as in the case of N7 neighborhood, the UMI Walkscore remains low. On the other hand, the walk-ability macroscale urban planning measures including explicit land-use factors (types and numbers of amenities, their locational distribution and catchment distances) and implicit factors (Destination and Global Weights), which proved being influential for UMI Walkscores, were overlocked in the recent neighborhoods’ design.
So, besides admitting that urban compactness per se is not a sufficient design measure for enhancing walk-ability in local communities, and that the macroscale urban planning measure are significant in this regard, the research proposed a five-actions plan to help boost walkability macroscale measures in the design of local urban communities in the UAE. This proposed plan highlights the essential role of local residents in the customization of walkability macroscale urban
planning design measures to be tailored for their local communities, especially in light of the wide gabs among local regulations and guidelines, on the one hand, and the actual designs, on the other hand. In addition, these customized design measures should be revisited peri-odically to assure their continuous suitability to local communities because the types and numbers of the locally provided amenities and the accepted catch-ment distances to them could change over time. This applies also to their customized Global and Destination Weights. In other words, planning for the local ameni-ties of walkable urban communities should consider both local customization and resilience of the design measures to keep being sustainable.
On the other hand, while it might be understood that with lower population density (such as in the cases of N2, 3, 4, 6) less types and number of amenities might be provided but it is puzzling to see that this was the case for N5 and N7 neighbourhoods which have almost ideal gross density and urban morphology compactness measures. Neighborhoods designs like these should not be granted a development permit by the concerned local authorities. Lower than 50 pph neighborhoods should not be allowed to make sure that the provided amenities in terms of sufficient types and numbers will be economically viable. The significantly low popula-tion density, as noticed in all new designs of urban communities in the UAE, would make any rectifying action for boosting walkability, such as increasing num-bers and diversifying the types of amenities, not eco-nomically feasible. Therefore, increasing population density through urban densification might be practi-cally considered the first essential step in this regard. Furthermore, walkability to easily accessible public transportation nodes (bus stops) linking the commu-nity with other neighboring facilities, seems another necessary action. This would overcome the problem of low population density and enable people to choose among various amenities in the surroundings localities as well.
While the applied method in this research could be rep-licated in any other urban context, as long as the custom-ization of locally provided amenities and their resilience are considered, it should be acknowledged that in this research walkability scores were quantitatively calculated based on the walkability macroscale measures including the pedestrian network connectivity, catchment areas, locational distribution and weights of amenities. Despite the recognized significance of these quantitative param-eters, there are other microscale urban design effective, mostly qualitative, such as widths of pedestrian walk-ways, safety measures, street detailed cross section with frontage, furnishing, etc. factors that have been out of the
Page 24 of 26Galal Ahmed and Alipour City Territ Archit (2021) 8:12
scope of this research. Accordingly, to enrich the research about the HPT in general, and the design for walkability in particular, these other fine-grain urban design influen-tial measures should be investigated in further research. Also, even for the macroscale walkability measures, the research findings should be perceived within the extent of the measured indicators as per the utilized walkability
simulation tool of the UMI Walkscore. Other macroscale measures that might be missing from this simulation tool are not covered in this research.
Appendix 1See Table 7
Table 7 The regulations for amenities and catchment distances in Dubai
Amenity level Amenity type No. of residents Catchment distance (m)
Less than 70 pph
Neighborhood level Daily prayer mosque 2000 500
Retail shops 2000 400
Post office boxes 2000 400
Public space (plaza) 2000 400
Children play zone (optional) 2000 400
Neighborhood garden 2000 400
Residential region level Friday mosque 6000 1000
Shopping center 6000 800
Nursery 6000 800
Kindergarten (KG) 6000 800
Primary school 6000 800
Private general clinic 6000 Not specified
Private specialized clinic 6000 Not specified
Private medical center 6000 Not specified
Public plaza (optional) 6000 800
Region park 6000 800
Between 70 and 220 pph
Neighborhood level Daily prayer mosque 3000 500
Retail shops 3000 350
Post office boxes 3000 –
Public space (plaza) 3000 350
Children play zone (optional) 3000 350
Neighborhood garden 3000 350
Residential region level Friday mosque 9000 1000
Shopping center 9000 650
Nursery 9000 650
Kindergarten (KG) 9000 650
Primary school 9000 Not specified
Private general clinic 9000 Not specified
Private specialized clinic 9000 Not specified
Private medical center 9000 Not specified
Public plaza (optional) 9000 800
Region park 9000 800
More than 220 pph
Neighborhood level Daily prayer mosque 4000 500
Retail shops 4000 300
Post office boxes 4000 –
Public space (plaza) 4000 300
Children play zone (optional) 4000 300
Neighborhood garden 4000 300
Page 25 of 26Galal Ahmed and Alipour City Territ Archit (2021) 8:12
Table 7 (continued)
Amenity level Amenity type No. of residents Catchment distance (m)
Residential region level Friday mosque 12,000 1000
Shopping center 12,000 500
Nursery 12,000 500
Kindergarten (KG) 12,000 500
Primary school 12,000 Not specified
Private general clinic 12,000 Not specified
Private specialized clinic 12,000 Not specified
Private medical center 12,000 Not specified
Public plaza (optional) 12,000 500
Region park 12,000 600
AcknowledgementsThe researcher would like to thank the Emirates Center for Happiness Research at the United Arab Emirates University and the Research Assistants how con-tributed to this research project.
Authors’ contributionsKGA: the main author, significantly contributed to developing the literature review, case studies, and the results’ Analysis. Shared the discussion and con-clusions with the second author. SMH: significantly applied the UMI software simulation. Shared the discussion and conclusions with the first correspond-ing author. All authors read and approved the final manuscript.
FundingThis research is Funded by the Emirates Center for Happiness Research at the United Arab Emirates University, Grant Code G00003226.
Availability of data and materialsAll data generated or analyzed during this study are included in this published article [and its supplementary information files].
Declarations
Competing interestsThe authors declare that they have no competing interests.
Author details1 Emirates Center for Happiness Research, United Arab Emirates University, Al Ain 15551, UAE. 2 Architectural Engineering Department, College of Engineer-ing, United Arab Emirates University, P. O. Box: 13393, Al Ain, UAE. 3 Architec-tural Engineering Department, College of Engineering, United Arab Emirates University, Al Ain, UAE.
Received: 16 December 2020 Accepted: 2 August 2021
ReferencesAbu Dhabi Housing Authority (ADHA) (2016) Abu Dhabi national housing
guidelines for integrated communities, planning guidelines. V 1.0. ADHA, Abu Dhabi
Abu Dhabi Urban Planning Council (2014a) Abu Dhabi community facility planning standards, standards report. Version 1.0. ADUPC, Abu Dhabi
Abu Dhabi Urban Planning Council (2014b) Abu Dhabi public realm design manual. ADUPC, Abu Dhabi
Abu Dhabi Urban Planning Council. The Pearl Community Rating System. http:// estid ama. upc. gov. ae/ templ ate/ estid ama/ docs/ PCRS% 20Ver sion% 201.0. pdf. Accessed 6 May 2019
Abu Dhabi Urban planning Council (2015) Abu Dhabi urban street design manual. Abu Dhabi Urban planning Council, Abu Dhabi
Allen A (2009) Sustainable cities or sustainable urbanisation? Perspective, Summer 2009 edition of ‘palette.’ Ucls J Sustain Cities 12:1
American Society of Landscape Architects (2015) professional practice: sustainable urban development. https:// www. asla. org/ susta inabl eurba ndeve lopme nt. aspx. Accessed 13 Feb 2015
Annunziata A et al (2020) A literature review on walkability and its theoreti-cal framework. Emerging perspectives for research developments. International Conference on computational science and its applications. Springer, Cham, pp 422–437
Barton H (2000) Sustainable communities. Earthscan Publications Ltd., Cambridge
Brookfield K (2017) Residents’ preferences for walkable neighborhoods. J Urban Des 22(1):44–58. https:// doi. org/ 10. 1080/ 13574 809. 2016. 12343 35
Brown, Tom (2015) Walk score and your community. http:// straf ord. org/ magaz ine/ walk- score- and- your- commu nity/. Accessed 30 Jan 2019
Burton E, Jenks M, Williams K (2013) Achieving sustainable urban form. Rout-ledge, London
CNU (Congress for the New Urbanism) (2019) street networks 101. https:// www. cnu. org/ our- proje cts/ street- netwo rks/ street- netwo rks- 101. Accessed 12 Mar 2019
Frank LD et al (2021) Comparing walkability methods: creation of street-smart walk score and efficacy of a code-based 3D walkability index. J Transp Health 21:101005
Frey H (1999) Designing the city: towards a more sustainable urban form. Spon Press, London
Garau C et al (2020) A walkability assessment tool coupling multi-criteria analysis and space syntax: the case study of Iglesias, Italy. Eur Plan Stud. https:// doi. org/ 10. 1080/ 09654 313. 2020. 17619 47
Khaled GA (2020) Sustainable modes of mobility in new urban neighborhoods in UAE: assessing walkability and bikeability. In: Al-Masri A, Al-Assaf Y (eds) Sustainable development and social responsibility—ch 33, vol 2. Springer, Berlin. https:// doi. org/ 10. 1007/ 978-3- 030- 32902-0_ 33
Jones C, MacDonald C (2004) Sustainable urban form and real estate markets. The Proceedings of the Annual European Real Estate Conference, 2–5 June. Milan, Annual European Real Estate Conference
Arwa KS, Khaled GA (2019) Replacing land-use planning with localized form-based codes in the United Arab Emirates: a proposed method. Land 8(3):47. https:// doi. org/ 10. 3390/ land8 030047
Page 26 of 26Galal Ahmed and Alipour City Territ Archit (2021) 8:12
Labdaoui K et al (2021) Utilizing thermal comfort and walking facilities to propose a comfort walkability index (CWI) at the neighborhood level. Build Environ 193:107627
Moreno C, Allam Z, Chabaud D, Gall C, Pratlong F (2021) Introducing the “15-minute city”: sustainability, resilience and place identity in future post-pandemic cities. Smart Cities 4(1):93–111
Neuman M (2005) The compact city fallacy. J Plan Educ Res 25:11–26Clerk M (2000) A treatise on electricity and magnetism. In: Jenks M, Burgess R
(eds) Compact cities sustainable urban forms for developing countries, vol 2, 3rd edn. Spon Press, London, pp 68–73
Koohsari MJ, Sugiyama T, Hanibuchi T, Shibata A, Ishii K, Liao Y, Oka K (2018) Validity of Walk Score® as a measure of neighborhood walkability in Japan. Prev Med Rep 9:114–117
Koschinsky J, Talen E, Alfonzo M, Sungduck L (2017) How walkable is Walker’s paradise? Environ Plann B Plann Des 44(2):343–363
Kowaleski-Jones L, Zick C, Ken RS, Brown B, Hanson H, Fan J (2018) Walkable neighborhoods and obesity: evaluating efects with a propensity score approach. Popul Health 6:9–15
Masoud M (2011) Evaluation of social capital, considering sociability and walkability in urban fabrics: the case of Isfahan City, Iran. Asian Social Sci 7(10):216–228
Mazumdar S, Learnihan V, Cochrane T, Davey R (2018) The built environment and social capital: a systematic review. Environ Behav 50(2):119–158
Paranagamage P, Price A, Khandokar F, Austin S (2014) Urban design and social capital: lessons from a case study in Braunstone, Leicester. 3rd World Construction Symposium: sustainability and development in built envi-ronment Proceedings. Sri Lanka, Ceylon Institute of Builders
Kiflen R, Thielman J, Manson H, Public Health Ontario (Ontario Agency for Health Protection and Promotion) (2018) Evidence brief: neighborhood walkability and type 2 diabetes. Queen’s Printer for Ontario, Toronto
Reliance Foundry (2018) What are walk score and walk appeal?. https:// www. relia nce- found ry. com/ blog/ walk- score- and- walka ble- cities# gref. Accessed 17 Dec 2018
Rogers H, Gardner K, Carlson C (2013) Social capital and walkability as social aspects of sustainability. Sustainability 5:3473–3483
Rundle AG et al (2019) Development of a neighborhood walkability index for studying neighborhood physical activity contexts in communities across the US over the past three decades. J Urban Health 96(4):583–590
Trimarchi M. (2018) What’s a walk score?. https:// scien ce. howst ufwo rks. com/ envir onmen tal/ green- scien ce/ walk- score1. htm. Accessed 24 July 2018
Singh K, Murari SI, Narahari SI, Denis AS (2018) Design and analysis of human powered hybrid vehicle. Int J Mech Eng Technol 9(4):594–605
Schiller B (2015) Live in a walkable neighborhood? You get to be thinner and healthier. https:// www. fastc ompany. com/ 30542 31/ live- in-a- walka ble- neigh borho od- you- get- to- be- thinn er- and- more- healt hy. Accessed 23 Nov 2018
URBACT (2019) Densification beyond the city centre: urban transformation against sprawl. https:// urbact. eu/ densi ficat ion- beyond- city- centre- urban- trans forma tion- again st- sprawl. Accessed 12 April 2019
Walk Score (2019) Walk Score Methodology. https:// www. walks core. com/ metho dology. shtml. Accessed 2 June 2019
Publisher’s NoteSpringer Nature remains neutral with regard to jurisdictional claims in pub-lished maps and institutional affiliations.