Morphological Phase Diagram for a Ternary System of Block Copolymer PS310-b-PAA52/Dioxane/H2O
Hongwei Shen and Adi Eisenberg*
Department of Chemistry, McGill UniVersity, 801 Sherbrooke Street West,Montreal, Quebec, Canada H3A 2K6
ReceiVed: April 26, 1999; In Final Form: August 29, 1999
The partial ternary phase diagram was investigated for the polystyrene310-block-poly(acrylic acid)52 copolymerin dioxane/water mixtures in regions in which self-assembled nanoaggregates of various morphologies areseen. Both fractionated and unfractionated copolymers were used; the unfractionated copolymer containshomopolystyrene. The study was carried out over the range of water contents from 0 to 45 wt % and copolymerconcentrations from 0.1 to 10 wt %. Freeze-drying transmission electron microscopy (TEM), turbiditymeasurements, as well as static and dynamic light scattering were employed. Because of the proximity of themelting points and boiling points of water and dioxane, quenching and subsequent freeze-drying of solutionsamples can be employed to preserve aggregate morphologies. The morphologies can then be observed usingTEM. The reversibility of various morphological transitions was examined by means of TEM and turbiditymeasurements. With increasing water content, the sequence of copolymer structures in solution follows theorder of single chains, spheres, sphere and rod mixtures, rods, rod and vesicle mixtures, and finally purevesicles. The morphologies observed here are under thermodynamic control. Not only the water content butalso the polymer concentration affects the morphologies and the sizes of the aggregates. For the unfractionatedpolymer, the single-chain/sphere boundary shifts to lower water contents relative to that of the fractionatedcopolymer, while the other morphological boundaries move to higher water contents. On the basis of theprogressive changes of the aggregate morphologies with the addition of water, possible pathways of themorphological transitions are suggested and discussed briefly. Also, approximate thermodynamic functionsare estimated for the morphological transitions on the basis of the morphological boundaries. The combinationof freeze-drying TEM techniques with turbidity measurements is very useful in exploring the morphologicalbehavior of block copolymers in solution.
1. Introduction
Micellization of block copolymers in selective solvents hasbeen studied extensively, and a number of reviews haveappeared.1 Amphiphilic copolymers can self-assemble in aque-ous media to give regular micelles with a hydrophobic core anda hydrophilic corona, or they can aggregate in organic solventsto give reverse micelles with the hydrophilic block in the core.Because most of the previous studies dealt with starlike micelles(both regular and reverse) formed from copolymers withrelatively long corona-forming blocks, the micelles are mainlyspherical.1 Some nonspherical morphologies were suggested onthe basis of light scattering and small-angle X-ray scatteringmeasurements.2 Nonspherical aggregates were rarely observedusing TEM.3 Crew-cut aggregates with a relatively large coreand short corona have been receiving attention only recently.4-16
By contrast to starlike micelles, various morphologies wereobserved from these aggregates in both aqueous6-13 and organicmedia.14-16 The morphologies include spheres, rods, bicontinu-ous rods, lamellae, vesicles, large compound micelles (LCMs),large compound vesicles (LCVs), hexagonally packed hollowhoops (HHHs), and many others.6-16
The various morphologies of nanoaggregates formed formblock copolymers, especially from polystyrene-b-poly(acrylicacid) (PS-b-PAA), have been intensively investigated in ourgroup.6-12 It has been found that the morphologies are influ-enced by many variables, e.g., the composition of the blockcopolymers, the copolymer concentration, the type of thecommon solvent, the type and concentration of added ions, andothers. A typical preparation of the aggregates involves thedissolution of copolymers in an organic solvent (e.g., DMF),the dropwise addition of deionized water, and finally the dialysisof the mixtures against distilled water.6 Alternately, directdissolution of copolymers in a mixed solvent followed byquenching can also result in the formation of both sphericaland nonspherical aggregates.11 However, due to the slow chaindynamics at relatively high water contents, e.g., above ca. 7 wt% (in DMF), the aggregation behavior cannot be explored atthose high water contents.9 At high temperature and highpressure, various morphologies can also be formed by thedissolution of copolymers into a single solvent, e.g., alcohol.12
Although the influence of many variables on the formationof various aggregates from block copolymers has been inves-tigated, fundamental questions regarding the equilibrium natureof morphologies other than solid spheres have not yet beenanswered. The determination of a morphological phase diagram
* To whom correspondence should be addressed. E-mail: [email protected].
can certainly answer the above question. In addition, such astudy can also show quantitatively how the water content,polymer concentration, and homopolystyrene content affect theaggregate morphologies. Therefore, it is of fundamental im-portance to explore the morphological phase diagram of thestrongly amphiphilic block copolymers in very dilute solution.However, so far, no such attempts have been made.
Phase diagrams of block copolymers in bulk have beenextensively investigated for many years.17-22 These phasediagrams usually show two disordered phases and severalordered phases. In the ordered region, seven equilibrium phasesand four nonequilibrium or metastable phases have beenidentified.22 Five of the classical equilibrium phases (or mor-phologies), including two cubic phases (Sphere), two hexago-nally packed cylinder phases (HEX), and one lamellar phase(LAM), were identified using TEM.17 The other two equilibriumphases are the bicontinuous cubic phases (Gyroid), which wereidentified recently with the help of small-angle X-ray scatter-ing.19 All these equilibrium phases are predictable from theoreti-cal studies.17,18 The four nonequilibrium phases include twounstable OBDD bicontinuous phases and two metastableperforated lamellar phases.22 It should be noted that, generally,not all the phases can appear in a single copolymer series. Themelt morphologies can be preserved by annealing followed byquenching and can then be studied by TEM or other tech-niques.17 Due to the kinetic difficulties encountered in thesample preparation, it is clear that careful handling of thesamples is crucial to avoid misidentification.22
Solutions of small molecule surfactants, which bear somerelation to the present work, have also been studied extensivelyfor many decades.23-27 Various phases are present in smallmolecule surfactant systems. In addition to the ordered phases,I1 and I2 (Spheres), H1 and H2 (HEX), V1 and V2 (Gyroid), andLR (LAM), which also appear in the bulk copolymer systems,other morphologies, including spheres, rods, irregular bicon-tinuous, and bilayers, occur in the disordered phase.26,27 Nometastable phases have been observed among the ordered phasesbecause the kinetics are rapid in the small molecule surfactantsystems.24,25
One disordered bilayer phase, the vesicle, had been commonlyregarded as a nonequilibrium structure25 until the formation ofvesicles from a mixture of surfactants reopened the questionabout a decade ago.28-36 Theoretical studies show that if a mix-ture of surfactants or a mixture of a surfactant and other polarmolecules can provide different curvatures at two sides of thebilayers, thermodynamically stable vesicles can, indeed, exist.32-35
In some experimental studies, vesicles prepared from variousmixtures are claimed to be an equilibrium morphology.28-30
However, other workers who challenge this concept believe thatthe vesicle is a form of an irreversible colloid structure.36
The solution behavior of poly(ethylene oxide) (PEO) basedcopolymers has been studied for some years.37-43 Recently, itwas found that nine equilibrium phases are present in a PPO/PEO-water-oil system.43 These equilibrium phases include twodisordered phases, L1 and L2 (regular and reverse micelles), andseven ordered phases which are also found in solutions of smallmolecule surfactants. In the PEO based copolymer systems, thetime scale used to reach equilibrium varies from days toweeks.38,41 It is believed that the copolymers in bulk and inconcentrated or semidilute solutions share the same principlesthat govern their phase behavior.42 Theoretically, vesicles couldbe achieved in concentrated or semidilute copolymer solutions.44
However, experimentally, no vesicles have been seen in thesesystems.37-45
For the present study, the PS-b-PAA diblock family wasselected since many studies have been performed on themorphological aspects of the system.6-12 Dioxane was chosento be the common solvent because the melting point and boilingpoint are close to those of water, the precipitant for the PSblock.46 Since the morphological transitions of interest occurat relatively low water contents and low copolymer concentra-tions, the present study was performed in the water content rangeof 0 to 45 wt % at polymer concentrations of 0.1 to 10 wt %.Although the chain exchange rate constants in the micellizationof copolymers are generally very slow (i.e., 10-6 to 10-3 s-1
for copolymer micelles versus 106 to 108 s-1 for conventionalsurfactant micelles),1,47 the rate constant increases significantlywith decreasing precipitant (for the micellar core) content.48
Since the present study was performed at relatively low watercontents, the chain mobility should be fairly high. However,the solution can be rapidly frozen because of the high freezingpoints of dioxane and water. The solid solvent mixture can thenbe sublimed, and the aggregate morphology can be visualizedusing TEM. Therefore, equilibrium morphologies can beinvestigated. Furthermore, the reversibility of various morpho-logical transitions is carefully examined using both TEM andturbidity measurements. The effects of water content, polymerconcentration, and fractionation are explored in detail. Thepathways of various morphological transitions upon additionof water are also briefly discussed. Finally, thermodynamicparameters for the various morphological transitions are esti-mated on the basis of the phase diagram.
2. Experimental Section
2.1. Block Copolymers.The polystyrene-b-poly(tert-butylacrylate) diblock copolymers were synthesized by sequentialanionic polymerization of styrene followed bytert-butyl acrylate(t-BuA) usingsec-butyllithium as the initiator.49 The polymer-ization was carried out in tetrahydrofuran (THF) at-78 °Cunder nitrogen. After the polystyrene block was formed, analiquot of the reaction mixture was withdrawn for characteriza-tion. A series of diblock copolymers with the same polystyreneblock length were obtained by withdrawing aliquots of themixtures after eacht-BuA monomer addition. The degree ofpolymerization of the PS blocks and the polydispersities of thehomopolymers and diblocks were determined by gel permeationchromatography (GPC). FT-IR was used to determine the degreeof polymerization of the poly(t-BuA) blocks relative to that ofthe PS block using a previously established calibration curve.49
The poly(t-BuA) blocks in the copolymers were hydrolyzed totheir acid form in toluene usingp-toluenesulfonic acid as thecatalyst. A detailed description of the procedures can be foundelsewhere.49
In anionic polymerization, the copolymer often contains somehomopolymer due to the chain termination upon the additionof the second monomer. Thus, a fractionation process is neededto purify PS-b-PAA copolymers; a detailed procedure wasdescribed in a previous publication.50 To fractionate the mixture,the acrylic acid blocks were first converted to sodium acrylatein THF by addition of sodium hydroxide, which results in theimmediate formation of the reverse micelles with a poly(sodiumacrylate) core. Upon addition of water, the reverse micellesprecipitated first because of the high molecular weight; thecopolymers were then separated by removing the upper ho-mopolystyrene solution. The above process was repeated severaltimes until no homopolystyrene was detected in the reversemicelle phase by GPC.50 The sodium acrylate blocks were thenconverted back to the acrylic acid form. The copolymers PS310-
9474 J. Phys. Chem. B, Vol. 103, No. 44, 1999 Shen and Eisenberg
b-PAA52 and PS310-b-PAA75 were used in the present study;the subscript labels indicate the number of repeat units in theblocks. Both copolymers have a polydispersity index of 1.05.
2.2. Light Scattering Measurements.The light scatteringexperiments were performed on a Brookhaven light scatteringinstrument with a BI9000 AT digital correlator. The instrumentis equipped with an UniphaseµBlue laser with an output powerof 125 mW, which supplies vertically polarized light with awavelength of 532 nm. The data were collected by monitoringthe scattered light intensity at a 90° scattering angle at 25°C.The stock solutions (1-10 wt %) were prepared by dissolvingthe diblocks in dioxane, which is a common solvent for bothblocks, and were stored overnight in covered glass tubes sealedwith Teflon tape. These stock solutions were filtered directlyinto the scintillation vials of 1.5 cm diameter through filters of0.45µm pore size, and diluted with filtered dioxane solvent tothe desired copolymer concentrations. Deionized water (filteredthrough filters of 0.22µm pore size) was added dropwise at arate of 0.2 wt % per minute to form the aggregates. Static lightscattering (SLS) measurements were performed after eachsample was allowed to sit at a given water content for 20 min.Each of the water increment steps was ca. 1 wt %. Dynamiclight scattering (DLS) measurements were used as a monitorfor the phase diagram study. Thus, data were taken at waterintervals that are the same as those in the phase diagram study(see section 2.4). The filters were always rinsed first with solventand/or the stock solution before the filtration of solvent andstock solutions, as described in a previous paper.50
2.3. Turbidity Measurements.Turbidity measurements wereperformed on an 8452A diode array UV-visible spectropho-tometer (Hewlett-Packard) using HP 89531A MS-DOS UV/visOperation Software. The measurements were carried out at awavelength of 650 nm where the absorption is lowest for bothpolymer and aggregate solutions. Dioxane was used as thereference for all the measurements. The preparation of thesolution samples was the same as that for SLS measurements(see section 2.2).
2.4. Sample Preparation for the Phase Diagram Study.The sample preparation was similar to that for SLS measure-ments (see section 2.2). However, at each water increment (ca.2 wt % after aggregation), samples were stored for 3 or 4 dayswhen the water content was below 20 wt % and for 1 week forsamples above 20 wt % water. Although optical observationsand turbidity measurements suggest that the time scale neededto reach equilibrium is in the range of several minutes to anhour, depending on the water content (see section 3.1.1), extratime was taken to make sure that equilibrium had been reachedbefore the samples were prepared for TEM observation. In somecases, the samples were stored in solution for periods exceeding2 years to examine the stability of various aggregates.
2.5. Freeze-Drying Transmission Electron Microscopy.Transmission electron microscopy (TEM) was performed on aPhillips EM400 microscope operating at an acceleration voltageof 80 kV. EM copper grids were first coated with a thin film ofFormvar (J.B. EM Services Inc.) and a film of carbon. Then, toavoid the possible artifacts from exposing the Formvar film tothe solvent (dioxane), the coated EM grids were kept in acetonewith gentle stirring for a week to remove the Formvar film.After eliminating the Formvar film, the EM grids, coated onlywith carbon, were used for the present study. For the observationof the aggregate morphologies, ca. 0.01 mL of each sample waswithdrawn from the solutions used in the phase diagram study(section 2.4) and deposited onto the carbon coated EM coppergrids. A thin layer of the liquid sample on the copper grids was
immediately frozen by putting it on a metal block which waskept in thermal equilibrium with liquid nitrogen and then freeze-dried under vacuum for 2 days. Finally, the samples wereshadowed with a palladium/platinum alloy at an angle of ca.35°. The sizes of aggregates were measured directly from theprints of the microscope negatives after calibration using astandard PS latex.6 In the course of TEM observation, it wasnoted that the morphologies are completely stable in a weakelectron beam, but exposure of the sample to a strong electronbeam results in the extensive deformation of the aggregates.Therefore, only weak electron beams were used.
3. Results and Discussion
The Results and Discussion section is divided into five parts.The first presents the evidence that the morphologies observedhere represent equilibria. The evidence involves both thermo-dynamic and kinetic arguments. The second part is devoted tothe determination of the phase diagrams of the fractionated andunfractionated copolymer PS310-b-PAA52 in dioxane/watermixtures. The effects of water content, polymer concentration,and fractionation are described in detail. In the third part, thepathways of the morphological transitions accompanying wateraddition are discussed. In part four, thermodynamic functionsare estimated on the basis of the phase diagram. In the finalpart, a comparison is given of the present phase diagram withthose of block copolymers in bulk, of small molecule surfactantsin solution, and of PEO based copolymers in concentratedsolution.
3.1. Equilibrium Morphologies. 3.1.1. Kinetic Consider-ations.The study of thermodynamic aspects of self-assemblyof high molecular weight copolymers frequently encountersdifficulties involving kinetics. Therefore, it is essential to explorethe kinetics of the self-assembly process before an observedmorphology can be identified as an equilibrium phase. Aprevious study of the dynamics of high molecular weight chainsin dioxane/water mixtures revealed that the exchange rateconstant depends strongly on the composition of the solventmixture.48 Thus, one can anticipate that in the present case thechain mobility should also be a function of the solventcomposition.
Figure 1 shows plots of the turbidity as a function of timefor the 1.00 wt % fractionated copolymer PS310-b-PAA52 forca. 1 wt % water jumps at two different water contents. Thedotted lines connect the starting points (t ) 0) with the earliestattainable experimental points. The lower curve, obtained for awater content jump from 12.0 to 13.0 wt %, reaches a plateau
Figure 1. Plots of the turbidity against time for a 1.00 wt %fractionated PS310-b-PAA52. The dotted lines are the extension of thecurves to zero time.
Phase Diagram of PS310-b-PAA52/Dioxane/H2O J. Phys. Chem. B, Vol. 103, No. 44, 19999475
in ca. 5 min, which indicates that most of the morphologicalchanges triggered by water addition are complete within thattime frame. The upper curve, obtained for a water content jumpfrom 26.4 to 27.7 wt %, levels out in ca. 15 min. Clearly, thechain mobility decreases with increasing water content, but isnot very slow in either case. The lower curve is a reflection ofthe process of sphere-to-rod transition, while the upper onecorresponds to the process of vesicle formation from rods (seediscussion of phase diagrams in sections 3.2.1 and 3.2.2). Asseen from Figure 1, rod formation from spheres is clearly fasterthan vesicle formation from rods. Thus, the chain dynamics orkinetics of morphological transitions are faster at low watercontents, which is in agreement with the previous results.48 Bothplateau regions were monitored for a period of a week. Nochanges in the turbidity were observed after 15 min for the lowercurve or after 40 min for the upper curve. Therefore, bothmorphological transitions are complete over those time scales.A detailed kinetic analysis is presented in the following paperof the same issue.51 In addition, the aggregate morphologieshave been observed using TEM for an extended time period(see section 3.1.2).
The kinetics of morphological changes are determined notonly by the water content but also by the magnitude of the watercontent jump. It has been shown in preliminary experimentsthat a large water content jump, which one might want to useto induce rapid morphological reorganization, can result insteadin freezing or quenching of nonequilibrium morphologies. Also,previous experiments showed that the dissolution of a copolymerdirectly into a solvent mixture at relatively high water contentscan result in the formation of nonequilibrium aggregates dueto slow chain dynamics.11 Therefore, the aggregates in the phasediagram study should be prepared by slow water addition. Aftereach water addition, sufficient time should be allowed to passfor the system to regain equilibrium, a phenomenon similar tothe annealing process in bulk studies. It was suggested that theindirect way as employed here is a practical method to prepareequilibrium aggregates of copolymers in solution.52
3.1.2. Stability of Various Morphologies.The aggregatemorphologies should not change with time if they are equilib-
rium phases. As one test of whether they are true equilibriummorphologies, we examined the aggregates as a function of timeover long time periods. Up to now, solutions of spherical,rodlike, and vesicular aggregates have been stored underpreparation conditions for over 14, 14, and 24 months,respectively. At intervals of 1 to 2 months, a drop of each ofthese samples was withdrawn and freeze-dried for TEMobservation. So far, all the aggregate morphologies in the solventmixtures have remained unchanged. However, the stability ofthe morphologies alone is not sufficient to prove their equilib-rium nature. To prove the existence of true equilibria, it isnecessary to demonstrate that the same morphologies can beobtained reversibly both with increasing and decreasing watercontents.
3.1.3. ReVersibility of Various Morphological Transitions.Previous experiments using SLS showed that the spheres arethermodynamically controlled morphologies.50 Naturally, it isalso of interest to inquire whether the shapes and the dimensionsof the short rods, long rods, and vesicles are also underthermodynamic control. To explore this aspect, we tested thereversibility of morphological transitions by inducing a shapechange upon the addition of water, and subsequently monitoringits return to the starting morphology following the addition ofdioxane. Changes in the aggregate dimensions were alsomonitored. Figure 2 shows TEM pictures obtained in the aboveexperiments utilizing a 1.00 wt % fractionated copolymer PS310-b-PAA52 solution. Figure 2A shows spheres present at 9.1 wt% water. An increase in the water content to 11.5 wt % (step1) results in the formation of short rods shown in Figure 2B.The short rod solution was then divided into two parts. Uponaddition of dioxane to one of the short rod solutions (step 8),which reduced the water content to 9.5 wt % water, sphericalaggregates were reformed, as shown in Figure 2I. The continuedaddition of water to the other short rod solution (step 2) resultedin the formation of long rods at a water content of 14.0 wt %,as shown in Figure 2C. This solution was again split to twoparts. The addition of dioxane to one part (step 7) changed thelong rods back to short rods at 11.8 wt % water, as seen inFigure 2H. To the other part, water was added to 28 wt % (step
Figure 2. Reversibility of various morphological transitions for 1.00 wt % of fractionated copolymer PS310-b-PAA52 solution. The arrows indicatethe directions of morphological changes on addition of water (steps 1-4) or dioxane (steps 5-8): (A) spheres at 9.1 wt % water; (B) short rodsupon addition of water to 11.5 wt %; (C) long rods at 14.0 wt % water; (D) vesicles at 28.0 wt % water; (E) bigger vesicles at 40 wt % water; (F)back to smaller vesicles at 29 wt % water by adding dioxane to sample E; (G) back to long rods at 14 wt % water upon addition of dioxane tosample F; (H) back to short rods at 11.8 wt % of water upon addition of dioxane to sample G; (I) back to spheres at 9.5 wt % water by addingdioxane to sample H.
9476 J. Phys. Chem. B, Vol. 103, No. 44, 1999 Shen and Eisenberg
3), where pure vesicles formed, as shown in Figure 2D. Theaverage outside diameter of the vesicles is 84.3 nm with a wallthickness of 25.7 nm. The results of a statistical population studyfor these vesicles, based on 200 points, are given in Table 1.The vesicle solution was again divided into two parts. Dioxanewas added to one part until the water content decreased to 14wt % (step 6). The vesicles changed back to long rods, as shownin Figure 2G. Continued addition of water to the other part to40 wt % water (step 4) did not change the morphology, but thesize of vesicles increased to 90.2 nm with a wall thickness of27.0 nm. The picture is shown in Figure 2E and the statisticaldata are also listed in Table 1. The addition of dioxane to therelatively large vesicle solution to achieve a water content of29 wt % (step 5) results in the formation of smaller vesicleswith a diameter of 80.7 nm and a wall thickness of 26.5 nm.The picture and detailed data are presented in Figure 2F andTable 1, respectively.
As seen from the experiments summarized in Figure 2, thesequence of morphologies resulting from the addition of wateris spheres, short rods, long rods, small vesicles, and largervesicles. Subsequent addition of dioxane, which decreases thewater content, reverses the sequence from the relatively largevesicles to smaller vesicles, to long rods, to short rods, andfinally to spheres. Reversibility has thus been demonstrated inevery step of the morphological transitions. It should be notedhere that the polymer concentration decreases continuously uponthe addition of water followed by the addition of dioxane. InTable 1, the actual polymer concentrations are reported insteadof the initial polymer concentration, i.e., 1.00 wt % for the firstgroup or 3.00 wt % for the second. Obviously, the polymerconcentration decreases significantly with each dilution. Toavoid excessive dilution of the polymer solution, the reverseprocess for any morphology was examined by the addition ofdioxane to a solution having that morphology at the highestpolymer concentration. Thus, in step 6, the change of vesiclesto long rods, we used solution 2D (where the polymerconcentration is 0.72 wt %) instead of that shown in Figure 2F(where the polymer concentration is 0.60 wt %). Similarly, forthe conversion of short rods back to spheres, we started fromsolution 2B (polymer concentration) 0.88 wt %) instead ofsolution 2H (polymer concentration) 0.73 wt %). If we hadstarted the reverse process with the solution 2F and addeddioxane to reduce the water content to 9.5 wt %, the polymerconcentration would have been 0.13 wt %, which is far fromthe starting polymer concentration of 1.00 wt %.
Figure 3 shows the position of the starting point and end pointfor steps 1 through 8, giving the locations of points A throughI, on a diagram which will be discussed in section 3.2.1. S, R,and V represent regions of stability of spheres, rods, andvesicles, respectively. Letter combinations (e.g., S+ R) indicatethe presence of mixtures of morphologies. These mixtures arealso thermodynamically stable because they can be recreated
from high water or high dioxane directions starting from thepure morphologies.
Several other starting points and end points were also utilizedin the study of the reversibility to test whether more morpho-logical jumps can be made. For example, starting from a purevesicle solution at 34 wt % water and 0.66 wt % polymer,dioxane was added progressively to decrease the water contentto 10 wt % water, which converted the vesicles back to longrods, then back to short rods, and eventually back to spheres.The TEM results are not shown because they resemble thepictures in Figure 2. Furthermore, another test of the reversibilityof the vesicle sizes started from 3.00 wt % of polymer indioxane. The addition of 28 wt % water resulted in the formationof vesicles of 93.3 nm mean diameter (see Table 1). Additionof water to 40 wt % increased the size of the vesicles to 96.7nm. A subsequent decrease in the water content to 28 wt %resulted in the decrease of the vesicle size to 87.6 nm. Thedifference in the vesicle size from 96 to 87 nm is of statisticalsignificance at the 99% confidence level. Figure 4 gives plotsof the vesicle sizes as a function of the polymer concentrationfor different water contents and also indicates the variousconcentration steps which were performed in the reversibilitytest. The error bars indicate the variation of the averages at the95% confidence level. This experiment clearly demonstrates thereversibility of the vesicle sizes with changes in the watercontent and suggests that the vesicles are, indeed, equilibriumstructures.
The electron microscopy investigation clearly shows that theaggregate morphologies are, indeed, reversible for the presentsystem. However, the mechanisms of the forward and backward
TABLE 1: Effect of the Water Content on the Vesicle Size
Figure 3. Locations of the reversible morphological transitions shownin Figure 2 on a simplified phase diagram (similar to that shown inFigure 6A). The arrows and numbers are the same as those in Figure2. Letters, S, R, and V, represent spheres, rods, and vesicles,respectively.
Phase Diagram of PS310-b-PAA52/Dioxane/H2O J. Phys. Chem. B, Vol. 103, No. 44, 19999477
morphological transitions are probably different. Also, thekinetics of redistribution of aggregate sizes can be very slowfor some cases. This aspect can be appreciated when oneexamines the results of turbidity measurements for the revers-ibility of the morphological transitions. Figure 5 shows a plotof the turbidity against the water content resulting from theaddition of water to a 1.00 wt % fractionated PS310-b-PAA52
solution to >30 wt % water and the subsequent addition ofdioxane to reduce the water content back to<10 wt %. Thevariation of the turbidity upon water addition, represented byclosed circles, shows three sharp jumps. These jumps areassociated with three morphological transitions from singlechains to spheres, from spheres to rods, and from rods to vesicles(see section 3.2.2). However, the reverse process (following theaddition of dioxane) represented by the open circles only showstwo sharp drops. Judging from the water contents and thepolymer concentrations, these two drops correspond to thetransitions from rods back to spheres and from spheres back tosingle chains. No sharp drop associated with the transition fromvesicles to rods was found. The absence of the sharp discontinu-ity from vesicles back to rods suggests that the mechanism ofvesicle to rod formation must be very different from rod tovesicle formation. It is essential to keep in mind that the vesicleto rod transformation does take place on dioxane addition, asis seen from TEM results. Also, it should be borne in mind
that the polymer concentrations are considerably lower duringthe reverse process, as was discussed above.
In the studies of surfactant systems and block copolymers inbulk, a variation of temperature is frequently used to inducemorphological transitions under equilibrium conditions.17,38Thiswas also tried in the present system. However, it was foundthat even a change from room temperature to 90°C did notproduce an appreciable change in the turbidity, suggesting thatno morphological change occurred. This experiment was per-formed on various aggregate solutions under different conditions,even at water contents close to the transition boundaries. Noneof the tests led to an observable turbidity change. After thetemperature changes, TEM was employed to observe aggregatemorphologies, and again no changes were seen. Thus, theaggregate morphologies of the PS-b-PAA/dioxane/water systemare not very sensitive to temperature changes. However, thekinetics should accelerate appreciably with increasing temper-ature. Therefore, the aggregates should reach equilibrium moreeasily at the high temperature. The fact that aggregates are stableat high temperature also supports the argument that themorphologies observed represent true equilibria.
3.1.4. Thermodynamic Considerations.From the kinetic,stability, and reversibility tests, it is reasonable to draw theconclusion that in the present system the sizes and morphologiesof the spheres, short rods, long rods, and small vesicles arethermodynamically controlled. However, it should be pointedout that it is generally accepted that in colloid systems sphericaland long rodlike micelles can be equilibrium structrues,1,25whilethe equilibrium nature of the short rods and vesicles has beenquestioned.25,36
Most of previous studies in small molecule surfactants foundthat short rods are not thermodynamically stable due to highend-cap energies, which drive the short ones to form theequilibrated long-rod morphology.25 The studies were performedon a single surfactant, which means that all molecules were ofexactly the same structure. In the present system, the reversibilityin the length of rods is clearly shown in parts B to C of Figure2 and then to part H. Also, an increase in the temperature doesnot change the length of the rods despite the acceleration ofkinetics. Thus, experimentally, it appears that the rod length iscontrolled by thermodynamic factors. Recent theoretical studieson mixed surfactant systems have shown that aggregates canpossess different curvatures in different regions of the aggregatesresulting from an uneven distribution of different molecules inthe aggregates.32-35 In a copolymer system, block copolymersare, effectively, a mixture of different chain lengths due to thepolydispersity of the copolymer, even if the copolymer molec-ular weight has a narrow distribution.53 For example, a polymerhaving an average of 100 repeat units and a polydispersity of1.05 is, in fact, composed of a range of polymer chains from 0to 200 repeat units, with only 1.8% of the chains having theaverage value.53 Therefore, in the present study, when a rodlikemorphology is favorable for a copolymer solution, a smallportion of the copolymer chains from the longer end of thecorona length distribution can selectively aggregate at the chainends and thus stabilize the rod ends by minimizing the overallenergy. Thus, because of the presence of a molecular weightdistribution, short rods can be a thermodynamically stablemorphology. A similar argument will be used later on forvesicles. Entropic factors probably also play a role in stabilizingthe short-rod structure. As the water content increases, thedriving force for rod formation increases and the concentrationof long rods increases at the expense of both short rods andspheres.
Figure 4. Vesicle sizes under various conditions. The arrows showthe reversibility of vesicle sizes for two initial polymer concentrations.The error bars indicate the variation ranges of the average vesicle sizesat the 95% confidence level.
Figure 5. Morphological transitions examined by turbidity measure-ments for 1.00 wt % of the fractionated PS310-b-PAA52 solution uponaddition of water and subsequently addition of dioxane. The closedcircles represent the addition of water, while the open ones reflect thereverse process upon addition of dioxane.
9478 J. Phys. Chem. B, Vol. 103, No. 44, 1999 Shen and Eisenberg
The equilibrium nature of vesicles has been the subject ofsome controversy.25,28-36 Recent arguments on the subject havebeen focused on the reversibility of the vesicular structrue.36 Inthe present system, the reversibility of the vesicular morphologyis confirmed from TEM results (see Figure 2, part D to E andthen to F, and Table 1) and further supported by the invarianceof the structure with temperature. Theoretically, as the watercontent reaches a region where a bilayer structure is favorable,the curvatures at two sides of the bilayers can differ due to theuneven distribution of different polymer chains. As the differ-ence in the curvature reaches a sufficient value, the bilayerstructure will fold spontaneously to a more favorable vesicularstructure.32 Another theoretical study showed that equilibriumvesicles should have a size polydispersity of 0.283, where thepolydispersity is defined as the ratio of the relative standarddeviation of the radius over the peak radius.35 In the presentstudy, defining polydispersity as the ratio of the standarddeviation of the diameter over the average diameter, the vesicleshave a polydispersity of 0.16-0.20, which are close to thetheoretically calculated value. Additional evidence in favor ofthe equilibrium nature of the vesicles comes from the stabilityas well as the distribution of the vesicle sizes over time underconditions where the sizes are known to change in response toa change in the water content and temperature. Therefore, it isreasonable to conclude that these vesicles are true equilibriumstructures.
3.2. Phase Diagrams of Fractionated and UnfractionatedPS310-b-PAA52 Copolymers. 3.2.1. Determination of PhaseDiagrams.The morphologies shown in the phase diagrams weredetermined from TEM pictures. For each copolymer, ca. 10polymer concentrations from 0.1 to 10 wt % were examined.For each polymer concentration, the aggregate morphology wasobserved using TEM at ca. 10 consecutive water contents afterthe appearance of aggregates. Thus, ca. 100 points representingthe various morphologies seen at different polymer concentra-tions and water contents were put on each graph. The boundariesfor different morphologies (or phases) were determined bydrawing smooth lines between the points representing differentmorphologies. Using the above method, the phase diagram forthe fractionated copolymer was determined and is shown inFigure 6. Closed circles, plus signs, and open circles representspheres, rods, and vesicles, respectively. Mixed symbols standfor the corresponding mixed morphologies. The solid lines arethe boundaries determined from the TEM pictures, while thedotted line is the micellization curve determined from SLSmeasurements (see section 3.2.2). The upper graph (A) showsregions of stability on a plot of the logarithm of the polymerconcentration against the water content. The lower graph (B)is a part of the classical ternary phase diagram. The polymerconcentrations are corrected after each dilution resulting fromwater addition. Thus, the slope of a line connecting a family ofpoints for every polymer concentration has a downward slopewith increasing water content in both parts of the figure. Figure7 shows the phase diagram of the unfractionated PS310-b-PAA52,which contains ca. 10 wt % homopolystyrene. For simplicity,the experimental points have been omitted. All the lines andsymbols have the same meaning as those in Figure 6. It shouldbe noted that no macrophase separation takes place under anyconditions studied here, and only the microstructures of theaggregates change.
3.2.2. Boundaries of the Morphological Transitions.Severaldifferent methods, including SLS, DLS, and turbidity measure-ments, have been tried to determine morphological boundariesin addition to TEM, because light scattering techniques and
turbidity measurements have been used frequently in the pastfor studies of the micellization of block copolymers andmorphological transitions of surfactant systems.1,30 In our group,SLS measurements have been frequently used to determine cwc,which is defined as the critical water content at which micel-lization or aggregation takes place.8-11 In the present study, cwccan be considered as the single-chain/sphere boundary, sincespheres are the initial aggregate form. The results of SLSmeasurements are shown in Figure 8 as a plot of the scattered
Figure 6. Phase diagram of the fractionated copolymer PS310-b-PAA52
in dioxane/H2O mixture. The symbols stand for morphologies, i.e.,closed circles for spheres, closed circles with plus sign for mixtures ofspheres and rods, plus sign for rods, open circles with plus sign formixtures of rods and vesicles, open circles for vesicles. The solid linesare the phase boundaries determined from TEM pictures. The dottedline is the micellization curve from SLS measurements. (A) (top) showsthe regions of stability on a plot of the logarithm of the polymerconcentration against water content. (B) (bettom) is a part of a ternaryphase diagram.
Figure 7. Phase diagram of the unfractionated copolymer PS310-b-PAA52 in dioxane/H2O mixture. All the symbols, lines, and graphs havethe same meanings as those for Figure 6.
Phase Diagram of PS310-b-PAA52/Dioxane/H2O J. Phys. Chem. B, Vol. 103, No. 44, 19999479
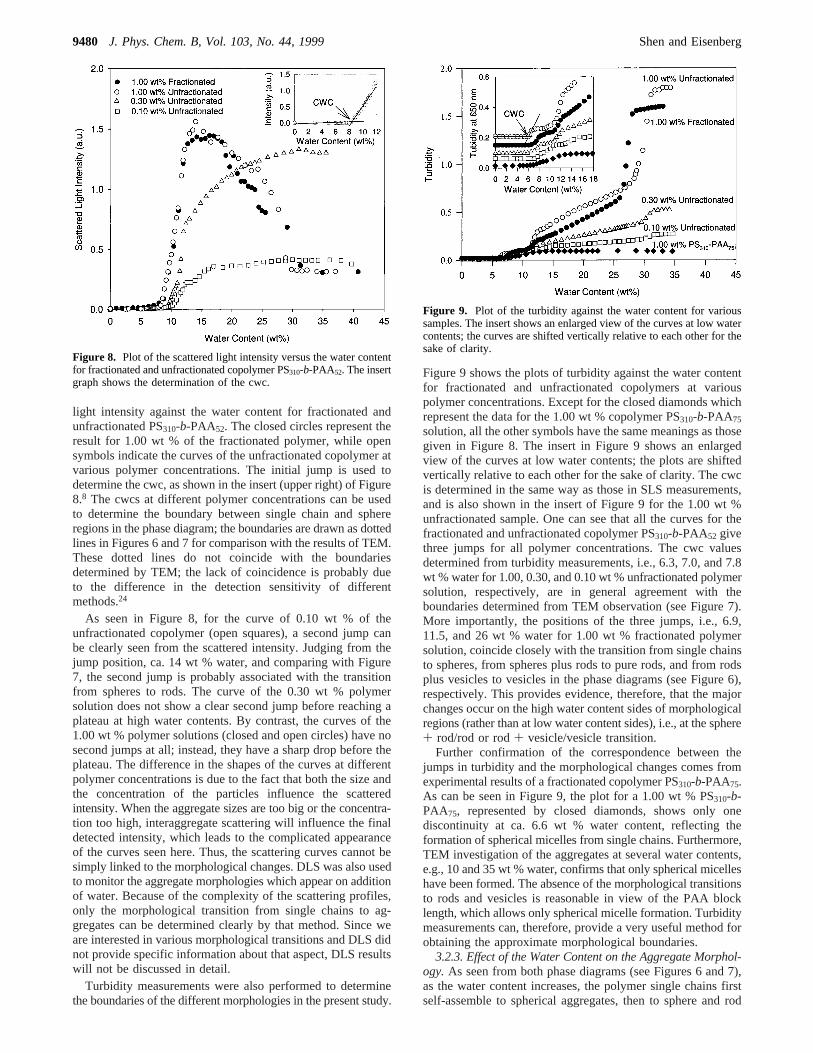
light intensity against the water content for fractionated andunfractionated PS310-b-PAA52. The closed circles represent theresult for 1.00 wt % of the fractionated polymer, while opensymbols indicate the curves of the unfractionated copolymer atvarious polymer concentrations. The initial jump is used todetermine the cwc, as shown in the insert (upper right) of Figure8.8 The cwcs at different polymer concentrations can be usedto determine the boundary between single chain and sphereregions in the phase diagram; the boundaries are drawn as dottedlines in Figures 6 and 7 for comparison with the results of TEM.These dotted lines do not coincide with the boundariesdetermined by TEM; the lack of coincidence is probably dueto the difference in the detection sensitivity of differentmethods.24
As seen in Figure 8, for the curve of 0.10 wt % of theunfractionated copolymer (open squares), a second jump canbe clearly seen from the scattered intensity. Judging from thejump position, ca. 14 wt % water, and comparing with Figure7, the second jump is probably associated with the transitionfrom spheres to rods. The curve of the 0.30 wt % polymersolution does not show a clear second jump before reaching aplateau at high water contents. By contrast, the curves of the1.00 wt % polymer solutions (closed and open circles) have nosecond jumps at all; instead, they have a sharp drop before theplateau. The difference in the shapes of the curves at differentpolymer concentrations is due to the fact that both the size andthe concentration of the particles influence the scatteredintensity. When the aggregate sizes are too big or the concentra-tion too high, interaggregate scattering will influence the finaldetected intensity, which leads to the complicated appearanceof the curves seen here. Thus, the scattering curves cannot besimply linked to the morphological changes. DLS was also usedto monitor the aggregate morphologies which appear on additionof water. Because of the complexity of the scattering profiles,only the morphological transition from single chains to ag-gregates can be determined clearly by that method. Since weare interested in various morphological transitions and DLS didnot provide specific information about that aspect, DLS resultswill not be discussed in detail.
Turbidity measurements were also performed to determinethe boundaries of the different morphologies in the present study.
Figure 9 shows the plots of turbidity against the water contentfor fractionated and unfractionated copolymers at variouspolymer concentrations. Except for the closed diamonds whichrepresent the data for the 1.00 wt % copolymer PS310-b-PAA75
solution, all the other symbols have the same meanings as thosegiven in Figure 8. The insert in Figure 9 shows an enlargedview of the curves at low water contents; the plots are shiftedvertically relative to each other for the sake of clarity. The cwcis determined in the same way as those in SLS measurements,and is also shown in the insert of Figure 9 for the 1.00 wt %unfractionated sample. One can see that all the curves for thefractionated and unfractionated copolymer PS310-b-PAA52 givethree jumps for all polymer concentrations. The cwc valuesdetermined from turbidity measurements, i.e., 6.3, 7.0, and 7.8wt % water for 1.00, 0.30, and 0.10 wt % unfractionated polymersolution, respectively, are in general agreement with theboundaries determined from TEM observation (see Figure 7).More importantly, the positions of the three jumps, i.e., 6.9,11.5, and 26 wt % water for 1.00 wt % fractionated polymersolution, coincide closely with the transition from single chainsto spheres, from spheres plus rods to pure rods, and from rodsplus vesicles to vesicles in the phase diagrams (see Figure 6),respectively. This provides evidence, therefore, that the majorchanges occur on the high water content sides of morphologicalregions (rather than at low water content sides), i.e., at the sphere+ rod/rod or rod+ vesicle/vesicle transition.
Further confirmation of the correspondence between thejumps in turbidity and the morphological changes comes fromexperimental results of a fractionated copolymer PS310-b-PAA75.As can be seen in Figure 9, the plot for a 1.00 wt % PS310-b-PAA75, represented by closed diamonds, shows only onediscontinuity at ca. 6.6 wt % water content, reflecting theformation of spherical micelles from single chains. Furthermore,TEM investigation of the aggregates at several water contents,e.g., 10 and 35 wt % water, confirms that only spherical micelleshave been formed. The absence of the morphological transitionsto rods and vesicles is reasonable in view of the PAA blocklength, which allows only spherical micelle formation. Turbiditymeasurements can, therefore, provide a very useful method forobtaining the approximate morphological boundaries.
3.2.3. Effect of the Water Content on the Aggregate Morphol-ogy.As seen from both phase diagrams (see Figures 6 and 7),as the water content increases, the polymer single chains firstself-assemble to spherical aggregates, then to sphere and rod
Figure 8. Plot of the scattered light intensity versus the water contentfor fractionated and unfractionated copolymer PS310-b-PAA52. The insertgraph shows the determination of the cwc.
Figure 9. Plot of the turbidity against the water content for varioussamples. The insert shows an enlarged view of the curves at low watercontents; the curves are shifted vertically relative to each other for thesake of clarity.
9480 J. Phys. Chem. B, Vol. 103, No. 44, 1999 Shen and Eisenberg
mixtures, to rods, to rod and vesicle mixtures, and finally tovesicles, for all polymer concentrations. For example, 1.00 wt% fractionated copolymer chains in solution first aggregate toform spherical micelles at 9.5 wt % water; the spheres have anaverage radius of 13.6 nm with a standard deviation of 1.9 nmand have an average aggregation number of 180. As the watercontent increases, the spheres change to a mixture of spheresand short rods at 10.9 wt % water. As the water content increasesfurther, the relative number of spheres decreases until only rodsare seen at 13.4 wt % water. Morphologies then change to amixture of rods and vesicles at 20 wt % water. Again, as thewater content increases, the number of vesicles increases untilpure vesicles are seen at 40 wt % water. Further addition ofwater does not change the aggregate morphology.
The morphological changes with increasing water content canbe attributed to the change of the solvent quality toward bothblocks of the copolymer. As the solvent becomes poorer forthe core-forming PS block with increasing water content, theinterfacial tension increases, while the corona repulsion maynot change much since both dioxane and water are good solventsfor the corona-forming PAA block. Thus, larger sphericalaggregates tend to form to minimize the total interfacial energy.However, in the process of the core enlargement, the stretchingof polymer chains in the core increases, which causes an increasein that component of the free energy which reflects core chainstretching. When the stretching is too high, an aggregate has toadapt another geometry to relax the stretching, and thus the totalfree energy is minimized. As a result, rodlike aggregates appear.As the water content continues to increase, the rods can growto significant length because of the interplay of the interfacialtension and the corona repulsion with contributions from thehigh end-cap energy.25 However, the copolymer rods cannotgrow to infinite length due to the new balance of interfacialtension, corona repulsion, and stretching, as well as the unevendistribution of polymer chains in the rods and entropic factorsrelated to the number of particles. Thus, the diameter of therods increases upon further addition of water and core chainstretching is building up again. Similar to the change fromspheres to rods, the rod to bilayer transition is also a result ofeasing the stretching of polymer chains in the core (seediscussion in section 3.1.4). Overall, the aggregate morphologyalways changes in a direction that decreases the overall freeenergy, which, in the present system, is from spheres to shortrods, then to long rods, and finally to vesicles with increasingwater content. If more water is added into the system, theaggregate should grow further until the vesicles are no longerstable. Therefore, inverted structures should appear. In thepresent system, however, the morphology does not changefurther beyond the vesicular structure because the chain mobilityis frozen at high water contents, i.e., above ca. 40 wt %. Theinverted structure can be observed for copolymers with shorterPS block lengths, which increase chain mobility at high watercontents.54 It is noteworthy that, as the water content increasesafter the formation of aggregates, the viscosity of the aggregatesolution progressively increases, first due to the change ofspheres to short rods and then to long rods, but then decreasesbecause of the transition from rods to vesicles.
3.2.4. Effect of the Polymer Concentration on the AggregateMorphology. In the preceding section, we have explored theeffect of the water content on the morphology. We now discussthe effect of polymer concentration. As seen from Figures 6Aand 7B, the slopes of morphological boundary lines are generallyfrom upper left to lower right. Therefore, with increasingpolymer concentration, the aggregate morphology tends to
change in a manner similar to the effect of increasing watercontent. The pattern of morphological transitions can varydepending on the water content. For example, at 15 wt % water(see Figure 6), the aggregates change from spheres to spheresplus rods, to rods, and then to rods plus vesicles. On the otherhand, at 25 wt % water, the aggregates change only from rodsplus vesicles to pure vesicles over the polymer concentrationregion studied here. The trend of the boundary lines is, at least,partly due to the change in the solvent composition withchanging polymer concentration. Starting at low polymerconcentrations, as the polymer concentration increases, thewater-to-dioxane ratio also increases. As expected, the aggregatemorphology goes through a general transition from spheres torods and then to vesicles, which is similar to that of increasingwater content. Other factors, such as pure polymer concentrationeffect, may also contribute to the shape of the boundaries.
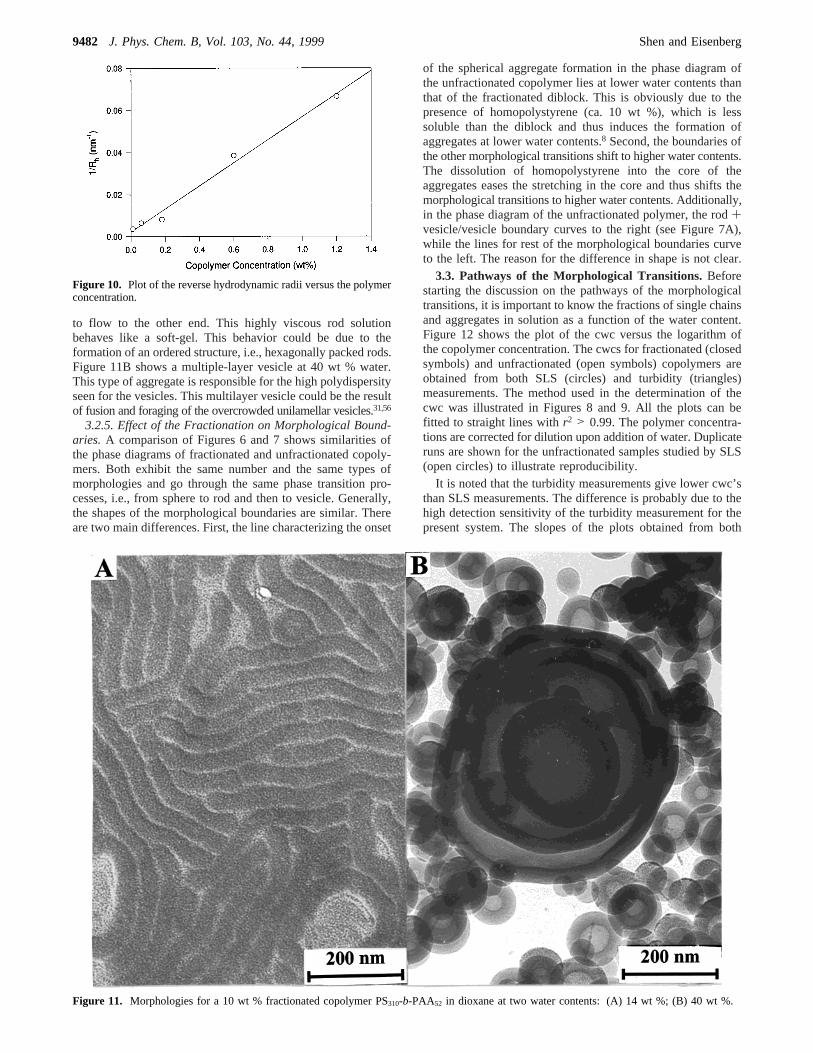
It is of interest to compare the vesicle sizes at the same watercontent as a function of polymer concentration. Table 2 listsstatistical results on the vesicles from TEM pictures at ca. 40wt % water with various polymer concentrations. The resultsare based on a population of 200 and the polymer concentrationis corrected for dilution. One can see that the outside diametersof the vesicles increase gradually between 0.6 and 3.0 wt %(see also Figure 4), but increase more steeply between 3.0 and5.0 wt %. The difference in vesicle sizes is statisticallysignificance above the 95% confidence level, as seen in Table2. The wall thickness is similar under all conditions, while thepolydispersities of the vesicles are narrow at and below 3.0 wt% but are high at 5.0 wt %. At 5.0 wt % polymer, one seesvery large multilayer vesicles appearing instead of only smallunilamellar vesicles; the multilayer vesicles will be discussedin the next paragraph. In the solution, it is possible to obtainapproximate vesicle sizes from DLS measurements by treatingthem as spheres.55 Using the CONTIN method,55 thez averagehydrodynamic radius can be obtained for various polymerconcentrations at the same water content, ca. 40 wt %. The resultis shown in Figure 10 by plotting the inverse hydrodynamicradius against the polymer concentration. The hydrodynamicradius (Rh0) extrapolated to zero polymer concentration is ca.450 nm, which is significantly larger than the size measuredby TEM. Although DLS measurements givez average valuesand the fact that the corona stretching in solution contributesto the sizes of the hydrodynamic radii, the difference betweenRh0 from DLS and the radius from TEM is too high to beaccounted for by these terms only. Other factors must alsocontribute to the high values of the hydrodynamic radii.
Some unusual phenomena are encountered at high polymerconcentrations. Figure 11 shows the aggregates formed from10 wt % polymer solution. At 13 wt % water, regularly arrangedrods appear, as shown in Figure 11A. Also, the viscosity of theaggregate solution is very high at this point. If the solutioncontainer is inverted, several hours are needed for the solution
TABLE 2: Effect of the Polymer Concentration on theVesicle Size
Phase Diagram of PS310-b-PAA52/Dioxane/H2O J. Phys. Chem. B, Vol. 103, No. 44, 19999481
to flow to the other end. This highly viscous rod solutionbehaves like a soft-gel. This behavior could be due to theformation of an ordered structure, i.e., hexagonally packed rods.Figure 11B shows a multiple-layer vesicle at 40 wt % water.This type of aggregate is responsible for the high polydispersityseen for the vesicles. This multilayer vesicle could be the resultof fusion and foraging of the overcrowded unilamellar vesicles.31,56
3.2.5. Effect of the Fractionation on Morphological Bound-aries. A comparison of Figures 6 and 7 shows similarities ofthe phase diagrams of fractionated and unfractionated copoly-mers. Both exhibit the same number and the same types ofmorphologies and go through the same phase transition pro-cesses, i.e., from sphere to rod and then to vesicle. Generally,the shapes of the morphological boundaries are similar. Thereare two main differences. First, the line characterizing the onset
of the spherical aggregate formation in the phase diagram ofthe unfractionated copolymer lies at lower water contents thanthat of the fractionated diblock. This is obviously due to thepresence of homopolystyrene (ca. 10 wt %), which is lesssoluble than the diblock and thus induces the formation ofaggregates at lower water contents.8 Second, the boundaries ofthe other morphological transitions shift to higher water contents.The dissolution of homopolystyrene into the core of theaggregates eases the stretching in the core and thus shifts themorphological transitions to higher water contents. Additionally,in the phase diagram of the unfractionated polymer, the rod+vesicle/vesicle boundary curves to the right (see Figure 7A),while the lines for rest of the morphological boundaries curveto the left. The reason for the difference in shape is not clear.
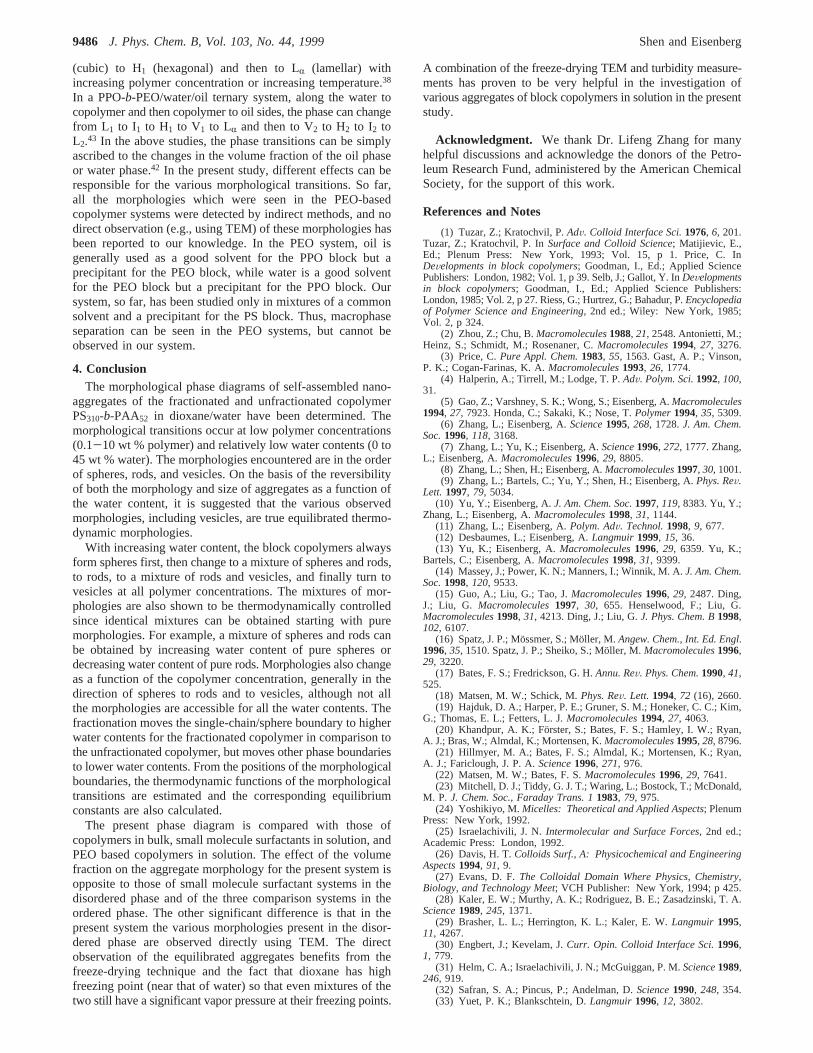
3.3. Pathways of the Morphological Transitions.Beforestarting the discussion on the pathways of the morphologicaltransitions, it is important to know the fractions of single chainsand aggregates in solution as a function of the water content.Figure 12 shows the plot of the cwc versus the logarithm ofthe copolymer concentration. The cwcs for fractionated (closedsymbols) and unfractionated (open symbols) copolymers areobtained from both SLS (circles) and turbidity (triangles)measurements. The method used in the determination of thecwc was illustrated in Figures 8 and 9. All the plots can befitted to straight lines withr2 > 0.99. The polymer concentra-tions are corrected for dilution upon addition of water. Duplicateruns are shown for the unfractionated samples studied by SLS(open circles) to illustrate reproducibility.
It is noted that the turbidity measurements give lower cwc’sthan SLS measurements. The difference is probably due to thehigh detection sensitivity of the turbidity measurement for thepresent system. The slopes of the plots obtained from both
Figure 10. Plot of the reverse hydrodynamic radii versus the polymerconcentration.
Figure 11. Morphologies for a 10 wt % fractionated copolymer PS310-b-PAA52 in dioxane at two water contents: (A) 14 wt %; (B) 40 wt %.
9482 J. Phys. Chem. B, Vol. 103, No. 44, 1999 Shen and Eisenberg
methods are similar for the fractionated sample. The plots ofthe unfractionated polymer have slightly different slopes, whichis probably due to the presence of the homopolymer. Usingpreviously developed formalism,8 the fraction of the aggregates[(C - cmc)/C] in the total copolymer can be obtained from thefollowing equation:
whereC is the total polymer concentration after the correction,cmc is the critical micellization concentration, [H2O] representsthe water content, andb is the slope obtained from Figure 12.The fraction of the single chains in the total copolymer is 1minus the fraction of aggregates in the total copolymer.
Thus, the fraction of aggregates and of single chains in thepolymer solution can be calculated as a function of the watercontent. Figure 13 shows plots of the fractions of single chainsand aggregates as a function of the water content for 1.00 wt% fractionated and unfractionated copolymers. Since a highercwc results in a higher fraction of single chains, the results fromSLS measurements will give higher fractions of single chains.For example, at 10 wt % of water, either ca. 1 or ca. 10 wt %of single chains are present in the solution, depending onwhether one uses turbidity or SLS measurements. At 15 wt %water, either only 0.0001 or only 0.01% of polymer chains arein the single chain state. Also, the chain dynamics should be afunction of the water content, as discussed in section 3.1.1. Thus,
the single chains should be able to make some contribution tothe aggregation processes at low water contents, but probablyhave a negligible effect at relatively high water contents, i.e.,above ca. 15 wt %.
Since the contribution of single chains to the aggregation isa function of the water content and the aggregate morphologychanges with increasing water content, the contribution variesfor different morphological transitions. For the formation ofspheres at the onset of the aggregation, single chains shouldmake the major contribution to aggregation process, althoughthe collision/fusion of nonequilibrium spheres may also con-tribute. As the water content increases, the collision/fusion ofnonequilibrium aggregates becomes important for the formationof short rods, with single chains playing a minor role. In thegrowth of short rods to long rods, the transition is dominatedby the rate of the collision and fusion since the water contentis relatively high, i.e., 13 wt %. The single chain involvementin the formation of vesicles probably is negligible since the watercontent is high. The following paper will discuss the formationof vesicles from rods in detail.51
3.4. Estimation of Thermodynamic Functions on the Basisof the Morphological Boundaries.3.4.1. Theoretical Aspects.The formation of spheres in the present system is consideredto follow the closed association model. Similar to the previousthermodynamic study,50 the free energy for the transfer of 1mol of polymer single chains into the spherical core (∆GS) canbe estimated.
cmc is the critical micellization concentration of polymer chainsfor sphere formation in moles per liter. In the present study,cwc is frequently measured because the study was performedby changing water content instead of the polymer concentration.The total polymer concentration (C), after the correction forwater addition, is equal to the cmc at the cwc. Thus,
Because the∆GS involves the transfer of 1 mol of single chainsand the equilibrium constant (KS) refers to the formation of 1mol of spherical aggregates, the equilibrium constant for sphereformation can be estimated.
NS is the aggregation number of the spheres, which can beestimated from TEM pictures.
Since the rods constitute a mixture of short and long rods, itis too difficult to estimate thermodynamic functions for eachrod length. As an approximation, all the rods are considered tobe of the same (average) size and the formation of rods fromspheres is considered as a one-step process. Thus, rod formationcan be expressed as
NR is the average aggregation number of the rods, andKSR isthe sphere-to-rod equilibrium constant. IfCS and [R] representthe critical concentration of spheres for rod formation and therod concentration, respectively, the free energy of transforming1 mol of spheres in solution to rods (∆GSR′) can be estimatedusing
Figure 12. Plot of the cwc against the logarithm of the polymerconcentration for fractionated and unfractionated PS310-b-PAA52 usingSLS and turbidity measurements.
Figure 13. Plots of the fraction of aggregates and fraction of free chainsagainst the water content for 1.00 wt % fractionated and unfractionatedPS310-b-PAA52 copolymer from both SLS and turbidity measurements.
(C - cmc)/C ) 1 - exp[- 2.303([H2O] - cwc)/b] (1)
∆GS ) RT ln(cmc) (2)
∆GS ) RT ln(C) (3)
KS ) C-NS (4)
(NR/NS)S {\}KSR
R (5)
Phase Diagram of PS310-b-PAA52/Dioxane/H2O J. Phys. Chem. B, Vol. 103, No. 44, 19999483
If the aggregation number is high, the second term is small andcan be neglected.∆GSR′ can then be estimated by omitting thesecond term.
Because∆GSR′ is related to transfer of 1 mol of spheres, thefree energy of transferring 1 mol of single chains from spheresto rods (∆GSR) is then equal to the value of∆GSR′ divided bythe aggregation number of the spheres (NS). If the initial sphereconcentration can be represented asC/NS, theCS can be replacedby C/NS at the critical water content for rod formation. Thus,
On the basis of eqs 6 and 8, one may also estimate theKSR,which refers to the formation of 1 mol of rods.
Following the simplified method developed for the rod forma-tion, the free energy of transferring 1 mol of single chains fromrods to vesicles (∆GRV) and the equilibrium constant for thetransition form rods to vesicles (KRV) with an aggregationnumber ofNV can be roughly estimated as follows:
The estimates for rod formation and vesicle formation containmore uncertainties than those for sphere formation, but theyare intended to show the trends; the values obtained for rodand vesicle formation should, therefore, not be considered asaccurate estimates.
The free energies obtained under equilibrium conditions areall state functions. Thus, the free energies of transferring 1 molof single chains from solution to rods (∆GR) and to vesicles(∆GV) can be obtained, respectively, from:
3.4.2. Estimated Parameters.The thermodynamic functionscan now be roughly estimated using eqs 3, 4, and 8-13. Theaggregation numbers for spheres, rods, and vesicles are esti-mated to be 180 from Figure 2A, 2400 from Figure 2B,57 and5000 from Figure 2D, respectively. Since the single-chain/sphere, sphere+ rod/rod, and rod+ vesicle/vesicle boundariesin the morphological phase diagrams (see Figures 6 and 7)correspond to the three major changes from single chains tospheres, from spheres to rods, and from rods to vesicles, thesethree boundaries are used to estimate thermodynamic functions.Figure 14 shows the free energies of transferring 1 mol of singlechains to spheres, to rods, and to vesicles as a function of watercontent at 25°C. It should be kept in mind that the values ofthe free energies and the regions of morphological transitionsfrom spheres to rods and from rods to vesicles are onlyestimates. However, the graph definitely shows the trends ofthese changes. As the water content increases from ca. 5 to ca.10 wt %, the free energy of the sphere formation decreases.Rods then become the lowest energy morphology between ca.
10 wt % and ca. 18 wt %. At higher water contents, vesiclesbecome thermodynamically most stable. The logarithms ofequilibrium constants for sphere formation are ca. 450-850 at25 °C, much higher than those for small molecule surfactants(65-478).24 The formation of rods and vesicles involvesrelatively lower logarithm values, i.e., 65-95 for the rodformation from spheres and 12-18 for the vesicle formationfrom rods. The major morphology present in solution dependson the relative values of three equilibrium constants. Forexample, with addition of water, only spheres are presentinitially because of the highKS values. As the water contentincreases, coexistence regions are encountered. The relativewidths of these regions for the various mixtures of morphologiesare undoubtedly related to the relative magnitudes of theequilibrium constants. Thus, the narrowness of the sphere+rod region relative to the wide range of the rod+ vesicle regionis dependent on the logarithm values of equilibrium constants,i.e., 65-90 for rods versus 12-18 for vesicles.
3.5. Comparison to Other Systems.It is instructive tocompare and contrast the morphological phase diagrams ob-tained in the present study with those of block copolymers inbulk, with small molecule surfactants in solution, and with PEObased copolymers in concentrated solution. The results for thosethree families of materials are most relevant to the present study.
3.5.1. Block Copolymers in Bulk.In the study of equilibratedphases in bulk, to overcome kinetic barriers, melted samplesare annealed at high temperature for several minutes to severalhours to achieve equilibrium and are then quenched to a lowtemperature.17 The morphologies at that temperature are pre-served and can be studied using TEM, SAXS, or other tools.However, careful handling of the samples, e.g., the length ofthe annealing time and the quenching speed, is needed to avoidthe misidentification of the equilibrium phases.22 In the presentstudy, the aggregate solution was prepared by adding waterprogressively to the polymer solution and storing the samplesfor several days to allow them to reach equilibrium at each wateraddition interval; finally, the samples were quenched to liquidnitrogen temperature and freeze-dried to preserve the morphol-ogies in solution. As will be seen in the subsequent paper,equilibration times under the conditions of the present studyare of the order of several minutes. The present study thusutilizes a similar strategy to that used in the bulk studies, withprecautions which include the use of small water contentincrements and very long annealing times relative to theequilibration times. More importantly, reversibility tests were
Figure 14. Estimates of the free energies of formation of variousmorphologies from single chains as a function of the water content.
∆GSR′ ) -RT ln(KSR)/(NR/NS)
) RT ln(CS) - RT ln([R])/(NR/NS) (6)
∆GSR′ ≈ RT ln(CS) (7)
∆GSR ) (RT/NS) ln(CS) ) (RT/NS) ln(C/NS) (8)
KSR ) (C/NS)-NR/NS (9)
∆GRV ) -(RT/NV) ln KRV ≈ (RT/NR) ln(C/NR) (10)
KRV ) (C/NR)-NV/NR (11)
∆GR ) ∆GS+ ∆GSR (12)
∆GV ) ∆GR + ∆GRV ) ∆GS+ ∆GSR+ ∆GRV (13)
9484 J. Phys. Chem. B, Vol. 103, No. 44, 1999 Shen and Eisenberg
performed for each morphological transition to make sure thatkinetics does not perturb the identification of equilibrium phases.
The phase behavior of diblock copolymers in bulk ischaracterized by the segregation termøN and the volumefractionf. N is the total number of repeat units in the copolymerand ø is the Flory-Huggins segment-segment interactionparameter, which decreases with increasing temperature. Amodel system, PS-PI, has been studied extensively.17-22 In thestrong segregation region (øN . 10), the sequence of micro-structures or morphologies, asfPI increases from 0 to 0.5,involves the following: disordered, Sphere, HEX, Gyroid, andLAM phases. A metastable phase, HPL, is located betweenGyroid and LAM, while another unstable phase, OBDD, is alsofound near the Gyriod region. AsfPI increases from 0.5 to 1, amirror image of the phases appears with inverted structures.The ordered phase transitioning from Sphere to HEX and thento LAM as fPI increases from 0 to 0.5 is similar to themorphological changes seen in the present study, i.e., fromspheres to rods and then to vesicles, with increasing watercontent. Thus, an increase in the water content has the sameeffect as an increase in the fraction or the length of the core-forming block (i.e., PS). In the bulk system, with increasingøN, the sequence of phase transitions depends on the startingvolume fraction. For example, the phase sequence changes fromdisordered to Gyroid to HPL and then to LAM at afPI of 0.65,while at a fPI of 0.69, it changes from disordered to HEX toGyroid. The effect of increasingøN by decreasing temperaturein the bulk resembles the polymer concentration effect in thepresent study. As the polymer concentration increases atdifferent water contents, the morphologies go through differenttransition sequences, as discussed in section 3.2.4.
In the present study, the various morphologies appear onlyin the disordered state instead of in the ordered phase in bulkbecause the present study was performed at low polymerconcentrations. However, at a relatively high polymer concen-tration, i.e., 10 wt %, we do have an indication of the appearanceof ordered phases (see section 3.2.4). Also, we have observedordered phases such as the HHH morphology before.9 For thebilayer morphology, closed lamellae or vesicles are seen in thepresent study instead of only open lamellae in bulk. In thepresent system, many variables influence the phase behavior,while only two parameters control the phase behavior in bulk.Furthermore, various morphologies are seen to coexist atequilibrium in the present study, while this aspect has not beenexplored extensively in bulk. Also, in the present system, variousmorphologies can be formed simply by varying the water contentfor one copolymer, while a series of copolymer samples haveto be synthesized to achieve the same purpose in bulk. Finally,since the aggregates in the present system can be prepared inliquid solution, including pure water, individual stable free-standing nanostructures of various morphologies can be isolatedand studied individually. This opens up the opportunity forvarious applications, such as in drug delivery.15,58
3.5.2. Small Molecule Surfactant Systems.Aggregates ofvarious morphologies can be easily obtained in both disorderedand ordered phases from small molecule surfactant systems.23-27
In addition to the phase transitions observed in ordered phases,which are similar to those in bulk copolymers, various mor-phologies also appear in the disordered micellar phases (L1 andL2). With increasing surfactant concentration or decreasingcurvature energy, aggregates can change from spheres to rodsand to bilayers before going to the ordered phases in a two-component system.27 Different morphologies can be bypasseddepending on the starting conditions. The effect of increasing
surfactant concentration is parallel to that of increasing copoly-mer concentration in the present study, while the effect ofdecreasing curvature is similar to that of the water addition.
In the surfactant/water/oil ternary system, with the additionof water, aggregates may change from ordered phases toirregular bicontinuous structures to cylindrical micelles and thento spherical micelles, or from ordered phases to cylindricalmicelles and then to spherical micelles, depending on the initialsurfactant concentration in the oil.23,26 Two different butcomplementary approaches can be invoked. Because water andoil have opposite effects on small molecule surfactants, boththe interfacial tension and corona repulsion increase upon addi-tion of water. As a result, the increase in the corona repulsion,which is dominant, drives the aggregates to change in a directionof bilayers to spheres. Another approach, which considers theeffect of the volume fraction, can also explain the morphologicalchanges. With increasing water content, the volume of the water(or hydrophilic) phase increases and the volume of the oil (orhydrophobic) phase decreases. Thus, the aggregates change frombilayers at low water contents to spheres at the high watercontents. In our study, with increasing water content, the trendof the morphological transition is opposite to that in smallmolecule surfactant systems, i.e., from spheres to rods and thento vesicles (bilayers). Because dioxane is a common solventfor both blocks, corona effects do not contribute materially withincreasing water content and only the interfacial tensionincreases appreciably. Therefore, aggregates change in thedirection of spheres to bilayers (see discussion in section 3.1.4).
Vesicles can be present as a disordered phase in mixedsurfactant systems.28-30 With changing composition or concen-tration of the surfactant mixtures, pure spherical, rodlike, andvesicular morphologies or mixed morphologies can occur in thedisordered phase, similar to the situation in the present study.Also, in the rod region, the aggregate solution is viscous. Sincemost surfactants have 12-18 carbons, the wall thickness of thevesicles cannot be varied over a wide range. By contrast, in thepresent system, because the PS block can change over a widerange of repeat units (the range from 100 to 1000 is easilyaccessible), the wall thickness can be varied over a broad range.In addition, the various aggregates in surfactant solution canbe observed using freeze-fracture TEM, which can preserve theaggregate morphologies. This is similar to the method used toobserve equilibrated morphologies in the present study. How-ever, in the copolymer systems, it is easy to find regions ofslow kinetics and then isolate the various aggregates for someapplications.15,58
3.5.3. PEO based Copolymers in Concentrated Solutions.ThePEO based copolymer systems, e.g., PPO-b-PEO and PBO-b-PEO, have relatively high molecular weights, and their kineticscan be slow or fast, depending on the experimental conditions.1
Thus, PEO systems are more like the present system. For thePEO systems, aggregate solutions were monitored for weeksor months to see whether they reached equilibria.38,42 In thepresent study, representative spherical, rodlike, and vesicularaggregate solutions have been examined for 14-24 monthperiods. It was found that, after the first few minutes or hours,the aggregate solutions had already reached equilibrium. Ad-ditionally, the reversibility of the morphological transitions wasalso examined for the present system.
In the PEO based copolymer systems, various morphologiesappear only at relatively high polymer concentrations, i.e., above20 wt %, as well as in the ordered phases for both two- andthree-component systems.37-43 In a PPO-b-PEO/water system,the phase sequence can go through L1 (disordered phase) to I1
Phase Diagram of PS310-b-PAA52/Dioxane/H2O J. Phys. Chem. B, Vol. 103, No. 44, 19999485
(cubic) to H1 (hexagonal) and then to LR (lamellar) withincreasing polymer concentration or increasing temperature.38
In a PPO-b-PEO/water/oil ternary system, along the water tocopolymer and then copolymer to oil sides, the phase can changefrom L1 to I1 to H1 to V1 to LR and then to V2 to H2 to I2 toL2.43 In the above studies, the phase transitions can be simplyascribed to the changes in the volume fraction of the oil phaseor water phase.42 In the present study, different effects can beresponsible for the various morphological transitions. So far,all the morphologies which were seen in the PEO-basedcopolymer systems were detected by indirect methods, and nodirect observation (e.g., using TEM) of these morphologies hasbeen reported to our knowledge. In the PEO system, oil isgenerally used as a good solvent for the PPO block but aprecipitant for the PEO block, while water is a good solventfor the PEO block but a precipitant for the PPO block. Oursystem, so far, has been studied only in mixtures of a commonsolvent and a precipitant for the PS block. Thus, macrophaseseparation can be seen in the PEO systems, but cannot beobserved in our system.
4. ConclusionThe morphological phase diagrams of self-assembled nano-
aggregates of the fractionated and unfractionated copolymerPS310-b-PAA52 in dioxane/water have been determined. Themorphological transitions occur at low polymer concentrations(0.1-10 wt % polymer) and relatively low water contents (0 to45 wt % water). The morphologies encountered are in the orderof spheres, rods, and vesicles. On the basis of the reversibilityof both the morphology and size of aggregates as a function ofthe water content, it is suggested that the various observedmorphologies, including vesicles, are true equilibrated thermo-dynamic morphologies.
With increasing water content, the block copolymers alwaysform spheres first, then change to a mixture of spheres and rods,to rods, to a mixture of rods and vesicles, and finally turn tovesicles at all polymer concentrations. The mixtures of mor-phologies are also shown to be thermodynamically controlledsince identical mixtures can be obtained starting with puremorphologies. For example, a mixture of spheres and rods canbe obtained by increasing water content of pure spheres ordecreasing water content of pure rods. Morphologies also changeas a function of the copolymer concentration, generally in thedirection of spheres to rods and to vesicles, although not allthe morphologies are accessible for all the water contents. Thefractionation moves the single-chain/sphere boundary to higherwater contents for the fractionated copolymer in comparison tothe unfractionated copolymer, but moves other phase boundariesto lower water contents. From the positions of the morphologicalboundaries, the thermodynamic functions of the morphologicaltransitions are estimated and the corresponding equilibriumconstants are also calculated.
The present phase diagram is compared with those ofcopolymers in bulk, small molecule surfactants in solution, andPEO based copolymers in solution. The effect of the volumefraction on the aggregate morphology for the present system isopposite to those of small molecule surfactant systems in thedisordered phase and of the three comparison systems in theordered phase. The other significant difference is that in thepresent system the various morphologies present in the disor-dered phase are observed directly using TEM. The directobservation of the equilibrated aggregates benefits from thefreeze-drying technique and the fact that dioxane has highfreezing point (near that of water) so that even mixtures of thetwo still have a significant vapor pressure at their freezing points.
A combination of the freeze-drying TEM and turbidity measure-ments has proven to be very helpful in the investigation ofvarious aggregates of block copolymers in solution in the presentstudy.
Acknowledgment. We thank Dr. Lifeng Zhang for manyhelpful discussions and acknowledge the donors of the Petro-leum Research Fund, administered by the American ChemicalSociety, for the support of this work.
References and Notes
(1) Tuzar, Z.; Kratochvil, P.AdV. Colloid Interface Sci.1976, 6, 201.Tuzar, Z.; Kratochvil, P. InSurface and Colloid Science; Matijievic, E.,Ed.; Plenum Press: New York, 1993; Vol. 15, p 1. Price, C. InDeVelopments in block copolymers; Goodman, I., Ed.; Applied SciencePublishers: London, 1982; Vol. 1, p 39. Selb, J.; Gallot, Y. InDeVelopmentsin block copolymers; Goodman, I., Ed.; Applied Science Publishers:London, 1985; Vol. 2, p 27. Riess, G.; Hurtrez, G.; Bahadur, P.Encyclopediaof Polymer Science and Engineering, 2nd ed.; Wiley: New York, 1985;Vol. 2, p 324.
(16) Spatz, J. P.; Mo¨ssmer, S.; Mo¨ller, M. Angew. Chem., Int. Ed. Engl.1996, 35, 1510. Spatz, J. P.; Sheiko, S.; Mo¨ller, M. Macromolecules1996,29, 3220.
(17) Bates, F. S.; Fredrickson, G. H.Annu. ReV. Phys. Chem.1990, 41,525.
(18) Matsen, M. W.; Schick, M.Phys. ReV. Lett. 1994, 72 (16), 2660.(19) Hajduk, D. A.; Harper, P. E.; Gruner, S. M.; Honeker, C. C.; Kim,
G.; Thomas, E. L.; Fetters, L. J.Macromolecules1994, 27, 4063.(20) Khandpur, A. K.; Fo¨rster, S.; Bates, F. S.; Hamley, I. W.; Ryan,
A. J.; Bras, W.; Almdal, K.; Mortensen, K.Macromolecules1995, 28, 8796.(21) Hillmyer, M. A.; Bates, F. S.; Almdal, K.; Mortensen, K.; Ryan,
A. J.; Fariclough, J. P. A.Science1996, 271, 976.(22) Matsen, M. W.; Bates, F. S.Macromolecules1996, 29, 7641.(23) Mitchell, D. J.; Tiddy, G. J. T.; Waring, L.; Bostock, T.; McDonald,
M. P. J. Chem. Soc., Faraday Trans. 11983, 79, 975.(24) Yoshikiyo, M.Micelles: Theoretical and Applied Aspects; Plenum
Press: New York, 1992.(25) Israelachivili, J. N.Intermolecular and Surface Forces,2nd ed.;
Academic Press: London, 1992.(26) Davis, H. T.Colloids Surf., A: Physicochemical and Engineering
Aspects1994, 91, 9.(27) Evans, D. F.The Colloidal Domain Where Physics, Chemistry,
Biology, and Technology Meet; VCH Publisher: New York, 1994; p 425.(28) Kaler, E. W.; Murthy, A. K.; Rodriguez, B. E.; Zasadzinski, T. A.
Science1989, 245, 1371.(29) Brasher, L. L.; Herrington, K. L.; Kaler, E. W.Langmuir 1995,
1, 779.(31) Helm, C. A.; Israelachivili, J. N.; McGuiggan, P. M.Science1989,
246, 919.(32) Safran, S. A.; Pincus, P.; Andelman, D.Science1990, 248, 354.(33) Yuet, P. K.; Blankschtein, D.Langmuir1996, 12, 3802.
9486 J. Phys. Chem. B, Vol. 103, No. 44, 1999 Shen and Eisenberg
(34) Bernardes, A. T.Langmuir1996, 12, 5763.(35) Bergstro¨m, M.; Eriksson, J. C.Langmuir1998, 14, 288.(36) Laughlin, R. G.Colloids Surf., A: Physicochemical and Engineer-
6055.(56) Menger, F. M.; Gabrielson, K.J. Am. Chem. Soc.1994, 116, 1567.(57) TheNagg value given here was obtained for samples equilibrated
at 11.5 wt % water, near the sphere/rod-to-rod transition. In the followingpaper, theNagg value is given for rods at 25.9 wt % water, near the rod/vesicle-to-vesicle transition.