20
AUGUST 2019 REPORT MORTGAGE MONITOR

AUGUST 2019 REPORT
MORTGAGE MONITOR
Confidential, Proprietary and/or Trade Secret TM SM ® Trademark(s) of Black Knight IP Holding Company, LLC, and/or an affiliate. © 2019 Black Knight Financial Technology Solutions, LLC. All Rights Reserved.
MORTGAGE MONITOR
AUGUST 2019 | 2Confidential, Proprietary and/or Trade Secret TM SM ® Trademark(s) of Black Knight IP Holding Company, LLC, and/or an affiliate. © 2019 Black Knight Financial Technology Solutions, LLC. All Rights Reserved.
Each month, the Black Knight Mortgage Monitor looks at a variety of issues related to the mortgage finance and housing industries.
This month, as always, we begin with a review of some of the high-level mortgage performance statistics reported in our most recent First Look report, with an update on delinquency, foreclosure and prepayment trends. We then take a closer look at mortgage performance and prepayment detail for the month of August. In addition, we examine how pull-through rates of refinance candidates could impact origination volumes in coming months.
With 30-year mortgage interest rates hitting a three-year low in August, we revisit home affordability across the country, while also taking a comparative look across different metropolitan areas. Finally, we look at the impact improved affordability is having in terms of reheating the housing market by examining home price growth and the recent reaction to falling interest rates across the country.
In producing the Mortgage Monitor, Black Knight’s Data & Analytics division aggregates, analyzes and reports upon the most recently available data from the company’s vast mortgage and housing related data assets. Information is gathered from the McDash loan-level mortgage performance dataset, the Black Knight HPI and the company’s robust public property records database covering 99.9% of the U.S. population. For more information on gaining access to Black Knight’s data assets, please call 844-474-2537 or email [email protected].
AUGUST 2019 OVERVIEW
MORTGAGE MONITOR
AUGUST FIRST LOOK RELEASE
AUGUST MORTGAGE PERFORMANCE HIGHLIGHTS
AFFORDABILITY & HOME PRICE TRENDS
APPENDIX
DISCLOSURES
DEFINITIONS
3
4
9
16
19
20
CONTENTS
Confidential, Proprietary and/or Trade Secret TM SM ® Trademark(s) of Black Knight IP Holding Company, LLC, and/or an affiliate. © 2019 Black Knight Financial Technology Solutions, LLC. All Rights Reserved.
MORTGAGE MONITOR
AUGUST 2019 | 3
Here we have an overview of findings from Black Knight’s ‘First Look’ at August mortgage performance data. This information has been compiled from Black Knight’s McDash loan-level mortgage performance database. You may click on each chart to see its contents in high-resolution.
AUGUST 2019 FIRST LOOK RELEASE
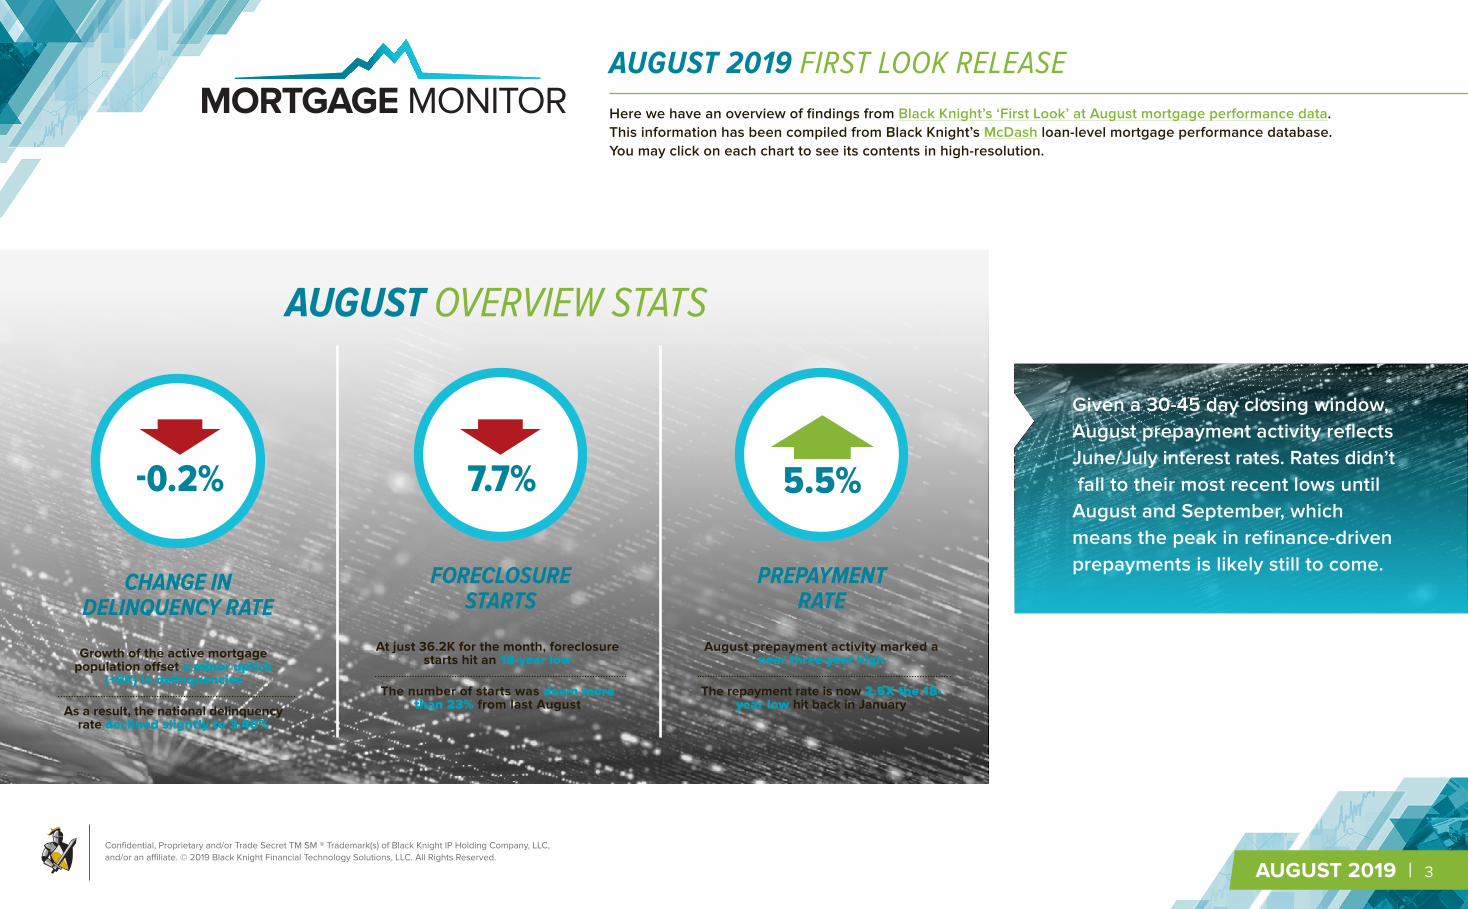
Given a 30-45 day closing window, August prepayment activity reflects June/July interest rates. Rates didn’t fall to their most recent lows until August and September, which means the peak in refinance-driven prepayments is likely still to come.
AUGUST OVERVIEW STATS
CHANGE IN DELINQUENCY RATE
Growth of the active mortgage population offset a minor uptick
(+6K) in delinquencies
As a result, the national delinquency rate declined slightly to 3.45%
FORECLOSURE STARTS
At just 36.2K for the month, foreclosure starts hit an 18-year low
The number of starts was down more than 23% from last August
PREPAYMENT RATE
August prepayment activity marked a near three-year high
The repayment rate is now 2.5X the 18-year low hit back in January
5.5%7.7%-0.2%
Confidential, Proprietary and/or Trade Secret TM SM ® Trademark(s) of Black Knight IP Holding Company, LLC, and/or an affiliate. © 2019 Black Knight Financial Technology Solutions, LLC. All Rights Reserved.
MORTGAGE MONITOR
AUGUST 2019 | 4
Here, we take a closer look at mortgage performance and prepayment detail for the month of August. In addition, we examine how pull-through rates of refinance candidates could impact origination volumes in coming months. This information has been compiled from Black Knight’s McDash loan-level mortgage performance database. You may click on each chart to see its contents in high-resolution.
AUGUST 2019 MORTGAGE PERFORMANCE UPDATE
-2.7% -2.3%
-10.6%
+3.2%
+0.7%
+2.9%+1.0%
-0.2%
+5.2%
-2.0%
+4.4%
+1.9%
-14%
-9%
-4%
1%
6%
Janu
ary
Febr
uary
Mar
ch
Apr
il
May
June
July
Aug
ust
Sep
tem
ber
Oct
ober
Nov
embe
r
Dec
embe
r
AVERAGE MONTHLY CHANGE IN DELINQUENCY RATE(SINCE JANUARY 2000)
3.45%
4.39%
2.00%
3.00%
4.00%
5.00%
6.00%
7.00%
8.00%
9.00%
10.00%
11.00%
2000
-08
2001
-08
2002
-08
2003
-08
2004
-08
2005
-08
2006
-08
2007
-08
2008
-08
2009
-08
2010
-08
2011
-08
2012
-08
2013
-08
2014
-08
2015
-08
2016
-08
2017
-08
2018
-08
2019
-08
NATIONAL DELINQUENCY RATE – FIRST LIEN MORTGAGESDelinquency Rate 2000-2005 Average Record Low
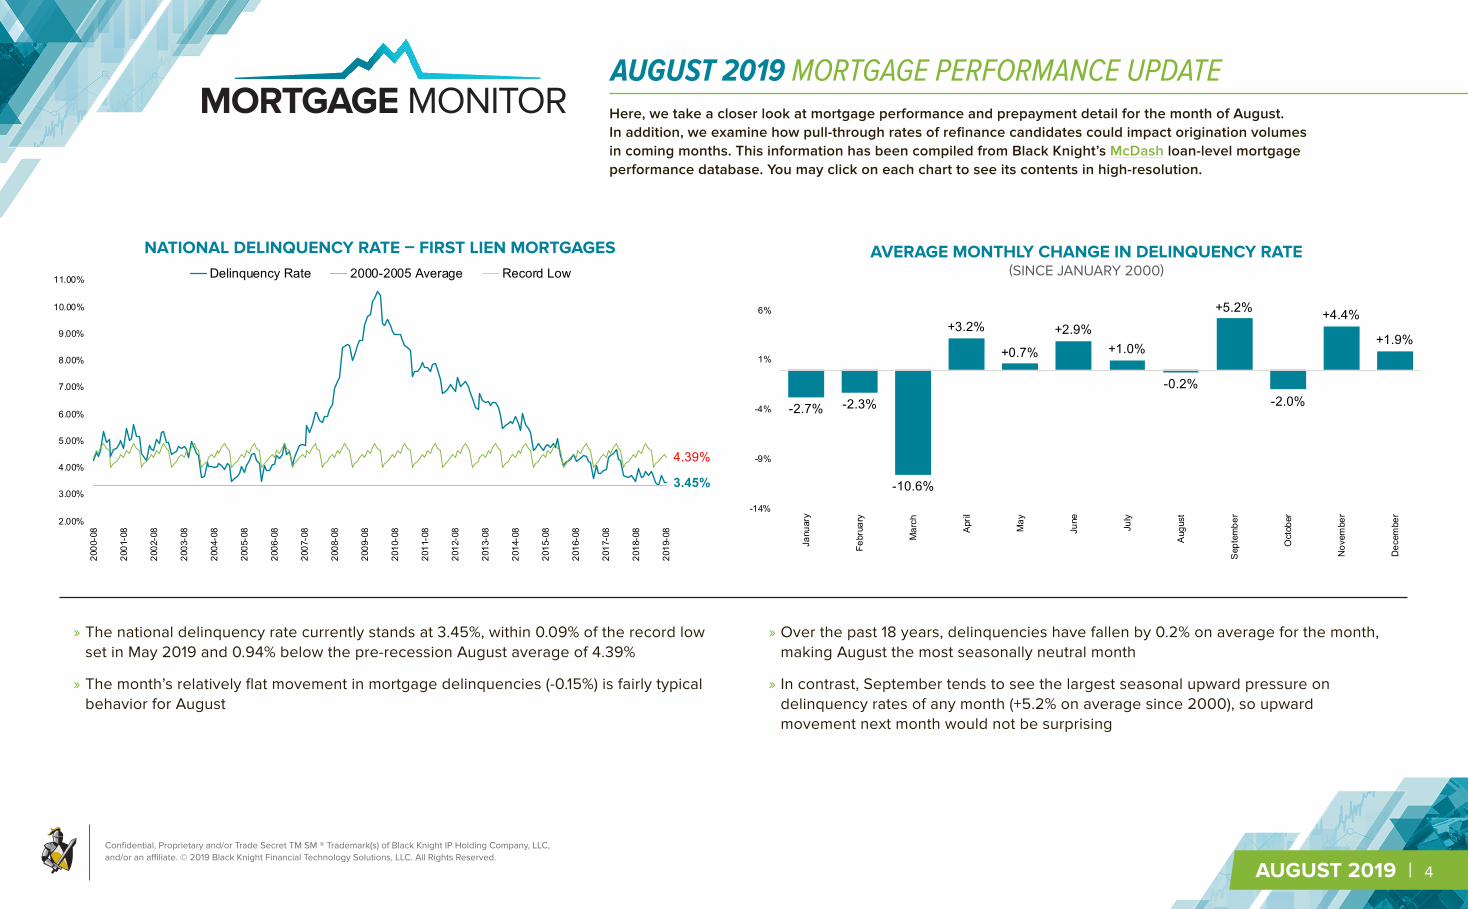
» The national delinquency rate currently stands at 3.45%, within 0.09% of the record low set in May 2019 and 0.94% below the pre-recession August average of 4.39%
» The month’s relatively flat movement in mortgage delinquencies (-0.15%) is fairly typical behavior for August
» Over the past 18 years, delinquencies have fallen by 0.2% on average for the month, making August the most seasonally neutral month
» In contrast, September tends to see the largest seasonal upward pressure on delinquency rates of any month (+5.2% on average since 2000), so upward movement next month would not be surprising
NATIONAL DELINQUENCY RATE – FIRST LIEN MORTGAGES AVERAGE MONTHLY CHANGE IN DELINQUENCY RATE(SINCE JANUARY 2000)

Confidential, Proprietary and/or Trade Secret TM SM ® Trademark(s) of Black Knight IP Holding Company, LLC, and/or an affiliate. © 2019 Black Knight Financial Technology Solutions, LLC. All Rights Reserved.
MORTGAGE MONITOR
AUGUST 2019 | 5
AUGUST 2019 MORTGAGE PERFORMANCE UPDATE
» While August’s 85K defaults were 15% below the pre-recession (2000-2005) average for this time of year, default volume was up by 6% from the same time last year
» Defaults have been relatively flat year-over-year or up slightly in each of the past five months
» One contributing factor has been the severe early-2018 flooding in the Midwest, with defaults in the region rising by 10% from the year prior
» August also saw defaults increase in the south (+8%) and the Northeast (+4.5%)
» Though default activity remains historically low, this is a trend worth watching
0K
50K
100K
150K
200K
250K
300K
350K
400K
450K
500K
2000-0
8
2001-0
8
2002-0
8
2003-0
8
2004-0
8
2005-0
8
2006-0
8
2007-0
8
2008-0
8
2009-0
8
2010-0
8
2011-0
8
2012-0
8
2013-0
8
2014-0
8
2015-0
8
2016-0
8
2017-0
8
2018-0
8
2019-0
8
90-DAY DEFAULTS VS. FORECLOSURE STARTS90-Day Defaults Foreclosure Starts Foreclosure starts hit an 18-year low in
August, but defaults have shown signs of upward movement in recent months
90-DAY DEFAULTS VS. FORECLOSURE STARTS
Confidential, Proprietary and/or Trade Secret TM SM ® Trademark(s) of Black Knight IP Holding Company, LLC, and/or an affiliate. © 2019 Black Knight Financial Technology Solutions, LLC. All Rights Reserved.
MORTGAGE MONITOR
AUGUST 2019 | 6
0.00%
0.50%
1.00%
1.50%
2.00%
2.50%
3.00%
3.50%
4.00%
2007-08
2008-08
2009-08
2010-08
2011-08
2012-08
2013-08
2014-08
2015-08
2016-08
2017-08
2018-08
2019-08
PREPAYMENT RATE (SMM) BY VINTAGE2004 2005 2006 2007 2008 2009 2010 20112012 2013 2014 2015 2016 2017 2018 2019
0.00%
0.50%
1.00%
1.50%
2.00%
2.50%
3.00%
2007
-08
2008
-08
2009
-08
2010
-08
2011
-08
2012
-08
2013
-08
2014
-08
2015
-08
2016
-08
2017
-08
2018
-08
2019
-08
PREPAYMENT RATE (SMM) BY INVESTOR / PRODUCTGSE FHA/VA Portfolio Private Securities Total Market
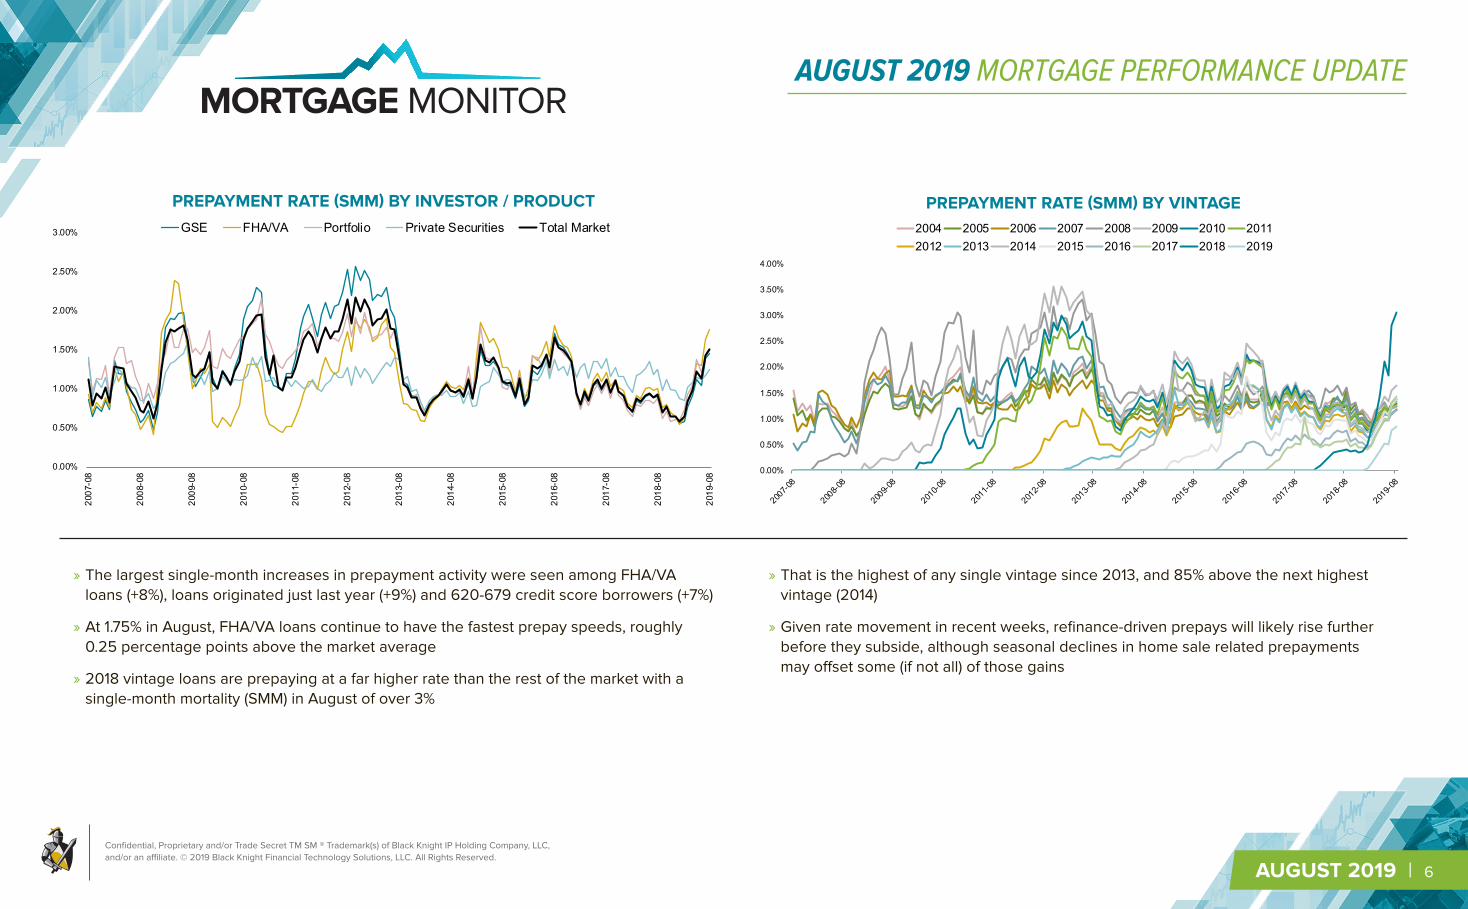
» The largest single-month increases in prepayment activity were seen among FHA/VA loans (+8%), loans originated just last year (+9%) and 620-679 credit score borrowers (+7%)
» At 1.75% in August, FHA/VA loans continue to have the fastest prepay speeds, roughly 0.25 percentage points above the market average
» 2018 vintage loans are prepaying at a far higher rate than the rest of the market with a single-month mortality (SMM) in August of over 3%
» That is the highest of any single vintage since 2013, and 85% above the next highest vintage (2014)
» Given rate movement in recent weeks, refinance-driven prepays will likely rise further before they subside, although seasonal declines in home sale related prepayments may offset some (if not all) of those gains
PREPAYMENT RATE (SMM) BY INVESTOR / PRODUCT PREPAYMENT RATE (SMM) BY VINTAGE
AUGUST 2019 MORTGAGE PERFORMANCE UPDATE

Confidential, Proprietary and/or Trade Secret TM SM ® Trademark(s) of Black Knight IP Holding Company, LLC, and/or an affiliate. © 2019 Black Knight Financial Technology Solutions, LLC. All Rights Reserved.
MORTGAGE MONITOR
AUGUST 2019 | 7
15.Nov '184.94%
28.Mar '194.06% 6.Jun '19
3.82%
.0M
2.0M
4.0M
6.0M
8.0M
10.0M
12.0M
14.0M
3.00%
3.50%
4.00%
4.50%
5.00%
5.50%
06.Sep 11.Oct 15.Nov 20.Dec 24.Jan 28.Feb 04.Apr 09.May 13.Jun 18.Jul 22.Aug 26.Sep
REFINANCE CANDIDATES BY WEEK VS. 30-YR FIXED RATESRefinance Candidates (Right Axis) 30-YR Fixed Rate Freddie PMMS (Left Axis)
Rate window impacting August prepay andRate window impacting August prepay and refinance activity
(Assuming 30 day close)
3.0%
3.5%
4.0%
4.5%
5.0%
5.5%
6.0%
6.5%
7.0%
7.5%
M
2M
4M
6M
8M
10M
12M
2001
-09
2002
-09
2003
-09
2004
-09
2005
-09
2006
-09
2007
-09
2008
-09
2009
-09
2010
-09
2011
-09
2012
-09
2013
-09
2014
-09
2015
-09
2016
-09
2017
-09
2018
-09
TOD
AY*
REFINANCE CANDIDATES IN MILLIONSRefinance Candidates (Left Axis) Freddie 30-Year Fixed Rate (Right Axis)
Refinance Candidates: Homeowners current on their mortgage with 720+ credit scores and >= 20% equity in their home that could reduce their interest rate by 0.75% or more by refinancing into a 30-year fixed rate mortgage at the prevailing interest rate
» Both prepayment activity and refinance originations have risen in six of the past seven months
» Assuming a 30-day window from application to closing, we see that throughout July there were an average of 7.9M refinance candidates (up 10% from June)
» The average number of refinance candidates in August (who would drive refi-related prepayments in September) rose by nearly 20% to 9.46M suggesting a continued surge in refi closings
» Refinance incentive subsequently peaked at 11.7M candidates in the first week of September, setting an all-time high with rates falling to 3.49%, before pulling back to 8.3M as of September 26th
REFINANCE CANDIDATES IN MILLIONS REFINANCE CANDIDATES BY WEEK VS. 30-YR FIXED RATES
AUGUST 2019 MORTGAGE PERFORMANCE UPDATE
Refinance Candidates: Homeowners current on their mortgage with 720+ credit scores and >=20% equity in their home that could reduce their interest rate by 0.75% or more by refinancing inot a 30-year fixd rate mortgage at the prevailing interest rate

Confidential, Proprietary and/or Trade Secret TM SM ® Trademark(s) of Black Knight IP Holding Company, LLC, and/or an affiliate. © 2019 Black Knight Financial Technology Solutions, LLC. All Rights Reserved.
MORTGAGE MONITOR
AUGUST 2019 | 8
» The reason is that lower credit quality rate/term refinances and "out of the money" cash-outs make-up a much larger share of the refi market
» Conversely, as rates fall and refinance incentive increases so do originations, but the ratio of originations to candidates tends to fall
» The ratio of originations to candidates has fallen back down near 4%, much as in 2016 – the last time 30-year rates were in the 3.5% range
» Though only a rough estimation, this ratio can offer some insight as to where refinance volumes may go in coming months
» Refi originations hit a 21-month high in July spurred by falling rates; if the 4% ratio holds, refinance originations could continue to rise by as much as 20-40%
» Black Knight will continue to watch this trend closely in Q3/Q4 2019
2.00%
2.25%
2.50%
2.75%
3.00%
3.25%
3.50%
3.75%
4.00%
4.25%
4.50%
4.75%
5.00%
5.25%
0%
1%
2%
3%
4%
5%
6%
7%
8%
9%
10%
2013-08
2013-10
2013-12
2014-02
2014-04
2014-06
2014-08
2014-10
2014-12
2015-02
2015-04
2015-06
2015-08
2015-10
2015-12
2016-02
2016-04
2016-06
2016-08
2016-10
2016-12
2017-02
2017-04
2017-06
2017-08
2017-10
2017-12
2018-02
2018-04
2018-06
2018-08
2018-10
2018-12
2019-02
2019-04
2019-06
2019-08
Fred
die
30-Y
ear F
ixed
Rat
e
Refi
Orig
inat
ions
as Pe
rcent o
f Can
dida
tes
REFINANCE ORIGINATIONS AS PERCENT OF REFI CANDIDATESRefi Originations as Percent of Candidates Freddie 30-Year Fixed Rate
Refinance Originations as Percent of Candidates is calculated by dividing the number of refinance originations in a given month by the number of refinance candidates in the previous month (assumes a 30 day closing window)
When rates rise (as in late 2016 and early 2018), the ratio of originations to refinance candidates, tends to rise
REFINANCE ORIGINATIONS AS PERCENT OF REFI CANDIDATES
AUGUST 2019 MORTGAGE PERFORMANCE UPDATE
Refinance Originations as Percent of Candidates is calculates by dividing the number of refinance originations in a given month by the number of refinance candidates in the previous month (assumes a 30 day closing window)

Confidential, Proprietary and/or Trade Secret TM SM ® Trademark(s) of Black Knight IP Holding Company, LLC, and/or an affiliate. © 2019 Black Knight Financial Technology Solutions, LLC. All Rights Reserved.
MORTGAGE MONITOR
AUGUST 2019 | 9
With 30-year mortgage interest rates hitting a three-year low in August, we revisit home affordability and its impact on home price growth across the country. This information has been compiled from the Black Knight Home Price Index, U.S. Census Bureau Median Household Income estimates and Freddie Mac’s Primary Mortgage Market Survey. You may click on each chart to see its contents in high-resolution.
AUGUST 2019 AFFORDABILITY & HOME PRICE TRENDS
» This is the second lowest payment-to-income ratio in 20 months, behind only August 2019, and 4.5% below the long-term (1995-2003) average
» Affordability briefly hit a 32-month high in early September, when interest rates dipped below 3.5% for a single week
» The $1,122 in monthly P&I required to purchase the average home is down 10% from November 2018 – when interest rates peaked near 5% – despite home prices rising more than 4% from that point
» Affordability had hit a nine-year low back in November when the national payment-to-income ratio rose to 23.7%, spurring a noticeable and extended slowdown in home price growth
» The decline in rates since November has been enough to boost buying power by $46K (+16%) while keeping monthly P&I payments the same
34.5%
20.7%
3.64%
2.5%
4.0%
5.5%
7.0%
8.5%
0%
5%
10%
15%
20%
25%
30%
35%
40%
1995-0
9
1996-0
9
1997-0
9
1998-0
9
1999-0
9
2000-0
9
2001-0
9
2002-0
9
2003-0
9
2004-0
9
2005-0
9
2006-0
9
2007-0
9
2008-0
9
2009-0
9
2010-0
9
2011-0
9
2012-0
9
2013-0
9
2014-0
9
2015-0
9
2016-0
9
2017-0
9
2018-0
9
2019-0
9
Fred
die
30-Y
ear F
ixed
Rat
e
Paym
ent-
to-In
com
e R
atio
NATIONAL PAYMENT-TO-INCOME RATIO*Payment-to-Income Ratio (Left Axis) Freddie 30-Year Fixed Interest Rate (Right Axis)
*The National Payment-to-Income Ratio is the share of median income needed to make the monthly principal and interest payment on the purchase of the median priced home using a 20% down 30-year fixed rate mortgage at the prevailing interest rate
As of the end of September 2019 – with the average 30-year interest rate at 3.64% – it now requires 20.7% of the national median income to make the monthly principal and interest (P&I) payments on the average-priced home
NATIONAL PAYMENT-TO-INCOME RATIO*
*The National Payment-to-Income Ratio is the share of median income needed to make the monthly principal and interest payment on the purchase of the median priced home using a 20% down 30-year fixed rate mortgage at the prevailing interest rate
Confidential, Proprietary and/or Trade Secret TM SM ® Trademark(s) of Black Knight IP Holding Company, LLC, and/or an affiliate. © 2019 Black Knight Financial Technology Solutions, LLC. All Rights Reserved.
MORTGAGE MONITOR
AUGUST 2019 | 10
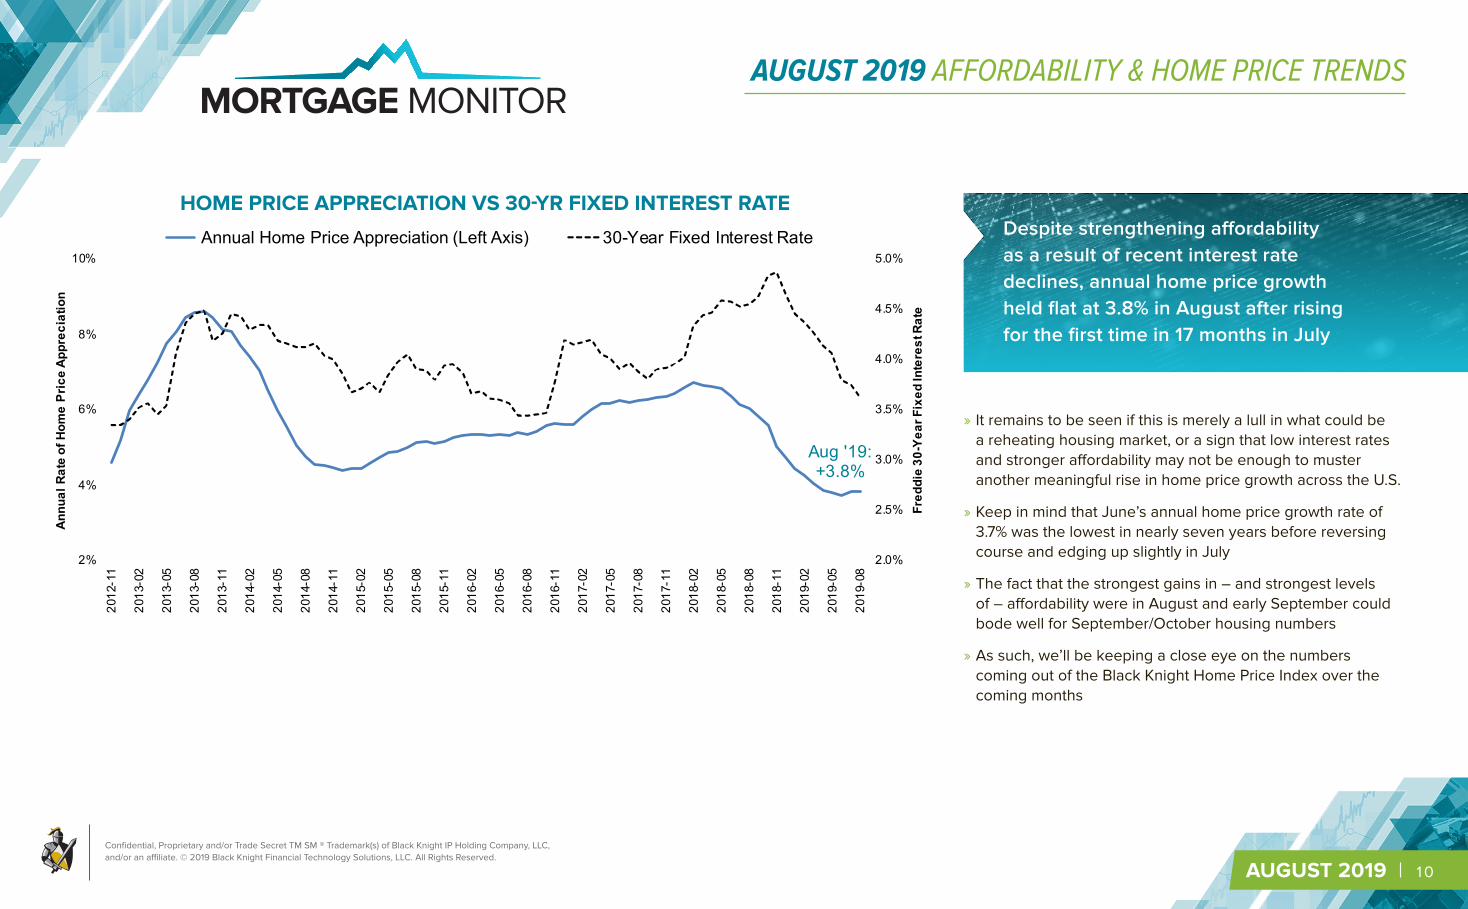
» It remains to be seen if this is merely a lull in what could be a reheating housing market, or a sign that low interest rates and stronger affordability may not be enough to muster another meaningful rise in home price growth across the U.S.
» Keep in mind that June’s annual home price growth rate of 3.7% was the lowest in nearly seven years before reversing course and edging up slightly in July
» The fact that the strongest gains in – and strongest levels of – affordability were in August and early September could bode well for September/October housing numbers
» As such, we’ll be keeping a close eye on the numbers coming out of the Black Knight Home Price Index over the coming months
Aug '19:+3.8%
2.0%
2.5%
3.0%
3.5%
4.0%
4.5%
5.0%
2%
4%
6%
8%
10%
2012
-11
2013
-02
2013
-05
2013
-08
2013
-11
2014
-02
2014
-05
2014
-08
2014
-11
2015
-02
2015
-05
2015
-08
2015
-11
2016
-02
2016
-05
2016
-08
2016
-11
2017
-02
2017
-05
2017
-08
2017
-11
2018
-02
2018
-05
2018
-08
2018
-11
2019
-02
2019
-05
2019
-08
Fred
die
30-Y
ear F
ixed
Inte
rest
Rat
e
Annu
al R
ate
of H
ome
Pric
e Ap
prec
iatio
n
HOME PRICE APPRECIATION VS 30-YR FIXED INTEREST RATEAnnual Home Price Appreciation (Left Axis) 30-Year Fixed Interest Rate
BLACK KNIGHT HOME PRICE INDEX
Despite strengthening affordability as a result of recent interest rate declines, annual home price growth held flat at 3.8% in August after rising for the first time in 17 months in July
HOME PRICE APPRECIATION VS 30-YR FIXED INTEREST RATE
AUGUST 2019 AFFORDABILITY & HOME PRICE TRENDS

Confidential, Proprietary and/or Trade Secret TM SM ® Trademark(s) of Black Knight IP Holding Company, LLC, and/or an affiliate. © 2019 Black Knight Financial Technology Solutions, LLC. All Rights Reserved.
MORTGAGE MONITOR
AUGUST 2019 | 11
PAYMENT-TO-INCOME RATIO BY CBSA – SEPTEMBER 2019
13%
17%
14%
19%
17%15%
20%
13%
20%
14%
16%
18%
21%26%
13%
38%37%
35%
18%
22%
26%
25%
18%
17%
20%
22%
24%
16%
21%
18%
19%
32%
15%
15%
18%28%
21%
16%
20%
17%
17%
25%
17%
19%
17%
16%
43%16%
23% 19%
15%
17%
20%
15%
17%
14%
17%
16%
24%
17%
14%
13%
24%
20%
13%
18%
16%
15%
22%
13%
14%
16%
18% 19%
21%
20%
17%25%
24%
17%
16%
17%
21%
20%
16%16%
15%
20%
15%
BLUE = LESS AFFORDABLE THAN NATIONAL AVERAGEGREEN = MORE AFFORDABLE THAN NATIONAL AVERAGE
*Payment-to-Income Ratio is the share of median household income needed to make the monthly principal and interest payment on the purchase of the median priced home using a 20% down 30-year fixed rate mortgage at the prevailing interest rate
Rank Geography (CBSA) July 2006(Pre-Crisis Peak)
Nov 2018(30-YR = 4.87%)
Sept 2019 (30-YR = 3.64%)
1 Dayton, OH 20.3% 13.8% 12.6%2 Akron, OH 22.5% 14.0% 12.7%3 Youngstown, OH 19.9% 14.3% 12.8%4 Scranton, PA 24.5% 14.6% 13.0%5 Toledo, OH 20.7% 14.4% 13.2%6 Cleveland, OH 22.3% 14.4% 13.2%7 Des Moines, IA 20.9% 14.8% 13.4%8 Rochester, NY 19.0% 14.8% 13.7%9 Wichita, KS 19.0% 15.1% 13.7%10 Hartford, CT 26.6% 15.4% 13.7%
10 MOST AFFORDABLE MARKETS (CBSAs)
Rank Geography (CBSA) July 2006(Pre-Crisis Peak)
Nov 2018(30-YR = 4.87%)
Sept 2019(30-YR = 3.64%)
91 Seattle, WA 38.1% 28.8% 25.9%92 Sacramento, CA 46.7% 28.8% 26.1%93 Stockton, CA 52.4% 29.6% 26.4%94 New York-Newark, NY-NJ 49.1% 31.6% 28.1%95 Oxnard, CA 52.4% 36.2% 31.9%96 Honolulu, HI 48.0% 36.5% 32.1%97 San Diego, CA 57.4% 38.8% 34.8%98 San Francisco, CA 59.2% 42.0% 37.1%99 San Jose, CA 53.7% 45.3% 37.9%
100 Los Angeles, CA 70.8% 48.3% 42.9%
10 LEAST AFFORDABLE MARKETS (CBSAs)
» While falling interest rates have improved affordability across the country, pockets of tight affordability remain, especially on the West Coast
» In November 2018, 11 states had become less affordable than their own long-term averages; today, with rates at 3.64%, only California and Hawaii remain so
» In fact, California now accounts for seven of the 10 least affordable markets in the nation, despite interest rates at or near multi-year lows
» In Los Angeles for example, purchasing the average-priced home requires nearly 43% of the median household income -- more than twice the national average
» While down from more than 48% near the end of 2018, that payment-to-income ratio still makes Los Angeles the country's least affordable market
» San Jose is the second least affordable market, with a 38% payment-to-income ratio
» Tight affordability was likely a key driver in the strong deceleration in West Coast home price growth that began as interest rates rose in late 2018
» The Midwest remains the most affordable region of the country, with payment-to-income ratios well below the national average
AUGUST 2019 AFFORDABILITY & HOME PRICE TRENDS
PAYMENT-TO-INCOME RATIO BY CBSA – SEPTEMBER 2O19BLUE = LESS AFFORDABLE THAN NATIONAL AVERAGE
GREEN = MORE AFFORDABLE THAN NATIONAL AVERAGE
10 MOST AFFORDABLE MARKETS (CBSAs)
10 LEAST AFFORDABLE MARKETS (CBSAs)
Confidential, Proprietary and/or Trade Secret TM SM ® Trademark(s) of Black Knight IP Holding Company, LLC, and/or an affiliate. © 2019 Black Knight Financial Technology Solutions, LLC. All Rights Reserved.
MORTGAGE MONITOR
AUGUST 2019 | 12
-10.0%
-5.0%
0.0%
5.0%
10.0%
15.0%
20.0%
25.0%
30.0%
2012
-02
2012
-05
2012
-08
2012
-11
2013
-02
2013
-05
2013
-08
2013
-11
2014
-02
2014
-05
2014
-08
2014
-11
2015
-02
2015
-05
2015
-08
2015
-11
2016
-02
2016
-05
2016
-08
2016
-11
2017
-02
2017
-05
2017
-08
2017
-11
2018
-02
2018
-05
2018
-08
2018
-11
2019
-02
2019
-05
2019
-08
ANNUAL HOME PRICE GROWTH RATE BY CBSAUnited States California Los Angeles, CASan Francisco, CA San Jose, CA Seattle, WA
*Payment-to-Income Ratio is the share of median household income needed to make the monthly principal and interest payment on the purchase of the median priced home using a 20% down 30-year fixed rate mortgage at the prevailing interest rate
0%
10%
20%
30%
40%
50%
60%
70%
80%
19950
9
19960
9
19970
9
19980
9
19990
9
20000
9
20010
9
20020
9
20030
9
20040
9
20050
9
20060
9
20070
9
20080
9
20090
9
20100
9
20110
9
20120
9
20130
9
20140
9
20150
9
20160
9
20170
9
20180
9
20190
9
PAYMENT-TO-INCOME RATIO – CBSA-LEVEL DETAILUnited States California Los Angeles, CASan Jose, CA San Francisco, CA Seattle, WA
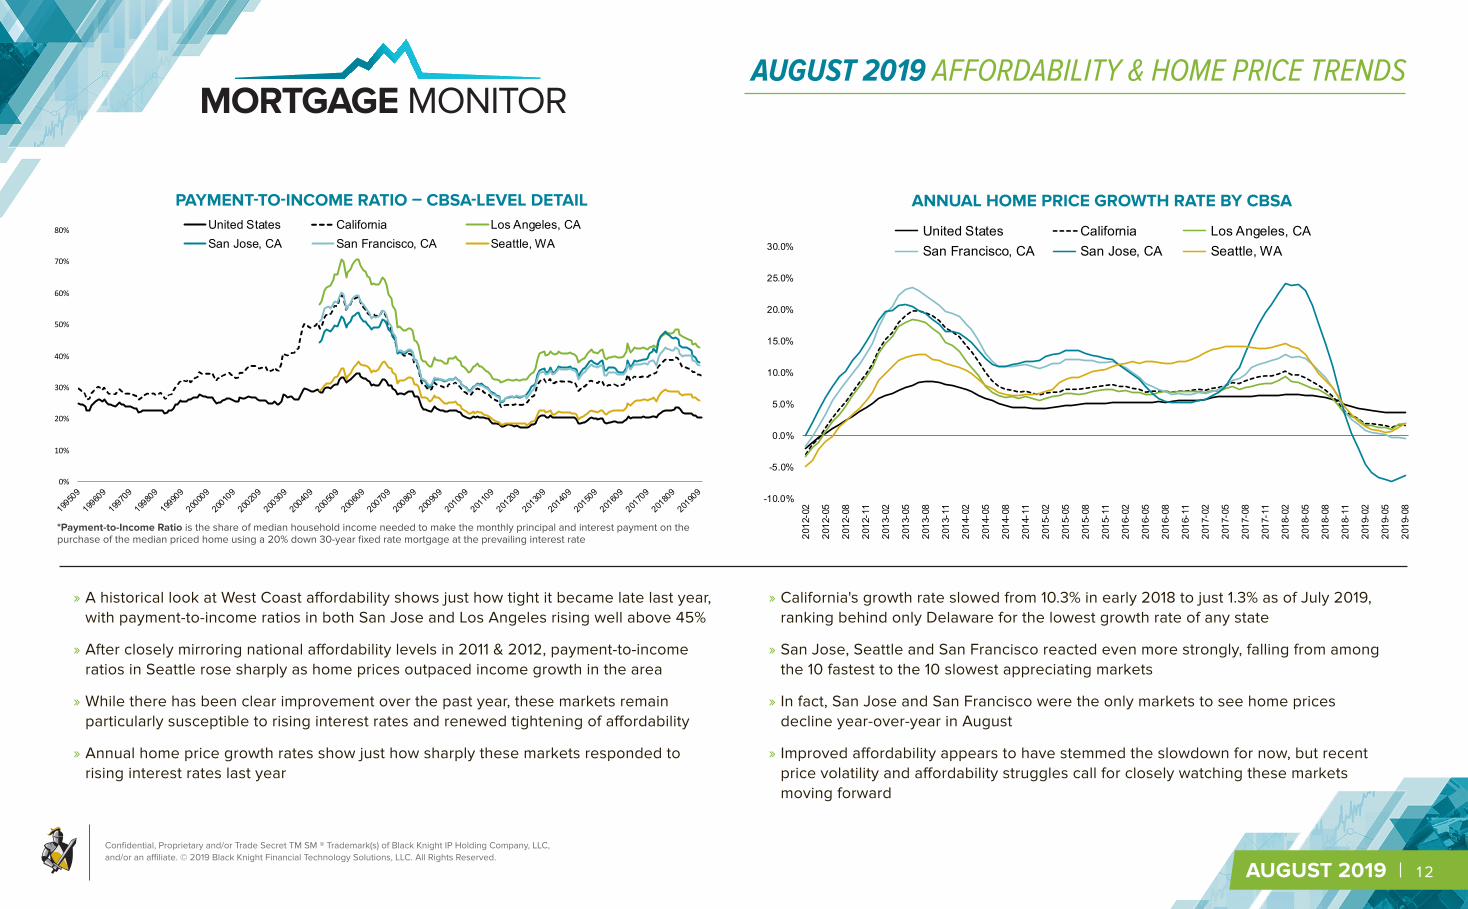
» A historical look at West Coast affordability shows just how tight it became late last year, with payment-to-income ratios in both San Jose and Los Angeles rising well above 45%
» After closely mirroring national affordability levels in 2011 & 2012, payment-to-income ratios in Seattle rose sharply as home prices outpaced income growth in the area
» While there has been clear improvement over the past year, these markets remain particularly susceptible to rising interest rates and renewed tightening of affordability
» Annual home price growth rates show just how sharply these markets responded to rising interest rates last year
» California's growth rate slowed from 10.3% in early 2018 to just 1.3% as of July 2019, ranking behind only Delaware for the lowest growth rate of any state
» San Jose, Seattle and San Francisco reacted even more strongly, falling from among the 10 fastest to the 10 slowest appreciating markets
» In fact, San Jose and San Francisco were the only markets to see home prices decline year-over-year in August
» Improved affordability appears to have stemmed the slowdown for now, but recent price volatility and affordability struggles call for closely watching these markets moving forward
PAYMENT-TO-INCOME RATIO – CBSA-LEVEL DETAIL ANNUAL HOME PRICE GROWTH RATE BY CBSA
AUGUST 2019 AFFORDABILITY & HOME PRICE TRENDS
*Payment-to-Income Ratio is the share of median household income needed to make the monthly principal and interest payment on the purchase of the median priced home using a 20% down 30-year fixed rate mortgage at the prevailing interest rate

Confidential, Proprietary and/or Trade Secret TM SM ® Trademark(s) of Black Knight IP Holding Company, LLC, and/or an affiliate. © 2019 Black Knight Financial Technology Solutions, LLC. All Rights Reserved.
MORTGAGE MONITOR
AUGUST 2019 | 13
» Boise, ID continues to the lead the nation in terms of annual home price growth and is one of only three markets seeing double-digit Y/Y gains
» In fact, much of the western Rocky Mountains remain strong from an appreciation standpoint
» Still, the four markets with the highest home price growth rates all cooled slightly in August
» The majority of the Midwest continues to see home price growth rates above the national average, while also representing some of the most affordable areas
» At the same time, growth rates in many coastal areas are below the national average, as affordability pressures continue to weigh on those markets
» In California, San Jose, San Francisco, Oxnard and L.A. all rank among the bottom 10 in terms of home price growth rates
AUGUST 2019 AFFORDABILITY & HOME PRICE TRENDS
ANNUAL HOME PRICE GROWTH RATES – AUGUST 2019BLUE = HOME PRICE GROWTH RATE ABOVE NATIONAL AVERAGE
GREEN = HOME PRICE GROWTH RATE BELOW NATIONAL AVERAGERank Geography (CBSA) Annual Home Price Growth
(Aug 2019)1-Mo Change
(In Annual Rate)1 Boise City, ID +11.6% -0.3%2 St. Louis, MO +10.5% -0.2%3 Spokane, WA +10.4% -0.1%4 Ogden, UT +8.0% -0.3%5 Syracuse, NY +7.7% +0.5%6 Knoxville, TN +7.5% +0.3%7 Memphis, TN +7.4% +0.3%8 Colorado Springs, CO +7.4% +0.3%9 Buffalo, NY +7.3% +0.7%
10 Milwaukee, WI +6.9% +1.1%
HIGHEST HOME PRICE GROWTH RATES
Rank Geography (CBSA) Annual Home Price Growth(Aug 2019)
1-Mo Change(In Annual Rate)
91 Los Angeles, CA +1.9% +0.1%92 Houston, TX +1.8% -0.3%93 Baltimore, MD +1.2% -0.3%94 Honolulu, HI +1.2% +0.1%95 Baton Rouge, LA +1.0% +0.2%96 Bridgeport, CT +0.8% +0.3%97 Oxnard, CA +0.7% -0.3%98 Cape Coral, FL +0.2% -1.1%99 San Francisco, CA -0.4% -0.3%100 San Jose, CA -6.3% +0.3%
LOWEST HOME PRICE GROWTH RATES
ANNUAL HOME PRICE GROWTH RATES – AUGUST 2019BLUE = HOME PRICE GROWTH RATE ABOVE NATIONAL AVERAGE
GREEN = HOME PRICE GROWTH RATE BELOW NATIONAL AVERAGE
HIGHEST HOME PRICE GROWTH RATES
LOWEST HOME PRICE GROWTH RATES
Confidential, Proprietary and/or Trade Secret TM SM ® Trademark(s) of Black Knight IP Holding Company, LLC, and/or an affiliate. © 2019 Black Knight Financial Technology Solutions, LLC. All Rights Reserved.
MORTGAGE MONITOR
AUGUST 2019 | 14
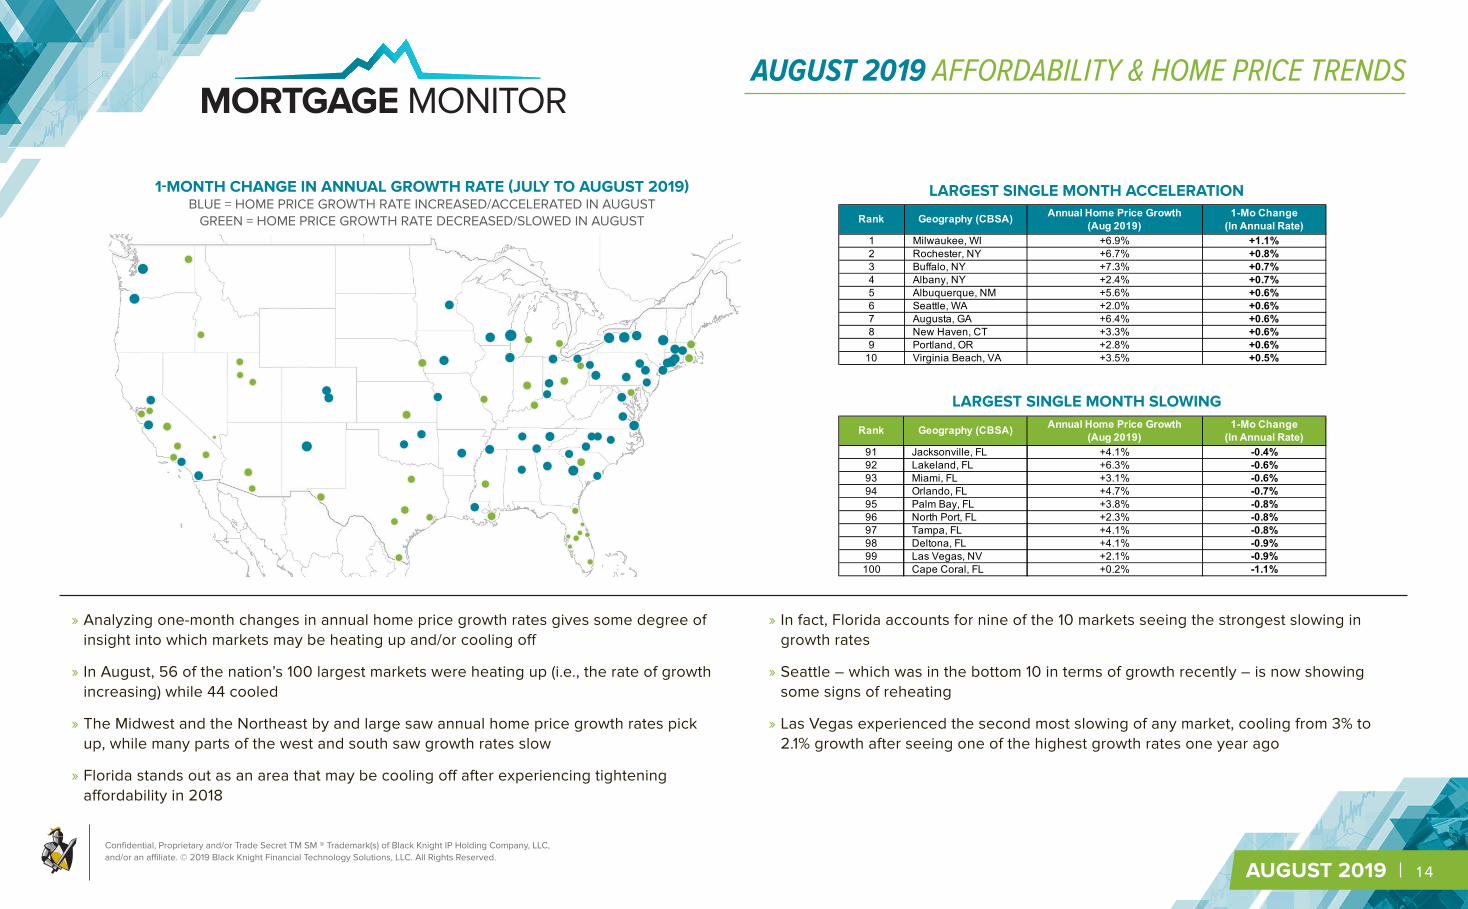
» Analyzing one-month changes in annual home price growth rates gives some degree of insight into which markets may be heating up and/or cooling off
» In August, 56 of the nation’s 100 largest markets were heating up (i.e., the rate of growth increasing) while 44 cooled
» The Midwest and the Northeast by and large saw annual home price growth rates pick up, while many parts of the west and south saw growth rates slow
» Florida stands out as an area that may be cooling off after experiencing tightening affordability in 2018
» In fact, Florida accounts for nine of the 10 markets seeing the strongest slowing in growth rates
» Seattle – which was in the bottom 10 in terms of growth recently – is now showing some signs of reheating
» Las Vegas experienced the second most slowing of any market, cooling from 3% to 2.1% growth after seeing one of the highest growth rates one year ago
AUGUST 2019 AFFORDABILITY & HOME PRICE TRENDS
1-MONTH CHANGE IN ANNUAL GROWTH RATE (JULY TO AUGUST 2019)BLUE = HOME PRICE GROWTH RATE INCREASED/ACCELERATED IN AUGUST
GREEN = HOME PRICE GROWTH RATE DECREASED/SLOWED IN AUGUST Rank Geography (CBSA) Annual Home Price Growth(Aug 2019)
1-Mo Change(In Annual Rate)
1 Milwaukee, WI +6.9% +1.1%2 Rochester, NY +6.7% +0.8%3 Buffalo, NY +7.3% +0.7%4 Albany, NY +2.4% +0.7%5 Albuquerque, NM +5.6% +0.6%6 Seattle, WA +2.0% +0.6%7 Augusta, GA +6.4% +0.6%8 New Haven, CT +3.3% +0.6%9 Portland, OR +2.8% +0.6%
10 Virginia Beach, VA +3.5% +0.5%
LARGEST SINGLE MONTH ACCELERATION
Rank Geography (CBSA) Annual Home Price Growth(Aug 2019)
1-Mo Change(In Annual Rate)
91 Jacksonville, FL +4.1% -0.4%92 Lakeland, FL +6.3% -0.6%93 Miami, FL +3.1% -0.6%94 Orlando, FL +4.7% -0.7%95 Palm Bay, FL +3.8% -0.8%96 North Port, FL +2.3% -0.8%97 Tampa, FL +4.1% -0.8%98 Deltona, FL +4.1% -0.9%99 Las Vegas, NV +2.1% -0.9%100 Cape Coral, FL +0.2% -1.1%
LARGEST SINGLE MONTH SLOWING
1-MONTH CHANGE IN ANNUAL GROWTH RATE (JULY TO AUGUST 2019)BLUE = HOME PRICE GROWTH RATE INCREASED/ACCELERATED IN AUGUST
GREEN = HOME PRICE GROWTH RATE DECREASED/SLOWED IN AUGUST
LARGEST SINGLE MONTH ACCELERATION
LARGEST SINGLE MONTH SLOWING

Confidential, Proprietary and/or Trade Secret TM SM ® Trademark(s) of Black Knight IP Holding Company, LLC, and/or an affiliate. © 2019 Black Knight Financial Technology Solutions, LLC. All Rights Reserved.
MORTGAGE MONITOR
AUGUST 2019 | 15
» Among the 100 largest markets, the average annual home price growth rate of Tier 1 properties (those in the bottom 20% of their respective market) is currently 6.1%
» That is more than 50% higher than those in the middle price tier (4%) and more than 2X that of the highest priced homes (Tier 5) at 2.5%
» After peaking in February of 2018 at +9%, growth among Tier 1 properties has fallen to 6.1% as of August 2019, the largest slowdown of any price tier
» The gap between the low and high ends of the market has narrowed from 5% to 3.6% over the past 19 months
» This trend is consistent across much of the country, with Tier 1 prices rising faster than the median price in 96 of the nation’s 100 largest markets
» The delta is highest in Bridgeport, CT; New York, NY; Atlanta, GA; Kansas City, MO; Seattle, WA; and Detroit, MI
» Only Toledo, OH; Denver, CO; San Jose, CA; and Albuquerque, NM are seeing Tier 1 growth rates lower than that of the median home
+6.1%+4.0%+2.5%
-15.0%
-10.0%
-5.0%
0.0%
5.0%
10.0%
15.0%
20.0%
1995-0
8
1996-0
8
1997-0
8
1998-0
8
1999-0
8
2000-0
8
2001-0
8
2002-0
8
2003-0
8
2004-0
8
2005-0
8
2006-0
8
2007-0
8
2008-0
8
2009-0
8
2010-0
8
2011-0
8
2012-0
8
2013-0
8
2014-0
8
2015-0
8
2016-0
8
2017-0
8
2018-0
8
2019-0
8
AVERAGE ANNUAL HOME PRICE GROWTH BY PRICE TIER(AMONG 100 LARGEST MARKETS)
Price Tier 1 (Bottom 20%) Tier 2 Tier 3 Tier 4 Price Tier 5 (Top 20%)
Price tiers for the above analysis determined at the CBSA level
Despite a recently narrowing margin, price growth among the lowest price tier continues to outpace all other segments of the market
AUGUST 2019 AFFORDABILITY & HOME PRICE TRENDS
AVERAGE ANNUAL HOME PRICE GROWTH BY PRICE TIER(AMONG 100 LARGEST MARKETS)
Price tiers for the above analysis determined at the CBSA level
Confidential, Proprietary and/or Trade Secret TM SM ® Trademark(s) of Black Knight IP Holding Company, LLC, and/or an affiliate. © 2019 Black Knight Financial Technology Solutions, LLC. All Rights Reserved.
MORTGAGE MONITOR
AUGUST 2019 | 16
Aug-19 Monthly Change
YTD Change
Yearly Change
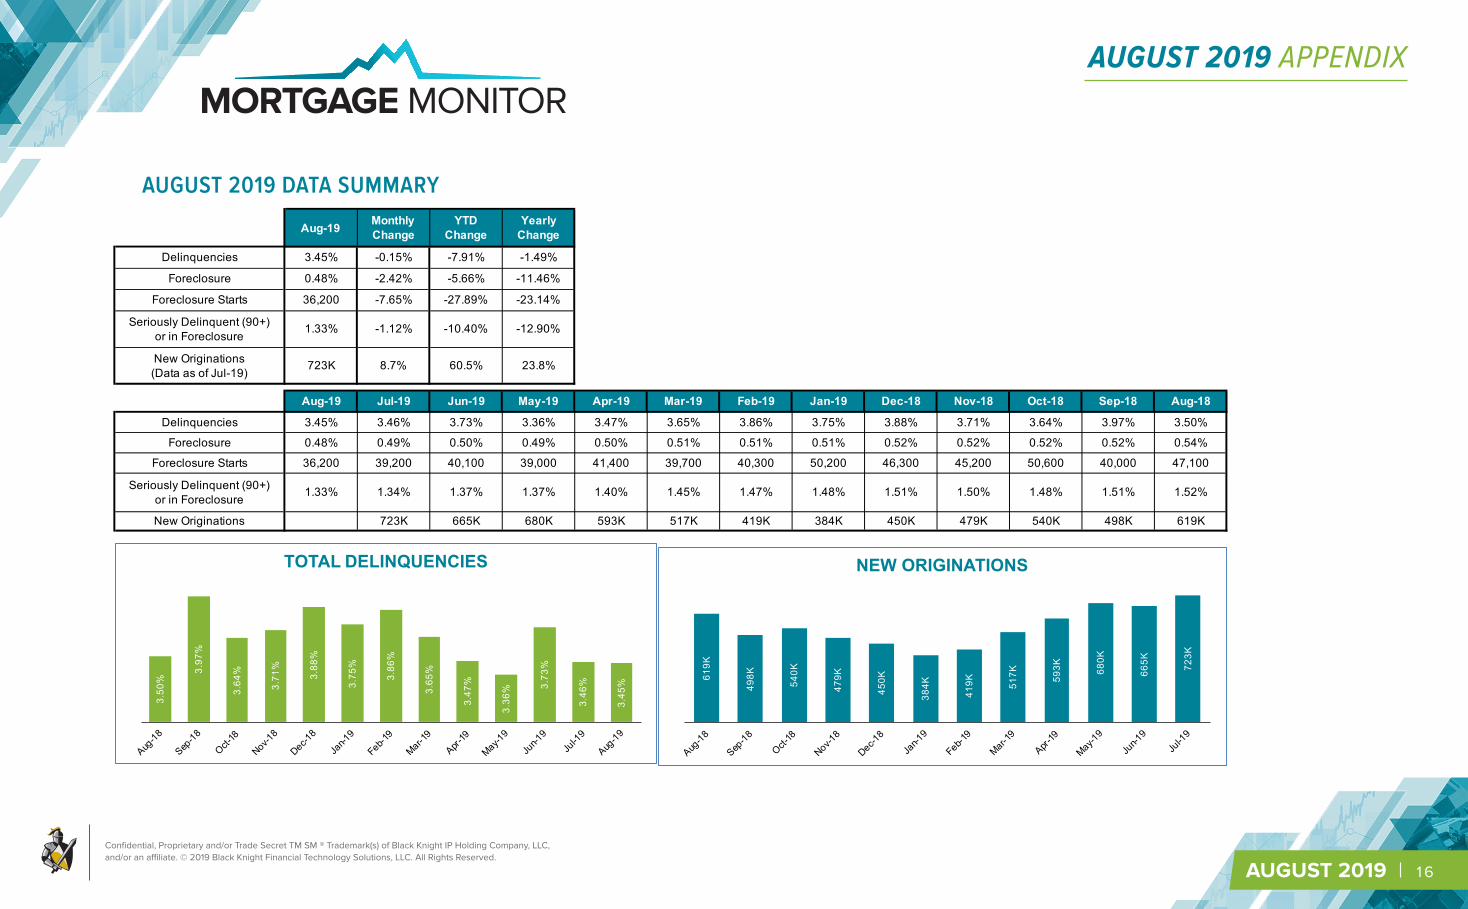
Delinquencies 3.45% -0.15% -7.91% -1.49%
Foreclosure 0.48% -2.42% -5.66% -11.46%
Foreclosure Starts 36,200 -7.65% -27.89% -23.14%
Seriously Delinquent (90+) or in Foreclosure 1.33% -1.12% -10.40% -12.90%
New Originations (Data as of Jul-19) 723K 8.7% 60.5% 23.8%
Aug-19 Jul-19 Jun-19 May-19 Apr-19 Mar-19 Feb-19 Jan-19 Dec-18 Nov-18 Oct-18 Sep-18 Aug-18
Delinquencies 3.45% 3.46% 3.73% 3.36% 3.47% 3.65% 3.86% 3.75% 3.88% 3.71% 3.64% 3.97% 3.50%
Foreclosure 0.48% 0.49% 0.50% 0.49% 0.50% 0.51% 0.51% 0.51% 0.52% 0.52% 0.52% 0.52% 0.54%
Foreclosure Starts 36,200 39,200 40,100 39,000 41,400 39,700 40,300 50,200 46,300 45,200 50,600 40,000 47,100
Seriously Delinquent (90+) or in Foreclosure 1.33% 1.34% 1.37% 1.37% 1.40% 1.45% 1.47% 1.48% 1.51% 1.50% 1.48% 1.51% 1.52%
New Originations 723K 665K 680K 593K 517K 419K 384K 450K 479K 540K 498K 619K
3.50
%
3.97
%
3.64
%
3.71
%
3.88
%
3.75
%
3.86
%
3.65
%
3.47
%
3.36
% 3.73
%
3.46
%
3.45
%
Aug-18
Sep-18
Oct-18
Nov-18
Dec-18
Jan-1
9
Feb-19
Mar-19
Apr-19
May-19
Jun-1
9Ju
l-19
Aug-19
TOTAL DELINQUENCIES
619K
498K
540K
479K
450K
384K
419K 51
7K 593K 68
0K
665K 72
3K
Aug-18
Sep-18
Oct-18
Nov-18
Dec-18
Jan-1
9
Feb-19
Mar-19
Apr-19
May-19
Jun-1
9Ju
l-19
NEW ORIGINATIONS
AUGUST 2019 DATA SUMMARY
AUGUST 2019 APPENDIX

Confidential, Proprietary and/or Trade Secret TM SM ® Trademark(s) of Black Knight IP Holding Company, LLC, and/or an affiliate. © 2019 Black Knight Financial Technology Solutions, LLC. All Rights Reserved.
MORTGAGE MONITOR
AUGUST 2019 | 17
Month TOTAL ACTIVE COUNT 30 DAYS 60 DAYS 90+ DAYS FC Total NC FC Starts Average Days
Delinquent for 90+Average Days
Delinquent for FCRatio of 90+
to FC
1/31/05 47,706,128 1,197,062 339,920 458,719 276,745 2,272,446 50,922 242 324 165.8%1/31/06 50,900,620 1,242,434 387,907 542,378 258,613 2,431,332 76,477 207 308 209.7%1/31/07 53,900,458 1,425,030 468,441 551,439 393,973 2,838,883 117,419 203 267 140.0%1/31/08 55,478,782 1,743,420 676,266 950,639 813,560 4,183,885 195,033 190 256 116.8%1/31/09 55,788,441 2,001,314 932,436 1,878,981 1,321,029 6,133,760 250,621 193 323 142.2%1/31/10 55,098,009 1,945,589 903,778 2,972,983 2,068,572 7,890,922 292,308 253 418 143.7%1/31/11 53,861,778 1,750,601 746,634 2,078,130 2,245,250 6,820,615 277,374 333 527 92.6%1/31/12 52,687,781 1,592,463 652,524 1,796,698 2,205,818 6,247,503 223,394 395 666 81.5%1/31/13 51,229,692 1,464,583 587,661 1,551,415 1,742,689 5,346,348 156,654 460 803 89.0%1/31/14 50,380,779 1,341,074 529,524 1,278,955 1,213,046 4,362,599 97,467 486 935 105.4%1/31/15 50,412,744 1,238,453 465,849 1,060,002 884,901 3,649,204 93,280 509 1,031 119.8%1/31/16 50,541,353 1,298,682 444,594 831,284 659,237 3,233,797 71,900 495 1,047 126.1%1/31/17 50,871,357 1,108,712 389,768 663,521 480,598 2,642,599 70,357 454 1,013 138.1%1/31/18 51,155,753 1,083,162 412,676 706,623 336,613 2,539,074 62,312 364 932 209.9%1/31/19 51,896,438 1,074,044 367,750 503,655 264,875 2,210,325 50,196 391 830 190.1%2/28/19 51,854,081 1,138,116 362,154 500,822 263,707 2,264,798 40,289 385 839 189.9%3/31/19 52,081,244 1,061,924 348,443 492,889 264,451 2,167,707 39,657 391 853 186.4%4/30/19 52,228,211 1,003,514 335,160 473,565 259,290 2,071,529 41,356 393 880 182.6%5/31/19 52,304,596 965,815 332,992 461,036 255,386 2,015,229 38,970 394 897 180.5%6/30/19 52,288,778 1,145,626 349,170 454,890 259,274 2,208,960 40,126 364 920 175.4%7/31/19 52,260,606 1,020,037 343,343 443,500 257,859 2,064,739 39,189 369 908 172.0%8/31/19 52,519,269 1,025,863 343,145 444,029 252,873 2,065,911 36,179 364 913 175.6%
LOAN COUNTS AND AVERAGE DAYS DELINQUENT
AUGUST 2019 APPENDIX
Confidential, Proprietary and/or Trade Secret TM SM ® Trademark(s) of Black Knight IP Holding Company, LLC, and/or an affiliate. © 2019 Black Knight Financial Technology Solutions, LLC. All Rights Reserved.
MORTGAGE MONITOR
AUGUST 2019 | 18
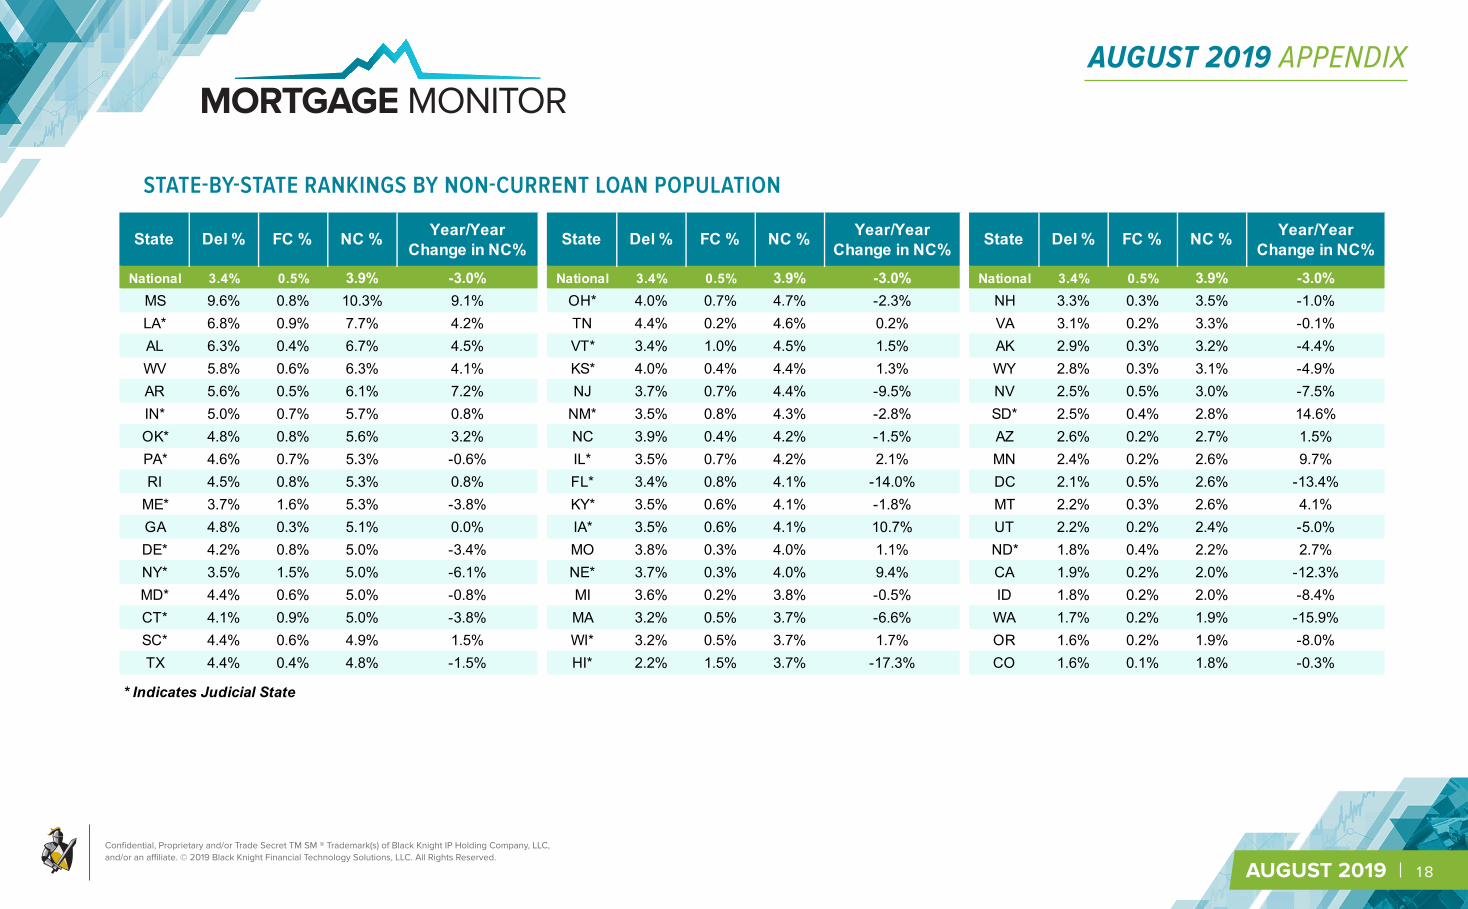
State Del % FC % NC % Year/Year Change in NC% State Del % FC % NC % Year/Year
Change in NC% State Del % FC % NC % Year/Year Change in NC%
National 3.4% 0.5% 3.9% -3.0% National 3.4% 0.5% 3.9% -3.0% National 3.4% 0.5% 3.9% -3.0%MS 9.6% 0.8% 10.3% 9.1% OH* 4.0% 0.7% 4.7% -2.3% NH 3.3% 0.3% 3.5% -1.0%LA* 6.8% 0.9% 7.7% 4.2% TN 4.4% 0.2% 4.6% 0.2% VA 3.1% 0.2% 3.3% -0.1%AL 6.3% 0.4% 6.7% 4.5% VT* 3.4% 1.0% 4.5% 1.5% AK 2.9% 0.3% 3.2% -4.4%WV 5.8% 0.6% 6.3% 4.1% KS* 4.0% 0.4% 4.4% 1.3% WY 2.8% 0.3% 3.1% -4.9%AR 5.6% 0.5% 6.1% 7.2% NJ 3.7% 0.7% 4.4% -9.5% NV 2.5% 0.5% 3.0% -7.5%IN* 5.0% 0.7% 5.7% 0.8% NM* 3.5% 0.8% 4.3% -2.8% SD* 2.5% 0.4% 2.8% 14.6%OK* 4.8% 0.8% 5.6% 3.2% NC 3.9% 0.4% 4.2% -1.5% AZ 2.6% 0.2% 2.7% 1.5%PA* 4.6% 0.7% 5.3% -0.6% IL* 3.5% 0.7% 4.2% 2.1% MN 2.4% 0.2% 2.6% 9.7%RI 4.5% 0.8% 5.3% 0.8% FL* 3.4% 0.8% 4.1% -14.0% DC 2.1% 0.5% 2.6% -13.4%ME* 3.7% 1.6% 5.3% -3.8% KY* 3.5% 0.6% 4.1% -1.8% MT 2.2% 0.3% 2.6% 4.1%GA 4.8% 0.3% 5.1% 0.0% IA* 3.5% 0.6% 4.1% 10.7% UT 2.2% 0.2% 2.4% -5.0%DE* 4.2% 0.8% 5.0% -3.4% MO 3.8% 0.3% 4.0% 1.1% ND* 1.8% 0.4% 2.2% 2.7%NY* 3.5% 1.5% 5.0% -6.1% NE* 3.7% 0.3% 4.0% 9.4% CA 1.9% 0.2% 2.0% -12.3%MD* 4.4% 0.6% 5.0% -0.8% MI 3.6% 0.2% 3.8% -0.5% ID 1.8% 0.2% 2.0% -8.4%CT* 4.1% 0.9% 5.0% -3.8% MA 3.2% 0.5% 3.7% -6.6% WA 1.7% 0.2% 1.9% -15.9%SC* 4.4% 0.6% 4.9% 1.5% WI* 3.2% 0.5% 3.7% 1.7% OR 1.6% 0.2% 1.9% -8.0%TX 4.4% 0.4% 4.8% -1.5% HI* 2.2% 1.5% 3.7% -17.3% CO 1.6% 0.1% 1.8% -0.3%
* Indicates Judicial State
STATE-BY-STATE RANKINGS BY NON-CURRENT LOAN POPULATION
AUGUST 2019 APPENDIX

Confidential, Proprietary and/or Trade Secret TM SM ® Trademark(s) of Black Knight IP Holding Company, LLC, and/or an affiliate. © 2019 Black Knight Financial Technology Solutions, LLC. All Rights Reserved.
MORTGAGE MONITOR
AUGUST 2019 | 19
Mortgage Monitor Disclosures
You can reach us by email [email protected]
Follow us on Twitter@Black_KnightInc
AUGUST 2019 DISCLOSURE
Confidential, Proprietary and/or Trade Secret TM SM ® Trademark(s) of Black Knight IP Holding Company, LLC, and/or an affiliate. © 2019 Black Knight Financial Technology Solutions, LLC. All Rights Reserved.
MORTGAGE MONITOR
AUGUST 2019 | 20
AUGUST 2019 DEFINITIONS
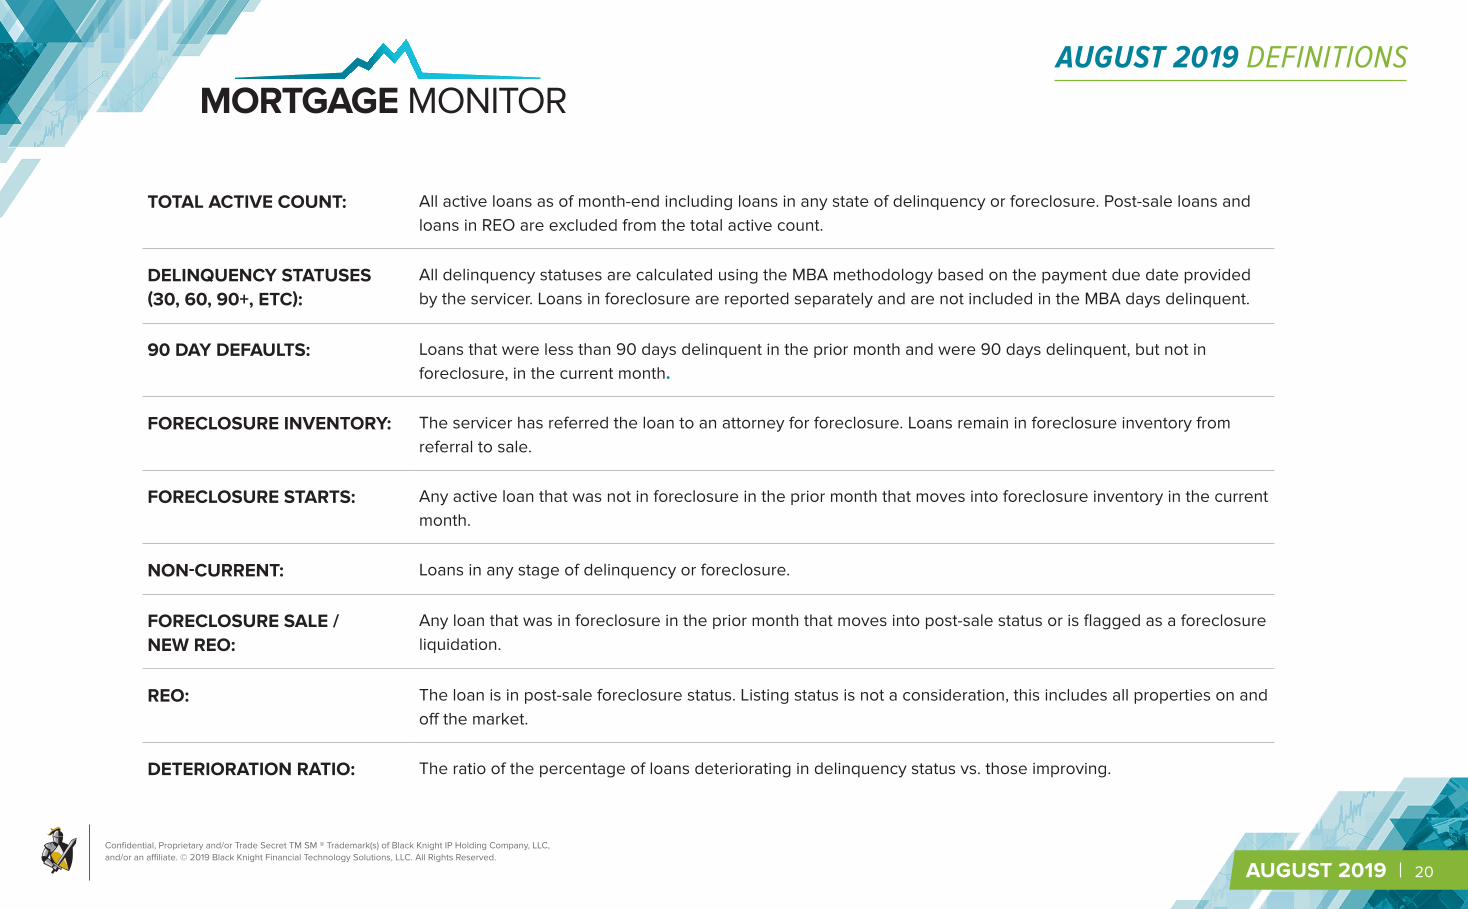
TOTAL ACTIVE COUNT: All active loans as of month-end including loans in any state of delinquency or foreclosure. Post-sale loans and loans in REO are excluded from the total active count.
DELINQUENCY STATUSES (30, 60, 90+, ETC):
All delinquency statuses are calculated using the MBA methodology based on the payment due date provided by the servicer. Loans in foreclosure are reported separately and are not included in the MBA days delinquent.
90 DAY DEFAULTS: Loans that were less than 90 days delinquent in the prior month and were 90 days delinquent, but not in foreclosure, in the current month.
FORECLOSURE INVENTORY: The servicer has referred the loan to an attorney for foreclosure. Loans remain in foreclosure inventory from referral to sale.
FORECLOSURE STARTS: Any active loan that was not in foreclosure in the prior month that moves into foreclosure inventory in the current month.
NON-CURRENT: Loans in any stage of delinquency or foreclosure.
FORECLOSURE SALE / NEW REO:
Any loan that was in foreclosure in the prior month that moves into post-sale status or is flagged as a foreclosure liquidation.
REO: The loan is in post-sale foreclosure status. Listing status is not a consideration, this includes all properties on and off the market.
DETERIORATION RATIO: The ratio of the percentage of loans deteriorating in delinquency status vs. those improving.


