24
MOTION AND TIME STUDY FOR ENHANCING THE ASSEMBLY PROCESS AT PHN INDUSTRY SDN BHD ISMAIL BIN IBRAHIM B050910250 UNIVERSITI TEKNIKAL MALAYSIA MELAKA 2013
MOTION AND TIME STUDY FOR ENHANCING THE
ASSEMBLY PROCESS AT PHN INDUSTRY
SDN BHD
ISMAIL BIN IBRAHIM
B050910250
UNIVERSITI TEKNIKAL MALAYSIA MELAKA
2013

UNIVERSITI TEKNIKAL MALAYSIA MELAKA
MOTION AND TIME STUDY FOR ENHANCING THE
ASSEMBLY PROCESS AT PHN INDUSTRY SDN BHD
This report submitted in accordance with requirement of the Universiti Teknikal
Malaysia Melaka (UTeM) for the Bachelor Degree of Manufacturing Engineering
(Manufacturing Process) (Hons.)
by
ISMAIL BIN IBRAHIM
B050910250
880216-26-5365
FACULTY OF MANUFACTURING ENGINEERING
2013

UNIVERSITI TEKNIKAL MALAYSIA MELAKA
BORANG PENGESAHAN STATUS LAPORAN PROJEK SARJANA MUDA
TAJUK: Motion and Time Study for Enhancing the Assembly Process at PHN Industry Sdn Bhd
SESI PENGAJIAN: 2012/13 Semester 2 Saya ISMAIL BIN IBRAHIM Mengaku membenarkan Laporan PSM ini disimpan di Perpustakaan Universiti Teknikal Malaysia Melaka (UTeM) dengan syarat-syarat kegunaan seperti berikut:
1. Laporan PSM adalah hak milik Universiti Teknikal Malaysia Melaka dan penulis. 2. Perpustakaan Universiti Teknikal Malaysia Melaka dibenarkan membuat salinan
untuk tujuan pengajian sahaja dengan izin penulis. 3. Perpustakaan dibenarkan membuat salinan laporan PSM ini sebagai bahan
pertukaran antara institusi pengajian tinggi.
4. **Sila tandakan ( )
SULIT
TERHAD
TIDAK TERHAD
(Mengandungi maklumat yang berdarjah keselamatan atau kepentingan Malaysia sebagaimana yang termaktub dalam AKTA RAHSIA RASMI 1972)
(Mengandungi maklumat TERHAD yang telah ditentukan oleh organisasi / badan di mana penyelidikan dijalankan)
Alamat Tetap:
No 198, Kampung Tengah,
Kuala Kedah, 06600,
Kuala Kedah, Kedah.
Tarikh: ________________________
Disahkan oleh:
Cop Rasmi: Tarikh: _______________________
** Jika Laporan PSM ini SULIT atau TERHAD, sila lampirkan surat daripada pihak berkuasa/organisasi berkenaan dengan menyatakan sekali sebab dan tempoh laporan PSM ini perlu dikelaskan sebagai SULIT atau TERHAD.

DECLARATION
I hereby, declared this report entitled “Motion and Time Study for Enhancing the
Assembly Process at PHN Industry Sdn Bhd” is the results of my own research
except as cited in references.
Signature :
Author’s Name : ISMAIL BIN IBRAHIM
Date : 03 / 06 / 2013

APPROVAL
This report is submitted to the Faculty of Manufacturing Engineering of UTeM
as a partial fulfillment of the requirements for the degree of Bachelor of
Manufacturing Engineering (Process) (Hons.). The member of the supervisory is
as follow:
………………………………
PROF. MADYA DR. MOHD RIZAL BIN SALLEH
(Project Supervisor)

i
ABSTRAK
Kajian ini bertujuan untuk meningkatkan hasil kimpalan bertompok dengan
mengurangkan kadar masa mesin yang tidak produktif. Faktor-faktor seperti
pergerakkan pekerja, masa yang diperlukan bagi sesuatu kerja disiapkan dan punca
yang menyebabkan mesin tidak dapat digunakan secara optimum akan
dipertimbangkan. Segala maklumat berkaitan dengan tajuk ini akan dikumpulkan
melalui pembacaan jurnal, buku dan lain-lain selain melalui lawatan organisasi untuk
mengenal pasti masalah dan skop. Beberapa kaedah boleh digunakan untuk
menganalisis data seperti borang semakan, gambarajah Pareto dan gambarajah punca
dan akibat. Penggunaan sesuatu mesin secara optimum dapat memberikan faedah
dalam pengeluaran. Ia berhasil mengurangkan jumlah masa yang terbuang seterusnya
meningkatkan kadar penghasilan. Selain itu, pengurangan kadar masa untuk
menghasilkan satu unit produk juga telah meningkatkan kadar pengeluaran pada
sesuatu masa. Pergerakan yang berulang dan jarak capaian yang tidak praktikal perlu
dihapuskan. Dengan penggunaan perisian Simul8, semua data yang dikumpul telah
dimasukkan sebagai maklumat bagi menghasilkan model proses pemasangan yang
dikaji. Aliran proses semasa telah dinilai dan diperbaiki bagi meningkatkan kadar
pengeluaran. Kadar pengeluaran dapat ditingkatkan sebanyak 9% dan penggunaan
mesin dapat dimaksimumkan dengan sepenuhnya.

ii
ABSTRACT
This study aims to improve productivity of spot weld process by reducing the time
loss. Factors such as the movements of workers, time taken to complete the job and
cause of the idle time will be measured to enhance productivity. The information
about the proposed title gathered through journals, books and others besides of
company visit to identify the problem statement and scope. Several methods has been
used to analyze the data obtained including check sheet, pareto diagram and cause
and effect diagram. Optimum use of a machine provides the benefits in production.
Its managed to reduce the amount of time spent and thus increasing the rate of
production. Futhermore, the reduction of time in producing a unit of product can also
increase the production rate at a time. Repeated movement and access distance which
is not practically done in manufacturing must be eliminated in order to increase the
productivity. By using a Simul8, a simulation software for process improvement, all
the necessary data have been included to visualized the model of assembly process
being investigated. The current process flow has been evaluated and all the waste
such as repeated movements have been eliminated and time taken to complete the
sub-assembly process also has reduced to enhancing the productivity. The improved
process flow show the increases of productivity by 9% and also increased
percentages of machine utilization thus minimized the idle time of the machines.

iii
DEDICATION
This work is dedicated to my beloved parents, my family, my supervisor, my friends
and my lecturers. I have been inspired and encouraged by them.

iv
ACKNOWLEDGEMENT
Alhamdulillah, thanks to Allah the Almighty for His will, I have the chance to finish
up my Projek Sarjana Muda (PSM) report from the very first word till end point
within the specified period.
First of all, I want express my appreciation to my PSM supervisor, Professor Madya
Dr Mohd Rizal bin Salleh for his supervision, comments and guidance in order to
make sure I can gain as much experience and knowledge to complete my PSM
report. I really appreciate the kindness and thoughts. Thank you.
Furthermore, I would like to take this opportunity to express my thankfulness and my
deepest to Mr Amirullah bin Mansor, Head of Manufacturing Melaka Section, and
Mr Kamrul Azwan bin Ahmad from company PHN Industry Sdn Bhd for their
guidance and willingness to share their knowledge with me. I also want to say thank
you to my fellow course mate from BMFP for the input sharing all the comments for
my PSM report.
At this juncture, it is only logical for me to pay compliment to my family. Their
undivided love and support are the beacons that have continued to motivate me
through the harshest of situations and I believe it will also spur me on to greater
achievement in the future.
Lastly, to those who are involved directly and indirectly with my PSM report
completion – I just can say thank you. Thanks for being so supportive and helpful all
the way through this process. Only Allah can repay for what they have done.

v
TABLE OF CONTENT
Abstrak i
Abstract ii
Dedication iii
Acknowledgement iv
Table of Content v
List of Tables viii
List of Figures ix
List of Abbreviations x
CHAPTER 1: INTRODUCTION 1
1.1 Background of Study 1
1.2 Problem Statement 2
1.3 Aim 2
1.4 Objectives 2
1.5 Scopes 3
1.6 Importance of Study 3
CHAPTER 2: LITERATURE REVIEW 4
2.1 Productivity 4
2.1.1 Productivity in Automotives 4
2.2 Time Loss 5
2.2.1 Idle Time 7
2.3 Motion Study 8
2.3.1 Definition 8
2.3.2 Motion Study Techniques 9
2.3.2.1 Motion Study Principles 10
2.3.2.2 Analyst of Therbligh 11
2.4 Work Measurement and Time Study 12
2.4.1 Work Measurement 12

vi
2.4.2 Time Study 12
2.4.2.1 Definition 13
2.4.2.2 Basic Steps in Time Study 14
2.5 Motion and Time Study 15
2.6 Simul8 17
2.7 Summary for Literature Review 18
CHAPTER 3: METHODOLOGY 19
3.1 Plan and Activities 19
3.2 Flow Chart of Studies 19
3.3 Framework of Studies 21
3.3.1 Problem Identification 22
3.3.2 Data Collection 22
3.3.2.1 Qualitative Data 22
3.3.2.2 Quantitative Data 23
3.3.3 Data Analysis 23
3.3.3.1 Data Organize using Check Sheet 23
3.3.3.2 Pareto Diagram 24
3.3.3.3 Cause and Effect Diagram 24
3.3.3.4 Time Study Method 25
3.3.3.5 Simulation 26
3.4 Summary 26
CHAPTER 4: RESULT & DISCUSSION 27
4.1 Introduction 27
4.2 Identifying Major Problems of Time Loss 27
4.2.1 Data Collection 27
4.2.1.1 Current Process Map 27
4.2.1.2 Robot 3 Spot Welding Operation 28
4.2.1.3 Amount of Time Loss and Down Time 33
4.2.1.4 Major Problems of Robot 3 34
4.3 Discussion 35
4.3.1 Time Loss Caused by Machine 35

vii
4.3.2 Time Loss Caused by Setting / 5S / Meeting 36
4.3.3 Time Loss by Manpower 37
4.4 Proposed Solution 37
4.5 Process Flow Analysis 38
4.5.1 Work Elements for Current Process 38
4.5.1.1 Simulation for Current Process Flow 42
4.5.1.2 Machine Utilization for Current Process Flow 43
4.5.2 Work Elements for Improved Process 45
4.5.2.1 Simulation for Improved Process Flow 48
4.5.2.2 Machine Utilization for Improved Process Flow 49
CHAPTER 5: CONCLUSION & FUTURE WORK 51
5.1 Introduction 52
5.2 Conclusion 52
5.3 Recommendation for Future Work 53
REFERENCES
APPENDIX
A Gantt Chart

viii
LIST OF TABLES
2.1
4.1
4.2
4.3
4.4
4.5
4.6
4.7
4.8
4.9
Motion Study Principle
Child Parts of Stage 10 Spot Welding Process
Child Parts of Stage 20 Spot Welding Process
Child Parts of Stage 30 Spot Welding Process
Operating Hours of Robot 3
Work Elements for Current Process (Stage 10)
Work Elements for Current Process (Stage 20)
Work Elements for Current Process (Stage 30)
Work Elements for Improved Process (Stage 10)
Work Elements for Improved Process (Stage 20)
10
29
30
32
33
39
40
41
46
47

ix
LIST OF FIGURES
2.1 Categories and Time Loss example 6
2.2
2.3
Factors that Cause Idle Time
Steps for Developing Motion Efficient Work Method
7
11
2.4
2.5
Stop Watch
Basic Steps in Time Study
13
15
3.1 Flow Chart of A Study 20
3.2 Framework of Study 21
3.3 Check Sheet 24
4.1 The Sub-assembly Process of Workstation Robot 3 28
4.2
4.3
4.4
4.5
4.6
4.7
4.8
4.9
4.10
4.11
4.12
4.13
4.14
4.15
4.16
4.17
Performance Measure for Robot 3
Time Loss by Machine Factor
Time Loss by Setting / 5S / Meeting
Time Loss by Manpower
Current Process Flow of Sub-assembly Process
Machine Utilization of Robot 3
Machine Utilization of WSS Spot Welding
Machine utilization of Stud Weld
Machine Utilization for Checking Process
Machine Utilization for Marking Process
Improved Process Flow of Sub-assembly Process
Machine Utilization of Robot 3
Machine Utilization of WSS Spot Weld
Machine Utilization of Stud Weld
Machine Utilization for Checking Process
Machine Utilization for Marking Process
34
35
36
37
42
43
43
44
44
45
48
49
50
50
51
51

x
LIST OF ABBREVIATION
SMED - Single-Minute Exchange of Die
PSM - Projek Sarjana Muda

1
1.1 Background of Study
The automotive industry in Malaysia offers vast opportunities for global automotive
and component manufacturers to set up manufacturing and distribution operations in
the country.
Thus, it will result to the growth of local component industry. Dashboard component
can be divided into two, dashboard upper and dashboard lower. The used of these
two components are below the windshield, which place in front of the front seats.
Dashboard lower component absorbs the front-side impacts. Its also served as the
frame onto which polyurethane foams that act as absorption materials, and
passenger-side airbags are attached to ensuring passenger safety.
This study will be focused on the optimization of spot welding robot knowns as robot
3 at PHN Industry Sdn. Bhd which is a company that produces and assembly parts
and components ranging from dash board panel to parcel and frame compartment.
This robot is being used to weld the lower dashboard component. Besides that, the
major problems contribute to Time Loss are studied and solutions will be proposed at
the end of the study.
INTRODUCTION
CHAPTER 1

2
1.2 Problem Statement
The decision making process involved in product design, manufacturing engineering,
and production management have to consider many variables as products and
processes are becoming more complex. Time loss is one of the problem experienced
by PHN Industry Sdn Bhd. The high time loss will reduce the available machine run
time and decrease the welding productivity.
Furthermore, it will reduce the organisation’s operating cost. The company needs to
develop the capability to shorten the time loss and reduce the idle time of the
machine for maximize the production output. Time loss happened due to inconsistent
setup time, changeover and frequent machine stoppage. Thus, to enable
manufacturing company to increase its productivity, the reduction of time loss and
waste are highly demanded.
Idle time is one of the major problem experienced in PHN Industry Sdn. Bhd. This
can be found at the workstation of robot 3 where after starting spot welding process,
it needs to wait for an operator to reload all parts that will be welded. The delay of
robot movement will cause waste on processing time. The high time loss will reduce
the available machine run time and minimize the welding productivity. Furthermore,
it will increase the production output.
1.3 Aim
The aim of this study is to improve productivity of spot weld process at Robot 3
section by reducing the Time Loss.
1.4 Objectives
The objectives of the study are:
1. To investigate the major problems that cause machine idle.
3
2. To minimize and propose the time loss at workstation Robot 3 of Lower
Dashboard Component section.
1.5 Scope
This study seeks to solve the problems at PHN Industry Sdn. Bhd which is located in
Alor Gajah. PHN Industry is a company that produces parts and components ranging
from dash board panel to parcel and frame compartment for an automotive
manufacturer based in Alor Gajah. This study will focus primarily on the time study
method. An interview and observation method also will be included to gain some
information of the processes. The result of the study will be use to achieve the
objectives that have been setup. The scope of this study will not cover on the factors
that contribute the processing time such as machine breakdown time, maintenance
and others.
1.6 Importance of Study
By identifying time loss and reducing idle time, the production output can be
improved tremendously. This consequently standardizes the setup method which
takes inconsistent time for every machine operator. With the elimination of waste,
lead time and production cost can be reduced and it will enhance productivity
efficiency to the organization.

4
2.1 Productivity
Productivity usually associated with labour effectiveness in industry. It can be
defined to different meanings. Productivity is a ratio of output to some or all of the
resources used to produce the output. For example, labour productivity is units
produced divide by hours worked while capital productivity is the ratio of output and
capital input. Besides of labour and capital productivity, material productivity is the
ratio of output to the materials input (Barnes, 1980).
Motion and Time study is a method that evolved over the years and designed to
increase the productivity of an organization. Its objective is the elimination of
unnecessary work, the design of methods and procedures which are most effective
require the least effort suited for the user. Moreover, a performance index or
productivity index can be determined by methods of work measurement including for
an single worker, group of workers, a department or entire plant.
2.1.1 Productivity in Automotive
Malaysia offers vast opportunities for global automotive and component
manufacturers to set up manufacturing and distribution operations in the country. It is
because of its strategic location centrally situated in the ASEAN region with a large
LITERATURE REVIEW
CHAPTER 2

5
population. Besides, there are other factors that contribute to the statement above
such as pragmatic government policies, political, an educated and skilled labour
force and economic stability with well developed infrastructural facilities. All of the
factors resulted the attraction of major international automotive and components to
invest in Malaysia (MIDA, n.d.).
The automotive industry also reflected to the auxiliary and supporting industries,
contributed to skills development, the enhancement of technological and engineering
capabilities and also boosted the development of engineering (MIDA, n.d). The
national car projects also contribute to the development of an integrated motor
vehicle industry where it has resulted to the growth of the local component industry.
The statistic value confirmed by Department of Statistics Malaysia, there are 350
component manufacturers presence in Malaysia. It is stated that 234 of them are
Proton vendors and another 135 are Perodua vendors (Uzir and Kanageswary, 2004).
Since the competitive between manufacturers in this industry is high, the automotive
production has to face with a challenging set of market requirements and demands
such as shorter time to market, more vehicle models and variants, higher
productivity, reduce total cost of ownership, and production quality. Furthermore, the
main objectives of a firm also to win market shares both domestically and
internationally, to increase their profit and also to compete globally (Siemens, n.d.).
As example, the BMW assembly line in Dingolfing, Germany has built in flexibility
that allows it to easily produce multiple models which is currently only assembles its
7 series model. The production flexibility enables its line to easily respond to market
fluctuations and also avoiding the changeover cost. Its known that their rival
typically configure their assembly lines to produce just a single model at a time and
will be shut down due to produce the different model (Stevenson and Chuong, 2010).
2.2 Time Loss
In an ideal environment, the organization will have the full capacity of operations at
all the time for all equipment its have. But, all of this almost impossible in real life

6
where there will be time loss in the operation. Time loss can be considered as time in
which the equipment is not working due to operating delay or idle time of the
operator or machine.
Figure 2.1: Categories of Time Loss and example
From the chart below, time loss can be divided into three major categories which is
planned, necessary and unnecessary. The planned time loss is doing works that help
the production process to flow smoothly. The examples of planned time loss are
changeover, asset care and planned maintenance. All of the time loss can be reduced
by several technique and method such as SMED ( Single Minute Die Exchange ),
benchmarking and planned downtime log and matrix.
Next, necessary time loss is time of work that to be done because of the method
itself. Inspection is a example of necessary time loss. It‟s needed to control the
process and quality of the product. Other example of necessary time loss is minor
stops where the performance is measure such as equipment failure for less than 5
minutes, fallen product, obstruction and blockages. Lastly, the unnecessary loss time
that resulted from equipment failure which is more than 5 minutes, major component
failure and unplanned maintenance (Unido, n.d.).
Time loss
Planned
Changeover
Planned maintenance
Necessary
Inspection
Unnecessary
Material shortages
Labour shortages
Breakdowns
7
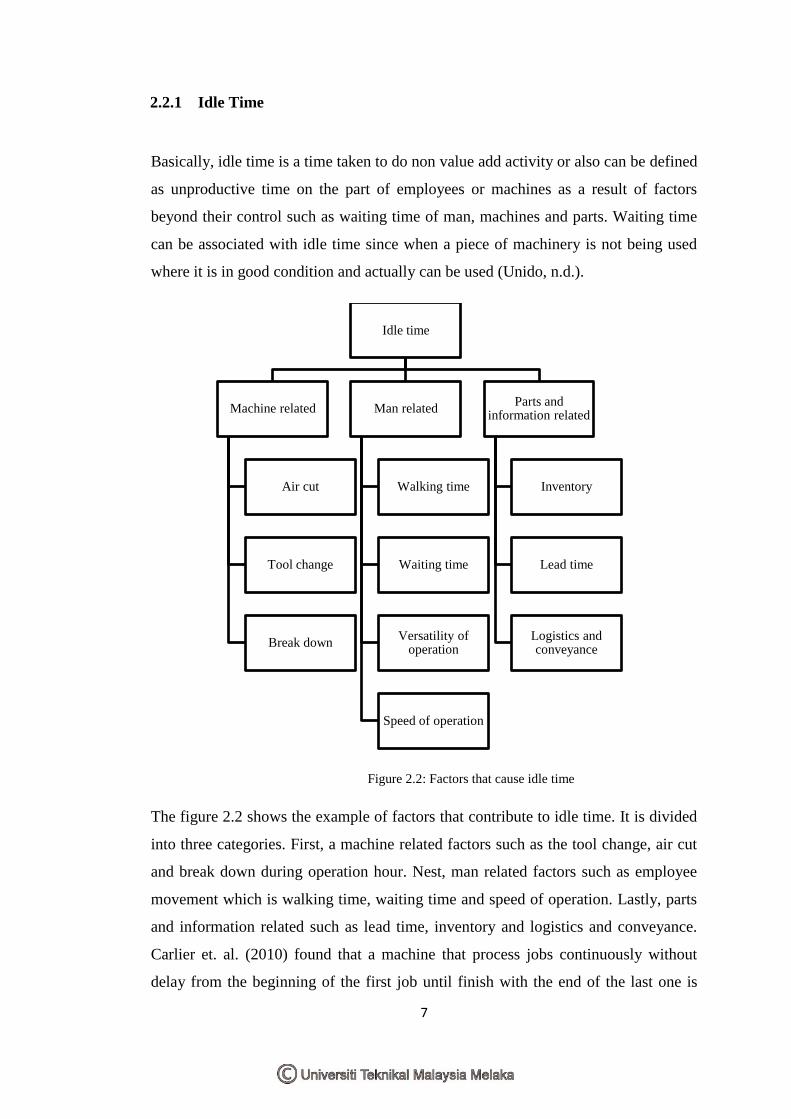
2.2.1 Idle Time
Basically, idle time is a time taken to do non value add activity or also can be defined
as unproductive time on the part of employees or machines as a result of factors
beyond their control such as waiting time of man, machines and parts. Waiting time
can be associated with idle time since when a piece of machinery is not being used
where it is in good condition and actually can be used (Unido, n.d.).
Figure 2.2: Factors that cause idle time
The figure 2.2 shows the example of factors that contribute to idle time. It is divided
into three categories. First, a machine related factors such as the tool change, air cut
and break down during operation hour. Nest, man related factors such as employee
movement which is walking time, waiting time and speed of operation. Lastly, parts
and information related such as lead time, inventory and logistics and conveyance.
Carlier et. al. (2010) found that a machine that process jobs continuously without
delay from the beginning of the first job until finish with the end of the last one is
Idle time
Machine related
Air cut
Tool change
Break down
Man related
Walking time
Waiting time
Versatility of operation
Speed of operation
Parts and information related
Inventory
Lead time
Logistics and conveyance

8
machine with no-idle constraint. It is suitable for production setting which the
machine must be running at all time in order to satisfy the customer‟s orders. It‟s also
must running continuously to fulfil the demand although the capacity of the machine
is limited.
Idle time should be avoided for high operating costs machines to increase the profit
of the organizations. For example, an oven is used to heat some metal parts at a given
temperature. Then, the oven will be maintained at the desired temperature while it is
empty. The situation will provided waste which costly to the organizations.
2.3 Motion Study
The idea of Motion study nowadays is evolved from the work of Frank Gilbreth,
where the concept was originated in the bricklaying trade in the early 20th
century.
Through the use of motion study techniques, Gilbreth is generally credited with
increasing the average number of bricks laid per hour by a factor of 3, even though
he was not a bricklayer by trade (Stevenson and Chuong, 2010).
Their contribution to the industry is large from their pioneering work in motion
study. Nowadays, the principle and techniques they developed long time ago are
being applied by industry at an increasingly rapid rate.
2.3.1 Definition
Motion Study is a technique used to analyze body movement of the employee into
the work to eliminate or reduce ineffective movement and facilitate efficient
movement. Groover (2007) states that Motion Study also can be defined as analyze
of the basic hand, arm, and body movements of workers as they perform work.
Motion study is the systematic study of the human motions used to perform an
operation (Stevenson and Chuong, 2010).

9
Basically, motion study is a base for time study and should be done before a time
study is made. It can be used successfully without time study but time study cannot
be used without motion study since it is the foundation for time study. The main
function of motion study is to eliminate unnecessary motions and to identify the best
sequence of motions for maximum efficiency.
It‟s also to find the most economy of effort with due regard for safety and from the
aspect of human. Thus, motion study can be an important avenue for productivity
improvements. The total cost for human expenditure of effort can be reduced and
increase the unit cost for human effort at the same time. Thus, less time is use to
accomplish the same amount of work with more efficient application of human effort
(Pigage and Tucker, 1954).
2.3.2 Motion Study Techniques
Motion study also is a versatile method which can be applied to any job effectively
including jobs in the home, in the office, in retail and distribution fields and many
others area. Motion study can be simply stated as to find out how a job is being done
currently, to know the reason for each step being done on the job through question
and the steps on the job that cannot be fully justified would be remove. Lastly, the
new procedure for doing the job is install and standardized (Pigage and Tucker,
1954).
There are several of the possible motion study techniques which can be used where it
is simply illustrate. The technique will be provided with supporting procedures will
clear the relatively uniform practices prevailing at this time. Usually, the tested
procedures in the study will involve the use of process chart, flow charts, operation
charts and micro motion (Pigage and Tucker, 1954).


