Page 1
Mount San Antonio College SCE Permanent Load Shifting Program Incentive Account Number 3-000-2091-22 1100 N. Grand Avenue Walnut, CA 91789
October 7, 2014 Prepared by: P2S Engineering, Inc. 5000 East Spring St, Eighth Floor Long Beach, CA 90815 562.497.2999 p2seng.com
Page 2
Table of Contents
Executive Summary .............................................................................................................................. 2
Project Background .............................................................................................................................. 3
Existing Central Plant ........................................................................................................................... 5
Existing Central Plant Electric Loads.............................................................................................. ..... 9
Thermal Energy Storage Options ...................................................................................................... 10
Estimated Demand Reduction and Energy Use ............................................................................... 12
Energy Efficiency Information ............................................................................................................ 14
Operations and Maintenance ............................................................................................................ 16
Economic Analysis .............................................................................................................................. 17
Recommendations .............................................................................................................................. 18
Appendices
Mt San Antonio College SCE Permanent Load Shifting Program Incentive 1 | P a g e
Page 3
Executive Summary
Mt San Antonio College has approximately 822,000 SF of buildings connected to the existing central plant and a future 828,000 SF to be added by 2025, for a total square footage of 1,650,000 SF to be connected to the College central plant. The existing central plant has one 500 ton absorption chiller, two 750 ton chillers and a primary variable chilled water system. A satellite plant in Building 2 also supports the chilled water system with two 250 tons chillers, configured in a primary / secondary variable pump system. Mt San Antonio College has reached a point in the operation of the central plant where expansion of the chilled water is required to service the total square footage of the College through 2025 and to maintain redundancy in the chilled water system. The existing central plant has physical capacity to fit another 750 ton chiller and pumps. Our office reviewed the option of adding another 750 ton chiller and the option of adding a chilled water thermal energy storage system. Through a partnership between our office and the College, we are proposing thermal energy storage and the installation of the 750 ton chiller option for the following reasons:
• The energy savings resulting from not running the existing chillers (and a third chiller) during peak demand periods is substantial.
• A significant incentive is available to offset first costs related to the installation of a thermal energy storage system.
• The flexibility in having a redundant source of chilled water in case of chiller failure or maintenance.
Through the analysis presented in this report, P2S Engineering Inc. recommends the installation of the 20,000 ton hour chilled water thermal energy tank at Mt San Antonio College. The College is currently on a fixed rate through SCE and Constellation. It is recommended for the College to change to a TOU-8 rate in 2016 on the contract is up for renewal in order to maximize the energy savings during peak demand periods, an estimated $323,000 for the first year. Also a 20 year life cycle cost analysis was performed as part of this report and a positive rate of return is expected after 12 years. The proposed 20,000 ton hour capacity in the thermal energy storage tank allows for future connection to the central plant chilled water system of the planned buildings as part of the master plan through 2025. Most importantly, the total tonnage offset during the summer peak operation hours is 2,311 tons. This equates to a $1,602,913 immediate incentive available once additional buildings currently under constructed are completed in 2016. These incentives will help offset the estimated $5.24M of first costs for the installation of a thermal energy storage system. It will also continue to save Mt San Antonio College money in maintenance and utility costs throughout the life of the central plant equipment.
Mt San Antonio College SCE Permanent Load Shifting Program Incentive 2 | P a g e
Page 4
Project Background
Mt San Antonio College has undergone extensive growth in facilities and upgrades within the last 10 years resulting in a total central plant connected square footage of 822,000. The College expects further build out of approximately 1,650,000 square feet over the next 10 years. A central plant was provided in 2003 to centralize all the chilled water supply for campus cooling for efficiency and equipment maintenance. Initially the central plant was designed with one (1) 500 ton absorption chiller and two (2) 750 ton centrifugal chillers, with a space for a third 750 ton centrifugal chiller to accommodate the future needs of the College. During the summer of 2014, a satellite central plant in Building 2 was connected to the College central plant chilled water loop with a total capacity of 500 tons to service the shoulder loads of the College.
In anticipation of the future loads resulting in almost double existing College cooling loads, an energy efficiency measure to provide chilled water to the various instructional buildings is required. Through a partnership, our office and the College opted for the thermal energy storage option for the following reasons:
1. The College is currently on a non-TOU rate schedule through SCE and Constellation through 2016. We are recommending herein changing the College rate schedule to TOU once contact is expired.
2. A significant incentive is available from SCE to offset first costs related to the installation of a thermal energy storage system.
3. The following are specific advantages to the College:
• Efficient operation of the chillers during the night by operating them at higher efficiencies when the night temperatures are cooler.
• Elimination of additional maintenance costs for added chillers and cooling towers to support the peak chilled water demand.
• Reduce operating costs by generating chilled water at night when the demand charges are not applicable and the utility rates are lower compared to peak period rates (when TOU is applicable).
• Help offset the peak demand charges of the College.
• Help shield the College against future escalation in demand charges.
• Efficient operation of the central plant at low loads.
• Provide redundancy should a chiller fail during peak periods.
• Addition of approximately 3,200 tons of additional chilled water capacity to the existing chiller plant to accommodate the cooling demands of the future buildings.
Mt San Antonio College SCE Permanent Load Shifting Program Incentive 3 | P a g e
Page 5
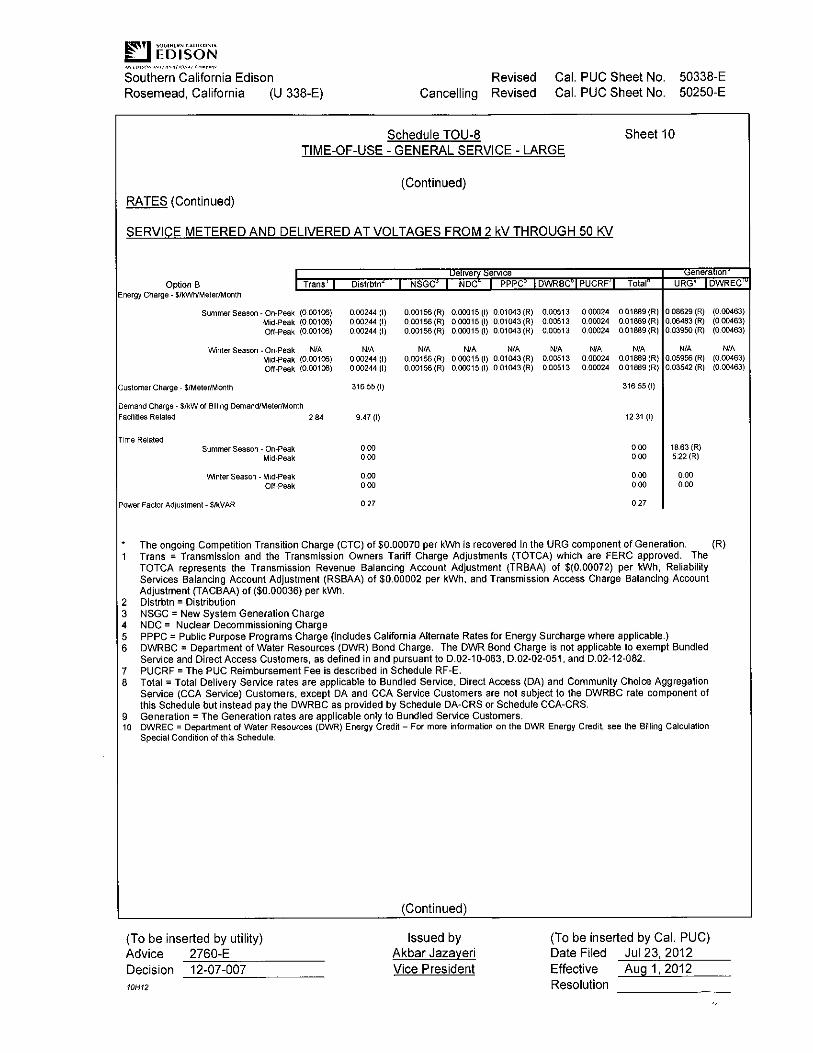
The following is the current Non-TOU schedule for the entire year at Mt SAC, fixed at $0.147/kWh:
Monday Tuesday Wednesday Thursday Friday Saturday Sunday
8am-12pm* Mid Peak Energy Rate
12pm-6 pm* On-Peak Energy Rate
6pm-11pm Mid Peak Energy Rate
11pm-8am Off - Peak Energy Rate
* Except holidays, holidays are considered off peak.
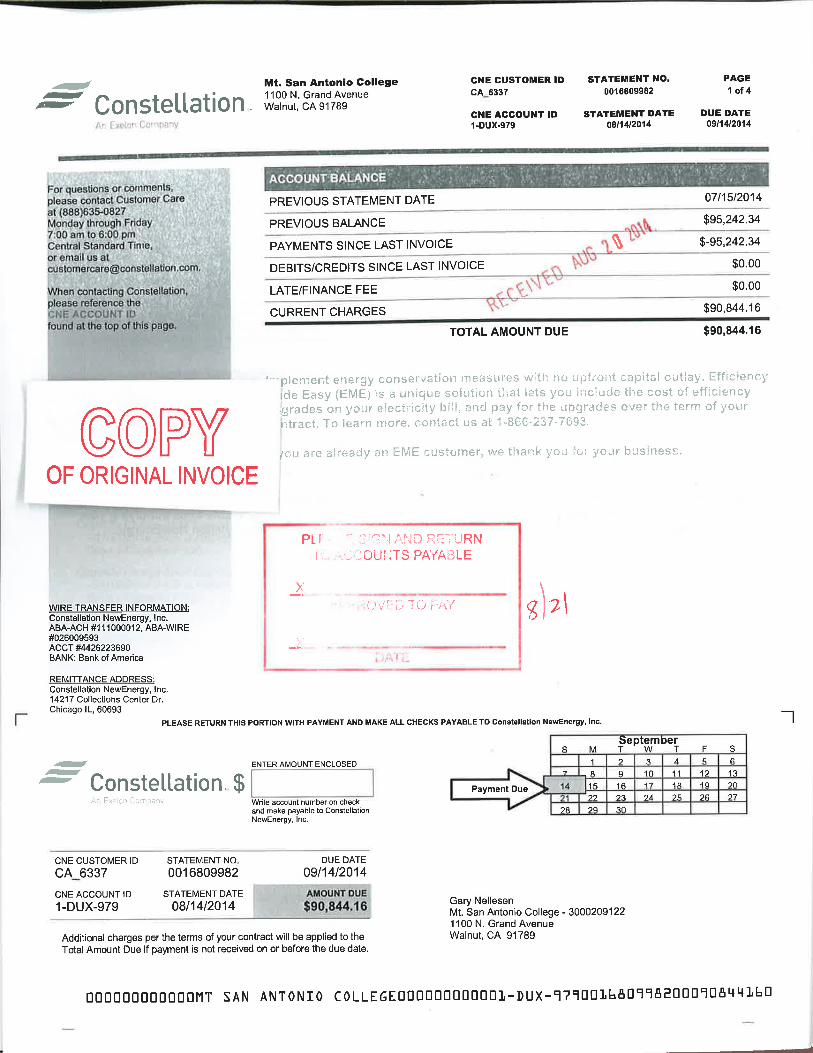
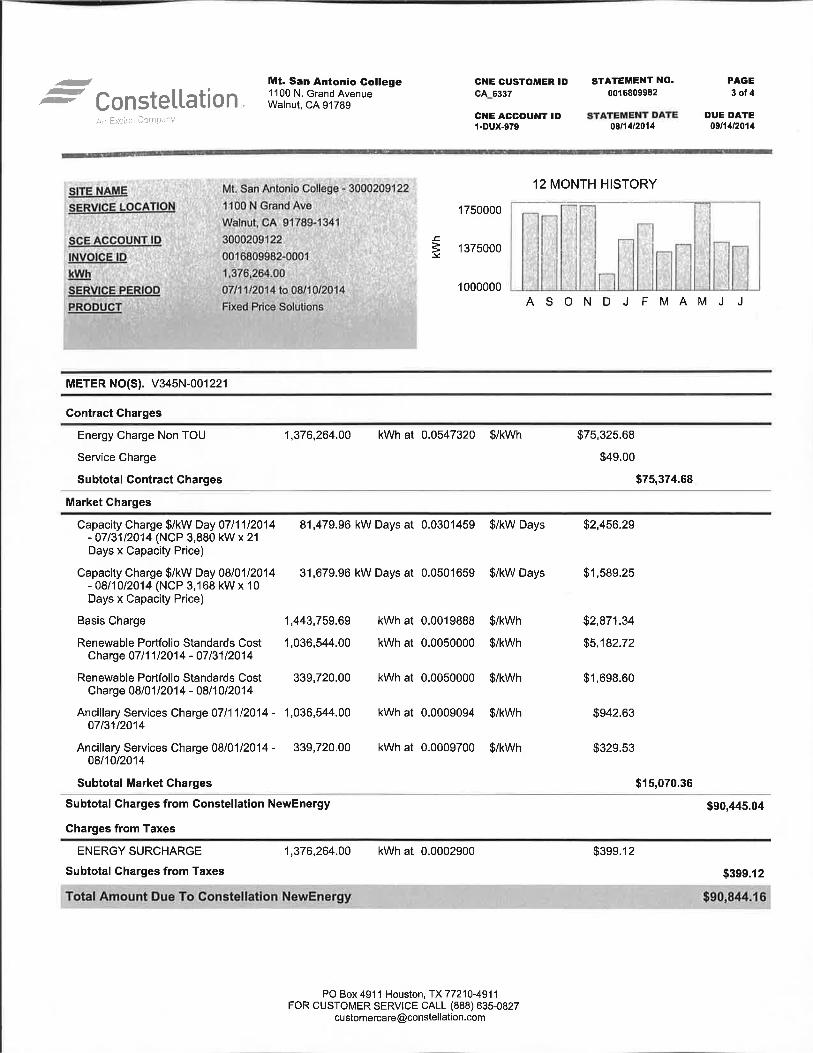
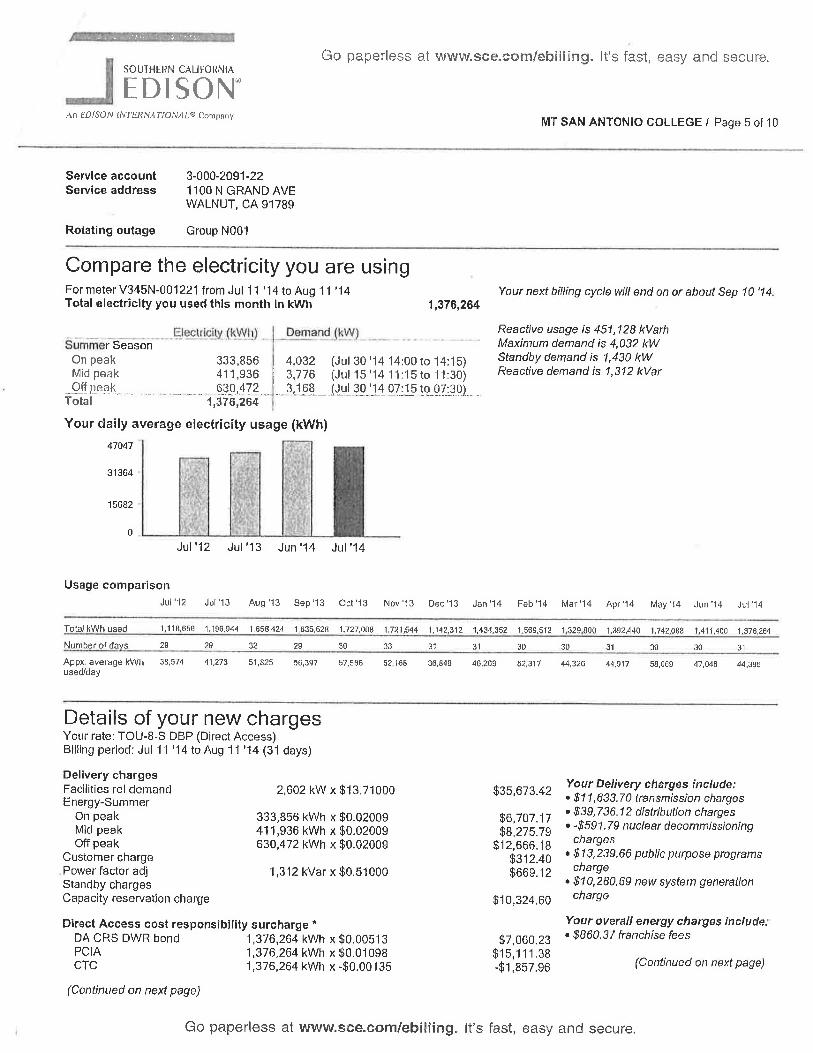
The actual SCE and Constellation College bills for the month of July can be found in Appendix A. These rates were utilized when taking into consideration the existing central plant operation.
The proposed location of the thermal energy storage tank is directly north of the existing central plant. Refer to Appendix B for site plan of College. The main central plant system will be changed from a primary variable to a primary/ secondary distribution system. The Building 2 satellite plant configuration will remain the same. The chillers are proposed to only operate during mid and off peak periods and to charge the tank at night during the summer months. It is expected that during the winter months, the thermal energy storage tank may be able to handle the full load of the College throughout its entire operating day.
The following is the proposed TOU-8 schedule for the summer season, June 1 to October 1.
Monday Tuesday Wednesday Thursday Friday Saturday Sunday
8am-12pm* Mid Peak Energy Rate
12pm-6 pm* On-Peak Energy Rate
6pm-11pm Mid Peak Energy Rate
11pm-8am Off - Peak Energy Rate
* Except holidays, holidays are considered off peak.
Mt San Antonio College SCE Permanent Load Shifting Program Incentive 4 | P a g e
Page 6
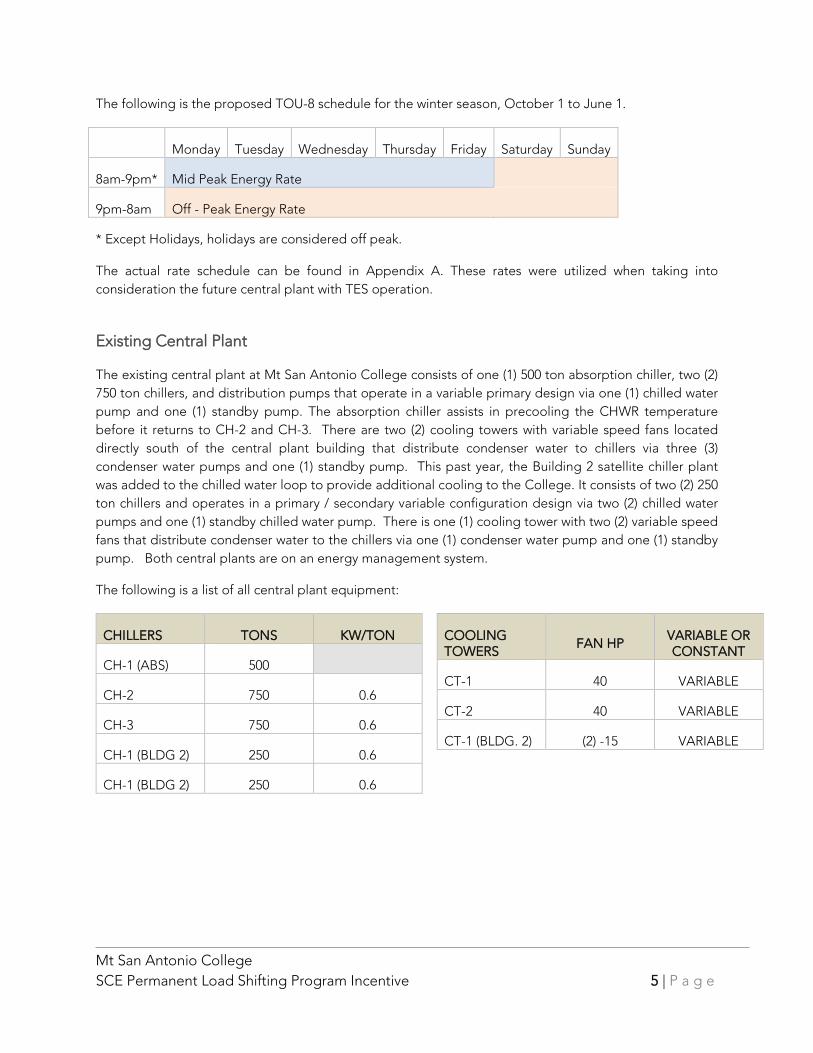
The following is the proposed TOU-8 schedule for the winter season, October 1 to June 1.
Monday Tuesday Wednesday Thursday Friday Saturday Sunday
8am-9pm* Mid Peak Energy Rate
9pm-8am Off - Peak Energy Rate
* Except Holidays, holidays are considered off peak.
The actual rate schedule can be found in Appendix A. These rates were utilized when taking into consideration the future central plant with TES operation.
Existing Central Plant
The existing central plant at Mt San Antonio College consists of one (1) 500 ton absorption chiller, two (2) 750 ton chillers, and distribution pumps that operate in a variable primary design via one (1) chilled water pump and one (1) standby pump. The absorption chiller assists in precooling the CHWR temperature before it returns to CH-2 and CH-3. There are two (2) cooling towers with variable speed fans located directly south of the central plant building that distribute condenser water to chillers via three (3) condenser water pumps and one (1) standby pump. This past year, the Building 2 satellite chiller plant was added to the chilled water loop to provide additional cooling to the College. It consists of two (2) 250 ton chillers and operates in a primary / secondary variable configuration design via two (2) chilled water pumps and one (1) standby chilled water pump. There is one (1) cooling tower with two (2) variable speed fans that distribute condenser water to the chillers via one (1) condenser water pump and one (1) standby pump. Both central plants are on an energy management system.
The following is a list of all central plant equipment:
CHILLERS TONS KW/TON
CH-1 (ABS) 500
CH-2 750 0.6
CH-3 750 0.6
CH-1 (BLDG 2) 250 0.6
CH-1 (BLDG 2) 250 0.6
COOLING TOWERS
FAN HP VARIABLE OR CONSTANT
CT-1 40 VARIABLE
CT-2 40 VARIABLE
CT-1 (BLDG. 2) (2) -15 VARIABLE
Mt San Antonio College SCE Permanent Load Shifting Program Incentive 5 | P a g e
Page 7
CHWP PUMP HP PUMP HD VARIABLE OR CONSTANT
CHWP-1 200 228 VARIABLE
CHWP-2 200 228 VARIABLE
CHWP-1 (BLDG. 2) 20 65 CONSTANT
CHWP-2 (BLDG. 2) 20 65 CONSTANT
CHWP-3 (BLDG. 2) 30 100 VARIABLE
CWHP-4 (BLDG. 2) 30 100 VARIABLE
CWP PUMP HP PUMP HD VARIABLE OR CONSTANT
CWP-1 60 30 CONSTANT
CWP-2 60 30 CONSTANT
CWP-3 60 30 CONSTANT
CWP-4 60 30 CONSTANT
CWP-1 (BLDG. 2) 40 15 CONSTANT
CWP-2 (BLDG. 2) 40 15 CONSTANT
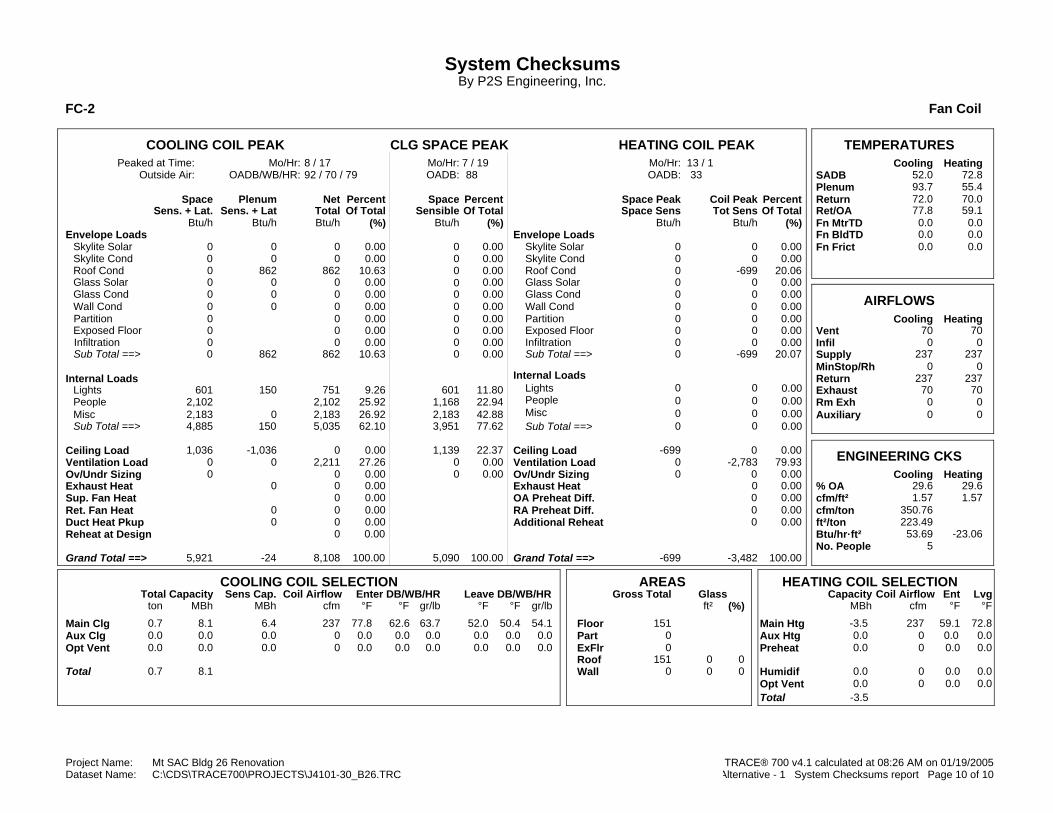
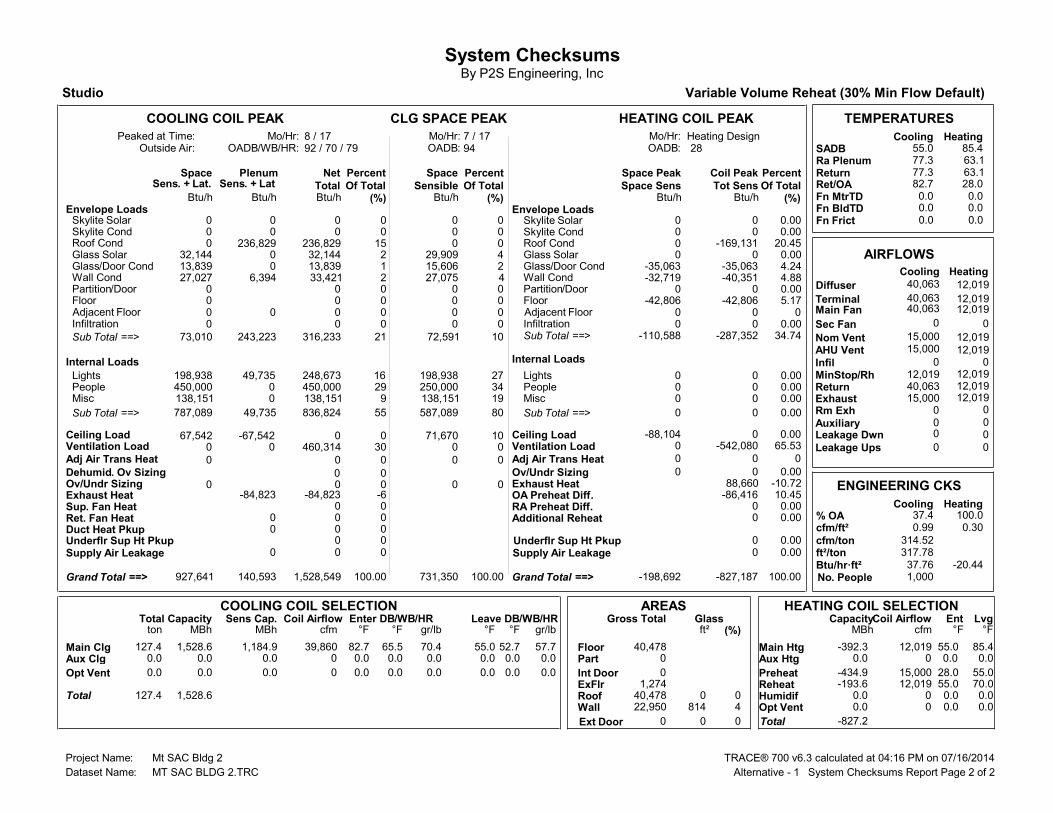
There are various HVAC designs in each of the buildings connected to the central plant. Most of the HVAC systems are new or have been renovated to variable air volume systems. A total of approximately 822,000 SF of conditioned area is currently connected to the central plant for chilled water and are on College energy management system. Refer to Appendix C for a list of buildings and the Trace outputs of the typical peak profile day per month for the College.
The College's 2013-2014 academic calendars were incorporated into the study, along with standard schedules of each building. Generally, the College operates from 8am-10pm Monday through Friday. Many classes are off for lunch between noon and 1pm during this period. The existing central plant starts at 7am and is available until 10pm. The electric centrifugal chillers are off between 10pm and 7am; however, the absorption chiller continues to operate through the night.
All of the buildings connected to the central plant were modeled in Trane Trace. This included envelope loads, internal loads such as lighting and power, people, and operating schedules.
Mt San Antonio College SCE Permanent Load Shifting Program Incentive 6 | P a g e
Page 8
The following is HVAC peak block tonnage breakdown per building based on the Trane Trace model for the current buildings connected to the central plant without diversity:
NO. BUILDING SQUARE FOOTAGE PEAK BLOCK TONNAGE
1A Art Center 16,700 60
1B/C Art StudioCenter 16,136 74
2B Fedderson Recital Hall 63,361 193
4 Administration 41,963 113
6 Learning Technology Center 101,784 250
7 Science South 37,226 298
9B Student Services 51,369 118
11 Science North 18,939
107
12 Building 12 13,000 50
13 Design Technology Center 62,000 162
26 Humianities/Social Sciences 98,230 359
29 Central Plant 148 1
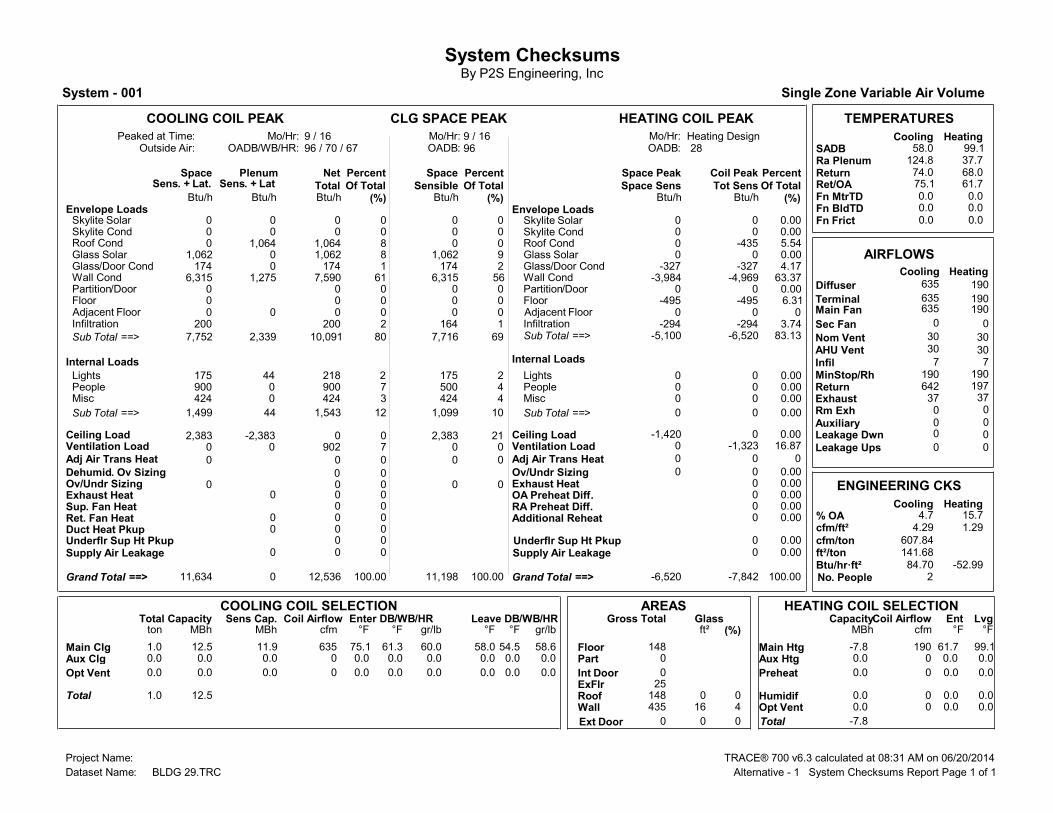
60 Science 62,982 249
61 Math and Science 64,139 211
66 Language Center 43,911 123
67A Health Careers 31,768 90
67B Student Health 10,995 33
70-73 Childhood Development 36,012 99
80 Agricultural Science Building 51,100 214
TOTALS 821,583 2,801
Mt San Antonio College SCE Permanent Load Shifting Program Incentive 7 | P a g e
Page 9
The following is HVAC peak block tonnage breakdown per building based upon the Trane Trace model for the additional buildings to be connected to the central plant by the end of 2016:
The following is the HVAC peak tonnage breakdown per buildings estimated for the full build out by 2025. The buildings will be divided into 2 phases. 400 SF/ton was utilized for peak load estimation.
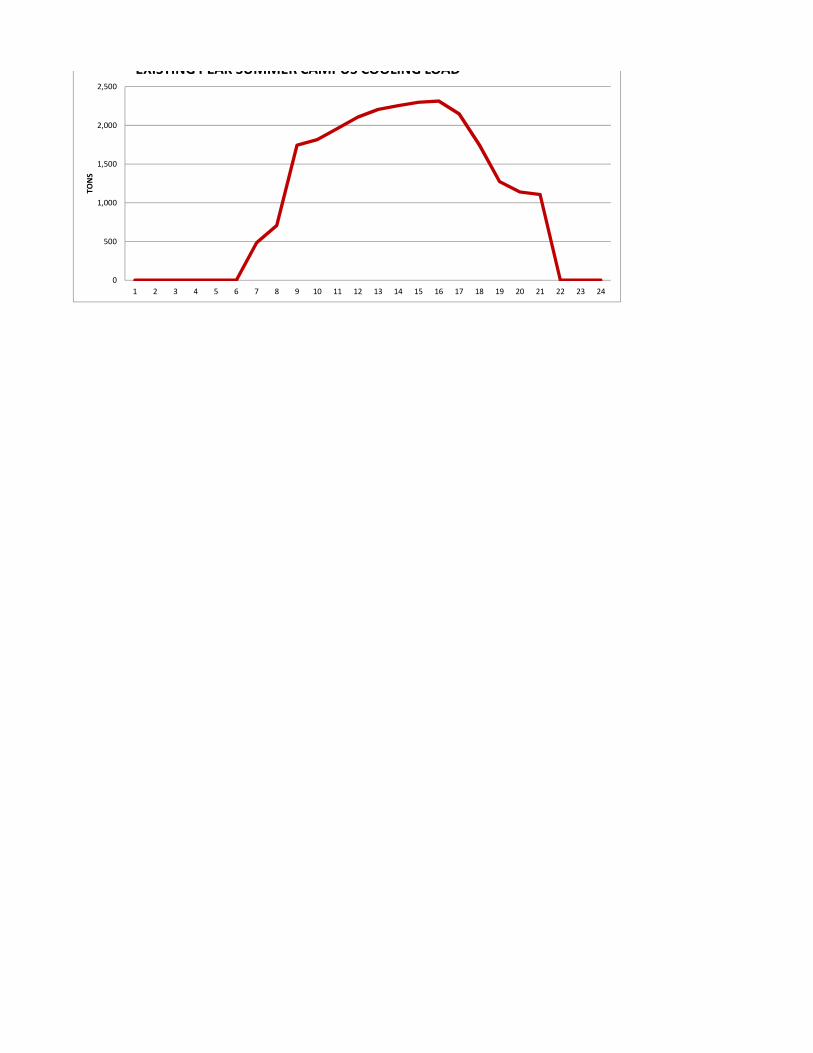
Trended information from both chiller plants was requested to review actual load profiles and diversity specific to Mt SAC. Per the College trends provide to our office, cooling demands peaked on September 15, 2014 at 3:00 pm at 2,311 tons. Outside air temperature was recorded at 102 deg F. This reflects an 83% diversity on campus during a peak period when compared to the calculated summarized Trance Trace peak block tonnage of the College.
NO. BUILDING SQUARE FOOTAGE PEAK BLOCK TONNAGE
9A Food Services 12,000 52
9B Add Student Support Services 16,056 53
Business Technology 87,000 365
TOTALS 115,056 470
BUILDING SQUARE FOOTAGE PEAK BLOCK TONNAGE
PHASE 1
Athletics Phase 1 45,000 240
Library/Campus Center 217,200 543
Classroom Building 101,400 254
Language Lab Expansion 15,000 38
Building 9A Renovation 21,300 53
Continuing Education 24,440 61
Athlectics Phase 2 50,000 260
PHASE 2
Instructional Building 50,000 125
Auditorium Zone
12,000 30
Instructional Building 75,000 188
Instructional Building 100,000 250
TOTALS 711,340 2,042
Mt San Antonio College SCE Permanent Load Shifting Program Incentive 8 | P a g e
Page 10
The following is the peak cooling load profile of the peak day (September 15, 2014) at Mt San Antonio College per the trends:
Existing Central Plant Electric Loads
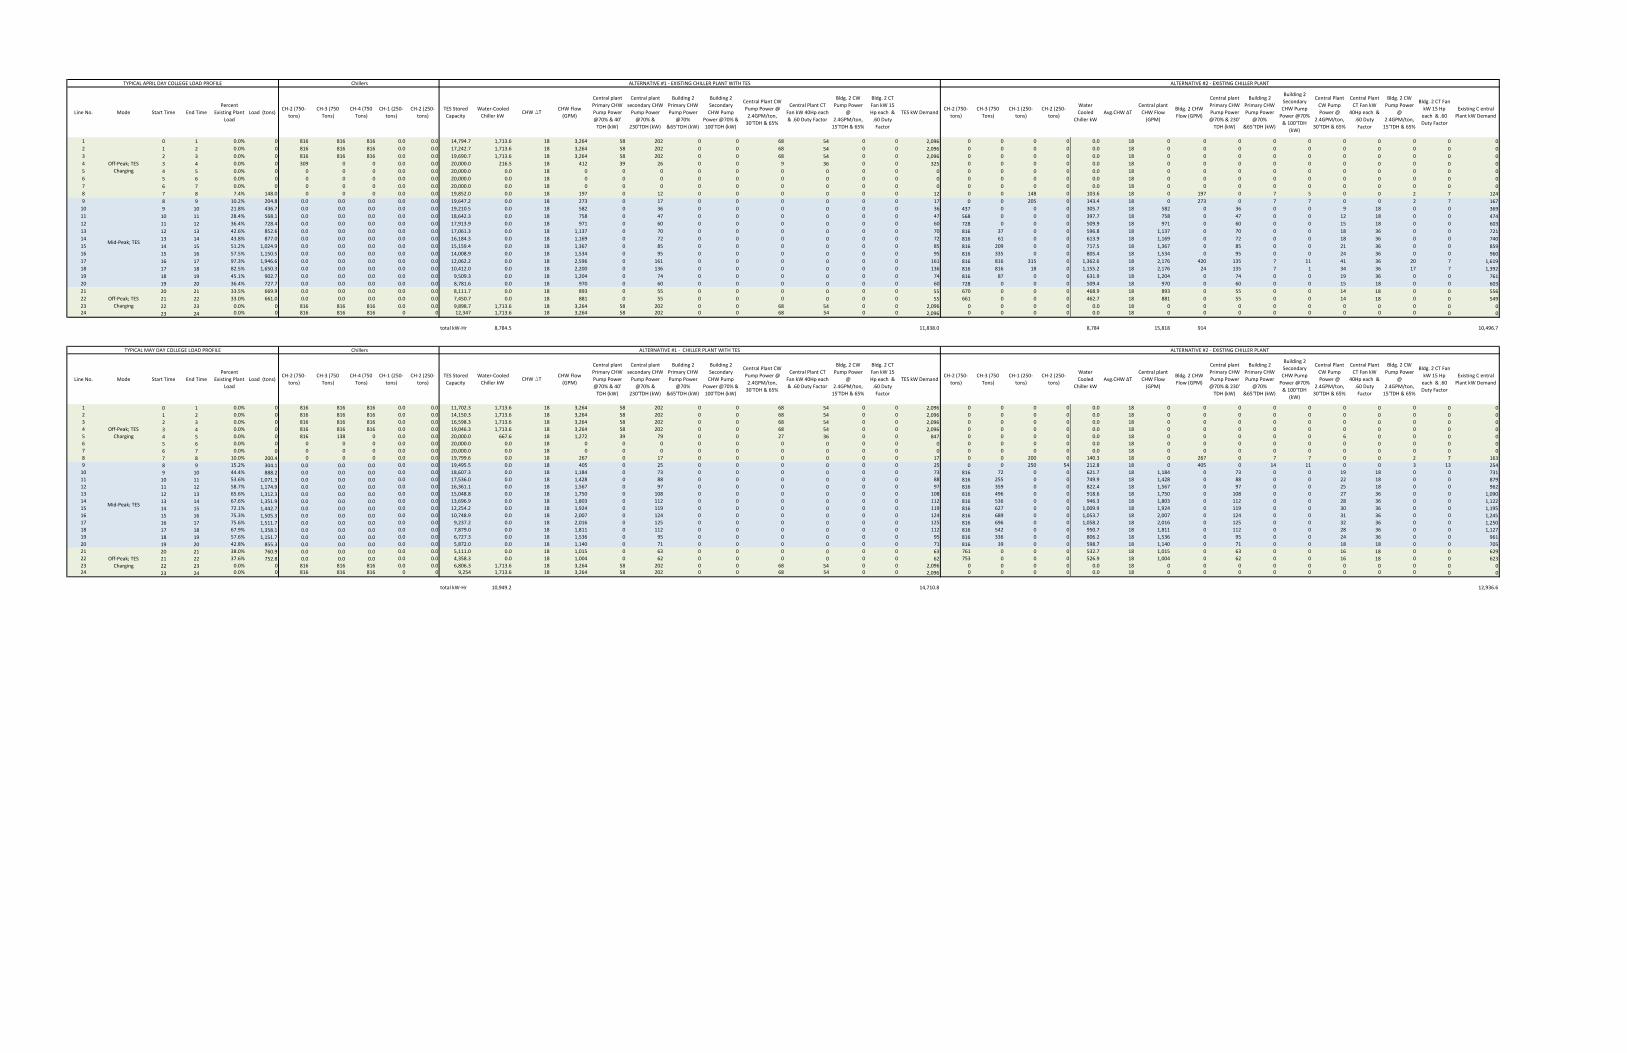
The central plant operation and load profiles were modeled to establish baseline electric load consumption based upon the building HVAC loads as listed previously. Below is the calculated central plant energy consumption supporting the current HVAC loads on campus. Refer to Appendix D for electric loads profiles modeled for the College.
Total Existing Annual
Load
Existing Summer Load (June 1 through
October 1)
Existing Winter Load (October 1 through
June 1)
On Peak (kWh) 882,211 882,211 0
Mid Peak (kWh) 2,330,606 820,611 1,509,995
Off Peak (kWh) 137,058 30,992 106,066
On Peak Demand (KW) 1,786 1,786 0
0
500
1000
1500
2000
2500
1 2 3 4 5 6 7 8 9 10 11 12 13 14 15 16 17 18 19 20 21 22 23 24
TON
S
EXISTING PEAK SUMMER CAMPUS COOLING LOAD
Mt San Antonio College SCE Permanent Load Shifting Program Incentive 9 | P a g e
Page 11
Thermal Energy Storage Options
Two options for energy storage were reviewed with the College; water storage and ice storage. The following are reasons why thermal energy water storage was recommended over the ice storage:
• The existing chillers can be utilized for charging the thermal energy storage tank without having to add a glycol chiller to charge an ice storage system.
• Generating low temperature glycol to make ice requires more compressor energy (0.9 kw/ton) than the existing chillers (0.7 kw/ton).
• Additional equipment (besides glycol chiller) is required for an ice storage system such as dedicated pumps, a plate and frame heat exchanger, a glycol loop, etc. This would require additional maintenance budget and expertise.
• There is increased complexity in the control strategy for ice storage as compared to the thermal energy storage tank.
• The College has the footprint available north of the central plant for the placement of thermal energy storage tank.
The thermal energy storage tank is assumed to operate over 6 hours of depletion during peak periods. 2,311 peak tons over 6 hours equates to 13,866 ton hours of required capacity. This is adequate chilled water for the existing buildings connected to central plant during a depletion time frame of over 6 hours. Currently the central plant with an installed capacity of about 2,300 tons (with absorption chiller) struggles to maintain chilled water supply to its buildings during peak periods.
There are still some buildings not connected to central plant and their future connection timeframe is unknown at this time. From our experience, community colleges in general experience about a 65% diversity factor in terms of building usage during peak periods. By the end of 2015, the connected load will include an additional 306 tons (470 tons x 65% diversity) resulting in to an additional 1,836 ton hours 15,702 ton hours required. Considering the additional cooling load requirements through 2025, a capacity of 20,000 ton hours is proposed for Mt San Antonio College. It is assumed that the buildings constructed between 2015 and 2025 will be more efficient, thus the assumption of 400 sf/ton will is conservative.
For the SCE incentive consideration, 2,311 tons will be considered as the total tons offset during the summer. In the past SCE has allowed demonstration of future loads with the year for additional incentive. Since current projects are under construction and expected to be completed by end of 2015, an additional 306 tons will be requested for consideration in the incentive.
The thermal energy storage tank will be located directly north of the central plant. An additional 750 ton water cooled chiller is proposed to be located in the central plant to assist with charging the tank at night and provide chiller redundancy. The existing primary pumps will be utilized as secondary pumps, and new primary pumps will be added. Refer to Appendix B for system schedules, control schematic, and TES concept level site plan.
Mt San Antonio College SCE Permanent Load Shifting Program Incentive 10 | P a g e
Page 12
The proposed typical operation of the central plant is as follows during peak Summer College operating hours (with new CH-4 installed):
8am 9am
10 am
11 am
12 pm
1pm 2pm 3pm 4pm 5pm 6pm 7pm 8pm 9pm 10 pm
CH-2 X X X X X
CH-3 X X X X
CH-4 X X
CH-1 (BLDG 2)
X X
CH-2 (BLDG 2)
X
TES X X X X X X X
The proposed typical operation of the central plant is as follows night peak charging period (with new CH-4 installed):
11pm 12am 1am 2am 3am 4am 5am 6am 7am
CH-2 X X X X X X X X X
CH-3 X X X X X X X X X
CH-4 X X X X X X X X X
CH-1 (BLDG 2)
CH-2 (BLDG 2)
TES
Mt San Antonio College SCE Permanent Load Shifting Program Incentive 11 | P a g e
Page 13
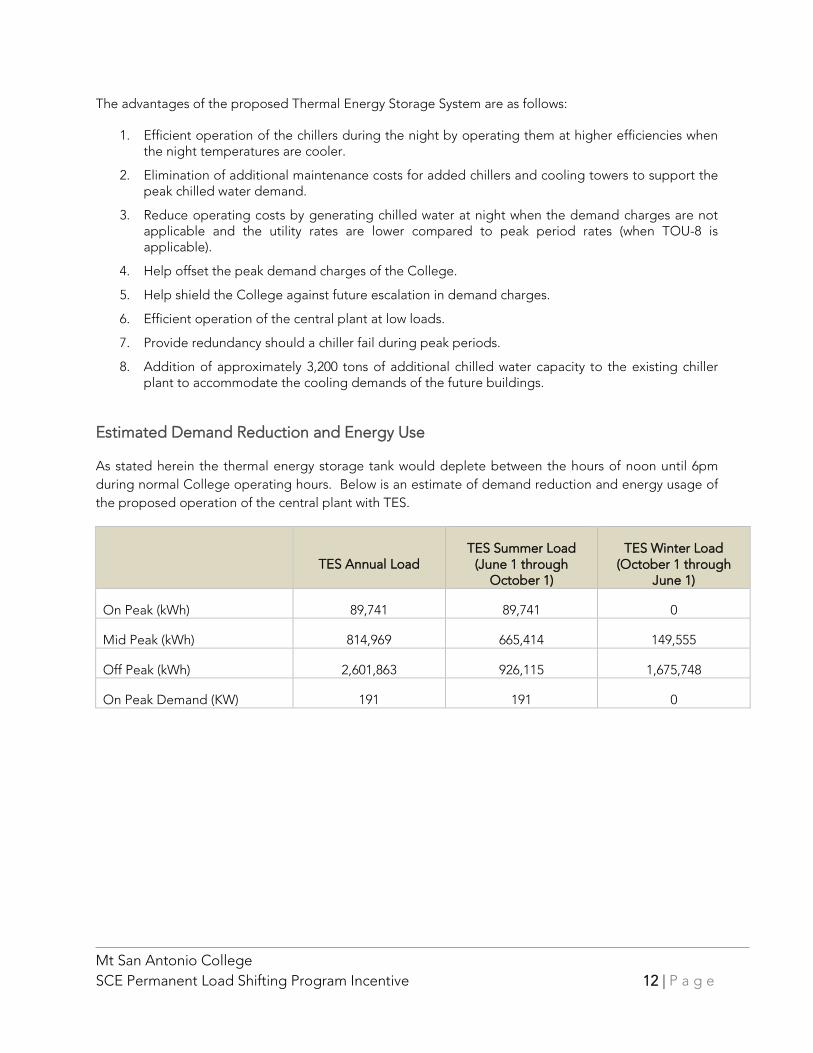
The advantages of the proposed Thermal Energy Storage System are as follows:
1. Efficient operation of the chillers during the night by operating them at higher efficiencies when the night temperatures are cooler.
2. Elimination of additional maintenance costs for added chillers and cooling towers to support the peak chilled water demand.
3. Reduce operating costs by generating chilled water at night when the demand charges are not applicable and the utility rates are lower compared to peak period rates (when TOU-8 is applicable).
4. Help offset the peak demand charges of the College.
5. Help shield the College against future escalation in demand charges.
6. Efficient operation of the central plant at low loads.
7. Provide redundancy should a chiller fail during peak periods.
8. Addition of approximately 3,200 tons of additional chilled water capacity to the existing chiller plant to accommodate the cooling demands of the future buildings.
Estimated Demand Reduction and Energy Use
As stated herein the thermal energy storage tank would deplete between the hours of noon until 6pm during normal College operating hours. Below is an estimate of demand reduction and energy usage of the proposed operation of the central plant with TES.
TES Annual Load TES Summer Load
(June 1 through October 1)
TES Winter Load (October 1 through
June 1)
On Peak (kWh) 89,741 89,741 0
Mid Peak (kWh) 814,969 665,414 149,555
Off Peak (kWh) 2,601,863 926,115 1,675,748
On Peak Demand (KW) 191 191 0
Mt San Antonio College SCE Permanent Load Shifting Program Incentive 12 | P a g e
Page 14
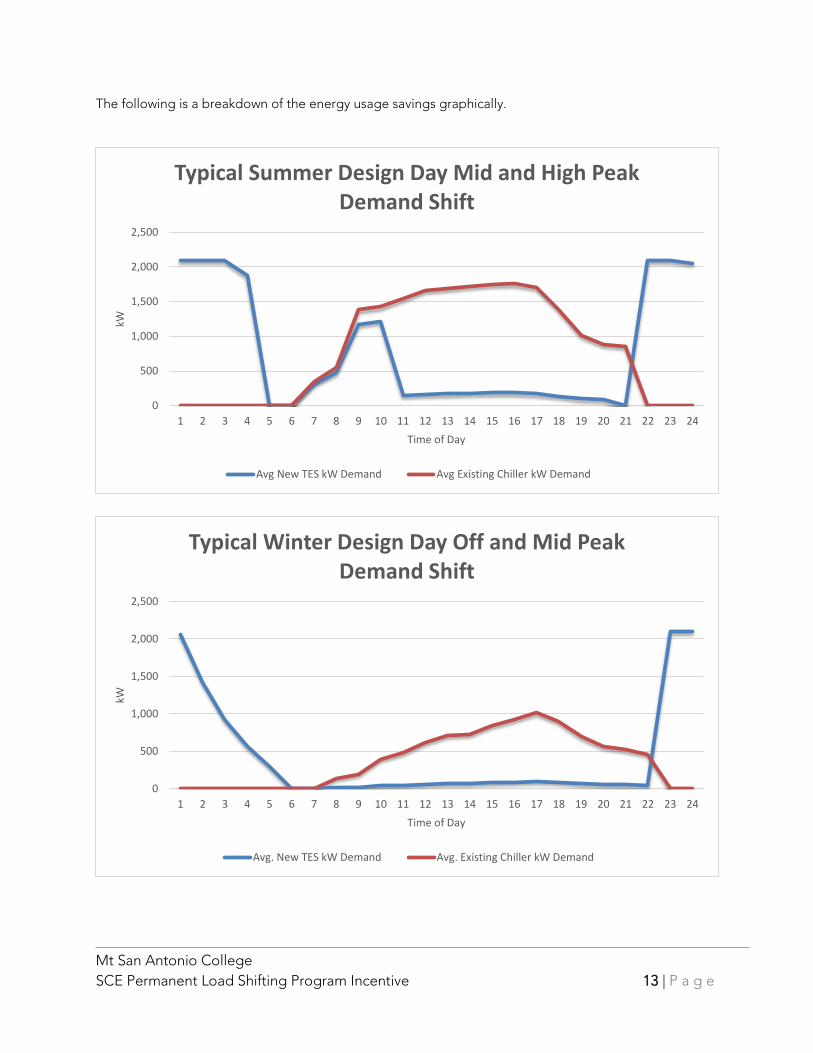
The following is a breakdown of the energy usage savings graphically.
0
500
1,000
1,500
2,000
2,500
1 2 3 4 5 6 7 8 9 10 11 12 13 14 15 16 17 18 19 20 21 22 23 24
kW
Time of Day
Typical Summer Design Day Mid and High Peak Demand Shift
Avg New TES kW Demand Avg Existing Chiller kW Demand
0
500
1,000
1,500
2,000
2,500
1 2 3 4 5 6 7 8 9 10 11 12 13 14 15 16 17 18 19 20 21 22 23 24
kW
Time of Day
Typical Winter Design Day Off and Mid Peak Demand Shift
Avg. New TES kW Demand Avg. Existing Chiller kW Demand
Mt San Antonio College SCE Permanent Load Shifting Program Incentive 13 | P a g e
Page 15
Energy Efficiency Information
The summer on, mid, and off peak periods, winter mid and off peak periods, and demand charges were considered as part of the energy analysis for this College. Appendix D can be referred to for the breakdown in costs for each period, below is the savings as calculated per year.
Existing Annual Consumption
TES Annual Consumption with
TOU Rate Annual Savings
Summer On Peak (kWh) $125,891.52 $9,438.94 $116,452.59
Summer Mid Peak (kWh) $117,101.16 $55,708.46 $61,392.69
Summer Off Peak (kWh) $4,422.49 $54,708.46 ($49,653.37)
Winter Mid Peak (kWh) $215,476.30 $11,732.60 $203,743.69
Winter Off Peak (kWh) $15,135.66 $91,009.85 ($75,874.19)
Summer On Peak Demand (KW)
$24,488.19 $3,552.47 $20,935.72
Summer Mid Peak Demand (KW)
$24,406.75 $917.93 $23,488.82
Summer Facility Related Demand (KW)
$24,488.19 $2,347.34 $22,140.85
Total $551,410.26 $228,783.45 $322,626.82
The annual operating savings is approximately $323,000 per year. This is based upon the SCE TOU-8 rate, campus load profiles, and existing and future equipment efficiencies.
Mt San Antonio College SCE Permanent Load Shifting Program Incentive 14 | P a g e
Page 16
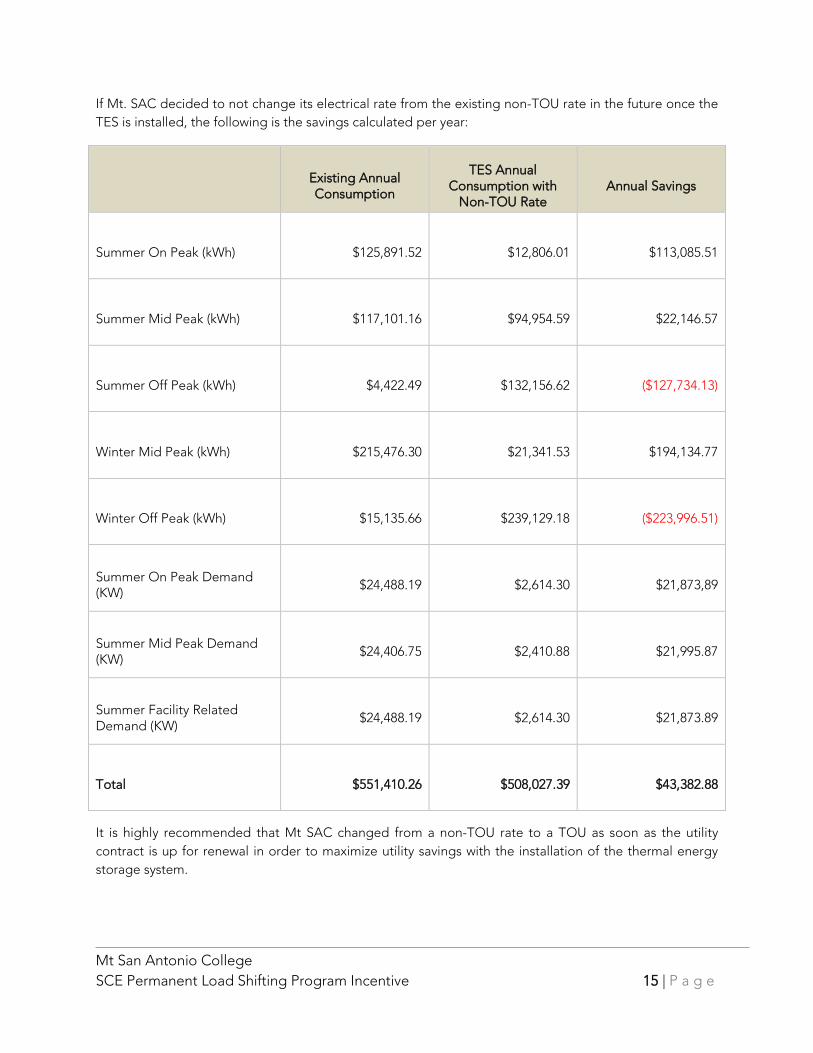
If Mt. SAC decided to not change its electrical rate from the existing non-TOU rate in the future once the TES is installed, the following is the savings calculated per year:
Existing Annual Consumption
TES Annual Consumption with
Non-TOU Rate Annual Savings
Summer On Peak (kWh) $125,891.52 $12,806.01 $113,085.51
Summer Mid Peak (kWh) $117,101.16 $94,954.59 $22,146.57
Summer Off Peak (kWh) $4,422.49 $132,156.62 ($127,734.13)
Winter Mid Peak (kWh) $215,476.30 $21,341.53 $194,134.77
Winter Off Peak (kWh) $15,135.66 $239,129.18 ($223,996.51)
Summer On Peak Demand (KW)
$24,488.19 $2,614.30 $21,873,89
Summer Mid Peak Demand (KW)
$24,406.75 $2,410.88 $21,995.87
Summer Facility Related Demand (KW)
$24,488.19 $2,614.30 $21,873.89
Total $551,410.26 $508,027.39 $43,382.88
It is highly recommended that Mt SAC changed from a non-TOU rate to a TOU as soon as the utility contract is up for renewal in order to maximize utility savings with the installation of the thermal energy storage system.
Mt San Antonio College SCE Permanent Load Shifting Program Incentive 15 | P a g e
Page 17
Operations and Maintenance
Thermal Energy Storage Tank
The maintenance of the tank would meet AWWA D100, the governing code for water storage tanks, including TES. It recommends that inspections are made every 3-5 years. Because the tank has no moving parts, visual inspections are all that are required with touch-up paint work as needed and recoats in accordance with paint manufacturer's recommendations. Because the TES tanks have insulation on the outside, it is also recommended to visually inspect the insulation for any physical damage. Considering the environment/climate of Walnut, in the case of the Mt San Antonio College tank, there is little reason to suspect that the exterior paint is having any issues as long as the insulation paneling remains intact. The insulation protects the exterior paint from the elements. Visual inspection of the tank interior can be done by using a diver or some form of remote control camera, although this is rarely done. It is our understanding that the cool temperatures of the water inside the tank along with the chemical additives greatly increase the life of the internal coatings. The concrete itself will theoretically last indefinitely as long as it remains protected. Therefore, the main concern when it comes to inspections revolve around the tank coatings. As long as the paint is in good condition, the concrete is in good condition. As noted above, as long as the insulation is in good condition, the exterior paint should be in good condition.
Chillers and Pumps
Currently the chillers and pumps are maintained by an independent contractor. The campus will continue to maintain the current maintenance plan for the existing chiller, the new chiller, and new pumps. This would not be an added cost to the project once the thermal energy storage tank in constructed, as this maintenance plan is currently in place now.
It is our understanding the chillers are checked quarterly and annually. Pump motors are recommended to be inspected every 6 months. The Mt San Antonio pumps have seal bearings thus lubrication is not required.
The annual operating costs are minimal since the thermal energy storage tank has no moving parts. There is also a chiller and pump maintenance program in place for the existing chiller and pumps, therefore, this maintenance cost would be negligible when considering added costs of maintenance for the thermal energy storage tank installation. However, there is additional maintenance costs related to the additional 750 ton chiller installation, new pumps, and the additional water treatment. The estimated increase in delta costs annually for this maintenance is approximately $45,000.
Mt San Antonio College SCE Permanent Load Shifting Program Incentive 16 | P a g e
Page 18
Economic Analysis
The installation of the Mt San Antonio thermal energy storage system is estimated to be approximately $5,235,000. This includes all installation and equipment costs for the tank, the chiller, the pumps, structural, etc. A breakdown of estimated construction costs is included in Appendix E. The calculated incentive for this program is as follows:
Cooling Load Shift (tons) Conversion Factor (kw/ton) PLS Incentive per KW Calculated Incentive
2,617 0.7 $875 $1,602,913
Below is a 20 year life cycle cost analysis considering a 3% escalation factor every year on the utility rates and 3% on the maintenance costs on the thermal energy storage tank, new chiller, new pumps, and additional water treatment:
Year Construction
Cost Incentives
Annual Energy Savings
Delta Maintenance Costs
Year End Costs
1 ($5,235,000) $1,602,913 $322,627 ($45,000) ($3,354,461) 2 ($3,354,461) $332,306 ($46,350) ($3,068,505) 3 ($3,068,505) $342,275 ($47,741) ($2,773,971) 4 ($2,773,971) $352,543 ($49,173) ($2,470,600) 5 ($2,470,600) $363,119 ($50,648) ($2,158,129) 6 ($2,158,129) $374,013 ($52,167) ($1,836,283) 7 ($1,836,283) $385,233 ($53,732) ($1,504,783) 8 ($1,504,783) $396,790 ($55,344) ($1,163,337) 9 ($1,163,337) $408,694 ($57,005) ($811,647)
10 ($811,647) $420,955 ($58,715) ($449,407) 11 ($449,407) $433,583 ($60,476) ($76,300) 12 ($76,300) $446,591 ($62,291) $308,001 13 $0 $459,989 ($64,159) $395,829 14 $0 $473,788 ($66,084) $407,704 15 $0 $488,002 ($68,067) $419,935 16 $0 $502,642 ($70,109) $432,534 17 $0 $517,721 ($72,212) $445,510 18 $0 $533,253 ($74,378) $458,875 19 $0 $549,251 ($76,609) $472,641 20 $0 $565,728 ($78,908) $486,820
Mt San Antonio College SCE Permanent Load Shifting Program Incentive 17 | P a g e
Page 19
Recommendations
P2S Engineering Inc. recommends the installation of the 20,000 ton hour chilled water thermal energy tank at Mt San Antonio College for the following reasons:
1. Annual energy savings of approximately 2,300,000 kWh during mid and peak periods resulting in a first year energy savings of $323,000. This savings would incrementally increase every year.
2. The $1,602,903 incentive available by SCE to offset first costs related to the installation of a thermal energy storage system, after the 2016 buildings are connected,
3. The 20 year life cycle cost analysis and expected continued energy savings reflecting a positive rate of return after 12 years.
4. The thermal energy storage tank allows for flexibility in the chilled water system when considering maintenance of the existing chillers.
5. The maintenance as related to adding the thermal energy storage system is minimal as compared to expanding the central plant with only adding additional chillers or ice storage system. This is important in a community college setting.
6. The 20,000 ton hour capacity in the thermal energy storage tank allows for future connection to the central plant chilled water system once the remaining buildings are renovated.
Mt San Antonio College SCE Permanent Load Shifting Program Incentive 18 | P a g e
Page 20
Appendix A – Existing and Future Rate Schedules
Mt San Antonio College SCE Permanent Load Shifting Program Incentive 19 | P a g e
Page 27
Appendix B - Mt San Antonio TES Schedule and Site Plan
Mt San Antonio College SCE Permanent Load Shifting Program Incentive 26 | P a g e
Page 31
Appendix C - Mt San Antonio College Load Profile
Mt San Antonio College SCE Permanent Load Shifting Program Incentive 30 | P a g e
Page 32
Building # BUILDING NAME BUILDING USE AREA (SF)SCHEDULED COMPLETION
ESTIMATED LOAD (TONS)
Calculated TRACE LOAD
(TONS)
Calculated SF/ton
1A Art Center Classrooms 16,700 1971 60.4 276
1 B/C Art Studio Complex Classrooms 16,136 73.4 220
2B Fedderson Recital Hall Theater/Music Hall 63,361 2003 Expansion 192.6 329
4 Administration Offices 41,693 1963 113.1 369
6 Learning Technology Center Offices 101,784 1997 249.4 408
7 Science South Classrooms/Labs 37,226 ‐ 297.8 125
9B Student Services Offices 51,369 2006 Reno. 117.8 436
11 Science North Classrooms/Labs 18,939 ‐ 107.5 176
13 Design Technology Classroom 62,000 2012 162.7 381
26 Humanities/Social Sciences Classrooms 98,320 358.2 274
29 Central Plant Office 148 2003 1.0 148
60 Science Labs 62,982 2006 248.8 253
61 Math & Sciences Classrooms/Labs 64,139 2006 210.7 304
66 Language Center Classrooms 43,911 2003 Reno. 122.6 358
67A Health Careers Classroom 31,768 2003 Reno. 89.9 353
67B Student Health Offices 10,995 2003 Reno. 33.0 333
70-73 Early Childhood Education Center Children Center 36,012 2013 99.0 364
80 Agriculture Science Building Lab 51,100 2012 213.4 239
2801 295
470 296
Athletics Phase 1 45,000 2016 240 188
Library/Campus Center Library 217,200 2017-2019 543 400
Classroom Building Renovation Classroom 101,400 2017-2019 254 399
Language Lab Expansion Labs 15,000 2017-2019 38 395
Building 9A Renovation Food Service/Dining 21,300 2017-2019 53 402
Building 40 Continuing Education Remodel Classroom 24,440 2017-2019 61 401
Athletics Phase 2 Athletics 50,000 2017-2019 260 192
1449 399
Future Instruction Building Zone Classroom 50,000 2020 125 400
Auditorium Zone Auditorium 12,000 2020 30 400
Future Instruction Building Zone Classroom 75,000 2025 188 399
Future Instruction Building Zone Classroom 100,000 2025 250 400
593 400 Totals
9B Add. Student Support Services Offices
Phase 3
Business and Technology Center
Phase 2
2015 53.1
365.0
16,056
2015
Existing
Totals
238 Classroom/Comp. Lab 87,000
2015Food Services Food Service/Dining
Totals
Totals
2015
12,000 51.8
302
9A
49.4 263 12 Building 12 Renovation Classroom 13,000 2014
Page 33
9/15/2014 CHWS CHWRFM4 Plnt Raw GPM
FM1 Plnt Raw GPM BTUH
CP TONNAGE
Bldg 2 Tonnage TOTAL
12:00 AM 40 49.1 453 975 6,497,400 541 181 723 1:00 AM 40 49.4 371.9 1,130.10 7,059,400 588 143 731 2:00AM 40 50.5 242 1,077.80 6,928,950 577 150 728 3:00 AM 40 50.5 203.4 1,059.60 6,630,750 553 134 687 4:00 AM 40 50.6 190.6 1,234.90 7,555,150 630 141 771 5:00 AM 40 52.6 170.5 1,333.60 9,475,830 790 181 971 6:00 AM 40 53.8 187.6 1,525.20 11,818,320 985 325 1,310 7:00 AM 40 52.2 206.4 1,958.20 13,204,060 1,100 181 1,281 8:00 AM 40 52.6 297.8 1,930.00 14,035,140 1,170 167 1,337 9:00 AM 40 53 326.4 2,121.40 15,910,700 1,326 150 1,476 10:00 AM 40 54.1 422 2,125.40 17,959,170 1,497 163 1,660 11:00 AM 42 55.4 407.5 2,314.70 18,238,740 1,520 358 1,878 12:00 PM 44 56.6 418.7 2,433.60 17,969,490 1,497 353 1,850 1:00 PM 46 58.3 501.2 2,518.40 18,570,540 1,548 404 1,951 2:00 PM 48 60.4 583.6 2,522.50 19,257,820 1,605 414 2,019 3:00 PM 50 64.2 552.6 2,633.20 22,619,180 1,885 426 2,311 4:00 PM 48 61 562.5 2,574.80 20,392,450 1,699 423 2,123 5:00 PM 46 59 496.2 2,506.30 19,516,250 1,626 416 2,042 6:00 PM 43 56.3 423.3 2,417.50 18,891,320 1,574 344 1,918 7:00 PM 40 54 422 2,183.80 18,240,600 1,520 292 1,812 8:00 PM 40 54 370.6 1,930.00 16,104,200 1,342 222 1,564 9:00 PM 40 53.6 366.3 1,889.70 15,340,800 1,278 199 1,477 10:00 PM 40 52.4 246 1,766.90 12,479,980 1,040 180 1,220 11:00 PM 45 51.9 16.5 751.4 2,649,255 221 133 354
Page 34
System ChecksumsBy P2S Engineering, Inc
Variable Volume Reheat (30% Min Flow Default)AH1
HEATING COIL PEAKCLG SPACE PEAKCOOLING COIL PEAK TEMPERATURESHeating DesignMo/Hr:10 / 16Mo/Hr:7 / 15Mo/Hr:Peaked at Time: Cooling Heating
SADBOADB: 30OADB:95 / 71 / 78OADB/WB/HR:Outside Air: 55.0 73.4Ra Plenum 73.7 65.8ReturnPercentCoil PeakSpace PeakSpace PercentPercentNetPlenumSpace 73.7 65.8Ret/OASens. + Lat. Of TotalTot SensSpace SensOf TotalSensibleOf TotalTotalSens. + Lat 30.095.0
0.00.2Fn MtrTDBtu/h (%)Btu/hBtu/h(%)Btu/h(%)Btu/hBtu/h0.00.5Fn BldTDEnvelope Loads0.01.4Fn Frict0Skylite Solar 0.000000000
0Skylite Cond 0.0000000000Roof Cond 2.17-10,538000220,32120,321
0.007,902Glass Solar 00616,42617,90204,493Glass/Door Cond -9,026 1.86-9,02624,37014,4930
AIRFLOWSHeatingCooling8,620Wall Cond 2.66-12,912-7,341411,346215,2716,651
2,484Partition/Door 1.17-5,692-5,69212,72502,4840Floor 0.0000000
Sec Fan0.000Infiltration 000000
4,706 4,706MinStop/Rh
7.8723,499Sub Total ==> -38,169-22,0591234,868650,47126,972
15,685Return 4,706
Internal Loads
4,70615,685Exhaust
21,057Lights 0.0000721,057326,3215,264
0 0Rm Exh
153,450People 0.0003085,25018
00Auxiliary
13,471Misc 0.0000513,471213,4710187,978Sub Total ==> 0.000042119,77823193,2425,264
3,691Ceiling Load 0.000-4,85213,47500-3,6910Ventilation Load 39.27-190,51800070584,9520
Sup. Fan Heat 435,320
ENGINEERING CKSHeatingCooling
Ret. Fan Heat 000 % OA 100.0100.0Duct Heat Pkup 000 0.692.30cfm/ft²
3,318Ov/Undr Sizing0.0000
44125,98403,318
224.40cfm/ton
Exhaust Heat-2.3211,258
-3-28,545
97.57ft²/ton-71.14122.99Btu/hr·ft²
341No. People218,486Grand Total ==> 100.00-485,166-26,911100.00284,105100.00838,7590
AREAS HEATING COIL SELECTIONCOOLING COIL SELECTIONTotal Capacity Sens Cap. Coil Airflow Enter DB/WB/HR Leave DB/WB/HR Gross Total Glass Coil Airflow Ent LvgCapacity
ton MBh MBh cfm °F °F gr/lb °F °F gr/lb ft² (%) °F°FcfmMBhFloor 6,820 Main Htg -102.7 4,706 52.9 73.469.9 838.8 570.2 15,685 95.0 70.5 78.2 52.9 52.8 62.3Main ClgPart 1,006 Aux Htg 0.0 0.00.000.0 0.0 0.0 0 0.0 0.0 0.0 0.0 0.0 0.0Aux Clg
ExFlr 0-382.5Preheat 30.0 52.915,6850.0 0.0 0.0 0 0.0 0.0 0.0 0.0 0.0 0.0Opt Vent
Roof 7,423 0 0Reheat -75.8 68.052.94,706
Wall 2,919 304 10Humidif 0.0 0 0.0 0.069.9 838.8TotalOpt Vent 0.0 0.00.00
-485.2Total
Envelope LoadsSkylite SolarSkylite CondRoof CondGlass SolarGlass/Door CondWall CondPartition/DoorFloor
InfiltrationSub Total ==>
LightsPeopleMiscSub Total ==>
Ceiling LoadVentilation Load
Additional Reheat
OA Preheat Diff.
Ov/Undr SizingExhaust Heat
RA Preheat Diff.
Grand Total ==>
Internal Loads
0
-267,7370
55.180.000.00
-28,545
Supply Air Leakage
93
Dehumid. Ov Sizing 0 0Adj Air Trans Heat 0 0 0 0 0 Adj Air Trans Heat 0 0 0
Leakage UpsLeakage Dwn
00InfilAHU VentNom Vent
Main FanTerminal
Adjacent Floor
Diffuser
Supply Air LeakageUnderflr Sup Ht Pkup Underflr Sup Ht Pkup
Adjacent Floor0 0 0 0
0 00 0 0
00
0 0 0 0
0 0.000 0.00
15,68515,68515,685
015,68515,685
00
4,7064,7064,706
04,7064,706
00
0 153,450 0
Int Door 0
Ext Door 0 0 0
TRACE® 700 v6.2.9 calculated at 04:15 PM on 05/02/2013Project Name: Ag ScienceDataset Name: Alternative - 2 System Checksums Report Page 4 of 12130415 AG SCI.TRC
Page 35
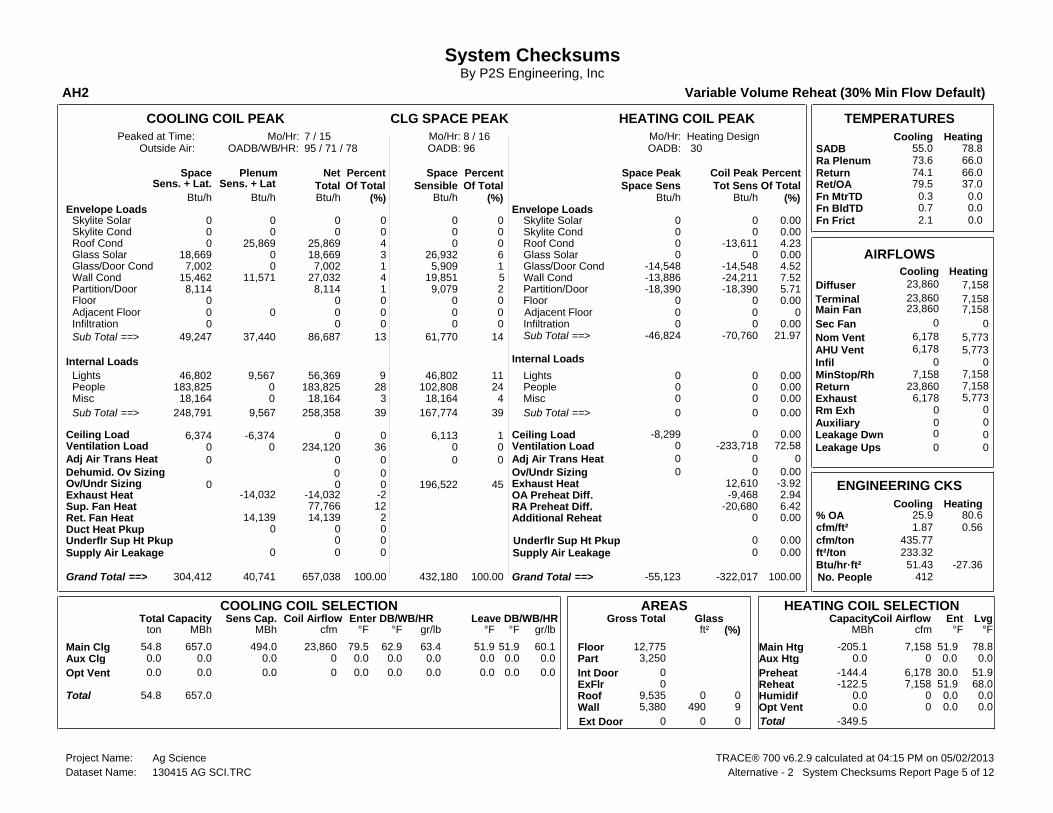
System ChecksumsBy P2S Engineering, Inc
Variable Volume Reheat (30% Min Flow Default)AH2
HEATING COIL PEAKCLG SPACE PEAKCOOLING COIL PEAK TEMPERATURESHeating DesignMo/Hr:8 / 16Mo/Hr:7 / 15Mo/Hr:Peaked at Time: Cooling Heating
SADBOADB: 30OADB:95 / 71 / 78OADB/WB/HR:Outside Air: 55.0 78.8Ra Plenum 73.6 66.0ReturnPercentCoil PeakSpace PeakSpace PercentPercentNetPlenumSpace 74.1 66.0Ret/OASens. + Lat. Of TotalTot SensSpace SensOf TotalSensibleOf TotalTotalSens. + Lat 37.079.5
0.00.3Fn MtrTDBtu/h (%)Btu/hBtu/h(%)Btu/h(%)Btu/hBtu/h0.00.7Fn BldTDEnvelope Loads0.02.1Fn Frict0Skylite Solar 0.000000000
0Skylite Cond 0.0000000000Roof Cond 4.23-13,611000425,86925,869
0.0018,669Glass Solar 00626,932318,66907,002Glass/Door Cond -14,548 4.52-14,54815,90917,0020
AIRFLOWSHeatingCooling15,462Wall Cond 7.52-24,211-13,886519,851427,03211,571
8,114Partition/Door 5.71-18,390-18,39029,07918,1140Floor 0.0000000
Sec Fan0.000Infiltration 000000
7,158 7,158MinStop/Rh
21.9749,247Sub Total ==> -70,760-46,8241461,7701386,68737,440
23,860Return 7,158
Internal Loads
5,7736,178Exhaust
46,802Lights 0.00001146,802956,3699,567
0 0Rm Exh
183,825People 0.00024102,80828
00Auxiliary
18,164Misc 0.0000418,164318,1640248,791Sub Total ==> 0.000039167,77439258,3589,567
6,374Ceiling Load 0.000-8,29916,11300-6,3740Ventilation Load 72.58-233,71800036234,1200
Sup. Fan Heat 1277,766
ENGINEERING CKSHeatingCooling
Ret. Fan Heat 214,13914,139 % OA 80.625.9Duct Heat Pkup 000 0.561.87cfm/ft²
0Ov/Undr Sizing0.0000
45196,52200
435.77cfm/ton
Exhaust Heat-3.9212,610
-2-14,032
233.32ft²/ton-27.3651.43Btu/hr·ft²
412No. People304,412Grand Total ==> 100.00-322,017-55,123100.00432,180100.00657,03840,741
AREAS HEATING COIL SELECTIONCOOLING COIL SELECTIONTotal Capacity Sens Cap. Coil Airflow Enter DB/WB/HR Leave DB/WB/HR Gross Total Glass Coil Airflow Ent LvgCapacity
ton MBh MBh cfm °F °F gr/lb °F °F gr/lb ft² (%) °F°FcfmMBhFloor 12,775 Main Htg -205.1 7,158 51.9 78.854.8 657.0 494.0 23,860 79.5 62.9 63.4 51.9 51.9 60.1Main ClgPart 3,250 Aux Htg 0.0 0.00.000.0 0.0 0.0 0 0.0 0.0 0.0 0.0 0.0 0.0Aux Clg
ExFlr 0-144.4Preheat 30.0 51.96,1780.0 0.0 0.0 0 0.0 0.0 0.0 0.0 0.0 0.0Opt Vent
Roof 9,535 0 0Reheat -122.5 68.051.97,158
Wall 5,380 490 9Humidif 0.0 0 0.0 0.054.8 657.0TotalOpt Vent 0.0 0.00.00
-349.5Total
Envelope LoadsSkylite SolarSkylite CondRoof CondGlass SolarGlass/Door CondWall CondPartition/DoorFloor
InfiltrationSub Total ==>
LightsPeopleMiscSub Total ==>
Ceiling LoadVentilation Load
Additional Reheat
OA Preheat Diff.
Ov/Undr SizingExhaust Heat
RA Preheat Diff.
Grand Total ==>
Internal Loads
0
-9,468-20,680
2.946.420.00
-14,032
Supply Air Leakage
96
Dehumid. Ov Sizing 0 0Adj Air Trans Heat 0 0 0 0 0 Adj Air Trans Heat 0 0 0
Leakage UpsLeakage Dwn
00InfilAHU VentNom Vent
Main FanTerminal
Adjacent Floor
Diffuser
Supply Air LeakageUnderflr Sup Ht Pkup Underflr Sup Ht Pkup
Adjacent Floor0 0 0 0
0 00 0 0
00
0 0 0 0
0 0.000 0.00
23,86023,86023,860
06,1786,178
00
7,1587,1587,158
05,7735,773
00
0 183,825 0
Int Door 0
Ext Door 0 0 0
TRACE® 700 v6.2.9 calculated at 04:15 PM on 05/02/2013Project Name: Ag ScienceDataset Name: Alternative - 2 System Checksums Report Page 5 of 12130415 AG SCI.TRC
Page 36
System ChecksumsBy P2S Engineering, Inc
Variable Volume Reheat (30% Min Flow Default)AH3
HEATING COIL PEAKCLG SPACE PEAKCOOLING COIL PEAK TEMPERATURESHeating DesignMo/Hr:10 / 15Mo/Hr:7 / 15Mo/Hr:Peaked at Time: Cooling Heating
SADBOADB: 30OADB:95 / 71 / 78OADB/WB/HR:Outside Air: 55.0 72.8Ra Plenum 73.6 66.0ReturnPercentCoil PeakSpace PeakSpace PercentPercentNetPlenumSpace 73.6 66.0Ret/OASens. + Lat. Of TotalTot SensSpace SensOf TotalSensibleOf TotalTotalSens. + Lat 30.095.0
0.00.2Fn MtrTDBtu/h (%)Btu/hBtu/h(%)Btu/h(%)Btu/hBtu/h0.00.5Fn BldTDEnvelope Loads0.01.4Fn Frict0Skylite Solar 0.000000000
0Skylite Cond 0.0000000000Roof Cond 1.80-8,270000215,65415,654
0.005,655Glass Solar 00410,26915,65503,460Glass/Door Cond -6,948 1.52-6,94813,36303,4600
AIRFLOWSHeatingCooling10,105Wall Cond 3.58-16,397-9,585514,220217,3947,290
175Partition/Door 0.09-402-402021701750Floor 0.0000000
Sec Fan0.000Infiltration 000000
4,476 4,476MinStop/Rh
6.9819,395Sub Total ==> -32,016-16,9351028,068542,33922,944
14,920Return 4,476
Internal Loads
4,47614,920Exhaust
25,273Lights 0.0000925,273431,4546,182
0 0Rm Exh
207,968People 0.00043115,53824
00Auxiliary
27,714Misc 0.00001027,714327,7140260,954Sub Total ==> 0.000062168,52431267,1356,182
4,535Ceiling Load 0.000-5,74224,07900-4,5350Ventilation Load 39.52-181,22600063542,7590
Sup. Fan Heat 433,598
ENGINEERING CKSHeatingCooling
Ret. Fan Heat 000 % OA 100.0100.0Duct Heat Pkup 000 0.481.61cfm/ft²
434Ov/Undr Sizing0.0000
2669,5770434
207.78cfm/ton
Exhaust Heat-2.049,340
-3-24,590
128.86ft²/ton-49.5693.12Btu/hr·ft²
462No. People285,318Grand Total ==> 100.00-458,581-22,676100.00270,248100.00861,6740
AREAS HEATING COIL SELECTIONCOOLING COIL SELECTIONTotal Capacity Sens Cap. Coil Airflow Enter DB/WB/HR Leave DB/WB/HR Gross Total Glass Coil Airflow Ent LvgCapacity
ton MBh MBh cfm °F °F gr/lb °F °F gr/lb ft² (%) °F°FcfmMBhFloor 9,253 Main Htg -94.8 4,476 52.9 72.871.8 861.7 592.3 14,920 95.0 70.5 78.2 52.9 52.1 59.3Main ClgPart 71 Aux Htg 0.0 0.00.000.0 0.0 0.0 0 0.0 0.0 0.0 0.0 0.0 0.0Aux Clg
ExFlr 0-363.8Preheat 30.0 52.914,9200.0 0.0 0.0 0 0.0 0.0 0.0 0.0 0.0 0.0Opt Vent
Roof 5,779 0 0Reheat -72.1 68.052.94,476
Wall 3,540 234 7Humidif 0.0 0 0.0 0.071.8 861.7TotalOpt Vent 0.0 0.00.00
-458.6Total
Envelope LoadsSkylite SolarSkylite CondRoof CondGlass SolarGlass/Door CondWall CondPartition/DoorFloor
InfiltrationSub Total ==>
LightsPeopleMiscSub Total ==>
Ceiling LoadVentilation Load
Additional Reheat
OA Preheat Diff.
Ov/Undr SizingExhaust Heat
RA Preheat Diff.
Grand Total ==>
Internal Loads
0
-254,6790
55.540.000.00
-24,590
Supply Air Leakage
94
Dehumid. Ov Sizing 0 0Adj Air Trans Heat 0 0 0 0 0 Adj Air Trans Heat 0 0 0
Leakage UpsLeakage Dwn
00InfilAHU VentNom Vent
Main FanTerminal
Adjacent Floor
Diffuser
Supply Air LeakageUnderflr Sup Ht Pkup Underflr Sup Ht Pkup
Adjacent Floor0 0 0 0
0 00 0 0
00
0 0 0 0
0 0.000 0.00
14,92014,92014,920
014,92014,920
00
4,4764,4764,476
04,4764,476
00
0 207,968 0
Int Door 0
Ext Door 0 0 0
TRACE® 700 v6.2.9 calculated at 04:15 PM on 05/02/2013Project Name: Ag ScienceDataset Name: Alternative - 2 System Checksums Report Page 6 of 12130415 AG SCI.TRC
Page 37
System ChecksumsBy P2S Engineering, Inc
Variable Volume Reheat (30% Min Flow Default)Bldg 70
HEATING COIL PEAKCLG SPACE PEAKCOOLING COIL PEAK TEMPERATURES
Heating DesignMo/Hr:9 / 16Mo/Hr:9 / 16Mo/Hr:Peaked at Time: Cooling HeatingSADBOADB: 28OADB:96 / 70 / 67OADB/WB/HR:Outside Air: 60.0 90.7Ra Plenum 85.5 61.7
ReturnPercentCoil PeakSpace PeakSpace PercentPercentNetPlenumSpace 74.0 68.0Ret/OASens. + Lat. Of TotalTot SensSpace SensOf TotalSensibleOf TotalTotalSens. + Lat 57.775.7
0.00.0Fn MtrTDBtu/h (%)Btu/hBtu/h(%)Btu/h(%)Btu/hBtu/h0.00.0Fn BldTDEnvelope Loads0.00.0Fn Frict0Skylite Solar 0.000000000
0Skylite Cond 0.0000000000Roof Cond 9.26-10,8410001018,58318,583
0.0018,346Glass Solar 001418,3461018,34603,271Glass/Door Cond -6,016 5.14-6,01623,27123,2710
AIRFLOWS
HeatingCooling4,322Wall Cond 9.54-11,165-8,36534,32235,088766
0Partition/Door 0.0000000015,509Floor 20.71-24,238-24,23812815,509
Sec Fan11.508,387Infiltration -13,456-13,45667,53248,387
2,624 2,624MinStop/Rh
56.1649,835Sub Total ==> -65,715-52,0753648,9793769,18319,349
8,578Return 2,455
Internal Loads
508508Exhaust
21,110Lights 0.00001621,1101426,3885,278
475 475Rm Exh
29,538People 0.0001114,34916
00Auxiliary
25,693Misc 0.00001925,6931425,6930
76,341Sub Total ==> 0.00004561,1524381,6195,278
24,626Ceiling Load 0.000-13,6401824,62600-24,6260Ventilation Load 25.55-29,9010001018,6380
Sup. Fan Heat 00
ENGINEERING CKS
HeatingCooling
Ret. Fan Heat 000 % OA 25.87.8
Duct Heat Pkup 1019,2850 0.391.29cfm/ft²
0Ov/Undr Sizing0.0000
0000
556.23cfm/ton
Exhaust Heat0.000
00
431.23ft²/ton-17.2527.83Btu/hr·ft²
56No. People150,802Grand Total ==> 100.00-117,015-65,715100.00134,757100.00188,7250
AREAS HEATING COIL SELECTIONCOOLING COIL SELECTIONTotal Capacity Sens Cap. Coil Airflow Enter DB/WB/HR Leave DB/WB/HR Gross Total Glass Coil Airflow Ent LvgCapacity
ton MBh MBh cfm °F °F gr/lb °F °F gr/lb ft² (%) °F°FcfmMBh
Floor 6,782 Main Htg -94.6 2,624 58.0 90.715.7 188.7 170.8 8,748 75.7 62.3 63.6 58.0 55.0 60.7Main ClgPart 0 Aux Htg 0.0 0.00.000.0 0.0 0.0 0 0.0 0.0 0.0 0.0 0.0 0.0Aux Clg
ExFlr 6,361-22.4Preheat 28.0 58.06780.0 0.0 0.0 0 0.0 0.0 0.0 0.0 0.0 0.0Opt Vent
Roof 9,918 0 0Reheat -28.9 68.058.02,624
Wall 4,531 551 12Humidif 0.0 0 0.0 0.015.7 188.7Total
Opt Vent 0.0 0.00.00
-117.0Total
Envelope LoadsSkylite SolarSkylite CondRoof CondGlass SolarGlass/Door CondWall CondPartition/DoorFloor
InfiltrationSub Total ==>
LightsPeopleMisc
Sub Total ==>
Ceiling LoadVentilation Load
Additional Reheat
OA Preheat Diff.
Ov/Undr SizingExhaust Heat
RA Preheat Diff.
Grand Total ==>
Internal Loads
0
0-21,399
0.0018.290.00
0
Supply Air Leakage
96
Dehumid. Ov Sizing 0 0
Adj Air Trans Heat 0 0 0 0 0 Adj Air Trans Heat 0 0 0Leakage Ups
Leakage Dwn
305305Infil
AHU VentNom Vent
Main FanTerminal
Adjacent Floor
Diffuser
Supply Air LeakageUnderflr Sup Ht Pkup Underflr Sup Ht Pkup
Adjacent Floor0 0 0 0
0 00 0 0
015,509
0 0 0 0
0 0.000 0.00
8,748
8,7488,748
0
678678
0
0
2,624
2,6242,624
0
678
678
0
0
0 29,538 0
Int Door 0
Ext Door 0 0 0
TRACE® 700 v6.3 calculated at 09:04 AM on 06/20/2014Project Name: 7091 Building 70
Dataset Name: Alternative - 1 System Checksums Report Page 1 of 470.TRC
Page 38
System ChecksumsBy P2S Engineering, Inc
Single Zone Variable Air VolumeBldg 71
HEATING COIL PEAKCLG SPACE PEAKCOOLING COIL PEAK TEMPERATURES
Heating DesignMo/Hr:9 / 16Mo/Hr:9 / 16Mo/Hr:Peaked at Time: Cooling HeatingSADBOADB: 28OADB:96 / 70 / 67OADB/WB/HR:Outside Air: 56.8 92.4Ra Plenum 84.3 62.4
ReturnPercentCoil PeakSpace PeakSpace PercentPercentNetPlenumSpace 74.0 68.0Ret/OASens. + Lat. Of TotalTot SensSpace SensOf TotalSensibleOf TotalTotalSens. + Lat 33.779.8
0.00.0Fn MtrTDBtu/h (%)Btu/hBtu/h(%)Btu/h(%)Btu/hBtu/h0.00.0Fn BldTDEnvelope Loads0.00.0Fn Frict0Skylite Solar 0.000000000
0Skylite Cond 0.0000000000Roof Cond 6.49-12,491000721,28121,281
0.0026,357Glass Solar 001426,357826,35706,041Glass/Door Cond -11,111 5.77-11,11136,04126,0410
AIRFLOWS
HeatingCooling3,970Wall Cond 5.70-10,964-7,85823,97014,863893
0Partition/Door 0.0000000017,984Floor 14.60-28,106-28,10610617,984
Sec Fan9.0110,777Infiltration -17,346-17,34659,710310,777
2,974 2,974MinStop/Rh
41.5865,128Sub Total ==> -80,018-64,4213464,0612787,30222,174
9,707Return 2,767
Internal Loads
2,3432,343Exhaust
25,782Lights 0.00001425,7821032,2276,445
600 600Rm Exh
89,251People 0.0002445,90128
00Auxiliary
23,872Misc 0.00001323,872723,8720
138,905Sub Total ==> 0.00005195,55445145,3506,445
28,620Ceiling Load 0.000-15,5971528,62000-28,6200Ventilation Load 58.42-112,4290002269,8500
Sup. Fan Heat 00
ENGINEERING CKS
HeatingCooling
Ret. Fan Heat 000 % OA 85.725.7
Duct Heat Pkup 721,8540 0.341.13cfm/ft²
0Ov/Undr Sizing0.0000
0000
366.76cfm/ton
Exhaust Heat0.000
00
323.46ft²/ton-22.0137.10Btu/hr·ft²
182No. People232,653Grand Total ==> 100.00-192,447-80,018100.00188,235100.00324,3560
AREAS HEATING COIL SELECTIONCOOLING COIL SELECTIONTotal Capacity Sens Cap. Coil Airflow Enter DB/WB/HR Leave DB/WB/HR Gross Total Glass Coil Airflow Ent LvgCapacity
ton MBh MBh cfm °F °F gr/lb °F °F gr/lb ft² (%) °F°FcfmMBh
Floor 8,743 Main Htg -192.5 2,974 33.7 92.427.0 324.4 273.0 9,913 79.8 63.9 64.5 54.8 52.8 57.0Main ClgPart 0 Aux Htg 0.0 0.00.000.0 0.0 0.0 0 0.0 0.0 0.0 0.0 0.0 0.0Aux Clg
ExFlr 7,3760.0Preheat 0.0 0.000.0 0.0 0.0 0 0.0 0.0 0.0 0.0 0.0 0.0Opt Vent
Roof 11,189 0 0Wall 4,922 1,017 21
Humidif 0.0 0 0.0 0.027.0 324.4Total
Opt Vent 0.0 0.00.00
-192.5Total
Envelope LoadsSkylite SolarSkylite CondRoof CondGlass SolarGlass/Door CondWall CondPartition/DoorFloor
InfiltrationSub Total ==>
LightsPeopleMisc
Sub Total ==>
Ceiling LoadVentilation Load
Additional Reheat
OA Preheat Diff.
Ov/Undr SizingExhaust Heat
RA Preheat Diff.
Grand Total ==>
Internal Loads
0
00
0.000.000.00
0
Supply Air Leakage
96
Dehumid. Ov Sizing 0 0
Adj Air Trans Heat 0 0 0 0 0 Adj Air Trans Heat 0 0 0Leakage Ups
Leakage Dwn
393393Infil
AHU VentNom Vent
Main FanTerminal
Adjacent Floor
Diffuser
Supply Air LeakageUnderflr Sup Ht Pkup Underflr Sup Ht Pkup
Adjacent Floor0 0 0 0
0 00 0 0
017,984
0 0 0 0
0 0.000 0.00
9,913
9,9139,913
0
2,5502,550
0
0
2,974
2,9742,974
0
2,550
2,550
0
0
0 89,251 0
Int Door 0
Ext Door 0 0 0
TRACE® 700 v6.3 calculated at 09:04 AM on 06/20/2014Project Name: 7091 Building 70
Dataset Name: Alternative - 1 System Checksums Report Page 2 of 470.TRC
Page 39
System ChecksumsBy P2S Engineering, Inc
Single Zone Variable Air VolumeBldg 72
HEATING COIL PEAKCLG SPACE PEAKCOOLING COIL PEAK TEMPERATURES
Heating DesignMo/Hr:9 / 15Mo/Hr:9 / 16Mo/Hr:Peaked at Time: Cooling HeatingSADBOADB: 28OADB:96 / 70 / 67OADB/WB/HR:Outside Air: 53.6 94.6Ra Plenum 77.4 63.9
ReturnPercentCoil PeakSpace PeakSpace PercentPercentNetPlenumSpace 77.4 63.9Ret/OASens. + Lat. Of TotalTot SensSpace SensOf TotalSensibleOf TotalTotalSens. + Lat 28.083.6
0.00.0Fn MtrTDBtu/h (%)Btu/hBtu/h(%)Btu/h(%)Btu/hBtu/h0.00.0Fn BldTDEnvelope Loads0.00.0Fn Frict0Skylite Solar 0.000000000
0Skylite Cond 0.0000000000Roof Cond 7.90-16,445000930,05030,050
0.0031,230Glass Solar 001734,274931,23007,302Glass/Door Cond -13,431 6.45-13,43147,18427,3020
AIRFLOWS
HeatingCooling4,618Wall Cond 6.86-14,277-8,73324,40827,3582,740
0Partition/Door 0.0000000022,262Floor 16.72-34,793-34,79311622,262
Sec Fan6.378,214Infiltration -13,264-13,26447,62328,214
2,834 2,834MinStop/Rh
44.3173,626Sub Total ==> -92,210-70,2203975,75231106,41632,790
7,942Return 2,022
Internal Loads
2,0222,022Exhaust
29,297Lights 0.00001529,2971136,6217,324
1,113 1,113Rm Exh
107,910People 0.0002855,15431
00Auxiliary
26,354Misc 0.00001326,354826,3540
163,561Sub Total ==> 0.000056110,80549170,8857,324
10,780Ceiling Load 0.000-12,925510,05900-10,7800Ventilation Load 60.04-124,9490002277,3760
Sup. Fan Heat 00
ENGINEERING CKS
HeatingCooling
Ret. Fan Heat 000 % OA 100.032.4
Duct Heat Pkup 000 0.280.87cfm/ft²
0Ov/Undr Sizing0.0000
0000
302.65cfm/ton
Exhaust Heat-4.369,065
-2-7,560
346.67ft²/ton-20.7534.61Btu/hr·ft²
218No. People247,966Grand Total ==> 100.00-208,094-83,145100.00196,615100.00347,11721,775
AREAS HEATING COIL SELECTIONCOOLING COIL SELECTIONTotal Capacity Sens Cap. Coil Airflow Enter DB/WB/HR Leave DB/WB/HR Gross Total Glass Coil Airflow Ent LvgCapacity
ton MBh MBh cfm °F °F gr/lb °F °F gr/lb ft² (%) °F°FcfmMBh
Floor 10,028 Main Htg -208.1 2,834 28.0 94.628.9 347.1 286.1 8,657 83.6 65.2 64.8 53.6 51.7 54.7Main ClgPart 0 Aux Htg 0.0 0.00.000.0 0.0 0.0 0 0.0 0.0 0.0 0.0 0.0 0.0Aux Clg
ExFlr 9,1310.0Preheat 0.0 0.000.0 0.0 0.0 0 0.0 0.0 0.0 0.0 0.0 0.0Opt Vent
Roof 14,091 0 0Wall 6,303 1,229 20
Humidif 0.0 0 0.0 0.028.9 347.1Total
Opt Vent 0.0 0.00.00
-208.1Total
Envelope LoadsSkylite SolarSkylite CondRoof CondGlass SolarGlass/Door CondWall CondPartition/DoorFloor
InfiltrationSub Total ==>
LightsPeopleMisc
Sub Total ==>
Ceiling LoadVentilation Load
Additional Reheat
OA Preheat Diff.
Ov/Undr SizingExhaust Heat
RA Preheat Diff.
Grand Total ==>
Internal Loads
0
00
0.000.000.00
-7,560
Supply Air Leakage
97
Dehumid. Ov Sizing 0 0
Adj Air Trans Heat 0 0 0 0 0 Adj Air Trans Heat 0 0 0Leakage Ups
Leakage Dwn
301301Infil
AHU VentNom Vent
Main FanTerminal
Adjacent Floor
Diffuser
Supply Air LeakageUnderflr Sup Ht Pkup Underflr Sup Ht Pkup
Adjacent Floor0 0 0 0
0 00 0 0
022,262
0 0 0 0
0 0.000 0.00
8,755
8,7558,755
0
2,8342,834
0
0
2,834
2,8342,834
0
2,834
2,834
0
0
0 107,910 0
Int Door 0
Ext Door 0 0 0
TRACE® 700 v6.3 calculated at 09:04 AM on 06/20/2014Project Name: 7091 Building 70
Dataset Name: Alternative - 1 System Checksums Report Page 3 of 470.TRC
Page 40
System ChecksumsBy P2S Engineering, Inc
Single Zone Variable Air VolumeBldg 73
HEATING COIL PEAKCLG SPACE PEAKCOOLING COIL PEAK TEMPERATURES
Heating DesignMo/Hr:8 / 16Mo/Hr:9 / 16Mo/Hr:Peaked at Time: Cooling HeatingSADBOADB: 28OADB:96 / 70 / 67OADB/WB/HR:Outside Air: 54.5 96.6Ra Plenum 84.9 61.5
ReturnPercentCoil PeakSpace PeakSpace PercentPercentNetPlenumSpace 74.0 68.0Ret/OASens. + Lat. Of TotalTot SensSpace SensOf TotalSensibleOf TotalTotalSens. + Lat 35.979.4
0.00.0Fn MtrTDBtu/h (%)Btu/hBtu/h(%)Btu/h(%)Btu/hBtu/h0.00.0Fn BldTDEnvelope Loads0.00.0Fn Frict0Skylite Solar 0.000000000
0Skylite Cond 0.0000000000Roof Cond 7.78-15,591000827,02527,025
0.0020,573Glass Solar 00818,287620,57306,371Glass/Door Cond -11,719 5.85-11,71936,11026,3710
AIRFLOWS
HeatingCooling5,903Wall Cond 8.69-17,415-11,34935,99927,6921,789
0Partition/Door 0.0000000022,926Floor 17.87-35,829-35,82911722,926
Sec Fan6.908,587Infiltration -13,834-13,83437,42938,587
3,000 3,000MinStop/Rh
47.0964,360Sub Total ==> -94,388-72,7322961,6072893,17328,814
9,731Return 2,732
Internal Loads
2,1372,137Exhaust
29,700Lights 0.00001429,7001137,1247,425
582 582Rm Exh
101,034People 0.0002452,71331
00Auxiliary
31,770Misc 0.00001531,7701031,7700
162,503Sub Total ==> 0.000053114,18352169,9287,425
36,239Ceiling Load 0.000-21,6561839,37500-36,2390Ventilation Load 52.91-106,0600002065,8330
Sup. Fan Heat 00
ENGINEERING CKS
HeatingCooling
Ret. Fan Heat 000 % OA 80.224.1
Duct Heat Pkup 000 0.290.96cfm/ft²
0Ov/Undr Sizing0.0000
0000
364.79cfm/ton
Exhaust Heat0.000
00
381.56ft²/ton-19.1731.45Btu/hr·ft²
209No. People263,102Grand Total ==> 100.00-200,448-94,388100.00215,165100.00328,9350
AREAS HEATING COIL SELECTIONCOOLING COIL SELECTIONTotal Capacity Sens Cap. Coil Airflow Enter DB/WB/HR Leave DB/WB/HR Gross Total Glass Coil Airflow Ent LvgCapacity
ton MBh MBh cfm °F °F gr/lb °F °F gr/lb ft² (%) °F°FcfmMBh
Floor 10,459 Main Htg -200.5 3,000 35.9 96.627.4 328.9 273.3 9,942 79.4 63.7 64.4 54.5 52.5 56.4Main ClgPart 0 Aux Htg 0.0 0.00.000.0 0.0 0.0 0 0.0 0.0 0.0 0.0 0.0 0.0Aux Clg
ExFlr 9,4030.0Preheat 0.0 0.000.0 0.0 0.0 0 0.0 0.0 0.0 0.0 0.0 0.0Opt Vent
Roof 14,344 0 0Wall 7,404 1,073 14
Humidif 0.0 0 0.0 0.027.4 328.9Total
Opt Vent 0.0 0.00.00
-200.5Total
Envelope LoadsSkylite SolarSkylite CondRoof CondGlass SolarGlass/Door CondWall CondPartition/DoorFloor
InfiltrationSub Total ==>
LightsPeopleMisc
Sub Total ==>
Ceiling LoadVentilation Load
Additional Reheat
OA Preheat Diff.
Ov/Undr SizingExhaust Heat
RA Preheat Diff.
Grand Total ==>
Internal Loads
0
00
0.000.000.00
0
Supply Air Leakage
95
Dehumid. Ov Sizing 0 0
Adj Air Trans Heat 0 0 0 0 0 Adj Air Trans Heat 0 0 0Leakage Ups
Leakage Dwn
314314Infil
AHU VentNom Vent
Main FanTerminal
Adjacent Floor
Diffuser
Supply Air LeakageUnderflr Sup Ht Pkup Underflr Sup Ht Pkup
Adjacent Floor0 0 0 0
0 00 0 0
023,782
0 0 0 0
0 0.000 0.00
9,999
9,9999,999
0
2,4062,406
0
0
3,000
3,0003,000
0
2,406
2,406
0
0
0 101,034 0
Int Door 0
Ext Door 0 0 0
TRACE® 700 v6.3 calculated at 09:04 AM on 06/20/2014Project Name: 7091 Building 70
Dataset Name: Alternative - 1 System Checksums Report Page 4 of 470.TRC
Page 41
System ChecksumsBy P2S Engineering, Inc
Bypass VAV with Reheat (30% Min Flow Default)66
HEATING COIL PEAKCLG SPACE PEAKCOOLING COIL PEAK TEMPERATURES
Heating DesignMo/Hr:9 / 17Mo/Hr:9 / 16Mo/Hr:Peaked at Time: Cooling HeatingSADBOADB: 28OADB:96 / 70 / 67OADB/WB/HR:Outside Air: 55.0 85.0Ra Plenum 75.7 60.4
ReturnPercentCoil PeakSpace PeakSpace PercentPercentNetPlenumSpace 75.7 60.4Ret/OASens. + Lat. Of TotalTot SensSpace SensOf TotalSensibleOf TotalTotalSens. + Lat 49.482.8
0.00.0Fn MtrTDBtu/h (%)Btu/hBtu/h(%)Btu/h(%)Btu/hBtu/h0.00.0Fn BldTDEnvelope Loads0.00.0Fn Frict0Skylite Solar 0.000000000
0Skylite Cond 0.0000000000Roof Cond 4.49-29,086000338,88238,882
0.000Glass Solar 00000000Glass/Door Cond 0 0.00000000
AIRFLOWS
HeatingCooling104,141Wall Cond 18.30-118,649-98,68813110,2429129,11324,972
0Partition/Door 0.0000000054,782Floor 13.21-85,616-85,6167454,782
Sec Fan11.9545,034Infiltration -77,440-77,440539,896345,034
12,045 12,045MinStop/Rh
47.94203,958Sub Total ==> -310,792-261,74424205,89118267,81163,854
39,423Return 41,039
Internal Loads
14,55212,935Exhaust
140,343Lights 0.000017140,34312175,42835,086
2,482 2,482Rm Exh
555,889People 0.00038322,88138
00Auxiliary
145,868Misc 0.000017145,86810145,8680
842,100Sub Total ==> 0.000072609,09260877,18535,086
23,996Ceiling Load 0.000-106,265325,82200-23,9960Ventilation Load 92.91-602,29600024350,2580
Sup. Fan Heat 00
ENGINEERING CKS
HeatingCooling
Ret. Fan Heat 000 % OA 34.034.0
Duct Heat Pkup 000 0.910.91cfm/ft²
0Ov/Undr Sizing-21.95142,320142,320
0000
327.59cfm/ton
Exhaust Heat-18.90122,500
-2-24,590
358.30ft²/ton-14.7633.49Btu/hr·ft²
1,308No. People1,070,054Grand Total ==> 100.00-648,267-225,690100.00840,804100.001,470,66550,353
AREAS HEATING COIL SELECTIONCOOLING COIL SELECTIONTotal Capacity Sens Cap. Coil Airflow Enter DB/WB/HR Leave DB/WB/HR Gross Total Glass Coil Airflow Ent LvgCapacity
ton MBh MBh cfm °F °F gr/lb °F °F gr/lb ft² (%) °F°FcfmMBh
Floor 43,911 Main Htg -398.3 12,045 55.0 85.0122.6 1,470.7 1,222.9 40,148 82.8 65.3 66.5 55.0 53.1 57.8Main ClgPart 0 Aux Htg 0.0 0.00.000.0 0.0 0.0 0 0.0 0.0 0.0 0.0 0.0 0.0Aux Clg
ExFlr 22,469-250.0Preheat 49.4 55.040,1480.0 0.0 0.0 0 0.0 0.0 0.0 0.0 0.0 0.0Opt Vent
Roof 22,469 0 0Reheat -172.6 68.055.012,045
Wall 15,420 0 0Humidif 0.0 0 0.0 0.0122.6 1,470.7Total
Opt Vent 0.0 0.00.00
-648.3Total
Envelope LoadsSkylite SolarSkylite CondRoof CondGlass SolarGlass/Door CondWall CondPartition/DoorFloor
InfiltrationSub Total ==>
LightsPeopleMisc
Sub Total ==>
Ceiling LoadVentilation Load
Additional Reheat
OA Preheat Diff.
Ov/Undr SizingExhaust Heat
RA Preheat Diff.
Grand Total ==>
Internal Loads
0
00
0.000.000.00
-24,590
Supply Air Leakage
95
Dehumid. Ov Sizing 0 0
Adj Air Trans Heat 0 0 0 0 0 Adj Air Trans Heat 0 0 0Leakage Ups
Leakage Dwn
1,7561,756Infil
AHU VentNom Vent
Main FanTerminal
Adjacent Floor
Diffuser
Supply Air LeakageUnderflr Sup Ht Pkup Underflr Sup Ht Pkup
Adjacent Floor0 0 0 0
0 00 0 0
055,753
0 0 0 0
0 0.000 0.00
40,148
40,14840,148
0
13,66113,661
0
0
12,045
12,04540,148
0
13,661
13,661
0
0
0 555,889 0
Int Door 0
Ext Door 0 0 0
TRACE® 700 v6.3 calculated at 04:46 PM on 05/27/2014Project Name:
Dataset Name: Alternative - 1 System Checksums Report Page 1 of 3Bldgs 66 67a 67b.trc
Page 42
System ChecksumsBy P2S Engineering, Inc
Bypass VAV with Reheat (30% Min Flow Default)67a
HEATING COIL PEAKCLG SPACE PEAKCOOLING COIL PEAK TEMPERATURES
Heating DesignMo/Hr:8 / 18Mo/Hr:9 / 16Mo/Hr:Peaked at Time: Cooling HeatingSADBOADB: 28OADB:96 / 70 / 67OADB/WB/HR:Outside Air: 55.0 85.0Ra Plenum 76.1 59.1
ReturnPercentCoil PeakSpace PeakSpace PercentPercentNetPlenumSpace 76.1 59.1Ret/OASens. + Lat. Of TotalTot SensSpace SensOf TotalSensibleOf TotalTotalSens. + Lat 49.582.3
0.00.0Fn MtrTDBtu/h (%)Btu/hBtu/h(%)Btu/h(%)Btu/hBtu/h0.00.0Fn BldTDEnvelope Loads0.00.0Fn Frict0Skylite Solar 0.000000000
0Skylite Cond 0.0000000000Roof Cond 4.24-20,280000327,33727,337
0.000Glass Solar 00000000Glass/Door Cond 0 0.00000000
AIRFLOWS
HeatingCooling101,619Wall Cond 24.91-119,039-99,68618110,35212125,74824,129
0Partition/Door 0.0000000039,795Floor 13.02-62,194-62,1947439,795
Sec Fan11.7232,628Infiltration -56,025-56,025425,463332,628
8,952 8,952MinStop/Rh
53.90174,042Sub Total ==> -257,538-217,90528177,09821225,50851,466
25,012Return 25,272
Internal Loads
4,6454,384Exhaust
102,352Lights 0.000016102,35212127,94125,588
6,099 6,099Rm Exh
391,519People 0.00034214,64936
00Auxiliary
107,340Misc 0.000017107,34010107,3400
601,212Sub Total ==> 0.000068424,34158626,80025,588
20,609Ceiling Load 0.000-89,967423,48100-20,6090Ventilation Load 85.01-406,18200022236,5510
Sup. Fan Heat 00
ENGINEERING CKS
HeatingCooling
Ret. Fan Heat 000 % OA 30.930.9
Duct Heat Pkup 000 0.940.94cfm/ft²
0Ov/Undr Sizing-29.33140,130140,130
0000
331.87cfm/ton
Exhaust Heat-9.5845,762
-1-9,895
353.32ft²/ton-15.0433.96Btu/hr·ft²
859No. People795,863Grand Total ==> 100.00-477,828-167,742100.00624,920100.001,078,96546,551
AREAS HEATING COIL SELECTIONCOOLING COIL SELECTIONTotal Capacity Sens Cap. Coil Airflow Enter DB/WB/HR Leave DB/WB/HR Gross Total Glass Coil Airflow Ent LvgCapacity
ton MBh MBh cfm °F °F gr/lb °F °F gr/lb ft² (%) °F°FcfmMBh
Floor 31,768 Main Htg -296.0 8,952 55.0 85.089.9 1,079.0 891.6 29,840 82.3 65.1 66.4 55.0 53.1 57.7Main ClgPart 0 Aux Htg 0.0 0.00.000.0 0.0 0.0 0 0.0 0.0 0.0 0.0 0.0 0.0Aux Clg
ExFlr 16,322-181.8Preheat 49.5 55.029,8400.0 0.0 0.0 0 0.0 0.0 0.0 0.0 0.0 0.0Opt Vent
Roof 16,322 0 0Reheat -128.3 68.055.08,952
Wall 15,576 0 0Humidif 0.0 0 0.0 0.089.9 1,079.0Total
Opt Vent 0.0 0.00.00
-477.8Total
Envelope LoadsSkylite SolarSkylite CondRoof CondGlass SolarGlass/Door CondWall CondPartition/DoorFloor
InfiltrationSub Total ==>
LightsPeopleMisc
Sub Total ==>
Ceiling LoadVentilation Load
Additional Reheat
OA Preheat Diff.
Ov/Undr SizingExhaust Heat
RA Preheat Diff.
Grand Total ==>
Internal Loads
0
00
0.000.000.00
-9,895
Supply Air Leakage
92
Dehumid. Ov Sizing 0 0
Adj Air Trans Heat 0 0 0 0 0 Adj Air Trans Heat 0 0 0Leakage Ups
Leakage Dwn
1,2711,271Infil
AHU VentNom Vent
Main FanTerminal
Adjacent Floor
Diffuser
Supply Air LeakageUnderflr Sup Ht Pkup Underflr Sup Ht Pkup
Adjacent Floor0 0 0 0
0 00 0 0
041,282
0 0 0 0
0 0.000 0.00
29,840
29,84029,840
0
9,2139,213
0
0
8,952
8,95229,840
0
9,213
9,213
0
0
0 391,519 0
Int Door 0
Ext Door 0 0 0
TRACE® 700 v6.3 calculated at 04:46 PM on 05/27/2014Project Name:
Dataset Name: Alternative - 1 System Checksums Report Page 2 of 3Bldgs 66 67a 67b.trc
Page 43
System ChecksumsBy P2S Engineering, Inc
Bypass VAV with Reheat (30% Min Flow Default)67b
HEATING COIL PEAKCLG SPACE PEAKCOOLING COIL PEAK TEMPERATURES
Heating DesignMo/Hr:9 / 17Mo/Hr:9 / 16Mo/Hr:Peaked at Time: Cooling HeatingSADBOADB: 28OADB:96 / 70 / 67OADB/WB/HR:Outside Air: 55.0 85.0Ra Plenum 76.5 57.9
ReturnPercentCoil PeakSpace PeakSpace PercentPercentNetPlenumSpace 76.5 57.9Ret/OASens. + Lat. Of TotalTot SensSpace SensOf TotalSensibleOf TotalTotalSens. + Lat 48.982.5
0.00.0Fn MtrTDBtu/h (%)Btu/hBtu/h(%)Btu/h(%)Btu/hBtu/h0.00.0Fn BldTDEnvelope Loads0.00.0Fn Frict0Skylite Solar 0.000000000
0Skylite Cond 0.0000000000Roof Cond 4.33-7,890000310,93010,930
0.000Glass Solar 00000000Glass/Door Cond 0 0.00000000
AIRFLOWS
HeatingCooling46,325Wall Cond 29.55-53,784-45,3122148,2901457,20410,879
0Partition/Door 0.0000000016,077Floor 13.80-25,126-25,1267416,077
Sec Fan10.6511,250Infiltration -19,390-19,390410,175311,250
3,276 3,276MinStop/Rh
58.3473,652Sub Total ==> -106,190-89,8283374,5422495,46121,809
8,141Return 8,164
Internal Loads
542519Exhaust
36,325Lights 0.00001636,3251145,4069,081
3,219 3,219Rm Exh
138,478People 0.0003374,58835
00Auxiliary
34,149Misc 0.00001534,149934,1490
208,951Sub Total ==> 0.000063145,06155218,0339,081
8,639Ceiling Load 0.000-35,13949,09900-8,6390Ventilation Load 79.90-145,4280002184,3780
Sup. Fan Heat 00
ENGINEERING CKS
HeatingCooling
Ret. Fan Heat 000 % OA 30.230.2
Duct Heat Pkup 000 0.990.99cfm/ft²
0Ov/Undr Sizing-34.9363,57963,579
0000
330.55cfm/ton
Exhaust Heat-3.316,022
0-1,419
332.80ft²/ton-16.5536.06Btu/hr·ft²
297No. People291,242Grand Total ==> 100.00-182,018-61,388100.00228,702100.00396,45320,832
AREAS HEATING COIL SELECTIONCOOLING COIL SELECTIONTotal Capacity Sens Cap. Coil Airflow Enter DB/WB/HR Leave DB/WB/HR Gross Total Glass Coil Airflow Ent LvgCapacity
ton MBh MBh cfm °F °F gr/lb °F °F gr/lb ft² (%) °F°FcfmMBh
Floor 10,995 Main Htg -108.3 3,276 55.0 85.033.0 396.5 329.2 10,921 82.5 65.2 66.5 55.0 53.1 57.8Main ClgPart 0 Aux Htg 0.0 0.00.000.0 0.0 0.0 0 0.0 0.0 0.0 0.0 0.0 0.0Aux Clg
ExFlr 6,594-73.7Preheat 48.9 55.010,9210.0 0.0 0.0 0 0.0 0.0 0.0 0.0 0.0 0.0Opt Vent
Roof 6,594 0 0Reheat -46.9 68.055.03,276
Wall 7,080 0 0Humidif 0.0 0 0.0 0.033.0 396.5Total
Opt Vent 0.0 0.00.00
-182.0Total
Envelope LoadsSkylite SolarSkylite CondRoof CondGlass SolarGlass/Door CondWall CondPartition/DoorFloor
InfiltrationSub Total ==>
LightsPeopleMisc
Sub Total ==>
Ceiling LoadVentilation Load
Additional Reheat
OA Preheat Diff.
Ov/Undr SizingExhaust Heat
RA Preheat Diff.
Grand Total ==>
Internal Loads
0
00
0.000.000.00
-1,419
Supply Air Leakage
95
Dehumid. Ov Sizing 0 0
Adj Air Trans Heat 0 0 0 0 0 Adj Air Trans Heat 0 0 0Leakage Ups
Leakage Dwn
440440Infil
AHU VentNom Vent
Main FanTerminal
Adjacent Floor
Diffuser
Supply Air LeakageUnderflr Sup Ht Pkup Underflr Sup Ht Pkup
Adjacent Floor0 0 0 0
0 00 0 0
016,077
0 0 0 0
0 0.000 0.00
10,921
10,92110,921
0
3,2993,299
0
0
3,276
3,27610,921
0
3,299
3,299
0
0
0 138,478 0
Int Door 0
Ext Door 0 0 0
TRACE® 700 v6.3 calculated at 04:46 PM on 05/27/2014Project Name:
Dataset Name: Alternative - 1 System Checksums Report Page 3 of 3Bldgs 66 67a 67b.trc
Page 44
System ChecksumsBy P2S Engineering, Inc
Variable Volume Reheat (30% Min Flow Default)System - 001
HEATING COIL PEAKCLG SPACE PEAKCOOLING COIL PEAK TEMPERATURES
Heating DesignMo/Hr:9 / 15Mo/Hr:9 / 16Mo/Hr:Peaked at Time: Cooling HeatingSADBOADB: 28OADB:96 / 70 / 67OADB/WB/HR:Outside Air: 57.0 85.0Ra Plenum 74.7 65.0
ReturnPercentCoil PeakSpace PeakSpace PercentPercentNetPlenumSpace 74.7 65.0Ret/OASens. + Lat. Of TotalTot SensSpace SensOf TotalSensibleOf TotalTotalSens. + Lat 31.280.7
0.00.0Fn MtrTDBtu/h (%)Btu/hBtu/h(%)Btu/h(%)Btu/hBtu/h0.00.0Fn BldTDEnvelope Loads0.00.0Fn Frict0Skylite Solar 0.000000000
0Skylite Cond 0.0000000000Roof Cond 2.80-38,216000371,76271,762
0.0094,387Glass Solar 00793,485494,387018,865Glass/Door Cond -34,180 2.51-34,180119,065118,8650
AIRFLOWS
HeatingCooling201,835Wall Cond 17.38-237,163-166,89115208,69212292,27490,439
0Partition/Door 0.0000000045,136Floor 5.17-70,541-70,5413245,136
Sec Fan10.4587,307Infiltration -142,598-142,598681,958387,307
22,632 22,632MinStop/Rh
38.31447,529Sub Total ==> -522,697-414,20932448,33524609,730162,201
67,304Return 14,496
Internal Loads
12,56412,564Exhaust
211,942Lights 0.000015211,94210264,92852,986
11,370 11,370Rm Exh
884,738People 0.00036515,40135
00Auxiliary
220,773Misc 0.000016220,7739220,7730
1,317,453Sub Total ==> 0.000067948,117541,370,43952,986
14,831Ceiling Load 0.000-60,963117,13700-14,8310Ventilation Load 66.89-912,62600022558,7670
Sup. Fan Heat 00
ENGINEERING CKS
HeatingCooling
Ret. Fan Heat 000 % OA 91.527.4
Duct Heat Pkup 00-165,058 0.351.17cfm/ft²
0Ov/Undr Sizing-3.7451,09551,095
0000
357.97cfm/ton
Exhaust Heat-3.0241,189
0-10,021
306.94ft²/ton-21.0939.10Btu/hr·ft²
2,087No. People1,779,814Grand Total ==> 100.00-1,364,393-424,077100.001,413,589100.002,528,91625,277
AREAS HEATING COIL SELECTIONCOOLING COIL SELECTIONTotal Capacity Sens Cap. Coil Airflow Enter DB/WB/HR Leave DB/WB/HR Gross Total Glass Coil Airflow Ent LvgCapacity
ton MBh MBh cfm °F °F gr/lb °F °F gr/lb ft² (%) °F°FcfmMBh
Floor 64,686 Main Htg -748.4 22,632 55.0 85.0210.7 2,528.9 2,104.2 74,874 80.7 64.3 64.9 55.0 52.9 57.1Main ClgPart 0 Aux Htg 0.0 0.00.000.0 0.0 0.0 0 0.0 0.0 0.0 0.0 0.0 0.0Aux Clg
ExFlr 23,458-616.0Preheat 28.0 55.020,7000.0 0.0 0.0 0 0.0 0.0 0.0 0.0 0.0 0.0Opt Vent
Roof 23,458 0 0Reheat -324.3 68.055.022,632
Wall 36,904 3,181 9Humidif 0.0 0 0.0 0.0210.7 2,528.9Total
Opt Vent 0.0 0.00.00
-1,364.4Total
Envelope LoadsSkylite SolarSkylite CondRoof CondGlass SolarGlass/Door CondWall CondPartition/DoorFloor
InfiltrationSub Total ==>
LightsPeopleMisc
Sub Total ==>
Ceiling LoadVentilation Load
Additional Reheat
OA Preheat Diff.
Ov/Undr SizingExhaust Heat
RA Preheat Diff.
Grand Total ==>
Internal Loads
0
0-21,355
0.001.570.00
-10,021
Supply Air Leakage
97
Dehumid. Ov Sizing 0 0
Adj Air Trans Heat 0 0 0 0 0 Adj Air Trans Heat 0 0 0Leakage Ups
Leakage Dwn
3,2343,234Infil
AHU VentNom Vent
Main FanTerminal
Adjacent Floor
Diffuser
Supply Air LeakageUnderflr Sup Ht Pkup Underflr Sup Ht Pkup
Adjacent Floor0 0 0 0
0 00 0 0
045,136
0 0 0 0
0 0.000 0.00
75,440
75,44075,440
0
20,70020,700
0
0
22,632
22,63222,632
0
20,700
20,700
0
0
0 884,738 0
Int Door 0
Ext Door 0 0 0
TRACE® 700 v6.3 calculated at 07:45 AM on 06/03/2014Project Name:
Dataset Name: Alternative - 1 System Checksums Report Page 1 of 1BLDG 61.TRC
Page 45
System ChecksumsBy P2S Engineering, Inc
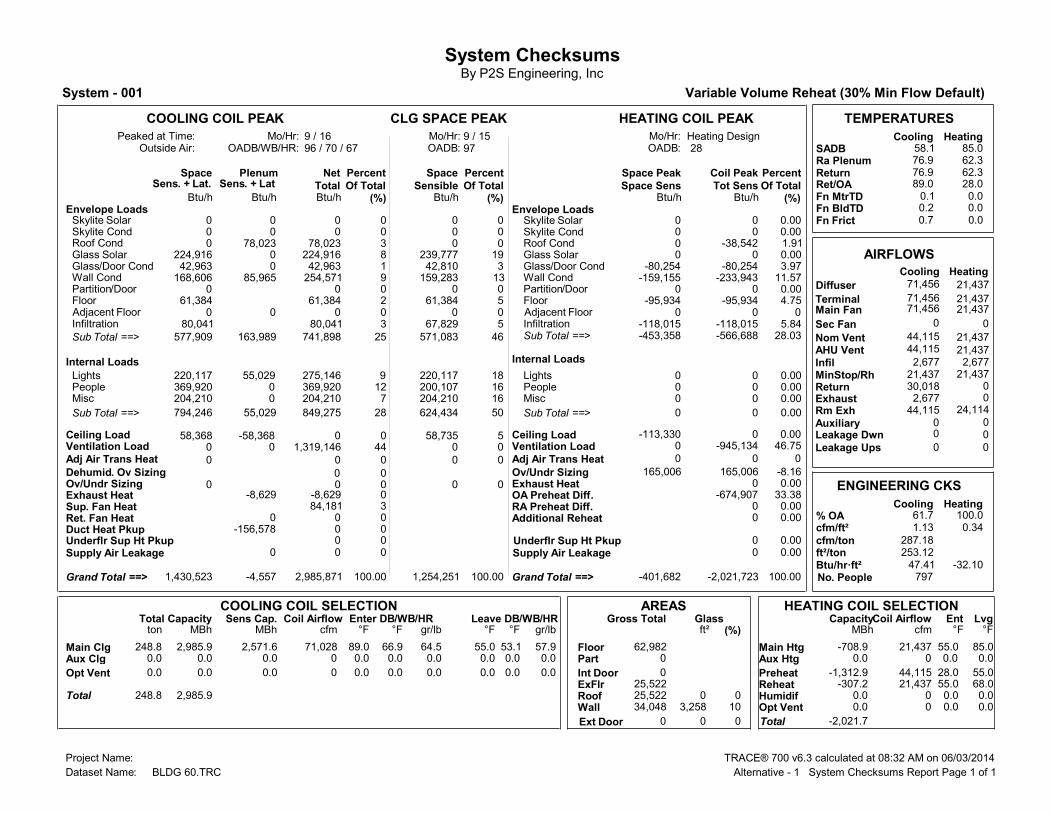
Variable Volume Reheat (30% Min Flow Default)System - 001
HEATING COIL PEAKCLG SPACE PEAKCOOLING COIL PEAK TEMPERATURES
Heating DesignMo/Hr:9 / 15Mo/Hr:9 / 16Mo/Hr:Peaked at Time: Cooling HeatingSADBOADB: 28OADB:96 / 70 / 67OADB/WB/HR:Outside Air: 58.1 85.0Ra Plenum 76.9 62.3
ReturnPercentCoil PeakSpace PeakSpace PercentPercentNetPlenumSpace 76.9 62.3Ret/OASens. + Lat. Of TotalTot SensSpace SensOf TotalSensibleOf TotalTotalSens. + Lat 28.089.0
0.00.1Fn MtrTDBtu/h (%)Btu/hBtu/h(%)Btu/h(%)Btu/hBtu/h0.00.2Fn BldTDEnvelope Loads0.00.7Fn Frict0Skylite Solar 0.000000000
0Skylite Cond 0.0000000000Roof Cond 1.91-38,542000378,02378,023
0.00224,916Glass Solar 0019239,7778224,916042,963Glass/Door Cond -80,254 3.97-80,254342,810142,9630
AIRFLOWS
HeatingCooling168,606Wall Cond 11.57-233,943-159,15513159,2839254,57185,965
0Partition/Door 0.0000000061,384Floor 4.75-95,934-95,9345261,384
Sec Fan5.8480,041Infiltration -118,015-118,015567,829380,041
21,437 21,437MinStop/Rh
28.03577,909Sub Total ==> -566,688-453,35846571,08325741,898163,989
30,018Return 0
Internal Loads
02,677Exhaust
220,117Lights 0.000018220,1179275,14655,029
44,115 24,114Rm Exh
369,920People 0.00016200,10712
00Auxiliary
204,210Misc 0.000016204,2107204,2100
794,246Sub Total ==> 0.000050624,43428849,27555,029
58,368Ceiling Load 0.000-113,330558,73500-58,3680Ventilation Load 46.75-945,134000441,319,1460
Sup. Fan Heat 384,181
ENGINEERING CKS
HeatingCooling
Ret. Fan Heat 000 % OA 100.061.7
Duct Heat Pkup 00-156,578 0.341.13cfm/ft²
0Ov/Undr Sizing-8.16165,006165,006
0000
287.18cfm/ton
Exhaust Heat0.000
0-8,629
253.12ft²/ton-32.1047.41Btu/hr·ft²
797No. People1,430,523Grand Total ==> 100.00-2,021,723-401,682100.001,254,251100.002,985,871-4,557
AREAS HEATING COIL SELECTIONCOOLING COIL SELECTIONTotal Capacity Sens Cap. Coil Airflow Enter DB/WB/HR Leave DB/WB/HR Gross Total Glass Coil Airflow Ent LvgCapacity
ton MBh MBh cfm °F °F gr/lb °F °F gr/lb ft² (%) °F°FcfmMBh
Floor 62,982 Main Htg -708.9 21,437 55.0 85.0248.8 2,985.9 2,571.6 71,028 89.0 66.9 64.5 55.0 53.1 57.9Main ClgPart 0 Aux Htg 0.0 0.00.000.0 0.0 0.0 0 0.0 0.0 0.0 0.0 0.0 0.0Aux Clg
ExFlr 25,522-1,312.9Preheat 28.0 55.044,1150.0 0.0 0.0 0 0.0 0.0 0.0 0.0 0.0 0.0Opt Vent
Roof 25,522 0 0Reheat -307.2 68.055.021,437
Wall 34,048 3,258 10Humidif 0.0 0 0.0 0.0248.8 2,985.9Total
Opt Vent 0.0 0.00.00
-2,021.7Total
Envelope LoadsSkylite SolarSkylite CondRoof CondGlass SolarGlass/Door CondWall CondPartition/DoorFloor
InfiltrationSub Total ==>
LightsPeopleMisc
Sub Total ==>
Ceiling LoadVentilation Load
Additional Reheat
OA Preheat Diff.
Ov/Undr SizingExhaust Heat
RA Preheat Diff.
Grand Total ==>
Internal Loads
0
-674,9070
33.380.000.00
-8,629
Supply Air Leakage
97
Dehumid. Ov Sizing 0 0
Adj Air Trans Heat 0 0 0 0 0 Adj Air Trans Heat 0 0 0Leakage Ups
Leakage Dwn
2,6772,677Infil
AHU VentNom Vent
Main FanTerminal
Adjacent Floor
Diffuser
Supply Air LeakageUnderflr Sup Ht Pkup Underflr Sup Ht Pkup
Adjacent Floor0 0 0 0
0 00 0 0
061,384
0 0 0 0
0 0.000 0.00
71,456
71,45671,456
0
44,11544,115
0
0
21,437
21,43721,437
0
21,437
21,437
0
0
0 369,920 0
Int Door 0
Ext Door 0 0 0
TRACE® 700 v6.3 calculated at 08:32 AM on 06/03/2014Project Name:
Dataset Name: Alternative - 1 System Checksums Report Page 1 of 1BLDG 60.TRC
Page 46
System ChecksumsBy P2S Engineering, Inc
Single Zone Variable Air VolumeSystem - 001
HEATING COIL PEAKCLG SPACE PEAKCOOLING COIL PEAK TEMPERATURES
Heating DesignMo/Hr:9 / 16Mo/Hr:9 / 16Mo/Hr:Peaked at Time: Cooling HeatingSADBOADB: 28OADB:96 / 70 / 67OADB/WB/HR:Outside Air: 58.0 99.1Ra Plenum 124.8 37.7
ReturnPercentCoil PeakSpace PeakSpace PercentPercentNetPlenumSpace 74.0 68.0Ret/OASens. + Lat. Of TotalTot SensSpace SensOf TotalSensibleOf TotalTotalSens. + Lat 61.775.1
0.00.0Fn MtrTDBtu/h (%)Btu/hBtu/h(%)Btu/h(%)Btu/hBtu/h0.00.0Fn BldTDEnvelope Loads0.00.0Fn Frict0Skylite Solar 0.000000000
0Skylite Cond 0.0000000000Roof Cond 5.54-43500081,0641,064
0.001,062Glass Solar 0091,06281,0620174Glass/Door Cond -327 4.17-327217411740
AIRFLOWS
HeatingCooling6,315Wall Cond 63.37-4,969-3,984566,315617,5901,275
0Partition/Door 0.000000000Floor 6.31-495-495000
Sec Fan3.74200Infiltration -294-29411642200
190 190MinStop/Rh
83.137,752Sub Total ==> -6,520-5,100697,7168010,0912,339
642Return 197
Internal Loads
3737Exhaust
175Lights 0.00002175221844
0 0Rm Exh
900People 0.00045007
00Auxiliary
424Misc 0.0000442434240
1,499Sub Total ==> 0.0000101,099121,54344
2,383Ceiling Load 0.000-1,420212,38300-2,3830Ventilation Load 16.87-1,32300079020
Sup. Fan Heat 00
ENGINEERING CKS
HeatingCooling
Ret. Fan Heat 000 % OA 15.74.7
Duct Heat Pkup 000 1.294.29cfm/ft²
0Ov/Undr Sizing0.0000
0000
607.84cfm/ton
Exhaust Heat0.000
00
141.68ft²/ton-52.9984.70Btu/hr·ft²
2No. People11,634Grand Total ==> 100.00-7,842-6,520100.0011,198100.0012,5360
AREAS HEATING COIL SELECTIONCOOLING COIL SELECTIONTotal Capacity Sens Cap. Coil Airflow Enter DB/WB/HR Leave DB/WB/HR Gross Total Glass Coil Airflow Ent LvgCapacity
ton MBh MBh cfm °F °F gr/lb °F °F gr/lb ft² (%) °F°FcfmMBh
Floor 148 Main Htg -7.8 190 61.7 99.11.0 12.5 11.9 635 75.1 61.3 60.0 58.0 54.5 58.6Main ClgPart 0 Aux Htg 0.0 0.00.000.0 0.0 0.0 0 0.0 0.0 0.0 0.0 0.0 0.0Aux Clg
ExFlr 250.0Preheat 0.0 0.000.0 0.0 0.0 0 0.0 0.0 0.0 0.0 0.0 0.0Opt Vent
Roof 148 0 0Wall 435 16 4
Humidif 0.0 0 0.0 0.01.0 12.5Total
Opt Vent 0.0 0.00.00
-7.8Total
Envelope LoadsSkylite SolarSkylite CondRoof CondGlass SolarGlass/Door CondWall CondPartition/DoorFloor
InfiltrationSub Total ==>
LightsPeopleMisc
Sub Total ==>
Ceiling LoadVentilation Load
Additional Reheat
OA Preheat Diff.
Ov/Undr SizingExhaust Heat
RA Preheat Diff.
Grand Total ==>
Internal Loads
0
00
0.000.000.00
0
Supply Air Leakage
96
Dehumid. Ov Sizing 0 0
Adj Air Trans Heat 0 0 0 0 0 Adj Air Trans Heat 0 0 0Leakage Ups
Leakage Dwn
77Infil
AHU VentNom Vent
Main FanTerminal
Adjacent Floor
Diffuser
Supply Air LeakageUnderflr Sup Ht Pkup Underflr Sup Ht Pkup
Adjacent Floor0 0 0 0
0 00 0 0
00
0 0 0 0
0 0.000 0.00
635
635635
0
3030
0
0
190
190190
0
30
30
0
0
0 900 0
Int Door 0
Ext Door 0 0 0
TRACE® 700 v6.3 calculated at 08:31 AM on 06/20/2014Project Name:
Dataset Name: Alternative - 1 System Checksums Report Page 1 of 1BLDG 29.TRC
Page 47
System ChecksumsBy P2S Engineering, Inc.
AC-1 (1st North) Double Duct VAV
HEATING COIL PEAKCLG SPACE PEAKCOOLING COIL PEAK TEMPERATURES13 / 1Mo/Hr:7 / 18Mo/Hr:8 / 17Mo/Hr:Peaked at Time: Cooling Heating
SADBOADB: 3391OADB:92 / 70 / 79OADB/WB/HR:Outside Air: 52.7 100.0Plenum 73.8 67.6ReturnPercentCoil PeakSpace PeakSpace PercentPercentNetPlenumSpace 73.8 67.6Ret/OASens. + Lat. Of TotalTot SensSpace SensOf TotalSensibleOf TotalTotalSens. + Lat 37.283.0
0.00.1Fn MtrTDBtu/h (%)Btu/hBtu/h(%)Btu/h(%)Btu/hBtu/h0.00.2Fn BldTDEnvelope Loads0.00.7Fn Frict0Skylite Solar 0.00000.0000.0000
0Skylite Cond 0.00000.0000.00000Roof Cond 0.00000.0000.0000
0.0018,024Glass Solar 005.9714,5883.3418,02404,197Glass Cond -8,561 1.78-8,5611.694,1200.784,1970 AIRFLOWS
HeatingCooling45,189Wall Cond 19.41-93,092-67,62519.9248,65611.5262,07816,889
6,0736,073Vent1,787Partition 0.42-2,025-2,0250.811,9670.331,787
00Infil0Exposed Floor 0.00000.0000.000
6,90211,758Supply0.000Infiltration -2-20.0000.000
0 0MinStop/Rh21.6169,196Sub Total ==> -103,679-78,21228.3869,33115.9786,08516,889
11,758Return 6,902Internal Loads6,0736,073Exhaust44,261Lights 0.000018.1244,26110.2655,32611,065
0 0Rm Exh178,201People 0.000040.9199,93933.06178,20100Auxiliary24,589Misc 0.000010.0724,5894.5624,5890
247,051Sub Total ==> 0.000069.09168,78947.88258,11611,065
5,909Ceiling Load 0.000-7,9782.536,1740.000-5,9090Ventilation Load 50.30-241,29400.00036.00194,0680
Sup. Fan Heat 2.2612,174
ENGINEERING CKSHeatingCooling
Ret. Fan Heat 0.0000
% OA 88.051.7
Duct Heat Pkup 0.0000
0.651.10cfm/ft²
0Ov/Undr Sizing 28.39-136,167-136,1670.0000.000
261.76cfm/ton
Exhaust Heat -3.2115,388-2.11-11,396
237.55ft²/ton-44.9850.52Btu/hr·ft²
401No. People322,156Grand Total ==> 100.00-479,679-222,357100.00244,293100.00539,04610,649
AREAS HEATING COIL SELECTIONCOOLING COIL SELECTIONTotal Capacity Sens Cap. Coil Airflow Enter DB/WB/HR Leave DB/WB/HR Gross Total Glass Coil Airflow Ent LvgCapacity
ton MBh MBh cfm °F °F gr/lb °F °F gr/lb ft² (%) °F°FcfmMBhFloor 10,671 Main Htg -358.1 6,902 51.7 100.044.9 539.1 394.9 11,739 83.3 66.0 71.5 52.0 50.3 53.5Main ClgPart 1,206 Aux Htg 0.0 0.00.000.0 0.0 0.0 0 0.0 0.0 0.0 0.0 0.0 0.0Aux ClgExFlr 0 -121.9Preheat 33.0 51.76,0730.0 0.0 0.0 0 0.0 0.0 0.0 0.0 0.0 0.0Opt VentRoof 0 0 0 Reheat 0.0 0.00.00Wall 6,497 232 4 Humidif 0.0 0 0.0 0.044.9 539.1Total
Opt Vent 0.0 0.00.00-480.0Total
Envelope LoadsSkylite SolarSkylite CondRoof CondGlass SolarGlass CondWall CondPartitionExposed FloorInfiltrationSub Total ==>
LightsPeopleMiscSub Total ==>
Ceiling LoadVentilation Load
Additional Reheat
OA Preheat Diff.
Ov/Undr SizingExhaust Heat
RA Preheat Diff.
Grand Total ==>
Internal Loads
0
0-13,927
0.002.900.00
-11,396
Reheat at Design 0 0.00
TRACE® 700 v4.1 calculated at 08:26 AM on 01/19/2005Project Name: Mt SAC Bldg 26 RenovationDataset Name: Alternative - 1 System Checksums report Page 1 of 10C:\CDS\TRACE700\PROJECTS\J4101-30_B26.TRC
Page 48
System ChecksumsBy P2S Engineering, Inc.
AC-2 (2nd North) Double Duct VAV
HEATING COIL PEAKCLG SPACE PEAKCOOLING COIL PEAK TEMPERATURES13 / 1Mo/Hr:7 / 18Mo/Hr:8 / 17Mo/Hr:Peaked at Time: Cooling Heating
SADBOADB: 3391OADB:92 / 70 / 79OADB/WB/HR:Outside Air: 52.7 100.0Plenum 73.8 67.4ReturnPercentCoil PeakSpace PeakSpace PercentPercentNetPlenumSpace 73.8 67.4Ret/OASens. + Lat. Of TotalTot SensSpace SensOf TotalSensibleOf TotalTotalSens. + Lat 37.882.8
0.00.1Fn MtrTDBtu/h (%)Btu/hBtu/h(%)Btu/h(%)Btu/hBtu/h0.00.2Fn BldTDEnvelope Loads0.00.7Fn Frict0Skylite Solar 0.00000.0000.0000
0Skylite Cond 0.00000.0000.00000Roof Cond 0.00000.0000.0000
0.0021,712Glass Solar 006.4818,7823.4521,71203,974Glass Cond -8,111 1.45-8,1111.353,9010.633,9740 AIRFLOWS
HeatingCooling57,999Wall Cond 20.89-116,913-84,93021.8463,34712.6779,75321,753
6,9686,968Vent3,241Partition 0.66-3,672-3,6721.233,5680.513,241
00Infil0Exposed Floor 0.00000.0000.000
8,09913,959Supply0.000Infiltration -2-20.0000.000
0 0MinStop/Rh23.0086,927Sub Total ==> -128,698-96,71530.8989,59817.26108,68021,753
13,959Return 8,099Internal Loads6,9686,968Exhaust49,648Lights 0.000017.1249,6489.8662,06112,412
0 0Rm Exh205,938People 0.000039.57114,76132.71205,93800Auxiliary28,667Misc 0.00009.8928,6674.5528,6670
284,254Sub Total ==> 0.000066.58193,07747.12296,66612,412
6,965Ceiling Load 0.000-9,7322.537,3340.000-6,9650Ventilation Load 49.47-276,85900.00035.52223,5910
Sup. Fan Heat 2.2814,324
ENGINEERING CKSHeatingCooling
Ret. Fan Heat 0.0000
% OA 86.049.9
Duct Heat Pkup 0.0000
0.671.16cfm/ft²
0Ov/Undr Sizing 27.60-154,464-154,4640.0000.000
266.06cfm/ton
Exhaust Heat -3.4219,143-2.18-13,699
228.85ft²/ton-46.6452.44Btu/hr·ft²
459No. People378,145Grand Total ==> 100.00-559,630-260,912100.00290,009100.00629,56113,502
AREAS HEATING COIL SELECTIONCOOLING COIL SELECTIONTotal Capacity Sens Cap. Coil Airflow Enter DB/WB/HR Leave DB/WB/HR Gross Total Glass Coil Airflow Ent LvgCapacity
ton MBh MBh cfm °F °F gr/lb °F °F gr/lb ft² (%) °F°FcfmMBhFloor 12,006 Main Htg -420.2 8,099 51.7 100.052.5 629.6 461.9 13,812 83.1 65.8 71.2 52.0 50.2 53.4Main ClgPart 1,932 Aux Htg 0.0 0.00.000.0 0.0 0.0 0 0.0 0.0 0.0 0.0 0.0 0.0Aux ClgExFlr 0 -139.8Preheat 33.0 51.76,9680.0 0.0 0.0 0 0.0 0.0 0.0 0.0 0.0 0.0Opt VentRoof 0 0 0 Reheat 0.0 0.00.00Wall 8,099 218 3 Humidif 0.0 0 0.0 0.052.5 629.6Total
Opt Vent 0.0 0.00.00-560.0Total
Envelope LoadsSkylite SolarSkylite CondRoof CondGlass SolarGlass CondWall CondPartitionExposed FloorInfiltrationSub Total ==>
LightsPeopleMiscSub Total ==>
Ceiling LoadVentilation Load
Additional Reheat
OA Preheat Diff.
Ov/Undr SizingExhaust Heat
RA Preheat Diff.
Grand Total ==>
Internal Loads
0
0-18,752
0.003.350.00
-13,699
Reheat at Design 0 0.00
TRACE® 700 v4.1 calculated at 08:26 AM on 01/19/2005Project Name: Mt SAC Bldg 26 RenovationDataset Name: Alternative - 1 System Checksums report Page 2 of 10C:\CDS\TRACE700\PROJECTS\J4101-30_B26.TRC
Page 49
System ChecksumsBy P2S Engineering, Inc.
AC-3 (3rd North) Double Duct VAV
HEATING COIL PEAKCLG SPACE PEAKCOOLING COIL PEAK TEMPERATURES13 / 1Mo/Hr:7 / 18Mo/Hr:8 / 17Mo/Hr:Peaked at Time: Cooling Heating
SADBOADB: 3391OADB:92 / 70 / 79OADB/WB/HR:Outside Air: 52.7 100.0Plenum 78.7 62.5ReturnPercentCoil PeakSpace PeakSpace PercentPercentNetPlenumSpace 78.7 62.5Ret/OASens. + Lat. Of TotalTot SensSpace SensOf TotalSensibleOf TotalTotalSens. + Lat 35.585.5
0.00.1Fn MtrTDBtu/h (%)Btu/hBtu/h(%)Btu/h(%)Btu/hBtu/h0.00.2Fn BldTDEnvelope Loads0.00.7Fn Frict0Skylite Solar 0.00000.0000.0000
0Skylite Cond 0.00000.0000.00000Roof Cond 11.78-73,98300.00014.10106,987106,987
0.0017,807Glass Solar 004.5414,8692.3517,80703,592Glass Cond -7,340 1.17-7,3401.083,5260.473,5920 AIRFLOWS
HeatingCooling58,668Wall Cond 18.08-113,600-86,00919.6364,27110.0476,13217,464
8,1798,179Vent3,241Partition 0.58-3,672-3,6721.093,5680.433,241
00Infil0Exposed Floor 0.00000.0000.000
8,95215,762Supply0.000Infiltration -2-20.0000.000
0 0MinStop/Rh31.6183,308Sub Total ==> -198,596-97,02226.3386,23427.39207,758124,451
15,762Return 8,952Internal Loads8,1798,179Exhaust52,076Lights 0.000015.9052,0768.5865,09413,019
0 0Rm Exh243,450People 0.000041.30135,25032.09243,45000Auxiliary25,598Misc 0.00007.8225,5983.3725,5980
321,123Sub Total ==> 0.000065.02212,92344.05334,14213,019
25,822Ceiling Load 0.000-29,0678.6528,3140.000-25,8220Ventilation Load 51.73-324,97900.00034.21259,4870
Sup. Fan Heat 2.1216,075
ENGINEERING CKSHeatingCooling
Ret. Fan Heat 0.0000
% OA 91.451.9
Duct Heat Pkup 0.0000
0.741.30cfm/ft²
0Ov/Undr Sizing 25.83-162,285-162,2850.0000.000
249.33cfm/ton
Exhaust Heat -10.5466,251-7.76-58,854
192.38ft²/ton-51.6862.38Btu/hr·ft²
541No. People430,253Grand Total ==> 100.00-628,281-288,375100.00327,472100.00758,60952,794
AREAS HEATING COIL SELECTIONCOOLING COIL SELECTIONTotal Capacity Sens Cap. Coil Airflow Enter DB/WB/HR Leave DB/WB/HR Gross Total Glass Coil Airflow Ent LvgCapacity
ton MBh MBh cfm °F °F gr/lb °F °F gr/lb ft² (%) °F°FcfmMBhFloor 12,162 Main Htg -464.4 8,952 51.7 100.063.2 758.6 563.6 15,501 85.9 66.8 71.8 52.0 50.2 53.3Main ClgPart 1,932 Aux Htg 0.0 0.00.000.0 0.0 0.0 0 0.0 0.0 0.0 0.0 0.0 0.0Aux ClgExFlr 0 -164.1Preheat 33.0 51.78,1790.0 0.0 0.0 0 0.0 0.0 0.0 0.0 0.0 0.0Opt VentRoof 12,162 0 0 Reheat 0.0 0.00.00Wall 8,166 194 2 Humidif 0.0 0 0.0 0.063.2 758.6Total
Opt Vent 0.0 0.00.00-628.5Total
Envelope LoadsSkylite SolarSkylite CondRoof CondGlass SolarGlass CondWall CondPartitionExposed FloorInfiltrationSub Total ==>
LightsPeopleMiscSub Total ==>
Ceiling LoadVentilation Load
Additional Reheat
OA Preheat Diff.
Ov/Undr SizingExhaust Heat
RA Preheat Diff.
Grand Total ==>
Internal Loads
0
0-8,672
0.001.380.00
-58,854
Reheat at Design 0 0.00
TRACE® 700 v4.1 calculated at 08:26 AM on 01/19/2005Project Name: Mt SAC Bldg 26 RenovationDataset Name: Alternative - 1 System Checksums report Page 3 of 10C:\CDS\TRACE700\PROJECTS\J4101-30_B26.TRC
Page 50
System ChecksumsBy P2S Engineering, Inc.
AC-4 (Ground South) Double Duct VAV
HEATING COIL PEAKCLG SPACE PEAKCOOLING COIL PEAK TEMPERATURES13 / 2Mo/Hr:9 / 19Mo/Hr:8 / 15Mo/Hr:Peaked at Time: Cooling Heating
SADBOADB: 3385OADB:94 / 70 / 77OADB/WB/HR:Outside Air: 52.7 87.0Plenum 73.3 69.1ReturnPercentCoil PeakSpace PeakSpace PercentPercentNetPlenumSpace 73.3 69.1Ret/OASens. + Lat. Of TotalTot SensSpace SensOf TotalSensibleOf TotalTotalSens. + Lat 36.286.9
0.00.1Fn MtrTDBtu/h (%)Btu/hBtu/h(%)Btu/h(%)Btu/hBtu/h0.00.2Fn BldTDEnvelope Loads0.00.7Fn Frict0Skylite Solar 0.00000.0000.0000
0Skylite Cond 0.00000.0000.00000Roof Cond 0.00000.0000.0000
0.004,300Glass Solar 000.0000.884,30001,788Glass Cond -3,231 0.83-3,2310.501,0470.361,7880 AIRFLOWS
HeatingCooling17,114Wall Cond 9.26-36,162-26,24214.1829,7254.7723,3736,259
6,3396,339Vent3,423Partition 2.29-8,951-8,9511.994,1760.703,423
00Infil0Exposed Floor 0.00000.0000.000
6,95510,091Supply0.000Infiltration -1-10.0000.000
0 0MinStop/Rh12.3726,625Sub Total ==> -48,345-38,42516.6734,9486.7132,8836,259
10,091Return 6,955Internal Loads6,3396,339Exhaust49,257Lights 0.000023.4949,25712.5761,57212,314
0 0Rm Exh184,050People 0.000048.77102,25037.58184,05000Auxiliary17,065Misc 0.00008.1417,0653.4817,0650
250,372Sub Total ==> 0.000080.41168,57253.63262,68712,314
4,997Ceiling Load 0.000-3,3542.926,1320.000-4,9970Ventilation Load 64.46-251,85400.00039.43193,1440
Sup. Fan Heat 2.049,993
ENGINEERING CKSHeatingCooling
Ret. Fan Heat 0.0000
% OA 91.162.8
Duct Heat Pkup 0.0000
0.580.84cfm/ft²
0Ov/Undr Sizing 21.80-85,182-85,1820.0000.000
247.23cfm/ton
Exhaust Heat -1.535,985-1.82-8,917
294.98ft²/ton-32.4740.68Btu/hr·ft²
409No. People281,994Grand Total ==> 100.00-390,720-126,961100.00209,653100.00489,7904,659
AREAS HEATING COIL SELECTIONCOOLING COIL SELECTIONTotal Capacity Sens Cap. Coil Airflow Enter DB/WB/HR Leave DB/WB/HR Gross Total Glass Coil Airflow Ent LvgCapacity
ton MBh MBh cfm °F °F gr/lb °F °F gr/lb ft² (%) °F°FcfmMBhFloor 12,040 Main Htg -263.7 6,955 51.7 87.040.8 489.8 364.3 9,636 87.2 67.6 73.7 52.0 50.6 54.6Main ClgPart 1,598 Aux Htg 0.0 0.00.000.0 0.0 0.0 0 0.0 0.0 0.0 0.0 0.0 0.0Aux ClgExFlr 0 -127.2Preheat 33.0 51.76,3390.0 0.0 0.0 0 0.0 0.0 0.0 0.0 0.0 0.0Opt VentRoof 0 0 0 Reheat 0.0 0.00.00Wall 2,505 100 4 Humidif 0.0 0 0.0 0.040.8 489.8Total
Opt Vent 0.0 0.00.00-390.9Total
Envelope LoadsSkylite SolarSkylite CondRoof CondGlass SolarGlass CondWall CondPartitionExposed FloorInfiltrationSub Total ==>
LightsPeopleMiscSub Total ==>
Ceiling LoadVentilation Load
Additional Reheat
OA Preheat Diff.
Ov/Undr SizingExhaust Heat
RA Preheat Diff.
Grand Total ==>
Internal Loads
0
0-11,324
0.002.900.00
-8,917
Reheat at Design 0 0.00
TRACE® 700 v4.1 calculated at 08:26 AM on 01/19/2005Project Name: Mt SAC Bldg 26 RenovationDataset Name: Alternative - 1 System Checksums report Page 4 of 10C:\CDS\TRACE700\PROJECTS\J4101-30_B26.TRC
Page 51
System ChecksumsBy P2S Engineering, Inc.
AC-5 (1st South) Double Duct VAV
HEATING COIL PEAKCLG SPACE PEAKCOOLING COIL PEAK TEMPERATURES13 / 1Mo/Hr:7 / 17Mo/Hr:8 / 17Mo/Hr:Peaked at Time: Cooling Heating
SADBOADB: 3394OADB:92 / 70 / 79OADB/WB/HR:Outside Air: 52.7 100.0Plenum 73.9 66.5ReturnPercentCoil PeakSpace PeakSpace PercentPercentNetPlenumSpace 73.9 66.5Ret/OASens. + Lat. Of TotalTot SensSpace SensOf TotalSensibleOf TotalTotalSens. + Lat 49.577.3
0.00.1Fn MtrTDBtu/h (%)Btu/hBtu/h(%)Btu/h(%)Btu/hBtu/h0.00.2Fn BldTDEnvelope Loads0.00.7Fn Frict0Skylite Solar 0.00000.0000.0000
0Skylite Cond 0.00000.0000.00000Roof Cond 0.00000.0000.0000
0.0020,383Glass Solar 0010.9221,9206.4420,38307,187Glass Cond -14,626 6.63-14,6264.068,1522.277,1870 AIRFLOWS
HeatingCooling45,329Wall Cond 41.72-91,997-66,88821.8743,87519.7962,66617,338
1,8111,811Vent715Partition 0.37-810-8100.377380.23715
00Infil0Exposed Floor 0.00000.0000.000
3,5619,658Supply0.000Infiltration -4-40.0000.000
0 0MinStop/Rh48.7273,614Sub Total ==> -107,438-82,32937.2274,68528.7390,95217,338
9,658Return 3,561Internal Loads1,8111,811Exhaust36,762Lights 0.000018.3236,76214.5145,9539,191
0 0Rm Exh50,634People 0.000014.0228,13015.9950,63400Auxiliary54,876Misc 0.000027.3554,87617.3354,8760
142,272Sub Total ==> 0.000059.69119,76847.84151,4639,191
6,377Ceiling Load 0.000-11,5953.096,2070.000-6,3770Ventilation Load 32.63-71,96300.00021.4867,9970
Sup. Fan Heat 3.159,971
ENGINEERING CKSHeatingCooling
Ret. Fan Heat 0.0000
% OA 50.918.8
Duct Heat Pkup 0.0000
0.340.93cfm/ft²
0Ov/Undr Sizing 9.43-20,806-20,8060.0000.000
366.07cfm/ton
Exhaust Heat -3.126,872-1.19-3,780
392.56ft²/ton-21.3530.57Btu/hr·ft²
113No. People222,263Grand Total ==> 100.00-220,524-114,731100.00200,661100.00316,60316,372
AREAS HEATING COIL SELECTIONCOOLING COIL SELECTIONTotal Capacity Sens Cap. Coil Airflow Enter DB/WB/HR Leave DB/WB/HR Gross Total Glass Coil Airflow Ent LvgCapacity
ton MBh MBh cfm °F °F gr/lb °F °F gr/lb ft² (%) °F°FcfmMBhFloor 10,357 Main Htg -184.8 3,561 51.7 100.026.4 316.6 264.3 9,615 77.6 61.6 59.5 52.0 49.7 51.4Main ClgPart 357 Aux Htg 0.0 0.00.000.0 0.0 0.0 0 0.0 0.0 0.0 0.0 0.0 0.0Aux ClgExFlr 0 -36.3Preheat 33.0 51.71,8110.0 0.0 0.0 0 0.0 0.0 0.0 0.0 0.0 0.0Opt VentRoof 0 0 0 Reheat 0.0 0.00.00Wall 6,662 409 6 Humidif 0.0 0 0.0 0.026.4 316.6Total
Opt Vent 0.0 0.00.00-221.1Total
Envelope LoadsSkylite SolarSkylite CondRoof CondGlass SolarGlass CondWall CondPartitionExposed FloorInfiltrationSub Total ==>
LightsPeopleMiscSub Total ==>
Ceiling LoadVentilation Load
Additional Reheat
OA Preheat Diff.
Ov/Undr SizingExhaust Heat
RA Preheat Diff.
Grand Total ==>
Internal Loads
0
0-27,189
0.0012.33
0.00
-3,780
Reheat at Design 0 0.00
TRACE® 700 v4.1 calculated at 08:26 AM on 01/19/2005Project Name: Mt SAC Bldg 26 RenovationDataset Name: Alternative - 1 System Checksums report Page 5 of 10C:\CDS\TRACE700\PROJECTS\J4101-30_B26.TRC
Page 52
System ChecksumsBy P2S Engineering, Inc.
AC-6 (2nd South) Double Duct VAV
HEATING COIL PEAKCLG SPACE PEAKCOOLING COIL PEAK TEMPERATURES13 / 1Mo/Hr:7 / 18Mo/Hr:8 / 17Mo/Hr:Peaked at Time: Cooling Heating
SADBOADB: 3391OADB:92 / 70 / 79OADB/WB/HR:Outside Air: 52.7 100.0Plenum 73.9 67.3ReturnPercentCoil PeakSpace PeakSpace PercentPercentNetPlenumSpace 73.9 67.3Ret/OASens. + Lat. Of TotalTot SensSpace SensOf TotalSensibleOf TotalTotalSens. + Lat 40.781.9
0.00.1Fn MtrTDBtu/h (%)Btu/hBtu/h(%)Btu/h(%)Btu/hBtu/h0.00.2Fn BldTDEnvelope Loads0.00.7Fn Frict0Skylite Solar 0.00000.0000.0000
0Skylite Cond 0.00000.0000.00000Roof Cond 0.00000.0000.0000
0.0023,167Glass Solar 006.8219,7953.8423,16705,808Glass Cond -11,843 2.20-11,8431.965,7020.965,8080 AIRFLOWS
HeatingCooling61,614Wall Cond 22.28-120,162-87,09522.8866,44114.0785,00923,395
6,2196,219Vent3,431Partition 0.72-3,888-3,8881.303,7780.573,431
00Infil0Exposed Floor 0.00000.0000.000
8,00213,976Supply0.000Infiltration -3-30.0000.000
0 0MinStop/Rh25.2094,021Sub Total ==> -135,896-102,82932.9695,71619.44117,41623,395
13,976Return 8,002Internal Loads6,2196,219Exhaust47,831Lights 0.000016.4747,8319.9059,78811,958
0 0Rm Exh182,750People 0.000034.96101,52830.26182,75000Auxiliary37,767Misc 0.000013.0137,7676.2537,7670
268,347Sub Total ==> 0.000064.44187,12546.41280,30411,958
7,201Ceiling Load 0.000-10,1642.607,5370.000-7,2010Ventilation Load 45.81-247,09400.00033.86204,5110
Sup. Fan Heat 2.3814,393
ENGINEERING CKSHeatingCooling
Ret. Fan Heat 0.0000
% OA 77.744.5
Duct Heat Pkup 0.0000
0.661.16cfm/ft²
0Ov/Undr Sizing 26.85-144,795-144,7950.0000.000
277.67cfm/ton
Exhaust Heat -3.3017,800-2.09-12,611
239.10ft²/ton-44.8650.19Btu/hr·ft²
406No. People369,568Grand Total ==> 100.00-539,346-257,787100.00290,377100.00604,01415,541
AREAS HEATING COIL SELECTIONCOOLING COIL SELECTIONTotal Capacity Sens Cap. Coil Airflow Enter DB/WB/HR Leave DB/WB/HR Gross Total Glass Coil Airflow Ent LvgCapacity
ton MBh MBh cfm °F °F gr/lb °F °F gr/lb ft² (%) °F°FcfmMBhFloor 12,035 Main Htg -415.2 8,002 51.7 100.050.3 604.0 449.6 13,879 82.2 65.2 69.6 52.0 50.2 53.3Main ClgPart 2,017 Aux Htg 0.0 0.00.000.0 0.0 0.0 0 0.0 0.0 0.0 0.0 0.0 0.0Aux ClgExFlr 0 -124.8Preheat 33.0 51.76,2190.0 0.0 0.0 0 0.0 0.0 0.0 0.0 0.0 0.0Opt VentRoof 0 0 0 Reheat 0.0 0.00.00Wall 8,431 323 4 Humidif 0.0 0 0.0 0.050.3 604.0Total
Opt Vent 0.0 0.00.00-540.0Total
Envelope LoadsSkylite SolarSkylite CondRoof CondGlass SolarGlass CondWall CondPartitionExposed FloorInfiltrationSub Total ==>
LightsPeopleMiscSub Total ==>
Ceiling LoadVentilation Load
Additional Reheat
OA Preheat Diff.
Ov/Undr SizingExhaust Heat
RA Preheat Diff.
Grand Total ==>
Internal Loads
0
0-29,361
0.005.440.00
-12,611
Reheat at Design 0 0.00
TRACE® 700 v4.1 calculated at 08:26 AM on 01/19/2005Project Name: Mt SAC Bldg 26 RenovationDataset Name: Alternative - 1 System Checksums report Page 6 of 10C:\CDS\TRACE700\PROJECTS\J4101-30_B26.TRC
Page 53
System ChecksumsBy P2S Engineering, Inc.
AC-7 (3rd South) Double Duct VAV
HEATING COIL PEAKCLG SPACE PEAKCOOLING COIL PEAK TEMPERATURES13 / 1Mo/Hr:7 / 18Mo/Hr:8 / 17Mo/Hr:Peaked at Time: Cooling Heating
SADBOADB: 3391OADB:92 / 70 / 79OADB/WB/HR:Outside Air: 52.7 100.0Plenum 78.2 62.0ReturnPercentCoil PeakSpace PeakSpace PercentPercentNetPlenumSpace 78.2 62.0Ret/OASens. + Lat. Of TotalTot SensSpace SensOf TotalSensibleOf TotalTotalSens. + Lat 36.083.8
0.00.1Fn MtrTDBtu/h (%)Btu/hBtu/h(%)Btu/h(%)Btu/hBtu/h0.00.2Fn BldTDEnvelope Loads0.00.7Fn Frict0Skylite Solar 0.00000.0000.0000
0Skylite Cond 0.00000.0000.00000Roof Cond 12.77-71,99800.00013.69106,952106,952
0.0018,841Glass Solar 004.3315,7452.4118,84105,235Glass Cond -10,686 1.90-10,6861.415,1390.675,2350 AIRFLOWS
HeatingCooling61,649Wall Cond 20.32-114,514-86,86718.2666,35310.3580,86919,220
7,2357,235Vent1,649Partition 0.33-1,869-1,8690.501,8160.211,649
00Infil0Exposed Floor 0.00000.0000.000
8,07217,495Supply0.000Infiltration -2-20.0000.000
0 0MinStop/Rh35.3287,374Sub Total ==> -199,067-99,42324.5089,05327.34213,547126,172
17,495Return 8,072Internal Loads7,2357,235Exhaust51,432Lights 0.000014.1551,4328.2364,29012,858
0 0Rm Exh215,100People 0.000032.88119,50027.54215,10000Auxiliary77,578Misc 0.000021.3477,5789.9377,5780
344,110Sub Total ==> 0.000068.37248,51045.70356,96812,858
23,609Ceiling Load 0.000-30,4147.1325,9110.000-23,6090Ventilation Load 51.00-287,45700.00030.83240,7570
Sup. Fan Heat 2.3017,944
ENGINEERING CKSHeatingCooling
Ret. Fan Heat 0.0000
% OA 89.641.4
Duct Heat Pkup 0.0000
0.671.46cfm/ft²
0Ov/Undr Sizing 23.10-130,185-130,1850.0000.000
268.79cfm/ton
Exhaust Heat -11.0162,056-6.17-48,172
184.63ft²/ton-46.9364.99Btu/hr·ft²
478No. People455,093Grand Total ==> 100.00-563,649-260,022100.00363,474100.00781,04467,249
AREAS HEATING COIL SELECTIONCOOLING COIL SELECTIONTotal Capacity Sens Cap. Coil Airflow Enter DB/WB/HR Leave DB/WB/HR Gross Total Glass Coil Airflow Ent LvgCapacity
ton MBh MBh cfm °F °F gr/lb °F °F gr/lb ft² (%) °F°FcfmMBhFloor 12,017 Main Htg -418.8 8,072 51.7 100.065.1 781.0 597.4 17,303 84.1 65.7 68.8 52.0 50.2 53.1Main ClgPart 823 Aux Htg 0.0 0.00.000.0 0.0 0.0 0 0.0 0.0 0.0 0.0 0.0 0.0Aux ClgExFlr 0 -145.2Preheat 33.0 51.77,2350.0 0.0 0.0 0 0.0 0.0 0.0 0.0 0.0 0.0Opt VentRoof 12,017 0 0 Reheat 0.0 0.00.00Wall 8,356 287 3 Humidif 0.0 0 0.0 0.065.1 781.0Total
Opt Vent 0.0 0.00.00-563.9Total
Envelope LoadsSkylite SolarSkylite CondRoof CondGlass SolarGlass CondWall CondPartitionExposed FloorInfiltrationSub Total ==>
LightsPeopleMiscSub Total ==>
Ceiling LoadVentilation Load
Additional Reheat
OA Preheat Diff.
Ov/Undr SizingExhaust Heat
RA Preheat Diff.
Grand Total ==>
Internal Loads
0
0-8,994
0.001.600.00
-48,172
Reheat at Design 0 0.00
TRACE® 700 v4.1 calculated at 08:26 AM on 01/19/2005Project Name: Mt SAC Bldg 26 RenovationDataset Name: Alternative - 1 System Checksums report Page 7 of 10C:\CDS\TRACE700\PROJECTS\J4101-30_B26.TRC
Page 54
System ChecksumsBy P2S Engineering, Inc.
AC-9 (1st Central) Variable Volume Reheat (30% Min Flow Default)
HEATING COIL PEAKCLG SPACE PEAKCOOLING COIL PEAK TEMPERATURES13 / 1Mo/Hr:7 / 18Mo/Hr:8 / 18Mo/Hr:Peaked at Time: Cooling Heating
SADBOADB: 3391OADB:89 / 70 / 81OADB/WB/HR:Outside Air: 53.0 100.0Plenum 76.6 62.4ReturnPercentCoil PeakSpace PeakSpace PercentPercentNetPlenumSpace 76.6 62.4Ret/OASens. + Lat. Of TotalTot SensSpace SensOf TotalSensibleOf TotalTotalSens. + Lat 38.380.3
0.00.1Fn MtrTDBtu/h (%)Btu/hBtu/h(%)Btu/h(%)Btu/hBtu/h0.00.2Fn BldTDEnvelope Loads0.00.7Fn Frict0Skylite Solar 0.00000.0000.0000
0Skylite Cond 0.00000.0000.00000Roof Cond 12.41-27,62700.00011.0443,49043,490
0.009,259Glass Solar 004.168,6202.359,25903,142Glass Cond -7,265 3.26-7,2651.703,5340.803,1420 AIRFLOWS
HeatingCooling23,607Wall Cond 19.25-42,853-31,34611.3123,4558.3232,7719,165
2,5742,981Vent0Partition 0.00000.0000.000
00Infil0Exposed Floor 0.00000.0000.000
3,14010,149Supply0.000Infiltration -1-10.0000.000
3,140 3,140MinStop/Rh34.9236,008Sub Total ==> -77,746-38,61217.1735,60922.5088,66252,654
10,149Return 3,140Internal Loads2,5742,981Exhaust23,056Lights 0.000011.1123,0567.3128,8205,764
0 0Rm Exh89,420People 0.000023.9549,67822.6989,42000Auxiliary90,388Misc 0.000043.5790,38822.9490,3880
202,864Sub Total ==> 0.000078.64163,12252.94208,6285,764
8,177Ceiling Load 0.000-13,4794.208,7040.000-8,1770Ventilation Load 45.94-102,28200.00025.64101,0390
Sup. Fan Heat 2.6710,518
ENGINEERING CKSHeatingCooling
Ret. Fan Heat 0.0000
% OA 82.029.4
Duct Heat Pkup 0.0000
0.561.82cfm/ft²
0Ov/Undr Sizing 22.03-49,052-49,0520.0000.000
309.04cfm/ton
Exhaust Heat -9.4521,036-3.75-14,776
170.22ft²/ton-39.8370.50Btu/hr·ft²
199No. People247,049Grand Total ==> 100.00-222,641-101,143100.00207,434100.00394,07235,465
AREAS HEATING COIL SELECTIONCOOLING COIL SELECTIONTotal Capacity Sens Cap. Coil Airflow Enter DB/WB/HR Leave DB/WB/HR Gross Total Glass Coil Airflow Ent LvgCapacity
ton MBh MBh cfm °F °F gr/lb °F °F gr/lb ft² (%) °F°FcfmMBhFloor 5,590 Main Htg -161.8 3,140 52.0 100.032.8 394.1 308.2 10,143 80.3 63.7 65.1 52.0 50.0 52.6Main ClgPart 0 Aux Htg 0.0 0.00.000.0 0.0 0.0 0 0.0 0.0 0.0 0.0 0.0 0.0Aux ClgExFlr 0 -60.8Preheat 33.0 52.02,9810.0 0.0 0.0 0 0.0 0.0 0.0 0.0 0.0 0.0Opt VentRoof 4,552 0 0Wall 3,254 226 7 Humidif 0.0 0 0.0 0.032.8 394.1Total
Opt Vent 0.0 0.00.00-222.6Total
Envelope LoadsSkylite SolarSkylite CondRoof CondGlass SolarGlass CondWall CondPartitionExposed FloorInfiltrationSub Total ==>
LightsPeopleMiscSub Total ==>
Ceiling LoadVentilation Load
Additional Reheat
OA Preheat Diff.
Ov/Undr SizingExhaust Heat
RA Preheat Diff.
Grand Total ==>
Internal Loads
0
-8,289-6,307
3.722.830.00
-14,776
Reheat at Design 0 0.00
TRACE® 700 v4.1 calculated at 08:26 AM on 01/19/2005Project Name: Mt SAC Bldg 26 RenovationDataset Name: Alternative - 1 System Checksums report Page 8 of 10C:\CDS\TRACE700\PROJECTS\J4101-30_B26.TRC
Page 55
System ChecksumsBy P2S Engineering, Inc.
FC-1 Fan Coil
HEATING COIL PEAKCLG SPACE PEAKCOOLING COIL PEAK TEMPERATURES13 / 1Mo/Hr:9 / 20Mo/Hr:9 / 20Mo/Hr:Peaked at Time: Cooling Heating
SADBOADB: 3382OADB:82 / 66 / 76OADB/WB/HR:Outside Air: 52.0 84.3Plenum 92.5 53.1ReturnPercentCoil PeakSpace PeakSpace PercentPercentNetPlenumSpace 72.0 70.0Ret/OASens. + Lat. Of TotalTot SensSpace SensOf TotalSensibleOf TotalTotalSens. + Lat 67.172.8
0.00.0Fn MtrTDBtu/h (%)Btu/hBtu/h(%)Btu/h(%)Btu/hBtu/h0.00.0Fn BldTDEnvelope Loads0.00.0Fn Frict0Skylite Solar 0.00000.0000.0000
0Skylite Cond 0.00000.0000.00000Roof Cond 0.00000.0000.0000
0.000Glass Solar 000.0000.00000Glass Cond 0 0.0000.0000.0000 AIRFLOWS
HeatingCooling4,111Wall Cond 82.99-4,507-3,67665.084,11168.794,978867
2323Vent0Partition 0.00000.0000.000
00Infil0Exposed Floor 0.00000.0000.000
294294Supply0.000Infiltration 000.0000.000
0 0MinStop/Rh82.994,111Sub Total ==> -4,507-3,67665.084,11168.794,978867
294Return 294Internal Loads2323Exhaust550Lights 0.00008.715509.50688138
0 0Rm Exh698People 0.00006.133889.6469800Auxiliary265Misc 0.00004.192653.662650
1,512Sub Total ==> 0.000019.031,20222.801,650138
1,004Ceiling Load 0.000-83115.901,0040.000-1,0040Ventilation Load 17.01-92400.0008.416080
Sup. Fan Heat 0.000
ENGINEERING CKSHeatingCooling
Ret. Fan Heat 0.0000
% OA 7.97.9
Duct Heat Pkup 0.0000
1.901.90cfm/ft²
0Ov/Undr Sizing 0.00000.0000.000
487.84cfm/ton
Exhaust Heat 0.0000.000
257.04ft²/ton-35.0446.69Btu/hr·ft²
2No. People6,628Grand Total ==> 100.00-5,431-4,507100.006,318100.007,2360
AREAS HEATING COIL SELECTIONCOOLING COIL SELECTIONTotal Capacity Sens Cap. Coil Airflow Enter DB/WB/HR Leave DB/WB/HR Gross Total Glass Coil Airflow Ent LvgCapacity
ton MBh MBh cfm °F °F gr/lb °F °F gr/lb ft² (%) °F°FcfmMBhFloor 155 Main Htg -5.4 294 67.1 84.30.6 7.2 6.6 294 72.8 58.7 54.2 52.0 49.5 50.6Main ClgPart 0 Aux Htg 0.0 0.00.000.0 0.0 0.0 0 0.0 0.0 0.0 0.0 0.0 0.0Aux ClgExFlr 0 0.0Preheat 0.0 0.000.0 0.0 0.0 0 0.0 0.0 0.0 0.0 0.0 0.0Opt VentRoof 0 0 0Wall 344 0 0 Humidif 0.0 0 0.0 0.00.6 7.2Total
Opt Vent 0.0 0.00.00-5.4Total
Envelope LoadsSkylite SolarSkylite CondRoof CondGlass SolarGlass CondWall CondPartitionExposed FloorInfiltrationSub Total ==>
LightsPeopleMiscSub Total ==>
Ceiling LoadVentilation Load
Additional Reheat
OA Preheat Diff.
Ov/Undr SizingExhaust Heat
RA Preheat Diff.
Grand Total ==>
Internal Loads
0
00
0.000.000.00
0
Reheat at Design 0 0.00
TRACE® 700 v4.1 calculated at 08:26 AM on 01/19/2005Project Name: Mt SAC Bldg 26 RenovationDataset Name: Alternative - 1 System Checksums report Page 9 of 10C:\CDS\TRACE700\PROJECTS\J4101-30_B26.TRC
Page 56
System ChecksumsBy P2S Engineering, Inc.
FC-2 Fan Coil
HEATING COIL PEAKCLG SPACE PEAKCOOLING COIL PEAK TEMPERATURES13 / 1Mo/Hr:7 / 19Mo/Hr:8 / 17Mo/Hr:Peaked at Time: Cooling Heating
SADBOADB: 3388OADB:92 / 70 / 79OADB/WB/HR:Outside Air: 52.0 72.8Plenum 93.7 55.4ReturnPercentCoil PeakSpace PeakSpace PercentPercentNetPlenumSpace 72.0 70.0Ret/OASens. + Lat. Of TotalTot SensSpace SensOf TotalSensibleOf TotalTotalSens. + Lat 59.177.8
0.00.0Fn MtrTDBtu/h (%)Btu/hBtu/h(%)Btu/h(%)Btu/hBtu/h0.00.0Fn BldTDEnvelope Loads0.00.0Fn Frict0Skylite Solar 0.00000.0000.0000
0Skylite Cond 0.00000.0000.00000Roof Cond 20.06-69900.00010.63862862
0.000Glass Solar 000.0000.00000Glass Cond 0 0.0000.0000.0000 AIRFLOWS
HeatingCooling0Wall Cond 0.00000.0000.0000
7070Vent0Partition 0.00000.0000.000
00Infil0Exposed Floor 0.00000.0000.000
237237Supply0.000Infiltration 000.0000.000
0 0MinStop/Rh20.070Sub Total ==> -69900.00010.63862862
237Return 237Internal Loads7070Exhaust601Lights 0.000011.806019.26751150
0 0Rm Exh2,102People 0.000022.941,16825.922,10200Auxiliary2,183Misc 0.000042.882,18326.922,1830
4,885Sub Total ==> 0.000077.623,95162.105,035150
1,036Ceiling Load 0.000-69922.371,1390.000-1,0360Ventilation Load 79.93-2,78300.00027.262,2110
Sup. Fan Heat 0.000
ENGINEERING CKSHeatingCooling
Ret. Fan Heat 0.0000
% OA 29.629.6
Duct Heat Pkup 0.0000
1.571.57cfm/ft²
0Ov/Undr Sizing 0.00000.0000.000
350.76cfm/ton
Exhaust Heat 0.0000.000
223.49ft²/ton-23.0653.69Btu/hr·ft²
5No. People5,921Grand Total ==> 100.00-3,482-699100.005,090100.008,108-24
AREAS HEATING COIL SELECTIONCOOLING COIL SELECTIONTotal Capacity Sens Cap. Coil Airflow Enter DB/WB/HR Leave DB/WB/HR Gross Total Glass Coil Airflow Ent LvgCapacity
ton MBh MBh cfm °F °F gr/lb °F °F gr/lb ft² (%) °F°FcfmMBhFloor 151 Main Htg -3.5 237 59.1 72.80.7 8.1 6.4 237 77.8 62.6 63.7 52.0 50.4 54.1Main ClgPart 0 Aux Htg 0.0 0.00.000.0 0.0 0.0 0 0.0 0.0 0.0 0.0 0.0 0.0Aux ClgExFlr 0 0.0Preheat 0.0 0.000.0 0.0 0.0 0 0.0 0.0 0.0 0.0 0.0 0.0Opt VentRoof 151 0 0Wall 0 0 0 Humidif 0.0 0 0.0 0.00.7 8.1Total
Opt Vent 0.0 0.00.00-3.5Total
Envelope LoadsSkylite SolarSkylite CondRoof CondGlass SolarGlass CondWall CondPartitionExposed FloorInfiltrationSub Total ==>
LightsPeopleMiscSub Total ==>
Ceiling LoadVentilation Load
Additional Reheat
OA Preheat Diff.
Ov/Undr SizingExhaust Heat
RA Preheat Diff.
Grand Total ==>
Internal Loads
0
00
0.000.000.00
0
Reheat at Design 0 0.00
TRACE® 700 v4.1 calculated at 08:26 AM on 01/19/2005Project Name: Mt SAC Bldg 26 RenovationDataset Name: Alternative - 1 System Checksums report Page 10 of 10C:\CDS\TRACE700\PROJECTS\J4101-30_B26.TRC
Page 57
System ChecksumsBy P2S Engineering, Inc
Variable Volume Reheat (30% Min Flow Default)System - 001
HEATING COIL PEAKCLG SPACE PEAKCOOLING COIL PEAK TEMPERATURES
Heating DesignMo/Hr:9 / 14Mo/Hr:9 / 16Mo/Hr:Peaked at Time: Cooling HeatingSADBOADB: 28OADB:96 / 70 / 67OADB/WB/HR:Outside Air: 59.7 86.6Ra Plenum 76.5 66.2
ReturnPercentCoil PeakSpace PeakSpace PercentPercentNetPlenumSpace 76.5 66.2Ret/OASens. + Lat. Of TotalTot SensSpace SensOf TotalSensibleOf TotalTotalSens. + Lat 28.082.9
0.00.0Fn MtrTDBtu/h (%)Btu/hBtu/h(%)Btu/h(%)Btu/hBtu/h0.00.0Fn BldTDEnvelope Loads0.00.0Fn Frict0Skylite Solar 0.000000000
0Skylite Cond 0.0000000000Roof Cond 4.28-58,9450008156,424156,424
0.00142,896Glass Solar 0017182,6377142,896028,948Glass/Door Cond -52,609 3.82-52,609227,353128,9480
AIRFLOWS
HeatingCooling40,178Wall Cond 5.02-69,144-42,947333,091364,17824,000
0Partition/Door 0.0000000094,845Floor 10.76-148,229-148,2299594,845
Sec Fan10.7091,946Infiltration -147,421-147,421782,519591,946
21,031 21,031MinStop/Rh
34.56398,814Sub Total ==> -476,348-391,20638420,44530579,238180,424
71,790Return 22,718
Internal Loads
22,71823,313Exhaust
237,371Lights 0.000021237,37115296,71359,343
1,656 1,656Rm Exh
362,570People 0.00018200,62219
00Auxiliary
182,593Misc 0.000017182,5939182,5930
782,533Sub Total ==> 0.000056620,58543841,87659,343
52,172Ceiling Load 0.000-39,024663,16300-52,1720Ventilation Load 67.28-927,22100030594,6530
Sup. Fan Heat 00
ENGINEERING CKS
HeatingCooling
Ret. Fan Heat 000 % OA 100.030.8
Duct Heat Pkup 000 0.311.05cfm/ft²
0Ov/Undr Sizing0.0000
0000
430.84cfm/ton
Exhaust Heat-3.3546,117
-3-63,268
411.01ft²/ton-20.6129.20Btu/hr·ft²
806No. People1,233,519Grand Total ==> 100.00-1,378,228-430,231100.001,104,193100.001,952,499124,326
AREAS HEATING COIL SELECTIONCOOLING COIL SELECTIONTotal Capacity Sens Cap. Coil Airflow Enter DB/WB/HR Leave DB/WB/HR Gross Total Glass Coil Airflow Ent LvgCapacity
ton MBh MBh cfm °F °F gr/lb °F °F gr/lb ft² (%) °F°FcfmMBh
Floor 66,874 Main Htg -622.4 21,031 59.7 86.6162.7 1,952.5 1,720.2 67,432 82.9 64.9 64.6 59.7 55.5 59.6Main ClgPart 0 Aux Htg 0.0 0.00.000.0 0.0 0.0 0 0.0 0.0 0.0 0.0 0.0 0.0Aux Clg
ExFlr 38,901-755.8Preheat 28.0 59.721,6250.0 0.0 0.0 0 0.0 0.0 0.0 0.0 0.0 0.0Opt Vent
Roof 38,901 0 0Reheat -192.2 68.059.721,031
Wall 18,004 4,815 27Humidif 0.0 0 0.0 0.0162.7 1,952.5Total
Opt Vent 0.0 0.00.00
-1,378.2Total
Envelope LoadsSkylite SolarSkylite CondRoof CondGlass SolarGlass/Door CondWall CondPartition/DoorFloor
InfiltrationSub Total ==>
LightsPeopleMisc
Sub Total ==>
Ceiling LoadVentilation Load
Additional Reheat
OA Preheat Diff.
Ov/Undr SizingExhaust Heat
RA Preheat Diff.
Grand Total ==>
Internal Loads
0
-20,7760
1.510.000.00
-63,268
Supply Air Leakage
96
Dehumid. Ov Sizing 0 0
Adj Air Trans Heat 0 0 0 0 0 Adj Air Trans Heat 0 0 0Leakage Ups
Leakage Dwn
3,3443,344Infil
AHU VentNom Vent
Main FanTerminal
Adjacent Floor
Diffuser
Supply Air LeakageUnderflr Sup Ht Pkup Underflr Sup Ht Pkup
Adjacent Floor0 0 0 0
0 00 0 0
094,845
0 0 0 0
0 0.000 0.00
70,102
70,10270,102
0
21,62521,625
0
0
21,031
21,03121,031
0
21,031
21,031
0
0
0 362,570 0
Int Door 0
Ext Door 0 0 0
TRACE® 700 v6.3 calculated at 11:28 AM on 05/30/2014Project Name: 7190
Dataset Name: Alternative - 1 System Checksums Report Page 1 of 1BLDG 13.TRC
Page 58
System ChecksumsBy P2S Engineering, Inc
Variable Volume Reheat (30% Min Flow Default)AHU-1
HEATING COIL PEAKCLG SPACE PEAKCOOLING COIL PEAK TEMPERATURESHeating DesignMo/Hr:9 / 15Mo/Hr:8 / 15Mo/Hr:Peaked at Time: Cooling Heating
SADBOADB: 33OADB:94 / 70 / 75OADB/WB/HR:Outside Air: 55.0 89.2Ra Plenum 87.6 62.7ReturnPercentCoil PeakSpace PeakSpace PercentPercentNetPlenumSpace 75.8 70.0Ret/OASens. + Lat. Of TotalTot SensSpace SensOf TotalSensibleOf TotalTotalSens. + Lat 33.387.1
0.00.2Fn MtrTDBtu/h (%)Btu/hBtu/h(%)Btu/h(%)Btu/hBtu/h0.00.5Fn BldTDEnvelope Loads0.01.5Fn Frict0Skylite Solar 0.000000000
0Skylite Cond 0.0000000000Roof Cond 4.87-10,011000623,07423,074
0.0018,014Glass Solar 001423,534518,01406,170Glass/Door Cond -14,925 7.26-14,92535,85826,1700
AIRFLOWSHeatingCooling8,268Wall Cond 14.15-29,066-21,91258,05728,625357
0Partition/Door 0.000000000Floor 0.0000000
Sec Fan0.000Infiltration 000000
2,608 2,608MinStop/Rh
26.2832,452Sub Total ==> -54,002-36,8372237,4491555,88323,431
7,842Return 2,608
Internal Loads
2,5884,825Exhaust
24,220Lights 0.00001424,220830,2756,055
0 0Rm Exh
104,235People 0.0003457,71828
00Auxiliary
22,884Misc 0.00001422,884622,8840151,339Sub Total ==> 0.000062104,82142157,3946,055
29,448Ceiling Load 0.000-17,1641626,92600-29,4480Ventilation Load 50.28-103,31000037137,6880
Sup. Fan Heat 518,317
ENGINEERING CKSHeatingCooling
Ret. Fan Heat 26,8696,869 % OA 99.261.5Duct Heat Pkup 000 0.351.06cfm/ft²
0Ov/Undr Sizing0.0000
0000
253.07cfm/ton
Exhaust Heat0.000
-1-4,289
238.54ft²/ton-27.8050.31Btu/hr·ft²
231No. People213,238Grand Total ==> 100.00-205,463-54,002100.00169,196100.00371,8622,618
AREAS HEATING COIL SELECTIONCOOLING COIL SELECTIONTotal Capacity Sens Cap. Coil Airflow Enter DB/WB/HR Leave DB/WB/HR Gross Total Glass Coil Airflow Ent LvgCapacity
ton MBh MBh cfm °F °F gr/lb °F °F gr/lb ft² (%) °F°FcfmMBhFloor 7,392 Main Htg -102.4 2,608 52.8 89.231.0 371.9 285.9 7,728 87.1 67.1 70.8 52.8 51.0 54.5Main ClgPart 0 Aux Htg 0.0 0.00.000.0 0.0 0.0 0 0.0 0.0 0.0 0.0 0.0 0.0Aux Clg
ExFlr 0-103.1Preheat 33.0 52.84,8250.0 0.0 0.0 0 0.0 0.0 0.0 0.0 0.0 0.0Opt Vent
Roof 7,392 0 0Wall 7,606 790 10
Humidif 0.0 0 0.0 0.031.0 371.9TotalOpt Vent 0.0 0.00.00
-205.5Total
Envelope LoadsSkylite SolarSkylite CondRoof CondGlass SolarGlass/Door CondWall CondPartition/DoorFloor
InfiltrationSub Total ==>
LightsPeopleMiscSub Total ==>
Ceiling LoadVentilation Load
Additional Reheat
OA Preheat Diff.
Ov/Undr SizingExhaust Heat
RA Preheat Diff.
Grand Total ==>
Internal Loads
0
-47,779-373
23.250.180.00
-4,289
Supply Air Leakage
93
Dehumid. Ov Sizing 0 0Adj Air Trans Heat 0 0 0 0 0 Adj Air Trans Heat 0 0 0
Leakage UpsLeakage Dwn
00InfilAHU VentNom Vent
Main FanTerminal
Adjacent Floor
Diffuser
Supply Air LeakageUnderflr Sup Ht Pkup Underflr Sup Ht Pkup
Adjacent Floor0 0 0 0
0 00 0 0
00
0 0 0 0
0 0.000 0.00
7,8427,8427,842
04,8254,825
00
2,6082,6082,608
02,5882,588
00
0 104,235 0
Int Door 0
Ext Door 0 0 0
TRACE® 700 v6.2.5 calculated at 02:09 PM on 12/27/2010Project Name: J6012 MT SAC Bldg 12 RemodelDataset Name: Alternative - 1 System Checksums Report Page 1 of 320101227_DD.TRC
Page 59
System ChecksumsBy P2S Engineering, Inc
Variable Volume Reheat (30% Min Flow Default)AHU-2 East
HEATING COIL PEAKCLG SPACE PEAKCOOLING COIL PEAK TEMPERATURESHeating DesignMo/Hr:7 / 16Mo/Hr:8 / 14Mo/Hr:Peaked at Time: Cooling Heating
SADBOADB: 33OADB:93 / 70 / 77OADB/WB/HR:Outside Air: 55.0 84.6Ra Plenum 87.3 62.3ReturnPercentCoil PeakSpace PeakSpace PercentPercentNetPlenumSpace 75.0 70.0Ret/OASens. + Lat. Of TotalTot SensSpace SensOf TotalSensibleOf TotalTotalSens. + Lat 33.088.5
0.00.1Fn MtrTDBtu/h (%)Btu/hBtu/h(%)Btu/h(%)Btu/hBtu/h0.00.2Fn BldTDEnvelope Loads0.00.5Fn Frict0Skylite Solar 0.000000000
0Skylite Cond 0.0000000000Roof Cond 3.44-1,78800043,9243,924
0.001,098Glass Solar 00293511,0980398Glass/Door Cond -1,023 1.97-1,023148203980
AIRFLOWSHeatingCooling2,180Wall Cond 12.39-6,432-4,98162,40122,372192
0Partition/Door 0.000000000Floor 0.0000000
Sec Fan0.000Infiltration 000000
587 587MinStop/Rh
17.803,677Sub Total ==> -9,243-6,00493,81887,7924,116
1,956Return 587
Internal Loads
5871,425Exhaust
4,374Lights 0.0000104,37465,4681,094
0 0Rm Exh
42,750People 0.0005623,75045
00Auxiliary
4,556Misc 0.0000114,55654,556051,680Sub Total ==> 0.00007732,6805552,7741,094
5,209Ceiling Load 0.000-3,239145,70700-5,2090Ventilation Load 45.12-23,4240003533,4300
Sup. Fan Heat 21,484
ENGINEERING CKSHeatingCooling
Ret. Fan Heat 000 % OA 100.072.8Duct Heat Pkup 000 0.441.47cfm/ft²
0Ov/Undr Sizing0.0000
0000
245.86cfm/ton
Exhaust Heat0.000
00
167.78ft²/ton-38.8971.52Btu/hr·ft²
95No. People60,566Grand Total ==> 100.00-51,912-9,243100.0042,206100.0095,4810
AREAS HEATING COIL SELECTIONCOOLING COIL SELECTIONTotal Capacity Sens Cap. Coil Airflow Enter DB/WB/HR Leave DB/WB/HR Gross Total Glass Coil Airflow Ent LvgCapacity
ton MBh MBh cfm °F °F gr/lb °F °F gr/lb ft² (%) °F°FcfmMBhFloor 1,335 Main Htg -19.2 587 54.3 84.68.0 95.5 71.0 1,927 88.5 68.4 75.3 54.3 52.2 56.8Main ClgPart 0 Aux Htg 0.0 0.00.000.0 0.0 0.0 0 0.0 0.0 0.0 0.0 0.0 0.0Aux Clg
ExFlr 0-32.7Preheat 33.0 54.31,4250.0 0.0 0.0 0 0.0 0.0 0.0 0.0 0.0 0.0Opt Vent
Roof 1,335 0 0Wall 1,560 54 3
Humidif 0.0 0 0.0 0.08.0 95.5TotalOpt Vent 0.0 0.00.00
-51.9Total
Envelope LoadsSkylite SolarSkylite CondRoof CondGlass SolarGlass/Door CondWall CondPartition/DoorFloor
InfiltrationSub Total ==>
LightsPeopleMiscSub Total ==>
Ceiling LoadVentilation Load
Additional Reheat
OA Preheat Diff.
Ov/Undr SizingExhaust Heat
RA Preheat Diff.
Grand Total ==>
Internal Loads
0
-19,2450
37.070.000.00
0
Supply Air Leakage
96
Dehumid. Ov Sizing 0 0Adj Air Trans Heat 0 0 0 0 0 Adj Air Trans Heat 0 0 0
Leakage UpsLeakage Dwn
00InfilAHU VentNom Vent
Main FanTerminal
Adjacent Floor
Diffuser
Supply Air LeakageUnderflr Sup Ht Pkup Underflr Sup Ht Pkup
Adjacent Floor0 0 0 0
0 00 0 0
00
0 0 0 0
0 0.000 0.00
1,9561,9561,956
01,4251,425
00
587587587
0587587
00
0 42,750 0
Int Door 0
Ext Door 0 0 0
TRACE® 700 v6.2.5 calculated at 02:09 PM on 12/27/2010Project Name: J6012 MT SAC Bldg 12 RemodelDataset Name: Alternative - 1 System Checksums Report Page 2 of 320101227_DD.TRC
Page 60
System ChecksumsBy P2S Engineering, Inc
Variable Volume Reheat (30% Min Flow Default)AHU-3 West
HEATING COIL PEAKCLG SPACE PEAKCOOLING COIL PEAK TEMPERATURESHeating DesignMo/Hr:7 / 15Mo/Hr:8 / 14Mo/Hr:Peaked at Time: Cooling Heating
SADBOADB: 33OADB:93 / 70 / 77OADB/WB/HR:Outside Air: 55.0 85.5Ra Plenum 87.2 62.3ReturnPercentCoil PeakSpace PeakSpace PercentPercentNetPlenumSpace 75.0 70.0Ret/OASens. + Lat. Of TotalTot SensSpace SensOf TotalSensibleOf TotalTotalSens. + Lat 33.088.1
0.00.1Fn MtrTDBtu/h (%)Btu/hBtu/h(%)Btu/h(%)Btu/hBtu/h0.00.2Fn BldTDEnvelope Loads0.00.5Fn Frict0Skylite Solar 0.000000000
0Skylite Cond 0.0000000000Roof Cond 3.62-1,77800043,9103,910
0.001,103Glass Solar 00298811,1030398Glass/Door Cond -1,023 2.08-1,023148703980
AIRFLOWSHeatingCooling2,098Wall Cond 13.33-6,549-5,07552,15132,252154
0Partition/Door 0.000000000Floor 0.0000000
Sec Fan0.000Infiltration 000000
558 558MinStop/Rh
19.033,599Sub Total ==> -9,349-6,09893,62597,6634,064
1,860Return 558
Internal Loads
5581,320Exhaust
4,358Lights 0.0000114,35865,4471,089
0 0Rm Exh
39,600People 0.0005522,00044
00Auxiliary
4,539Misc 0.0000114,53954,539048,497Sub Total ==> 0.00007730,8975649,5861,089
5,153Ceiling Load 0.000-3,251145,61200-5,1530Ventilation Load 45.35-22,2740003430,6670
Sup. Fan Heat 21,416
ENGINEERING CKSHeatingCooling
Ret. Fan Heat 000 % OA 100.071.0Duct Heat Pkup 000 0.421.40cfm/ft²
0Ov/Undr Sizing0.0000
0000
249.89cfm/ton
Exhaust Heat0.000
00
178.66ft²/ton-36.9367.17Btu/hr·ft²
88No. People57,249Grand Total ==> 100.00-49,119-9,349100.0040,134100.0089,3310
AREAS HEATING COIL SELECTIONCOOLING COIL SELECTIONTotal Capacity Sens Cap. Coil Airflow Enter DB/WB/HR Leave DB/WB/HR Gross Total Glass Coil Airflow Ent LvgCapacity
ton MBh MBh cfm °F °F gr/lb °F °F gr/lb ft² (%) °F°FcfmMBhFloor 1,330 Main Htg -18.8 558 54.3 85.57.4 89.3 67.0 1,838 88.1 68.2 75.3 54.3 52.4 57.6Main ClgPart 0 Aux Htg 0.0 0.00.000.0 0.0 0.0 0 0.0 0.0 0.0 0.0 0.0 0.0Aux Clg
ExFlr 0-30.3Preheat 33.0 54.31,3200.0 0.0 0.0 0 0.0 0.0 0.0 0.0 0.0 0.0Opt Vent
Roof 1,330 0 0Wall 1,588 54 3
Humidif 0.0 0 0.0 0.07.4 89.3TotalOpt Vent 0.0 0.00.00
-49.1Total
Envelope LoadsSkylite SolarSkylite CondRoof CondGlass SolarGlass/Door CondWall CondPartition/DoorFloor
InfiltrationSub Total ==>
LightsPeopleMiscSub Total ==>
Ceiling LoadVentilation Load
Additional Reheat
OA Preheat Diff.
Ov/Undr SizingExhaust Heat
RA Preheat Diff.
Grand Total ==>
Internal Loads
0
-17,4950
35.620.000.00
0
Supply Air Leakage
97
Dehumid. Ov Sizing 0 0Adj Air Trans Heat 0 0 0 0 0 Adj Air Trans Heat 0 0 0
Leakage UpsLeakage Dwn
00InfilAHU VentNom Vent
Main FanTerminal
Adjacent Floor
Diffuser
Supply Air LeakageUnderflr Sup Ht Pkup Underflr Sup Ht Pkup
Adjacent Floor0 0 0 0
0 00 0 0
00
0 0 0 0
0 0.000 0.00
1,8601,8601,860
01,3201,320
00
558558558
0558558
00
0 39,600 0
Int Door 0
Ext Door 0 0 0
TRACE® 700 v6.2.5 calculated at 02:09 PM on 12/27/2010Project Name: J6012 MT SAC Bldg 12 RemodelDataset Name: Alternative - 1 System Checksums Report Page 3 of 320101227_DD.TRC
Page 61
System ChecksumsBy P2S ENGINEERING, INC
Variable Volume Reheat (30% Min Flow Default)Bldg 11
HEATING COIL PEAKCLG SPACE PEAKCOOLING COIL PEAK TEMPERATURES
Heating DesignMo/Hr:7 / 18Mo/Hr:8 / 17Mo/Hr:Peaked at Time: Cooling HeatingSADBOADB: 33OADB:92 / 70 / 79OADB/WB/HR:Outside Air: 53.0 85.9Ra Plenum 77.6 64.2
ReturnPercentCoil PeakSpace PeakSpace PercentPercentNetPlenumSpace 77.7 64.8Ret/OASens. + Lat. Of TotalTot SensSpace SensOf TotalSensibleOf TotalTotalSens. + Lat 36.084.8
0.00.0Fn MtrTDBtu/h (%)Btu/hBtu/h(%)Btu/h(%)Btu/hBtu/h0.00.0Fn BldTDEnvelope Loads0.00.0Fn Frict0Skylite Solar 0.000000000
0Skylite Cond 0.0000000000Roof Cond 8.30-58,31800010129,759129,759
0.0036,365Glass Solar 00530,970336,365019,935Glass/Door Cond -39,507 5.62-39,507420,736219,9350
AIRFLOWS
HeatingCooling61,698Wall Cond 14.79-103,944-84,3511269,439677,68315,9867,203Partition/Door 2.48-17,416-17,41618,52017,203
0Floor 2.05-14,429-14,429000
Sec Fan0.000Infiltration 000000
10,969 10,969MinStop/Rh
33.25125,201Sub Total ==> -233,614-155,70322129,66521270,946145,745
24,022Return 7,469
Internal Loads
6,5369,591Exhaust
97,130Lights 0.00001697,1309121,41324,283
4,885 3,500Rm Exh
315,714People 0.00030174,04825
00Auxiliary
137,166Misc 0.000023137,16611137,1660
550,010Sub Total ==> 0.000069408,34445574,29324,283
29,829Ceiling Load 0.000-31,000532,16800-29,8290Ventilation Load 56.75-398,72600037475,3860
Sup. Fan Heat 00
ENGINEERING CKS
HeatingCooling
Ret. Fan Heat 000 % OA 91.550.1
Duct Heat Pkup 000 0.581.53cfm/ft²
19,688Ov/Undr Sizing0.0000
319,585219,688
271.09cfm/ton
Exhaust Heat-5.6639,790
-5-60,742
177.61ft²/ton-36.8567.56Btu/hr·ft²
696No. People724,729Grand Total ==> 100.00-702,656-186,703100.00589,762100.001,279,57279,457
AREAS HEATING COIL SELECTIONCOOLING COIL SELECTIONTotal Capacity Sens Cap. Coil Airflow Enter DB/WB/HR Leave DB/WB/HR Gross Total Glass Coil Airflow Ent LvgCapacity
ton MBh MBh cfm °F °F gr/lb °F °F gr/lb ft² (%) °F°FcfmMBh
Floor 18,939 Main Htg -386.9 10,969 53.0 85.9106.6 1,279.6 968.1 28,578 84.8 66.3 70.7 53.0 51.1 55.0Main ClgPart 2,444 Aux Htg 0.0 0.00.000.0 0.0 0.0 0 0.0 0.0 0.0 0.0 0.0 0.0Aux Clg
ExFlr 780-310.9Preheat 33.0 53.014,4750.0 0.0 0.0 0 0.0 0.0 0.0 0.0 0.0 0.0Opt Vent
Roof 16,727 0 0Reheat -200.2 70.053.010,969
Wall 10,026 929 9Humidif 0.0 0 0.0 0.0106.6 1,279.6Total
Opt Vent 0.0 0.00.00
-697.8Total
Envelope LoadsSkylite SolarSkylite CondRoof CondGlass SolarGlass/Door CondWall CondPartition/DoorFloor
InfiltrationSub Total ==>
LightsPeopleMisc
Sub Total ==>
Ceiling LoadVentilation Load
Additional Reheat
OA Preheat Diff.
Ov/Undr SizingExhaust Heat
RA Preheat Diff.
Grand Total ==>
Internal Loads
0
-95,351-14,756
13.572.100.00
-60,742
Supply Air Leakage
91
Dehumid. Ov Sizing 0 0
Adj Air Trans Heat 0 0 0 0 0 Adj Air Trans Heat 0 0 0Leakage Ups
Leakage Dwn
00Infil
AHU VentNom Vent
Main FanTerminal
Adjacent Floor
Diffuser
Supply Air LeakageUnderflr Sup Ht Pkup Underflr Sup Ht Pkup
Adjacent Floor0 0 0 0
0 00 0 0
00
0 0 0 0
0 0.000 0.00
28,906
28,90628,906
0
14,47514,475
0
0
10,969
10,96910,969
0
10,036
10,036
0
0
0 315,714 0
Int Door 0
Ext Door 0 0 0
TRACE® 700 v6.3 calculated at 06:52 AM on 10/03/2014Project Name: MT SAN ANTONIO COLLEGE BLDG 11 RENO
Dataset Name: Alternative - 1 System Checksums Report Page 1 of 14101-BLDG11.TRC
Page 62
System ChecksumsBy P2S Engineering, Inc
Variable Volume Reheat (30% Min Flow Default)System - 001
HEATING COIL PEAKCLG SPACE PEAKCOOLING COIL PEAK TEMPERATURES
Heating DesignMo/Hr:9 / 15Mo/Hr:9 / 16Mo/Hr:Peaked at Time: Cooling HeatingSADBOADB: 28OADB:96 / 70 / 67OADB/WB/HR:Outside Air: 55.0 95.5Ra Plenum 74.7 65.6
ReturnPercentCoil PeakSpace PeakSpace PercentPercentNetPlenumSpace 75.8 65.6Ret/OASens. + Lat. Of TotalTot SensSpace SensOf TotalSensibleOf TotalTotalSens. + Lat 41.379.8
0.00.1Fn MtrTDBtu/h (%)Btu/hBtu/h(%)Btu/h(%)Btu/hBtu/h0.00.2Fn BldTDEnvelope Loads0.00.7Fn Frict0Skylite Solar 0.000000000
0Skylite Cond 0.0000000000Roof Cond 5.09-39,235000345,15145,151
0.0076,998Glass Solar 001085,715576,998017,522Glass/Door Cond -34,814 4.52-34,814217,020117,5220
AIRFLOWS
HeatingCooling81,035Wall Cond 13.16-101,393-70,659974,9508118,00136,9664,647Partition/Door 0.94-7,262-7,26214,64704,647
63,635Floor 12.90-99,452-99,4528563,635
Sec Fan13.9680,123Infiltration -107,579-107,579761,831680,123
11,844 11,844MinStop/Rh
50.57323,958Sub Total ==> -389,736-319,76637307,79729406,07582,117
39,120Return 11,484
Internal Loads
7,2917,291Exhaust
175,322Lights 0.000021175,32216219,15343,831
2,800 2,800Rm Exh
260,124People 0.00017137,16618
00Auxiliary
198,114Misc 0.000024198,11414198,1140
633,561Sub Total ==> 0.000062510,60348677,39143,831
10,929Ceiling Load 0.000-39,36018,40600-10,9290Ventilation Load 43.76-337,31400018251,2240
Sup. Fan Heat 346,722
ENGINEERING CKS
HeatingCooling
Ret. Fan Heat 346,29646,296 % OA 64.619.4
Duct Heat Pkup 00-86,904 0.230.77cfm/ft²
0Ov/Undr Sizing0.0000
0000
335.13cfm/ton
Exhaust Heat-2.5219,433
-1-14,037
436.05ft²/ton-15.0027.52Btu/hr·ft²
546No. People968,447Grand Total ==> 100.00-770,739-359,126100.00826,806100.001,413,67260,374
AREAS HEATING COIL SELECTIONCOOLING COIL SELECTIONTotal Capacity Sens Cap. Coil Airflow Enter DB/WB/HR Leave DB/WB/HR Gross Total Glass Coil Airflow Ent LvgCapacity
ton MBh MBh cfm °F °F gr/lb °F °F gr/lb ft² (%) °F°FcfmMBh
Floor 51,369 Main Htg -569.0 11,844 51.9 95.5117.8 1,413.7 1,208.4 39,422 79.8 62.5 57.9 51.9 49.8 50.3Main ClgPart 7,051 Aux Htg 0.0 0.00.000.0 0.0 0.0 0 0.0 0.0 0.0 0.0 0.0 0.0Aux Clg
ExFlr 26,100-201.8Preheat 28.0 51.97,6510.0 0.0 0.0 0 0.0 0.0 0.0 0.0 0.0 0.0Opt Vent
Roof 26,100 0 0Reheat -209.9 68.051.911,844
Wall 13,800 879 6Humidif 0.0 0 0.0 0.0117.8 1,413.7Total
Opt Vent 0.0 0.00.00
-770.7Total
Envelope LoadsSkylite SolarSkylite CondRoof CondGlass SolarGlass/Door CondWall CondPartition/DoorFloor
InfiltrationSub Total ==>
LightsPeopleMisc
Sub Total ==>
Ceiling LoadVentilation Load
Additional Reheat
OA Preheat Diff.
Ov/Undr SizingExhaust Heat
RA Preheat Diff.
Grand Total ==>
Internal Loads
0
0-63,123
0.008.190.00
-14,037
Supply Air Leakage
97
Dehumid. Ov Sizing 0 0
Adj Air Trans Heat 0 0 0 0 0 Adj Air Trans Heat 0 0 0Leakage Ups
Leakage Dwn
2,4402,440Infil
AHU VentNom Vent
Main FanTerminal
Adjacent Floor
Diffuser
Supply Air LeakageUnderflr Sup Ht Pkup Underflr Sup Ht Pkup
Adjacent Floor0 0 0 0
0 00 0 0
063,635
0 0 0 0
0 0.000 0.00
39,480
39,48039,480
0
7,6517,651
0
0
11,844
11,84411,844
0
7,651
7,651
0
0
0 260,124 0
Int Door 0
Ext Door 0 0 0
TRACE® 700 v6.3 calculated at 02:13 PM on 06/03/2014Project Name:
Dataset Name: Alternative - 1 System Checksums Report Page 1 of 1BLDG 9B.TRC
Page 63
System ChecksumsBy P2S ENGINEERING, INC
Variable Volume Reheat (30% Min Flow Default)Bldg 7 Science
HEATING COIL PEAKCLG SPACE PEAKCOOLING COIL PEAK TEMPERATURES
Heating DesignMo/Hr:7 / 18Mo/Hr:8 / 17Mo/Hr:Peaked at Time: Cooling HeatingSADBOADB: 33OADB:92 / 70 / 79OADB/WB/HR:Outside Air: 54.2 84.7Ra Plenum 79.8 64.0
ReturnPercentCoil PeakSpace PeakSpace PercentPercentNetPlenumSpace 79.8 64.0Ret/OASens. + Lat. Of TotalTot SensSpace SensOf TotalSensibleOf TotalTotalSens. + Lat 35.590.2
0.00.0Fn MtrTDBtu/h (%)Btu/hBtu/h(%)Btu/h(%)Btu/hBtu/h0.00.0Fn BldTDEnvelope Loads0.00.0Fn Frict0Skylite Solar 0.000000000
0Skylite Cond 0.0000000000Roof Cond 3.89-78,7040006172,229172,229
0.00144,245Glass Solar 0011127,8185144,245067,760Glass/Door Cond -134,565 6.65-134,565670,204267,7600
AIRFLOWS
HeatingCooling137,971Wall Cond 11.16-225,835-163,93614158,3076185,20847,23711,039Partition/Door 1.01-20,365-20,365112,361011,039
276Floor 0.19-3,817-3,81700276
Sec Fan0.000Infiltration 000000
24,916 24,916MinStop/Rh
22.90361,291Sub Total ==> -463,286-322,68332369,02919580,757219,466
18,067Return 10,716
Internal Loads
8,69910,039Exhaust
162,498Lights 0.000014162,4987203,12240,624
42,997 14,201Rm Exh
417,838People 0.00019226,09414
00Auxiliary
297,445Misc 0.000025297,44510297,4450
877,780Sub Total ==> 0.000059686,03730918,40540,624
92,457Ceiling Load 0.000-71,172999,78900-92,4570Ventilation Load 44.97-909,833000581,783,0520
Sup. Fan Heat 00
ENGINEERING CKS
HeatingCooling
Ret. Fan Heat 000 % OA 91.986.9
Duct Heat Pkup 000 0.671.64cfm/ft²
18,665Ov/Undr Sizing0.0000
114,249118,665
237.04cfm/ton
Exhaust Heat-2.7956,365
-7-209,582
144.51ft²/ton-54.3583.04Btu/hr·ft²
904No. People1,350,194Grand Total ==> 100.00-2,023,059-393,855100.001,169,103100.003,091,297-41,949
AREAS HEATING COIL SELECTIONCOOLING COIL SELECTIONTotal Capacity Sens Cap. Coil Airflow Enter DB/WB/HR Leave DB/WB/HR Gross Total Glass Coil Airflow Ent LvgCapacity
ton MBh MBh cfm °F °F gr/lb °F °F gr/lb ft² (%) °F°FcfmMBh
Floor 37,226 Main Htg -817.4 24,916 54.2 84.7257.6 3,091.3 2,236.2 60,507 90.2 69.1 77.0 54.2 52.6 58.8Main ClgPart 1,551 Aux Htg 0.0 0.00.000.0 0.0 0.0 0 0.0 0.0 0.0 0.0 0.0 0.0Aux Clg
ExFlr 1,006-1,205.7Preheat 33.0 54.253,0360.0 0.0 0.0 0 0.0 0.0 0.0 0.0 0.0 0.0Opt Vent
Roof 22,709 0 0Reheat -423.5 70.054.224,916
Wall 16,624 3,188 19Humidif 0.0 0 0.0 0.0257.6 3,091.3Total
Opt Vent 0.0 0.00.00
-2,023.1Total
Envelope LoadsSkylite SolarSkylite CondRoof CondGlass SolarGlass/Door CondWall CondPartition/DoorFloor
InfiltrationSub Total ==>
LightsPeopleMisc
Sub Total ==>
Ceiling LoadVentilation Load
Additional Reheat
OA Preheat Diff.
Ov/Undr SizingExhaust Heat
RA Preheat Diff.
Grand Total ==>
Internal Loads
0
-685,093-21,213
33.861.050.00
-209,582
Supply Air Leakage
91
Dehumid. Ov Sizing 0 0
Adj Air Trans Heat 0 0 0 0 0 Adj Air Trans Heat 0 0 0Leakage Ups
Leakage Dwn
00Infil
AHU VentNom Vent
Main FanTerminal
Adjacent Floor
Diffuser
Supply Air LeakageUnderflr Sup Ht Pkup Underflr Sup Ht Pkup
Adjacent Floor0 0 0 0
0 00 0 0
0338
0 0 0 0
0 0.000 0.00
61,063
61,06361,063
0
53,03653,036
0
0
24,916
24,91624,916
0
22,900
22,900
0
0
0 417,838 0
Int Door 0
Ext Door 0 0 0
TRACE® 700 v6.3 calculated at 06:48 AM on 10/03/2014Project Name: MT SAN ANTONIO COLLEGE BLDG 7 RENO
Dataset Name: Alternative - 1 System Checksums Report Page 1 of 14101-BLDG7.TRC
Page 64
System ChecksumsBy P2S Engineering, Inc
Variable Volume Reheat (30% Min Flow Default)bldg 6
HEATING COIL PEAKCLG SPACE PEAKCOOLING COIL PEAK TEMPERATURES
Heating DesignMo/Hr:7 / 16Mo/Hr:8 / 16Mo/Hr:Peaked at Time: Cooling HeatingSADBOADB: 28OADB:95 / 69 / 66OADB/WB/HR:Outside Air: 60.4 84.1Ra Plenum 76.2 63.8
ReturnPercentCoil PeakSpace PeakSpace PercentPercentNetPlenumSpace 77.7 63.8Ret/OASens. + Lat. Of TotalTot SensSpace SensOf TotalSensibleOf TotalTotalSens. + Lat 36.881.7
0.00.1Fn MtrTDBtu/h (%)Btu/hBtu/h(%)Btu/h(%)Btu/hBtu/h0.00.3Fn BldTDEnvelope Loads0.01.0Fn Frict0Skylite Solar 0.000000000
0Skylite Cond 0.0000000000Roof Cond 10.37-167,64500011330,874330,874
0.00122,611Glass Solar 009130,4904122,611026,299Glass/Door Cond -51,125 3.16-51,125226,214126,2990
AIRFLOWS
HeatingCooling78,531Wall Cond 5.66-91,421-62,066578,8604118,18539,654
0Partition/Door 0.000000000Floor 1.17-18,863-18,863000
Sec Fan16.29153,813Infiltration -263,264-263,2649140,7155153,813
29,969 29,969MinStop/Rh
36.64381,254Sub Total ==> -592,319-395,31925376,27925751,782370,528
83,282Return 13,353
Internal Loads
5,9715,971Exhaust
350,168Lights 0.000023350,16815437,71087,542
22,587 22,587Rm Exh
550,559People 0.00019291,47218
00Auxiliary
406,445Misc 0.000027406,44514406,4450
1,307,172Sub Total ==> 0.0000701,048,085471,394,71487,542
72,349Ceiling Load 0.000-135,267577,16400-72,3490Ventilation Load 61.60-995,84400019581,8250
Sup. Fan Heat 5157,356
ENGINEERING CKS
HeatingCooling
Ret. Fan Heat 4130,967130,967 % OA 75.422.6
Duct Heat Pkup 00-218,420 0.290.98cfm/ft²
0Ov/Undr Sizing0.0000
0000
400.61cfm/ton
Exhaust Heat-1.7127,605
-1-24,248
408.17ft²/ton-15.8829.40Btu/hr·ft²
1,157No. People1,760,775Grand Total ==> 100.00-1,616,566-530,586100.001,501,528100.002,992,396274,021
AREAS HEATING COIL SELECTIONCOOLING COIL SELECTIONTotal Capacity Sens Cap. Coil Airflow Enter DB/WB/HR Leave DB/WB/HR Gross Total Glass Coil Airflow Ent LvgCapacity
ton MBh MBh cfm °F °F gr/lb °F °F gr/lb ft² (%) °F°FcfmMBh
Floor 101,784 Main Htg -896.5 29,969 56.9 84.1249.4 2,992.4 2,673.8 99,081 81.7 64.4 64.0 56.9 54.4 59.9Main ClgPart 0 Aux Htg 0.0 0.00.000.0 0.0 0.0 0 0.0 0.0 0.0 0.0 0.0 0.0Aux Clg
ExFlr 943-720.1Preheat 28.0 56.922,5870.0 0.0 0.0 0 0.0 0.0 0.0 0.0 0.0 0.0Opt Vent
Roof 101,784 0 0Reheat -365.9 68.056.929,969
Wall 31,719 2,076 7Humidif 0.0 0 0.0 0.0249.4 2,992.4Total
Opt Vent 0.0 0.00.00
-1,616.6Total
Envelope LoadsSkylite SolarSkylite CondRoof CondGlass SolarGlass/Door CondWall CondPartition/DoorFloor
InfiltrationSub Total ==>
LightsPeopleMisc
Sub Total ==>
Ceiling LoadVentilation Load
Additional Reheat
OA Preheat Diff.
Ov/Undr SizingExhaust Heat
RA Preheat Diff.
Grand Total ==>
Internal Loads
0
0-56,009
0.003.460.00
-24,248
Supply Air Leakage
95
Dehumid. Ov Sizing 0 0
Adj Air Trans Heat 0 0 0 0 0 Adj Air Trans Heat 0 0 0Leakage Ups
Leakage Dwn
5,9715,971Infil
AHU VentNom Vent
Main FanTerminal
Adjacent Floor
Diffuser
Supply Air LeakageUnderflr Sup Ht Pkup Underflr Sup Ht Pkup
Adjacent Floor0 0 0 0
0 00 0 0
00
0 0 0 0
0 0.000 0.00
99,898
99,89899,898
0
22,58722,587
0
0
29,969
29,96929,969
0
22,587
22,587
0
0
0 550,559 0
Int Door 0
Ext Door 0 0 0
TRACE® 700 v6.3 calculated at 10:56 AM on 07/18/2014Project Name:
Dataset Name: Alternative - 1 System Checksums Report Page 1 of 1BLDG 6.TRC
Page 65
System ChecksumsBy P2S Engineering, Inc
Double DuctSystem - 001
HEATING COIL PEAKCLG SPACE PEAKCOOLING COIL PEAK TEMPERATURES
Heating DesignMo/Hr:8 / 18Mo/Hr:8 / 17Mo/Hr:Peaked at Time: Cooling HeatingSADBOADB: 28OADB:94 / 69 / 65OADB/WB/HR:Outside Air: 57.2 75.7Ra Plenum 79.0 64.6
ReturnPercentCoil PeakSpace PeakSpace PercentPercentNetPlenumSpace 79.0 64.6Ret/OASens. + Lat. Of TotalTot SensSpace SensOf TotalSensibleOf TotalTotalSens. + Lat 59.081.4
0.00.1Fn MtrTDBtu/h (%)Btu/hBtu/h(%)Btu/h(%)Btu/hBtu/h0.00.3Fn BldTDEnvelope Loads0.00.9Fn Frict0Skylite Solar 0.000000000
0Skylite Cond 0.0000000000Roof Cond 15.09-121,80500014190,736190,736
0.0070,747Glass Solar 00972,365570,747016,127Glass/Door Cond -32,623 4.04-32,623215,334116,1270
AIRFLOWS
HeatingCooling103,700Wall Cond 22.23-179,402-112,91213108,55912161,24957,548
3,779Partition/Door 0.71-5,694-5,69403,77903,77960,955Floor 11.38-91,831-91,8318460,955
Sec Fan10.2544,338Infiltration -82,720-82,720537,596344,338
0 0MinStop/Rh
63.71299,646Sub Total ==> -514,075-325,78037298,58940547,931248,285
38,877Return 38,877
Internal Loads
1,8761,876Exhaust
133,191Lights 0.000016133,19112166,48933,298
6,800 6,800Rm Exh
237,510People 0.00015123,20518
00Auxiliary
189,257Misc 0.000023189,25714189,2570
559,957Sub Total ==> 0.000055445,65344593,25533,298
66,353Ceiling Load 0.000-44,371867,40400-66,3530Ventilation Load 37.15-299,80700012160,6990
Sup. Fan Heat 564,757
ENGINEERING CKS
HeatingCooling
Ret. Fan Heat 000 % OA 15.515.5
Duct Heat Pkup 000 1.051.05cfm/ft²
934Ov/Undr Sizing0.00-8-8
000934
387.28cfm/ton
Exhaust Heat-0.866,946
-1-10,387
368.64ft²/ton-19.3532.55Btu/hr·ft²
468No. People926,891Grand Total ==> 100.00-806,944-370,158100.00811,646100.001,357,190204,843
AREAS HEATING COIL SELECTIONCOOLING COIL SELECTIONTotal Capacity Sens Cap. Coil Airflow Enter DB/WB/HR Leave DB/WB/HR Gross Total Glass Coil Airflow Ent LvgCapacity
ton MBh MBh cfm °F °F gr/lb °F °F gr/lb ft² (%) °F°FcfmMBh
Floor 41,693 Main Htg -806.9 43,801 59.0 75.7113.1 1,357.2 1,230.8 43,711 81.4 64.2 63.7 55.8 53.9 59.4Main ClgPart 3,063 Aux Htg 0.0 0.00.000.0 0.0 0.0 0 0.0 0.0 0.0 0.0 0.0 0.0Aux Clg
ExFlr 22,6140.0Preheat 0.0 0.000.0 0.0 0.0 0 0.0 0.0 0.0 0.0 0.0 0.0Opt Vent
Roof 22,614 0 0Wall 15,054 1,314 9
Humidif 0.0 0 0.0 0.0113.1 1,357.2Total
Opt Vent 0.0 0.00.00
-806.9Total
Envelope LoadsSkylite SolarSkylite CondRoof CondGlass SolarGlass/Door CondWall CondPartition/DoorFloor
InfiltrationSub Total ==>
LightsPeopleMisc
Sub Total ==>
Ceiling LoadVentilation Load
Additional Reheat
OA Preheat Diff.
Ov/Undr SizingExhaust Heat
RA Preheat Diff.
Grand Total ==>
Internal Loads
0
00
0.000.000.00
-10,387
Supply Air Leakage
92
Dehumid. Ov Sizing 0 0
Adj Air Trans Heat 0 0 0 0 0 Adj Air Trans Heat 0 0 0Leakage Ups
Leakage Dwn
1,8761,876Infil
AHU VentNom Vent
Main FanTerminal
Adjacent Floor
Diffuser
Supply Air LeakageUnderflr Sup Ht Pkup Underflr Sup Ht Pkup
Adjacent Floor0 0 0 0
0 00 0 0
060,955
0 0 0 0
0 0.000 0.00
43,801
43,80143,801
0
6,8006,800
0
0
43,801
43,80143,801
0
6,800
6,800
0
0
0 237,510 0
Int Door 0
Ext Door 0 0 0
TRACE® 700 v6.3 calculated at 02:58 PM on 06/03/2014Project Name:
Dataset Name: Alternative - 1 System Checksums Report Page 1 of 1BLDG 4.TRC
Page 66
System ChecksumsBy P2S Engineering, Inc
Variable Volume Reheat (30% Min Flow Default)Recital Hall
HEATING COIL PEAKCLG SPACE PEAKCOOLING COIL PEAK TEMPERATURES
Heating DesignMo/Hr:9 / 16Mo/Hr:8 / 17Mo/Hr:Peaked at Time: Cooling HeatingSADBOADB: 28OADB:92 / 70 / 79OADB/WB/HR:Outside Air: 55.0 89.8Ra Plenum 77.1 63.2
ReturnPercentCoil PeakSpace PeakSpace PercentPercentNetPlenumSpace 77.1 63.2Ret/OASens. + Lat. Of TotalTot SensSpace SensOf TotalSensibleOf TotalTotalSens. + Lat 28.081.6
0.00.0Fn MtrTDBtu/h (%)Btu/hBtu/h(%)Btu/h(%)Btu/hBtu/h0.00.0Fn BldTDEnvelope Loads0.00.0Fn Frict0Skylite Solar 0.000000000
0Skylite Cond 0.0000000000Roof Cond 19.66-95,85100016134,426134,426
0.0047,395Glass Solar 001357,196547,395019,374Glass/Door Cond -49,134 10.08-49,134419,536219,3740
AIRFLOWS
HeatingCooling19,446Wall Cond 6.16-30,033-24,155417,853324,2444,797
0Partition/Door 0.000000000Floor 6.39-31,181-31,181000
Sec Fan0.000Infiltration 000000
7,242 7,242MinStop/Rh
42.2886,216Sub Total ==> -206,198-104,4692194,58526225,439139,224
24,137Return 7,242
Internal Loads
7,2427,500Exhaust
112,464Lights 0.000026112,46416140,57928,116
0 0Rm Exh
225,000People 0.00028125,00026
00Auxiliary
78,100Misc 0.00001878,100978,1000
415,563Sub Total ==> 0.000072315,56351443,67928,116
36,716Ceiling Load 0.000-49,086730,47900-36,7160Ventilation Load 66.97-326,60100027234,7690
Sup. Fan Heat 00
ENGINEERING CKS
HeatingCooling
Ret. Fan Heat 000 % OA 100.031.1
Duct Heat Pkup 000 0.321.05cfm/ft²
0Ov/Undr Sizing0.0000
0000
335.59cfm/ton
Exhaust Heat-10.8052,644
-5-40,782
318.15ft²/ton-21.3137.72Btu/hr·ft²
500No. People538,495Grand Total ==> 100.00-487,646-153,555100.00440,627100.00863,10689,842
AREAS HEATING COIL SELECTIONCOOLING COIL SELECTIONTotal Capacity Sens Cap. Coil Airflow Enter DB/WB/HR Leave DB/WB/HR Gross Total Glass Coil Airflow Ent LvgCapacity
ton MBh MBh cfm °F °F gr/lb °F °F gr/lb ft² (%) °F°FcfmMBh
Floor 22,883 Main Htg -270.2 7,242 55.0 89.871.9 863.1 686.7 24,021 81.6 64.9 68.9 55.0 52.7 58.1Main ClgPart 0 Aux Htg 0.0 0.00.000.0 0.0 0.0 0 0.0 0.0 0.0 0.0 0.0 0.0Aux Clg
ExFlr 928-217.5Preheat 28.0 55.07,5000.0 0.0 0.0 0 0.0 0.0 0.0 0.0 0.0 0.0Opt Vent
Roof 22,883 0 0Reheat -116.6 70.055.07,242
Wall 17,632 1,141 6Humidif 0.0 0 0.0 0.071.9 863.1Total
Opt Vent 0.0 0.00.00
-487.7Total
Envelope LoadsSkylite SolarSkylite CondRoof CondGlass SolarGlass/Door CondWall CondPartition/DoorFloor
InfiltrationSub Total ==>
LightsPeopleMisc
Sub Total ==>
Ceiling LoadVentilation Load
Additional Reheat
OA Preheat Diff.
Ov/Undr SizingExhaust Heat
RA Preheat Diff.
Grand Total ==>
Internal Loads
0
-7,4900
1.540.000.00
-40,782
Supply Air Leakage
93
Dehumid. Ov Sizing 0 0
Adj Air Trans Heat 0 0 0 0 0 Adj Air Trans Heat 0 0 0Leakage Ups
Leakage Dwn
00Infil
AHU VentNom Vent
Main FanTerminal
Adjacent Floor
Diffuser
Supply Air LeakageUnderflr Sup Ht Pkup Underflr Sup Ht Pkup
Adjacent Floor0 0 0 0
0 00 0 0
00
0 0 0 0
0 0.000 0.00
24,137
24,13724,137
0
7,5007,500
0
0
7,242
7,2427,242
0
7,242
7,242
0
0
0 225,000 0
Int Door 0
Ext Door 0 0 0
TRACE® 700 v6.3 calculated at 04:16 PM on 07/16/2014Project Name: Mt SAC Bldg 2
Dataset Name: Alternative - 1 System Checksums Report Page 1 of 2MT SAC BLDG 2.TRC
Page 67
System ChecksumsBy P2S Engineering, Inc
Variable Volume Reheat (30% Min Flow Default)Studio
HEATING COIL PEAKCLG SPACE PEAKCOOLING COIL PEAK TEMPERATURES
Heating DesignMo/Hr:7 / 17Mo/Hr:8 / 17Mo/Hr:Peaked at Time: Cooling HeatingSADBOADB: 28OADB:92 / 70 / 79OADB/WB/HR:Outside Air: 55.0 85.4Ra Plenum 77.3 63.1
ReturnPercentCoil PeakSpace PeakSpace PercentPercentNetPlenumSpace 77.3 63.1Ret/OASens. + Lat. Of TotalTot SensSpace SensOf TotalSensibleOf TotalTotalSens. + Lat 28.082.7
0.00.0Fn MtrTDBtu/h (%)Btu/hBtu/h(%)Btu/h(%)Btu/hBtu/h0.00.0Fn BldTDEnvelope Loads0.00.0Fn Frict0Skylite Solar 0.000000000
0Skylite Cond 0.0000000000Roof Cond 20.45-169,13100015236,829236,829
0.0032,144Glass Solar 00429,909232,144013,839Glass/Door Cond -35,063 4.24-35,063215,606113,8390
AIRFLOWS
HeatingCooling27,027Wall Cond 4.88-40,351-32,719427,075233,4216,394
0Partition/Door 0.000000000Floor 5.17-42,806-42,806000
Sec Fan0.000Infiltration 000000
12,019 12,019MinStop/Rh
34.7473,010Sub Total ==> -287,352-110,5881072,59121316,233243,223
40,063Return 12,019
Internal Loads
12,01915,000Exhaust
198,938Lights 0.000027198,93816248,67349,735
0 0Rm Exh
450,000People 0.00034250,00029
00Auxiliary
138,151Misc 0.000019138,1519138,1510
787,089Sub Total ==> 0.000080587,08955836,82449,735
67,542Ceiling Load 0.000-88,1041071,67000-67,5420Ventilation Load 65.53-542,08000030460,3140
Sup. Fan Heat 00
ENGINEERING CKS
HeatingCooling
Ret. Fan Heat 000 % OA 100.037.4
Duct Heat Pkup 000 0.300.99cfm/ft²
0Ov/Undr Sizing0.0000
0000
314.52cfm/ton
Exhaust Heat-10.7288,660
-6-84,823
317.78ft²/ton-20.4437.76Btu/hr·ft²
1,000No. People927,641Grand Total ==> 100.00-827,187-198,692100.00731,350100.001,528,549140,593
AREAS HEATING COIL SELECTIONCOOLING COIL SELECTIONTotal Capacity Sens Cap. Coil Airflow Enter DB/WB/HR Leave DB/WB/HR Gross Total Glass Coil Airflow Ent LvgCapacity
ton MBh MBh cfm °F °F gr/lb °F °F gr/lb ft² (%) °F°FcfmMBh
Floor 40,478 Main Htg -392.3 12,019 55.0 85.4127.4 1,528.6 1,184.9 39,860 82.7 65.5 70.4 55.0 52.7 57.7Main ClgPart 0 Aux Htg 0.0 0.00.000.0 0.0 0.0 0 0.0 0.0 0.0 0.0 0.0 0.0Aux Clg
ExFlr 1,274-434.9Preheat 28.0 55.015,0000.0 0.0 0.0 0 0.0 0.0 0.0 0.0 0.0 0.0Opt Vent
Roof 40,478 0 0Reheat -193.6 70.055.012,019
Wall 22,950 814 4Humidif 0.0 0 0.0 0.0127.4 1,528.6Total
Opt Vent 0.0 0.00.00
-827.2Total
Envelope LoadsSkylite SolarSkylite CondRoof CondGlass SolarGlass/Door CondWall CondPartition/DoorFloor
InfiltrationSub Total ==>
LightsPeopleMisc
Sub Total ==>
Ceiling LoadVentilation Load
Additional Reheat
OA Preheat Diff.
Ov/Undr SizingExhaust Heat
RA Preheat Diff.
Grand Total ==>
Internal Loads
0
-86,4160
10.450.000.00
-84,823
Supply Air Leakage
94
Dehumid. Ov Sizing 0 0
Adj Air Trans Heat 0 0 0 0 0 Adj Air Trans Heat 0 0 0Leakage Ups
Leakage Dwn
00Infil
AHU VentNom Vent
Main FanTerminal
Adjacent Floor
Diffuser
Supply Air LeakageUnderflr Sup Ht Pkup Underflr Sup Ht Pkup
Adjacent Floor0 0 0 0
0 00 0 0
00
0 0 0 0
0 0.000 0.00
40,063
40,06340,063
0
15,00015,000
0
0
12,019
12,01912,019
0
12,019
12,019
0
0
0 450,000 0
Int Door 0
Ext Door 0 0 0
TRACE® 700 v6.3 calculated at 04:16 PM on 07/16/2014Project Name: Mt SAC Bldg 2
Dataset Name: Alternative - 1 System Checksums Report Page 2 of 2MT SAC BLDG 2.TRC
Page 68
System ChecksumsBy P2S Engineering, Inc
Fan CoilSystem - 001
HEATING COIL PEAKCLG SPACE PEAKCOOLING COIL PEAK TEMPERATURES
Heating DesignMo/Hr:Sum ofMo/Hr:9 / 15Mo/Hr:Peaked at Time: Cooling HeatingSADBOADB: 28OADB:97 / 69 / 63OADB/WB/HR:Outside Air: 55.0 78.8Ra Plenum 81.5 62.9
ReturnPercentCoil PeakSpace PeakSpace PercentPercentNetPlenumSpace 81.5 62.9Ret/OASens. + Lat. Of TotalTot SensSpace SensOf TotalSensibleOf TotalTotalSens. + Lat 43.890.0
0.00.1Fn MtrTDBtu/h (%)Btu/hBtu/h(%)Btu/h(%)Btu/hBtu/h0.00.3Fn BldTDEnvelope Loads0.01.0Fn Frict0Skylite Solar 0.000000000
0Skylite Cond 0.0000000000Roof Cond 6.49-47,2290001090,02790,027
0.0043,584Glass Solar 001560,972543,584024,102Glass/Door Cond -45,746 6.29-45,746521,207324,1020
AIRFLOWS
HeatingCooling87,571Wall Cond 15.36-111,754-70,8122286,52316136,78749,216
0Partition/Door 0.000000000Floor 5.35-38,894-38,894000
Sec Fan5.8730,523Infiltration -42,685-42,685622,186330,523
0 0MinStop/Rh
39.35185,781Sub Total ==> -286,308-198,13748190,88737325,024139,243
11,007Return 11,007
Internal Loads
2,4432,443Exhaust
59,478Lights 0.00001559,478874,34714,869
8,845 8,845Rm Exh
90,182People 0.0001247,87010
00Auxiliary
56,174Misc 0.00001456,174656,1740
205,834Sub Total ==> 0.000041163,52225220,70314,869
38,497Ceiling Load 0.000-26,1411041,04200-38,4970Ventilation Load 62.54-455,00100037325,3610
Sup. Fan Heat 329,990
ENGINEERING CKS
HeatingCooling
Ret. Fan Heat 000 % OA 54.754.7
Duct Heat Pkup 00-41,629 1.171.17cfm/ft²
0Ov/Undr Sizing0.0000
0000
257.27cfm/ton
Exhaust Heat-1.8913,768
-2-20,277
219.84ft²/ton-45.0954.59Btu/hr·ft²
179No. People430,112Grand Total ==> 100.00-727,541-224,278100.00395,451100.00880,80253,710
AREAS HEATING COIL SELECTIONCOOLING COIL SELECTIONTotal Capacity Sens Cap. Coil Airflow Enter DB/WB/HR Leave DB/WB/HR Gross Total Glass Coil Airflow Ent LvgCapacity
ton MBh MBh cfm °F °F gr/lb °F °F gr/lb ft² (%) °F°FcfmMBh
Floor 16,136 Main Htg -727.5 18,884 43.8 78.873.4 880.8 768.7 18,884 91.4 66.5 58.5 53.0 50.8 52.2Main ClgPart 0 Aux Htg 0.0 0.00.000.0 0.0 0.0 0 0.0 0.0 0.0 0.0 0.0 0.0Aux Clg
ExFlr 1,332-161.1Preheat 43.8 51.618,8840.0 0.0 0.0 0 0.0 0.0 0.0 0.0 0.0 0.0Opt Vent
Roof 16,922 0 0Wall 23,800 1,155 5
Humidif 0.0 0 0.0 0.073.4 880.8Total
Opt Vent 0.0 0.00.00
-727.5Total
Envelope LoadsSkylite SolarSkylite CondRoof CondGlass SolarGlass/Door CondWall CondPartition/DoorFloor
InfiltrationSub Total ==>
LightsPeopleMisc
Sub Total ==>
Ceiling LoadVentilation Load
Additional Reheat
OA Preheat Diff.
Ov/Undr SizingExhaust Heat
RA Preheat Diff.
Grand Total ==>
Internal Loads
0
00
0.000.000.00
-20,277
Supply Air Leakage
Peaks
Dehumid. Ov Sizing 0 0
Adj Air Trans Heat 0 0 0 0 0 Adj Air Trans Heat 0 0 0Leakage Ups
Leakage Dwn
968968Infil
AHU VentNom Vent
Main FanTerminal
Adjacent Floor
Diffuser
Supply Air LeakageUnderflr Sup Ht Pkup Underflr Sup Ht Pkup
Adjacent Floor0 0 0 0
0 00 0 0
00
0 0 0 0
0 0.000 0.00
18,884
18,88418,884
0
10,32010,320
0
0
18,884
18,88418,884
0
10,320
10,320
0
0
0 90,182 0
Int Door 0
Ext Door 0 0 0
TRACE® 700 v6.3 calculated at 03:22 PM on 07/16/2014Project Name:
Dataset Name: Alternative - 1 System Checksums Report Page 1 of 1Bldg 1 BC.trc
Page 69
System ChecksumsBy P2S Engineering, Inc
Variable Volume Reheat (30% Min Flow Default)System - 001
HEATING COIL PEAKCLG SPACE PEAKCOOLING COIL PEAK TEMPERATURES
Heating DesignMo/Hr:9 / 16Mo/Hr:9 / 16Mo/Hr:Peaked at Time: Cooling HeatingSADBOADB: 28OADB:96 / 70 / 67OADB/WB/HR:Outside Air: 54.0 113.1Ra Plenum 78.6 58.9
ReturnPercentCoil PeakSpace PeakSpace PercentPercentNetPlenumSpace 78.6 58.9Ret/OASens. + Lat. Of TotalTot SensSpace SensOf TotalSensibleOf TotalTotalSens. + Lat 37.882.2
0.00.0Fn MtrTDBtu/h (%)Btu/hBtu/h(%)Btu/h(%)Btu/hBtu/h0.00.0Fn BldTDEnvelope Loads0.00.0Fn Frict0Skylite Solar 0.000000000
0Skylite Cond 0.0000000000Roof Cond 4.94-24,569000536,40836,408
0.0032,396Glass Solar 00832,396432,396024,889Glass/Door Cond -49,434 9.94-49,434624,889324,8890
AIRFLOWS
HeatingCooling97,470Wall Cond 26.28-130,752-88,4522397,47021151,52354,053
0Partition/Door 0.0000000040,716Floor 12.79-63,634-63,6349640,716
Sec Fan8.5126,248Infiltration -42,337-42,337523,698426,248
5,880 5,880MinStop/Rh
62.46221,719Sub Total ==> -310,726-243,85751219,16943312,18090,461
15,591Return 1,872
Internal Loads
00Exhaust
50,157Lights 0.00001250,157962,69712,539
4,968 4,968Rm Exh
188,710People 0.0002086,50626
00Auxiliary
51,297Misc 0.00001251,297751,2970
290,165Sub Total ==> 0.000044187,96142302,70412,539
24,249Ceiling Load 0.000-48,112624,24900-24,2490Ventilation Load 35.52-176,71000015109,5580
Sup. Fan Heat 00
ENGINEERING CKS
HeatingCooling
Ret. Fan Heat 000 % OA 68.220.5
Duct Heat Pkup 000 0.351.17cfm/ft²
0Ov/Undr Sizing0.0000
0000
324.64cfm/ton
Exhaust Heat0.000
00
276.63ft²/ton-29.7943.38Btu/hr·ft²
334No. People536,133Grand Total ==> 100.00-497,496-291,969100.00431,378100.00724,44278,751
AREAS HEATING COIL SELECTIONCOOLING COIL SELECTIONTotal Capacity Sens Cap. Coil Airflow Enter DB/WB/HR Leave DB/WB/HR Gross Total Glass Coil Airflow Ent LvgCapacity
ton MBh MBh cfm °F °F gr/lb °F °F gr/lb ft² (%) °F°FcfmMBh
Floor 16,700 Main Htg -382.5 5,880 54.0 113.160.4 724.4 609.0 19,599 82.2 64.7 64.3 54.0 52.2 55.8Main ClgPart 0 Aux Htg 0.0 0.00.000.0 0.0 0.0 0 0.0 0.0 0.0 0.0 0.0 0.0Aux Clg
ExFlr 16,700-115.0Preheat 28.0 54.04,0080.0 0.0 0.0 0 0.0 0.0 0.0 0.0 0.0 0.0Opt Vent
Roof 16,700 0 0Reheat -90.5 68.054.05,880
Wall 13,056 2,007 15Humidif 0.0 0 0.0 0.060.4 724.4Total
Opt Vent 0.0 0.00.00
-497.5Total
Envelope LoadsSkylite SolarSkylite CondRoof CondGlass SolarGlass/Door CondWall CondPartition/DoorFloor
InfiltrationSub Total ==>
LightsPeopleMisc
Sub Total ==>
Ceiling LoadVentilation Load
Additional Reheat
OA Preheat Diff.
Ov/Undr SizingExhaust Heat
RA Preheat Diff.
Grand Total ==>
Internal Loads
0
0-10,061
0.002.020.00
0
Supply Air Leakage
96
Dehumid. Ov Sizing 0 0
Adj Air Trans Heat 0 0 0 0 0 Adj Air Trans Heat 0 0 0Leakage Ups
Leakage Dwn
960960Infil
AHU VentNom Vent
Main FanTerminal
Adjacent Floor
Diffuser
Supply Air LeakageUnderflr Sup Ht Pkup Underflr Sup Ht Pkup
Adjacent Floor0 0 0 0
0 00 0 0
040,716
0 0 0 0
0 0.000 0.00
19,599
19,59919,599
0
4,0084,008
0
0
5,880
5,8805,880
0
4,008
4,008
0
0
0 188,710 0
Int Door 0
Ext Door 0 0 0
TRACE® 700 v6.3 calculated at 03:50 PM on 06/03/2014Project Name: 7190
Dataset Name: Alternative - 1 System Checksums Report Page 1 of 1BUILDING 1A.TRC
Page 70
Clg (Tons) Htg (Btuh) Htg (Btuh) Clg (Tons) Htg (Btuh) Htg (Btuh)
0.0 -50,942 -57,099 0.0 -150,780 -172,6650.0 -58,174 -58,591 0.0 -159,973 -279,4110.0 -60,813 -61,048 0.0 -167,970 -368,0590.0 -62,087 -62,105 0.0 -177,679 -555,7730.0 -64,528 -64,820 0.0 -260,622 -592,1920.0 -68,260 -68,260 0.0 -460,923 -725,027
119.1 -3,716,369 -69,260 0.0 -524,793 -5,174,180158.8 -3,075,568 -112,858 0.0 -570,453 -5,609,531191.3 -5,578,631 -85,692 0.0 -342,994 -9,094,361268.9 -3,138,227 -12,787 0.0 -76,552 -6,121,551412.6 -1,746,708 -4,167 0.0 -45,544 -5,404,493535.8 -1,363,338 0 0.0 -31,126 -4,064,611555.9 -1,863,010 0 0.0 -12,591 -3,501,278653.0 -1,051,145 0 0.0 -8,679 -1,855,952701.9 -866,716 0 0.0 -5,015 -1,114,785691.2 -817,335 0 0.0 -2,188 -1,000,481650.6 -982,225 0 0.0 0 -1,164,450558.3 -1,664,534 -3,809 0.0 -3,809 -1,742,859511.6 -1,559,650 -7,887 0.0 -7,887 -1,636,895499.1 -1,705,181 -10,971 0.0 -13,826 -1,773,210505.3 -1,779,719 -15,255 0.0 -20,603 -1,824,328
0.0 -15,572 -24,298 0.0 -33,118 -15,5720.0 -32,037 -30,567 0.0 -41,740 -32,0370.0 -45,907 -61,038 0.0 -75,158 -45,907
Clg (Tons) Htg (Btuh) Htg (Btuh) Clg (Tons) Htg (Btuh) Htg (Btuh)
0.0 -41,131 -50,927 0.0 -33,612 -33,6120.0 -54,252 -55,020 0.0 -71,753 -88,6540.0 -55,017 -55,428 0.0 -144,341 -144,3410.0 -57,700 -57,858 0.0 -150,899 -150,8990.0 -61,259 -61,364 0.0 -166,714 -166,7140.0 -62,536 -62,700 0.0 -173,178 -292,740
132.9 -3,334,128 -62,682 0.0 -175,856 -4,687,844177.1 -2,313,537 -43,015 0.0 -145,383 -5,253,593282.8 -4,359,135 -20,953 0.0 -20,953 -7,990,228364.3 -2,340,735 -7,111 0.0 -7,111 -5,577,259555.3 -1,254,651 0 0.0 0 -4,941,617650.4 -1,088,175 0 0.0 0 -2,967,627661.9 -1,506,037 0 0.0 0 -2,626,807779.7 -833,779 0 0.0 0 -1,108,988834.6 -719,549 0 0.0 0 -841,263840.0 -735,672 0 0.0 0 -864,857783.1 -834,946 0 0.0 0 -936,857653.6 -1,425,553 0 0.0 0 -1,538,631598.1 -1,480,284 0 0.0 0 -1,484,098562 9
0 0559.6 -1,638,615 -8,757 0.0 -8,757 -1,694,8990.0 -11,340 -13,257 0.0 -13,257 -11,3400.0 -22,786 -17,158 0.0 -17,158 -22,7860.0 -34,822 -25,077 0.0 -25,077 -34,822
Clg (Tons) Htg (Btuh) Htg (Btuh) Clg (Tons) Htg (Btuh) Htg (Btuh)
0.0 -38,528 -47,191 0.0 -19,229 -19,2290.0 -52,615 -53,969 0.0 -28,119 -28,1190.0 -55,036 -55,409 0.0 -35,812 -35,8120.0 -57,640 -57,901 0.0 -93,032 -122,5270.0 -61,291 -61,349 0.0 -154,383 -154,3300.0 -62,491 -62,688 0.0 -168,491 -168,487
138.8 -2,986,104 -53,516 0.0 -140,415 -4,218,396186.5 -1,973,151 -33,583 0.0 -62,425 -4,226,307311.1 -3,849,129 -14,930 0.0 -14,882 -7,314,868388.5 -1,707,128 0 0.0 0 -4,943,933589.3 -1,041,085 0 0.0 0 -3,562,012704.3 -944,959 0 0.0 0 -2,233,314706.8 -1,192,948 0 0.0 0 -1,507,694838.6 -718,584 0 0.0 0 -770,265906.0 -702,695 0 0.0 0 -783,508917.4 -672,044 0 0.0 0 -746,074852.8 -742,537 0 0.0 0 -806,632706.3 -1,112,461 0 0.0 0 -1,219,315635.0 -1,381,145 0 0.0 0 -1,378,395591.0 -1,529,017 0 0.0 0 -1,533,996585.4 -1,586,631 0 0.0 0 -1,591,754
0.0 -10,113 -4,433 0.0 -4,433 -10,1130.0 -19,651 -11,046 0.0 -11,046 -19,6510.0 -33,240 -14,494 0.0 -14,494 -33,240
Clg (Tons) Htg (Btuh) Htg (Btuh) Clg (Tons) Htg (Btuh) Htg (Btuh)
0.0 -21,968 -29,825 0.0 -5,352 -5,3520.0 -31,624 -38,822 0.0 -7,647 -7,6470.0 -42,074 -43,959 0.0 -12,740 -12,7400.0 -47,339 -47,527 0.0 -18,084 -18,0840.0 -50,855 -51,163 0.0 -24,407 -24,3370.0 -51,455 -51,784 0.0 -29,463 -29,461
148.0 -1,894,210 -30,666 0.0 -18,890 -2,037,466204.8 -1,091,733 -9,859 0.0 -8,784 -2,552,496436.7 -1,308,610 0 0.0 0 -3,755,069568.1 -771,938 0 0.0 0 -1,716,939728.4 -613,658 0 0.0 0 -666,048852.6 -613,741 0 0.0 0 -634,308877.0 -799,187 0 0.0 0 -818,535
1,024.9 -636,712 0 0.0 0 -635,3821,150.5 -575,515 0 0.0 0 -574,9361,946.6 -563,491 0 0.0 0 -556,6311,650.3 -638,960 0 0.0 0 -632,334902.7 -834,906 0 0.0 0 -831,922727.7 -813,856 0 0.0 0 -806,268669.9 -1,245,033 0 0.0 0 -1,245,058661.0 -1,340,723 0 0.0 0 -1,359,052
0.0 -8,232 0 0.0 0 -8,2320.0 -12,211 0 0.0 0 -12,2110.0 -21,633 -3,721 0.0 -3,721 -21,633
0.023 60.022 61.0 56.0 -4,169 0.0 0.0
0.0
575.313 71.0 58.6 -704,656 552.7 0.0 550.5
343.411 68.0 56.6 -540,186 505.0 0.0 494.510
12 70.0 57.5 -544,503 584.8 0.0
64.0 54.6 -593,036 317.6 0.0
0.023 57.0 52.8 -8,272 0.0 0.0 0.022 59.0 54.0 -6,406 0.0 0.0
400.821 61.0 54.2 -1,101,331 414.2 0.0 403.920 62.0 54.4 -817,055 408.1 0.0
163.711 61.0 51.2 -662,709 268.0 0.0 264.1
71.19 53.0 47.0 -2,902,912 38.9 0.0 46.68
10 59.0 49.7 -1,539,073 158.1 0.0
52.0 46.6 -2,260,465 76.1 0.0
374.519 62.0 54.1 -784,695 399.2 0.0 382.318 63.0
0.07 51.0 46.2 -3,360,767 60.6 0.0 54.3
380.821 60.0 53.2 -1,247,117 391.8 0.0 384.9
389.2 -4,496 0.0 -4,496 0.0 -1,638,31020 61.0 53.7 -836,048 -1,624,826
287.513 64.0 53.2 -818,002 290.9 0.0 296.412 62.0 52.0 -645,746 289.7 0.0
54.2 -747,635 384.9 0.0
16 65.0 54.5 -521,420 391.0 0.0
408.615 67.0
143.811 60.0 50.6 -858,091 216.1 0.0 217.210 58.0 49.4 -1,934,161 129.9 0.0
1 53.0 47.8 -34,621 0.0 0.0 0.0
8 51.0 41.2 -2,846,041 72.0 0.0 56.29 53.0 42.2 -3,662,418
Design Weekday Saturday Sunday Monday24 53.0
Hour OADB OAWB Htg (Btuh) Clg (Tons) Clg (Tons)
47.9 -25,918 0.0 0.0
233.813 62.012 60.0 49.9 -804,857 231.2 0.0
19 61.0 51.9 -817,306 375.8 0.0 364.618 62.0 52.3 -797,064 357.9 0.0
342.417 63.0 52.8 -620,282 366.2 0.0 355.016 64.0
BUILDING COOL HEAT DEMANDBy P2S ENGINEERING, INC
January Typical Weather (°F) Design Weekday Saturday Sunday Monday
0.03 51.0 45.5 0 0.0 0.0 0.0
Clg (Tons)
1 52.0 47.1 0 0.0 0.0 0.0
Hour OADB OAWB Htg (Btuh) Clg (Tons) Clg (Tons)
2
0.0
0.0
55.4 -2,963 0.0 0.0 0.00.0
May Typical Weather (°F) Design Weekday Saturday Sunday Monday24 59.0 55.0 -6,098
59.0 -572,842 620.4 0.0
581.3
20 64.0 57.0 -772,840 465.3 0.0 466.221 62.0 56.2 -812,830 464.7 0.0 465.7
514.219 65.0 57.3 -727,985 494.5 0.0 492.618 66.0 57.6 -668,352 537.1
0.0 119.86 54.0 50.2 -31,027 0.0 0.0
156.0
16 69.0 68.6 -334,543 595.1 0.017 68.0 68.1 -526,652 604.8 0.0 572.8
601.615 70.0 59.0 -503,668 618.2 0.0 604.914 71.0
9 60.0 53.0 -1,656,532 220.4 0.0 198.7
4 55.0 51.3 -31,286 0.0 0.05 54.0 50.3 -32,270 0.0 0.0 0.0
8 58.0 52.0 -1,144,390 145.0 0.0
0.07 55.0 50.2 -2,502,893 106.3
0.03 56.0 52.0 -29,278 0.0 0.0 0.02 57.0 53.2 -26,409 0.0 0.0
0.0
0.0
Hour OADB OAWB Htg (Btuh) Clg (Tons) Clg (Tons)
0.0April Typical Weather (°F) Design Weekday Saturday Sunday Monday24 55.0 51.8 -18,991 0.0 0.0
Clg (Tons)
1 58.0 54.0 -20,462 0.0 0.0
18 64.0 55.0 -719,882 415.5 0.0 407.319 63.0 54.9 -768,084 423.5 0.0 407.7
412.317 65.0 55.2 -565,048 437.1 0.0 420.616 66.0 55.5 -502,612 430.3 0.0
14 68.0 55.5 -592,171 472.7 0.015 66.0 55.0 -516,843 429.6 0.0 413.3
330.313 65.0 53.8 -776,406 335.9 0.0 338.912 63.0 52.7 -600,661 336.5 0.0
456.5
6 51.0 47.0 -42,200 0.0 0.0
0.05 51.0 47.8 -42,966 0.0 0.0 0.04 52.0 48.8 -41,922 0.0 0.0
2 53.0 49.9 -37,090 0.0 0.03 53.0 49.2 -39,723 0.0 0.0 0.0
Clg (Tons)
1 54.0 50.5 -32,257 0.0 0.0 0.0
Hour OADB OAWB Htg (Btuh) Clg (Tons) Clg (Tons)
0.0
Monday24 55.0 50.4 -19,961 0.0 0.0
0.023 56.0 51.3 -9,909 0.0 0.0 0.022 58.0 52.5 -7,336 0.0 0.0
0.0March Typical Weather (°F) Design Weekday Saturday Sunday
55.1 -536,746 445.5 0.0 426.414 67.0 54.9 -613,542 423.7 0.0
374.217 64.0 54.5 -587,430 400.1 0.0 382.6
37.2 0.0 47.6
0.07 51.0 41.2 -3,561,349 59.9 0.0 45.56 51.0 41.2 -42,509 0.0 0.0
4 52.0 42.4 -41,927 0.0 0.05 51.0 41.7 -42,972 0.0 0.0 0.0
0.03 53.0 43.0 -40,048 0.0 0.0 0.02 53.0 43.3 -37,558 0.0 0.0
0.0
0.022 54.0 48.7 -9,558 0.0 0.0 0.023 54.0 48.3 -16,436 0.0 0.0
Clg (Tons)
365.421 58.0 50.5 -1,514,024 376.6 0.0 371.020 60.0 51.5 -1,131,787 370.6 0.0
0.0February Typical Weather (°F)
53.1 -548,145 353.6 0.0
353.1
51.6 -891,277 234.0 0.0 242.6326.2
15 65.0 53.7 -562,027 380.8 0.0 371.314 64.0 53.1 -634,329 333.6 0.0
0.0
0.0
10 56.0 46.8 -3,234,412 80.4 0.0 86.911 58.0 48.3 -1,557,266 156.2 0.0 153.8
43.89 52.0 44.9 -6,620,819 27.8 0.0 32.98 49.0 43.5 -3,739,645 66.8 0.0
52.0 46.1 0 0.0 0.0
6 49.0 43.5 0 0.0 0.07 49.0 43.5 -4,551,945 58.3 0.0 39.0
0.05 50.0 43.9 0 0.0 0.0 0.04 51.0 44.9 0 0.0
Monica Amalfitano
Text Box
Diversified to match trends
Page 71
Clg (Tons) Htg (Btuh) Htg (Btuh) Clg (Tons) Htg (Btuh) Htg (Btuh)
0.0 0 0 0.0 0 00.0 0 0 0.0 0 00.0 0 0 0.0 0 00.0 0 0 0.0 0 00.0 0 -3,616 0.0 0 00.0 0 -4,331 0.0 0 0
200.4 -327,273 0 0.0 0 -126,642304.1 -408,013 0 0.0 0 -251,910888.2 -552,764 0 0.0 0 -404,970
1,071.3 -537,860 0 0.0 0 -460,8631,174.9 -521,823 0 0.0 0 -467,7901,312.3 -528,980 0 0.0 0 -491,6381,351.9 -660,071 0 0.0 0 -611,0501,442.7 -560,707 0 0.0 0 -524,0241,505.3 -505,516 0 0.0 0 -490,9871,511.7 -490,716 0 0.0 0 -486,0131,358.1 -541,052 0 0.0 0 -532,9381,151.7 -673,036 0 0.0 0 -664,683855.3 -714,705 0 0.0 0 -708,834760.9 -759,879 0 0.0 0 -755,272752.8 -796,059 0 0.0 0 -789,304
0.0 -3,824 0 0.0 0 -3,8240.0 0 0 0.0 0 00.0 0 0 0.0 0 0
Clg (Tons) Htg (Btuh) Htg (Btuh) Clg (Tons) Htg (Btuh) Htg (Btuh)
0.0 0 0 0.0 0 00.0 0 0 0.0 0 00.0 0 0 0.0 0 00.0 0 0 0.0 0 00.0 0 0 0.0 0 00.0 0 0 0.0 0 0
297.2 -255,751 0 0.0 0 -82,172516.7 -367,263 0 0.0 0 -248,841
1,344.5 -492,863 0 0.0 0 -400,1251,360.4 -509,375 0 0.0 0 -447,4591,495.1 -510,113 0 0.0 0 -448,4031,674.7 -516,423 0 0.0 0 -473,0561,714.6 -617,918 0 0.0 0 -573,4721,851.1 -534,572 0 0.0 0 -488,7891,957.7 -478,746 0 0.0 0 -444,6941,984.9 -465,868 0 0.0 0 -449,7041,779.8 -513,742 0 0.0 0 -483,8891,473.7 -648,347 0 0.0 0 -623,9871,109.5 -690,369 0 0.0 0 -673,011922.9 -737,967 0 0.0 0 -730,487884.4 -771,767 0 0.0 0 -770,193
0.0 -3,774 0 0.0 0 -3,7740.0 0 0 0.0 0 00.0 0 0 0.0 0 0
Clg (Tons) Htg (Btuh) Htg (Btuh) Clg (Tons) Htg (Btuh) Htg (Btuh)
0.0 0 0 0.0 0 00.0 0 0 0.0 0 00.0 0 0 0.0 0 00.0 0 0 0.0 0 00.0 0 0 0.0 0 00.0 0 0 0.0 0 0
425.4 -220,023 0 0.0 0 -45,130700.8 -315,099 0 0.0 0 -236,929
1,720.8 -446,130 0 0.0 0 -391,9871,797.4 -476,995 0 0.0 0 -437,8541,922.8 -479,586 0 0.0 0 -435,3772,034.9 -493,873 0 0.0 0 -440,3852,098.9 -589,956 0 0.0 0 -549,0462,214.6 -499,653 0 0.0 0 -468,5512,270.5 -447,316 0 0.0 0 -416,7422,299.5 -440,713 0 0.0 0 -420,6742,133.2 -479,736 0 0.0 0 -451,9491,753.1 -612,277 0 0.0 0 -553,1171,233.1 -667,481 0 0.0 0 -642,2001,147.7 -716,917 0 0.0 0 -692,7081,071.9 -756,521 0 0.0 0 -741,952
0.0 -3,751 0 0.0 0 -3,7510.0 0 0 0.0 0 00.0 0 0 0.0 0 0
Clg (Tons) Htg (Btuh) Htg (Btuh) Clg (Tons) Htg (Btuh) Htg (Btuh)
0.0 0 0 0.0 0 00.0 0 0 0.0 0 00.0 0 0 0.0 0 00.0 0 0 0.0 0 00.0 0 0 0.0 0 00.0 0 0 0.0 0 0
457.7 -220,784 0 0.0 0 -50,467742.4 -324,486 0 0.0 0 -240,242
1,782.3 -453,866 0 0.0 0 -393,4871,835.8 -475,020 0 0.0 0 -435,0211,970.6 -474,457 0 0.0 0 -429,6482,131.6 -491,511 0 0.0 0 -432,1482,182.8 -586,318 0 0.0 0 -538,5422,272.4 -499,961 0 0.0 0 -462,0632,300.4 -445,619 0 0.0 0 -413,0272,301.8 -436,072 0 0.0 0 -411,7722,142.6 -477,596 0 0.0 0 -442,0051,756.0 -613,821 0 0.0 0 -560,0491,276.6 -670,153 0 0.0 0 -648,8451,151.1 -715,578 0 0.0 0 -691,5141,112.0 -751,246 0 0.0 0 -739,325
0.0 -3,704 0 0.0 0 -3,7040.0 0 0 0.0 0 00.0 0 0 0.0 0 0
Clg (Tons) Htg (Btuh) Htg (Btuh) Clg (Tons) Htg (Btuh) Htg (Btuh)
0.0 0 0 0.0 0 00.0 0 0 0.0 0 00.0 0 0 0.0 0 00.0 0 0 0.0 0 0
0.023 74.922 75.9 61.9 -3,435 0.0 0.0
3 71.9 58.2 0 0.0 0.0 0.02 71.9 58.8 0 0.0 0.0
Clg (Tons)
1 72.9 59.8 0 0.0 0.0 0.0
0.0
1,697.213 89.9 65.9 -563,492 1,669.8 0.0 1,710.1
1,562.411 86.9 64.8 -454,349 1,587.5 0.0 1,639.110
12 88.9 65.5 -471,600 1,651.9 0.0
84.9 64.0 -455,916 1,516.2 0.0
0.023 73.9 60.5 0 0.0 0.0 0.022 74.9 61.0 -3,451 0.0 0.0
822.121 74.9 60.9 -684,377 709.7 0.0 783.620 76.9 61.4 -647,233 746.3 0.0
1,462.011 86.9 63.9 -460,561 1,536.6 0.0 1,583.9
675.19 78.9 61.1 -411,447 1,308.6 0.0 1,348.98
10 82.9 62.6 -461,760 1,415.9 0.0
74.9 59.5 -268,010 483.2 0.0
0.023 72.822 73.8 59.8 -3,609 0.0 0.0
3 71.9 59.2 0 0.0 0.0 0.02 71.9 59.3 0 0.0 0.0
Clg (Tons)
1 72.9 59.8 0 0.0 0.0 0.0
0.0
1,273.513 83.8 61.9 -588,567 1,202.2 0.0 1,227.7
1,165.711 80.8 60.6 -484,392 1,134.5 0.0 1,261.210
12 82.8 61.5 -497,347 1,214.9 0.0
76.8 59.1 -484,405 1,014.8 0.0
0.023 70.8 57.8 0 0.0 0.0 0.022 72.8 58.7 -3,739 0.0 0.0
582.221 72.8 58.6 -752,314 552.9 0.0 572.920 74.8 58.9 -713,307 555.3 0.0
845.711 76.8 57.8 -501,143 915.1 0.0 919.7
428.49 70.8 55.3 -508,157 627.5 0.0 703.78
10 74.8 57.0 -519,208 831.6 0.0
65.8 53.3 -379,061 245.6 0.0
3 65.8 53.5 0 0.0 0.0 0.02 66.8 54.3 0 0.0 0.0
Clg (Tons)
1 69.8 56.1 0 0.0 0.0 0.0
0.0
0.04 70.9 57.6 0 0.0 0.0
0.0
Hour OADB OAWB Htg (Btuh) Clg (Tons) Clg (Tons)
0.0
61.5 0 0.0 0.0 0.00.0
September Typical Weather (°F) Design Weekday Saturday Sunday Monday24 73.9 60.8 0
66.1 -442,478 1,694.1 0.0
1,648.2
20 78.9 62.9 -651,750 782.4 0.0 848.921 76.9 62.2 -693,678 751.6 0.0 846.0
1,296.419 82.9 64.1 -608,417 862.6 0.0 947.718 84.9 64.8 -525,871 1,264.2
0.0 726.66 71.9 59.4 0 0.0 0.0
714.7
16 86.9 65.4 -346,251 1,645.2 0.017 85.9 65.1 -428,937 1,483.9 0.0 1,512.4
1,723.715 88.9 65.9 -355,578 1,691.5 0.0 1,706.914 89.9
9 80.9 62.7 -413,554 1,414.2 0.0 1,458.2
4 71.9 59.5 0 0.0 0.05 71.9 59.4 0 0.0 0.0 0.0
8 76.9 61.2 -269,932 516.9 0.0
0.07 74.9 60.5 -205,970 362.6
0.03 72.9 60.1 0 0.0 0.0 0.02 72.9 60.3 0 0.0 0.0
0.0
0.0
Hour OADB OAWB Htg (Btuh) Clg (Tons) Clg (Tons)
0.0August Typical Weather (°F) Design Weekday Saturday Sunday Monday
24 72.9 59.9 0 0.0 0.0
Clg (Tons)
1 73.9 60.8 0 0.0 0.0
18 82.9 63.3 -513,616 1,174.0 0.0 1,211.219 80.9 62.7 -600,055 821.4 0.0 904.4
1,540.517 83.9 63.6 -427,196 1,348.3 0.0 1,411.216 84.9 63.8 -354,838 1,498.7 0.0
14 88.9 64.9 -453,785 1,602.8 0.015 86.9 64.4 -365,203 1,557.5 0.0 1,598.1
1,643.513 89.9 65.1 -567,486 1,613.3 0.0 1,660.512 88.9 64.7 -476,000 1,600.7 0.0
1,644.5
0.0
6 71.9 58.8 0 0.0 0.0
0.05 70.9 58.7 0 0.0 0.0 0.04 70.9 58.8 0 0.0 0.0
0.0
0.0
7 72.9 58.9 -206,858 298.1 0.0 603.2
Hour OADB OAWB Htg (Btuh) Clg (Tons) Clg (Tons)
0.0
59.3 0 0.0 0.0 0.00.0
July Typical Weather (°F) Design Weekday Saturday Sunday Monday24 71.8 58.8 0
62.0 -488,594 1,255.2 0.0
1,203.1
20 75.8 60.1 -678,446 656.1 0.0 676.521 74.8 60.0 -721,703 642.4 0.0 660.8
1,018.119 76.8 60.2 -626,023 714.4 0.0 741.418 78.8 60.8 -564,583 952.3
0.0 454.56 66.8 55.3 0 0.0 0.0
568.6
16 80.8 61.2 -424,502 1,206.5 0.017 79.8 61.0 -445,563 1,104.6 0.0 1,097.9
1,251.015 82.8 61.8 -437,043 1,267.3 0.0 1,262.814 83.8
9 72.8 57.6 -433,408 930.8 0.0 1,055.7
4 67.8 56.3 0 0.0 0.05 66.8 55.5 0 0.0 0.0 0.0
8 70.8 56.8 -296,419 352.9 0.0
0.07 67.8 55.5 -229,440 248.1
0.03 68.8 56.9 0 0.0 0.0 0.02 69.8 57.4 0 0.0 0.0
0.0
0.0
Hour OADB OAWB Htg (Btuh) Clg (Tons) Clg (Tons)
0.0June Typical Weather (°F) Design Weekday Saturday Sunday Monday24 70.8 57.1 0 0.0 0.0
Clg (Tons)
1 70.8 58.2 0 0.0 0.0
18 75.8 58.6 -603,031 750.6 0.0 784.719 74.8 58.5 -665,038 580.9 0.0 613.0
975.617 75.8 58.2 -475,531 868.4 0.0 883.816 76.8 58.3 -441,539 960.3 0.0
14 78.8 58.9 -508,443 1,002.7 0.015 77.8 58.6 -459,968 992.7 0.0 1,010.0
957.213 78.8 58.8 -603,671 957.2 0.0 960.512 77.8 58.3 -507,062 965.5 0.0
1,012.2
6 63.8 52.2 0 0.0 0.0
0.05 63.8 52.2 0 0.0 0.0 0.04 63.8 52.4 0 0.0 0.0
0.07 64.8 52.7 -334,003 155.7 0.0 337.6
Hour OADB OAWB Htg (Btuh) Clg (Tons) Clg (Tons)
0.0
Page 72
0.0 0 0 0.0 0 00.0 0 0 0.0 0 0
484.0 -230,661 0 0.0 0 -77,625706.5 -361,479 0 0.0 0 -248,696
1,743.2 -488,211 0 0.0 0 -394,7501,815.4 -485,390 0 0.0 0 -433,5321,959.0 -480,922 0 0.0 0 -423,7482,106.4 -488,581 0 0.0 0 -430,0332,203.6 -585,846 0 0.0 0 -529,8432,253.3 -499,602 0 0.0 0 -451,3362,298.1 -449,239 0 0.0 0 -408,5922,311.4 -444,668 0 0.0 0 -419,6452,146.8 -488,563 0 0.0 0 -454,3751,745.1 -633,507 0 0.0 0 -602,6521,274.0 -683,701 0 0.0 0 -663,4731,139.0 -727,255 0 0.0 0 -713,0851,106.1 -758,366 0 0.0 0 -753,283
0.0 -3,707 0 0.0 0 -3,7070.0 0 0 0.0 0 00.0 0 0 0.0 0 0
Clg (Tons) Htg (Btuh) Htg (Btuh) Clg (Tons) Htg (Btuh) Htg (Btuh)
0.0 0 -15,160 0.0 0 00.0 -8,332 -21,589 0.0 0 00.0 -17,979 -24,548 0.0 -4,255 -4,2550.0 -24,781 -29,720 0.0 -6,100 -6,1000.0 -28,075 -31,861 0.0 -8,978 -8,9780.0 -33,224 -34,216 0.0 -10,868 -10,868
335.2 -768,764 -27,931 0.0 -10,657 -461,546490.1 -881,933 -6,724 0.0 -4,698 -574,022902.5 -773,729 0 0.0 0 -665,440991.6 -600,080 0 0.0 0 -590,624
1,145.8 -550,429 0 0.0 0 -550,8781,294.7 -575,475 0 0.0 0 -581,1021,343.2 -723,002 0 0.0 0 -744,8401,491.2 -593,394 0 0.0 0 -602,6361,679.3 -540,275 0 0.0 0 -545,5861,734.4 -532,565 0 0.0 0 -534,9451,520.9 -597,828 0 0.0 0 -603,1701,200.9 -756,478 0 0.0 0 -765,095829.8 -782,452 0 0.0 0 -783,067752.7 -859,491 0 0.0 0 -833,531750.2 -1,243,570 0 0.0 0 -1,240,604
0.0 -5,461 0 0.0 0 -5,4610.0 -5,148 0 0.0 0 -5,1480.0 -9,103 0 0.0 0 -9,103
Clg (Tons) Htg (Btuh) Htg (Btuh) Clg (Tons) Htg (Btuh) Htg (Btuh)
0.0 -23,476 -31,180 0.0 -15,168 -15,1680.0 -31,527 -39,350 0.0 -19,343 -19,3430.0 -41,291 -43,736 0.0 -25,411 -25,4110.0 -47,081 -47,415 0.0 -30,855 -30,8550.0 -50,525 -50,826 0.0 -35,037 -35,0370.0 -51,782 -51,902 0.0 -41,891 -41,832
150.0 -2,313,711 -52,122 0.0 -43,724 -3,588,659204.2 -1,340,520 -26,481 0.0 -24,493 -3,045,647462.0 -1,719,394 -8,409 0.0 -8,409 -5,127,371563.1 -923,923 0 0.0 0 -3,091,948780.6 -693,388 0 0.0 0 -1,220,345887.8 -680,499 0 0.0 0 -747,926892.9 -860,429 0 0.0 0 -908,980
1,037.4 -675,318 0 0.0 0 -681,2621,144.7 -605,873 0 0.0 0 -611,7451,178.1 -590,754 0 0.0 0 -598,3111,014.0 -676,586 0 0.0 0 -677,812834.5 -889,104 0 0.0 0 -912,126658.3 -1,161,784 0 0.0 0 -1,160,498612.3 -1,327,289 0 0.0 0 -1,338,094610.0 -1,474,872 0 0.0 0 -1,483,656
0.0 -8,959 -2,934 0.0 -2,934 -8,9590.0 -13,363 -7,332 0.0 -7,332 -13,3630.0 -23,467 -11,951 0.0 -11,951 -23,467
Clg (Tons) Htg (Btuh) Htg (Btuh) Clg (Tons) Htg (Btuh) Htg (Btuh)
0.0 -38,890 -47,819 0.0 -32,046 -32,0460.0 -50,552 -51,484 0.0 -35,224 -35,2240.0 -53,766 -54,188 0.0 -79,138 -103,8890.0 -55,067 -55,191 0.0 -136,767 -136,7670.0 -57,583 -57,640 0.0 -143,156 -170,8270.0 -61,129 -61,344 0.0 -160,890 -286,741
129.3 -3,382,920 -64,784 0.0 -169,759 -4,451,213168.0 -2,208,294 -44,399 0.0 -189,552 -4,748,961281.1 -3,643,234 -15,498 0.0 -17,780 -6,868,816359.9 -1,916,108 -2,987 0.0 -2,987 -5,206,103540.1 -935,920 0 0.0 0 -3,553,722670.4 -835,751 0 0.0 0 -2,382,028689.6 -1,105,243 0 0.0 0 -1,698,622826.9 -750,072 0 0.0 0 -870,793879.7 -668,373 0 0.0 0 -741,832893.5 -690,801 0 0.0 0 -769,485775.6 -788,754 0 0.0 0 -873,481644.2 -1,296,204 0 0.0 0 -1,423,827583.4 -1,487,140 0 0.0 0 -1,492,844548.0 -1,601,257 -7,296 0.0 -7,296 -1,626,197547.0 -1,622,189 -13,384 0.0 -13,384 -1,659,287
0.0 -12,892 -16,227 0.0 -16,227 -12,8920.0 -24,460 -21,732 0.0 -21,732 -24,4600.0 -34,334 -26,986 0.0 -26,986 -34,334
Dataset Name: MT SAC current.TRC Alternative - 1 System Load Profiles report Page 6 of 6
24 56.0
17 64.0 54.0 -622,319 396.9 0.0 384.2
378.221 58.0 50.9 -1,333,335 393.7 0.0 383.3
0.0
Project Name: TRACE® 700 v6.3 calculated at 04:18 PM on 09/25/2014
49.5 -21,432 0.0 0.0
0.023 56.0 49.7 -11,066
426.513 68.0 54.4 -830,371 404.0 0.0 405.512 67.0 53.5 -652,116 430.1 0.0
246.011 66.0 52.8 -760,579 377.6 0.0 370.310 62.0 50.7 -1,465,182 228.4 0.0
0.023 60.0 52.2 -3,141 0.0 0.0 0.022 60.0 52.5 -4,111 0.0 0.0
418.121 62.0 53.8 -926,920 430.0 0.0 424.120 62.0 54.2 -812,916 425.8 0.0
286.811 68.0 54.4 -560,599 463.7 0.0 449.3
123.69 60.0 49.8 -1,077,781 204.6 0.0 190.98
10 64.0 52.0 -608,459 299.5 0.0
56.0 48.0 -1,049,967 124.7 0.0
0.023 64.022 64.0 58.5 -3,871 0.0 0.0
3 56.0 49.1 -24,745 0.0 0.0 0.02 57.0 49.8 -20,145 0.0 0.0
Clg (Tons)
1 58.0 50.5 -14,793 0.0 0.0 0.0
0.0
827.713 76.0 62.1 -664,472 859.7 0.0 834.5
646.411 72.0 60.5 -510,251 769.2 0.0 739.510
12 74.0 61.2 -523,874 855.3 0.0
70.0 59.8 -539,492 630.5 0.0
0.023 74.9 60.9 0 0.0 0.0 0.022 75.9 61.3 -3,443 0.0 0.0
845.421 76.9 61.7 -704,551 745.7 0.0 842.120 78.9 62.4 -666,004 768.5 0.0
1,515.911 88.9 64.8 -454,691 1,611.2 0.0 1,655.8
681.19 80.9 61.7 -422,134 1,336.3 0.0 1,399.68
10 84.9 63.2 -454,452 1,479.1 0.0
76.9 60.0 -283,163 495.1 0.0
0.0 0.0 0.022 57.0 50.0 -7,594 0.0 0.0
20 59.0 51.4 -972,216 387.9 0.0
365.119 60.0 52.4 -817,691 398.0 0.0 381.318 62.0 53.1 -782,018 372.6 0.0
16 66.0 55.7 -550,435 422.7 0.0
446.615 68.0 55.5 -558,611 482.4 0.0 462.814 68.0 54.8 -619,760 458.3 0.0
409.2
8 54.0 46.5 -1,896,804 80.0 0.0 68.09 58.0 47.7 -2,971,112 131.0 0.0 140.3
0.07 50.0 44.4 -3,330,731 61.1 0.0 45.16 51.0 45.0 -45,673 0.0 0.0
4 53.0 46.5 -45,187 0.0 0.05 52.0 46.0 -46,439 0.0 0.0 0.0
0.03 53.0 46.7 -42,767 0.0 0.0 0.02 54.0 47.6 -39,032 0.0 0.0
0.0
0.0
Hour OADB OAWB Htg (Btuh) Clg (Tons) Clg (Tons)
0.0December Typical Weather (°F) Design Weekday Saturday Sunday Monday
24 58.0 51.0 -6,628 0.0 0.0
Clg (Tons)
1 54.0 48.3 -30,228 0.0 0.0
18 66.0 56.5 -732,458 473.6 0.0 448.019 64.0 55.3 -776,004 447.7 0.0 430.9
560.617 68.0 57.3 -574,934 524.2 0.0 502.816 70.0 58.0 -510,468 583.7 0.0
14 72.0 58.4 -578,582 608.6 0.015 71.0 58.2 -520,530 607.1 0.0 581.4
495.013 70.0 56.6 -746,652 479.9 0.0 474.812 69.0 55.5 -588,093 509.4 0.0
586.0
0.0
6 54.0 47.1 -31,467 0.0 0.0
0.05 54.0 47.6 -31,931 0.0 0.0 0.04 55.0 48.1 -30,075 0.0 0.0
0.0
0.0
7 54.0 46.9 -1,981,137 68.5 0.0 64.1
Hour OADB OAWB Htg (Btuh) Clg (Tons) Clg (Tons)
0.0
58.4 0 0.0 0.0 0.00.0
November Typical Weather (°F) Design Weekday Saturday Sunday Monday24 63.0 58.0 0
62.3 -535,750 931.7 0.0
823.2
20 66.0 59.3 -762,829 516.2 0.0 509.421 64.0 58.5 -795,180 514.5 0.0 508.4
618.419 66.0 59.3 -710,189 555.7 0.0 548.218 68.0 60.0 -660,074 655.9
0.0 193.46 59.0 54.6 0 0.0 0.0
234.7
16 72.0 61.3 -472,319 863.6 0.017 70.0 60.7 -521,116 767.7 0.0 719.2
883.815 74.0 62.0 -481,106 925.4 0.0 867.014 76.0
9 66.0 57.8 -595,506 473.7 0.0 441.8
4 60.0 55.4 0 0.0 0.05 60.0 55.0 0 0.0 0.0 0.0
8 62.0 56.0 -443,346 190.2 0.0
0.07 59.0 54.6 -383,573 162.1
0.03 61.0 56.3 0 0.0 0.0 0.02 61.0 56.5 0 0.0 0.0
0.0
0.0
Hour OADB OAWB Htg (Btuh) Clg (Tons) Clg (Tons)
0.0October Typical Weather (°F) Design Weekday Saturday Sunday Monday
24 72.9 60.1 0 0.0 0.0
Clg (Tons)
1 62.0 57.3 0 0.0 0.0
18 84.9 64.4 -549,117 1,222.2 0.0 1,275.519 82.9 63.8 -616,505 847.5 0.0 903.3
1,632.017 85.9 64.9 -416,597 1,476.1 0.0 1,498.416 86.9 65.2 -280,354 1,632.8 0.0
14 90.9 66.0 -405,924 1,700.6 0.015 88.9 65.6 -319,102 1,676.7 0.0 1,684.8
1,697.013 90.9 65.8 -554,339 1,679.6 0.0 1,715.512 89.9 65.3 -465,252 1,652.9 0.0
1,728.3
6 70.9 57.3 0 0.0 0.05 70.9 57.5 0 0.0 0.0 0.0
0.07 72.9 58.3 -210,056 337.7 0.0 659.0
EXISTING PEAK SUMMER CAMPUS COOLING LOAD
Page 73
0
500
1,000
1,500
2,000
2,500
1 2 3 4 5 6 7 8 9 10 11 12 13 14 15 16 17 18 19 20 21 22 23 24
TONS
EXISTING PEAK SUMMER CAMPUS COOLING LOAD
Page 74
Appendix D - Economic Analysis
Mt San Antonio College SCE Permanent Load Shifting Program Incentive 73 | P a g e
Page 75
Line No. Mode Start Time End Time
Percent
Existing Plant
Load
Load (tons)CH‐2 (750‐
tons)
CH‐3 (750
Tons)
CH‐4 (750
Tons)
CH‐1 (250‐
tons)
CH‐2 (250‐
tons)
TES Stored
Capacity
Water‐Cooled
Chiller kWCHW ∆T
CHW Flow
(GPM)
Central plant
Primary CHW
Pump Power
@70% & 40'
TDH (kW)
Central plant
secondary CHW
Pump Power
@70% &
230'TDH (kW)
Building 2
Primary CHW
Pump Power
@70%
&65'TDH (kW)
Building 2
Secondary
CHW Pump
Power @70% &
100'TDH (kW)
Central Plant CW
Pump Power @
2.4GPM/ton,
30'TDH & 65%
Central Plant CT
Fan kW 40Hp each
& .60 Duty Factor
Bldg. 2 CW
Pump Power
@
2.4GPM/ton,
15'TDH & 65%
Bldg. 2 CT
Fan kW 15
Hp each &
.60 Duty
Factor
TES kW DemandCH‐2 (750‐
tons)
CH‐3 (750
Tons)
CH‐1 (250‐
tons)
CH‐2 (250‐
tons)
Water
Cooled
Chiller kW
Avg.CHW ∆T
Central plant
CHW Flow
(GPM)
Bldg. 2 CHW
Flow (GPM)
Central plant
Primary CHW
Pump Power
@70% & 230'
TDH (kW)
Building 2
Primary CHW
Pump Power
@70%
&65'TDH (kW)
Building 2
Secondary
CHW Pump
Power @70%
& 100'TDH
(kW)
Central Plant
CW Pump
Power @
2.4GPM/ton,
30'TDH & 65%
Central Plant
CT Fan kW
40Hp each &
.60 Duty
Factor
Bldg. 2 CW
Pump Power
@
2.4GPM/ton,
15'TDH & 65%
Bldg. 2 CT Fan
kW 15 Hp
each & .60
Duty Factor
Existing C entral
Plant kW Demand
1 0 1 0.0% 0 816.0 816.0 816.0 0.0 0.0 10,447 1,713.6 18 3,264 58 202 0 0 68 54 0 0 2,096 0 0 0 0 0.0 18 0 0 0 0 0 0 0 0 0 0
2 1 2 0.0% 0 816.0 816.0 816.0 0.0 0.0 12,895 1,713.6 18 3,264 58 202 0 0 68 54 0 0 2,096 0 0 0 0 0.0 18 0 0 0 0 0 0 0 0 0 0
3 2 3 0.0% 0 816.0 816.0 816.0 0.0 0.0 15,343 1,713.6 18 3,264 58 202 0 0 68 54 0 0 2,096 0 0 0 0 0.0 18 0 0 0 0 0 0 0 0 0 0
4 3 4 0.0% 0 816.0 816.0 577.1 0.0 0.0 17,791 1,546.4 18 2,945 58 182 0 0 61 54 0 0 1,902 0 0 0 0 0.0 18 0 0 0 0 0 0 0 0 0 0
5 4 5 0.0% 0 0.0 0.0 0.0 0.0 0.0 20,000 0.0 18 0 0 0 0 0 0 0 0 0 0 0 0 0 0 0.0 18 0 0 0 0 0 0 0 0 0 0
6 5 6 0.0% 0 0.0 0.0 0.0 0.0 0.0 20,000 0.0 18 0 0 0 0 0 0 0 0 0 0 0 0 0 0 0.0 18 0 0 0 0 0 0 0 0 0 0
7 6 7 14.9% 297 0.0 0.0 0.0 0.0 0.0 20,000.0 0.0 18 396 0 25 0 0 0 0 0 0 25 297 0 0 0 208.1 18 396 0 25 0 0 6 18 0 0 2578 7 8 25.8% 516.7 0.0 0.0 0.0 0.0 0.0 19,483.3 0.0 18 689 0 43 0 0 0 0 0 0 43 517 0 0 0 361.7 18 689 0 43 0 0 11 18 0 0 433
9 8 9 67.2% 1,344.5 0.0 0.0 0.0 0.0 0.0 18,138.7 0.0 18 1,793 0 111 0 0 0 0 0 0 111 816 529 0 0 941.2 18 1,793 0 111 0 0 28 36 0 0 1,116
10 9 10 68.0% 1,360.4 0.0 0.0 0.0 0.0 0.0 16,778.4 0.0 18 1,814 0 112 0 0 0 0 0 0 112 816 544 0 0 952.3 18 1,814 0 112 0 0 28 36 0 0 1,129
11 10 11 74.8% 1,495.1 0.0 0.0 0.0 0.0 0.0 15,283.2 0.0 18 1,994 0 123 0 0 0 0 0 0 123 816 679 0 0 1,046.6 18 1,994 0 123 0 0 31 36 0 0 1,237
12 11 12 83.7% 1,674.7 0.0 0.0 0.0 0.0 0.0 13,608.5 0.0 18 2,233 0 138 0 0 0 0 0 0 138 816 816 43 0 1,172.3 18 2,176 57 135 10 2 35 36 17 7 1,41313 12 13 85.7% 1,714.6 0.0 0.0 0.0 0.0 0.0 11,893.9 0.0 18 2,286 0 141 0 0 0 0 0 0 141 816 816 83 0 1,200.2 18 2,176 110 135 10 3 36 36 18 7 1,444
14 13 14 92.6% 1,851.1 0.0 0.0 0.0 0.0 0.0 10,042.8 0.0 18 2,468 0 153 0 0 0 0 0 0 153 816 816 219 0 1,295.8 18 2,176 292 135 10 8 39 36 19 7 1,549
15 14 15 97.9% 1,957.7 0.0 0.0 0.0 0.0 0.0 8,085.1 0.0 18 2,610 0 162 0 0 0 0 0 0 162 816 816 250 76 1,370.4 18 2,176 434 135 20 12 41 36 20 13 1,647
16 15 16 99.2% 1,984.9 0.0 0.0 0.0 0.0 0.0 6,100.2 0.0 18 2,647 0 164 0 0 0 0 0 0 164 816 816 250 103 1,389.4 18 2,176 471 135 20 13 41 36 21 13 1,668
17 16 17 89.0% 1,779.8 0.0 0.0 0.0 0.0 0.0 4,320.4 0.0 18 2,373 0 147 0 0 0 0 0 0 147 816 816 148 0 1,245.9 18 2,176 197 135 10 5 37 36 19 7 1,494
18 17 18 73.7% 1,473.7 0.0 0.0 0.0 0.0 0.0 2,846.7 0.0 18 1,965 0 122 0 0 0 0 0 0 122 816 658 0 0 1,031.6 18 1,965 0 122 0 0 31 36 0 0 1,220
19 18 19 55.5% 1,109.5 0.0 0.0 0.0 0.0 0.0 1,737.3 0.0 18 1,479 0 92 0 0 0 0 0 0 92 816 293 0 0 776.6 18 1,479 0 92 0 0 23 36 0 0 927
20 19 20 46.1% 922.9 0.0 0.0 0.0 0.0 0.0 814.4 0.0 18 1,231 0 76 0 0 0 0 0 0 76 816 0 0 0 571.2 18 1,088 0 67 0 0 19 18 0 0 676
21 20 21 44.2% 884.4 0.0 0.0 0.0 0.0 0.0 852.9 0.0 18 0 0 0 0 0 0 0 0 0 0 816 0 0 0 571.2 18 1,088 0 67 0 0 18 18 0 0 675
22 21 22 0.0% 0.0 816.0 816.0 816.0 0.0 0.0 3,300.9 1,713.6 18 3,264 58 202 0 0 68 54 0 0 2,096 0 0 0 0 0.0 18 0 0 0 0 0 0 0 0 0 0
23 22 23 0.0% 0.0 816.0 816.0 816.0 0.0 0.0 5,748.9 1,713.6 18 3,264 58 202 0 0 68 54 0 0 2,096 0 0 0 0 0.0 18 0 0 0 0 0 0 0 0 0 0
24Off‐Peak; TES
Charging23 24 0.0% 0 750 750 750 0 0 7,999 1,575.0 18 3,000 58 186 0 0 63 54 0 0 1,935 0 0 0 0 0.0 18 0 0 0 0 0 0 0 0 0 0
total kW‐Hr 11,689.4 15,921.8 16,882.8
Line No. Mode Start Time End Time
Percent
Existing Plant
Load
Load (tons)CH‐2 (750‐
tons)
CH‐3 (750
Tons)
CH‐4 (750
Tons)
CH‐1 (250‐
tons)
CH‐2 (250‐
tons)
TES Stored
Capacity
Water‐Cooled
Chiller kWCHW ∆T
CHW Flow
(GPM)
Central plant
Primary CHW
Pump Power
@70% & 40'
TDH (kW)
Central plant
secondary CHW
Pump Power
@70% &
230'TDH (kW)
Building 2
Primary CHW
Pump Power
@70%
&65'TDH (kW)
Building 2
Secondary
CHW Pump
Power @70% &
100'TDH (kW)
Central Plant CW
Pump Power @
2.4GPM/ton,
30'TDH & 65%
Central Plant CT
Fan kW 40Hp each
& .60 Duty Factor
Bldg. 2 CW
Pump Power
@
2.4GPM/ton,
15'TDH & 65%
Bldg. 2 CT
Fan kW 15
Hp each &
.60 Duty
Factor
TES kW DemandCH‐2 (750‐
tons)
CH‐3 (750
Tons)
CH‐1 (250‐
tons)
CH‐2 (250‐
tons)
Water
Cooled
Chiller kW
Avg.CHW ∆T
Central plant
CHW Flow
(GPM)
Bldg. 2 CHW
Flow (GPM)
Central plant
Primary CHW
Pump Power
@70% & 230'
TDH (kW)
Building 2
Primary CHW
Pump Power
@70%
&65'TDH (kW)
Building 2
Secondary
CHW Pump
Power @70%
& 100'TDH
(kW)
Central Plant
CW Pump
Power @
2.4GPM/ton,
30'TDH & 65%
Central Plant
CT Fan kW
40Hp each &
.60 Duty
Factor
Bldg. 2 CW
Pump Power
@
2.4GPM/ton,
15'TDH & 65%
Bldg. 2 CT Fan
kW 15 Hp
each & .60
Duty Factor
Existing C entral
Plant kW Demand
1 0 1 0.0% 0 816.0 816.0 816.0 0.0 0.0 10,759 1,713.6 18 3,264 58 202 0 0 68 54 0 0 2,096 0 0 0 0 0.0 18 0 0 0 0 0 0 0 0 0 0
2 1 2 0.0% 0 816.0 816.0 816.0 0.0 0.0 13,207 1,713.6 18 3,264 58 202 0 0 68 54 0 0 2,096 0 0 0 0 0.0 18 0 0 0 0 0 0 0 0 0 0
3 2 3 0.0% 0 816.0 816.0 816.0 0.0 0.0 15,655 1,713.6 18 3,264 58 202 0 0 68 54 0 0 2,096 0 0 0 0 0.0 18 0 0 0 0 0 0 0 0 0 0
4 3 4 0.0% 0 816.0 816.0 264.6 0.0 0.0 18,103 1,327.6 18 2,529 58 156 0 0 53 54 0 0 1,649 0 0 0 0 0.0 18 0 0 0 0 0 0 0 0 0 0
5 4 5 0.0% 0 0.0 0.0 0.0 0.0 0.0 20,000 0.0 18 0 0 0 0 0 0 0 0 0 0 0 0 0 0 0.0 18 0 0 0 0 0 0 0 0 0 0
6 5 6 0.0% 0 0.0 0.0 0.0 0.0 0.0 20,000 0.0 18 0 0 0 0 0 0 0 0 0 0 0 0 0 0 0.0 18 0 0 0 0 0 0 0 0 0 0
7 6 7 21.3% 425 425.4 0.0 0.0 0.0 0.0 20,000.0 297.8 18 567 19 35 0 0 12 18 0 0 382 425 0 0 0 297.8 18 567 0 35 0 0 9 18 0 0 360
8 7 8 35.0% 700.8 700.8 0.0 0.0 0.0 0.0 20,000.0 490.6 18 934 19 58 0 0 19 18 0 0 605 701 0 0 0 490.6 18 934 0 58 0 0 15 18 0 0 581
9 8 9 86.0% 1,720.8 816.0 816.0 88.8 0.0 0.0 20,000.0 1,204.6 18 2,294 58 142 0 0 48 54 0 0 1,506 816 816 89 0 1,204.6 18 2,176 118 135 10 3 36 36 18 7 1,449
10 9 10 89.9% 1,797.4 816.0 816.0 165.4 0.0 0.0 20,000.0 1,258.2 18 2,397 58 148 0 0 50 54 0 0 1,568 816 816 165 0 1,258.2 18 2,176 221 135 10 6 37 36 19 7 1,507
11 10 11 96.1% 1,922.8 0.0 0.0 0.0 0.0 0.0 18,077.2 0.0 18 2,564 0 159 0 0 0 0 0 0 159 816 816 250 41 1,346.0 18 2,176 388 135 20 10 40 36 20 13 1,620
12 11 12 101.7% 2,034.9 0.0 0.0 0.0 0.0 0.0 16,042.2 0.0 18 2,713 0 168 0 0 0 0 0 0 168 816 816 250 153 1,424.5 18 2,176 537 135 20 14 42 36 21 13 1,706
13 12 13 104.9% 2,098.9 0.0 0.0 0.0 0.0 0.0 13,943.3 0.0 18 2,799 0 173 0 0 0 0 0 0 173 816 816 250 217 1,469.2 18 2,176 623 135 20 17 44 36 22 13 1,755
14 13 14 110.7% 2,214.6 0.0 0.0 0.0 0.0 0.0 11,728.7 0.0 18 2,953 0 183 0 0 0 0 0 0 183 816 816 250 250 1,492.4 18 2,176 667 135 20 18 46 36 23 13 1,783
15 14 15 113.5% 2,270.5 0.0 0.0 0.0 0.0 0.0 9,458.2 0.0 18 3,027 0 187 0 0 0 0 0 0 187 816 816 250 250 1,492.4 18 2,176 667 135 20 18 47 36 24 13 1,785
16 15 16 115.0% 2,299.5 0.0 0.0 0.0 0.0 0.0 7,158.7 0.0 18 3,066 0 190 0 0 0 0 0 0 190 816 816 250 250 1,492.4 18 2,176 667 135 20 18 48 36 24 13 1,786
17 16 17 106.7% 2,133.2 0.0 0.0 0.0 0.0 0.0 5,025.5 0.0 18 2,844 0 176 0 0 0 0 0 0 176 816 816 250 251 1,493.3 18 2,176 668 135 20 18 44 36 22 13 1,781
18 17 18 87.7% 1,753.1 0.0 0.0 0.0 0.0 0.0 3,272.4 0.0 18 2,337 0 145 0 0 0 0 0 0 145 816 816 121 0 1,227.1 18 2,176 161 135 10 0 37 36 0 7 1,451
19 18 19 61.7% 1,233.1 0.0 0.0 0.0 0.0 0.0 2,039.3 0.0 18 1,644 0 102 0 0 0 0 0 0 102 816 417 0 0 863.2 18 1,644 0 102 0 0 26 36 0 0 1,026
20 19 20 57.4% 1,147.7 0.0 0.0 0.0 0.0 0.0 891.6 0.0 18 1,530 0 95 0 0 0 0 0 0 95 816 332 0 0 803.4 18 1,530 0 95 0 0 24 36 0 0 958
21 20 21 53.6% 1,071.9 0.0 0.0 0.0 0.0 0.0 967.4 0.0 18 0 0 0 0 0 0 0 0 0 0 816 256 0 0 750.3 18 1,429 0 88 0 0 22 36 0 0 897
22 21 22 0.0% 0.0 816.0 816.0 816.0 0.0 0.0 3,415.4 1,713.6 18 3,264 58 202 0 0 68 54 0 0 2,096 0 0 0 0 0.0 18 0 0 0 0 0 0 0 0 0 0
23 22 23 0.0% 0.0 816.0 816.0 816.0 0.0 0.0 5,863.4 1,713.6 18 3,264 58 202 0 0 68 54 0 0 2,096 0 0 0 0 0.0 18 0 0 0 0 0 0 0 0 0 0
24
Off‐Peak; TES
Charging23 24
0.0% 0 816 816 816 0 0 8,311 1,713.6 18 3,264 58 202 0 0 68 54 0 0 2,096 0 0 0 0 0.0 18 0 0 0 0 0 0 0 0 0 0
total kW‐Hr 14,860.3 19,859.9 20,445.1
ALTERNATIVE #1 ‐ CHILLER PLANT WITH TES
ALTERNATIVE #2 ‐ EXISTING CHILLER PLANT
ALTERNATIVE #2 ‐ EXISTING CHILLER PLANT
ALTERNATIVE #1 ‐ CHILLER PLANT WITH TES
TYPICAL JUNE DAY COLLEGE LOAD PROFILE
Off‐Peak; TES
Charging
On‐Peak; TES
Discharge
Mid‐Peak; TES
Discharging
Mid‐Peak; TES
Discharging
TYPICAL JULY DAY COLLEGE LOAD PROFILE
Off‐Peak; TES
Charging
Mid‐Peak; TES
Discharging
On‐Peak; TES
Discharge
Mid‐Peak; TES
Discharging
Page 76
Line No. Mode Start Time End Time
Percent
Existing Plant
Load
Load (tons)CH‐2 (750‐
tons)
CH‐3 (750
Tons)
CH‐4 (750
Tons)
CH‐1 (250‐
tons)
CH‐2 (250‐
tons)
TES Stored
Capacity
Water‐Cooled
Chiller kWCHW ∆T
CHW Flow
(GPM)
Central plant
Primary CHW
Pump Power
@70% & 40'
TDH (kW)
Central plant
secondary CHW
Pump Power
@70% &
230'TDH (kW)
Building 2
Primary CHW
Pump Power
@70%
&65'TDH (kW)
Building 2
Secondary
CHW Pump
Power @70% &
100'TDH (kW)
Central Plant CW
Pump Power @
2.4GPM/ton,
30'TDH & 65%
Central Plant CT
Fan kW 40Hp each
& .60 Duty Factor
Bldg. 2 CW
Pump Power
@
2.4GPM/ton,
15'TDH & 65%
Bldg. 2 CT
Fan kW 15
Hp each &
.60 Duty
Factor
TES kW DemandCH‐2 (750‐
tons)
CH‐3 (750
Tons)
CH‐1 (250‐
tons)
CH‐2 (250‐
tons)
Water
Cooled
Chiller kW
Avg.CHW ∆T
Central plant
CHW Flow
(GPM)
Bldg. 2 CHW
Flow (GPM)
Central plant
Primary CHW
Pump Power
@70% & 230'
TDH (kW)
Building 2
Primary CHW
Pump Power
@70%
&65'TDH (kW)
Building 2
Secondary
CHW Pump
Power @70%
& 100'TDH
(kW)
Central Plant
CW Pump
Power @
2.4GPM/ton,
30'TDH & 65%
Central Plant
CT Fan kW
40Hp each &
.60 Duty
Factor
Bldg. 2 CW
Pump Power
@
2.4GPM/ton,
15'TDH & 65%
Bldg. 2 CT Fan
kW 15 Hp
each & .60
Duty Factor
Existing C entral
Plant kW Demand
1 0 1 0.0% 0 816.0 816.0 816.0 0.0 0.0 10,345 1,713.6 18 3,264 58 202 0 0 68 54 0 0 2,096 0 0 0 0 0.0 18 0 0 0 0 0 0 0 0 0 0
2 1 2 0.0% 0 816.0 816.0 816.0 0.0 0.0 12,793 1,713.6 18 3,264 58 202 0 0 68 54 0 0 2,096 0 0 0 0 0.0 18 0 0 0 0 0 0 0 0 0 0
3 2 3 0.0% 0 816.0 816.0 816.0 0.0 0.0 15,241 1,713.6 18 3,264 58 202 0 0 68 54 0 0 2,096 0 0 0 0 0.0 18 0 0 0 0 0 0 0 0 0 0
4 3 4 0.0% 0 816.0 816.0 678.7 0.0 0.0 17,689 1,617.5 18 3,081 58 191 0 0 64 54 0 0 1,984 0 0 0 0 0.0 18 0 0 0 0 0 0 0 0 0 0
5 4 5 0.0% 0 0.0 0.0 0.0 0.0 0.0 20,000 0.0 18 0 0 0 0 0 0 0 0 0 0 0 0 0 0 0.0 18 0 0 0 0 0 0 0 0 0 0
6 5 6 0.0% 0 0.0 0.0 0.0 0.0 0.0 20,000 0.0 18 0 0 0 0 0 0 0 0 0 0 0 0 0 0 0.0 18 0 0 0 0 0 0 0 0 0 0
7 6 7 22.9% 458 457.7 0.0 0.0 0.0 0.0 20,000.0 320.4 18 610 19 38 0 0 13 18 0 0 408 458 0 0 0 320.4 18 610 0 38 0 0 10 18 0 0 386
8 7 8 37.1% 742.4 742.4 0.0 0.0 0.0 0.0 20,000.0 519.7 18 990 19 61 0 0 21 18 0 0 639 742 0 0 0 519.7 18 990 0 61 0 0 15 18 0 0 614
9 8 9 89.1% 1,782.3 816.0 816.0 150.3 0.0 0.0 20,000.0 1,247.6 18 2,376 58 147 0 0 50 54 0 0 1,556 816 816 150 0 1,247.6 18 2,176 200 135 10 5 37 36 19 7 1,496
10 9 10 91.8% 1,835.8 816.0 816.0 203.8 0.0 0.0 20,000.0 1,285.0 18 2,448 58 151 0 0 51 54 0 0 1,599 816 816 204 0 1,285.0 18 2,176 272 135 10 7 38 36 19 7 1,53711 10 11 98.5% 1,970.6 0.0 0.0 0.0 0.0 0.0 18,029.4 0.0 18 2,627 0 163 0 0 0 0 0 0 163 816 816 250 89 1,379.4 18 2,176 451 135 20 12 41 36 21 13 1,657
12 11 12 106.6% 2,131.6 0.0 0.0 0.0 0.0 0.0 15,897.9 0.0 18 2,842 0 176 0 0 0 0 0 0 176 816 816 250 250 1,492.1 18 2,176 666 135 20 18 44 36 22 13 1,78013 12 13 109.1% 2,182.8 0.0 0.0 0.0 0.0 0.0 13,715.1 0.0 18 2,910 0 180 0 0 0 0 0 0 180 816 816 250 250 1,492.4 18 2,176 667 135 20 18 46 36 23 13 1,782
14 13 14 113.6% 2,272.4 0.0 0.0 0.0 0.0 0.0 11,442.7 0.0 18 3,030 0 187 0 0 0 0 0 0 187 816 816 250 250 1,492.4 18 2,176 667 135 20 18 47 36 24 13 1,785
15 14 15 115.0% 2,300.4 0.0 0.0 0.0 0.0 0.0 9,142.4 0.0 18 3,067 0 190 0 0 0 0 0 0 190 816 816 250 252 1,493.8 18 2,176 669 135 20 18 48 36 24 13 1,787
16 15 16 115.1% 2,301.8 0.0 0.0 0.0 0.0 0.0 6,840.5 0.0 18 3,069 0 190 0 0 0 0 0 0 190 816 816 250 250 1,492.4 18 2,176 667 135 20 18 48 36 24 13 1,786
17 16 17 107.1% 2,142.6 0.0 0.0 0.0 0.0 0.0 4,697.9 0.0 18 2,857 0 177 0 0 0 0 0 0 177 816 816 250 250 1,492.4 18 2,176 667 135 20 18 45 36 22 13 1,781
18 17 18 87.8% 1,756.0 0.0 0.0 0.0 0.0 0.0 2,941.9 0.0 18 2,341 0 145 0 0 0 0 0 0 145 816 816 124 0 1,229.2 18 2,176 165 135 10 0 37 36 0 7 1,453
19 18 19 63.8% 1,276.6 0.0 0.0 0.0 0.0 0.0 1,665.3 0.0 18 1,702 0 105 0 0 0 0 0 0 105 816 461 0 0 893.6 18 1,702 0 105 0 0 27 36 0 0 1,061
20 19 20 57.6% 1,151.1 0.0 0.0 0.0 0.0 0.0 514.2 0.0 18 1,535 0 95 0 0 0 0 0 0 95 816 335 0 0 805.8 18 1,535 0 95 0 0 24 36 0 0 961
21 20 21 55.6% 1,112.0 0.0 0.0 0.0 0.0 0.0 553.3 0.0 18 0 0 0 0 0 0 0 0 0 0 816 296 0 0 778.4 18 1,483 0 92 0 0 23 36 0 0 929
22 21 22 0.0% 0.0 816.0 816.0 816.0 0.0 0.0 3,001.3 1,713.6 18 3,264 58 202 0 0 68 54 0 0 2,096 0 0 0 0 0.0 18 0 0 0 0 0 0 0 0 0 0
23 22 23 0.0% 0.0 816.0 816.0 816.0 0.0 0.0 5,449.3 1,713.6 18 3,264 58 202 0 0 68 54 0 0 2,096 0 0 0 0 0.0 18 0 0 0 0 0 0 0 0 0 0
24Off‐Peak; TES
Charging23 24 0.0% 0 816 816 816 0 0 7,897 1,713.6 18 3,264 58 202 0 0 68 54 0 0 2,096 0 0 0 0 0.0 18 0 0 0 0 0 0 0 0 0 0
total kW‐Hr 15,271.7 20,367.2 20,794.3
Line No. Mode Start Time End Time
Percent
Existing Plant
Load
Load (tons)CH‐2 (750‐
tons)
CH‐3 (750
Tons)
CH‐4 (750
Tons)
CH‐1 (250‐
tons)
CH‐2 (250‐
tons)
TES Stored
Capacity
Water‐Cooled
Chiller kWCHW ∆T
CHW Flow
(GPM)
Central plant
Primary CHW
Pump Power
@70% & 40'
TDH (kW)
Central plant
secondary CHW
Pump Power
@70% &
230'TDH (kW)
Building 2
Primary CHW
Pump Power
@70%
&65'TDH (kW)
Building 2
Secondary
CHW Pump
Power @70% &
100'TDH (kW)
Central Plant CW
Pump Power @
2.4GPM/ton,
30'TDH & 65%
Central Plant CT
Fan kW 40Hp each
& .60 Duty Factor
Bldg. 2 CW
Pump Power
@
2.4GPM/ton,
15'TDH & 65%
Bldg. 2 CT
Fan kW 15
Hp each &
.60 Duty
Factor
TES kW DemandCH‐2 (750‐
tons)
CH‐3 (750
Tons)
CH‐1 (250‐
tons)
CH‐2 (250‐
tons)
Water
Cooled
Chiller kW
Avg.CHW ∆T
Central plant
CHW Flow
(GPM)
Bldg. 2 CHW
Flow (GPM)
Central plant
Primary CHW
Pump Power
@70% & 230'
TDH (kW)
Building 2
Primary CHW
Pump Power
@70%
&65'TDH (kW)
Building 2
Secondary
CHW Pump
Power @70%
& 100'TDH
(kW)
Central Plant
CW Pump
Power @
2.4GPM/ton,
30'TDH & 65%
Central Plant
CT Fan kW
40Hp each &
.60 Duty
Factor
Bldg. 2 CW
Pump Power
@
2.4GPM/ton,
15'TDH & 65%
Bldg. 2 CT Fan
kW 15 Hp
each & .60
Duty Factor
Existing C entral
Plant kW Demand
1 0 1 0.0% 0 816.0 816.0 816.0 0.0 0.0 10,388 1,713.6 18 3,264 58 202 0 0 68 54 0 0 2,096 0 0 0 0 0.0 18 0 0 0 0 0 0 0 0 0 0
2 1 2 0.0% 0 816.0 816.0 816.0 0.0 0.0 12,836 1,713.6 18 3,264 58 202 0 0 68 54 0 0 2,096 0 0 0 0 0.0 18 0 0 0 0 0 0 0 0 0 0
3 2 3 0.0% 0 816.0 816.0 816.0 0.0 0.0 15,284 1,713.6 18 3,264 58 202 0 0 68 54 0 0 2,096 0 0 0 0 0.0 18 0 0 0 0 0 0 0 0 0 0
4 3 4 0.0% 0 816.0 816.0 635.8 0.0 0.0 17,732 1,587.5 18 3,024 58 187 0 0 63 54 0 0 1,949 0 0 0 0 0.0 18 0 0 0 0 0 0 0 0 0 0
5 4 5 0.0% 0 0.0 0.0 0.0 0.0 0.0 20,000 0.0 18 0 0 0 0 0 0 0 0 0 0 0 0 0 0 0.0 18 0 0 0 0 0 0 0 0 0 0
6 5 6 0.0% 0 0.0 0.0 0.0 0.0 0.0 20,000 0.0 18 0 0 0 0 0 0 0 0 0 0 0 0 0 0 0.0 18 0 0 0 0 0 0 0 0 0 0
7 6 7 24.2% 484 484.0 0.0 0.0 0.0 0.0 20,000.0 338.8 18 645 19 40 0 0 13 18 0 0 429 484 0 0 0 338.8 18 645 0 40 0 0 10 18 0 0 407
8 7 8 35.3% 706.5 706.5 0.0 0.0 0.0 0.0 20,000.0 494.5 18 942 19 58 0 0 20 18 0 0 610 706 0 0 0 494.5 18 942 0 58 0 0 15 18 0 0 585
9 8 9 87.2% 1,743.2 816.0 816.0 111.2 0.0 0.0 20,000.0 1,220.3 18 2,324 58 144 0 0 48 54 0 0 1,524 816 816 111 0 1,220.3 18 2,176 148 135 10 4 36 36 18 7 1,466
10 9 10 90.8% 1,815.4 816.0 816.0 183.4 0.0 0.0 20,000.0 1,270.8 18 2,421 58 150 0 0 50 54 0 0 1,583 816 816 183 0 1,270.8 18 2,176 245 135 10 7 38 36 19 7 1,521
11 10 11 98.0% 1,959.0 0.0 0.0 0.0 0.0 0.0 18,041.0 0.0 18 2,612 0 162 0 0 0 0 0 0 162 816 816 250 77 1,371.3 18 2,176 436 135 20 12 41 36 20 13 1,648
12 11 12 105.3% 2,106.4 0.0 0.0 0.0 0.0 0.0 15,934.6 0.0 18 2,809 0 174 0 0 0 0 0 0 174 816 816 250 224 1,474.5 18 2,176 633 135 20 17 44 36 22 13 1,761
13 12 13 110.2% 2,203.6 0.0 0.0 0.0 0.0 0.0 13,731.0 0.0 18 2,938 0 182 0 0 0 0 0 0 182 816 816 250 250 1,492.4 18 2,176 667 135 20 18 46 36 23 13 1,783
14 13 14 112.7% 2,253.3 0.0 0.0 0.0 0.0 0.0 11,477.7 0.0 18 3,004 0 186 0 0 0 0 0 0 186 816 816 250 250 1,492.4 18 2,176 667 135 20 18 47 36 24 13 1,78415 14 15 114.9% 2,298.1 0.0 0.0 0.0 0.0 0.0 9,179.7 0.0 18 3,064 0 190 0 0 0 0 0 0 190 816 816 250 250 1,492.4 18 2,176 667 135 20 18 48 36 24 13 1,786
16 15 16 115.6% 2,311.4 0.0 0.0 0.0 0.0 0.0 6,868.3 0.0 18 3,082 0 191 0 0 0 0 0 0 191 816 816 250 250 1,492.4 18 2,176 667 135 20 18 48 36 24 13 1,78617 16 17 107.3% 2,146.8 0.0 0.0 0.0 0.0 0.0 4,721.4 0.0 18 2,862 0 177 0 0 0 0 0 0 177 816 816 250 250 1,492.4 18 2,176 667 135 20 18 45 36 22 13 1,781
18 17 18 87.3% 1,745.1 0.0 0.0 0.0 0.0 0.0 2,976.4 0.0 18 2,327 0 144 0 0 0 0 0 0 144 816 816 113 0 1,221.6 18 2,176 151 135 10 0 36 36 0 7 1,445
19 18 19 63.7% 1,274.0 0.0 0.0 0.0 0.0 0.0 1,702.3 0.0 18 1,699 0 105 0 0 0 0 0 0 105 816 458 0 0 891.8 18 1,699 0 105 0 0 27 36 0 0 1,059
20 19 20 56.9% 1,139.0 0.0 0.0 0.0 0.0 0.0 563.4 0.0 18 1,519 0 94 0 0 0 0 0 0 94 816 323 0 0 797.3 18 1,519 0 94 0 0 24 36 0 0 951
21 20 21 55.3% 1,106.1 0.0 0.0 0.0 0.0 0.0 596.2 0.0 18 0 0 0 0 0 0 0 0 0 0 816 290 0 0 774.3 18 1,475 0 91 0 0 23 36 0 0 924
22 21 22 0.0% 0.0 816.0 816.0 816.0 0.0 0.0 3,044.2 1,713.6 18 3,264 58 202 0 0 68 54 0 0 2,096 0 0 0 0 0.0 18 0 0 0 0 0 0 0 0 0 0
23 22 23 0.0% 0.0 816.0 816.0 816.0 0.0 0.0 5,492.2 1,713.6 18 3,264 58 202 0 0 68 54 0 0 2,096 0 0 0 0 0.0 18 0 0 0 0 0 0 0 0 0 0
24Off‐Peak; TES
Charging23 24 0.0% 0 816 816 816 0 0 7,940 1,713.6 18 3,264 58 202 0 0 68 54 0 0 2,096 0 0 0 0 0.0 18 0 0 0 0 0 0 0 0 0 0
total kW‐Hr 15,193.4 20,272.5 11,798.5 1,551.4 17,317.1 432.0 28,039.4 4,945.5 20,687.4
ALTERNATIVE #2 ‐ EXISTING CHILLER PLANT
ALTERNATIVE #2 ‐ EXISTING CHILLER PLANTALTERNATIVE #1 ‐ EXISTING CHILLER PLANT WITH TESTYPICAL AUGUST DAY COLLEGE LOAD PROFILE
Mid‐Peak; TES
Discharging
On‐Peak; TES
Discharge
Off‐Peak; TES
Charging
Off‐Peak; TES
Charging
ALTERNATIVE #1 ‐ EXISTING CHILLER PLANT WITH TES
Mid‐Peak; TES
Discharging
On‐Peak; TES
Discharge
Mid‐Peak; TES
Discharging
TYPICAL SEPTEMBER DAY COLLEGE LOAD PROFILE
Mid‐Peak; TES
Discharging
Page 77
Line No. Mode Start Time End Time
Percent
Existing Plant
Load
Load (tons)CH‐2 (750‐
tons)
CH‐3 (750
Tons)
CH‐4 (750
Tons)
CH‐1 (250‐
tons)
CH‐2 (250‐
tons)
TES Stored
Capacity
Water‐Cooled
Chiller kWCHW ∆T
CHW Flow
(GPM)
Central plant
Primary CHW
Pump Power
@70% & 40'
TDH (kW)
Central plant
secondary CHW
Pump Power
@70% &
230'TDH (kW)
Building 2
Primary CHW
Pump Power
@70%
&65'TDH (kW)
Building 2
Secondary
CHW Pump
Power @70% &
100'TDH (kW)
Central Plant CW
Pump Power @
2.4GPM/ton,
30'TDH & 65%
Central Plant CT
Fan kW 40Hp each
& .60 Duty Factor
Bldg. 2 CW
Pump Power
@
2.4GPM/ton,
15'TDH & 65%
Bldg. 2 CT
Fan kW 15
Hp each &
.60 Duty
Factor
TES kW DemandCH‐2 (750‐
tons)
CH‐3 (750
Tons)
CH‐1 (250‐
tons)
CH‐2 (250‐
tons)
Water
Cooled
Chiller kW
Avg.CHW ∆T
Central plant
CHW Flow
(GPM)
Bldg. 2 CHW
Flow (GPM)
Central plant
Primary CHW
Pump Power
@70% & 230'
TDH (kW)
Building 2
Primary CHW
Pump Power
@70%
&65'TDH (kW)
Building 2
Secondary
CHW Pump
Power @70%
& 100'TDH
(kW)
Central Plant
CW Pump
Power @
2.4GPM/ton,
30'TDH & 65%
Central Plant
CT Fan kW
40Hp each &
.60 Duty
Factor
Bldg. 2 CW
Pump Power
@
2.4GPM/ton,
15'TDH & 65%
Bldg. 2 CT Fan
kW 15 Hp
each & .60
Duty Factor
Existing C entral
Plant kW Demand
1 0 1 0.0% 0 816 816 816 0.0 0.0 10,881.4 1,713.6 18 3,264 58 202 0 0 68 54 0 0 2,096 0 0 0 0 0.0 18 0 0 0 0 0 0 0 0 0 0
2 1 2 0.0% 0 816 816 816 0.0 0.0 13,329.4 1,713.6 18 3,264 58 202 0 0 68 54 0 0 2,096 0 0 0 0 0.0 18 0 0 0 0 0 0 0 0 0 0
3 2 3 0.0% 0 816 816 816 0.0 0.0 15,777.4 1,713.6 18 3,264 58 202 0 0 68 54 0 0 2,096 0 0 0 0 0.0 18 0 0 0 0 0 0 0 0 0 0
4 3 4 0.0% 0 816 816 816 0.0 0.0 18,225.4 1,713.6 18 3,264 58 202 0 0 68 54 0 0 2,096 0 0 0 0 0.0 18 0 0 0 0 0 0 0 0 0 0
5 4 5 0.0% 0 816 816 143 0.0 0.0 20,000.0 1,242.2 18 2,366 58 146 0 0 49 54 0 0 1,550 0 0 0 0 0.0 18 0 0 0 0 0 0 0 0 0 0
6 5 6 0.0% 0 0 0 0 0.0 0.0 20,000.0 0.0 18 0 0 0 0 0 0 0 0 0 0 0 0 0 0 0.0 18 0 0 0 0 0 0 0 0 0 0
7 6 7 0.0% 0 0 0 0 0.0 0.0 20,000.0 0.0 18 0 0 0 0 0 0 0 0 0 0 0 0 0 0 0.0 18 0 0 0 0 0 0 0 0 0 0
8 7 8 16.8% 335.2 0 0 0 0.0 0.0 19,664.8 0.0 18 447 0 28 0 0 0 0 0 0 28 0 0 250 85 234.7 18 0 447 0 14 12 0 0 3 13 278
9 8 9 24.5% 490.1 0.0 0.0 0.0 0.0 0.0 19,174.6 0.0 18 654 0 40 0 0 0 0 0 0 40 0 0 250 240 343.1 18 0 654 0 14 18 0 0 5 13 393
10 9 10 45.1% 902.5 0.0 0.0 0.0 0.0 0.0 18,272.1 0.0 18 1,203 0 74 0 0 0 0 0 0 74 816 87 0 0 631.8 18 1,203 0 74 0 0 19 36 0 0 761
11 10 11 49.6% 991.6 0.0 0.0 0.0 0.0 0.0 17,280.5 0.0 18 1,322 0 82 0 0 0 0 0 0 82 816 176 0 0 694.1 18 1,322 0 82 0 0 21 36 0 0 832
12 11 12 57.3% 1,145.8 0.0 0.0 0.0 0.0 0.0 16,134.7 0.0 18 1,528 0 95 0 0 0 0 0 0 95 816 330 0 0 802.0 18 1,528 0 95 0 0 24 36 0 0 956
13 12 13 64.7% 1,294.7 0.0 0.0 0.0 0.0 0.0 14,839.9 0.0 18 1,726 0 107 0 0 0 0 0 0 107 816 479 0 0 906.3 18 1,726 0 107 0 0 27 36 0 0 1,076
14 13 14 67.2% 1,343.2 0.0 0.0 0.0 0.0 0.0 13,496.8 0.0 18 1,791 0 111 0 0 0 0 0 0 111 816 527 0 0 940.2 18 1,791 0 111 0 0 28 36 0 0 1,115
15 14 15 74.6% 1,491.2 0.0 0.0 0.0 0.0 0.0 12,005.5 0.0 18 1,988 0 123 0 0 0 0 0 0 123 816 675 0 0 1,043.9 18 1,988 0 123 0 0 31 36 0 0 1,234
16 15 16 84.0% 1,679.3 0.0 0.0 0.0 0.0 0.0 10,326.3 0.0 18 2,239 0 139 0 0 0 0 0 0 139 816 816 47 0 1,175.5 18 2,176 63 135 7 2 35 36 18 7 1,414
17 16 17 86.7% 1,734.4 0.0 0.0 0.0 0.0 0.0 8,591.9 0.0 18 2,312 0 143 0 0 0 0 0 0 143 816 816 102 0 1,214.0 18 2,176 136 135 7 4 36 36 18 7 1,456
18 17 18 76.0% 1,520.9 0.0 0.0 0.0 0.0 0.0 7,071.0 0.0 18 2,028 0 125 0 0 0 0 0 0 125 816 705 0 0 1,064.7 18 2,028 0 125 0 0 32 36 0 0 1,258
19 18 19 60.0% 1,200.9 0.0 0.0 0.0 0.0 0.0 5,870.1 0.0 18 1,601 0 99 0 0 0 0 0 0 99 816 385 0 0 840.6 18 1,601 0 99 0 0 25 36 0 0 1,001
20 19 20 41.5% 829.8 0.0 0.0 0.0 0.0 0.0 5,040.3 0.0 18 1,106 0 68 0 0 0 0 0 0 68 816 14 0 0 580.9 18 1,106 0 68 0 0 17 36 0 0 702
21 20 21 37.6% 752.7 0.0 0.0 0.0 0.0 0.0 4,287.5 0.0 18 1,004 0 62 0 0 0 0 0 0 62 753 0 0 0 526.9 18 1,004 0 62 0 0 16 18 0 0 623
22 21 22 37.5% 750.2 0.0 0.0 0.0 0.0 0.0 3,537.4 0.0 18 1,000 0 62 0 0 0 0 0 0 62 750 0 0 0 525.1 18 1,000 0 62 0 0 16 18 0 0 621
23 22 23 0.0% 0.0 816 816 816 0.0 0.0 5,985.4 1,713.6 18 3,264 58 202 0 0 68 54 0 0 2,096 0 0 0 0 0.0 18 0 0 0 0 0 0 0 0 0 024 23 24 0.0% 0 816 816 816 0 0 8,433 1,713.6 18 3,264 58 202 0 0 68 54 0 0 2,096 0 0 0 0 0.0 18 0 0 0 0 0 0 0 0 0 0
total kW‐Hr 11,523.8 15,481.0 11,524 35 44 40 40 13,719 13,719.2
Line No. Mode Start Time End Time
Percent
Existing Plant
Load
Load (tons)CH‐2 (750‐
tons)
CH‐3 (750
Tons)
CH‐4 (750
Tons)
CH‐1 (250‐
tons)
CH‐2 (250‐
tons)
TES Stored
Capacity
Water‐Cooled
Chiller kWCHW ∆T
CHW Flow
(GPM)
Central plant
Primary CHW
Pump Power
@70% & 40'
TDH (kW)
Central plant
secondary CHW
Pump Power
@70% &
230'TDH (kW)
Building 2
Primary CHW
Pump Power
@70%
&65'TDH (kW)
Building 2
Secondary
CHW Pump
Power @70% &
100'TDH (kW)
Central Plant CW
Pump Power @
2.4GPM/ton,
30'TDH & 65%
Central Plant CT
Fan kW 40Hp each
& .60 Duty Factor
Bldg. 2 CW
Pump Power
@
2.4GPM/ton,
15'TDH & 65%
Bldg. 2 CT
Fan kW 15
Hp each &
.60 Duty
Factor
TES kW DemandCH‐2 (750‐
tons)
CH‐3 (750
Tons)
CH‐1 (250‐
tons)
CH‐2 (250‐
tons)
Water
Cooled
Chiller kW
Avg.CHW ∆T
Central plant
CHW Flow
(GPM)
Bldg. 2 CHW
Flow (GPM)
Central plant
Primary CHW
Pump Power
@70% & 230'
TDH (kW)
Building 2
Primary CHW
Pump Power
@70%
&65'TDH (kW)
Building 2
Secondary
CHW Pump
Power @70%
& 100'TDH
(kW)
Central Plant
CW Pump
Power @
2.4GPM/ton,
30'TDH & 65%
Central Plant
CT Fan kW
40Hp each &
.60 Duty
Factor
Bldg. 2 CW
Pump Power
@
2.4GPM/ton,
15'TDH & 65%
Bldg. 2 CT Fan
kW 15 Hp
each & .60
Duty Factor
Existing C entral
Plant kW Demand
1 0 1 0.0% 0 816 816 816 0.0 0.0 16,314.0 1,713.6 18 3,264 58 202 0 0 68 54 0 0 2,096 0 0 0 0 0.0 18 0 0 0 0 0 0 0 0 0 0
2 1 2 0.0% 0 816 816 816 0.0 0.0 18,762.0 1,713.6 18 3,264 58 202 0 0 68 54 0 0 2,096 0 0 0 0 0.0 18 0 0 0 0 0 0 0 0 0 0
3 2 3 0.0% 0 816 422 0 0.0 0.0 20,000.0 866.6 18 1,651 39 102 0 0 34 36 0 0 1,078 0 0 0 0 0.0 18 0 0 0 0 0 0 0 0 0 0
4 3 4 0.0% 0 0 0 0 0.0 0.0 20,000.0 0.0 18 0 0 0 0 0 0 0 0 0 0 0 0 0 0 0.0 18 0 0 0 0 0 0 0 0 0 0
5 4 5 0.0% 0 0 0 0 0.0 0.0 20,000.0 0.0 18 0 0 0 0 0 0 0 0 0 0 0 0 0 0 0.0 18 0 0 0 0 0 0 0 0 0 0
6 5 6 0.0% 0 0 0 0 0.0 0.0 20,000.0 0.0 18 0 0 0 0 0 0 0 0 0 0 0 0 0 0 0.0 18 0 0 0 0 0 0 0 0 0 0
7 6 7 0.0% 0 0 0 0 0.0 0.0 20,000.0 0.0 18 0 0 0 0 0 0 0 0 0 0 0 0 0 0 0.0 18 0 0 0 0 0 0 0 0 0 0
8 7 8 7.5% 150.0 0 0 0 0.0 0.0 19,850.0 0.0 18 200 0 12 0 0 0 0 0 0 12 0 0 150 0 105.0 18 0 200 0 7 5 0 0 2 7 126
9 8 9 10.2% 204.2 0.0 0.0 0.0 0.0 0.0 19,645.7 0.0 18 272 0 17 0 0 0 0 0 0 17 0 0 204 0 143.0 18 0 272 0 7 7 0 0 2 7 166
10 9 10 23.1% 462.0 0.0 0.0 0.0 0.0 0.0 19,183.8 0.0 18 616 0 38 0 0 0 0 0 0 38 462 0 0 0 323.4 18 616 0 38 0 0 10 18 0 0 389
11 10 11 28.2% 563.1 0.0 0.0 0.0 0.0 0.0 18,620.6 0.0 18 751 0 46 0 0 0 0 0 0 46 563 0 0 0 394.2 18 751 0 46 0 0 12 18 0 0 470
12 11 12 39.0% 780.6 0.0 0.0 0.0 0.0 0.0 17,840.0 0.0 18 1,041 0 64 0 0 0 0 0 0 64 781 0 0 0 546.4 18 1,041 0 64 0 0 16 18 0 0 645
13 12 13 44.4% 887.8 0.0 0.0 0.0 0.0 0.0 16,952.2 0.0 18 1,184 0 73 0 0 0 0 0 0 73 816 0 0 0 571.2 18 1,088 0 67 0 0 19 18 0 0 675
14 13 14 44.6% 892.9 0.0 0.0 0.0 0.0 0.0 16,059.3 0.0 18 1,191 0 74 0 0 0 0 0 0 74 816 0 0 0 571.2 18 1,088 0 67 0 0 19 18 0 0 675
15 14 15 51.9% 1,037.4 0.0 0.0 0.0 0.0 0.0 15,021.9 0.0 18 1,383 0 86 0 0 0 0 0 0 86 816 221 0 0 726.2 18 1,383 0 86 0 0 22 36 0 0 869
16 15 16 57.2% 1,144.7 0.0 0.0 0.0 0.0 0.0 13,877.1 0.0 18 1,526 0 94 0 0 0 0 0 0 94 816 329 0 0 801.3 18 1,526 0 94 0 0 24 36 0 0 955
17 16 17 58.9% 1,178.1 0.0 0.0 0.0 0.0 0.0 12,699.1 0.0 18 1,571 0 97 0 0 0 0 0 0 97 816 362 0 0 824.6 18 1,571 0 97 0 0 25 36 0 0 982
18 17 18 50.7% 1,014.0 0.0 0.0 0.0 0.0 0.0 11,685.1 0.0 18 1,352 0 84 0 0 0 0 0 0 84 816 198 0 0 709.8 18 1,352 0 84 0 0 21 36 0 0 850
19 18 19 41.7% 834.5 0.0 0.0 0.0 0.0 0.0 10,850.6 0.0 18 1,113 0 69 0 0 0 0 0 0 69 816 19 0 0 584.2 18 1,113 0 69 0 0 17 36 0 0 706
20 19 20 32.9% 658.3 0.0 0.0 0.0 0.0 0.0 10,192.2 0.0 18 878 0 54 0 0 0 0 0 0 54 658 0 0 0 460.8 18 878 0 54 0 0 14 18 0 0 547
21 20 21 30.6% 612.3 0.0 0.0 0.0 0.0 0.0 9,579.9 0.0 18 816 0 51 0 0 0 0 0 0 51 612 0 0 0 428.6 18 816 0 51 0 0 13 18 0 0 510
22 21 22 30.5% 610.0 0.0 0.0 0.0 0.0 0.0 8,970.0 0.0 18 813 0 50 0 0 0 0 0 0 50 610 0 0 0 427.0 18 813 0 50 0 0 13 18 0 0 508
23 22 23 0.0% 0 816 816 816 0.0 0.0 11,418.0 1,713.6 18 3,264 58 202 0 0 68 54 0 0 2,096 0 0 0 0 0.0 18 0 0 0 0 0 0 0 0 0 024 23 24 0.0% 0 816 816 816 0 0 13,866 1,713.6 18 3,264 58 202 0 0 68 54 0 0 2,096 0 0 0 0 0.0 18 0 0 0 0 0 0 0 0 0 0
total kW‐Hr 7,721.0 10,369.7 9,398 0 7,617 432 14,036 472 9,074.4
Chillers
ALTERNATIVE #2 ‐ EXISTING CHILLER PLANT
ALTERNATIVE #2 ‐ EXISTING CHILLER PLANT
Off‐Peak; TES
Charging
Mid‐Peak; TES
Off‐Peak; TES
Charging
ALTERNATIVE #1 ‐ EXISTING CHILLER PLANT WITH TESTYPICAL NOVEMBER DAY COLLEGE LOAD PROFILE
Off‐Peak; TES
Charging
Off‐Peak; TES
Charging
Mid‐Peak; TES
TYPICAL OCTOBER DAY COLLEGE LOAD PROFILE ALTERNATIVE #1 ‐ EXISTING CHILLER PLANT WITH TES Chillers
Page 78
Line No. Mode Start Time End Time
Percent
Existing Plant
Load
Load (tons)CH‐2 (750‐
tons)
CH‐3 (750
Tons)
CH‐4 (750
Tons)
CH‐1 (250‐
tons)
CH‐2 (250‐
tons)
TES Stored
Capacity
Water‐Cooled
Chiller kWCHW ∆T
CHW Flow
(GPM)
Central plant
Primary CHW
Pump Power
@70% & 40'
TDH (kW)
Central plant
secondary CHW
Pump Power
@70% &
230'TDH (kW)
Building 2
Primary CHW
Pump Power
@70%
&65'TDH (kW)
Building 2
Secondary
CHW Pump
Power @70% &
100'TDH (kW)
Central Plant CW
Pump Power @
2.4GPM/ton,
30'TDH & 65%
Central Plant CT
Fan kW 40Hp each
& .60 Duty Factor
Bldg. 2 CW
Pump Power
@
2.4GPM/ton,
15'TDH & 65%
Bldg. 2 CT
Fan kW 15
Hp each &
.60 Duty
Factor
TES kW DemandCH‐2 (750‐
tons)
CH‐3 (750
Tons)
CH‐1 (250‐
tons)
CH‐2 (250‐
tons)
Water
Cooled
Chiller kW
Avg.CHW ∆T
Central plant
CHW Flow
(GPM)
Bldg. 2 CHW
Flow (GPM)
Central plant
Primary CHW
Pump Power
@70% & 230'
TDH (kW)
Building 2
Primary CHW
Pump Power
@70%
&65'TDH (kW)
Building 2
Secondary
CHW Pump
Power @70%
& 100'TDH
(kW)
Central Plant
CW Pump
Power @
2.4GPM/ton,
30'TDH & 65%
Central Plant
CT Fan kW
40Hp each &
.60 Duty
Factor
Bldg. 2 CW
Pump Power
@
2.4GPM/ton,
15'TDH & 65%
Bldg. 2 CT Fan
kW 15 Hp
each & .60
Duty Factor
Existing C entral
Plant kW Demand
1 0 1 0.0% 0 816 816 816 0.0 0.0 18,807.3 1,713.6 18 3,264 58 202 0 0 68 54 0 0 2,096 0 0 0 0 0.0 18 0 0 0 0 0 0 0 0 0 0
2 1 2 0.0% 0 816 377 0 0.0 0.0 20,000.0 834.9 18 1,590 39 98 0 0 33 36 0 0 1,041 0 0 0 0 0.0 18 0 0 0 0 0 0 0 0 0 0
3 2 3 0.0% 0 0 0 0 0.0 0.0 20,000.0 0.0 18 0 0 0 0 0 0 0 0 0 0 0 0 0 0 0.0 18 0 0 0 0 0 0 0 0 0 0
4 3 4 0.0% 0 0 0 0 0.0 0.0 20,000.0 0.0 18 0 0 0 0 0 0 0 0 0 0 0 0 0 0 0.0 18 0 0 0 0 0 0 0 0 0 0
5 4 5 0.0% 0 0 0 0 0.0 0.0 20,000.0 0.0 18 0 0 0 0 0 0 0 0 0 0 0 0 0 0 0.0 18 0 0 0 0 0 0 0 0 0 0
6 5 6 0.0% 0 0 0 0 0.0 0.0 20,000.0 0.0 18 0 0 0 0 0 0 0 0 0 0 0 0 0 0 0.0 18 0 0 0 0 0 0 0 0 0 0
7 6 7 0.0% 0 0 0 0 0.0 0.0 20,000.0 0.0 18 0 0 0 0 0 0 0 0 0 0 0 0 0 0 0.0 18 0 0 0 0 0 0 0 0 0 0
8 7 8 6.5% 129.3 0 0 0 0.0 0.0 19,870.7 0.0 18 172 0 11 0 0 0 0 0 0 11 0 0 129 0 90.5 18 0 172 0 7 5 0 0 1 7 110
9 8 9 8.4% 168.0 0.0 0.0 0.0 0.0 0.0 19,702.7 0.0 18 224 0 14 0 0 0 0 0 0 14 0 0 168 0 117.6 18 0 224 0 7 6 0 0 2 7 139
10 9 10 14.1% 281.1 0.0 0.0 0.0 0.0 0.0 19,421.6 0.0 18 375 0 23 0 0 0 0 0 0 23 281 0 0 0 196.8 18 375 0 23 0 0 6 18 0 0 244
11 10 11 18.0% 359.9 0.0 0.0 0.0 0.0 0.0 19,061.8 0.0 18 480 0 30 0 0 0 0 0 0 30 360 0 0 0 251.9 18 480 0 30 0 0 8 18 0 0 307
12 11 12 27.0% 540.1 0.0 0.0 0.0 0.0 0.0 18,521.7 0.0 18 720 0 45 0 0 0 0 0 0 45 540 0 0 0 378.1 18 720 0 45 0 0 11 18 0 0 452
13 12 13 33.5% 670.4 0.0 0.0 0.0 0.0 0.0 17,851.3 0.0 18 894 0 55 0 0 0 0 0 0 55 670 0 0 0 469.3 18 894 0 55 0 0 14 18 0 0 556
14 13 14 34.5% 689.6 0.0 0.0 0.0 0.0 0.0 17,161.6 0.0 18 920 0 57 0 0 0 0 0 0 57 690 0 0 0 482.8 18 920 0 57 0 0 14 18 0 0 572
15 14 15 41.3% 826.9 0.0 0.0 0.0 0.0 0.0 16,334.7 0.0 18 1,103 0 68 0 0 0 0 0 0 68 816 11 0 0 578.8 18 1,103 0 68 0 0 17 36 0 0 700
16 15 16 44.0% 879.7 0.0 0.0 0.0 0.0 0.0 15,455.0 0.0 18 1,173 0 73 0 0 0 0 0 0 73 816 64 0 0 615.8 18 1,173 0 73 0 0 18 36 0 0 743
17 16 17 44.7% 893.5 0.0 0.0 0.0 0.0 0.0 14,561.5 0.0 18 1,191 0 74 0 0 0 0 0 0 74 816 78 0 0 625.5 18 1,191 0 74 0 0 19 36 0 0 754
18 17 18 38.8% 775.6 0.0 0.0 0.0 0.0 0.0 13,785.9 0.0 18 1,034 0 64 0 0 0 0 0 0 64 776 0 0 0 542.9 18 1,034 0 64 0 0 16 18 0 0 641
19 18 19 32.2% 644.2 0.0 0.0 0.0 0.0 0.0 13,141.7 0.0 18 859 0 53 0 0 0 0 0 0 53 644 0 0 0 450.9 18 859 0 53 0 0 13 18 0 0 535
20 19 20 29.2% 583.4 0.0 0.0 0.0 0.0 0.0 12,558.3 0.0 18 778 0 48 0 0 0 0 0 0 48 583 0 0 0 408.4 18 778 0 48 0 0 12 18 0 0 487
21 20 21 27.4% 548.0 0.0 0.0 0.0 0.0 0.0 12,010.3 0.0 18 731 0 45 0 0 0 0 0 0 45 548 0 0 0 383.6 18 731 0 45 0 0 11 18 0 0 458
22 21 22 27.4% 547.0 0.0 0.0 0.0 0.0 0.0 11,463.3 0.0 18 729 0 45 0 0 0 0 0 0 45 547 0 0 0 382.9 18 729 0 45 0 0 11 18 0 0 457
23 22 23 0.0% 0 816 816 816 0.0 0.0 13,911.3 1,713.6 18 3,264 58 202 0 0 68 54 0 0 2,096 0 0 0 0 0.0 18 0 0 0 0 0 0 0 0 0 024 23 24 0.0% 0 816 816 816 0 0 16,359 1,713.6 18 3,264 58 202 0 0 68 54 0 0 2,096 0 0 0 0 0.0 18 0 0 0 0 0 0 0 0 0 0
total kW‐Hr 5,975.7 8,031.8 8,087 0 5,976 432 10,986 396 7,155.2
Line No. Mode Start Time End Time
Percent
Existing Plant
Load
Load (tons)CH‐2 (750‐
tons)
CH‐3 (750
Tons)
CH‐4 (750
Tons)
CH‐1 (250‐
tons)
CH‐2 (250‐
tons)
TES Stored
Capacity
Water‐Cooled
Chiller kWCHW ∆T
CHW Flow
(GPM)
Central plant
Primary CHW
Pump Power
@70% & 40'
TDH (kW)
Central plant
secondary CHW
Pump Power
@70% &
230'TDH (kW)
Building 2
Primary CHW
Pump Power
@70%
&65'TDH (kW)
Building 2
Secondary
CHW Pump
Power @70% &
100'TDH (kW)
Central Plant CW
Pump Power @
2.4GPM/ton,
30'TDH & 65%
Central Plant CT
Fan kW 40Hp each
& .60 Duty Factor
Bldg. 2 CW
Pump Power
@
2.4GPM/ton,
15'TDH & 65%
Bldg. 2 CT
Fan kW 15
Hp each &
.60 Duty
Factor
TES kW DemandCH‐2 (750‐
tons)
CH‐3 (750
Tons)
CH‐1 (250‐
tons)
CH‐2 (250‐
tons)
Water
Cooled
Chiller kW
Avg.CHW ∆T
Central plant
CHW Flow
(GPM)
Bldg. 2 CHW
Flow (GPM)
Central plant
Primary CHW
Pump Power
@70% & 230'
TDH (kW)
Building 2
Primary CHW
Pump Power
@70%
&65'TDH (kW)
Building 2
Secondary
CHW Pump
Power @70%
& 100'TDH
(kW)
Central Plant
CW Pump
Power @
2.4GPM/ton,
30'TDH & 65%
Central Plant
CT Fan kW
40Hp each &
.60 Duty
Factor
Bldg. 2 CW
Pump Power
@
2.4GPM/ton,
15'TDH & 65%
Bldg. 2 CT Fan
kW 15 Hp
each & .60
Duty Factor
Existing C entral
Plant kW Demand
1 0 1 0.0% 0 816 816 485 0.0 0.0 20,000.0 1,482.2 18 2,823 58 175 0 0 59 54 0 0 1,828 0 0 0 0 0.0 18 0 0 0 0 0 0 0 0 0 0
2 1 2 0.0% 0 0 0 0 0.0 0.0 20,000.0 0.0 18 0 0 0 0 0 0 0 0 0 0 0 0 0 0 0.0 18 0 0 0 0 0 0 0 0 0 0
3 2 3 0.0% 0 0 0 0 0.0 0.0 20,000.0 0.0 18 0 0 0 0 0 0 0 0 0 0 0 0 0 0 0.0 18 0 0 0 0 0 0 0 0 0 0
4 3 4 0.0% 0 0 0 0 0.0 0.0 20,000.0 0.0 18 0 0 0 0 0 0 0 0 0 0 0 0 0 0 0.0 18 0 0 0 0 0 0 0 0 0 0
5 4 5 0.0% 0 0 0 0 0.0 0.0 20,000.0 0.0 18 0 0 0 0 0 0 0 0 0 0 0 0 0 0 0.0 18 0 0 0 0 0 0 0 0 0 0
6 5 6 0.0% 0 0 0 0 0.0 0.0 20,000.0 0.0 18 0 0 0 0 0 0 0 0 0 0 0 0 0 0 0.0 18 0 0 0 0 0 0 0 0 0 0
7 6 7 0.0% 0 0 0 0 0.0 0.0 20,000.0 0.0 18 0 0 0 0 0 0 0 0 0 0 0 0 0 0 0.0 18 0 0 0 0 0 0 0 0 0 0
8 7 8 6.0% 119.1 0 0 0 0.0 0.0 19,880.9 0.0 18 159 0 10 0 0 0 0 0 0 10 0 0 119 0 83.4 18 0 159 0 7 4 0 0 1 7 103
9 8 9 7.9% 158.8 0.0 0.0 0.0 0.0 0.0 19,722.1 0.0 18 212 0 13 0 0 0 0 0 0 13 0 0 159 0 111.2 18 0 212 0 7 6 0 0 2 7 132
10 9 10 9.6% 191.3 0.0 0.0 0.0 0.0 0.0 19,530.7 0.0 18 255 0 16 0 0 0 0 0 0 16 191 0 0 0 133.9 18 255 0 16 0 0 4 18 0 0 172
11 10 11 13.4% 268.9 0.0 0.0 0.0 0.0 0.0 19,261.9 0.0 18 358 0 22 0 0 0 0 0 0 22 269 0 0 0 188.2 18 358 0 22 0 0 6 18 0 0 234
12 11 12 20.6% 412.6 0.0 0.0 0.0 0.0 0.0 18,849.3 0.0 18 550 0 34 0 0 0 0 0 0 34 413 0 0 0 288.8 18 550 0 34 0 0 9 18 0 0 349
13 12 13 26.8% 535.8 0.0 0.0 0.0 0.0 0.0 18,313.5 0.0 18 714 0 44 0 0 0 0 0 0 44 536 0 0 0 375.1 18 714 0 44 0 0 11 18 0 0 448
14 13 14 27.8% 555.9 0.0 0.0 0.0 0.0 0.0 17,757.5 0.0 18 741 0 46 0 0 0 0 0 0 46 556 0 0 0 389.1 18 741 0 46 0 0 12 18 0 0 465
15 14 15 32.7% 653.0 0.0 0.0 0.0 0.0 0.0 17,104.5 0.0 18 871 0 54 0 0 0 0 0 0 54 653 0 0 0 457.1 18 871 0 54 0 0 14 18 0 0 543
16 15 16 35.1% 701.9 0.0 0.0 0.0 0.0 0.0 16,402.7 0.0 18 936 0 58 0 0 0 0 0 0 58 702 0 0 0 491.3 18 936 0 58 0 0 15 18 0 0 582
17 16 17 34.6% 691.2 0.0 0.0 0.0 0.0 0.0 15,711.5 0.0 18 922 0 57 0 0 0 0 0 0 57 691 0 0 0 483.8 18 922 0 57 0 0 14 18 0 0 573
18 17 18 32.5% 650.6 0.0 0.0 0.0 0.0 0.0 15,060.9 0.0 18 867 0 54 0 0 0 0 0 0 54 651 0 0 0 455.4 18 867 0 54 0 0 14 18 0 0 541
19 18 19 27.9% 558.3 0.0 0.0 0.0 0.0 0.0 14,502.6 0.0 18 744 0 46 0 0 0 0 0 0 46 558 0 0 0 390.8 18 744 0 46 0 0 12 18 0 0 466
20 19 20 25.6% 511.6 0.0 0.0 0.0 0.0 0.0 13,991.0 0.0 18 682 0 42 0 0 0 0 0 0 42 512 0 0 0 358.1 18 682 0 42 0 0 11 18 0 0 429
21 20 21 25.0% 499.1 0.0 0.0 0.0 0.0 0.0 13,491.9 0.0 18 666 0 41 0 0 0 0 0 0 41 499 0 0 0 349.4 18 666 0 41 0 0 10 18 0 0 419
22 21 22 25.3% 505 0.0 0.0 0.0 0.0 0.0 12,986.6 0.0 18 674 0 42 0 0 0 0 0 0 42 505 0 0 0 353.7 18 674 0 42 0 0 11 18 0 0 424
23 22 23 0.0% 0 816 816 816 0.0 0.0 15,434.6 1,713.6 18 3,264 58 202 0 0 68 54 0 0 2,096 0 0 0 0 0.0 18 0 0 0 0 0 0 0 0 0 024 23 24 0.0% 0 816 816 816 0 0 17,883 1,713.6 18 3,264 58 202 0 0 68 54 0 0 2,096 0 0 0 0 0.0 18 0 0 0 0 0 0 0 0 0 0
total kW‐Hr 4,909.4 6,597.2 6,735 0 4,909 432 8,981 371 5,878.8
ALTERNATIVE #2 ‐ EXISTING CHILLER PLANT
TYPICAL JANUARY DAY COLLEGE LOAD PROFILE ALTERNATIVE #1 ‐ EXISTING CHILLER PLANT WITH TES
Off‐Peak; TES
Charging
Chillers ALTERNATIVE #2 ‐ EXISTING CHILLER PLANT
ALTERNATIVE #1 ‐ EXISTING CHILLER PLANT WITH TES
Off‐Peak; TES
Charging
Mid‐Peak; TES
Off‐Peak; TES
Charging
TYPICAL DECEMBER DAY COLLEGE LOAD PROFILE Chillers
Mid‐Peak; TES
Off‐Peak; TES
Charging
Page 79
Line No. Mode Start Time End Time
Percent
Existing Plant
Load
Load (tons)CH‐2 (750‐
tons)
CH‐3 (750
Tons)
CH‐4 (750
Tons)
CH‐1 (250‐
tons)
CH‐2 (250‐
tons)
TES Stored
Capacity
Water‐Cooled
Chiller kWCHW ∆T
CHW Flow
(GPM)
Central plant
Primary CHW
Pump Power
@70% & 40'
TDH (kW)
Central plant
secondary CHW
Pump Power
@70% &
230'TDH (kW)
Building 2
Primary CHW
Pump Power
@70%
&65'TDH (kW)
Building 2
Secondary
CHW Pump
Power @70% &
100'TDH (kW)
Central Plant CW
Pump Power @
2.4GPM/ton,
30'TDH & 65%
Central Plant CT
Fan kW 40Hp each
& .60 Duty Factor
Bldg. 2 CW
Pump Power
@
2.4GPM/ton,
15'TDH & 65%
Bldg. 2 CT
Fan kW 15
Hp each &
.60 Duty
Factor
TES kW DemandCH‐2 (750‐
tons)
CH‐3 (750
Tons)
CH‐1 (250‐
tons)
CH‐2 (250‐
tons)
Water
Cooled
Chiller kW
Avg.CHW ∆T
Central plant
CHW Flow
(GPM)
Bldg. 2 CHW
Flow (GPM)
Central plant
Primary CHW
Pump Power
@70% & 230'
TDH (kW)
Building 2
Primary CHW
Pump Power
@70%
&65'TDH (kW)
Building 2
Secondary
CHW Pump
Power @70%
& 100'TDH
(kW)
Central Plant
CW Pump
Power @
2.4GPM/ton,
30'TDH & 65%
Central Plant
CT Fan kW
40Hp each &
.60 Duty
Factor
Bldg. 2 CW
Pump Power
@
2.4GPM/ton,
15'TDH & 65%
Bldg. 2 CT Fan
kW 15 Hp
each & .60
Duty Factor
Existing C entral
Plant kW Demand
1 0 1 0.0% 0 816 816 816 0.0 0.0 19,467.2 1,713.6 18 3,264 58 202 0 0 68 54 0 0 2,096 0 0 0 0 0.0 18 0 0 0 0 0 0 0 0 0 0
2 1 2 0.0% 0 533 0 0 0.0 0.0 20,000.0 373.0 18 710 19 44 0 0 15 18 0 0 469 0 0 0 0 0.0 18 0 0 0 0 0 0 0 0 0 0
3 2 3 0.0% 0 0 0 0 0.0 0.0 20,000.0 0.0 18 0 0 0 0 0 0 0 0 0 0 0 0 0 0 0.0 18 0 0 0 0 0 0 0 0 0 0
4 3 4 0.0% 0 0 0 0 0.0 0.0 20,000.0 0.0 18 0 0 0 0 0 0 0 0 0 0 0 0 0 0 0.0 18 0 0 0 0 0 0 0 0 0 0
5 4 5 0.0% 0 0 0 0 0.0 0.0 20,000.0 0.0 18 0 0 0 0 0 0 0 0 0 0 0 0 0 0 0.0 18 0 0 0 0 0 0 0 0 0 0
6 5 6 0.0% 0 0 0 0 0.0 0.0 20,000.0 0.0 18 0 0 0 0 0 0 0 0 0 0 0 0 0 0 0.0 18 0 0 0 0 0 0 0 0 0 0
7 6 7 0.0% 0 0 0 0 0.0 0.0 20,000.0 0.0 18 0 0 0 0 0 0 0 0 0 0 0 0 0 0 0.0 18 0 0 0 0 0 0 0 0 0 0
8 7 8 6.6% 132.9 0 0 0 0.0 0.0 19,867.1 0.0 18 177 0 11 0 0 0 0 0 0 11 0 0 133 0 93.0 18 0 177 0 7 5 0 0 1 7 113
9 8 9 8.9% 177.1 0.0 0.0 0.0 0.0 0.0 19,690.0 0.0 18 236 0 15 0 0 0 0 0 0 15 0 0 177 0 124.0 18 0 236 0 7 6 0 0 2 7 146
10 9 10 14.1% 282.8 0.0 0.0 0.0 0.0 0.0 19,407.2 0.0 18 377 0 23 0 0 0 0 0 0 23 283 0 0 0 198.0 18 377 0 23 0 0 6 18 0 0 245
11 10 11 18.2% 364.3 0.0 0.0 0.0 0.0 0.0 19,042.8 0.0 18 486 0 30 0 0 0 0 0 0 30 364 0 0 0 255.0 18 486 0 30 0 0 8 18 0 0 311
12 11 12 27.8% 555.3 0.0 0.0 0.0 0.0 0.0 18,487.5 0.0 18 740 0 46 0 0 0 0 0 0 46 555 0 0 0 388.7 18 740 0 46 0 0 12 18 0 0 464
13 12 13 32.5% 650.4 0.0 0.0 0.0 0.0 0.0 17,837.1 0.0 18 867 0 54 0 0 0 0 0 0 54 650 0 0 0 455.3 18 867 0 54 0 0 14 18 0 0 540
14 13 14 33.1% 661.9 0.0 0.0 0.0 0.0 0.0 17,175.1 0.0 18 883 0 55 0 0 0 0 0 0 55 662 0 0 0 463.3 18 883 0 55 0 0 14 18 0 0 550
15 14 15 39.0% 779.7 0.0 0.0 0.0 0.0 0.0 16,395.5 0.0 18 1,040 0 64 0 0 0 0 0 0 64 780 0 0 0 545.8 18 1,040 0 64 0 0 16 18 0 0 644
16 15 16 41.7% 834.6 0.0 0.0 0.0 0.0 0.0 15,560.8 0.0 18 1,113 0 69 0 0 0 0 0 0 69 816 19 0 0 584.2 18 1,113 0 69 0 0 17 36 0 0 706
17 16 17 42.0% 840.0 0.0 0.0 0.0 0.0 0.0 14,720.9 0.0 18 1,120 0 69 0 0 0 0 0 0 69 816 24 0 0 588.0 18 1,120 0 69 0 0 18 36 0 0 711
18 17 18 39.2% 783.1 0.0 0.0 0.0 0.0 0.0 13,937.7 0.0 18 1,044 0 65 0 0 0 0 0 0 65 783 0 0 0 548.2 18 1,044 0 65 0 0 16 18 0 0 647
19 18 19 32.7% 653.6 0.0 0.0 0.0 0.0 0.0 13,284.2 0.0 18 871 0 54 0 0 0 0 0 0 54 654 0 0 0 457.5 18 871 0 54 0 0 14 18 0 0 543
20 19 20 29.9% 598.1 0.0 0.0 0.0 0.0 0.0 12,686.1 0.0 18 797 0 49 0 0 0 0 0 0 49 598 0 0 0 418.7 18 797 0 49 0 0 12 18 0 0 498
21 20 21 28.1% 562.9 0.0 0.0 0.0 0.0 0.0 12,123.2 0.0 18 751 0 46 0 0 0 0 0 0 46 563 0 0 0 394.1 18 751 0 46 0 0 12 18 0 0 470
22 21 22 0.0% 0.0 0.0 0.0 0.0 0.0 0.0 12,123.2 0.0 18 0 0 0 0 0 0 0 0 0 0 0 0 0 0 0.0 18 0 0 0 0 0 0 18 0 0 18
23 22 23 0.0% 0.0 816 816 816 0.0 0.0 14,571.2 1,713.6 18 3,264 58 202 0 0 68 54 0 0 2,096 0 0 0 0 0.0 18 0 0 0 0 0 0 0 0 0 024 23 24 0.0% 0 816 816 816 0 0 17,019 1,713.6 18 3,264 58 202 0 0 68 54 0 0 2,096 0 0 0 0 0.0 18 0 0 0 0 0 0 0 0 0 0
total kW‐Hr 5,513.8 7,405.4 7,524 0 5,514 432 10,089 413 6,606.5
Line No. Mode Start Time End Time
Percent
Existing Plant
Load
Load (tons)CH‐2 (750‐
tons)
CH‐3 (750
Tons)
CH‐4 (750
Tons)
CH‐1 (250‐
tons)
CH‐2 (250‐
tons)
TES Stored
Capacity
Water‐Cooled
Chiller kWCHW ∆T
CHW Flow
(GPM)
Central plant
Primary CHW
Pump Power
@70% & 40'
TDH (kW)
Central plant
secondary CHW
Pump Power
@70% &
230'TDH (kW)
Building 2
Primary CHW
Pump Power
@70%
&65'TDH (kW)
Building 2
Secondary
CHW Pump
Power @70% &
100'TDH (kW)
Central Plant CW
Pump Power @
2.4GPM/ton,
30'TDH & 65%
Central Plant CT
Fan kW 40Hp each
& .60 Duty Factor
Bldg. 2 CW
Pump Power
@
2.4GPM/ton,
15'TDH & 65%
Bldg. 2 CT
Fan kW 15
Hp each &
.60 Duty
Factor
TES kW DemandCH‐2 (750‐
tons)
CH‐3 (750
Tons)
CH‐1 (250‐
tons)
CH‐2 (250‐
tons)
Water
Cooled
Chiller kW
Avg.CHW ∆T
Central plant
CHW Flow
(GPM)
Bldg. 2 CHW
Flow (GPM)
Central plant
Primary CHW
Pump Power
@70% & 230'
TDH (kW)
Building 2
Primary CHW
Pump Power
@70%
&65'TDH (kW)
Building 2
Secondary
CHW Pump
Power @70%
& 100'TDH
(kW)
Central Plant
CW Pump
Power @
2.4GPM/ton,
30'TDH & 65%
Central Plant
CT Fan kW
40Hp each &
.60 Duty
Factor
Bldg. 2 CW
Pump Power
@
2.4GPM/ton,
15'TDH & 65%
Bldg. 2 CT Fan
kW 15 Hp
each & .60
Duty Factor
Existing C entral
Plant kW Demand
1 0 1 0.0% 0 816 816 816 0.0 0.0 18,286.5 1,713.6 18 3,264 58 202 0 0 68 54 0 0 2,096 0 0 0 0 0.0 18 0 0 0 0 0 0 0 0 0 0
2 1 2 0.0% 0 816 816 82 0.0 0.0 20,000.0 1,199.8 18 2,285 58 141 0 0 48 54 0 0 1,501 0 0 0 0 0.0 18 0 0 0 0 0 0 0 0 0 0
3 2 3 0.0% 0 0 0 0 0.0 0.0 20,000.0 0.0 18 0 0 0 0 0 0 0 0 0 0 0 0 0 0 0.0 18 0 0 0 0 0 0 0 0 0 0
4 3 4 0.0% 0 0 0 0 0.0 0.0 20,000.0 0.0 18 0 0 0 0 0 0 0 0 0 0 0 0 0 0 0.0 18 0 0 0 0 0 0 0 0 0 0
5 4 5 0.0% 0 0 0 0 0.0 0.0 20,000.0 0.0 18 0 0 0 0 0 0 0 0 0 0 0 0 0 0 0.0 18 0 0 0 0 0 0 0 0 0 0
6 5 6 0.0% 0 0 0 0 0.0 0.0 20,000.0 0.0 18 0 0 0 0 0 0 0 0 0 0 0 0 0 0 0.0 18 0 0 0 0 0 0 0 0 0 0
7 6 7 0.0% 0 0 0 0 0.0 0.0 20,000.0 0.0 18 0 0 0 0 0 0 0 0 0 0 0 0 0 0 0.0 18 0 0 0 0 0 0 0 0 0 0
8 7 8 6.9% 138.8 0 0 0 0.0 0.0 19,861.2 0.0 18 185 0 11 0 0 0 0 0 0 11 0 0 139 0 97.2 18 0 185 0 7 5 0 0 1 7 117
9 8 9 9.3% 186.5 0.0 0.0 0.0 0.0 0.0 19,674.7 0.0 18 249 0 15 0 0 0 0 0 0 15 0 0 187 0 130.6 18 0 249 0 7 7 0 0 2 7 153
10 9 10 15.6% 311.1 0.0 0.0 0.0 0.0 0.0 19,363.6 0.0 18 415 0 26 0 0 0 0 0 0 26 311 0 0 0 217.7 18 415 0 26 0 0 6 18 0 0 268
11 10 11 19.4% 388.5 0.0 0.0 0.0 0.0 0.0 18,975.1 0.0 18 518 0 32 0 0 0 0 0 0 32 388 0 0 0 271.9 18 518 0 32 0 0 8 18 0 0 330
12 11 12 29.5% 589.3 0.0 0.0 0.0 0.0 0.0 18,385.9 0.0 18 786 0 49 0 0 0 0 0 0 49 589 0 0 0 412.5 18 786 0 49 0 0 12 18 0 0 491
13 12 13 35.2% 704.3 0.0 0.0 0.0 0.0 0.0 17,681.6 0.0 18 939 0 58 0 0 0 0 0 0 58 704 0 0 0 493.0 18 939 0 58 0 0 15 18 0 0 584
14 13 14 35.3% 706.8 0.0 0.0 0.0 0.0 0.0 16,974.8 0.0 18 942 0 58 0 0 0 0 0 0 58 707 0 0 0 494.8 18 942 0 58 0 0 15 18 0 0 586
15 14 15 41.9% 838.6 0.0 0.0 0.0 0.0 0.0 16,136.3 0.0 18 1,118 0 69 0 0 0 0 0 0 69 816 23 0 0 587.0 18 1,118 0 69 0 0 17 36 0 0 710
16 15 16 45.3% 906.0 0.0 0.0 0.0 0.0 0.0 15,230.3 0.0 18 1,208 0 75 0 0 0 0 0 0 75 816 90 0 0 634.2 18 1,208 0 75 0 0 19 36 0 0 764
17 16 17 45.9% 917.4 0.0 0.0 0.0 0.0 0.0 14,312.8 0.0 18 1,223 0 76 0 0 0 0 0 0 76 816 101 0 0 642.2 18 1,223 0 76 0 0 19 36 0 0 773
18 17 18 42.6% 852.8 0.0 0.0 0.0 0.0 0.0 13,460.1 0.0 18 1,137 0 70 0 0 0 0 0 0 70 816 37 0 0 596.9 18 1,137 0 70 0 0 18 36 0 0 721
19 18 19 35.3% 706.3 0.0 0.0 0.0 0.0 0.0 12,753.8 0.0 18 942 0 58 0 0 0 0 0 0 58 706 0 0 0 494.4 18 942 0 58 0 0 15 18 0 0 585
20 19 20 31.7% 635.0 0.0 0.0 0.0 0.0 0.0 12,118.8 0.0 18 847 0 52 0 0 0 0 0 0 52 635 0 0 0 444.5 18 847 0 52 0 0 13 18 0 0 528
21 20 21 29.5% 591.0 0.0 0.0 0.0 0.0 0.0 11,527.9 0.0 18 788 0 49 0 0 0 0 0 0 49 591 0 0 0 413.7 18 788 0 49 0 0 12 18 0 0 493
22 21 22 29.3% 585.4 0.0 0.0 0.0 0.0 0.0 10,942.5 0.0 18 781 0 48 0 0 0 0 0 0 48 585 0 0 0 409.8 18 781 0 48 0 0 12 18 0 0 488
23 22 23 0.0% 0 816 816 816 0.0 0.0 13,390.5 1,713.6 18 3,264 58 202 0 0 68 54 0 0 2,096 0 0 0 0 0.0 18 0 0 0 0 0 0 0 0 0 024 23 24 0.0% 0 816 816 816 0 0 15,838 1,713.6 18 3,264 58 202 0 0 68 54 0 0 2,096 0 0 0 0 0.0 18 0 0 0 0 0 0 0 0 0 0
total kW‐Hr 6,340.6 8,534.5 8,481 0 6,340 432 11,643 434 7,589.9
TYPICAL FEBRUARY DAY COLLEGE LOAD PROFILE ALTERNATIVE #1 ‐ EXISTING CHILLER PLANT WITH TES Chillers ALTERNATIVE #2 ‐ EXISTING CHILLER PLANT
ALTERNATIVE #2 ‐ EXISTING CHILLER PLANT
Off‐Peak; TES
Charging
Mid‐Peak; TES
Off‐Peak; TES
Charging
Off‐Peak; TES
Charging
Mid‐Peak; TES
Off‐Peak; TES
Charging
TYPICAL MARCH DAY COLLEGE LOAD PROFILE ALTERNATIVE #1 ‐ EXISTING CHILLER PLANT WITH TES Chillers
Page 80
Line No. Mode Start Time End Time
Percent
Existing Plant
Load
Load (tons)CH‐2 (750‐
tons)
CH‐3 (750
Tons)
CH‐4 (750
Tons)
CH‐1 (250‐
tons)
CH‐2 (250‐
tons)
TES Stored
Capacity
Water‐Cooled
Chiller kWCHW ∆T
CHW Flow
(GPM)
Central plant
Primary CHW
Pump Power
@70% & 40'
TDH (kW)
Central plant
secondary CHW
Pump Power
@70% &
230'TDH (kW)
Building 2
Primary CHW
Pump Power
@70%
&65'TDH (kW)
Building 2
Secondary
CHW Pump
Power @70% &
100'TDH (kW)
Central Plant CW
Pump Power @
2.4GPM/ton,
30'TDH & 65%
Central Plant CT
Fan kW 40Hp each
& .60 Duty Factor
Bldg. 2 CW
Pump Power
@
2.4GPM/ton,
15'TDH & 65%
Bldg. 2 CT
Fan kW 15
Hp each &
.60 Duty
Factor
TES kW DemandCH‐2 (750‐
tons)
CH‐3 (750
Tons)
CH‐1 (250‐
tons)
CH‐2 (250‐
tons)
Water
Cooled
Chiller kW
Avg.CHW ∆T
Central plant
CHW Flow
(GPM)
Bldg. 2 CHW
Flow (GPM)
Central plant
Primary CHW
Pump Power
@70% & 230'
TDH (kW)
Building 2
Primary CHW
Pump Power
@70%
&65'TDH (kW)
Building 2
Secondary
CHW Pump
Power @70%
& 100'TDH
(kW)
Central Plant
CW Pump
Power @
2.4GPM/ton,
30'TDH & 65%
Central Plant
CT Fan kW
40Hp each &
.60 Duty
Factor
Bldg. 2 CW
Pump Power
@
2.4GPM/ton,
15'TDH & 65%
Bldg. 2 CT Fan
kW 15 Hp
each & .60
Duty Factor
Existing C entral
Plant kW Demand
1 0 1 0.0% 0 816 816 816 0.0 0.0 14,794.7 1,713.6 18 3,264 58 202 0 0 68 54 0 0 2,096 0 0 0 0 0.0 18 0 0 0 0 0 0 0 0 0 0
2 1 2 0.0% 0 816 816 816 0.0 0.0 17,242.7 1,713.6 18 3,264 58 202 0 0 68 54 0 0 2,096 0 0 0 0 0.0 18 0 0 0 0 0 0 0 0 0 0
3 2 3 0.0% 0 816 816 816 0.0 0.0 19,690.7 1,713.6 18 3,264 58 202 0 0 68 54 0 0 2,096 0 0 0 0 0.0 18 0 0 0 0 0 0 0 0 0 0
4 3 4 0.0% 0 309 0 0 0.0 0.0 20,000.0 216.5 18 412 39 26 0 0 9 36 0 0 325 0 0 0 0 0.0 18 0 0 0 0 0 0 0 0 0 0
5 4 5 0.0% 0 0 0 0 0.0 0.0 20,000.0 0.0 18 0 0 0 0 0 0 0 0 0 0 0 0 0 0 0.0 18 0 0 0 0 0 0 0 0 0 0
6 5 6 0.0% 0 0 0 0 0.0 0.0 20,000.0 0.0 18 0 0 0 0 0 0 0 0 0 0 0 0 0 0 0.0 18 0 0 0 0 0 0 0 0 0 0
7 6 7 0.0% 0 0 0 0 0.0 0.0 20,000.0 0.0 18 0 0 0 0 0 0 0 0 0 0 0 0 0 0 0.0 18 0 0 0 0 0 0 0 0 0 0
8 7 8 7.4% 148.0 0 0 0 0.0 0.0 19,852.0 0.0 18 197 0 12 0 0 0 0 0 0 12 0 0 148 0 103.6 18 0 197 0 7 5 0 0 2 7 124
9 8 9 10.2% 204.8 0.0 0.0 0.0 0.0 0.0 19,647.2 0.0 18 273 0 17 0 0 0 0 0 0 17 0 0 205 0 143.4 18 0 273 0 7 7 0 0 2 7 167
10 9 10 21.8% 436.7 0.0 0.0 0.0 0.0 0.0 19,210.5 0.0 18 582 0 36 0 0 0 0 0 0 36 437 0 0 0 305.7 18 582 0 36 0 0 9 18 0 0 369
11 10 11 28.4% 568.1 0.0 0.0 0.0 0.0 0.0 18,642.3 0.0 18 758 0 47 0 0 0 0 0 0 47 568 0 0 0 397.7 18 758 0 47 0 0 12 18 0 0 474
12 11 12 36.4% 728.4 0.0 0.0 0.0 0.0 0.0 17,913.9 0.0 18 971 0 60 0 0 0 0 0 0 60 728 0 0 0 509.9 18 971 0 60 0 0 15 18 0 0 603
13 12 13 42.6% 852.6 0.0 0.0 0.0 0.0 0.0 17,061.3 0.0 18 1,137 0 70 0 0 0 0 0 0 70 816 37 0 0 596.8 18 1,137 0 70 0 0 18 36 0 0 721
14 13 14 43.8% 877.0 0.0 0.0 0.0 0.0 0.0 16,184.3 0.0 18 1,169 0 72 0 0 0 0 0 0 72 816 61 0 0 613.9 18 1,169 0 72 0 0 18 36 0 0 740
15 14 15 51.2% 1,024.9 0.0 0.0 0.0 0.0 0.0 15,159.4 0.0 18 1,367 0 85 0 0 0 0 0 0 85 816 209 0 0 717.5 18 1,367 0 85 0 0 21 36 0 0 859
16 15 16 57.5% 1,150.5 0.0 0.0 0.0 0.0 0.0 14,008.9 0.0 18 1,534 0 95 0 0 0 0 0 0 95 816 335 0 0 805.4 18 1,534 0 95 0 0 24 36 0 0 960
17 16 17 97.3% 1,946.6 0.0 0.0 0.0 0.0 0.0 12,062.2 0.0 18 2,596 0 161 0 0 0 0 0 0 161 816 816 315 0 1,362.6 18 2,176 420 135 7 11 41 36 20 7 1,619
18 17 18 82.5% 1,650.3 0.0 0.0 0.0 0.0 0.0 10,412.0 0.0 18 2,200 0 136 0 0 0 0 0 0 136 816 816 18 0 1,155.2 18 2,176 24 135 7 1 34 36 17 7 1,392
19 18 19 45.1% 902.7 0.0 0.0 0.0 0.0 0.0 9,509.3 0.0 18 1,204 0 74 0 0 0 0 0 0 74 816 87 0 0 631.9 18 1,204 0 74 0 0 19 36 0 0 761
20 19 20 36.4% 727.7 0.0 0.0 0.0 0.0 0.0 8,781.6 0.0 18 970 0 60 0 0 0 0 0 0 60 728 0 0 0 509.4 18 970 0 60 0 0 15 18 0 0 603
21 20 21 33.5% 669.9 0.0 0.0 0.0 0.0 0.0 8,111.7 0.0 18 893 0 55 0 0 0 0 0 0 55 670 0 0 0 468.9 18 893 0 55 0 0 14 18 0 0 556
22 21 22 33.0% 661.0 0.0 0.0 0.0 0.0 0.0 7,450.7 0.0 18 881 0 55 0 0 0 0 0 0 55 661 0 0 0 462.7 18 881 0 55 0 0 14 18 0 0 549
23 22 23 0.0% 0 816 816 816 0.0 0.0 9,898.7 1,713.6 18 3,264 58 202 0 0 68 54 0 0 2,096 0 0 0 0 0.0 18 0 0 0 0 0 0 0 0 0 024 23 24 0.0% 0 816 816 816 0 0 12,347 1,713.6 18 3,264 58 202 0 0 68 54 0 0 2,096 0 0 0 0 0.0 18 0 0 0 0 0 0 0 0 0 0
total kW‐Hr 8,784.5 11,838.0 8,784 15,818 914 10,496.7
Line No. Mode Start Time End Time
Percent
Existing Plant
Load
Load (tons)CH‐2 (750‐
tons)
CH‐3 (750
Tons)
CH‐4 (750
Tons)
CH‐1 (250‐
tons)
CH‐2 (250‐
tons)
TES Stored
Capacity
Water‐Cooled
Chiller kWCHW ∆T
CHW Flow
(GPM)
Central plant
Primary CHW
Pump Power
@70% & 40'
TDH (kW)
Central plant
secondary CHW
Pump Power
@70% &
230'TDH (kW)
Building 2
Primary CHW
Pump Power
@70%
&65'TDH (kW)
Building 2
Secondary
CHW Pump
Power @70% &
100'TDH (kW)
Central Plant CW
Pump Power @
2.4GPM/ton,
30'TDH & 65%
Central Plant CT
Fan kW 40Hp each
& .60 Duty Factor
Bldg. 2 CW
Pump Power
@
2.4GPM/ton,
15'TDH & 65%
Bldg. 2 CT
Fan kW 15
Hp each &
.60 Duty
Factor
TES kW DemandCH‐2 (750‐
tons)
CH‐3 (750
Tons)
CH‐1 (250‐
tons)
CH‐2 (250‐
tons)
Water
Cooled
Chiller kW
Avg.CHW ∆T
Central plant
CHW Flow
(GPM)
Bldg. 2 CHW
Flow (GPM)
Central plant
Primary CHW
Pump Power
@70% & 230'
TDH (kW)
Building 2
Primary CHW
Pump Power
@70%
&65'TDH (kW)
Building 2
Secondary
CHW Pump
Power @70%
& 100'TDH
(kW)
Central Plant
CW Pump
Power @
2.4GPM/ton,
30'TDH & 65%
Central Plant
CT Fan kW
40Hp each &
.60 Duty
Factor
Bldg. 2 CW
Pump Power
@
2.4GPM/ton,
15'TDH & 65%
Bldg. 2 CT Fan
kW 15 Hp
each & .60
Duty Factor
Existing C entral
Plant kW Demand
1 0 1 0.0% 0 816 816 816 0.0 0.0 11,702.3 1,713.6 18 3,264 58 202 0 0 68 54 0 0 2,096 0 0 0 0 0.0 18 0 0 0 0 0 0 0 0 0 0
2 1 2 0.0% 0 816 816 816 0.0 0.0 14,150.3 1,713.6 18 3,264 58 202 0 0 68 54 0 0 2,096 0 0 0 0 0.0 18 0 0 0 0 0 0 0 0 0 0
3 2 3 0.0% 0 816 816 816 0.0 0.0 16,598.3 1,713.6 18 3,264 58 202 0 0 68 54 0 0 2,096 0 0 0 0 0.0 18 0 0 0 0 0 0 0 0 0 0
4 3 4 0.0% 0 816 816 816 0.0 0.0 19,046.3 1,713.6 18 3,264 58 202 0 0 68 54 0 0 2,096 0 0 0 0 0.0 18 0 0 0 0 0 0 0 0 0 0
5 4 5 0.0% 0 816 138 0 0.0 0.0 20,000.0 667.6 18 1,272 39 79 0 0 27 36 0 0 847 0 0 0 0 0.0 18 0 0 0 0 0 6 0 0 0 0
6 5 6 0.0% 0 0 0 0 0.0 0.0 20,000.0 0.0 18 0 0 0 0 0 0 0 0 0 0 0 0 0 0 0.0 18 0 0 0 0 0 0 0 0 0 0
7 6 7 0.0% 0 0 0 0 0.0 0.0 20,000.0 0.0 18 0 0 0 0 0 0 0 0 0 0 0 0 0 0 0.0 18 0 0 0 0 0 0 0 0 0 0
8 7 8 10.0% 200.4 0 0 0 0.0 0.0 19,799.6 0.0 18 267 0 17 0 0 0 0 0 0 17 0 0 200 0 140.3 18 0 267 0 7 7 0 0 2 7 163
9 8 9 15.2% 304.1 0.0 0.0 0.0 0.0 0.0 19,495.5 0.0 18 405 0 25 0 0 0 0 0 0 25 0 0 250 54 212.8 18 0 405 0 14 11 0 0 3 13 254
10 9 10 44.4% 888.2 0.0 0.0 0.0 0.0 0.0 18,607.3 0.0 18 1,184 0 73 0 0 0 0 0 0 73 816 72 0 0 621.7 18 1,184 0 73 0 0 19 18 0 0 731
11 10 11 53.6% 1,071.3 0.0 0.0 0.0 0.0 0.0 17,536.0 0.0 18 1,428 0 88 0 0 0 0 0 0 88 816 255 0 0 749.9 18 1,428 0 88 0 0 22 18 0 0 879
12 11 12 58.7% 1,174.9 0.0 0.0 0.0 0.0 0.0 16,361.1 0.0 18 1,567 0 97 0 0 0 0 0 0 97 816 359 0 0 822.4 18 1,567 0 97 0 0 25 18 0 0 962
13 12 13 65.6% 1,312.3 0.0 0.0 0.0 0.0 0.0 15,048.8 0.0 18 1,750 0 108 0 0 0 0 0 0 108 816 496 0 0 918.6 18 1,750 0 108 0 0 27 36 0 0 1,090
14 13 14 67.6% 1,351.9 0.0 0.0 0.0 0.0 0.0 13,696.9 0.0 18 1,803 0 112 0 0 0 0 0 0 112 816 536 0 0 946.3 18 1,803 0 112 0 0 28 36 0 0 1,122
15 14 15 72.1% 1,442.7 0.0 0.0 0.0 0.0 0.0 12,254.2 0.0 18 1,924 0 119 0 0 0 0 0 0 119 816 627 0 0 1,009.9 18 1,924 0 119 0 0 30 36 0 0 1,195
16 15 16 75.3% 1,505.3 0.0 0.0 0.0 0.0 0.0 10,748.9 0.0 18 2,007 0 124 0 0 0 0 0 0 124 816 689 0 0 1,053.7 18 2,007 0 124 0 0 31 36 0 0 1,245
17 16 17 75.6% 1,511.7 0.0 0.0 0.0 0.0 0.0 9,237.2 0.0 18 2,016 0 125 0 0 0 0 0 0 125 816 696 0 0 1,058.2 18 2,016 0 125 0 0 32 36 0 0 1,250
18 17 18 67.9% 1,358.1 0.0 0.0 0.0 0.0 0.0 7,879.0 0.0 18 1,811 0 112 0 0 0 0 0 0 112 816 542 0 0 950.7 18 1,811 0 112 0 0 28 36 0 0 1,127
19 18 19 57.6% 1,151.7 0.0 0.0 0.0 0.0 0.0 6,727.3 0.0 18 1,536 0 95 0 0 0 0 0 0 95 816 336 0 0 806.2 18 1,536 0 95 0 0 24 36 0 0 961
20 19 20 42.8% 855.3 0.0 0.0 0.0 0.0 0.0 5,872.0 0.0 18 1,140 0 71 0 0 0 0 0 0 71 816 39 0 0 598.7 18 1,140 0 71 0 0 18 18 0 0 705
21 20 21 38.0% 760.9 0.0 0.0 0.0 0.0 0.0 5,111.0 0.0 18 1,015 0 63 0 0 0 0 0 0 63 761 0 0 0 532.7 18 1,015 0 63 0 0 16 18 0 0 629
22 21 22 37.6% 752.8 0.0 0.0 0.0 0.0 0.0 4,358.3 0.0 18 1,004 0 62 0 0 0 0 0 0 62 753 0 0 0 526.9 18 1,004 0 62 0 0 16 18 0 0 623
23 22 23 0.0% 0 816 816 816 0.0 0.0 6,806.3 1,713.6 18 3,264 58 202 0 0 68 54 0 0 2,096 0 0 0 0 0.0 18 0 0 0 0 0 0 0 0 0 024 23 24 0.0% 0 816 816 816 0 0 9,254 1,713.6 18 3,264 58 202 0 0 68 54 0 0 2,096 0 0 0 0 0.0 18 0 0 0 0 0 0 0 0 0 0
total kW‐Hr 10,949.2 14,710.8 12,936.6
ALTERNATIVE #2 ‐ EXISTING CHILLER PLANT
ALTERNATIVE #2 ‐ EXISTING CHILLER PLANT
Mid‐Peak; TES
Off‐Peak; TES
Charging
TYPICAL MAY DAY COLLEGE LOAD PROFILE ALTERNATIVE #1 ‐ CHILLER PLANT WITH TES
TYPICAL APRIL DAY COLLEGE LOAD PROFILE Chillers
Off‐Peak; TES
Charging
ALTERNATIVE #1 ‐ EXISTING CHILLER PLANT WITH TES
Off‐Peak; TES
Charging
Mid‐Peak; TES
Off‐Peak; TES
Charging
Chillers
Page 81
Start Time End TimeCooling kW
DemandDelivery Service
Generation
ChargesTotal $/kWh
Consumption
ChargeStart Time End Time
Cooling kW
Demand
Delivery
Service
Generation
ChargesTotal $/kWh Consumption Charge
0 1 184,404 0.01889 0.03950 0.05839 $10,767.37 0 1 0 0.06600 0.07670 0.14270 $0.00
1 2 184,404 0.01889 0.03950 0.05839 $10,767.37 1 2 0 0.06600 0.07670 0.14270 $0.00
2 3 184,404 0.01889 0.03950 0.05839 $10,767.37 2 3 0 0.06600 0.07670 0.14270 $0.00
3 4 164,656 0.01889 0.03950 0.05839 $9,614.27 3 4 0 0.06600 0.07670 0.14270 $0.00
4 5 0 0.01889 0.03950 0.05839 $0.00 4 5 0 0.06600 0.07670 0.14270 $0.00
5 6 0 0.01889 0.03950 0.05839 $0.00 5 6 0 0.06600 0.07670 0.14270 $0.00
6 7 27,371 0.01889 0.03950 0.05839 $1,598.20 6 7 30,992 0.06600 0.07670 0.14270 $4,422.49
7 8 41,720 0.01889 0.06483 0.08372 $3,492.77 7 8 48,702 0.06600 0.07670 0.14270 $6,949.73
8 9 103,349 0.01889 0.06483 0.08372 $8,652.36 8 9 121,574 0.06600 0.07670 0.14270 $17,348.60
9 10 106,982 0.01889 0.06483 0.08372 $8,956.55 9 10 125,266 0.06600 0.07670 0.14270 $17,875.53
10 11 13,335 0.01889 0.06483 0.08372 $1,116.43 10 11 135,554 0.06600 0.07670 0.14270 $19,343.59
11 12 14,424 0.01889 0.06483 0.08372 $1,207.61 11 12 146,529 0.06600 0.07670 0.14270 $20,909.64
12 13 14,882 0.01889 0.08629 0.10518 $1,565.31 12 13 148,806 0.06600 0.07670 0.14270 $21,234.64
13 14 15,593 0.01889 0.08629 0.10518 $1,640.04 13 14 151,821 0.06600 0.07670 0.14270 $21,664.82
14 15 16,020 0.01889 0.08629 0.10518 $1,684.96 14 15 154,104 0.06600 0.07670 0.14270 $21,990.67
15 16 16,149 0.01889 0.08629 0.10518 $1,698.51 15 16 154,561 0.06600 0.07670 0.14270 $22,055.84
16 17 14,887 0.01889 0.08629 0.10518 $1,565.80 16 17 150,418 0.06600 0.07670 0.14270 $21,464.71
17 18 12,211 0.01889 0.08629 0.10518 $1,284.31 17 18 122,501 0.06600 0.07670 0.14270 $17,480.84
18 19 8,881 0.01889 0.06483 0.08372 $743.51 18 19 89,636 0.06600 0.07670 0.14270 $12,791.07
19 20 7,914 0.01889 0.06483 0.08372 $662.58 19 20 77,989 0.06600 0.07670 0.14270 $11,129.04
20 21 0 0.01889 0.06483 0.08372 $0.00 20 21 75,361 0.06600 0.07670 0.14270 $10,753.95
21 22 184,404 0.01889 0.06483 0.08372 $15,438.33 21 22 0 0.06600 0.07670 0.14270 $0.00
22 23 184,404 0.01889 0.06483 0.08372 $15,438.33 22 23 0 0.06600 0.07670 0.14270 $0.00
23 24 180,875 0.01889 0.03950 0.05839 $10,561.27 23 24 0 0.06600 0.07670 0.14270 $0.00
1,681,270 $119,223.26 1,733,813 $247,415.17
on 89,741 on 9,438.94$ on 882,211 on 125,891.52$
mid 665,414 mid 55,708.46$ mid 820,611 mid 117,101.16$
off 926,115 off 54,075.86$ off 30,992 off 4,422.49$
Peak Demand
(kW)
Fac
Demand/kW
Fac. Rel Demand
Charge
$119,223.26 191 $12.31 $2,347.34 $18.63 $3,552.47 176 $5.22 $917.93
$247,415.17 1,786 $13.71 $24,488.19 $13.71 $24,488.19 1,780 $13.71 $24,406.75
Start Time End TimeCooling kW
DemandDelivery Service
Generation
ChargesTotal $/kWh
Consumption
ChargeStart Time End Time
Cooling kW
Demand
Delivery
Service
Generation
ChargesTotal $/kWh Consumption Charge
0 1 362,915 0.01889 0.03542 0.05431 $19,709.92 0 1 0 0.06600 0.07670 0.14270 $0.00
1 2 250,642 0.01889 0.03542 0.05431 $13,612.38 1 2 0 0.06600 0.07670 0.14270 $0.00
2 3 162,014 0.01889 0.03542 0.05431 $8,798.97 2 3 0 0.06600 0.07670 0.14270 $0.00
3 4 99,356 0.01889 0.03542 0.05431 $5,396.03 3 4 0 0.06600 0.07670 0.14270 $0.00
4 5 52,739 0.01889 0.03542 0.05431 $2,864.25 4 5 0 0.06600 0.07670 0.14270 $0.00
5 6 0 0.01889 0.03542 0.05431 $0.00 5 6 0 0.06600 0.07670 0.14270 $0.00
6 7 0 0.01889 0.03542 0.05431 $0.00 6 7 0 0.06600 0.07670 0.14270 $0.00
7 8 2,457 0.01889 0.03542 0.05431 $133.45 7 8 24,944 0.06600 0.07670 0.14270 $3,559.47
8 9 3,437 0.01889 0.05956 0.07845 $269.63 8 9 34,109 0.06600 0.07670 0.14270 $4,867.32
9 10 6,816 0.01889 0.05956 0.07845 $534.75 9 10 69,926 0.06600 0.07670 0.14270 $9,978.49
10 11 8,305 0.01889 0.05956 0.07845 $651.50 10 11 84,419 0.06600 0.07670 0.14270 $12,046.53
11 12 10,757 0.01889 0.05956 0.07845 $843.89 11 12 108,300 0.06600 0.07670 0.14270 $15,454.41
12 13 12,538 0.01889 0.05956 0.07845 $983.63 12 13 125,198 0.06600 0.07670 0.14270 $17,865.75
13 14 12,848 0.01889 0.05956 0.07845 $1,007.96 13 14 128,131 0.06600 0.07670 0.14270 $18,284.27
14 15 14,691 0.01889 0.05956 0.07845 $1,152.50 14 15 148,580 0.06600 0.07670 0.14270 $21,202.31
15 16 15,975 0.01889 0.05956 0.07845 $1,253.25 15 16 162,118 0.06600 0.07670 0.14270 $23,134.26
16 17 17,628 0.01889 0.05956 0.07845 $1,382.93 16 17 178,598 0.06600 0.07670 0.14270 $25,485.89
17 18 15,618 0.01889 0.05956 0.07845 $1,225.24 17 18 157,876 0.06600 0.07670 0.14270 $22,528.96
18 19 12,073 0.01889 0.05956 0.07845 $947.14 18 19 122,300 0.06600 0.07670 0.14270 $17,452.20
19 20 9,799 0.01889 0.05956 0.07845 $768.75 19 20 98,973 0.06600 0.07670 0.14270 $14,123.47
20 21 9,069 0.01889 0.05956 0.07845 $711.46 20 21 91,468 0.06600 0.07670 0.14270 $13,052.45
21 22 8,007 0.01889 0.03542 0.05431 $434.84 21 22 81,123 0.06600 0.07670 0.14270 $11,576.19
22 23 368,809 0.01889 0.03542 0.05431 $20,030.00 22 23 0 0.06600 0.07670 0.14270 $0.00
23 24 368,809 0.01889 0.03542 0.05431 $20,030.00 23 24 0 0.06600 0.07670 0.14270 $0.00
1,825,303 $102,742.45 1,616,061 $230,611.96
mid 149,555 mid 11,732.60$ mid 1,509,995 mid 215,476.30$
off 1,675,748 off 91,009.85$ off 106,066 off 15,135.66$
$875 Incentive per kW
2,311 Tonnage Offset
$1,415,487.50 Incentive
$127,869.51 Winter Cost Savings
$128,191.92 Summer Cost Savings
$66,565.40 Summer KW Savings
$322,626.82 Total Annual Savings
Typical Winter Existing Chillers (176 days in Operation)
Typical Summer Existing Chillers (88 Days of Operation)
Peak Demand Summer
(August 3pm)
Mid Peak Demand Summer
(July 11am)
Typical Summer Chillers with TES Tank (88 days of Operation)
Typical Winter Chillers with TES Tank (176 days in Operation)
Page 82
Appendix E - Probable Construction Cost Estimate
Mt San Antonio College SCE Permanent Load Shifting Program Incentive 81 | P a g e
Page 83
MT SAN ANTONIO COLLEGE TES ADDITION PROJECT
Description of Item Qty Unit Cost Total Cost
Thermal Energy Storage System 1 $3,300,000 $3,300,000
750 Ton Chiller 1 $310,000 $310,000
750 Ton Cooling Tower 1 $400,000 $400,000
Underground Chilled Water Piping 800 $550 $440,000
Inside Plant Chilled Water Piping L.S. $100,000 $100,000
Pumps and Accessories L.S. $200,000 $200,000
Controls L.S. $250,000 $250,000
Electrical Connections L.S. $120,000 $120,000
Structural inside plant L.S. $65,000 $65,000
Allowances DSA L.S. $50,000 $50,000
Total Costs $5,235,000