Movable fiber probe for gas-phase laser-induced breakdown spectroscopy
Cosmin E. Dumitrescu,1 Paulius V. Puzinauskas,1,* and Semih Olcmen2
1Department of Mechanical Engineering, University of Alabama, Tuscaloosa, Alabama 35487, USA2Department of Aerospace Engineering and Mechanics, University of Alabama, Tuscaloosa, Alabama 35487, USA
Laser-induced breakdown spectroscopy (LIBS) is anopticaldiagnostic techniqueusedtodeterminetheele-mentalcompositionofsolids, liquids,andgases[1–17].LIBS spectra are obtained from a nanosecond pulsedlaser beam focused into or onto themedium to be ana-lyzed. The intensity of elemental emission lines inthese spectra can be used to quantify relative elemen-tal concentrations. Detailed background of the LIBStechnique [1–8] and LIBS equivalence ratio measure-ments [9–17] is available in previous literature.The motivation of the present work came from ob-
serving the complexity and safety requirements of aconventional LIBS setup using open (exposed) optics.
Open optics require extensive optical alignment eachtime theyare setupanda clearpathbetween the laserand the environment to be analyzed. Special personalsafety and equipment precautions are required whenworking with exposed optics at the required laserpower levels. A solution for remote optical diagnosticsis to use flexible optic fiber for laser beam delivery.Maintaining the beam within a fiber-optic guide willsignificantly improve the general safety of the imple-mentation. Full fiber coupling (for both delivery andcollection) has already been applied for liquid- andsolid-phase environments [18]. Larger optical inten-sity and energy requirements for gas-phase break-down has delayed the development of fiber-coupledLIBS probes for use in gaseous media. Optical break-down (sparks) in atmospheric gases requires laser in-tensity of the order of102 to103 GW=cm2 [19],which isabove the damage threshold for propagation of
nanosecond pulses in standard solid optical fibers.Laser beam transmission experiments using multi-mode silica fiber performed preliminary to this effortindicated that these fibers are also unsuitable forLIBS beam delivery. The fiber tested was manufac-tured by Polymicro Technologies with a core diameterof 994 μm, a cladding outer diameter of 1019 μm, and a1GW=cm2 advertised damage threshold, which withthe 6ns laser pulse used here would equate to morethan 40mJ=pulse. Using 250GW=cm2 intensity dis-tributed over a volume with a 0:05mm diameter for6ns reveals that approximately 30mJ of energy isthe minimum requirement to form a spark in a gas-eous medium, therefore it was possible that this fibercould transmit an adequate pulse to create a spark ifthe transmission efficiency and beam quality werehigh enough. Unfortunately, themaximummeasuredstable fiber output energy without deteriorating thefiber that was achieved was less than 10mJ, andthe output energy was concentrated in rings aroundthe fiber periphery, consequently no sparks wereformed. It is possible multiple fibers could be com-bined to successfully form a spark, but it was con-cluded under the experimental conditions tested, asingle silica fiber is not able to deliver enough energyfor gas-phase breakdown. Yalin et al. [19] have de-monstrated the use of flexible coated hollow-core fi-bers to deliver nanosecond laser pulses withsufficient energy and beam quality to allow spark for-mation. While they reported that fiber curvature de-creased the transmission efficiency and output beamquality (1m long fiber) from 97% spark formation re-liability (M2
≈ 11) in straight position to a 50% relia-bility (M2
≈ 21) for a radius of curvature of∼1m, theirresults indicated the potential for wide practical ap-plicability, including use in optical laser based igni-tion systems, plasma manufacturing, and materialtreatment processes, and also as a spark-deliverymethod for LIBS applications.Gas-phase fiber-delivered flexible LIBS probe. The
first step in developing a flexible fiber-coupled LIBSprobe was described in our previous paper [20], whichreported what we believe to be the first gas-phaseLIBS measurements using a fiber-optically deliveredspark. The remainder of this section summarizes thateffort. The experiment was intended to determine thesimilarities and differences between conventionalopen optics and fiber-delivered spark LIBS measure-ments and to assess the feasibility of a fully fiber-coupled LIBS probe for gas-phase measurements.The laser beam was coupled into the fiber, whichwas kept in a straight position while a single lensplaced after the fiber exit focused the beam throughthe window of a measurement chamber to create aspark in an ultralean methane–air mixture of knowncomposition. The fiber end and focusing lens, and con-sequently the delivered beam, were exposed to thesurroundings. The spark emission signal was col-lected using separate optics. The observed spectralwindow from the resulting plasma light extendedfrom 479 to 760nm and contained the two Hα
(656nm) andHβ (486nm) lines, plus the three N linesat 742, 744, and 746nm. The equivalence ratio wasquantifiedusing the intensity ratio ofHα=Ntotal,whereNtotal is definedas thesumof spectral intensities of thethree above-mentioned nitrogen lines. The resultingLIBS measurements were compared with other mea-surements made using traditional LIBS techniqueswithout the fiber-optically delivered spark.
The cyclic olefin polymer (COP) and silver-coatedhollow fiber beam output was found to be multimode,consisting of a series of hot spots. TheM2 model [21] iscommonlyused to characterizemultimodebeamqual-ity by comparing thebeamparameters to a theoreticalGaussian beam, and M2 is defined as the ratio be-tween the actual beam divergence (Θ) and the diver-gence of a fundamentalmode beam (θn) with the samewaist diameter (M2 ¼ Θ=θn). A value of M2
∼ 12 wasmeasured for the straight fiber by Yalin et al. [19] un-der conditions nearly identical to those in the preli-minary fiber LIBS investigation. Considerations ofthe beampower and damage threshold of the focusinglens dictated theminimumbeamspot size on the lens.The fiber diameter and beam divergence then deter-mined the appropriate placement of the lens relativeto the fiber exit. These requirementsweremet using asingle focusing lens placed 330mmafter the fiber end,which resulted in an∼3mm laser beam radius on thelens surface.Calculation of the beamproperties at thespark location (focused beam waist) yields a beamwaist of approximately 50–100 μm and an intensityof approximately 100GW=cm2, while with the samelens configuration employed for conventional (non-fiber) LIBS yielded a smaller (approximately15–30 μm) beam waist and an order of magnitudehigher intensity.
The deposited laser energy influences the temporaland spatial evolution of the LIBS plasma, with an ef-fect on the intensity of elemental lines. Zimmer andTachibana [17] found this influence could at least par-tially be characterized by the ratio of the Hα and Hβhydrogen lines at 656 and486nm, respectively.Hencethis ratio was used to qualify and separate singleLIBS shots, although not as an explicit calibrationfactor as was done by Zimmer. Measurements withnegative or extremeHα=Hβ ratio valueswere removedfrom the data. A linear variation of H=N elementalratio with the equivalence ratio (Φ) was found(R2 ¼ 0:99), with or without the optical fiber. This de-monstrated the possibility of inferring equivalenceratio using LIBS signals obtained from fiber-delivered sparks and eventually developing a fullycontained LIBS probe for use in gas-phase media,which is the motivation for the present effort. Ideally,this probe could bemoved freely from location to loca-tion and fully contain the spark-delivery and signalcollection optics.
2. Objectives
To build on our initial effort, the present study pro-poses and evaluates a gas-phase fiber-coupled LIBSprobe design that contains both the delivery and
the collection optics. Specifically, the objectives ofthis work were to:
1. Demonstrate a LIBS fiber probe design thatcontains both the delivery and the collection optics.Our previous paper [20] confirmed the possibilityof a self-contained gas-phase LIBS probe with a fiber-delivered spark, but the LIBS spectra were actuallycollected with separate optics arranged similarly totypical open optics setups. Here, the collection opticsare integrated into the probe with the goal ofdemonstrating the possibility of eliminating tediouscollection optics alignment.2. Investigate effect of delivery fiber curvature on
LIBS results. Fiber curvature is known to deterioratethe quality of the beam exiting the fiber, but requiringthe spark-delivery fiber to be maintained straightwould significantly reduce the convenience of a fullyfiber-coupled LIBS probe. In the work of Yalin et al.[19] using similar fiber, the M2 was shown to doublewhen a straight fiber was curved to a 1m radius.Smaller fiber radii of curvature are expected tofurther increase the focused beam waist and corre-spondingly decrease the optical intensity at the pointof spark formation. In practical applications quantify-ing the fiber radius of curvature would be difficult. Inour previous work we found that the fiber-deliveredsparkswere less robust andhadmore varied intensitydistribution than those created with conventionalopen optics, and the degradation had correspondingeffects on the LIBS analysis [22]. This result moti-vates the present objective to quantify fiber curvatureeffects.3. Evaluate Hβ, Hα line ratio as a means to miti-
gate LIBS signal deterioration associated with fiberspark delivery. Considering the success of Zimmerand Tachibana[17] in reducing the elemental ratiostandard deviationwhenusing theHα=Hβ signal ratioas a calibration factor, this concept could potentiallyreduce the expected increased LIBS spectra variationassociated with the curved-fiber-delivered spark.
3. Technical Approach
We now describe the fully fiber-coupled LIBS probedesign in detail and provide an overview of the ex-perimental setup used to implement and evaluateit. Following this, the test matrix is presented.
A. Experimental Setup
The LIBS components used in this investigation areidentical to those described in [20]. An overview isprovided here as it relates to the present work.Laser, emission collection, and analysis. The first
harmonic (1064nm) of a Q-switched Nd:YAG Conti-nuum Surelite I-30 (5 − 7ns pulse, 30Hz, 6mm dia-meter beam, divergence 0:6mrad) was focused(f ¼ 500mm lens) to the fiber-optic inlet. A 1=2λ plateand polarized plate beam splitters were used to at-tenuate the fiber input pulse energy and to preservethe quality of the source laser to achieve effectivefiber coupling and downstream spark formation.
The fiber input and transmitted pulse energies weremeasured using two Ophir (3A-FS and 30(150)A-HE)optical energymeters. The emittedLIBS spectrawerecollected and analyzed using a 0:3m Acton Spectra-Pro-2300i spectrometer (15 μm slit) mated to aRoper-Scientific PI-MAX ICCD camera. The effectivedispersion of the systemusing a 150 groove=mmgrat-ing is approximately 0:275nm=pixel. This grating hasthe advantage of simultaneously capturing all thelines used for the present data analysis. The ICCDcamera was triggered by the laser. The data were ta-ken with an ICCD shutter delay of 0:85 μs after plas-mageneration andagatewidth of5 μs. Thegatewidthand delay were chosen to optimize the H and N sig-nals. The detected hydrogen lines FWHM were2:75nm for Hα and 3:5nm for Hβ, which are similarto those reported by Parriger et al. for the time delayused in this study [23,24]. The FWHM of each of thethree nitrogen lines (742, 744, and 746nm) was1:25nm.Thebackgroundandbaselinewere extractedfrom the peak values prior to quantifying the linestrengths. Since theLIBSapplication tested here con-sisted of using line ratios to infer equivalence ratio,the spectra were not explicitly corrected for the detec-tor’s sensitivity. Instead, the sensitivity was incorpo-rated into the assessment of the system’s ability tolinearly respond to equivalence ratio changes. Detec-tor calibrationmeasurements performed after the ex-periments indicated that H and N line correctioncoefficients are equal to those obtained from theman-ufacturer’s specification [25] for the 150 grooves=mmgrating (blazed wavelength 800) sensitivity curve.
Fiber probe. The probe’s functional requirementswere the primary focus in its design, but considera-tion was also given to its eventual practical applica-tion in severe environments such as engines,combustors, or burners. The latter consideration sug-gested small size with high resistance to thermal andmechanical shocks. To simplify the design and reduceoptical losses, the LIBS focusing lens was used as anaccesswindow to themeasuring chamber. As this lensalso acts as the spectra signal collection lens in theintegrated design, the probe outlet dimensions weredetermined both by the minimum beam diametersupported by the optics and by the ability to collectan adequate spectral signal for LIBS analysis. Theprimary functional requirements of the probe as partof a complete LIBS system are to:
1. Couple the laser output into the fiber.2. Transmit and focus the light to create a spark.3. Collect LIBS spectra emission and deliver it to
the spectrometer inlet for analysis.
Each of these functions and the design elementsassociated with them are discussed in the para-graphs below.
Couple the laser output into the fiber. The fiber out-put laser pulse energy in our previous work (30mJ)was near the minimum energy required forgas-phase breakdown at atmospheric conditions.
The fiber transmission efficiency decreases withradius of curvature, hence the laser energy mustbe increased at the fiber inlet to obtain the same exitenergy as the straight fiber. The fiber probe designmust allow an increase in the inlet energy withoutdeteriorating the fiber. The 1:0mm diameter COPand silver-coated hollow fiber, developed and manu-factured by Sato et al. [26], has an indicatedmaximum transmitted energy for vacuumed-coreconditions greater than 100mJ. Unfortunately,preliminary experiments showed the exiting beamdivergence with a vacuumed-core is more than twotimes greater than when a helium purge flow ismaintained within the fiber. This increase in exitingbeam divergence reduces the intensity at the LIBSfocusing point, as shown earlier in this paper, andit may be caused by suction effects inside the fiberthat distort its interior shape and cause the lightto follow an irregular path. Therefore, even thoughthe greater energy carrying capacity of the va-cuum-core solution is attractive, the helium flowwas maintained because its reduced negative effecton beam quality at the exit yielded better perfor-mance despite the reduced energy.In the previous experiment, stainless steel tubing
[0:03 in: ð0:08 cmÞ diameter] placed at a small anglerelative to the incoming laser beam had forced aweak helium purge into the fiber inlet, which hadhelped prevent breakdown at the fiber entrance.The longer fiber in the present work (2m in length)increased the risk of breakdown inside the fiber withonly a helium purge at the fiber inlet. Therefore ahelium flow throughout the fiber length was used.To facilitate the helium purge flow, the fiber inlet
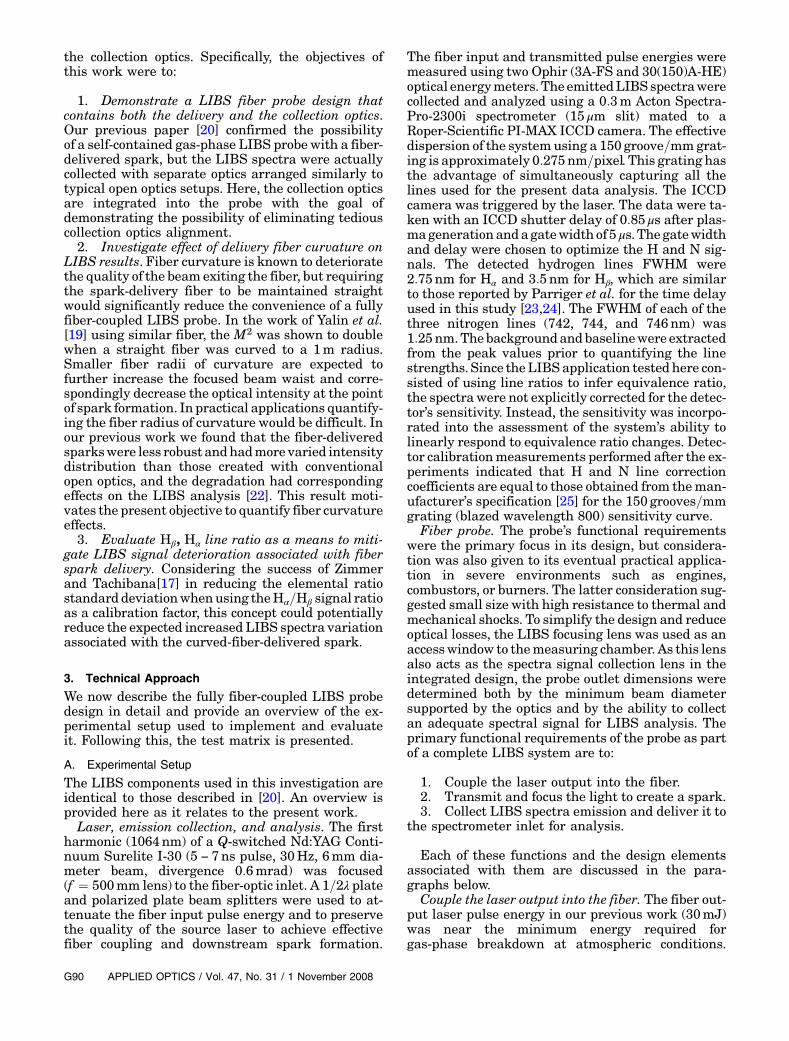
was confined to a sealed 0:5 in: ð1:27 cmÞ square tube(Fig. 1). A window placed at the beam inlet end al-lows the laser beam to focus into the fiber, whichis chucked at the opposite end of the tube. Threeother windows were placed along its sides to visua-lize the laser-to-fiber coupling and to facilitate align-ment. The tube is mounted onto a translational stagethat allows a 3-D axial movement for best fiber cou-pling. The helium flow throughout the fiber and theimproved beam-to-fiber alignment in the presentconfiguration resulted in a 66% increase of the max-imum fiber output energy, from 30 to 50mJ, as a con-sequence of the ability to increase input energy. Themaximum input energy and transmission efficiencywere 42mJ and 64%, respectively, in our previous ex-periments and 87mJ and 57% in the present work,although, as discussed later, these values decreasedduring the course of the experiment as the fiber en-trance degraded. Given the laser characteristics andfiber geometry presented above, this maximum out-put energy increase corresponds to output peak
power and intensity increasing from 10 to 16:6MWand from 1.29 to 2:13GW=cm2, respectively, if it isassumed that the peak values are double the averagevalues over the 6ns laser pulse duration.
Transmit and focus the light to create a spark. Asmall size probe is preferred for combustion environ-ments, both for easier probe access and limited inter-ference with the measuring zone. It was previouslymentioned that the end probe size was limited bythe laser intensity threshold of the commerciallyavailable lensesused in thiswork. Further probemin-iaturization using custom lenses could be consideredas a followup if justified by the results of this effort. Inour previouswork, a3mmbeamradius size before thefocusing lens was the smallest radius that preventedlens surface damage. For increased LIBS spark prob-ability at smaller optical fiber radii of curvature, a de-crease in the lens focal length was also considered.The smaller focal length improves spark probabilitybecause the focused beam waist decreases proportio-natelywith focal lengthand therefore increases inten-sity at the focal point. The lenses chosen for beamfocusing serve as the initial design point of the probe.Accommodating their function in a compact versatileform was the design objective for the probe.
The single, fixed-location focusing lens setup usedin our previously reported work where the fiber wasmaintained straight is not practical when allowingfiber curvature because, as was discussed in the pre-vious sections, the substantial beam divergence in-crease at smaller radii of curvature increases thebeam radius on the focusing lens surface to valueslarger than the lens overall diameter. Thus, in thiswork a collimating lens (25:4mm diameter,f ¼ 300mm) was placed in front of the focusing lens,and the distance from the beam exit to the collimat-ing lens was made adjustable to accommodate theprojected beam radius change caused by fiber curva-ture. This allowed us to maintain a constant 3mmspot size radius on the focusing lens no matter thefiber radii of curvature.
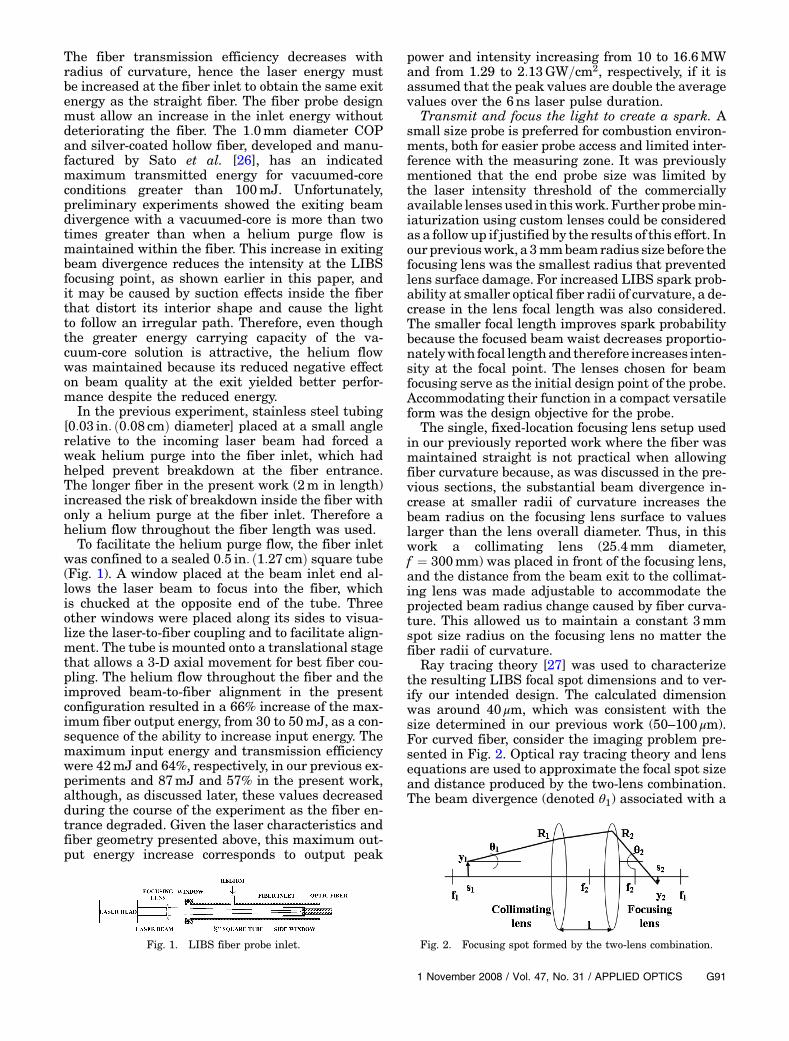
Ray tracing theory [27] was used to characterizethe resulting LIBS focal spot dimensions and to ver-ify our intended design. The calculated dimensionwas around 40 μm, which was consistent with thesize determined in our previous work (50–100 μm).For curved fiber, consider the imaging problem pre-sented in Fig. 2. Optical ray tracing theory and lensequations are used to approximate the focal spot sizeand distance produced by the two-lens combination.The beam divergence (denoted θ1) associated with a
Fig. 1. LIBS fiber probe inlet. Fig. 2. Focusing spot formed by the two-lens combination.
particular fiber radius of curvature is known. ForR2 ≈ 3mm, a maximum 20% increase in the final fo-cusing spot radius was predicted for a potentiallydoubled beam divergence exiting the fiber (as ex-pected for a 1m fiber radius of curvature), for a230mm distance between the fiber end and the col-limating lens. Note that since the goal is to maintaina constant spot size on the focusing lens for varyingfiber-exit divergences, as has been indicated in Fig. 2,the beam is not necessarily perfectly collimated be-tween the collimating and the focusing lenses.Similar results are obtained using the M2 theory,
which for a collimated laser beam predicts a 30% in-crease in the focus spot size for the same beam radiuson the focusing lens surface when the M2 valuechanges from 12 to 21.The focusing part of the fiber probe consists of a
tube-in-tube design [outer, 1:5 in: (3:8 cm) square; in-ner, 1:25 in: (3:17 cm) square], which allows for a 6 in:(15 cm) to 12 in: (30 cm) variable distance betweenthe fiber exit and a collimating lens (Fig. 3).To avoid fiber breakage during the experimental
setup, the exit end was not chucked but placed insidea 150mm straight stainless steel tube of slightly lar-ger diameter that was fixed inside a rectangular alu-minum block. The position of the optical fiber end isadjustable to allow centering the exiting laser beamon the collimating lens. Varying the distance be-tween the collimating and the focusing lenses from100 to 150mmhad a negligible effect on previous cal-culations for the spot dimensions and location. TheLIBS focusing lens is placed at 115mm after the col-limating lens and mounted on a conical support,which could be adjusted to center the collimatedbeam on the focusing lens.Collect LIBS spectra emission and deliver it to the
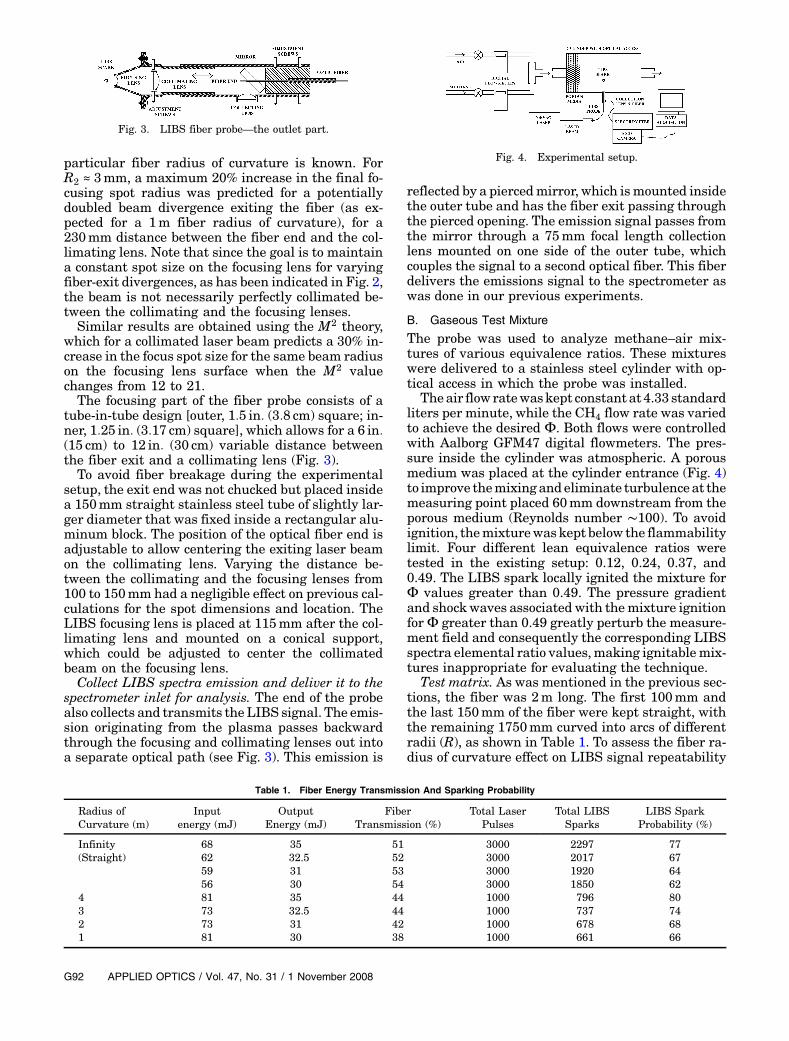
spectrometer inlet for analysis. The end of the probealso collects and transmits the LIBS signal. The emis-sion originating from the plasma passes backwardthrough the focusing and collimating lenses out intoa separate optical path (see Fig. 3). This emission is
reflected by a piercedmirror, which ismounted insidethe outer tube and has the fiber exit passing throughthe pierced opening. The emission signal passes fromthe mirror through a 75mm focal length collectionlens mounted on one side of the outer tube, whichcouples the signal to a second optical fiber. This fiberdelivers the emissions signal to the spectrometer aswas done in our previous experiments.
B. Gaseous Test Mixture
The probe was used to analyze methane–air mix-tures of various equivalence ratios. These mixtureswere delivered to a stainless steel cylinder with op-tical access in which the probe was installed.
Theair flowratewaskept constant at 4.33 standardliters per minute, while the CH4 flow rate was variedto achieve the desired Φ. Both flows were controlledwith Aalborg GFM47 digital flowmeters. The pres-sure inside the cylinder was atmospheric. A porousmedium was placed at the cylinder entrance (Fig. 4)to improve themixingandeliminate turbulenceat themeasuring point placed 60mm downstream from theporous medium (Reynolds number ∼100). To avoidignition, themixturewaskept below the flammabilitylimit. Four different lean equivalence ratios weretested in the existing setup: 0.12, 0.24, 0.37, and0.49. The LIBS spark locally ignited the mixture forΦ values greater than 0.49. The pressure gradientand shock waves associated with themixture ignitionforΦ greater than 0.49 greatly perturb the measure-ment field and consequently the corresponding LIBSspectra elemental ratio values,making ignitablemix-tures inappropriate for evaluating the technique.
Test matrix. As was mentioned in the previous sec-tions, the fiber was 2m long. The first 100mm andthe last 150mm of the fiber were kept straight, withthe remaining 1750mm curved into arcs of differentradii (R), as shown in Table 1. To assess the fiber ra-dius of curvature effect on LIBS signal repeatability
Fig. 3. LIBS fiber probe—the outlet part.
Fig. 4. Experimental setup.
Table 1. Fiber Energy Transmission And Sparking Probability
and linearity, LIBS spectra were acquired for theabove-mentioned equivalence ratios at four differentfiber curvature radii. For each curvature radius thefiber output energy was measured. Then the fiberwas straightened and LIBS spectra for six differentenergy values corresponding to the curved fiber out-put energies were acquired.
4. Results and Discussion
To evaluate the gas-phase fiber-coupled LIBS probedesign, first the fiber radii of curvature effect onthe exiting laser beam and LIBS plasma formationwas investigated, subsequently LIBS data were ac-quired from various methane–air equivalence ratiosand the separation, linearity, and variability of thecalculated elemental ratios that indicate air–fuel ra-tio and plasma character were analyzed. Data quali-fication based on the Hα=Hβ line ratios was necessaryto achieve an acceptable correlation between the N toH line ratios and equivalence ratios. These topics arepresented and discussed in the subsections thatfollow.
A. Effect of Energy and Fiber Radius of Curvature onPlasma Formation
Table 1 shows that the fiber transmittance decreasedfrom 44% to 38% as the radius of curvature decreasedfrom 4 to 1m. The LIBS signal is consequently influ-enced by both the increase in beam divergence andthe decrease in beam energy at the exit as the fibercurvature radius is decreased. These influences wereisolated by examining the LIBS signal of curved andstraight fiber at equivalent fiber output energy le-vels. The fiber output energies were established forvarious fiber curvatures while LIBS data were col-lected. Then LIBS experiments were performed withstraight fiber using equivalent fiber output energylevels, and the curved and straight LIBS data at eachenergy level were analyzed and compared.The repeated beam-to-fiber coupling on the same
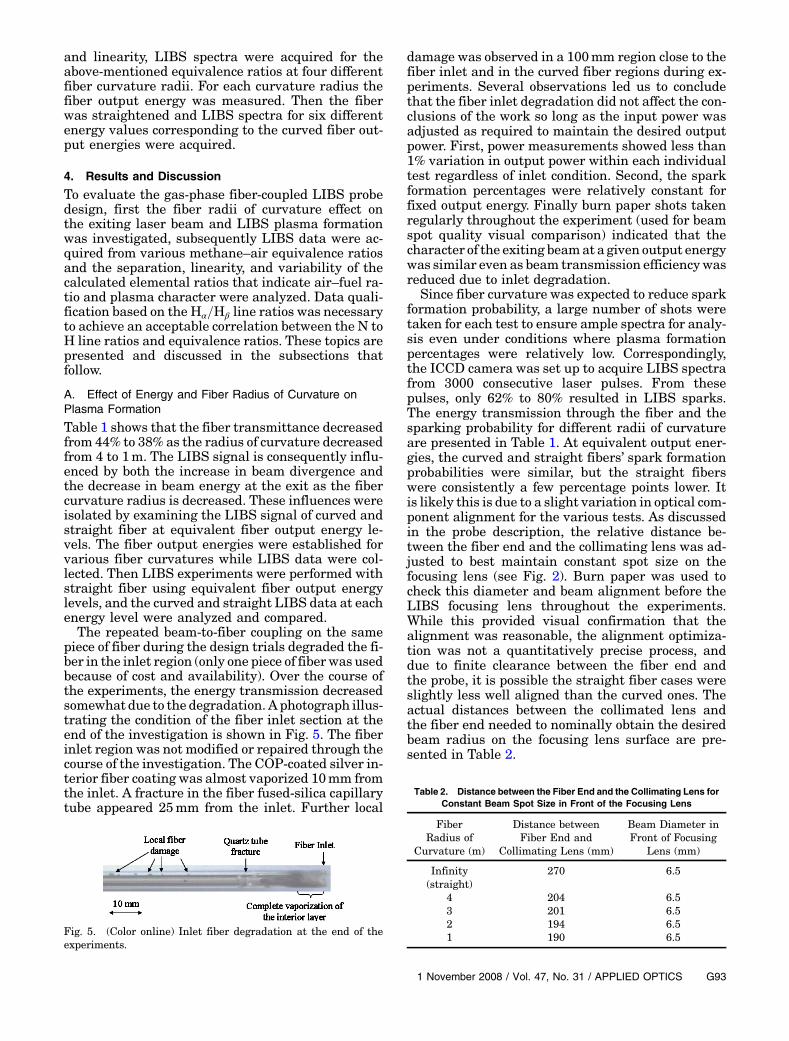
piece of fiber during the design trials degraded the fi-ber in the inlet region (only one piece of fiber was usedbecause of cost and availability). Over the course ofthe experiments, the energy transmission decreasedsomewhat due to the degradation. Aphotograph illus-trating the condition of the fiber inlet section at theend of the investigation is shown in Fig. 5. The fiberinlet region was not modified or repaired through thecourse of the investigation. The COP-coated silver in-terior fiber coating was almost vaporized 10mm fromthe inlet. A fracture in the fiber fused-silica capillarytube appeared 25mm from the inlet. Further local
damage was observed in a 100mm region close to thefiber inlet and in the curved fiber regions during ex-periments. Several observations led us to concludethat the fiber inlet degradation did not affect the con-clusions of the work so long as the input power wasadjusted as required to maintain the desired outputpower. First, power measurements showed less than1% variation in output power within each individualtest regardless of inlet condition. Second, the sparkformation percentages were relatively constant forfixed output energy. Finally burn paper shots takenregularly throughout the experiment (used for beamspot quality visual comparison) indicated that thecharacter of the exiting beamat a given output energywas similar even as beam transmission efficiencywasreduced due to inlet degradation.
Since fiber curvature was expected to reduce sparkformation probability, a large number of shots weretaken for each test to ensure ample spectra for analy-sis even under conditions where plasma formationpercentages were relatively low. Correspondingly,the ICCD camera was set up to acquire LIBS spectrafrom 3000 consecutive laser pulses. From thesepulses, only 62% to 80% resulted in LIBS sparks.The energy transmission through the fiber and thesparking probability for different radii of curvatureare presented in Table 1. At equivalent output ener-gies, the curved and straight fibers’ spark formationprobabilities were similar, but the straight fiberswere consistently a few percentage points lower. Itis likely this is due to a slight variation in optical com-ponent alignment for the various tests. As discussedin the probe description, the relative distance be-tween the fiber end and the collimating lens was ad-justed to best maintain constant spot size on thefocusing lens (see Fig. 2). Burn paper was used tocheck this diameter and beam alignment before theLIBS focusing lens throughout the experiments.While this provided visual confirmation that thealignment was reasonable, the alignment optimiza-tion was not a quantitatively precise process, anddue to finite clearance between the fiber end andthe probe, it is possible the straight fiber cases wereslightly less well aligned than the curved ones. Theactual distances between the collimated lens andthe fiber end needed to nominally obtain the desiredbeam radius on the focusing lens surface are pre-sented in Table 2.
Fig. 5. (Color online) Inlet fiber degradation at the end of theexperiments.
Table 2. Distance between the Fiber End and the Collimating Lens forConstant Beam Spot Size in Front of the Focusing Lens
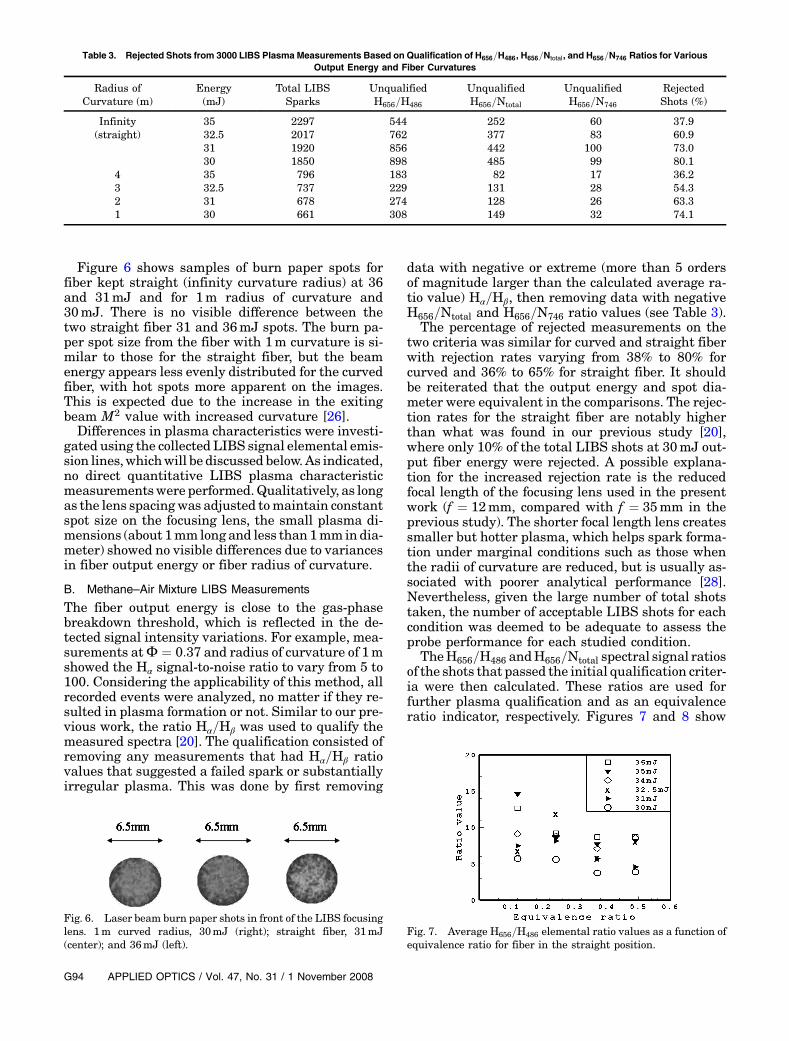
Figure 6 shows samples of burn paper spots forfiber kept straight (infinity curvature radius) at 36and 31mJ and for 1m radius of curvature and30mJ. There is no visible difference between thetwo straight fiber 31 and 36mJ spots. The burn pa-per spot size from the fiber with 1m curvature is si-milar to those for the straight fiber, but the beamenergy appears less evenly distributed for the curvedfiber, with hot spots more apparent on the images.This is expected due to the increase in the exitingbeam M2 value with increased curvature [26].Differences in plasma characteristics were investi-
gated using the collected LIBS signal elemental emis-sion lines,whichwill be discussed below.As indicated,no direct quantitative LIBS plasma characteristicmeasurementswere performed.Qualitatively, as longas the lens spacingwas adjusted tomaintain constantspot size on the focusing lens, the small plasma di-mensions (about 1mmlong and less than 1mmindia-meter) showed no visible differences due to variancesin fiber output energy or fiber radius of curvature.
B. Methane–Air Mixture LIBS Measurements
The fiber output energy is close to the gas-phasebreakdown threshold, which is reflected in the de-tected signal intensity variations. For example, mea-surements atΦ ¼ 0:37 and radius of curvature of 1mshowed the Hα signal-to-noise ratio to vary from 5 to100. Considering the applicability of this method, allrecorded events were analyzed, no matter if they re-sulted in plasma formation or not. Similar to our pre-vious work, the ratio Hα=Hβ was used to qualify themeasured spectra [20]. The qualification consisted ofremoving any measurements that had Hα=Hβ ratiovalues that suggested a failed spark or substantiallyirregular plasma. This was done by first removing
data with negative or extreme (more than 5 ordersof magnitude larger than the calculated average ra-tio value) Hα=Hβ, then removing data with negativeH656=Ntotal and H656=N746 ratio values (see Table 3).
The percentage of rejected measurements on thetwo criteria was similar for curved and straight fiberwith rejection rates varying from 38% to 80% forcurved and 36% to 65% for straight fiber. It shouldbe reiterated that the output energy and spot dia-meter were equivalent in the comparisons. The rejec-tion rates for the straight fiber are notably higherthan what was found in our previous study [20],where only 10% of the total LIBS shots at 30mJ out-put fiber energy were rejected. A possible explana-tion for the increased rejection rate is the reducedfocal length of the focusing lens used in the presentwork (f ¼ 12mm, compared with f ¼ 35mm in theprevious study). The shorter focal length lens createssmaller but hotter plasma, which helps spark forma-tion under marginal conditions such as those whenthe radii of curvature are reduced, but is usually as-sociated with poorer analytical performance [28].Nevertheless, given the large number of total shotstaken, the number of acceptable LIBS shots for eachcondition was deemed to be adequate to assess theprobe performance for each studied condition.
TheH656=H486 andH656=Ntotal spectral signal ratiosof the shots that passed the initial qualification criter-ia were then calculated. These ratios are used forfurther plasma qualification and as an equivalenceratio indicator, respectively. Figures 7 and 8 show
Fig. 6. Laser beam burn paper shots in front of the LIBS focusinglens. 1m curved radius, 30mJ (right); straight fiber, 31mJ(center); and 36mJ (left).
Table 3. Rejected Shots from 3000 LIBS Plasma Measurements Based on Qualification of H656=H486, H656=Ntotal, and H656=N746 Ratios for VariousOutput Energy and Fiber Curvatures
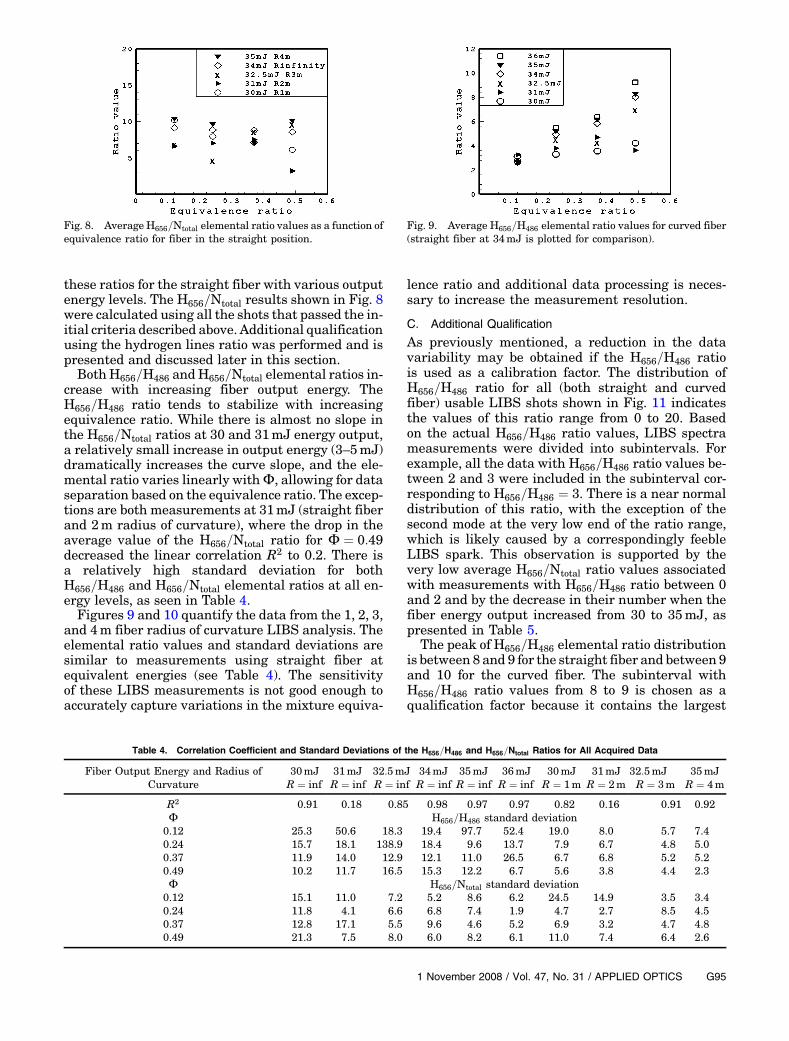
these ratios for the straight fiber with various outputenergy levels. The H656=Ntotal results shown in Fig. 8were calculated using all the shots that passed the in-itial criteria described above. Additional qualificationusing the hydrogen lines ratio was performed and ispresented and discussed later in this section.BothH656=H486 andH656=Ntotal elemental ratios in-
crease with increasing fiber output energy. TheH656=H486 ratio tends to stabilize with increasingequivalence ratio. While there is almost no slope inthe H656=Ntotal ratios at 30 and 31mJ energy output,a relatively small increase in output energy (3–5mJ)dramatically increases the curve slope, and the ele-mental ratio varies linearly withΦ, allowing for dataseparation based on the equivalence ratio. The excep-tions are both measurements at 31mJ (straight fiberand 2m radius of curvature), where the drop in theaverage value of the H656=Ntotal ratio for Φ ¼ 0:49decreased the linear correlation R2 to 0.2. There isa relatively high standard deviation for bothH656=H486 and H656=Ntotal elemental ratios at all en-ergy levels, as seen in Table 4.Figures 9 and 10 quantify the data from the 1, 2, 3,
and 4m fiber radius of curvature LIBS analysis. Theelemental ratio values and standard deviations aresimilar to measurements using straight fiber atequivalent energies (see Table 4). The sensitivityof these LIBS measurements is not good enough toaccurately capture variations in the mixture equiva-
lence ratio and additional data processing is neces-sary to increase the measurement resolution.
C. Additional Qualification
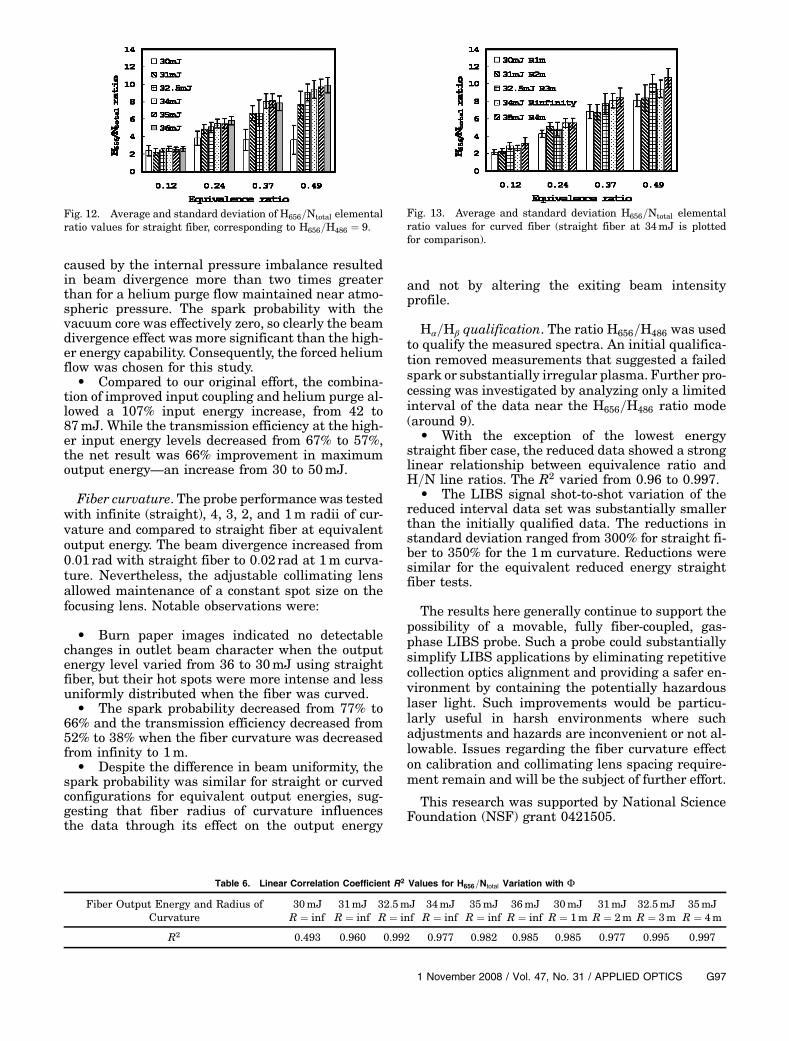
As previously mentioned, a reduction in the datavariability may be obtained if the H656=H486 ratiois used as a calibration factor. The distribution ofH656=H486 ratio for all (both straight and curvedfiber) usable LIBS shots shown in Fig. 11 indicatesthe values of this ratio range from 0 to 20. Basedon the actual H656=H486 ratio values, LIBS spectrameasurements were divided into subintervals. Forexample, all the data with H656=H486 ratio values be-tween 2 and 3 were included in the subinterval cor-responding to H656=H486 ¼ 3. There is a near normaldistribution of this ratio, with the exception of thesecond mode at the very low end of the ratio range,which is likely caused by a correspondingly feebleLIBS spark. This observation is supported by thevery low average H656=Ntotal ratio values associatedwith measurements with H656=H486 ratio between 0and 2 and by the decrease in their number when thefiber energy output increased from 30 to 35mJ, aspresented in Table 5.
The peak of H656=H486 elemental ratio distributionis between 8 and 9 for the straight fiber and between 9and 10 for the curved fiber. The subinterval withH656=H486 ratio values from 8 to 9 is chosen as aqualification factor because it contains the largest
Fig. 8. Average H656=Ntotal elemental ratio values as a function ofequivalence ratio for fiber in the straight position.
Table 4. Correlation Coefficient and Standard Deviations of the H656=H486 and H656=Ntotal Ratios for All Acquired Data
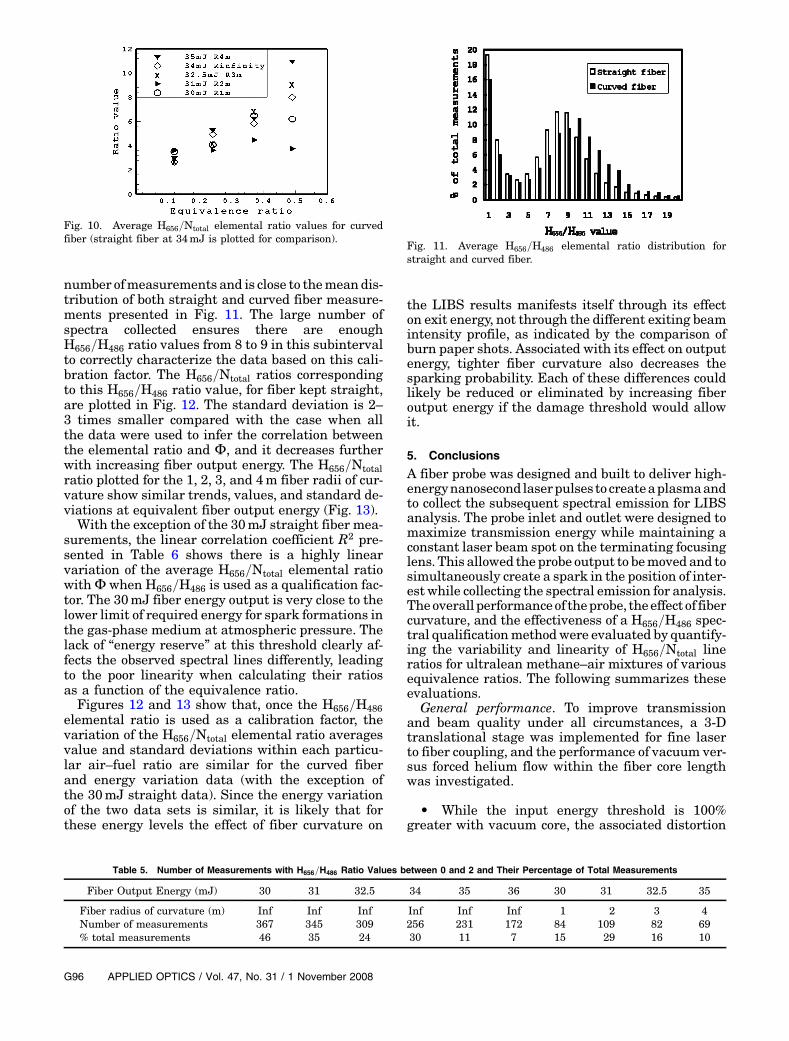
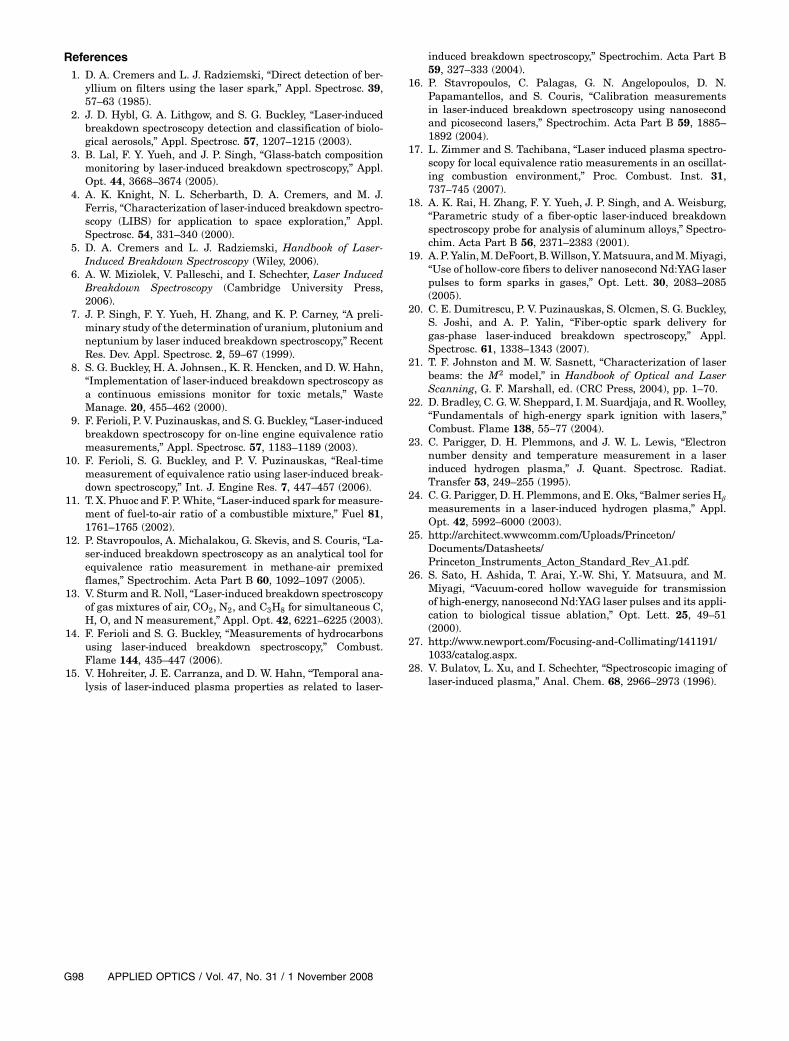
number ofmeasurements and is close to themean dis-tribution of both straight and curved fiber measure-ments presented in Fig. 11. The large number ofspectra collected ensures there are enoughH656=H486 ratio values from 8 to 9 in this subintervalto correctly characterize the data based on this cali-bration factor. The H656=Ntotal ratios correspondingto this H656=H486 ratio value, for fiber kept straight,are plotted in Fig. 12. The standard deviation is 2–3 times smaller compared with the case when allthe data were used to infer the correlation betweenthe elemental ratio and Φ, and it decreases furtherwith increasing fiber output energy. The H656=Ntotalratio plotted for the 1, 2, 3, and 4m fiber radii of cur-vature show similar trends, values, and standard de-viations at equivalent fiber output energy (Fig. 13).With the exception of the 30mJ straight fiber mea-
surements, the linear correlation coefficient R2 pre-sented in Table 6 shows there is a highly linearvariation of the average H656=Ntotal elemental ratiowithΦ when H656=H486 is used as a qualification fac-tor. The 30mJ fiber energy output is very close to thelower limit of required energy for spark formations inthe gas-phase medium at atmospheric pressure. Thelack of “energy reserve” at this threshold clearly af-fects the observed spectral lines differently, leadingto the poor linearity when calculating their ratiosas a function of the equivalence ratio.Figures 12 and 13 show that, once the H656=H486
elemental ratio is used as a calibration factor, thevariation of the H656=Ntotal elemental ratio averagesvalue and standard deviations within each particu-lar air–fuel ratio are similar for the curved fiberand energy variation data (with the exception ofthe 30mJ straight data). Since the energy variationof the two data sets is similar, it is likely that forthese energy levels the effect of fiber curvature on
the LIBS results manifests itself through its effecton exit energy, not through the different exiting beamintensity profile, as indicated by the comparison ofburn paper shots. Associated with its effect on outputenergy, tighter fiber curvature also decreases thesparking probability. Each of these differences couldlikely be reduced or eliminated by increasing fiberoutput energy if the damage threshold would allowit.
5. Conclusions
A fiber probe was designed and built to deliver high-energynanosecond laserpulses to createaplasmaandto collect the subsequent spectral emission for LIBSanalysis. The probe inlet and outlet were designed tomaximize transmission energy while maintaining aconstant laser beam spot on the terminating focusinglens. This allowed the probe output to bemoved and tosimultaneously create a spark in the position of inter-est while collecting the spectral emission for analysis.Theoverall performanceof theprobe, theeffect of fibercurvature, and the effectiveness of a H656=H486 spec-tral qualificationmethodwere evaluated by quantify-ing the variability and linearity of H656=Ntotal lineratios for ultralean methane–air mixtures of variousequivalence ratios. The following summarizes theseevaluations.
General performance. To improve transmissionand beam quality under all circumstances, a 3-Dtranslational stage was implemented for fine laserto fiber coupling, and the performance of vacuum ver-sus forced helium flow within the fiber core lengthwas investigated.
• While the input energy threshold is 100%greater with vacuum core, the associated distortion
Fig. 10. Average H656=Ntotal elemental ratio values for curvedfiber (straight fiber at 34mJ is plotted for comparison).
Table 5. Number of Measurements with H656=H486 Ratio Values between 0 and 2 and Their Percentage of Total Measurements
caused by the internal pressure imbalance resultedin beam divergence more than two times greaterthan for a helium purge flow maintained near atmo-spheric pressure. The spark probability with thevacuum core was effectively zero, so clearly the beamdivergence effect was more significant than the high-er energy capability. Consequently, the forced heliumflow was chosen for this study.• Compared to our original effort, the combina-
tion of improved input coupling and helium purge al-lowed a 107% input energy increase, from 42 to87mJ. While the transmission efficiency at the high-er input energy levels decreased from 67% to 57%,the net result was 66% improvement in maximumoutput energy—an increase from 30 to 50mJ.
Fiber curvature. The probe performance was testedwith infinite (straight), 4, 3, 2, and 1m radii of cur-vature and compared to straight fiber at equivalentoutput energy. The beam divergence increased from0:01 rad with straight fiber to 0:02 rad at 1m curva-ture. Nevertheless, the adjustable collimating lensallowed maintenance of a constant spot size on thefocusing lens. Notable observations were:
• Burn paper images indicated no detectablechanges in outlet beam character when the outputenergy level varied from 36 to 30mJ using straightfiber, but their hot spots were more intense and lessuniformly distributed when the fiber was curved.• The spark probability decreased from 77% to
66% and the transmission efficiency decreased from52% to 38% when the fiber curvature was decreasedfrom infinity to 1m.• Despite the difference in beam uniformity, the
spark probability was similar for straight or curvedconfigurations for equivalent output energies, sug-gesting that fiber radius of curvature influencesthe data through its effect on the output energy
and not by altering the exiting beam intensityprofile.
Hα=Hβ qualification. The ratio H656=H486 was usedto qualify the measured spectra. An initial qualifica-tion removed measurements that suggested a failedspark or substantially irregular plasma. Further pro-cessing was investigated by analyzing only a limitedinterval of the data near the H656=H486 ratio mode(around 9).
• With the exception of the lowest energystraight fiber case, the reduced data showed a stronglinear relationship between equivalence ratio andH=N line ratios. The R2 varied from 0.96 to 0.997.
• The LIBS signal shot-to-shot variation of thereduced interval data set was substantially smallerthan the initially qualified data. The reductions instandard deviation ranged from 300% for straight fi-ber to 350% for the 1m curvature. Reductions weresimilar for the equivalent reduced energy straightfiber tests.
The results here generally continue to support thepossibility of a movable, fully fiber-coupled, gas-phase LIBS probe. Such a probe could substantiallysimplify LIBS applications by eliminating repetitivecollection optics alignment and providing a safer en-vironment by containing the potentially hazardouslaser light. Such improvements would be particu-larly useful in harsh environments where suchadjustments and hazards are inconvenient or not al-lowable. Issues regarding the fiber curvature effecton calibration and collimating lens spacing require-ment remain and will be the subject of further effort.
This research was supported by National ScienceFoundation (NSF) grant 0421505.
Fig. 12. Average and standard deviation of H656=Ntotal elementalratio values for straight fiber, corresponding to H656=H486 ¼ 9.
Table 6. Linear Correlation Coefficient R2 Values for H656=Ntotal Variation with Φ
References1. D. A. Cremers and L. J. Radziemski, “Direct detection of ber-
yllium on filters using the laser spark,” Appl. Spectrosc. 39,57–63 (1985).
2. J. D. Hybl, G. A. Lithgow, and S. G. Buckley, “Laser-inducedbreakdown spectroscopy detection and classification of biolo-gical aerosols,” Appl. Spectrosc. 57, 1207–1215 (2003).
3. B. Lal, F. Y. Yueh, and J. P. Singh, “Glass-batch compositionmonitoring by laser-induced breakdown spectroscopy,” Appl.Opt. 44, 3668–3674 (2005).
4. A. K. Knight, N. L. Scherbarth, D. A. Cremers, and M. J.Ferris, “Characterization of laser-induced breakdown spectro-scopy (LIBS) for application to space exploration,” Appl.Spectrosc. 54, 331–340 (2000).
5. D. A. Cremers and L. J. Radziemski, Handbook of Laser-Induced Breakdown Spectroscopy (Wiley, 2006).
6. A. W. Miziolek, V. Palleschi, and I. Schechter, Laser InducedBreakdown Spectroscopy (Cambridge University Press,2006).
7. J. P. Singh, F. Y. Yueh, H. Zhang, and K. P. Carney, “A preli-minary study of the determination of uranium, plutonium andneptunium by laser induced breakdown spectroscopy,” RecentRes. Dev. Appl. Spectrosc. 2, 59–67 (1999).
8. S. G. Buckley, H. A. Johnsen., K. R. Hencken, and D. W. Hahn,“Implementation of laser-induced breakdown spectroscopy asa continuous emissions monitor for toxic metals,” WasteManage. 20, 455–462 (2000).
9. F. Ferioli, P. V. Puzinauskas, and S. G. Buckley, “Laser-inducedbreakdown spectroscopy for on-line engine equivalence ratiomeasurements,” Appl. Spectrosc. 57, 1183–1189 (2003).
10. F. Ferioli, S. G. Buckley, and P. V. Puzinauskas, “Real-timemeasurement of equivalence ratio using laser-induced break-down spectroscopy,” Int. J. Engine Res. 7, 447–457 (2006).
11. T. X. Phuoc and F. P.White, “Laser-induced spark for measure-ment of fuel-to-air ratio of a combustible mixture,” Fuel 81,1761–1765 (2002).
12. P. Stavropoulos, A. Michalakou, G. Skevis, and S. Couris, “La-ser-induced breakdown spectroscopy as an analytical tool forequivalence ratio measurement in methane-air premixedflames,” Spectrochim. Acta Part B 60, 1092–1097 (2005).
13. V. Sturm and R. Noll, “Laser-induced breakdown spectroscopyof gas mixtures of air, CO2, N2, and C3H8 for simultaneous C,H, O, and N measurement,” Appl. Opt. 42, 6221–6225 (2003).
14. F. Ferioli and S. G. Buckley, “Measurements of hydrocarbonsusing laser-induced breakdown spectroscopy,” Combust.Flame 144, 435–447 (2006).
15. V. Hohreiter, J. E. Carranza, and D. W. Hahn, “Temporal ana-lysis of laser-induced plasma properties as related to laser-
induced breakdown spectroscopy,” Spectrochim. Acta Part B59, 327–333 (2004).
16. P. Stavropoulos, C. Palagas, G. N. Angelopoulos, D. N.Papamantellos, and S. Couris, “Calibration measurementsin laser-induced breakdown spectroscopy using nanosecondand picosecond lasers,” Spectrochim. Acta Part B 59, 1885–1892 (2004).
17. L. Zimmer and S. Tachibana, “Laser induced plasma spectro-scopy for local equivalence ratio measurements in an oscillat-ing combustion environment,” Proc. Combust. Inst. 31,737–745 (2007).
18. A. K. Rai, H. Zhang, F. Y. Yueh, J. P. Singh, and A. Weisburg,“Parametric study of a fiber-optic laser-induced breakdownspectroscopy probe for analysis of aluminum alloys,” Spectro-chim. Acta Part B 56, 2371–2383 (2001).
19. A.P.Yalin,M.DeFoort,B.Willson,Y.Matsuura, andM.Miyagi,“Use of hollow-core fibers to deliver nanosecond Nd:YAG laserpulses to form sparks in gases,” Opt. Lett. 30, 2083–2085(2005).
20. C. E. Dumitrescu, P. V. Puzinauskas, S. Olcmen, S. G. Buckley,S. Joshi, and A. P. Yalin, “Fiber-optic spark delivery forgas-phase laser-induced breakdown spectroscopy,” Appl.Spectrosc. 61, 1338–1343 (2007).
21. T. F. Johnston and M. W. Sasnett, “Characterization of laserbeams: the M2 model,” in Handbook of Optical and LaserScanning, G. F. Marshall, ed. (CRC Press, 2004), pp. 1–70.
22. D. Bradley, C. G. W. Sheppard, I. M. Suardjaja, and R. Woolley,“Fundamentals of high-energy spark ignition with lasers,”Combust. Flame 138, 55–77 (2004).
23. C. Parigger, D. H. Plemmons, and J. W. L. Lewis, “Electronnumber density and temperature measurement in a laserinduced hydrogen plasma,” J. Quant. Spectrosc. Radiat.Transfer 53, 249–255 (1995).
24. C. G. Parigger, D. H. Plemmons, and E. Oks, “Balmer series Hβmeasurements in a laser-induced hydrogen plasma,” Appl.Opt. 42, 5992–6000 (2003).
26. S. Sato, H. Ashida, T. Arai, Y.-W. Shi, Y. Matsuura, and M.Miyagi, “Vacuum-cored hollow waveguide for transmissionof high-energy, nanosecond Nd:YAG laser pulses and its appli-cation to biological tissue ablation,” Opt. Lett. 25, 49–51(2000).