MOX–Report No. 24/2014 Multi-State modelling of repeated hospitalisation and death in patients with Heart Failure: the use of large administrative databases in clinical epidemiology Ieva, F., Jackson, C.H., Sharples, L.D. MOX, Dipartimento di Matematica “F. Brioschi” Politecnico di Milano, Via Bonardi 9 - 20133 Milano (Italy) [email protected]http://mox.polimi.it
Transcript
MOX–Report No. 24/2014
Multi-State modelling of repeated hospitalisation anddeath in patients with Heart Failure: the use of large
administrative databases in clinical epidemiology
Ieva, F., Jackson, C.H., Sharples, L.D.
MOX, Dipartimento di Matematica “F. Brioschi”Politecnico di Milano, Via Bonardi 9 - 20133 Milano (Italy)
In chronic diseases like Heart Failure (HF), the disease course and asso-ciated clinical event histories for the patient population vary widely. Toimprove understanding of the prognosis of patients and enable health-careproviders to assess and manage resources, we wish to jointly model diseaseprogression, mortality and their relation with patient characteristics. Weshow how episodes of hospitalisation for disease-related events, obtainedfrom administrative data, can be used as a surrogate for disease status. Wepropose flexible multi-state models for serial hospital admissions and deathin HF patients, that are able to accommodate important features of diseaseprogression, such as multiple ordered events and competing risks. Markovand semi-Markov models are implemented using freely available softwarein R. The models were applied to a dataset from the administrative databank of the Lombardia region in Northern Italy, which included 15,298 pa-tients who had a first hospitalisation ending in 2006 and 4 years of followup thereafter. This provided estimates of the associations of of age andgender with rates of hospital admission and length of stay in hospital, andestimates of the expected total time spent in hospital. For example, olderpatients and men were readmitted more frequently, though the total time inhospital was roughly constant with age. We also discuss the relative meritsof parametric and semi-parametric multi-state models, and assessment ofthe Markov assumption.
1
Keywords: Multi State Models, Heart Failure, Administrative Data, HospitalAdmissions, Competing Risks.
1 Introduction
Aging of the population and improved survival of cardiac patients due to moderntherapeutic innovations has led to an increasing prevalence of heart failure (HF).Despite improvements in therapy, the mortality rate in patients with HF remainshigh.1 The magnitude of the problem of HF is difficult to assess with precisionsince there is no gold standard for the diagnosis of heart failure, and there hasbeen wide variation in the diagnostic criteria used in different studies.2 At leastsix HF scoring systems based upon symptoms and signs have been developed toassess the presence or severity of heart failure. Clinical diagnostic criteria forheart failure have generally included history, physical examination, and chestradiographs (see Mosterd et al.,3 Roger4 and references therein). Regardlessof the definition used, the prevalence of HF and left ventricular dysfunctionincreases steeply with age (see, for example, Bleumink et al.5). In general HF isa chronic disease (Chronic Heart Failure — CHF), caused by many conditionsthat damage the heart muscle, including coronary artery disease, heart attack,cardiomyopathy and conditions that overwork the heart (high blood pressure,valve disease, thyroid disease, kidney disease, diabetes, or heart defects presentat birth). In addition, HF can occur in the presence of a combination of thesediseases. It is the leading cause of hospitalisation in people older than 65 years.A 2010 update from the American Heart Association (AHA) estimated that therewere 5.8 million people with HF in the United States in 2006 (see McMurray et
al.6 and Lloyd-Jones et al.,7 among others). There are an estimated 23 millionpeople with HF worldwide. In the Lombardia district of Italy, which providesour motivating example, the HF incidence over the last decade ranged between25, 000 and 30, 000 cases per year in a population of 9.7 million inhabitants.8
In chronic diseases like CHF, clinical interest lies in both the final outcome(death or survival time) and the dynamics of the process itself. To improveunderstanding of prognosis and for healthcare providers to assess the impactand costs of the disease, a comprehensive model should include both death andnon-fatal clinical events. There are several methodological approaches to themodelling of times to multiple events per subject. Castaneda and Bart9 providean appraisal of several methods, highlighting that the standard Cox model isnot appropriate since observations are not independent. In order to overcomethis, they propose the use of marginal and multi-state models using a countingprocess approach for the joint analysis of survival and time to disease-relatedhospitalisations, allowing for population average estimates of treatment effects.Several marginal models are adapted in order to account for intra-subject corre-lation and competing risks. The models differ in the way they define the ”at-risk”population at each time. However in these marginal models it is assumed that all
2
events are identical and can be revisited at any time, with no recognition of theserial nature of consecutive HF-hospitalisations. In their multi-state models, theserial nature of the events is allowed, but hospitalisation and death are treatedas the same type of event, which, given their nature and severity, is unaccept-able clinically. Thus, a multi-state model that represents multiple ordered eventsper subject, accounts for competing risks, and distinguishes between death andhospitalisation, is required.
A multi-state model is a stochastic process in which subjects occupy oneof a set of discrete states at any time. Multi-state models are convenient fordescribing longitudinal data and/or repeated events. In Andersen and Keiding10
a counting process representation is stressed. In medical applications, the statesmay represent healthy, different severities of disease, or periods in hospital, andtransition rates between states may be modelled in terms of covariates. See,for example, Hougaard11 for a review, and Commenges,12 Cook,13 Putter et
al.,14 Sommen et al.,15 Sharples and Titman,16 Duffy et al.,17 Kay,18 Chen et
al.,19 Commenges and Joly20 for applications to many different diseases. InSutradhar et al.,21 multi-state models are developed, in order to compare trendsin hospitalisations among cancer survivors. Despite the importance of CHF bothin terms of incidence and related human and monetary costs (WHO22 definesthe rising incidence and prevalence of chronic diseases as one of the major globalconcern), there are few examples in the literature of the application of multi-state models to hospitalisation and death from CHF. Postmus et al.23 useda three-state model representing in hospital, out of hospital or death for 1023patients from a randomized controlled trial with heart failure.
In this study, the impact of CHF is assessed using data from administra-tive databases, which provide information on the number and times of hospitaladmissions and time to death (or administrative censoring). Administrativedatabases play a central role in the evaluation of health-care systems, due totheir widespread diffusion and low cost of information. There is increasingagreement among clinical epidemiologists on the validity of disease and inter-vention registries based on administrative databases (see, for example, Barbieriet al.,24 Wirhenetal25 and references therein). A key issue is the selection criteriaof the observation units: different criteria may result in different estimates ofprevalence or incidence of diseases (Saczynski et al.26). The use of prospectivepatient management databases is of current interest (see, for example, Macchiaet al.,27 Au et al.,28 Aylin et al.,29 Philbin and DiSalvo30). The benefits of us-ing these data for health system planning and evaluation are many: they arepopulation based, often combine information from multiple centres, capture realhealth system use, are longitudinal and are relatively inexpensive to constructand use. In addition, individual health administrative records can be linked toother data (clinical registry, public health, socioeconomic etc.). The validityof this approach is critically dependent on the reliability of the data and theaccuracy of disease coding in the administrative records, as shown, for exam-ple, by Lee et al.31 and Saczynski etal.26 If search and data linkage strategies
3
are not carried out rigorously, administrative data on hospital admissions canbe less complete and exhaustive than data from epidemiological cohort studiesand clinical trials. Despite issues surrounding data reliability, and the on-goingdebate regarding their use in clinical research (see, for example, Quach et al.32),significant improvements have been achieved in this area in the last decade, andthe use of administrative databases in clinical biostatistics has become an ac-cepted practice (see, among others Schultz et al.,33 Muggah et al.,34 Iron et al.35
and references therein).We propose a multi-state modelling strategy for the joint analysis of out-
comes and hospital admissions in CHF patients, whose data come from theadministrative database of an Italian regional district (Lombardia). Our aim isto demonstrate a flexible approach that is able to capture important features ofdisease progression, such as multiple ordered events and the competing risks ofdeath and hospitalisation, in a novel application. We go further than Postmuset al.23 by using multiple states representing subsequent periods spent in andout of hospital, in order to model how the risk of death and further hospitali-sation changes through time and with disease progression. Analyses are carriedout using freely-available statistical software R.36 Specifically, the survival,37
mstate14 and msm38 packages are used to fit the multi-state models to the data.This work will provide healthcare providers with an effective modelling tool, us-ing hospital admissions to gain insights into the burden of heart failure, how itrelates to patient characteristics and how it changes over time.
We describe the data extraction and inclusion criteria in Section 2, and ex-plain the multi-state modelling methods in Section 3. Key results from applyingthese methods to the Lombardia HF admissions data are presented in Section4. In Section 5 we end with a discussion of the strengths and challenges ofmodelling disease progression through administrative data.
2 Study Cohort and Extraction Criteria
Within the Italian health-care regulation system, every hospital admission pro-duces a record in the administrative database. These records are then collectedin an data warehouse called SDO (Scheda di Dimissione Ospedaliera, i.e., hos-pital discharge paper) database. The SDO database has been interrogated toidentify heart failure episodes and subsequent hospitalisations. In addition, in-formation both on patient (sex, date and place of birth, residence, . . . ) andon hospitalisations (date of admission and discharge, diagnoses and procedures,type of admission, type of discharge, vital status at discharge, . . . ) over timecan be retrieved.
For the current study we used data extracted for the project “Utilization
of Regional Health Service databases for evaluating epidemiology, short- and
medium-term outcome, and process indexes in patients hospitalised for heart
failure”. These data include cases of CHF in the administrative data warehouse
4
of Regione Lombardia, the region in the northern part of Italy with capital Mi-lan. The project aims to describe the epidemiology and natural history of HFpatients at regional levels, to profile health service utilisation (e.g. hospitalisa-tions, cardiac rehabilitation, diagnostic tests, outpatient visits, etc.) over time,and investigate variation in patient care according to geographic area, socio-demographic characteristics and other clinical variables.
In order to include the vast majority of HF cases, any admission that endedbetween 2000 and 2010 in Major Diagnostic Category (MDC) 01 (Nervous Sys-tem), 04 (Respiratory System), and 05 (Circulatory System) in patients residentin the Nothern Italy regional district of Lombardia has been considered. Forpeople who died by the end of the study, the date of death has been obtainedthrough database linkage with the Italian National Registry of deaths. A list ofICD-9-CM codes relating to HF was created as the union of codes from “Heartfailure mortality rate” by AHRQ-IQI39 and from CMS-HCC40, 41 Model Cate-gory 80. From this dataset admissions for HF were identified if any of the sixHF diagnosis fields of the SDO were recorded.
Starting from this population, patients whose first admission (incident event)ended during 2006 were selected. The number of hospital admissions for HF andthe corresponding dates of admission and discharge were recorded over a 4-yearfollow up (up to December 31th, 2010). Data were anonymised, labelling eachpatient with an encrypted ID code.
The eligible cohort consisted of 15, 856 patients (corresponding to 36, 949records). Among these, patients who were younger than 18 years at the firsthospitalisation time were excluded (62 pts., corresponding to 182 rows). Amongthe remaining cohort, we also removed patients admitted and discharged on thesame day, i.e., patients whose length of stay (LOS) in hospital was zero (477 pts.,corresponding to 2476 rows), or those having long-stay recovery (LOS greaterthan 180 days, 19 pts., corresponding to 67 rows). Some other pre-processingand cleaning operations were carried out, for example to check coherence inpatients’ time-line progressions and test for agreement in event indicators. Therewere no missing data. The final dataset contained records from 15, 298 patients(corresponding to 35, 224 records),
3 Multi-state Models for HF data
3.1 Definitions
To characterise the association between hospital admissions, mortality and pa-tient characteristics, we adopt a multi-state model describing how an individualmoves between a series of discrete states in continuous time. Suppose an indi-vidual is in state S(t) at time t. The next state to which the individual moves,and the time of the change, are governed by a set of transition intensities qrs(t),r, s = 1, . . . , R. The intensity, or hazard, represents the instantaneous risk ofmoving from state r to state s. This may depend on the time t since the start of
5
the process, patient characteristics z(t), and possibly also the “history” of theprocess up to that time, Ht: the previous states visited by the individual andthe times spent in them. Therefore, for this patient,
qrs(t) = limδt→0
P(S(t+ δt) = s|S(t) = r)/δt
are then elements of a R × R matrix Q(t) whose rows sum to zero, so that the
diagonal entries are defined by qrr(t) = −∑
r 6=s
qrs(t), and qrs(t) = 0 if a transition
from state r to state s is not allowed.
3.2 Model structure for HF hospitalisation
The 11 states and the 19 permitted transitions in our application are illustratedin Figure 1. Each patient starts in state 1I , representing the first hospital admis-sion. From there they can either be discharged from hospital, or die in hospital.Once a patient is out of hospital, they can either be admitted again or die, andonce in hospital they can either be discharged or die. Death from any cause isincluded. A maximum of 6 hospital admissions are modelled, and subsequentadmissions (but not deaths) are ignored, due to the sparsity of data from individ-uals with more than 6 admissions (Table 1). Thus “greater than 5 admissions”is considered as a clinically-important “severe” disease state.
Figure 1: The multi state model, describing jointly the length of stay in hospital, risk ofsubsequent hospitalisation, mortality rates in and out of hospital, and how these changewith increasing numbers of hospital admissions.
Simplifications of this structure are possible. For example, we could haveonly two living states, representing “in hospital” and “out of hospital”, withtransitions allowed between them in either direction. This would allow estima-tion of the in-hospital and out-of-hospital mortality rate, and the average lengthof stay in hospital, but it would then be awkward to model how these quantities,or the probability of readmission, vary with the previous number of hospitaladmissions. Alternatively, if length of hospital stay is not of interest, we couldomit the “discharge” states, and simply model the times between successive hos-pital admission dates, jointly with mortality. This would assume, however, that
6
the risk of death does not change when a patient is in hospital. Both of thesesimplifications were investigated in exploratory work before deciding to use themost flexible structure of Figure 1.
3.3 Data structure and time-to-event modelling
In our application, the state S(t) is known at all times for each patient, sinceall dates of admission to, or discharge from, hospital, and all dates of death,are known. We label these times t1, . . . , tn. t1 is the date of the first hospi-tal admission. If the patient died, tn is the date of death, otherwise it is theend of follow-up. Any intermediate times t2, . . . , tn−1 represent discharges andsubsequent admissions, if they occur.
For each permitted r → s transition in the multi-state model (19 in ourcase) there is a corresponding time-to-event model, with cause-specific hazardrates defined by qrs(t). To enable estimation of these hazards, the data areexpressed as a series of times to events which are potentially censored: dtj =tj+1− tj : j = 1, . . . , n−1. For a patient who moves into state s at time tj, theirnext event at tj+1 is defined by the model structure (Figure 1) to be one of aset of competing events s∗1, . . . , s
∗ns.
For example, in state s = 1I (first hospital admission), the next state musteither be s∗1 = 1O (first discharge), or death (s∗2 = D) so ns = 2. The time of theevent which actually occurs at tj+1 is observed, and the times of the competing
events from this set (which have not occurred by this time) are censored. Eachdtj contributes an observed time to one of the 19 transition-specific models, anda censored time to each of the models for the competing events. Therefore, stan-dard tools for survival analysis can be used to estimate the qrs(t), independentlyfor each r → s transition, from this form of data. Additional software is re-quired to deal with the multi-state structure when processing the data, makingpredictions (Section 3.4) and presenting results.
We apply two alternative models using accessible R packages. The first is amore flexible semi-Markov model based on semi-parametric Cox regressions foreach transition. The second is a simpler, fully-parametric Markov model. Age(at the time of transition) and sex are included as covariates in both models, withdifferent hazard ratios exp(βrs) for each r → s transition. Age-sex interactionswere considered and judged not significant.
3.3.1 Semi-parametric, semi-Markov model
In this model,
qrs(t, z(t)) = q(0)rs (t) exp(β′rsz(t)) (1)
thus the hazards are proportional between patient groups or covariate values, inother words the covariate value has a constant time-independent multiplicativeassociation with the hazard. If the covariates z(t) are time dependent, such as
7
age in our example, they are assumed to be step functions which remain constantbetween each tj and tj+1.
The baseline hazard q(0)rs (t) is left unspecified and estimated nonparametri-
cally using the Breslow estimator (as in De Wreede et al.50), and the βrs are
estimated by maximum partial likelihood. The dependence of q(0)rs (t) on time
could be modelled by expressing time t as the time since the start of the pro-cess, in this case the date of the first hospital admission. We use an alternativeapproach of defining t as the time spent by the individual in their current state.
Then the function q(0)rs (t) represents how the hazard changes after discharge from
hospital, or during a single hospital stay. This is a clock-reset or semi-Markov
model (see Putter at al.14 for further details).We fit Cox semi-Markov models to the hospital admission data using the
survival package for R (Therneau and Grambsch42). The mstate package (DeWreede et al.43) subsequently computes covariate-specific cumulative hazardsfor each of the transition-specific Cox models.
3.3.2 Parametric Markov model
In a second, more parsimonious parametric model, the baseline hazard q(0)rs is
constant, and the hazard only varies with increasing patient age, included inz(t). Covariates are again included through proportional hazards.
qrs(t, z(t)) = q(0)rs exp(β′rsz(t)) (2)
Since age is piecewise-constant, the hazard is a step function of time, and thesojourn time in each state r has a piecewise exponential distribution, with apiecewise-constant rate qrr(t). This is a Markov model, since future evolutiononly depends on the current state. That is, qrs(t, z(t),Ht) is independent of Ht.
Again, the q(0)rs and βrs are estimated by maximum likelihood, and standard
errors are obtained by standard asymptotic theory. Since the state is known tobe S(tj) from tj until the transition to state S(tj+1) at tj+1, the contribution ofeach patient i to the likelihood is
Li(Q) =∏
j
Lj =
ni∏
j
exp{−qS(tj)S(tj )(tj+1 − tj)}qS(tj)S(tj+1) (3)
where the qrs in this formula are evaluated for this patient’s covariates, assumingtheir age is constant over this time interval. The complete likelihood L(Q) =∏
i Li(Q) is maximised in terms of log(q0rs) and βrs.This model is fitted using the msm package for R (Jackson44). This class of
models may also be fitted to data where the exact times of transition betweenstates are unknown. This is common in situations where the states are levels ofseverity of a disease, which may only be known at times of clinic visits (Jackson,38
Kalbfleisch and Lawless,44 Kay18).
8
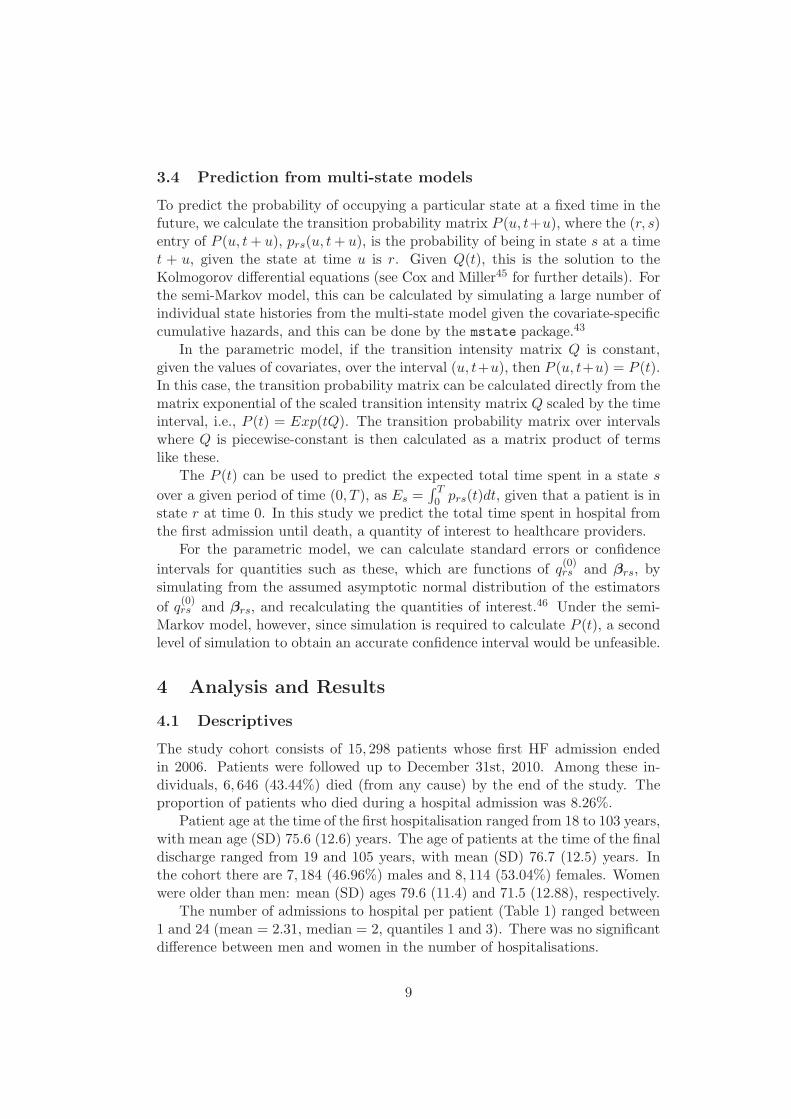
3.4 Prediction from multi-state models
To predict the probability of occupying a particular state at a fixed time in thefuture, we calculate the transition probability matrix P (u, t+u), where the (r, s)entry of P (u, t+ u), prs(u, t+ u), is the probability of being in state s at a timet + u, given the state at time u is r. Given Q(t), this is the solution to theKolmogorov differential equations (see Cox and Miller45 for further details). Forthe semi-Markov model, this can be calculated by simulating a large number ofindividual state histories from the multi-state model given the covariate-specificcumulative hazards, and this can be done by the mstate package.43
In the parametric model, if the transition intensity matrix Q is constant,given the values of covariates, over the interval (u, t+u), then P (u, t+u) = P (t).In this case, the transition probability matrix can be calculated directly from thematrix exponential of the scaled transition intensity matrix Q scaled by the timeinterval, i.e., P (t) = Exp(tQ). The transition probability matrix over intervalswhere Q is piecewise-constant is then calculated as a matrix product of termslike these.
The P (t) can be used to predict the expected total time spent in a state s
over a given period of time (0, T ), as Es =∫ T
0 prs(t)dt, given that a patient is instate r at time 0. In this study we predict the total time spent in hospital fromthe first admission until death, a quantity of interest to healthcare providers.
For the parametric model, we can calculate standard errors or confidence
intervals for quantities such as these, which are functions of q(0)rs and βrs, by
simulating from the assumed asymptotic normal distribution of the estimators
of q(0)rs and βrs, and recalculating the quantities of interest.46 Under the semi-
Markov model, however, since simulation is required to calculate P (t), a secondlevel of simulation to obtain an accurate confidence interval would be unfeasible.
4 Analysis and Results
4.1 Descriptives
The study cohort consists of 15, 298 patients whose first HF admission endedin 2006. Patients were followed up to December 31st, 2010. Among these in-dividuals, 6, 646 (43.44%) died (from any cause) by the end of the study. Theproportion of patients who died during a hospital admission was 8.26%.
Patient age at the time of the first hospitalisation ranged from 18 to 103 years,with mean age (SD) 75.6 (12.6) years. The age of patients at the time of the finaldischarge ranged from 19 and 105 years, with mean (SD) 76.7 (12.5) years. Inthe cohort there are 7, 184 (46.96%) males and 8, 114 (53.04%) females. Womenwere older than men: mean (SD) ages 79.6 (11.4) and 71.5 (12.88), respectively.
The number of admissions to hospital per patient (Table 1) ranged between1 and 24 (mean = 2.31, median = 2, quantiles 1 and 3). There was no significantdifference between men and women in the number of hospitalisations.
Table 1: Distribution of number of admissions to hospital for chronic HF between HFpatients and percentage of patients who entered each stage during the 5-year follow up.
Table 2 shows summary statistics for time from the previous discharge toeach subsequent admission, for those patients experiencing them. The mean (andmedian) time to the next hospitalisation decreases as the number of readmissionsincreases.
pts. mean (sd) median 1Q 3Q min max(1st adm) 15298 — — — — — —
Table 2: Summary statistics for times to readmission to hospital for HF-patients.
The overall mean (standard deviation) LOS in hospital is 13.2 (13.9) days(min = 1, median = 9, first and third quantiles respectively equal to 5 and 16,max = 180 days). There is a slight difference between mean LOS of male andfemale patients (12.9 male vs 13.5 female) and there is no significant differencein LOS among subsequent hospitalisations.
4.2 Multi-state models
The multi-state models described in Section 3 are fitted to the HF data. Table 3shows the total number of observed transitions for each state. In-hospital mor-tality increases from 7.16% (first admission in-hospital death rate) up to 9.99%(fifth admission in-hospital death rate), probably due to the aging populationand the increasing severity of the HF.
10
to r − th discharge to death to (r + 1) − th admission to deathFro
mr−
th
adm
ission r = 1 14,203 1,095
Fro
mr−
th
discharg
e r = 1 8,891 1,750r = 2 8,145 746 r = 2 4,836 980r = 3 4,383 453 r = 3 2,604 488r = 4 2,378 226 r = 4 1,492 236r = 5 1,343 149 r = 5 855 132r = 5+ - 394
Table 3: Transitions for the multi-state model in (2) fitted to HF data.
Associations with age and sex
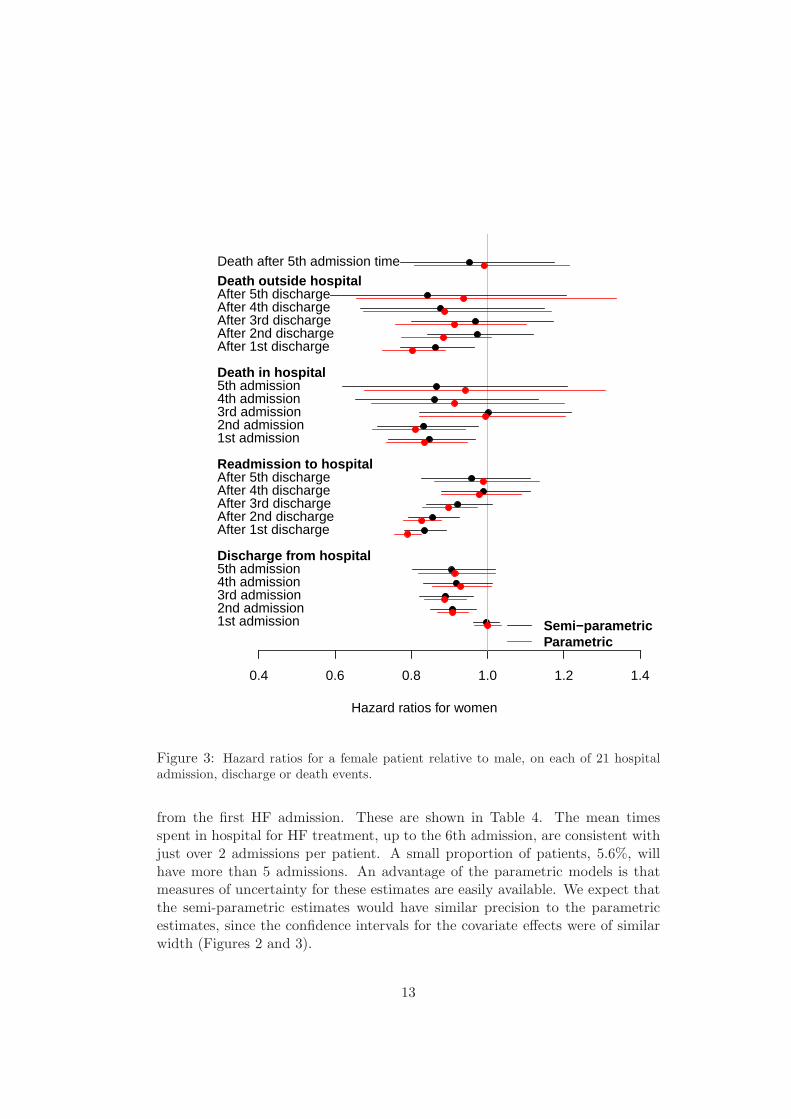
Figures 2 and 3 show maximum likelihood estimates of the hazard ratios forthe effects of age and sex, both for semi-parametric (black) and parametric(red) specifications of the model in (2). An increase of 5 years in age has onlya very small effect on readmission and discharge times, decreasing the chanceof discharge and increasing the risk of readmission slightly. These estimatesare very precise due to the large sample, though are unlikely to hold clinicalsignificance. There is evidence, as expected, that increasing patient age increasesthe death hazard from all the states. This effect appears to slightly decreasewith the number of hospitalisations. This may be due to the fact that as thepopulation ages, it tends to shrink toward more homogeneous and ”robust”behaviour (”survival of the fittest”), reducing the apparent contrasts betweenpatients.
In general the gender effect is smaller than the age effect, with few significanthazard ratios. In the earlier stages, women are less likely to change state (die,be admitted or discharged from hospital) than are men. The lower hazard fortransitions to death may reflect the longer life-expectancy for women, which theage effect in the model may not have fully adjusted for. These data suggest thatthere may be a reluctance to admit to hospital women with symptoms of HFin the early stages. Once admitted, women in the early stages of HF were lesslikely to be discharged early. However once disease severity has reached the laterstages, reflected by several admissions, progression through stages and survivalis the same for both sexes.
There were some differences between point estimates calculated from thesemi-parametric and parametric models although the patterns through the pro-cess were similar, and estimates of precision are comparable. The paramet-ric model resulted in an increased effect of age on death out of hospital, anda slightly bigger effect of age on readmission rates, particularly in the earlystages of disease. Note the hazards for the parametric model are assumed tobe constant within each state. The disagreement between the parametric andsemi-parametric models is greatest for the transitions which take place over longperiods of time (discharge to readmission or death) for which the hazard may notbe constant and there is heavy censoring. The parametric and semi-parametric
11
0.6 0.8 1.0 1.2 1.4 1.6 1.8
Hazard ratios for 5 years of age
1st admission2nd admission3rd admission4th admission5th admissionDischarge from hospital
After 1st dischargeAfter 2nd dischargeAfter 3rd dischargeAfter 4th dischargeAfter 5th dischargeReadmission to hospital
1st admission2nd admission3rd admission4th admission5th admissionDeath in hospital
After 1st dischargeAfter 2nd dischargeAfter 3rd dischargeAfter 4th dischargeAfter 5th dischargeDeath outside hospitalDeath after 5th admission time
Semi−parametricParametric
Figure 2: Hazard ratios for a five year increase in age, on each of 21 hospital admission,discharge or death events.
estimates agree for the transitions from admission to discharge or death in hos-pital, since the hazard is more likely to be constant over the relatively shorttimes spent in hospital, and there is minimal censoring.
Expected survival and time in hospital
Using the methods described in Section 3.4, we estimated the restricted meansurvival, and total time spent in any of the five hospital states, over 5 years
12
0.4 0.6 0.8 1.0 1.2 1.4
Hazard ratios for women
1st admission2nd admission3rd admission4th admission5th admissionDischarge from hospital
After 1st dischargeAfter 2nd dischargeAfter 3rd dischargeAfter 4th dischargeAfter 5th dischargeReadmission to hospital
1st admission2nd admission3rd admission4th admission5th admissionDeath in hospital
After 1st dischargeAfter 2nd dischargeAfter 3rd dischargeAfter 4th dischargeAfter 5th dischargeDeath outside hospitalDeath after 5th admission time
Semi−parametricParametric
Figure 3: Hazard ratios for a female patient relative to male, on each of 21 hospitaladmission, discharge or death events.
from the first HF admission. These are shown in Table 4. The mean timesspent in hospital for HF treatment, up to the 6th admission, are consistent withjust over 2 admissions per patient. A small proportion of patients, 5.6%, willhave more than 5 admissions. An advantage of the parametric models is thatmeasures of uncertainty for these estimates are easily available. We expect thatthe semi-parametric estimates would have similar precision to the parametricestimates, since the confidence intervals for the covariate effects were of similarwidth (Figures 2 and 3).
13
Parametric Semi-parametric
Men Women Men Women
Age Restricted mean survival (years) over five years
Table 4: Expected survival over five years, and time spent in hospital over fiveyears, by age and sex, under parametric and semi-parametric multi-state models,with 95% confidence intervals where available.
Another advantage of the parametric model is that the mean sojourn timesin each state may be estimated. These are the expected times from state entryuntil transition to another state. Estimates are reported in Table 5 for men andwomen aged 76 years (the mean population value). Under the semi-parametricmodel, the hazards are only estimated within the five-year follow-up period ofthe data, therefore to estimate the mean sojourn times we would need additionalparametric assumptions for the hazards beyond that period.
Periods in hospital Subsequent periods out of hospitalMale Female Male Female
1st13.6 13.8
1st676 820
(13.4, 14.0) (13.5 ,14.1) (662, 696) (802, 842 )
2nd12.3 13.7
2nd568 657
(12.0, 12.7) (13.3 ,14.1) (548, 589) (639, 681)
3rd12.2 13.6
3rd508 555
(11.7 ,12.7) (13.2 ,14.2) (483, 522) (531, 574)
4th12.3 13.3
4th419 434
(11.6 ,12.8) (12.5 ,14.0) (396, 452) (399, 462)
5th12.8 13.9
5th340 346
(12.0 ,13.7) (13.2 ,15.0) (317, 360) (313, 369)
Table 5: Estimated mean sojourn times, in days, for each transient state of the para-metric multi-state model, with 95% confidence intervals. Age on state entry is set tothe mean population value (76 years).
This table shows that mean stay in hospital does not change substantially asthe number of admissions increases. However the times between admissionsdo decrease, reflecting an acceleration in the disease process once it has been
14
diagnosed and has resulted in an initial admission. Mean sojourn times forwomen were slightly longer, consistent with the hazard ratios which showedthat women were less likely to change states than men. We could hypothesisethat women are more likely to have carer commitments at home and so mayonly be admitted for more severe HF episodes, resulting in slightly longer stay.This and other hypotheses could be examined in future clinical studies.
4.2.1 Model assessment
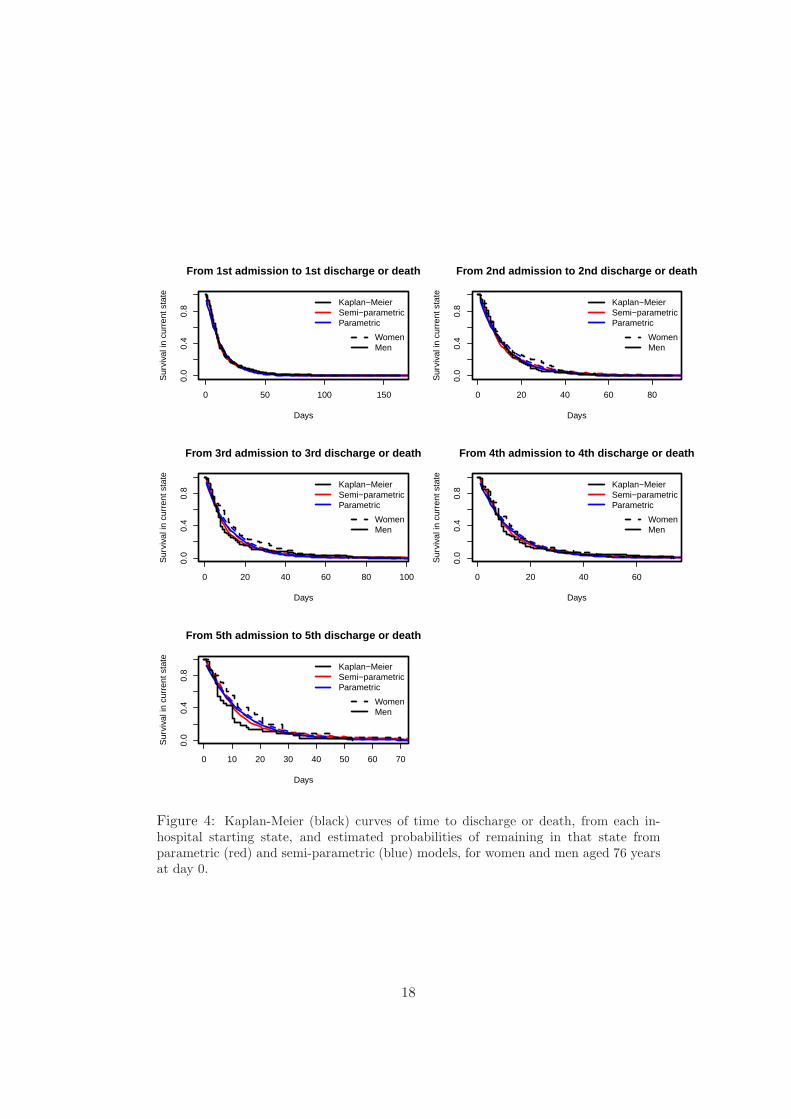
Since every transition time is known, we can calculate Kaplan-Meier estimatesof the time from state entry until the next transition for particular age-sex sub-groups. Estimates from the fitted models for the corresponding covariate cat-egory can be compared with these to assess model fit (as discussed by Titmanand Sharples.16 For patients in hospital, both the semi-parametric and para-metric models give good predictions of the probability of remaining in hospitalfor a 76 year old patient (Figure 4). This is consistent with the agreement ofthe corresponding covariate effects between the models in Figure 2. Figure 5shows that the semi-parametric model accounts better for the decrease in thehazard of readmission (or death) since the time of last discharge. This is becausethe parametric assumptions for the hazards are likely to be reasonable over theshort times spent in hospital, but not over longer periods. The parametric modelassumes the hazards vary only with age, whereas the semi-parametric model re-laxes the Markov assumption by also modelling the hazards as non-parametricfunctions of the time spent in the current state.
For out-of-hospital starting states, the extent of censoring and the sparsityof data at later times increases with the number of admissions, therefore anyvisible discrepancy between the Kaplan-Meier and fitted curves at these timesis less likely to be significant. Any remaining lack of fit of the semi-parametricmodel may result from non-proportional hazards. A test of the correlation ofthe Schoenfeld residuals with the Kaplan-Meier estimates at the correspondingtime showed that hazards were only significantly non-proportional for two outof the 19 transition-specific Cox models, and then only for the age effect. Sincethe sizes of these effects (discharge after 1st admission, and readmission after1st discharge in Figure 2) are not clinically significant, this is not a concern.
5 Conclusions
Contemporary administrative health care databases allow for a new kind of epi-demiological research, based on real-time availability and low-cost data. Despitethe issues surrounding the reliability of such data, in the last decade significantimprovements have been obtained in this area, and the use of administrativedatabases in clinical biostatistics has become an accepted practice. The benefitsof using these data for health system planning and evaluation go far beyondthe fact that they are cheap and quickly available: they are population based,
15
comprehensive, capture real health system use, longitudinal, and can be linkedto other data. Even if it can be difficult to properly define a population of inter-est starting from these databanks, administrative databases represent a valuableclinical resource. At the same time, they represent a great challenge for statisticsand statistical models.
In this work we focused on the use of administrative data for gaining insightsinto the impact of heart failure. We used multi-state models to simultaneouslypredict survival, time to the next hospitalisation and total time spent in hospital,and how these depend on age, gender and hospitalisation history.
For a chronic disease, such as CHF, in-hospital states are heavily controlledby the health care provider and assumptions of constant hazards and propor-tional hazards for these states are likely to be valid. However the out of hospitalstate is determined by a range of influences including the underlying progressionof the disease, comorbidities and the ageing of the population. These factors arenot adequately modelled using a parametric model based on constant hazards,although the bias in estimates of the hazard ratios was not large in this popu-lation. Thus if the focus is on estimation of covariate effects, constant hazardsmay be an adequate approximation, but for studies that focus on assessment oftime to readmission, and associated health care consumption, it is not a reliableapproach.
We were able to show that times between hospital admissions decreased asthe number of admissions increased, reflecting HF progression, and to quantifyexpected times between admissions. As might be expected, patients who wereolder at first admission were readmitted more frequently, as were men (comparedwith women) in the earlier stages of HF. However, the number of admissions andassociated time spent in hospital, over this 5 year period was roughly constantwith age, decreasing only for age of onset of around 85 years. For example, asa proportion of the restricted mean survival time over 5 years, time in hospitalranged from about 1.9% for 65 year old patients to 2.5% for 85 year old women.
Due to the size of the Lombardia administrative databases it is possible tostudy a range of factors influencing health care consumption, through jointlymodelling hospital admissions and death. This has resulted in precise estimatesof expected survival times, times spent in hospital and covariate effects. Addi-tionally there is sufficient power to investigate interactions between covariates,which has not been possible with smaller data registries. In this study therewere no significant interaction effects between age and sex on model parameters,and the size of the dataset ensures that we can be confident in this assertion.
Multi-state models are effective in describing clinical processes as discretestates. Nevertheless, due to the difficulty in inference for some types of data,strong assumptions on the process dynamics and on covariate effects are oftenapplied. As pointed out in Titman and Sharples,16 it is difficult to make univer-sally valid recommendations on model checking as often the model assumptionsdepend on the particular application. For example, the Markov assumptionclaims that given the present state, the future evolution of the process (hospi-
16
talisations as a proxy for HF progression, in the case of interest) is independentof the states previously visited and the transition times among them. This as-sumption is often restrictive and when it fails the model may provide inconsistentestimates. In this work we checked this assumption through informal diagnos-tic plots. Rodriguez-Girondo and De Una-Alvarez,47 proposed a formal testfor the Markov assumption in the illness-death model, based on measuring thefuture-past association over time through generalisations of Kendall’s τ , but nosolutions are present, to the best of our knowledge, for more general multi-statemodels.
Despite these restrictive assumptions, Markov models are often a convenientstarting point for jointly modelling hospital admissions and death. The msm
package in R, among others, has made implementation straightforward for awide range of model structures, and in particular for intermittently-observedmulti-state data where the exact times of transition are unknown. In addition,estimates of covariate effects were only slightly biased in our application. Forsituations such as the fitting of serial hospitalisation, in which transitions be-tween states are fully observed, the mstate package implements more flexiblesemi-parametric and/or semi-Markov models. These models provide less biasedestimates of sojourn times and covariate effects, but require computationally-expensive simulations from the fitted model to provide estimates of quantities ofinterest. Another advantage of parametric models is to estimate quantities thatrequire extrapolation beyond the time horizon of the data, such as (unrestricted)mean survival, or mean sojourn times in our example.
Acknowledgments
This work is within the Project of Ricerca Finalizzata ”Utilization of Regional Health Service
databases for evaluating epidemiology, short- and medium-term outcome, and process indexes
in patients hospitalized for heart failure”, funded by the Italian Ministry of Health and Regione
Lombardia - Healthcare division.
17
0 50 100 150
0.0
0.4
0.8
From 1st admission to 1st discharge or death
Days
Sur
viva
l in
curr
ent s
tate
Kaplan−MeierSemi−parametricParametric
WomenMen
0 20 40 60 80
0.0
0.4
0.8
From 2nd admission to 2nd discharge or death
Days
Sur
viva
l in
curr
ent s
tate
Kaplan−MeierSemi−parametricParametric
WomenMen
0 20 40 60 80 100
0.0
0.4
0.8
From 3rd admission to 3rd discharge or death
Days
Sur
viva
l in
curr
ent s
tate
Kaplan−MeierSemi−parametricParametric
WomenMen
0 20 40 60
0.0
0.4
0.8
From 4th admission to 4th discharge or death
Days
Sur
viva
l in
curr
ent s
tate
Kaplan−MeierSemi−parametricParametric
WomenMen
0 10 20 30 40 50 60 70
0.0
0.4
0.8
From 5th admission to 5th discharge or death
Days
Sur
viva
l in
curr
ent s
tate
Kaplan−MeierSemi−parametricParametric
WomenMen
Figure 4: Kaplan-Meier (black) curves of time to discharge or death, from each in-hospital starting state, and estimated probabilities of remaining in that state fromparametric (red) and semi-parametric (blue) models, for women and men aged 76 yearsat day 0.
18
0 500 1000 1500
0.0
0.4
0.8
From 1st discharge to 2nd admission or death
Days
Sur
viva
l in
curr
ent s
tate
Kaplan−MeierSemi−parametricParametric
WomenMen
0 500 1000 1500
0.0
0.4
0.8
From 2nd discharge to 3rd admission or death
Days
Sur
viva
l in
curr
ent s
tate
Kaplan−MeierSemi−parametricParametric
WomenMen
0 500 1000 1500
0.0
0.4
0.8
From 3rd discharge to 4th admission or death
Days
Sur
viva
l in
curr
ent s
tate
Kaplan−MeierSemi−parametricParametric
WomenMen
0 500 1000 1500
0.0
0.4
0.8
From 4th discharge to 5th admission or death
Days
Sur
viva
l in
curr
ent s
tate
Kaplan−MeierSemi−parametricParametric
WomenMen
0 500 1000 1500
0.0
0.4
0.8
From 5th discharge to 5+th admission or death
Days
Sur
viva
l in
curr
ent s
tate
Kaplan−MeierSemi−parametricParametric
WomenMen
Figure 5: Kaplan-Meier (black) curves of time to readmission or death, from each out-of-hospital starting state, and estimated probabilities of remaining in that state fromparametric (red) and semi-parametric (blue) models, for women and men aged 76 yearsat day 0.
19
References
1 Ho KK, Pinsky JL, Kannel WB,Levy D. The epidemiology of heartfailure: the Framingham Studyl.Journal of the American College of
Cardiology. 1993;22(4 Suppl A):6A.
2 Cowie MR, Mosterd A, Wood DA,et al. The epidemiology of heartfailure. European Heart Journal.1997;18:208–215.
3 Mosterd A, Deckers JW, Hoes AW,Nederpel A, Smeets A, Linker DT,et al. Classification of heart failurein population based research: an as-sessment of six heart failure scores.European Journal of Epidemiology.1997;13(5):491.
4 Roger VL. The heart failureepidemic. International Journal
of Environ Res Public Health.2010;7(4):1807–1830.
5 Bleumink GS, Knetsch AM, Sturken-boom MC, Straus SM, Hofman A,Deckers JW, et al. Quantifying theheart failure epidemic: prevalence,incidence rate, lifetime risk and prog-nosis of heart failure The Rotter-dam Study. European Heart Journal.2004;25(18):1614.
6 McMurray JJ, Petrie MC, MurdochDR, Davie AP. Clinical epidemiol-ogy of heart failure: public and pri-vate health burden. European Heart
Journal. 1998;19(Suppl):9.
7 Lloyd-Jones D, Adams RJ, BrownTM, Carnethon M, Dai S, De SimoneG, et al. ;.
8 ISTAT - Istituto Nazionale di Sta-tistica [homepage on the Internet];
[cited 2014 Jun 21]. Available from:http://demo.istat.it/.
9 Castaneda J, Bart G. Appraisal ofseveral methods to model time tomultiple events per subjecys: mod-elling time to hospitalizations anddeath. Revista Colombiana de Es-
tadistica. 2010;33(1):43–61.
10 Andersen PK, Keiding N. Multi-state models for event history anal-ysis. Statistical Methods in Medical
Research. 2002;11:91–115.
11 Hougaard P. Multi-state Models:a Review. Lifetime Data Analysis.1999;5:239–264.
12 Commenges D. Inference for multi-state models from interval-censoreddata. Statistical Methods in Medical
Research. 2002;11:167–182.
13 Cook RJ. A mixed model for markovprocesses under panel observation.Biometrics. 1999;55:178–183.
14 Putter H, Fiocco M, Geskus RB.Tutorial in biostatistics: competingrisks and multistate models. Statis-
tics in Medicine. 2007;26:2389–2430.
15 Sommmen C, Alioum A, CommengesD. A multistate approach for esti-mating the incidence of human im-munodeficiency virus by using HIVand AIDS French surveillance data.Statistics in Medicine. 2009;28:1554–1568.
16 Titman AC, Sharples LD. Modeldiagnostics for multi-state models.Statistical Methods in Medical Re-
search. 2009;19:621–651.
20
17 Duffy SW, Chen HH. Estimationof mean sojourn time in breast can-cer screening using a Markov chainmodel of entry to and exit from pre-clinical detectable phase. Statistics
in Medicine. 1995;14:1531–1543.
18 Kay R. A Markov Model forAnalysing Cancer Markers and Dis-ease States in Survival Studies. Bio-metrics. 1986;42:855–865.
19 Chen B, Yi GY, Cook RJ. Analy-sis of interval-censored disease pro-gression data via multi-state mod-els under a nonignorable inspec-tion process. Statistics in Medicine.2010;29(11):1175–1189.
20 Commenges D, Joly P. Multi-statemodel for dementia, institutionaliza-tion and death. Communications in
Statistics - A. 2004;33:1315–1326.
21 Sutradhar R, Forbes S, UrbachDR, Paszat L, Rabeneck L, Bax-ter NN. Multistate models forcomparing trends in hospitalizationsamong young adult survivors of col-orectal cancer and matched con-trols. BMC Health Service Research.2012;12:353.
22 Innovative Care for Chronic Condi-tions: Building Blocks for Action.Global Report [homepage on theInternet]; 2002 [cited 2014 Jun 21].World Health Organization, Geneva,Switzerland. Available from: www.
who.int/diabetesactiononline/
about/icccglobalreport.pdf.
23 Postmus D, Van Veldhuisen DJ,Jaarsma T, Luttik ML, Lassus J,Mebazaa A, et al. The COACHrisk engine: a multistate model for
predicting survival and hospitaliza-tion in patients with heart failure.European Journal of Heart Failure.2012;14(2):168–175.
24 Barbieri P, Grieco N, Ieva F,Paganoni AM, Secchi P. In: Ex-ploitation, integration and statisticalanalysis of Public Health Databaseand STEMI archive in LombardiaRegion. Complex data modelling andcomputationally intensive statisticalmethods. Series - Contribution toStatistics. Springer; 2010. p. 41–56.
25 Wirehn AB, Karlsson HM,Cartensen JM, et al. Estimat-ing Disease Prevalence using apopulation-based administrativehealthcare database. Scandina-
vian Journal of Public Health.2007;35:424–431.
26 Saczynski JS, Andrade SE, Har-rold LR, Tjia J, Cutrona SL, DoddKS, et al. A systematic reviewof validated methods for identify-ing heart failure using administrativedata. Pharmacoepidemiology and
drug safety. 2012;21(S1):129–140.
27 Macchia A, Monte S, Romero M,D’Ettorre A, Tognon G. The prog-nostic influence of chronic obstruc-tive pulmonary disease in patientshospitalised for chronic heart failure.European Journal of Heart Failure.2007;9:942–948.
28 Au AG, McAlister FA, Bakal JA,Ezekowitz J, Kaul P, van Wal-raven C. Predicting the risk of un-planned readmission ordeath within30 days of discharge after a heart fail-ure hospitalization. American Heart
Journal. 2012;164(3):365–372.
21
29 Aylin P, Bottle A, Majeed A. Useof administrative data or clinicaldatabases as predictors of risk ofdeath in hospital: comparison ofmodels. BMJ. 2007;334:1044.
30 Philbin EF DT. Prediction of Hos-pital Readmission for Heart Failure:Development of a Simple Risk ScoreBased on Administrative Data. Jour-nal of the American College of Car-
diology. 1999;33(6).
31 Lee Douglas S, Donovan L, AustinPC, Yanyan G, Liu PP, Rouleau JL,et al. Comparison of coding of heartfailure and comorbidities in adminis-trative and clinical data for use inoutcomes research. Medical Care.2005;43(2):182–188.
32 Quach S, Blais C, Quan H. Ad-ministrative data have high variationin validity for recording heart fail-ure. Canadian Journal of Cardiology.2010;26(8).
33 Schultz SE, Rothwell DM, Chen Z,Tu K. Identifying cases of conges-tive heart failure from administrativedata: a validation study using pri-mary care patient records. Chronic
Diseases and Injuries in Canada.2013;13(3).
34 Muggah E, Graves E, Bennett C,Manuel DG. Ascertainment ofchronic diseases using populationhealth data: a comparison of healthadministrative data and patient self-report. BMC Public Health. 2013;13.
35 Iron K, Lu H, Manuel D, Henry D,Gershon A. Using Linked HealthAdministrative Data to Assess the
Clinical and Healthcare System Im-pact of Chronic Diseases in Ontario.Healthcare Quarterly. 2011;14(3):23–27.
36 R Development Core Team. R: ALanguage and Environment for Sta-tistical Computing; 2009. Availablefrom: http://www.R-project.org.
37 Therneau TM. A Package for Sur-vival Analysis in S. R package ver-
sion 237-7. 2014;.
38 Jackson CH. Multi-State Models forPanel Data: The msm Package forR. Journal of Statistical Software.2011;38(8):1–29.
39 AHRQ QualityIndicators. Guide toInpatientQualityIndicators: Qualityof Care in Hospitals - Volume, Mor-tality, and Utilization. . 2007;Version3.1.
40 Pope GC, Kautter J, Ellis RP,AshJohn AS, Ayanian Z, Iezzoni LI,et al. Risk Adjustment of Medi-care Capitation Payments Using theCMS-HCC Model. Health Care Fi-
nancial Review. 2004;25(4):119–141.
41 Pope GC, Kautter J, Ingber MJ,Freeman S. Evaluation of the CMS-HCC RiskAdjustment Model - FinalReport. RTI International for CMS.201;.
42 Therneau TM, Grambsch PM;.
43 De Wreede LC, Fiocco M, Putter H.mstate: an R package for the analy-sis of competing risks and multi-statemodels. Journal of Statistical Soft-
ware. 2011;38(7):1–30.
22
44 Kalbfleisch J, Lawless JF. Theanalysis of panel data under aMarkov assumption. Journal of
the American Statistical Association.1985;80(392):863–871.
45 Cox DR, Miller HD. The Theory of
Stochastic Processes. London: Chap-man and Hall; 1965.
46 Mandel M. Simulation-Based Con-fidence Intervals for Functions WithComplicated Derivatives. The Amer-
ican Statistician. 2013;67(2):76–81.
47 Rodriguez-Girondo M, De Una-Alvarez J. A nonparametric testfor Markovianity in the illness-deathmodel. Statistics in Medicine.2012;31:4416–4427.
23
MOX Technical Reports, last issuesDipartimento di Matematica “F. Brioschi”,
Politecnico di Milano, Via Bonardi 9 - 20133 Milano (Italy)
24/2014 Ieva, F., Jackson, C.H., Sharples, L.D.
Multi-State modelling of repeated hospitalisation and death in patientswith Heart Failure: the use of large administrative databases in clinicalepidemiology
23/2014 Ieva, F., Paganoni, A.M., Tarabelloni, N.
Covariance Based Unsupervised Classification in Functional Data Anal-ysis
22/2014 Arioli, G.
Insegnare Matematica con Mathematica
21/2014 Artina, M.; Fornasier, M.; Micheletti, S.; Perotto, S.
The benefits of anisotropic mesh adaptation for brittle fractures underplane-strain conditions
20/2014 Artina, M.; Fornasier, M.; Micheletti, S.; Perotto, S.
Anisotropic mesh adaptation for crack detection in brittle materials
19/2014 L.Bonaventura; R. Ferretti
Semi-Lagrangian methods for parabolic problems in divergence form
18/2014 Tumolo, G.; Bonaventura, L.
An accurate and efficient numerical framework for adaptive numericalweather prediction
17/2014 Discacciati, M.; Gervasio, P.; Quarteroni, A.
Interface Control Domain Decomposition (ICDD) Method for Stokes-Darcy coupling