38
MQXF state of work and analysis of HQ experimental current decays with the QLASA model used for MQXF Vittorio Marinozzi 10/28/2013 1
| Date post: | 24-Dec-2015 |
| Category: |
Documents |
| Upload: | helena-mckinney |
| View: | 216 times |
| Download: | 2 times |
1
MQXF state of work and analysis of HQ experimental current decays with the QLASA model used for MQXF
Vittorio Marinozzi10/28/2013

2
1. Current decay with dumping resistance are faster than expected, because of high dI/dt effects
2. Considering residual bronze in cables causes a drop of ~30 K in the hot spot temperature estimation
1.1 MQXF state of work

3
1.2 dI/dt effects
• 13 kA @ 1.9 K (0.7 of SSL)
• 60 mΩ dumping resistance
• No PH
Dynamic effects confirmed with the cored cable, too.
With 60 mΩ dumping resistance, dI/dt is very higher than MQXF one.Question: do dynamic effects affect the decay with smaller dumping resistance? If yes, how much conservative have we been?
4
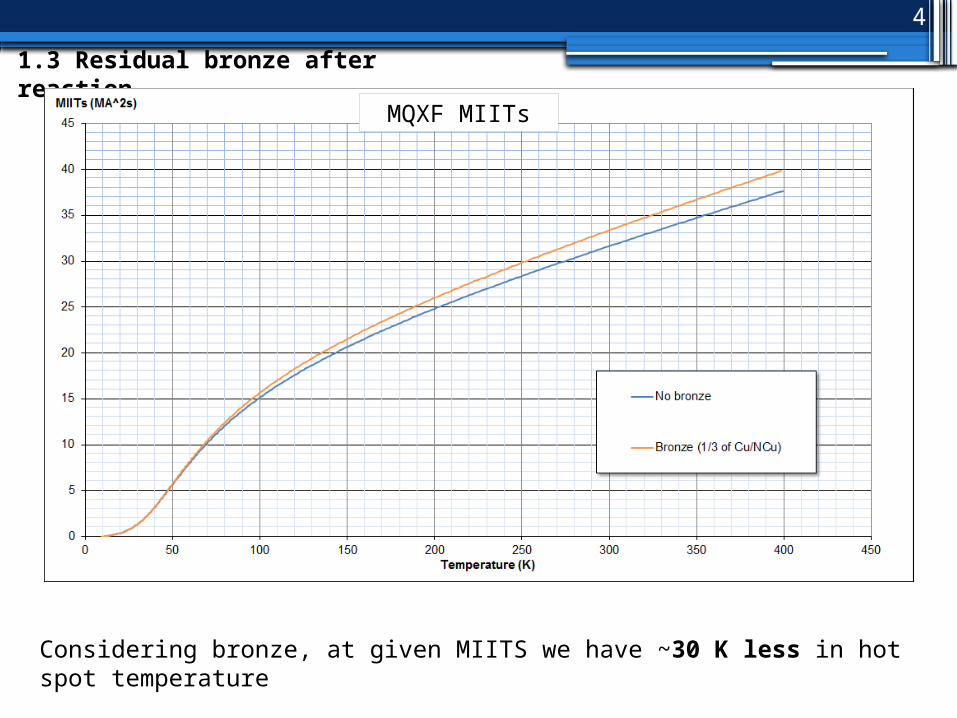
1.3 Residual bronze after reaction
Considering bronze, at given MIITS we have ~30 K less in hot spot temperature
MQXF MIITs

5
1.3 Summary
1. Impact of the material properties uncertainty on the MIITs-T curve
2. Analysis of HQ PH test with no dumping resistance
3. Analysis of HQ PH tests with 5 mΩ dumping resistance (dI/dt similar to MQXF one)
4. Coils resistance measurement during a discharge
5. MQXF protection with IL-HF block PH
6
Impact of the material properties uncertainty on the
MIITs-T curve
7
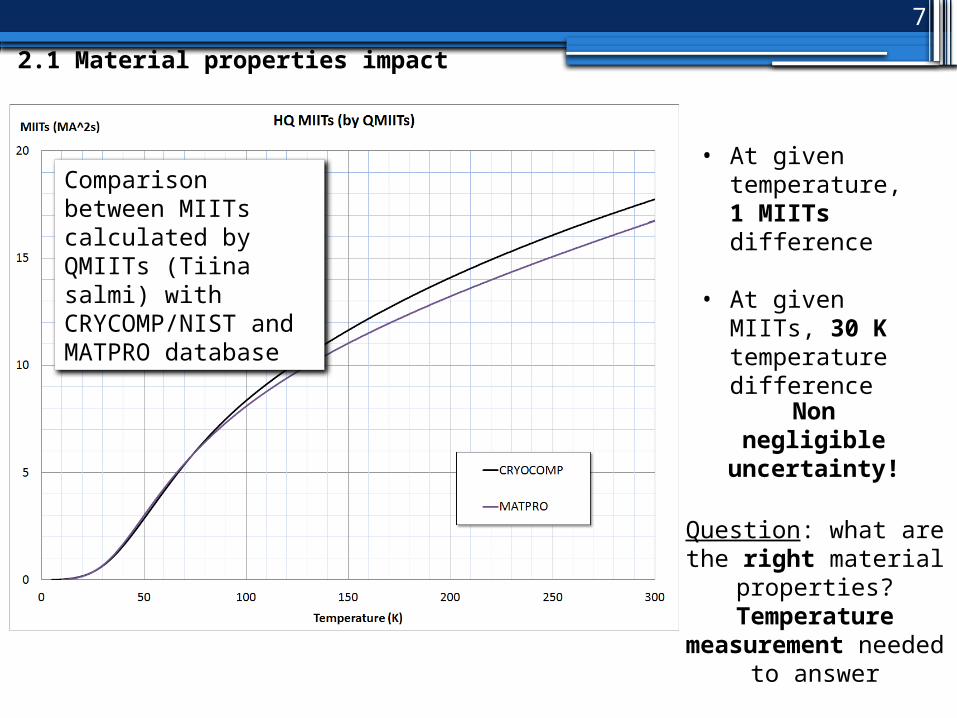
Comparison between MIITs calculated by QMIITs (Tiina salmi) with CRYCOMP/NIST and MATPRO database
• At given temperature, 1 MIITs difference
• At given MIITs, 30 K temperature difference
Non negligible
uncertainty!
Question: what are the right material
properties?Temperature measurement
needed to answer
2.1 Material properties impact

8
Analysis of HQ PH tests with no
dumping resistance

9
3.1 Introduction
• MQXF current decay is dominated by coils resistance
A good understanding of the quench heaters simulation is important
An analysis of HQ02 heaters test is in progress
• OL heaters manual trips
• No dumping resistance
• Currents from 0.4 to 0.8 of SSL
• Simulations with the same assumptions made for the MQXF
Question to answer:
How much conservative are the MQXF simulations?

10
3.2 Current decay comparison
• 14.6 kA @ 1.9 K (0.8 of SSL)
• OL-PH firing at 0 ms• No dumping resistance• Heaters delay time from
Tiina Salmi simulations by CoHDA (Code for Heater Delay Analysis) (heat equation solving)
• Heaters-induced quench covers all the turns, except the top and the bottom ones
• Simulation using nominal inductance (5.8 mH)
• The simulated decay is very slower. MIITs are surely overestimated
• At the start of the decay, the experimental curve is faster than expected
The average of the simulated delays in the HF/LF block is used as delay time in QLASA

11
3.2 Current decay comparison
Current starts to decay after few ms. Heaters do not induce quench so quickly (checked on voltage taps)
Evidence of a “dark” resistance
12
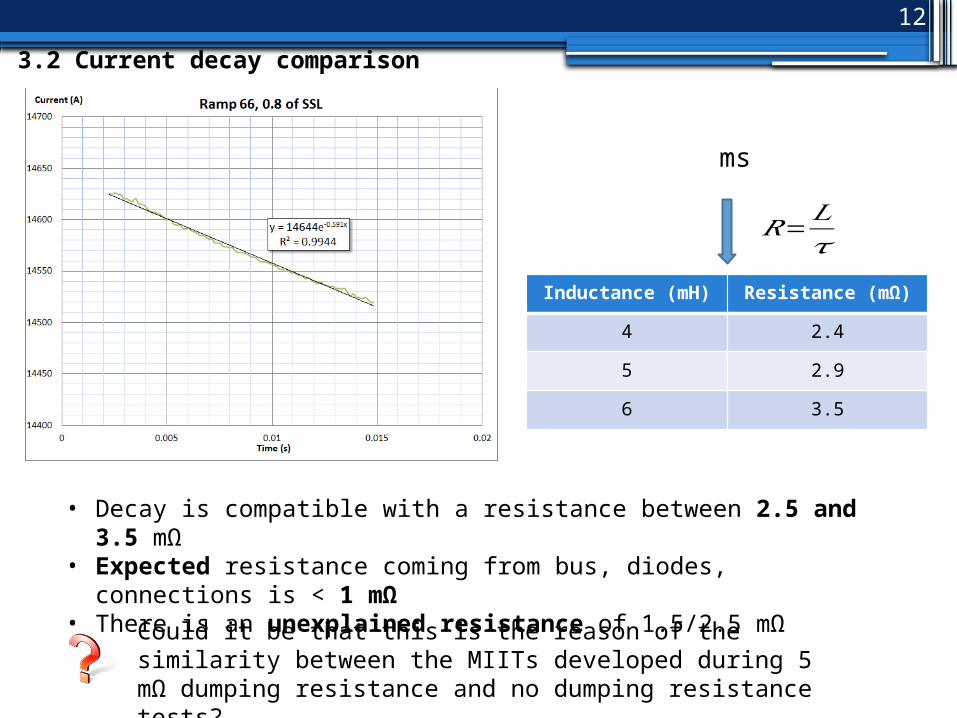
3.2 Current decay comparison
ms
Inductance (mH) Resistance (mΩ)
4 2.4
5 2.9
6 3.5
• Decay is compatible with a resistance between 2.5 and 3.5 mΩ• Expected resistance coming from bus, diodes, connections is <
1 mΩ• There is an unexplained resistance of 1.5/2.5 mΩ
𝑅=𝐿𝜏
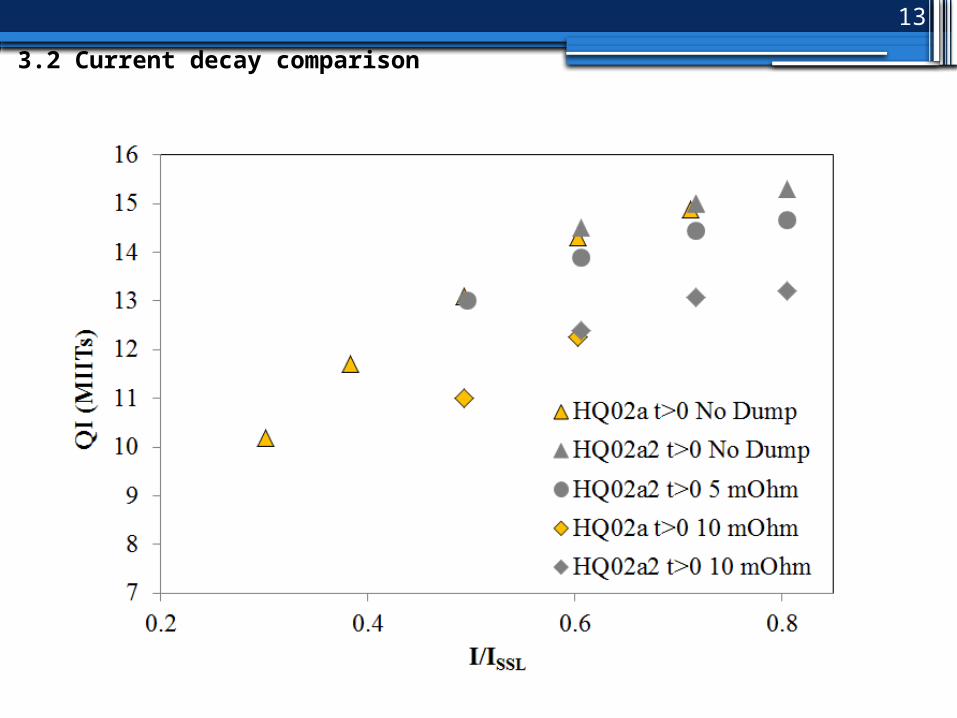
Could it be that this is the reason of the similarity between the MIITs developed during 5 mΩ dumping resistance and no dumping resistance tests?
13
3.2 Current decay comparison
14
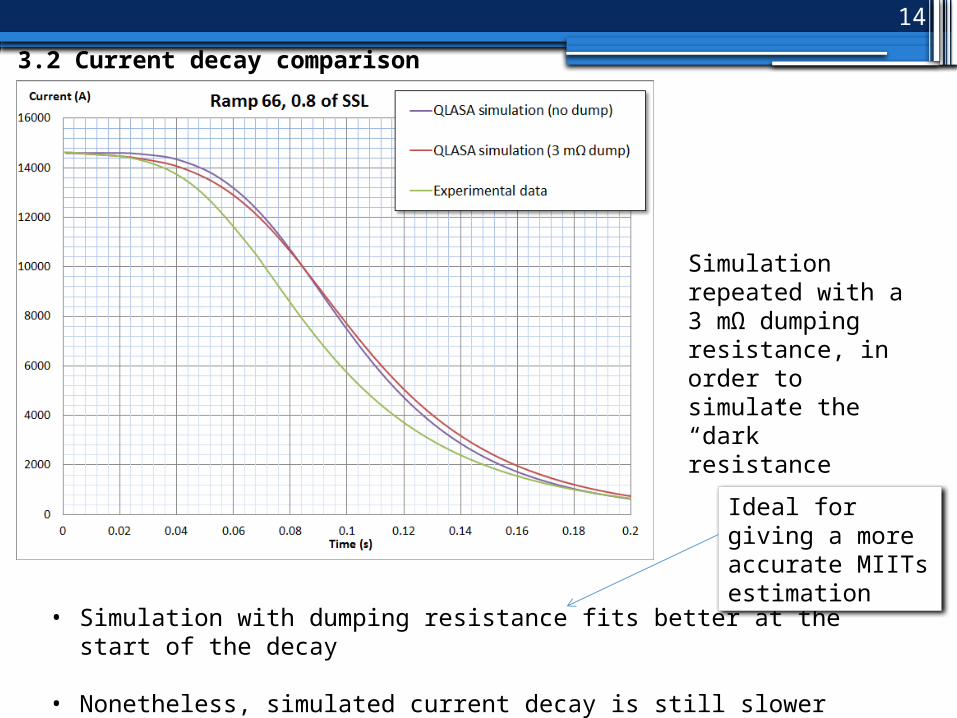
3.2 Current decay comparison
Simulation repeated with a 3 mΩ dumping resistance, in order to simulate the “dark” resistance
• Simulation with dumping resistance fits better at the start of the decay
• Nonetheless, simulated current decay is still slower than experimental one
Ideal for giving a more accurate MIITs estimation
15
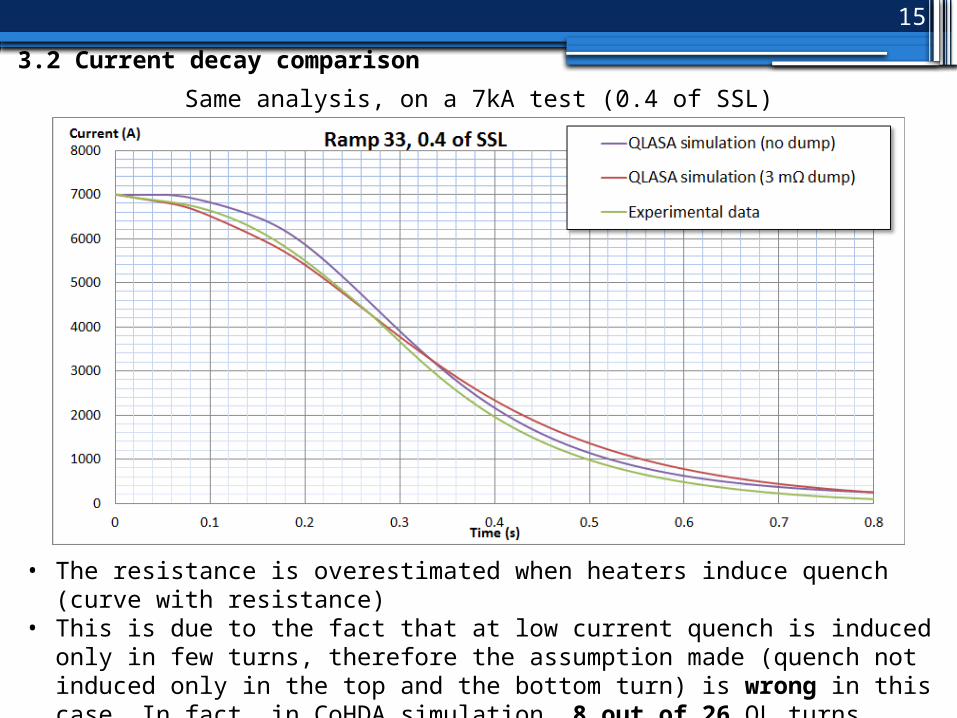
3.2 Current decay comparison
Same analysis, on a 7kA test (0.4 of SSL)
• The resistance is overestimated when heaters induce quench (curve with resistance)
• This is due to the fact that at low current quench is induced only in few turns, therefore the assumption made (quench not induced only in the top and the bottom turn) is wrong in this case. In fact, in CoHDA simulation, 8 out of 26 OL turns did not quench, but QLASA uses an average delay among all the turns

16
Current/SSL 0.8 0.7 0.6 0.5 0.4MIITs difference % (no dump
case)14.5 13.2 9.6 10.7 8.1
MIITs difference % (3 mΩ dump case)
13.4 11.1 6.4 5.3 0.9
3.3 MIITs comparison and conclusions
Most significant case for MQXF
• Under the assumptions used for MQXF, the heaters-induced quench simulation is conservative.
• At the current of interest (0.8 of SSL), the MIITs are overestimated of about 13 %. The overestimation is lower at lower currents.
• An unexplained ~ 2/3mΩ resistance appears during tests with no dumping resistance. This could be the reason of the similarity between MIITs developed during tests with no dumping resistance and tests with a 5 mΩ resistance.

17
3.3 MIITs comparison and conclusions
In MQXF, a MIITs overestimation of ~10% at 350 K corresponds to about 50 K less in hot spot temperature!

18
Analysis of HQ PH tests with 5mΩ
dumping resistance

19
• 14.6 kA @ 1.9 K (0.8 of SSL)
• OL heaters in protection
• Heaters delay time from CoHDA (Tiina salmi)
The current decay is slower in the simulation
The dynamic effects are still considerable (see start of the decay) with a dI/dt similar to MQXF one
Same program and assumptions used for MQXF
4.1 Current decay comparison
20
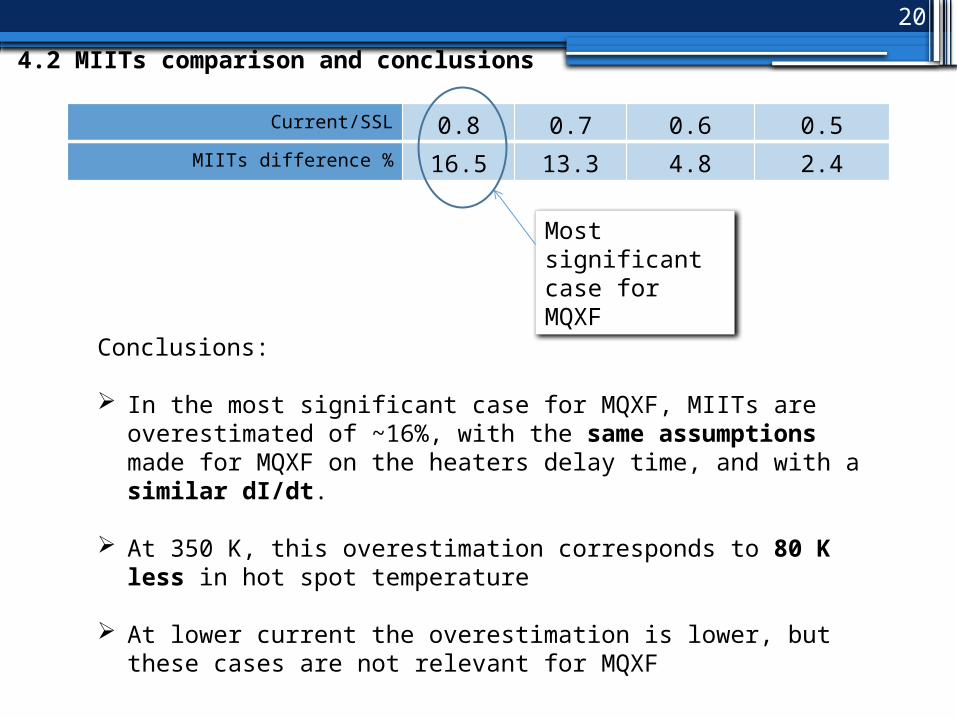
4.2 MIITs comparison and conclusions
Current/SSL 0.8 0.7 0.6 0.5MIITs difference % 16.5 13.3 4.8 2.4
Conclusions:
In the most significant case for MQXF, MIITs are overestimated of ~16%, with the same assumptions made for MQXF on the heaters delay time, and with a similar dI/dt.
At 350 K, this overestimation corresponds to 80 K less in hot spot temperature
At lower current the overestimation is lower, but these cases are not relevant for MQXF
Most significant case for MQXF
21
Resistance growth
measurement

22
5.1 Introduction
• A current decay depends on the ratio between magnet inductance and resistance (coils plus eventual dumping resistance).
• During the discharge, the inductance value appears lower than expected (fact experimentally proved), because of some dI/dt effects.
• This effects are not yet predictable, so we’re using nominal inductance in simulations. The results are conservative.
Question: in the case of negligible dI/dt effects in MQXF, are we still conservative? Is the coils resistance growth simulation conservative?
In order to answer, we’ve measured the coils resistance during the discharge. Then, experimental data have be compared to the simulated resistance growth. This measurement allows measuring the inductance.

23
5.2 Resistance plot
Heaters-induced
quench start:35-40 ms
After dumping resistance (80 ms), data are
unusable

24
5.3 Comparison
• Using delay time by Tiina simulations with CoHDA (same assumptions made for MQXF) the resistance growth is not conservative!
• Anyway, we are analyzing test at 0.5 of SSL, therefore this result is not reliable for MQXF.
Quench induced in all the turns, except the bottom and the top of the OL
25
5.4 Conclusions
Simulated resistance growth is not conservative, using the same assumptions made for MQXF.
Anyway, these results are not reliable for MQXF, because they are at 0.5 of SSL current.
These kind of test seems interesting for future studies, such as a similar analysis at 0.8 of SSL current (MQXF similar case), or for checking the differences between the heaters effect on different coils.
This kind of test could be used also for measuring inductance during the discharge
26
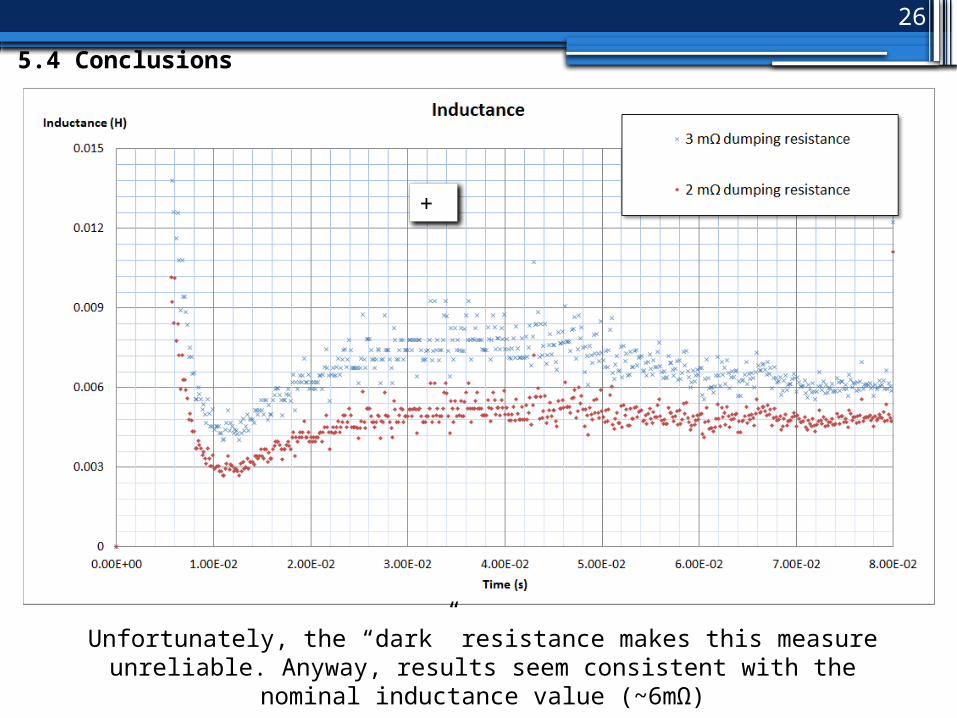
5.4 Conclusions
+
Unfortunately, the “dark” resistance makes this measure unreliable. Anyway, results seem consistent with the nominal
inductance value (~6mΩ)

27
MQXF protection with IL-HF block
PH

28
6.1 PH in the IL – HF zone
• OL Heaters delay time: 17 ms (HF block, from CoHDA)
• Validation time: 10 ms• Dumping resistance: 46 mΩ (800
V)• Voltage threshold: 100 mV• Bronze fraction: 30% of Cu/NCu• Two magnets (16 m) per
dumping resistance
29
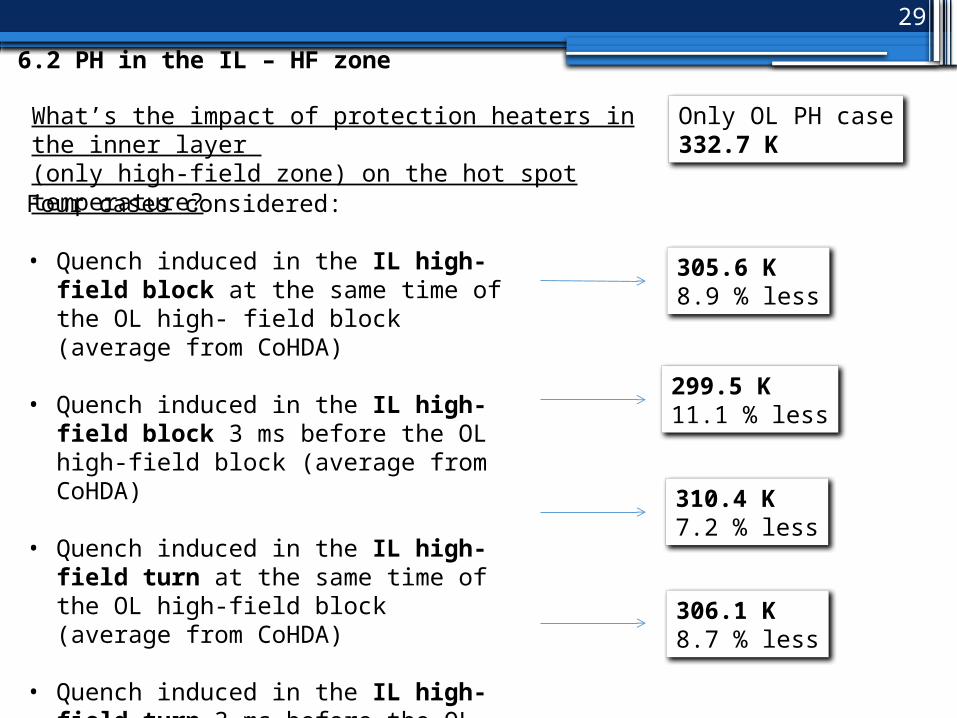
6.2 PH in the IL – HF zone
What’s the impact of protection heaters in the inner layer (only high-field zone) on the hot spot temperature?Four cases considered:
• Quench induced in the IL high-field block at the same time of the OL high- field block (average from CoHDA)
• Quench induced in the IL high-field block 3 ms before the OL high-field block (average from CoHDA)
• Quench induced in the IL high-field turn at the same time of the OL high-field block (average from CoHDA)
• Quench induced in the IL high-field turn 3 ms before the OL high-field block (average from CoHDA)
Only OL PH case332.7 K
305.6 K8.9 % less
299.5 K11.1 % less
310.4 K7.2 % less
306.1 K8.7 % less
30
6.3 Conclusions
Considering protection heaters on the inner layer (only in the high field zone), causes a drop in temperature of 20-30 K
The temperature difference between considering quench induced in the whole IL-HF block, or only in the IL-HF turn, is only of 5 K.
The temperature difference between considering the whole IL-HF block or turn to quench at the same time of the OL-HF, or 3 ms before, is only of 5 K.
We could consider the idea of protection heaters on the inner layer, high-field block. It could be enough only on the high-field turn.
Question to answer: What’s the impact of the bubbles caused by helium evaporation?
31
Conclusions
32
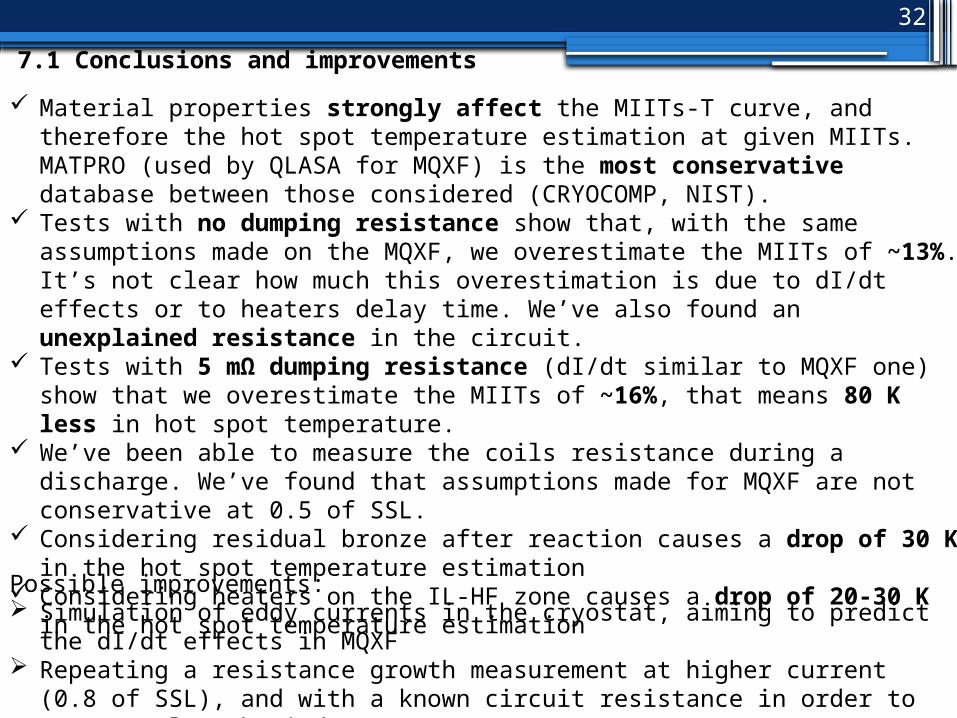
7.1 Conclusions and improvements
Possible improvements: Simulation of eddy currents in the cryostat, aiming to predict the dI/dt
effects in MQXF Repeating a resistance growth measurement at higher current (0.8 of
SSL), and with a known circuit resistance in order to measure also the inductance
Material properties strongly affect the MIITs-T curve, and therefore the hot spot temperature estimation at given MIITs. MATPRO (used by QLASA for MQXF) is the most conservative database between those considered (CRYOCOMP, NIST).
Tests with no dumping resistance show that, with the same assumptions made on the MQXF, we overestimate the MIITs of ~13%. It’s not clear how much this overestimation is due to dI/dt effects or to heaters delay time. We’ve also found an unexplained resistance in the circuit.
Tests with 5 mΩ dumping resistance (dI/dt similar to MQXF one) show that we overestimate the MIITs of ~16%, that means 80 K less in hot spot temperature.
We’ve been able to measure the coils resistance during a discharge. We’ve found that assumptions made for MQXF are not conservative at 0.5 of SSL.
Considering residual bronze after reaction causes a drop of 30 K in the hot spot temperature estimation
Considering heaters on the IL-HF zone causes a drop of 20-30 K in the hot spot temperature estimation
33
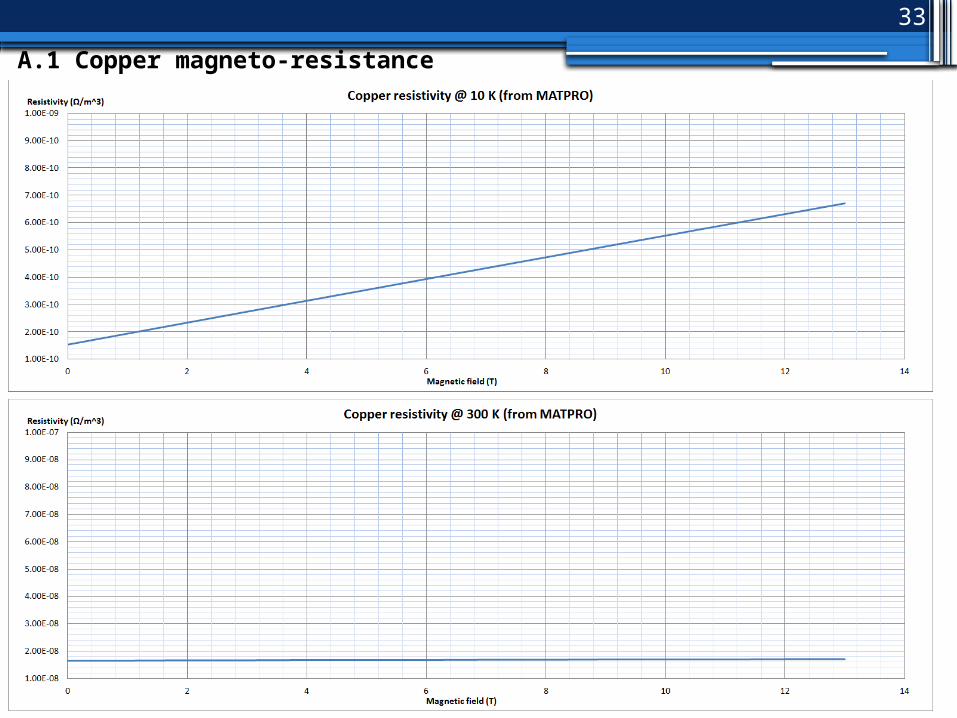
A.1 Copper magneto-resistance

34
A.2 The measure
Manual trip of the OL heaters, but only in two coils (opposite coils have been chosen, for mechanical reasons)
Voltage measure between the ends of the four coils. In the two coils where the quench has been induced, the signal is resistive plus inductive, in the other two it’s only inductive.
𝑉 𝑐𝑜𝑖𝑙=𝑅𝑐𝑜𝑖𝑙 𝐼+𝐿𝑐𝑜𝑖𝑙
Under the hypothesis of identic coils, by means of the difference between the two kind of signals, you can extract the resistive signal, and therefore the resistance
𝑅𝑐𝑜𝑖𝑙=𝑉 𝑐𝑜𝑖𝑙 1−𝑉 𝑐𝑜𝑖𝑙 3
𝐼
Inconvenient: this measure can be done only at low current, for protection reasons, and for preventing development of quench in the coils not covered by heaters. For protection reason, a 60 mΩ dumping resistance is used after 80 ms.
1
2 3
4
35
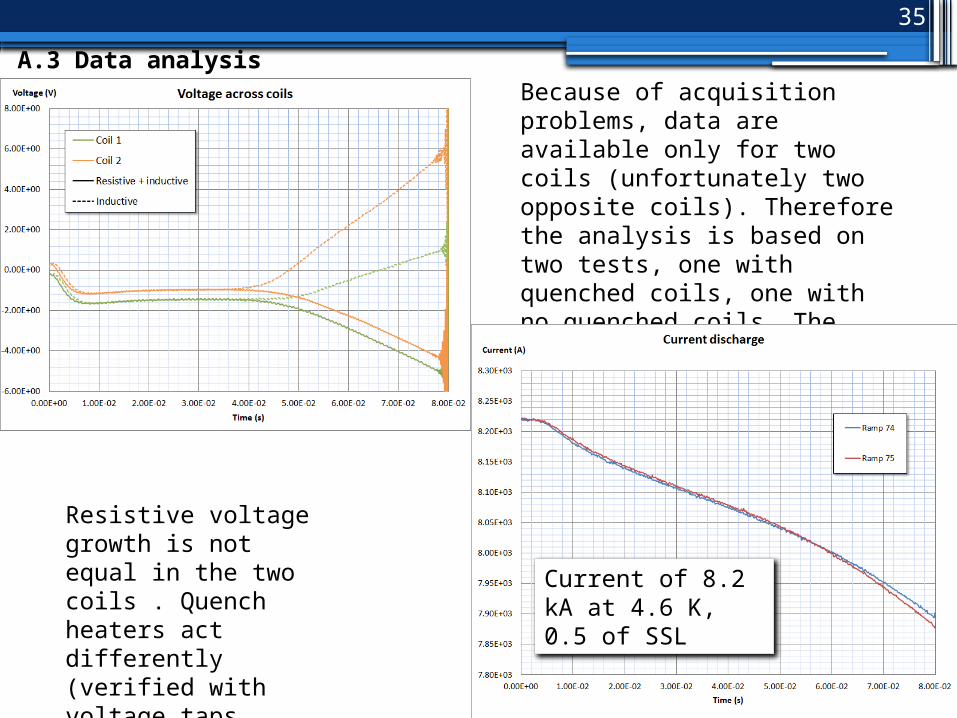
A.3 Data analysis Because of acquisition problems, data are available only for two coils (unfortunately two opposite coils). Therefore the analysis is based on two tests, one with quenched coils, one with no quenched coils. The current decay is almost coincident, so the approximation is very good
Resistive voltage growth is not equal in the two coils . Quench heaters act differently (verified with voltage taps check)
Current of 8.2 kA at 4.6 K, 0.5 of SSL
36
A.4 Comparison
In simulations, I’ve made some different assumptions on heaters delay time and heaters-induced quench size at
the startAbout heaters delay time, I’ve used two values:1. Experimental quench start (35-40 ms)2. Time at which quench reaches a voltage of 1V (47-52 ms). This
voltage corresponds to the simulated voltage between the coil ends after 2 ms. This is because, in the simulation, quench starts suddenly in several turns, instead in the actual case the quench start is distributed along the time.
About quench initial size, I’ve analyzed three cases:1. Quench is induced in all the turns, except the top and the
bottom turn of the OL (case similar to MQXF one).2. Quench is induced in all the turns, except the three top and the
three bottom turns of the OL3. Quench is induced only in the high-field turn of the OL
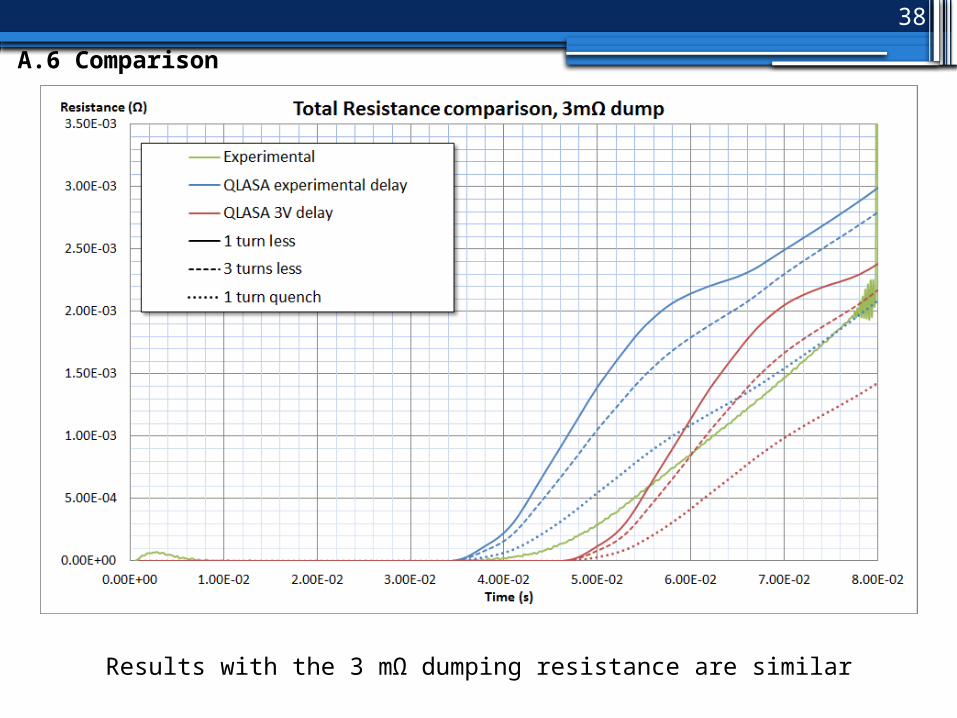
Simulations have been done for the cases with no dumping resistance and with 3 mΩ dumping resistance
37
A.5 Comparison
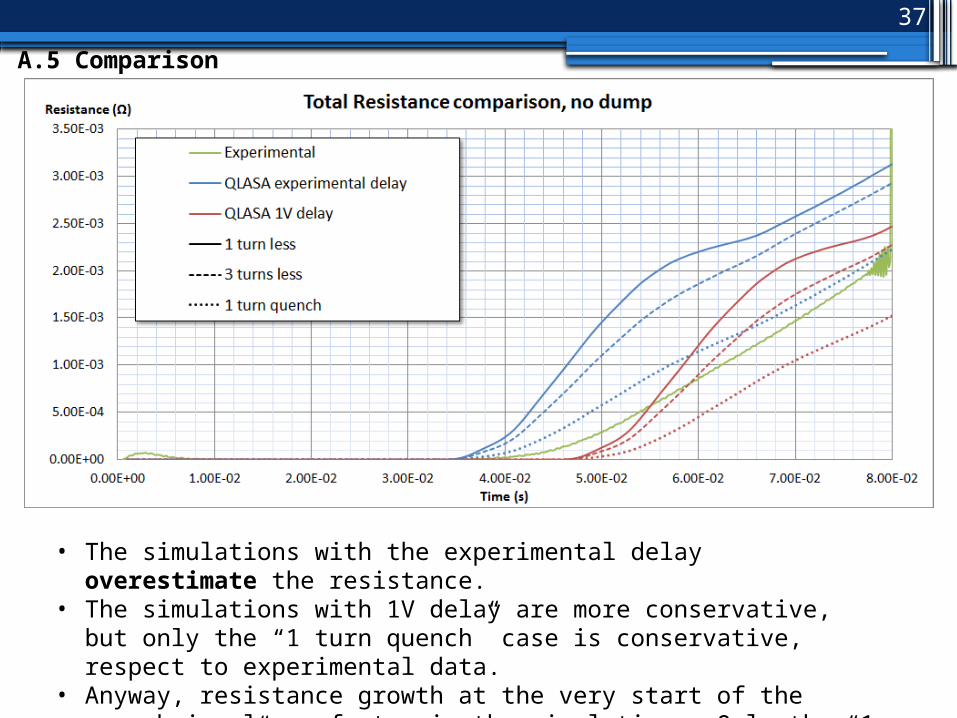
• The simulations with the experimental delay overestimate the resistance.
• The simulations with 1V delay are more conservative, but only the “1 turn quench” case is conservative, respect to experimental data.
• Anyway, resistance growth at the very start of the quench is always faster in the simulations. Only the “1 turn quench” case is comparable.
38
A.6 Comparison
Results with the 3 mΩ dumping resistance are similar


