Page 1
HAL Id: hal-01543092https://hal.archives-ouvertes.fr/hal-01543092
Submitted on 26 Jun 2017
HAL is a multi-disciplinary open accessarchive for the deposit and dissemination of sci-entific research documents, whether they are pub-lished or not. The documents may come fromteaching and research institutions in France orabroad, or from public or private research centers.
L’archive ouverte pluridisciplinaire HAL, estdestinée au dépôt et à la diffusion de documentsscientifiques de niveau recherche, publiés ou non,émanant des établissements d’enseignement et derecherche français ou étrangers, des laboratoirespublics ou privés.
MRI anatomical mapping and direct stereotactictargeting in the subthalamic region: functional andanatomical correspondence in Parkinson’s disease
Jean-Jacques Lemaire, Jerome Coste, Lemlih Ouchchane, Simone Hemm,Philippe Derost, Miguel Ulla, Séverine Siadoux, Jean Gabrillargues, Franck
Durif, Jean Chazal
To cite this version:Jean-Jacques Lemaire, Jerome Coste, Lemlih Ouchchane, Simone Hemm, Philippe Derost, et al..MRI anatomical mapping and direct stereotactic targeting in the subthalamic region: functionaland anatomical correspondence in Parkinson’s disease. International Journal of Computer AssistedRadiology and Surgery, Springer Verlag, 2007, 2 (2), pp.75-85. �10.1007/s11548-007-0124-2�. �hal-01543092�
Page 2
Lemaire et al. 2007
1
MRI anatomical mapping and direct stereotactic targeting in the subthalamic
region: functional and anatomical correspondence in Parkinson’s disease
Jean-Jacques Lemaire(1,2,6)
· Jérôme Coste(1,2)
· Lemlih Ouchchane(3,2)
·Simone
Hemm(2)
· Philippe Derost(4)
· Miguel Ulla(4)
Séverine Siadoux(5)
·Jean
Gabrillargues(5,2)
· Franck Durif(4)
· Jean Chazal(1)
(1) Service de Neurochirurgie A, CHU Clermont-Ferrand, Hôpital Gabriel Montpied, Clermont-Ferrand 63003, France
(2) Inserm, ERI 14, Clermont-Ferrand 63001, France
(3) Unité de Biostatistiques, télématique et traitement d’image, Univ Clermont 1, UFR Médecine, Clermont-Ferrand 63001, France
(4) Service de Neurologie A, CHU Clermont-Ferrand, Hôpital Gabriel Montpied, Clermont-Ferrand 63003, France
(5) Service de Radiologie A, CHU Clermont-Ferrand, Hôpital Gabriel Montpied, Clermont-Ferrand 63003, France
(6) Corresponding author: [email protected]
Abstract
Object Relationships between clinical effects, anatomy, and electrophysiology are not fully
understood in DBS of the subthalamic region in Parkinson’s disease. We proposed an anatomic
study based on direct image-guided stereotactic surgery with a multiple source data analysis.
Materials and Methods A manual anatomic mapping was realized on coronal 1.5-Tesla MRI of
15 patients. Biological data were collected under local anesthesia: the spontaneous neuron
activities and the clinical efficiency and the appearance of adverse effects. They were related to
relevant current values (mA), the benefit threshold (bt, minimal current leading an clear
efficiency), the adverse effect threshold (at, minimal current leading an adverse effect) and the
stimulation margin (sm = at − bt); they were matched with anatomy.
Results We found consistent relationships between anatomy and biological data. The optimal
stimulation parameters (low bt + high sm) were noted in the dorsolateral STN. The highest
spontaneous neuron activity was found in the ventromedial STN. Dorsolateral (sensorimotor)
STN seems the main DBS effector. The highest spontaneous neuron activity seems related to the
anterior (rostral) ventromedial (limbic) STN.
Conclusion 1.5 Tesla images provide sufficiently detailed subthalamic anatomy for image-guided
stereotactic surgery and may aid in understanding DBS mechanisms.
Keywords Image-guided surgery, STN-DBS, Stereotaxy, Brain mapping
Page 3
Lemaire et al. 2007
2
Introduction
Deep brain stimulation (DBS) of the subthalamic nucleus (STN) is widely accepted as treatment
of symptoms related to severe idiopathic Parkinson’s disease (PD). It dramatically alleviates
motor fluctuations and dyskinesia and leads to a significant reduction of dopatherapy [1–6]. DBS
seems to act mainly through a functional inactivation of the STN, the surgical target, through a
complex modulation [7–14]. However, neighboring structures, particularly the zona incerta (ZI)
and Forel’s fields, are strongly suspected to participate in the clinical effect [7,15–20]. To
investigate relationships between anatomic structures and effects we proposed a study based on
direct image-guided stereotactic surgery. Nuclei and bundles were identified during the planning
on coronal T2-weighted magnetic resonance imaging (MRI) images. This non probabilistic
approach, without reference to traditional anatomic landmarks (the anterior and posterior white
commissures, ACPC), is used in routine in our institution for DBS surgery [21,22]. It allows a 3D
trajectory optimization taking into account the neighbor structures around the target. Acute
stimulation tests and electrophysiological recordings were performed intra operatively, the patient
awake under local anesthesia, affording a side by side analysis of the subthalamic region. In a
prospective study, we aimed to analyze the multiple source data to evaluate the pertinence of the
detailed anatomic approach and beyond to improve the patient care through a better knowledge of
the mechanisms of DBS.
Materials and Methods
1. Clinical material
Fifteen consecutive patients, candidates for a DBS procedure according to the guidelines of the
French National Agency of Accreditation and Evaluation in Health, were studied. Clinical, MRI
and electrophysiological data were prospectively recorded between September 2004 and April
2005. Patients consisted of 8 males and 7 females suffering from a severe PD (values are
expressed as mean ± SD): age 62.1 ± 7.5 years, duration of disease 12.1 ± 4.8 years, Hoehn &
Yahr score in OFF state 2.3 ± 0.9 and ON state 2 ± 0.9 Unified Parkinson’s Disease Rate Scale
(UPDRS) in OFF state 27.5 ± 11 and ON state 8.6±5.8, Levodopa response 70.3±13.9 % and
treatment (Levodopa Equivalent dose) 1012.7 ± 437.6 mg.
Page 4
Lemaire et al. 2007
3
2. Anatomical mapping and surgical planning
A stereotactic frame (Leksell G frame, Elekta, Sweden) was placed with its repositioning kit
(Leksell repositioning kit, Elekta, Sweden) under local anesthesia. The repositioning kit consisted
in four posts with pre-positioned screw locations (the grooved hollows are numbered) and four
calibrated fiber glass fixations inserted coaxially into calibrated hollows performed in the outer
layer of the skull; for each post, the number of the grooved hollow used, the length of the fixation
and the value of exceeding of the fixation out of post, were noted for repositioning. The frame
was fitted to the cranial base along the Reid’s (suborbital - external auditory meatus) baseline. A
stereotactic MRI (with the stereotactic frame and its Coordinates Indicator Box) was performed
(Sonata 1.5 Tesla, Siemens, Germany) in the coronal plane. A Cortex Attenuated Inversion
Recovery sequence [23] was optimized for a better anatomical analysis without loss of
geometrical accuracy (White matter Attenuated Inversion Recovery sequence, WAIR, Table 1;
unpublished data).
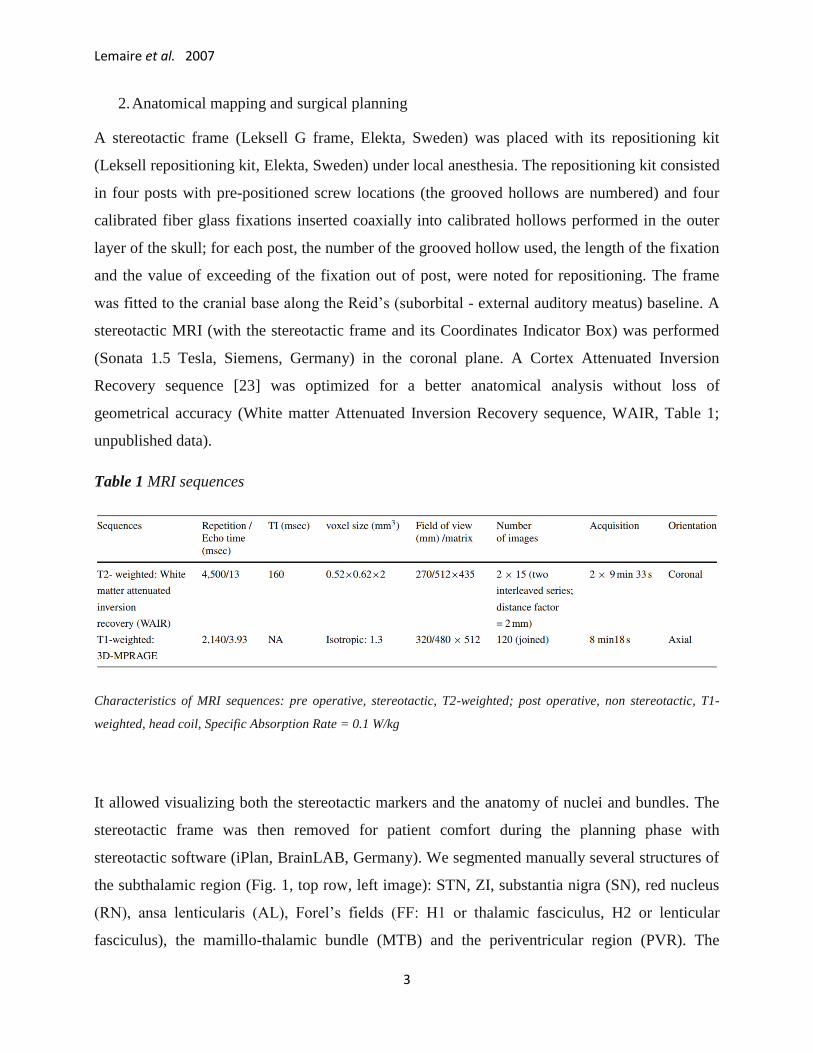
Table 1 MRI sequences
Characteristics of MRI sequences: pre operative, stereotactic, T2-weighted; post operative, non stereotactic, T1-
weighted, head coil, Specific Absorption Rate = 0.1 W/kg
It allowed visualizing both the stereotactic markers and the anatomy of nuclei and bundles. The
stereotactic frame was then removed for patient comfort during the planning phase with
stereotactic software (iPlan, BrainLAB, Germany). We segmented manually several structures of
the subthalamic region (Fig. 1, top row, left image): STN, ZI, substantia nigra (SN), red nucleus
(RN), ansa lenticularis (AL), Forel’s fields (FF: H1 or thalamic fasciculus, H2 or lenticular
fasciculus), the mamillo-thalamic bundle (MTB) and the periventricular region (PVR). The
Page 5
Lemaire et al. 2007
4
recognition of structures was achieved through a step by step approach based on the transfer of
the anatomical knowledge on the structures revealed by the contrasts of the WAIR sequence. This
was facilitated by the help of current anatomic and stereotactic books and 4.7 T MRI in-house
anatomy software [24] allowing accurate 3D multi plane analysis. The anatomical stereotactic
mapping was facilitated by the contrasts of the WAIR sequence, similar to the 4.7 T MRI in-
house anatomy software and the Schaltenbrand and Bailey’s atlas (Fig. 1). Then the two
trajectories (right and left) were planned as follows: double obliquity (ring and arc angles),
entrance point on the second frontal gyrus, extra ventricular trajectory avoiding vessels and
caudate nucleus and optimization of angles (ring and arc) to explore the anterior STN (in front of
the anterior border of RN) along the longest diameter from dorsolateral to ventromedial (i.e., the
endpoint located close to SN). We planned a 10-mm exploration from the ventral thalamus
(mainly the lateral border with the reticular nucleus) to the ventral anterior half of the STN (Fig.
1). The duration of the whole planning procedure (anatomical mapping of nine structures per
side; trajectories) for the direct targeting (i.e., without reference to ACPC) was about 1 h.
3. Electrode implantation
The following day the frame was repositioned under local anesthesia and antiparkinson-drug free
conditions since midnight. X-ray controls during the procedure confirmed that the tracts followed
the planning. Two quadripolar electrodes (DBS 3389, Medtronic, USA) were placed during the
same procedure. For each electrode (right and left) we optimized the positioning of one contact
(we always selected the contact n◦1, located just above the distal one or contact n◦0; diameter =
1.27 mm, length = 1.5 mm). For each side, the DBS electrode was implanted after an
electrophysiological mapping with two exploration electrodes (Alpha Omega, Israel): one on the
planned tract (named central) and a parallel one 2 mm anteriorly (named anterior). We used a
“closed dura mater” approach with water-air tight guides (Bengun, Immi, France) to minimize the
brain shift due to cerebrospinal fluid leakage during the introduction of guide tubes. The
electrophysiological analysis was performed along the lower 10-mm of the two tracts, from
proximal to distal (from −10 to 0 mm position). We first recorded the spontaneous extracellular
neuronal activity every 0.5 mm (mean duration 60 s) using the recording contact of the
exploration electrode (microelectrode contact, diameter = 25µm, length = 100µm).
Page 6
Lemaire et al. 2007
5
Figure 1 Overview of the method allowing image analysis. Top row (black horizontal line = 10mm): left, anatomical
mapping on the pre operative MRI images (WAIR sequence, voxel = 0.52 × 0.62 × 2 mm3), Substantia nigra (*),
subthalamic nucleus (*), zona incerta plus Arnold’s net (◦), Forel’s fields (grey arrows) and mamillo-thalamic
bundle (white arrows); middle and right, visual aids used for the recognition of anatomy, respectively, approximate
slice of 4.7T MRI in-house anatomy software (isotropic voxel = 253µm3; anatomic specimen preparation) and plate
of the Schaltenbrand and Bailey Atlas. Intermediate row reconstructed MRI slice along the planned trajectory and
merged anatomical mapping. Bottom row the DBS electrode is visible as a black artifact; the reference contact
location, calculated on the postoperative stereotactic X-ray control, is displayed as a segment (light purple)
Page 7
Lemaire et al. 2007
6
Then, after retraction of the recording contact and moving out to – 10 mm position, acute
stimulation tests up to 4 mA were performed every 1 mm from proximal to distal. Therefore, the
stimulation contact of the exploration electrode was used (macro-electrode contact, diameter =
550 µm, length = 1.2 mm; maximal current density 1.9 mA/mm2, frequency = 130 Hz, pulse
width 60 µs). At each checkpoint, the clinical benefit (neurologist evaluation) and the adverse
effects were recorded while increasing (step = 0.2 mA) the stimulation current. The quality of
improvement was quantified with a subjective scale, the improvement degree, estimatedas
follows: 0 = 0%, 1 = 25%, 2 = 50%, 3 = 75% and 4 = 100% (intermediate values between two
adjacent entire values were accepted). The current thresholds linked to clinical benefit (benefit
threshold, bt) and to adverse effects (adverse effect threshold, at) were noticed as well as the
difference between the adverse effect threshold and the benefit threshold, the stimulation margin
(sm = at−bt). If no adverse effect was noted till 4 mA, the adverse effect threshold was defined as
4 mA by design, delivering a standardized range of stimulation margins (smmin = 0 mA, smmax
= 4 mA). The stimulation tests were stopped when we obtained the best clinical improvement
(improvement degree > 2) with the lowest current, often before the end point of the tract. We
considered that we were past the optimal region if the benefit threshold (bt) increased and/or the
stimulation margin (sm) decreased significantly as compared to these values at the optimal point.
A DBS electrode was placed on the tract where we found the best stimulation parameters: the
lowest benefit threshold (bt) with a high stimulation margin (sm). The center of contact n◦1
(named reference contact) was placed on this optimal point. The DBS electrode placement was
based strictly on the stimulation effects, without taking into account the extracellular neuronal
activity (Fig. 2). A stereotactic X-ray control (based on Leksell Coordinates Indicator Box) was
performed at the end of the procedure to check the electrode positions before removal of the
frame.
Page 8
Lemaire et al. 2007
7
Figure 2 Example of intra operative clinical and electrophysiological mapping. The exploration was performed
along the distal 10-mm of the planed trajectory going through the subthalamic region. The clinical efficiency was
assessed every 1 mm giving two main electro-clinical parameters (y-axis; mA): the benefit threshold (black dot) and
the therapeutic margin (grey lozenge); minimal current leading an adverse effect (white dot). Note that the
stimulation tests were stopped 1 mm before the end point because of both a low adverse effect threshold and a
reduced therapeutic margin. The reference contact was placed on the optimal clinical efficiency zone (hatched grey
area), with both a low benefit threshold and a high therapeutic margin. The neuronal activity is plotted in
background (grey area, recording every 0.5 mm; the higher the spike, the higher the activity)
4. Post operative data
An early (within 2 days) MRI control (Table 1) was performed to identify asymptomatic
complications and to confirm position of DSB electrodes in the planned trajectories. The
visualization of the tracts selected for DBS electrode placement showed that all of them were
located within the artifact visible on the postoperative MRI (Fig. 1). After this control, a
neuropacemaker (Kinetra, Medtronic, USA) was implanted in the abdominal wall, under general
anesthesia.
Page 9
Lemaire et al. 2007
8
5. Classification of electrophysiological recordings and definition of stimulation related
parameters
The electrophysiological recordings were analyzed on and/or off line by an electro physiologist
and a neurosurgeon both blind to the anatomy. We used a qualitative classification of multi-unit
recordings, based on the visual evaluation of 30-s consecutive and spontaneous cell activity
replayed on a 5-s frame display (MicroGuide, Alpha-Omega, Israel). Six patterns of neuronal
activity were defined, regardless of the signal amplitude, considering relative regularity and
frequency, from the lowest to the highest (Fig. 3) : 0 = background noise, 1= isolated activity, 2A
= irregular low activity, 2B = irregular moderate activity, 2C = irregular high activity, 3 = low
burst-like activity, 4 = high burst-like activity and 5 = permanent tonic activity. The activity was
considered as monotonous if we noted only one type of pattern on whole recording, otherwise it
was variable. The stimulation related parameters were the benefit threshold (mA), the adverse
effect threshold (mA) and the difference so called the stimulation margin (mA).
Figure 3 Electrophysiological data: top classification of typical patterns (multi-unit recordings) of extracellular
neuron activity (y-axis, µV); bottom distribution of patterns according to structures (see text for abbreviations; y-
axis = number of patterns irrespective of trace type, monotonous or variable, minute contribution structures are
removed, PVR and AL)
Page 10
Lemaire et al. 2007
9
Rigidity and/or tremor were assessed mainly on the superior limb and in particular the wrist or
the elbow. The related improvement degree and adverse effects, gaze, vegetative, sensitive and
motor were recorded.
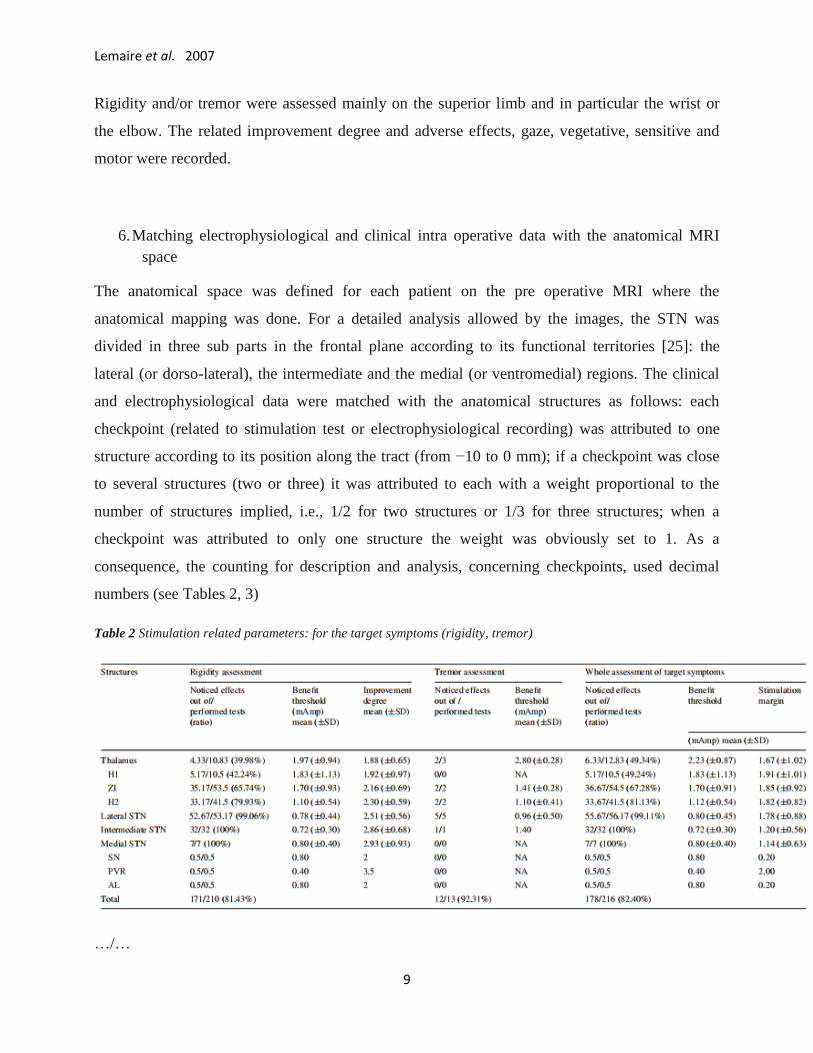
6. Matching electrophysiological and clinical intra operative data with the anatomical MRI
space
The anatomical space was defined for each patient on the pre operative MRI where the
anatomical mapping was done. For a detailed analysis allowed by the images, the STN was
divided in three sub parts in the frontal plane according to its functional territories [25]: the
lateral (or dorso-lateral), the intermediate and the medial (or ventromedial) regions. The clinical
and electrophysiological data were matched with the anatomical structures as follows: each
checkpoint (related to stimulation test or electrophysiological recording) was attributed to one
structure according to its position along the tract (from −10 to 0 mm); if a checkpoint was close
to several structures (two or three) it was attributed to each with a weight proportional to the
number of structures implied, i.e., 1/2 for two structures or 1/3 for three structures; when a
checkpoint was attributed to only one structure the weight was obviously set to 1. As a
consequence, the counting for description and analysis, concerning checkpoints, used decimal
numbers (see Tables 2, 3)
Table 2 Stimulation related parameters: for the target symptoms (rigidity, tremor)
…/…
Page 11
Lemaire et al. 2007
10
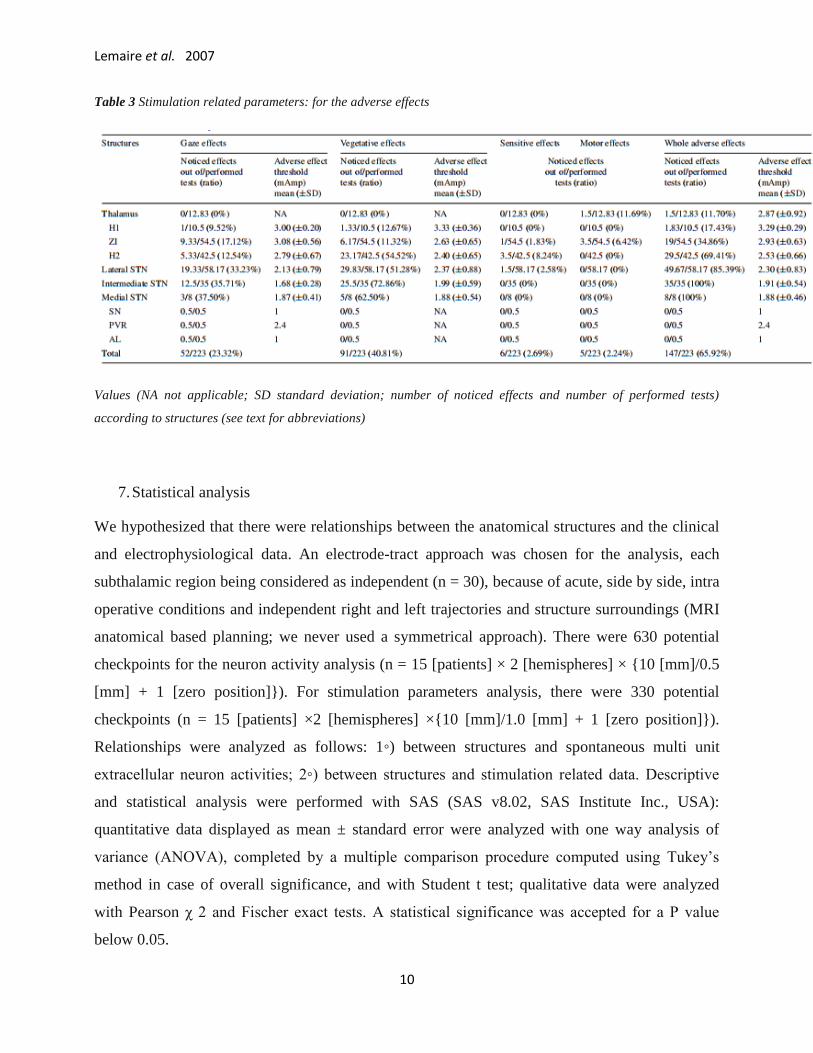
Table 3 Stimulation related parameters: for the adverse effects
Values (NA not applicable; SD standard deviation; number of noticed effects and number of performed tests)
according to structures (see text for abbreviations)
7. Statistical analysis
We hypothesized that there were relationships between the anatomical structures and the clinical
and electrophysiological data. An electrode-tract approach was chosen for the analysis, each
subthalamic region being considered as independent (n = 30), because of acute, side by side, intra
operative conditions and independent right and left trajectories and structure surroundings (MRI
anatomical based planning; we never used a symmetrical approach). There were 630 potential
checkpoints for the neuron activity analysis (n = 15 [patients] × 2 [hemispheres] × {10 [mm]/0.5
[mm] + 1 [zero position]}). For stimulation parameters analysis, there were 330 potential
checkpoints (n = 15 [patients] ×2 [hemispheres] ×{10 [mm]/1.0 [mm] + 1 [zero position]}).
Relationships were analyzed as follows: 1◦) between structures and spontaneous multi unit
extracellular neuron activities; 2◦) between structures and stimulation related data. Descriptive
and statistical analysis were performed with SAS (SAS v8.02, SAS Institute Inc., USA):
quantitative data displayed as mean ± standard error were analyzed with one way analysis of
variance (ANOVA), completed by a multiple comparison procedure computed using Tukey’s
method in case of overall significance, and with Student t test; qualitative data were analyzed
with Pearson χ 2 and Fischer exact tests. A statistical significance was accepted for a P value
below 0.05.
Page 12
Lemaire et al. 2007
11
Results
1. Intra operative data
Of the 630 potential checkpoints, 570 were related both to a structure and to a neuron activity.
There were 60 missing checkpoints; three could not be defined anatomically on one tract, as there
were small artifacts related to a hyper signal area (< 2mm). Fifty-seven recordings were not
readable. The majority of 30-s recording traces were monotonous (446 times = 78.2%) and the
minority was variable (124 times = 21.8%). The mean impedance of the 30 exploration electrodes
was 0.54±0.28 Megohms (at 1000 Hz). The mean length of exploration tract during the
stimulation tests was 6.83±1.42 mm (median value = modal value = 6 mm; out of the 10-mm
potential exploration). The efficiency assessment was related both to a structure and to
stimulation data on 216 checkpoints (65.5% from 330 potential checkpoints, 106 were not tested,
7 had no scaling of the benefit and one was not anatomically defined due to the artifact
previously described). For the adverse effect assessment, 223 checkpoints were used (67.5% from
330 potential checkpoints, 106 were not explored and one was not anatomically defined). The
stimulation assessment focused mainly on rigidity (210 tests versus 13 tests for tremor). The main
acute adverse effects related to stimulation were gaze (mainly by bilateral complex oculomotor,
OM, dysfunction or by ipsilateral OM nerve paralysis) and vegetative troubles (nausea, moving
sensation), respectively 23.3 and 40.8% of tests, followed by contralateral paresthesia and
contralateral pyramidal-like rigidity, respectively 2.7 and 2.2% of tests.
2. Relationships between structures and neuron activities
We did not find any difference between the structures relative to types of recording traces,
monotonous (n = 446) or variable (n = 124) (χ 2 test, P = 0.2717; Ansa Lenticularis and Peri
Ventricular Region were removed due to their minute contribution, respectively n = 3 and n = 1).
Considering only STN, we found a trend (P = 0.08) towards monotonous type on intermediate
STN and variable type on medial STN. The distribution of patterns according to structures is
summarized in Fig. 3. The whole activity (patterns 1 + 2A + 2B + 2C + 3 + 4 + 5) became
relatively more intense from ZI to medial STN. We could not analyze (χ 2 tests not applicable)
the pattern distributions by structures (reference: whole pattern distribution) even if there was a
Page 13
Lemaire et al. 2007
12
shift toward an important neuron activity in medial STN and SN. The regroupings of patterns into
two activity categories, low (0, 1, 2A) and high (2B, 2C, 3, 4, 5), revealed the hyperactivity of
medial STN (χ 2 test, P < 0.0001) and of SN (χ 2 test, P 0.05). A selective analysis of
checkpoints with exclusively low or high activity patterns (checkpoints with complex patterns,
e.g. 1 + 2C, removed) also showed the predominance of high activity patterns in medial STN and
SN (n = 520; monotonous or variable; χ 2 test P = 0.0007).
3. Relationships between structures and stimulation related data
The values of stimulation related parameters according to structures are summarized in Table 2
and 3. The mean rigidity benefit threshold and the mean whole benefit threshold decreased from
thalamus to intermediate STN then slightly increased in medial STN, and conversely for the
mean improvement degree until H1. The mean stimulation margin, the mean adverse effect
threshold for gaze and neurovegetative troubles and the mean whole adverse effect threshold
decreased from H1 to medial STN. The analysis of structures according to stimulation parameters
revealed that H2 Forel’s field and the three subparts of STN were significantly different relative
to the structures located above (significant overall ANOVA, Tukey’s P < 0.05); the only
significant difference concerning a subpart of the STN, the intermediate STN, was relative to the
stimulation margin of the lateral STN and ZI. The analysis of the distribution of effects, by
stimulation parameters and by structures, showed a constant benefit on rigidity (and on tremor) in
the STN, irrespective of improvement degree, and there were more gaze and vegetative troubles
in STN than in neighbor structures located above (significant χ 2 tests). Crossing data of benefit
threshold and of stimulation margin we noted that the best region for a DBS stimulation was the
lateral STN showing a low benefit threshold (mean less than 1 mA) and a high stimulation
margin (mean above 1.5 mA) (Fig. 4).
Page 14
Lemaire et al. 2007
13
Figure 4 Relationships between the mean current values of the benefit threshold and of the stimulation margin, with
their respective standard deviations (bold segments), function of structures (full circles, see text for abbreviations).
The surface of circles is proportional to the percentage of benefit effects noticed during the intra operative
assessment (see Table 2)
4. Post operative findings
The duration of the whole procedure of bilateral implantation was about 7 h. The patients were all
implanted bilaterally during the same procedure as we obtained a clear intra operative clinical
efficiency with a mean maximal improvement degree of 2.95 ± 0.63 (n = 28; 2 tracts had an
incomplete scaling). There were no surgical complications. There were 28 electrodes (out of 30;
93.3%; from 98% to 73% with a confidence interval of 5%) placed on the central tract, which
was anatomically optimized during the planning. Two electrodes were placed on the anterior
tract.
Three months after surgery the mean percentage (±SD) of motor improvement, achieved by the
reference contacts selected intra operatively, was 61.7± 4% (P < 0.05). These results (n = 30)
Page 15
Lemaire et al. 2007
14
were measured under OFF-drug for at least 12 h. The mean voltage was 2.7±0.5 V (frequency =
130 Hz, pulse width = 60µs). Scores were based on a side by side assessment on subscales of
UPDRS for akinesia, rigidity and tremor.
Discussion
The population in our study was comparable to others in the literature. Although relatively
heterogeneous concerning age and disease, patients were consecutively enrolled without
prejudice and following our institutional schedules.
1. MRI subthalamic anatomy
The WAIR sequence gave highly contrasted images in particular between nuclei and bundles
allowing the anatomical mapping. This was facilitated by the stereotactic condition during the
image acquisition, which not only allowed a direct reference to the surgical stereotactic space but
also an improvement of the image quality. While the quality of signal can be increased by a long
duration sequence of high resolution MRI it may also be compromised by any patient movements
while in the head coil. The fixation of the frame to the head coil maintains the head stable during
the acquisition and minimizes movement artifacts. To limit the patient discomfort, under local
anaesthesia, without removal of antiparkinsonian drugs, we used a time adaptation of medication
according to symptom fluctuations. Along with theoptimization of MRI acquisition, we favored
reconstructed images along tracts, yielding an optimal analysis of relationships between tracts
and structures without classical stereotactic atlas based referencing. These reconstructions also
facilitated the reproducibility of trajectories relative to structures. The data provided by 4.7 T
MRI in-house anatomy software with an isotropic voxel of 253µm side and a highly contrasted
anatomy [24] helped with the determination of structures. The problem of missing slices and
inconsistency between the different planes, well known with current classical atlas, was solved
with the 3D anatomical reference allowing any reconstructions without loss of information
Page 16
Lemaire et al. 2007
15
2. Analysis of spatial relationships
We used a direct approach to study the spatial relationships on MRI, without reference to ACPC.
We considered that the indirect approach of relative positioning methods could introduce non
negligible geometrical errors known to exist with MRI [26]. Moreover, the MRI geometric
distortion on current clinical MRI (1.5 Tesla machines) continues to be reduced toward tenths of
millimetre [27,28], although in practice, for a given patient, one expects it below 1 mm. Our
results provide consistent relationships between MRI anatomy and clinical and
electrophysiological data. The accurate analysis of the checkpoint location (stimulation tests and
electrophysiological recordings) with reference to the planned exploration tracts was allowed by
crossing multiple approaches. We first used reconstructed images along tracts allowing a direct
3D anatomical analysis. Then we controlled the geometry of the planned tracts by two different
methods. First, intra operative X-rays checked that the tracts followed the planning (intra
operative versus pre operative check; stereotactic matching with reference to the Leksell’s
geometrical space). Second, the analysis of DBS electrode location confirmed that all the studied
tracts were really explored (intra operative versus post operative check; voxel to voxel matching).
Post operative T1-weighted MRI was also proposed to determine the contact/electrode location
[29,30].
3. Intra operative data collection
Electrophysiology was performed in two tracts for three reasons: (1) the 2-mm thickness of
frontal MRI slices could introduce a relative geometrical inaccuracy in the anteriorposterior
direction; (2) only two tracts could be planned through STN because of the STN shape and the
trajectory constraints; (3) one of the two guide tubes (used on tracts) was used as a security tool
maintaining the brain during the removal of the one on the selected tract and its replacement by a
DBS electrode.
The clinical assessments was restricted to standard motor and adverse effects because speech,
behavior and cognitive functions could potentially be modified by a bilateral implantation of
DBS electrodes [1–5] and are difficult to evaluate in routine surgical conditions. Even subjective,
the quality of improvement scale gave consistent results with the anatomy. Its utilization is
Page 17
Lemaire et al. 2007
16
facilitated by a relative scoring acceptable in intraoperative conditions. Even limited to the motor
assessment, it was difficult to distinguish between a dramatic improvement (degree of
improvement = 3) and a total disappearance of symptoms (degree of improvement = 4) due to the
severity of the symptom, the subjective clinician evaluation and because of sub thalamotomy
effect when reaching the optimal site. This explains why we did not always reach the highest
score of improvement (degree of improvement = 4; 100% of improvement).
The maximum stimulation threshold was fixed to 4 mA fitting clinical and ethical considerations,
beyond which patient comfort could be compromised and data rendered useless. This led in
return to an underestimation of the stimulation margin in absence of adverse effects. Thus the
stimulation margin is not exactly the difference between benefit and adverse effect thresholds, a
phenomenon more pronounced on a proximal position (e.g. thalamus) with fewer adverse effects
(Table 2, 3). We fixed a 1-mm step between two stimulation tests based on our experience, as
distinct effects are obtained with this distance, and on the hypothesis that a lower step would
exaggerate the overlap of adjacent zones of stimulation (with the 1.2 mm length of our
exploration electrode).
The recordings of extracellular neuron activity were planned with a fixed step of 0.5 mm in order
to limit the duration of exploration without significant loss of information, since the length of the
exploration electrode was 0.1 mm. However, this compromise could result in underestimating the
neuron activity. It is also questionable to seek a target with micrometric steps as most stereotactic
tools or surgical environments are not still designed to reach such accuracy.
4. Relationships between structures and clinical and electrophysiological data
The distribution of spontaneous neuron activity patterns shows higher activities in STN and ZI
whereas these are lower in FF, even if it was not statistically significant due to the variability of
cell activities (Fig. 3). These results could be expected considering the complex micro
organization of the subthalamic region [25,31,32], yet they fit with anatomy as FF is constituted
by more bundles than cells. This qualitative analysis of multi-unit recordings could be used to
detect electrophysiological boundaries, as already proposed with other methods [33,34], but also
highlights the difficulties to reveal sharp boundaries [35]. We found the highest and most variable
Page 18
Lemaire et al. 2007
17
spontaneous neuronal activity in the anterior ventromedial STN and also the dorsal part of SN
(Fig. 3). As the ventromedial STN is known to be limbic in primates [32] it could be potentially
solicited particularly during surgery in awake conditions. Movement-related neuronal responses
[2,36,37] could define boundaries between the functional territories of STN.
The progressive increase of stimulation benefit from thalamus to STN (Tables 2, 3) was already
reported with another method of location based on ACPC referencing [20]. The best DBS target
determined by both, a low benefit threshold and a high stimulation margin, seems to be identified
in the anterior dorsolateral STN (Fig. 4). This is in agreement with the sensorimotor territory of
STN [25,38] and with the DBS clinical improvement mainly supported by motor effects [1–6],
even if the posterior (caudal) part of the dorsolateral STN seems to be also a target [39].
Considering only the benefit threshold and the improvement degree (Table 1), intermediate STN
could be the best target, in agreement with the functional segmentation of STN [25,38]. However,
this has to be interpreted with caution due to the dramatic subthalamotomy effect from the
entrance of STN. The main adverse effects, gaze and neurovegetative troubles, increase
remarkably along tracts, linked with all the subthalamic structures. The gaze side effect could be
explained by the proximity of OM fibers. The third cranial nerve fibers are at a distance of about
10 mm in the coronal plan from caudal and medial border of STN [40] and are progressively
solicited. But the closest subthalamic OM connections are fibers going through H2 of which
some emerged from STN [41]. The presence of all types of adverse effects in the upper part of
tracts around ZI, irrespective of adverse effect threshold, could be explained by the numerous
functions supported by this nucleus, including motor, attention, arousal and visceral controls [31],
and the adjacent FF [25,32,42]. The rare motor effects (6 times/223 tests), only noticed in the
upper 10-mm of the exploration tract, could also be due to the proximity of the pyramidal tract as
a consequence of the double obliquity of trajectories. Thus DBS benefit could act through
different main structures, STN, ZI and FF. Even if the lateral STN offers the best ratio efficiency
versus adverse effects, each of these can acutely improve symptoms. The incertitude of current
diffusion, as well as of the exact anatomy and physiology for a given patient, limit the
interpretation of results. Postmortem studies have also shown the complexity of relation
structures/effects in the subthalamic region encompassing ZI, posteromedial or dorsolateral STN
[15,17].
Page 19
Lemaire et al. 2007
18
Conclusion
The analysis of multiple source data, relying on direct imageguided stereotactic surgery, suggests
that it seems possible to determine the fine anatomy in the subthalamic region, and this with 1.5
Tesla images and under stereotactic conditions. The best microsurgical target, a compromise
between benefit and adverse effects, can be confirmed in the region of the dorsolateral STN. The
direct anatomical mapping emphasizes the interest to analyze the respective contributions of intra
operative stimulation and neuronal activity data for a better understanding of the pathophysiology
and also for an optimization of the surgical technique. Efforts to determine intimate relationships
between structures, neuronal activity (spontaneous and provoked) and effects could also help the
understanding of DBS results, the optimization of electrical stimulation parameters, and
indirectly- the definition of the target. Nevertheless, information provided from a side-byside
subthalamic analysis of data obtained during acute intraoperative conditions with exploration
electrodes, must be transposed carefully to the chronic phase of stimulation, acting through
bilateral stimulation via DBS electrodes.
Acknowledgments
We thank Yves Lazorthes, Marion Simonetta Moreau and Isabelle Berry from Toulouse (France),
Luc Dupont Jasmin from San Francisco (USA), Antonio De Salles and Edward Mitchell from
Los Angeles (USA) for their constructive comments, as well as Brian Vasey and David Brett for
the language review.
Page 20
Lemaire et al. 2007
19
References
1. Erola T, Karinen P, Heikkinen E, Tuominen J, Haapaniemi T, Koivukangas J, Myllyla V (2005) Bilateral
subthalamic nucleus stimulation improves health-related quality of life in parkinsonian patients. Parkinsonism Relat
Disord 11(2): 89–94
2. Hamani C, Richter E, Schwalb JM, Lozano AM (2005) Bilateral subthalamic nucleus stimulation for Parkinson’s
disease: a systematic review of the clinical literature. Neurosurg 56(6): 1313–1321
3. Krack P, Batir A, Van Blercom N, Chabardes S, Fraix V, Ardouin C, Koudsie A, Limousin PD, Benazzouz A,
LeBas JF, Benabid AL, Pollak P (2003) Five-year follow-up of bilateral stimulation of the subthalamic nucleus in
advanced Parkinson’s disease. N Engl J Med 349(20): 1925–1934
4. Krause M, Fogel W, Mayer P, Kloss M, Tronnier V (2004) Chronic inhibition of the subthalamic nucleus in
Parkinson’s disease. J Neurol Sci 219(1–2): 119–124
5. Rodriguez-Oroz MC, Zamarbide I, Guridi J, Palmero MR, Obeso JA (2004) Efficacy of deep brain stimulation of
the subthalamic nucleus in parkinson’s disease 4 years after surgery: Double blind and open label evaluation. J
Neurol Neurosurg Psychiatry 75(10): 1382–1385
6. Walter BL, Vitek JL (2004) Surgical treatment for Parkinson’s disease. Lancet Neurol 3(12): 719–728 7.
Benazzouz A, Tai CH, Meissner W, Bioulac B, Bezard E, Gross C (2004) High-frequency stimulation of both zona
incerta and subthalamic nucleus induces a similar normalization of basal ganglia metabolic activity in experimental
parkinsonism. Faseb J 18(3): 528–530
8. Breit S, Schulz JB, Benabid AL (2004) Deep brain stimulation. Cell Tissue Res 318(1): 275–288
9. Filali M, Hutchison WD, Palter VN, Lozano AM, Dostrovsky JO (2004) Stimulation-induced inhibition of
neuronal firing in human subthalamic nucleus. Exp Brain Res 156(3): 274–281
10. Garcia L, Audin J, D’Alessandro G, Bioulac B, Hammond C (2003) Dual effect of high-frequency stimulation on
subthalamic neuron activity. J Neurosci 23(25): 8743–8751
11. Hashimoto T, Elder CM, Okun MS, Patrick SK, Vitek JL (2003) Stimulation of the subthalamic nucleus changes
the firing pattern of pallidal neurons. J Neurosci 23(5): 1916–1923
12. MacKinnon CD, Webb RM, Silberstein P, Tisch S, Asselman P, Limousin P, Rothwell JC (2005) Stimulation
through electrodes implanted near the subthalamic nucleus activates projections to motor areas of cerebral cortex in
patients with Parkinson’s disease. Eur J Neurosci 21(5): 1394–1402
13. Meissner W, Leblois A, Hansel D, Bioulac B, Gross CE, Benazzouz A, Boraud T (2005) Subthalamic high
frequency stimulation resets subthalamic firing and reduces abnormal oscillations. Brain 128(Pt 10): 2372–2382
Page 21
Lemaire et al. 2007
20
14. Welter ML, Houeto JL, Bonnet AM, Bejjani PB, Mesnage V, Dormont D, Navarro S, Cornu P, Agid Y, Pidoux
B (2004) Effects of high-frequency stimulation on subthalamic neuronal activity in Parkinsonian patients. Arch
Neurol 61(1): 89–96
15. Counelis GJ, Simuni T, Forman MS, Jaggi JL, Trojanowski JQ, Baltuch GH (2003) Bilateral subthalamic
nucleus deep brain stimulation for advanced pd: Correlation of intraoperative MER and postoperative MRI with
neuropathological findings. Mov Disord 18(9): 1062–1065
16. Hamel W, Fietzek U, Morsnowski A, Schrader B, Herzog J, Weinert D, Pfister G, Muller D, Volkmann J,
Deuschl G, Mehdorn HM (2003) Deep brain stimulation of the subthalamic nucleus in Parkinson’s disease:
Evaluation of active electrode contacts. J Neurol Neurosurg Psychiatry 74(8): 1036–1046
17. Henderson JM, Pell M, O’Sullivan DJ, McCusker EA, Fung VS, Hedges P, Halliday GM (2002) Postmortem
analysis of bilateral subthalamic electrode implants in Parkinson’s disease. Mov Disord 17(1): 133–137
18. Herzog J, Fietzek U, Hamel W, Morsnowski A, Steigerwald F, Schrader B, Weinert D, Pfister G, Muller D,
Mehdorn HM, Deuschl G, Volkmann J (2004) Most effective stimulation site in subthalamic deep brain stimulation
for Parkinson’s disease. Mov Disord 19(9): 1050–1054
19. Saint-Cyr JA, Hoque T, Pereira LC, Dostrovsky JO, Hutchison WD, Mikulis DJ, Abosch A, Sime E, Lang AE,
Lozano AM (2002) Localization of clinically effective stimulating electrodes in the human subthalamic nucleus on
Magnetic Resonance Imaging. J Neurosurg 97(5): 1152–1166
20. Zincone A, Landi A, Piolti R, Appollonio I, Mariani CB, Pezzoli G, Gaini SM, Frattola L (2001) Physiologic
study of the subthalamic volume. Neurol Sci 22(1): 111–112
21. Derost P, Ouchchane L, Morand D , M Ulla, PM Lbrca, Barzet M, Debilly B, Lemaire JJ, Durif F, (2007) Is
DBS-STN appropriate to manage severe Parkinson’s disease in an elderly population? Neurology 68:1345–1355
22. Ulla M, Thobois S, Lemaire JJ, Schmitt A, Derost P, Broussolle E, Llorca PM, Durif F (2006) Manic behaviour
induced by deepbrain stimulation in Parkinson’s disease: Evidence of substantia nigra implication?. J Neurol
Neurosurg Psychiatry 77(12): 1363–1366
23. Magnotta VA, Gold S, Andreasen NC, Ehrhardt JC, Yuh WT (2000) Visualization of subthalamic nuclei with
cortex attenuated inversion recovery MR imaging. Neuroimage 11(4): 341– 346
24. Lemaire JJ, Caire F, Bony JM, Kemeny JL, Villéger A, Chazal J (2004) Contribution of 4.7 Tesla MRI in the
analysis of the MRI anatomy of the human subthalamic area. Acta Neurochir (Wien) 146(8): 906–907
25. Parent A (1996) Basal ganglia: In: Parent A, Carpenter’s human neuroanatomy. Williams and Wilkins,
Baltimore, pp 838–843
Page 22
Lemaire et al. 2007
21
26. Richter EO, Hoque T, Halliday W, Lozano AM, Saint-Cyr JA (2004) Determining the position and size of the
subthalamic nucleus based on magnetic resonance imaging results in patients with advanced Parkinson’s disease. J
Neurosurg 100(3): 541–546
27. Wang D, Strugnell W, Cowin G, Doddrell DM, Slaughter R (2004) Geometric distortion in clinical MRI systems
part ii: Correction using a 3d phantom. Magn Reson Imaging 22(9): 1223– 1232
28. Wang D, Strugnell W, Cowin G, Doddrell DM, Slaughter R (2004) Geometric distortion in clinical MRI systems
part i: Evaluation using a 3d phantom. Magn Reson Imaging 22(9): 1211– 1221
29. Ferroli P, Franzini A, Marras C, Maccagnano E, D’Incerti L, Broggi G (2004) A simple method to assess
accuracy of deep brain stimulation electrode placement: pre-operative stereotactic CT + postoperative MR image
fusion. Stereotact Funct Neurosurg 82(1): 14–19
30. Pollo C, Villemure JG, Vingerhoets F, Ghika J, Maeder P, Meuli R (2004) Magnetic resonance artifact induced
by the electrode Activa 3389: An in vitro and in vivo study. Acta Neurochir (Wien) 146(2): 161–164
31. Mitrofanis J (2005) Some certainty for the “Zone of uncertainty”? Exploring the function of the zona incerta.
Neuroscience 130(1): 1–15
32. Parent M, Parent A (2004) The pallidofugal motor fiber system in primates. Parkinsonism Relat Disord 10(4):
203–211
33. Hamani C, Richter EO, Andrade-Souza Y, Hutchison W, Saint-Cyr JA, Lozano AM (2005) Correspondence of
microelectrode mapping with magnetic resonance imaging for subthalamic nucleus procedures. Surg Neurol 63(3):
249–253
34. Pralong E, Villemure JG, Bloch J, Pollo C, Daniels RT, Ghika J, Vingerhoets F, Tetreault MH, Debatisse D
(2004) Quality index for the quantification of the information recorded along standard microelectrode tracks to the
subthalamic nucleus in parkinsonian patients. Neurophysiol Clin 34(5): 209–215
35. Baker KB, Boulis NM, Rezai AL, Montgomery EB Jr (2004) Target selection using microeletrode recording. In:
Israel Z, Burchiel KJ (eds) Microelectrode recording in movement disorder surgery. Thieme, New York, pp 138–151
36. Abosch A, Hutchison WD, Saint-Cyr JA, Dostrovsky JO, Lozano AM (2002) Movement-related neurons of the
subthalamic nucleus in patients with Parkinson’s disease. J Neurosurg 97(5): 1167–1172
37. Theodosopoulos PV, Marks WJ Jr., Christine C, Starr PA (2003) Locations of movement-related cells in the
human subthalamic nucleus in Parkinson’s disease. Mov Disord 18(7): 791– 798
38. Rodriguez-Oroz MC, Rodriguez M, Guridi J, Mewes K, Chockkman V, Vitek J, DeLong MR, Obeso JA (2001)
The subthalamic nucleus in Parkinson’s disease: Somatotopic organization and physiological characteristics. Brain
124(Pt 9): 1777–1790
Page 23
Lemaire et al. 2007
22
39. Patel NK, Plaha P, O’Sullivan K, McCarter R, Heywood P, Gill SS (2003) MRI directed bilateral stimulation of
the subthalamic nucleus in patients with Parkinson’s disease. J Neurol Neurosurg Psychiatry 74(12): 1631–1637
40. Schaltenbrand G, Bailey P (1959) Introduction to stereotaxis with an atlas of the human brain. Thieme Verlag,
New York
41. Talairach J (1957) Atlas d’anatomie stéréotaxique. Repérage radiologique indirect des noyaux gris centraux des
régions mésencéphalo-sous-optiques et hypothalamiques de l’homme. Masson & Cie, Paris
42. Abrahamson EE, Moore RY (2001) The posterior hypothalamic area: Chemoarchitecture and afferent
connections. Brain Res 889(1–2): 1–22