Page 1
Multi-Level Risk-Controlled Sector Optimization for Opportunistic Global Fixed-Income Portfolios
Ron D'Vari, Juan C. Sosa, KishoreYalamanchilli
State Street Research & Management
CIFEr, New York
March 27th, 2000
Page 2
State Street Research, Multilevel Risk-Controlled Optimization
2
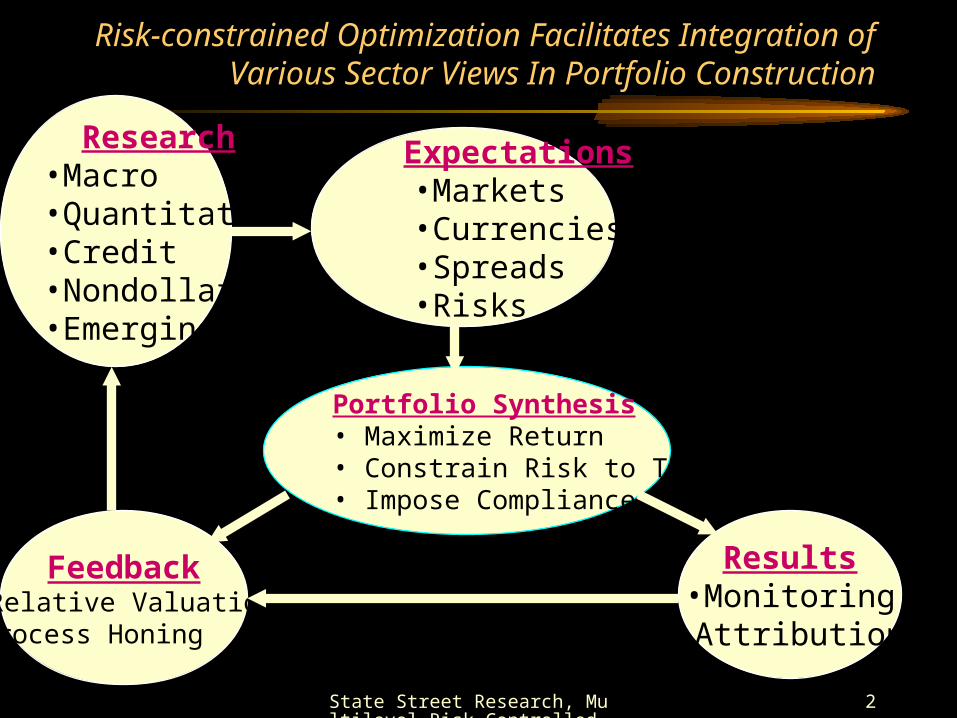
Risk-constrained Optimization Facilitates Integration of Various Sector Views In Portfolio Construction
Feedback•Relative Valuation•Process Honing
Results•Monitoring•Attribution
Expectations•Markets•Currencies•Spreads•Risks
Portfolio Synthesis • Maximize Return• Constrain Risk to Tolerance• Impose Compliance
Research•Macro •Quantitative•Credit•Nondollar•Emerging
Page 3
State Street Research, Multilevel Risk-Controlled Optimization
3
Agenda
• Problem Statement
• Why Multi-level Optimization?
• Proposed Multilevel Risk-Constrained Optimization Algorithm
– Sub-level: Nondollar Sectors vs. Domestic Index
– Top Level: Domestic Sectors + Customized Nondollar Portfolio
• Brief Review of Our Past Research
• Sector Structure
• Risk Model for G-13 Nondollar Government Bond Markets
• Sample Optimization Results
• Conclusion
Page 4
State Street Research, Multilevel Risk-Controlled Optimization
4
Risk-Constrained Optimization Problem Definition
Decision Variable Characteristics
Static Dynamic(Modeled as Normal, Garch or
Garch-PJ)
Sector
Weight CurrencyForward
Duration,Convexity
BaseYield
OASor
Spread
Spot Rate
Domestic Inv. GradeSubsector ith
(By Sector, Credit, andDuration)
DWi-- DEDuri
DEConi
DEYieldiDEspreadi --
Domestic High-YieldSubsector ith
(By Sector, Credit, andDuration)
HWi-- HEDuri
HEConi
HEYieldiHEspreadi --
Nondollar GovernmentSubsector ith
(By Country andMaturity)
NWi
CURWiNEDuriNEConi
NEYieldiNEspreadi
CURSi
Dollar-denominatedEmerging Subsector ith
(By Country andMaturity)
EWi
-- EEDuriEEConi
EEYieldiEEspreadi --
Page 5
State Street Research, Multilevel Risk-Controlled Optimization
5
Problem Definition (Cont’d)
• Maximize Relative or Absolute Return Under a Single View or Probably Weighted View– Requires explicit views on all sectors
– Coordinated effort by all research teams
– Could blend short (tactical) and long term views (strategic)
• Subject To Constraints– Relative or Absolute Conditional VaR at CL= X < CVaR Limit
– Under performance under defined scenarios < Scenario Return Limit
– Traditional Relative or Absolute Risk Measures• Duration
• Curve Risk Measures
• Duration Contributions from Various Sectors
Page 6
State Street Research, Multilevel Risk-Controlled Optimization
6
Why Multi-Level Optimization
• Avoid ill-conditioned problem of joint risk characterization – Simultaneous optimization of a large number of subsectors
• Requires a large length of time histories for joint risk characterization
• Can lead to numerical instabilities and noise
• Dependency of returns tend to be stable when considering – Cells within each sector, and
– Different sectors as aggregate
• Dependency of returns tend to be noisy when considering – Cells that fall in diverse sectors
• e.g. 5-year AAA CMBS spread vs. 10-year JGB yield)
Page 7
State Street Research, Multilevel Risk-Controlled Optimization
7
Proposed Multilevel Optimization Algorithm
• Sub-level:
– Optimize Relative Return of Nondollar Sectors to Domestic Index (Decision Variables: NWi, Cwi )
– Subject to:• Relative CVaR Limit Allotted to Nondollar
– Example (3-Month, 97.5% Confidence Level):
• Total Relative CVaR =100bp
• Allotted Nondollar CVaR at Total Portfolio Level = 30bp
• Allotted Nondollar Relative CVaR at Sector Level = 300bp
(All numbers measured w.r.t. domestic index)
• Hedge limits (i.e., 0.95 <[CWi/ NWi ]< 1.05)
• Scenario constraints
• Other constraints (related to guideline or research view)– Country weight or duration contribution
Page 8
State Street Research, Multilevel Risk-Controlled Optimization
8
Proposed Multilevel Optimization Algorithm (Cont’d)
• Top-level:
– Optimize Relative Return vs. Overall Index with Decision Variables as
• Domestic Sector Weights (DWi)
• Weight of Customized Nondollar Portfolio (Nwcustomized index )
– Specific opportunistic countries can be segregated and optimized at the top level (e.g. Greece)
– Subject to:• Relative CVaR Limit vs.. Overall benchmark
• Scenario constraints
• Traditional constraints
Page 9
State Street Research, Multilevel Risk-Controlled Optimization
9
Brief Review of Our Past Research
• Risk Models Used
• Rolling GARCH-PJ
• Sample Domestic Results
Page 10
State Street Research, Multilevel Risk-Controlled Optimization
10
Methodology Requirements for Risk Models
• Accuracy– Nonstationary – Non-normal
• Robustness
• Feasible automation and maintenance
Page 11
State Street Research, Multilevel Risk-Controlled Optimization
11
Risk Models Used
• Rolling Variance-Covariance– G-13 Government Bond Yields
– Investment Grade Corporate and ABS OASs
• GARCH and Garch-t– Mortgage passthroughs
– G-13 currencies • Garch-PJ
– Used for high yield and emerging markets • Univariate GARCH with Persistent Jumps
• Rolling white noise correlation matrix
• Exogenized jump frequencies
Page 12
State Street Research, Multilevel Risk-Controlled Optimization
12
Rolling GARCH-PJ (univariate)
• A variation of GARCH(1,1) that features Bernoulli-style jumps
st = a0 + et, where
et = sqrt(ht)ut + jt, with ut ~ N(0,1) i.i.d.
ht = g0 + g1 e2t-1 + g2ht-1
jt ~ N(j,j2) with probability p
0 with probability 1-p
• Jump occurrences in this model will induce a volatility spike in subsequent days
• Bernoulli, rather than Poisson jumps, simplify and speed up the parameter estimation procedure
• VaR estimates are also produced via simulation
• Jump frequencies are also allowed to depend on exogenous or past data
Page 13
State Street Research, Multilevel Risk-Controlled Optimization
130 25 50 75 100 125 150 175 200 225 250
-3
-2
-1
0
1
2
3 Brazil: Daily Series of 1-day spread changes, Jan/01/98-Jan/22/99
and 90%&99% Var-Covar VaR estimates
Page 14
State Street Research, Multilevel Risk-Controlled Optimization
140 25 50 75 100 125 150 175 200 225 250
-3
-2
-1
0
1
2
3
4 Brazil: Daily Series of 1-day spread changes, Jan/01/98-Jan/22/99and 90%&99% GARCH(1,1) VaR estimates
Page 15
State Street Research, Multilevel Risk-Controlled Optimization
150 25 50 75 100 125 150 175 200 225 250
-3
-2
-1
0
1
2
3
4
Brazil: Daily Series of 1-day spread changes, Jan/01/98-Jan/22/99and 90%&99% GARCH-PJ(1,1) VaR estimates
Page 16
State Street Research, Multilevel Risk-Controlled Optimization
160 25 50 75 100 125 150 175 200 225 250
-3
-2
-1
0
1
2
3
4
Brazil: Daily Series of 1-day spread changes, Jan/01/98-Jan/22/99and 90%&99% GARCH-PJ(1,1) w/ Exogenized Jumps VaR estimates
Page 17
State Street Research, Multilevel Risk-Controlled Optimization
17
Model Choice
The skewness and kurtosis of the standardized
innovations support GARCH-PJ
Brazil 1992-1999: Skewness Kurtosis
Rolling Var-Covar 5.94 99.67
GARCH 2.96 47.20
GARCH-PJ * 0.16 3.50
GARCH-PJ Exo* 0.12 3.42*jump days excluded
Page 18
State Street Research, Multilevel Risk-Controlled Optimization
18
Multivariate ARCH Issues
• Multivariate ARCH models suffer from estimation problems, deriving from the inclusion of correlation parameters
• Our ad-hoc approach: a 3-month sample correlation matrix estimated from (non-jump) standardized innovations
Page 19
State Street Research, Multilevel Risk-Controlled Optimization
19
Sample Domestic Results (Cont’d)Optimized Portfolio Weights Optimized Relative Weights
FF 2YR 5YR 10YR 30YR TOT FF 2YR 5YR 10YR 30YR TOT
ONTR Treasury 0.74 0.40 0.00 0.04 0.14 1.32 0.74 0.40 0.00 0.04 0.14 1.32
0-3 3-5 5-7 7-10 10-15 TOT 0-3 3-5 5-7 7-10 10-15 TOT
OFFTR Treasury 13.91 6.27 3.40 1.38 4.99 29.94 0.37 -0.19 -0.43 -1.66 -2.64 -4.56
Futures/Forward 0.00 0.00 0.00 0.00 0.00 0.00 0.00 0.00 0.00 0.00 0.00 0.00
Agencies 4.00 2.18 1.09 0.28 0.41 7.96 0.46 -0.07 -0.52 -0.22 -0.46 -0.81
Total Govt 18.65 8.85 4.49 1.70 5.54 39.22 1.57 0.14 -0.95 -1.84 -2.96 -4.05
AAA/AA 2.24 1.47 0.63 0.30 0.31 4.94 0.42 -0.06 -0.46 -0.26 -0.22 -0.59
A 2.83 2.52 2.13 0.54 0.64 8.66 0.46 0.04 -0.32 -0.68 -0.83 -1.33
BBB 1.77 1.77 1.26 0.38 0.44 5.63 0.53 0.12 -0.25 -0.51 -0.47 -0.57
Total Corp 6.84 5.76 4.01 1.22 1.40 19.23 1.41 0.10 -1.04 -1.45 -1.52 -2.49
DIS CC PREM TOT DIS CC PREM TOT
GNMA 30 Year 5.57 1.27 1.35 8.19 0.31 0.39 0.59 1.29
Conventional 30 Year 19.68 1.56 1.15 22.40 0.41 0.43 0.41 1.26
GNMA 15 Year 0.50 0.24 0.54 1.27 0.17 0.19 0.50 0.85
Conventional 15 Year 6.11 0.68 0.71 7.50 0.14 0.21 0.60 0.95
Total Mortgage 31.85 3.75 3.76 39.36 1.02 1.22 2.11 4.35
2YR 5YR 10YR TOT 2YR 5YR 10YR TOT
ABS Credit Card 0.59 0.09 0.04 0.72 0.59 0.09 0.04 0.72
ABS Man. Hous. 0.00 0.00 0.00 0.00 0.00 0.00 0.00 0.00
ABS Auto 0.00 0.00 0.00 0.00
AAA CMBS -- 0.07 0.03 0.11 -- 0.07 0.03 0.11
Total ABS 0.59 0.17 0.07 0.00 0.00 0.83 0.59 0.17 0.07 0.00 0.00 0.83
BB B TOT BB B TOT
HIGH YIELD 0.53 0.88 1.41 0.53 0.88 1.41
GRP1 GRP2 TOT GRP1 GRP2 TOT
Bond Fwd Bond Fwd Bond Bond Fwd Bond Fwd Bond
NONDOLLAR 0.00 0.00 0.00 0.00 0.00 0.00 0.00 0.00 0.00 0.00
EMBI 0.00 0.0 0.00 0.0
Total 100 0
Page 20
State Street Research, Multilevel Risk-Controlled Optimization
20
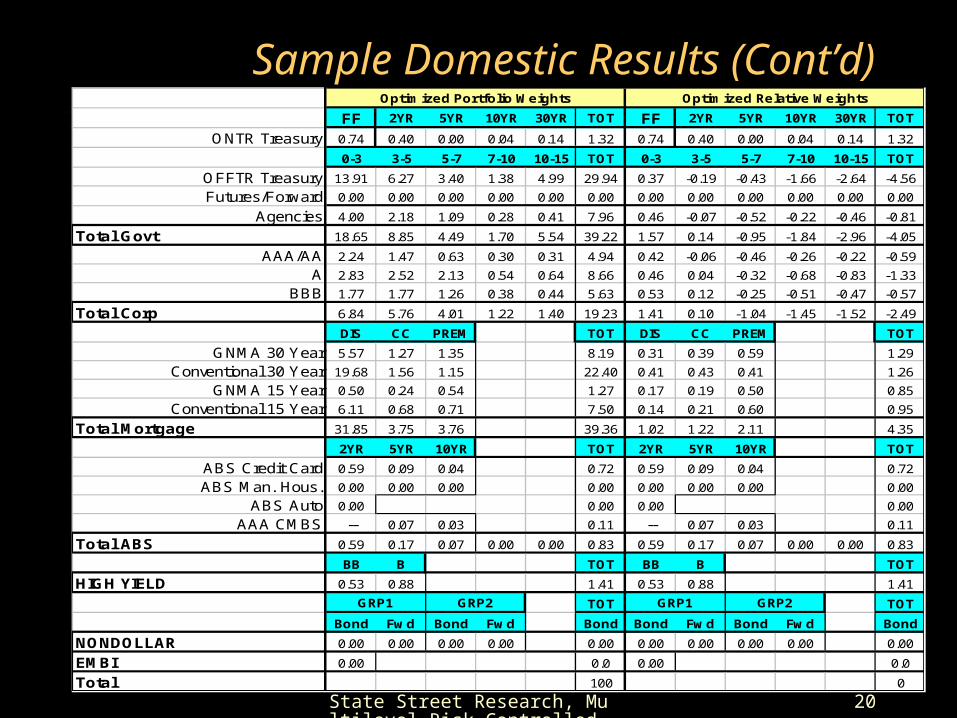
Sample Domestic Results (Cont’d)Optimized Portfolio Weights Optimized Relative Weights
FF 2YR 5YR 10YR 30YR TOT FF 2YR 5YR 10YR 30YR TOT
ONTR Treasury 0.74 0.40 0.00 0.04 0.14 1.32 0.74 0.40 0.00 0.04 0.14 1.32
0-3 3-5 5-7 7-10 10-15 TOT 0-3 3-5 5-7 7-10 10-15 TOT
OFFTR Treasury 13.91 6.27 3.40 1.38 4.99 29.94 0.37 -0.19 -0.43 -1.66 -2.64 -4.56
Futures/Forward 0.00 0.00 0.00 0.00 0.00 0.00 0.00 0.00 0.00 0.00 0.00 0.00
Agencies 4.00 2.18 1.09 0.28 0.41 7.96 0.46 -0.07 -0.52 -0.22 -0.46 -0.81
Total Govt 18.65 8.85 4.49 1.70 5.54 39.22 1.57 0.14 -0.95 -1.84 -2.96 -4.05
AAA/AA 2.24 1.47 0.63 0.30 0.31 4.94 0.42 -0.06 -0.46 -0.26 -0.22 -0.59
A 2.83 2.52 2.13 0.54 0.64 8.66 0.46 0.04 -0.32 -0.68 -0.83 -1.33
BBB 1.77 1.77 1.26 0.38 0.44 5.63 0.53 0.12 -0.25 -0.51 -0.47 -0.57
Total Corp 6.84 5.76 4.01 1.22 1.40 19.23 1.41 0.10 -1.04 -1.45 -1.52 -2.49
DIS CC PREM TOT DIS CC PREM TOT
GNMA 30 Year 5.57 1.27 1.35 8.19 0.31 0.39 0.59 1.29
Conventional 30 Year 19.68 1.56 1.15 22.40 0.41 0.43 0.41 1.26
GNMA 15 Year 0.50 0.24 0.54 1.27 0.17 0.19 0.50 0.85
Conventional 15 Year 6.11 0.68 0.71 7.50 0.14 0.21 0.60 0.95
Total Mortgage 31.85 3.75 3.76 39.36 1.02 1.22 2.11 4.35
2YR 5YR 10YR TOT 2YR 5YR 10YR TOT
ABS Credit Card 0.59 0.09 0.04 0.72 0.59 0.09 0.04 0.72
ABS Man. Hous. 0.00 0.00 0.00 0.00 0.00 0.00 0.00 0.00
ABS Auto 0.00 0.00 0.00 0.00
AAA CMBS -- 0.07 0.03 0.11 -- 0.07 0.03 0.11
Total ABS 0.59 0.17 0.07 0.00 0.00 0.83 0.59 0.17 0.07 0.00 0.00 0.83
BB B TOT BB B TOT
HIGH YIELD 0.53 0.88 1.41 0.53 0.88 1.41
GRP1 GRP2 TOT GRP1 GRP2 TOT
Bond Fwd Bond Fwd Bond Bond Fwd Bond Fwd Bond
NONDOLLAR 0.00 0.00 0.00 0.00 0.00 0.00 0.00 0.00 0.00 0.00
EMBI 0.00 0.0 0.00 0.0
Total 100 0
Page 21
State Street Research, Multilevel Risk-Controlled Optimization
21
Sample Domestic Results
Dur 3-Month Total Return
Yrs Sc1 Sc2 Sc3 Sc4 Sc5 Sc6 Sc7 Comp
Benchmark (yrs or %) 4.97 1.80 -0.22 2.75 3.89 1.15 0.78 11.42 -0.22
Portfolio (yrs or %) 4.32 1.82 0.13 2.63 3.76 0.95 1.28 10.16 0.13
Relative (yrs or bp) -0.66 2 35 -12 -13 -20 50 -126 35Relative Constraint (yrs or bp) -- -- -- -- -- -- -- -- --
13WK 95% CVaR 13WK 95% Rel. CVaR Equiv. Annual T.E.
(%) bp bpBenchmark (%) -2.34% -- --
Portfolio (%) -1.83% -70 bp 97 bpRelative (bp) 51 bp -- --
Relative Constraint (bp) -- -70 bp