35
Multimodal Study on Freight Transportation in Québec Transportation Border Working Group Spring 2014 Meeting Buffalo, NY April 8, 2014 Claude Sirois
| Date post: | 28-Dec-2015 |
| Category: |
Documents |
| Upload: | cecil-mason |
| View: | 215 times |
| Download: | 0 times |
Multimodal Study onFreight Transportation in Québec
Transportation Border Working GroupSpring 2014 Meeting
Buffalo, NYApril 8, 2014
Claude Sirois
2
Presentation Overview
• Objective, structure and scope of the study
• Overview of the database
• Profile of freight transportation in Québec
• Assessment of intermodality potential, methodology and observations
• Conclusion

3
Objective of the study
• Support Sustainable Mobility Regional Plans
• Characterize current and future (2026) supply and demand for freight transportation for all modes
• Develop and apply a methodology to assess Intermodality Potential
• Three scales of analysis– Québec– Major transportation corridors (11) – Regions (16)
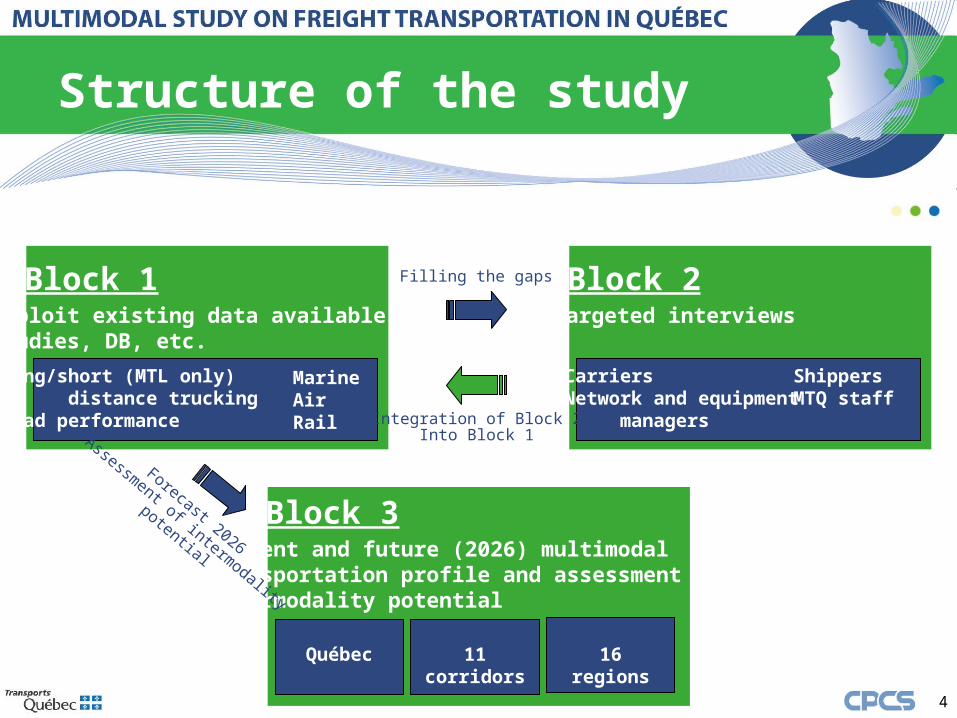
Structure of the study
4
Block 1Exploit existing data available instudies, DB, etc.
Block 2Filling the gaps
Block 3
Long/short (MTL only) distance truckingRoad performance
MarineAirRail Integration of Block 2
Into Block 1
Targeted interviews
CarriersNetwork and equipment managers
ShippersMTQ staff
Current and future (2026) multimodaltransportation profile and assessment ofIntermodality potential
Québec 11 corridors 16 regions
Forecast 2026
Assessment of intermodality
potential
5
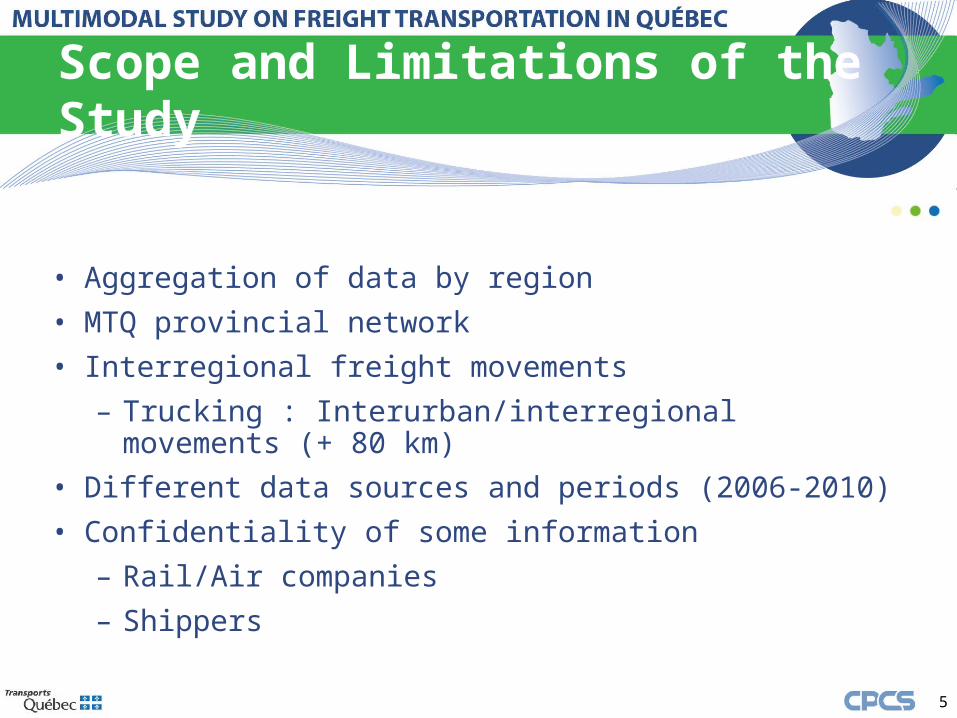
Scope and Limitations of the Study
• Aggregation of data by region• MTQ provincial network• Interregional freight movements
– Trucking : Interurban/interregional movements (+ 80 km)• Different data sources and periods (2006-2010)• Confidentiality of some information
– Rail/Air companies– Shippers
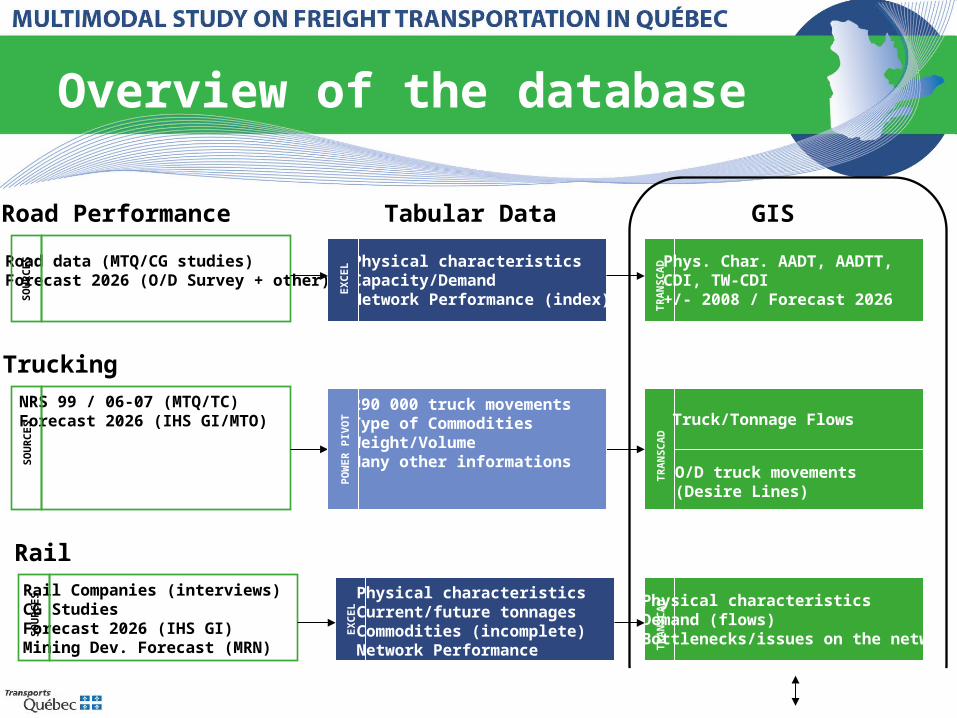
Overview of the database
Physical characteristicsCapacity/DemandNetwork Performance (index)
Road data (MTQ/CG studies)Forecast 2026 (O/D Survey + other)
SO
UR
CE
S
EX
CE
L Phys. Char. AADT, AADTT,CDI, TW-CDI+/- 2008 / Forecast 2026
NRS 99 / 06-07 (MTQ/TC)Forecast 2026 (IHS GI/MTO)
SO
UR
CE
S
TR
AN
SC
AD Truck/Tonnage Flows
Road Performance
Trucking
290 000 truck movementsType of CommoditiesWeight/VolumeMany other informations
PO
WE
R P
IVO
T
O/D truck movements(Desire Lines)
TR
AN
SC
AD
Rail Companies (interviews)CG StudiesForecast 2026 (IHS GI)Mining Dev. Forecast (MRN)
SO
UR
CE
S
TR
AN
SC
AD Physical characteristics
Demand (flows)Bottlenecks/issues on the network
Rail
Physical characteristicsCurrent/future tonnagesCommodities (incomplete)Network Performance
EX
CE
L
GISTabular Data
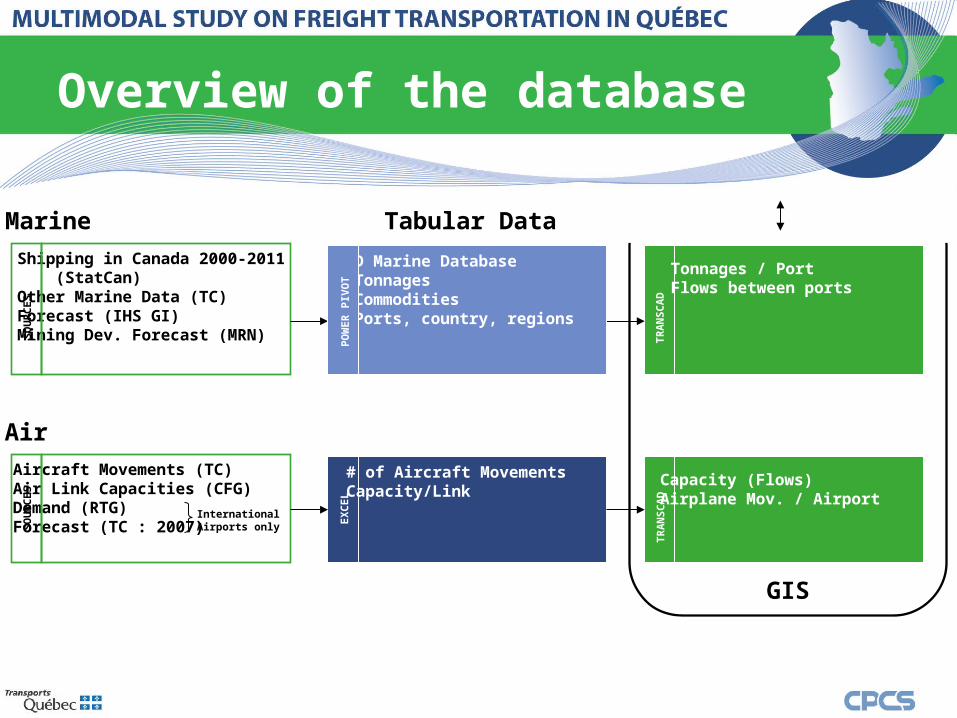
Overview of the database
Shipping in Canada 2000-2011 (StatCan)Other Marine Data (TC)Forecast (IHS GI)Mining Dev. Forecast (MRN)S
OU
RC
ES
TR
AN
SC
AD
Tonnages / PortFlows between ports
Marine
O/D Marine Database- Tonnages- Commodities- Ports, country, regions
PO
WE
R P
IVO
T
Aircraft Movements (TC)Air Link Capacities (CFG)Demand (RTG)Forecast (TC : 2007)S
OU
RC
ES
TR
AN
SC
AD Capacity (Flows)
Airplane Mov. / Airport
Air
# of Aircraft MovementsCapacity/Link
EX
CE
L
InternationalAirports only
GIS
Tabular Data

Profile of Québec – Geographic Scope
8
• 11 800 km of roads • 7 border crossings
– 4 in QC, 3 in ON • 6 200 km of railways • 6 intermodal terminals • 21 railways• 31 ports• 42 airports

9
Profile of Québec – Tonnages
*Road mode doesn’t include truck movements under 80 km
Tonnages with an origin ora destination in Québec
Ton-kilometre onQuébec’s road and rail networks
Air - 274 000 tonnes (0,1%)
Marine
Rail
Road
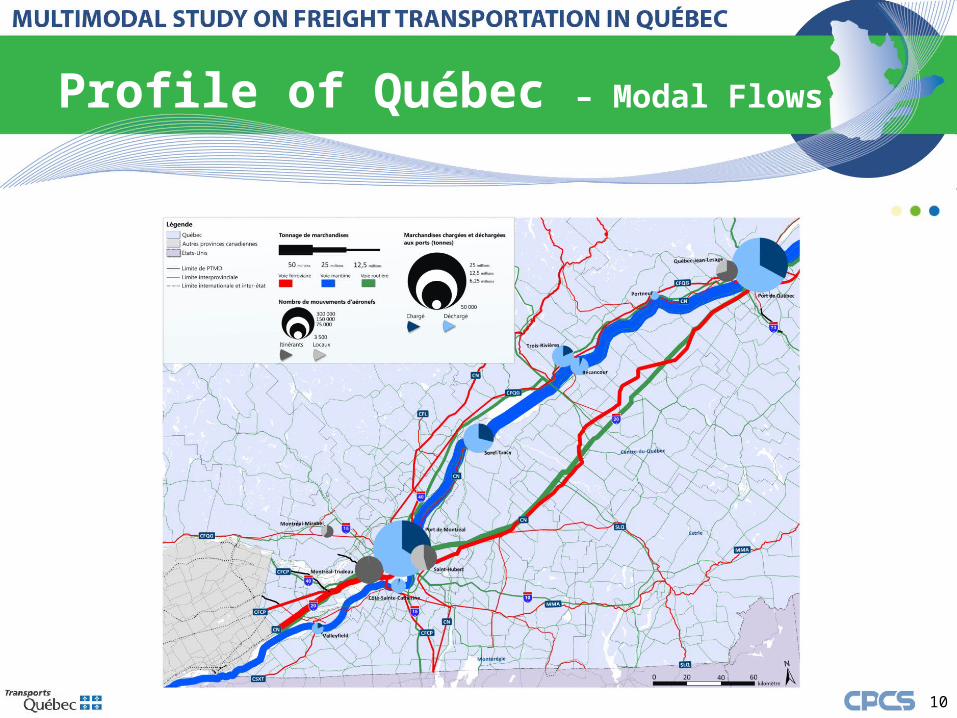
10
Profile of Québec – Modal Flows
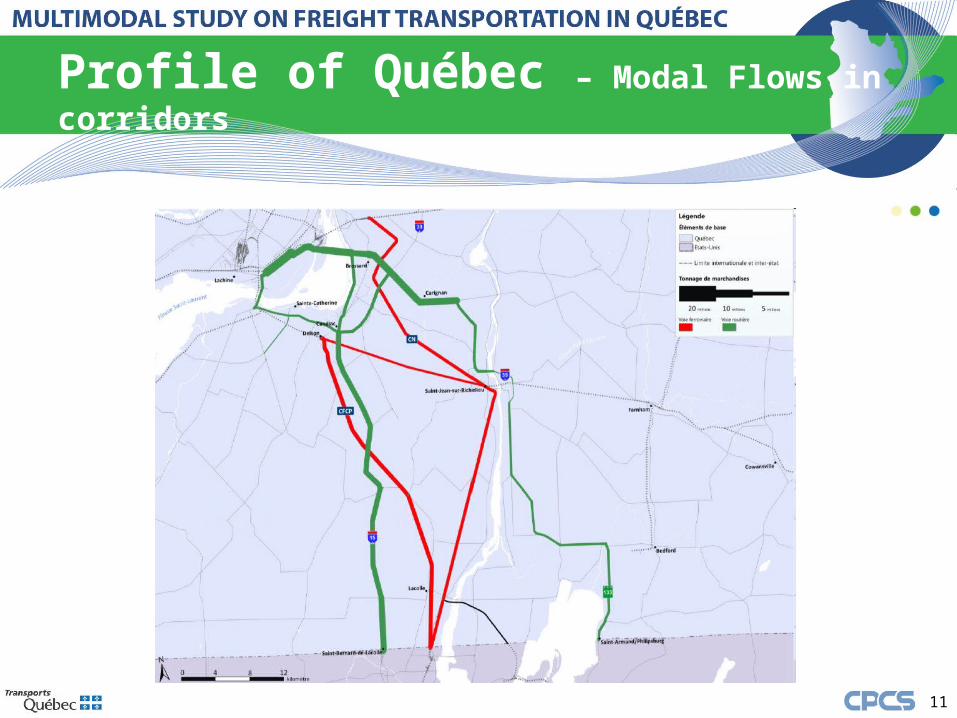
11
Profile of Québec – Modal Flows in corridors
12
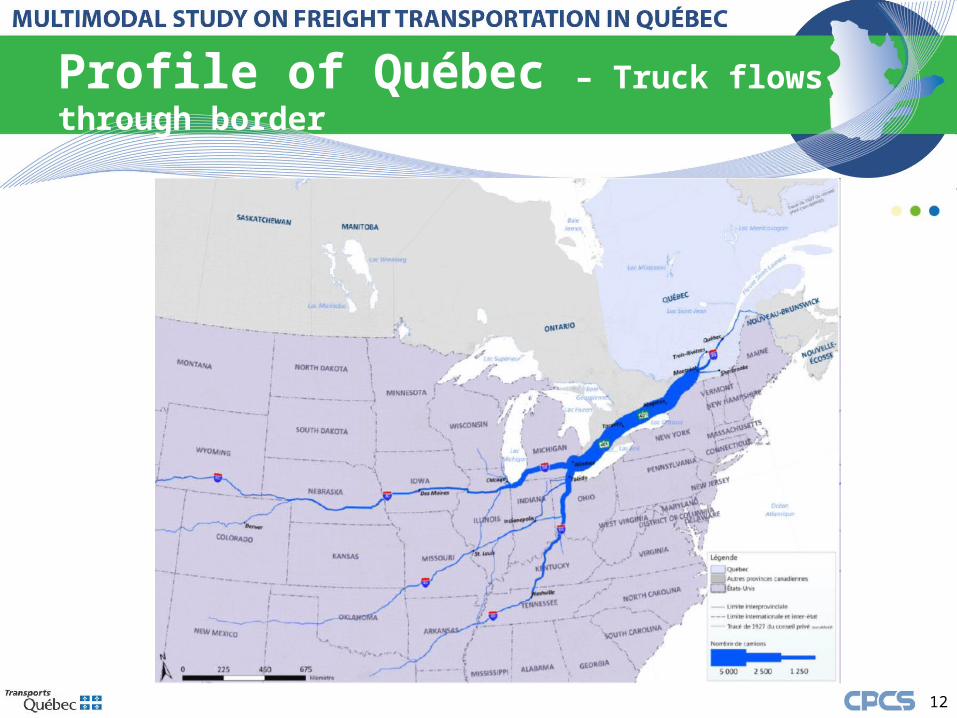
Profile of Québec – Truck flows through border

13
Profile of Québec – Desire Lines
Truck movements during a week in 2006-2007 between Québec and New York
14
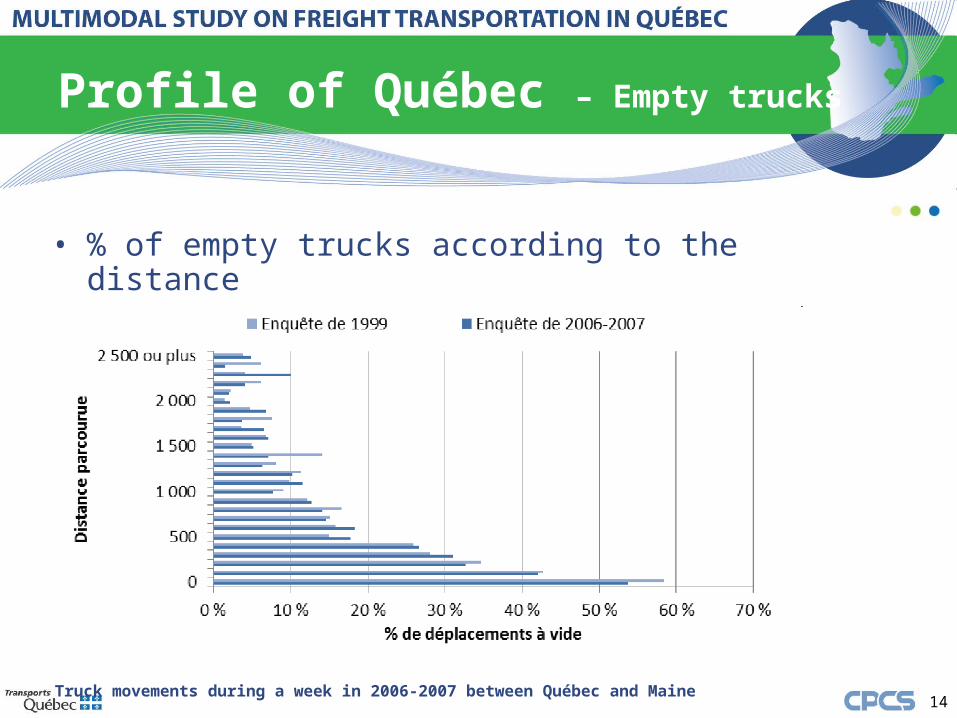
Profile of Québec – Empty trucks
Truck movements during a week in 2006-2007 between Québec and Maine
• % of empty trucks according to the distance

15
Profile of Québec – Air links capacity
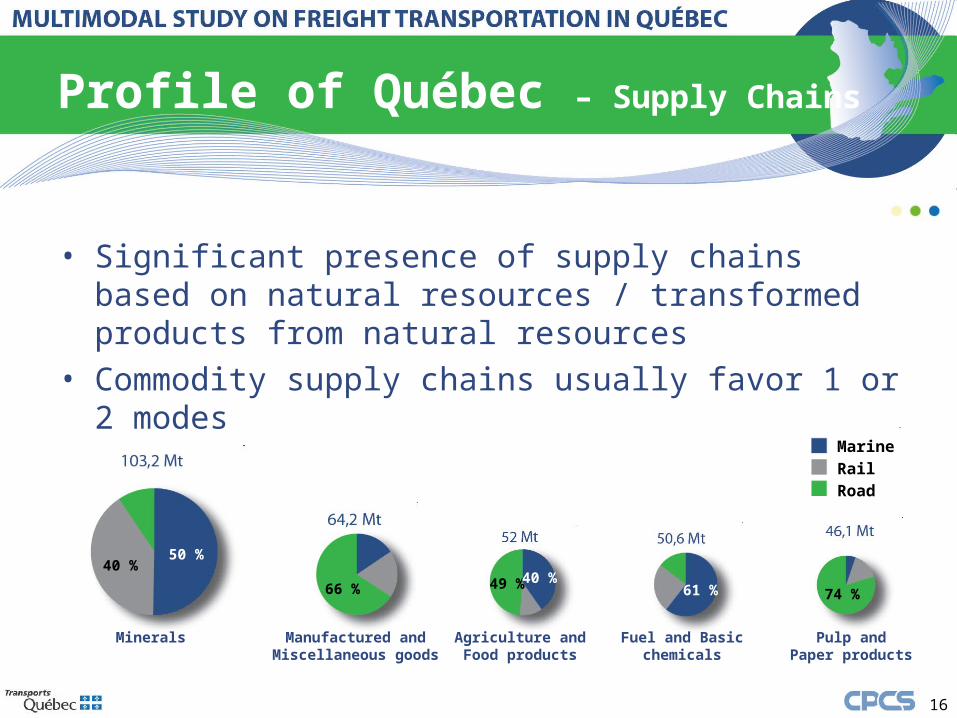
Profile of Québec – Supply Chains
16
• Significant presence of supply chains based on natural resources / transformed products from natural resources
• Commodity supply chains usually favor 1 or 2 modes
Minerals Manufactured andMiscellaneous goods
Agriculture andFood products
Fuel and Basicchemicals
Pulp andPaper products
50 %
66 % 49 % 61 % 74 %
40 %40 %
MarineRailRoad

Profile of Québec – Modal shares
17
• Modal shares at the Québec / U.S. States Border• Québec / NY+VT+ME globally : Rail 47 % / Road 53 %
Québec–
New York
43 %57 %
RailRoad
20 %
80 %56 %44 %
Québec–
VermontQuébec
–Maine
18
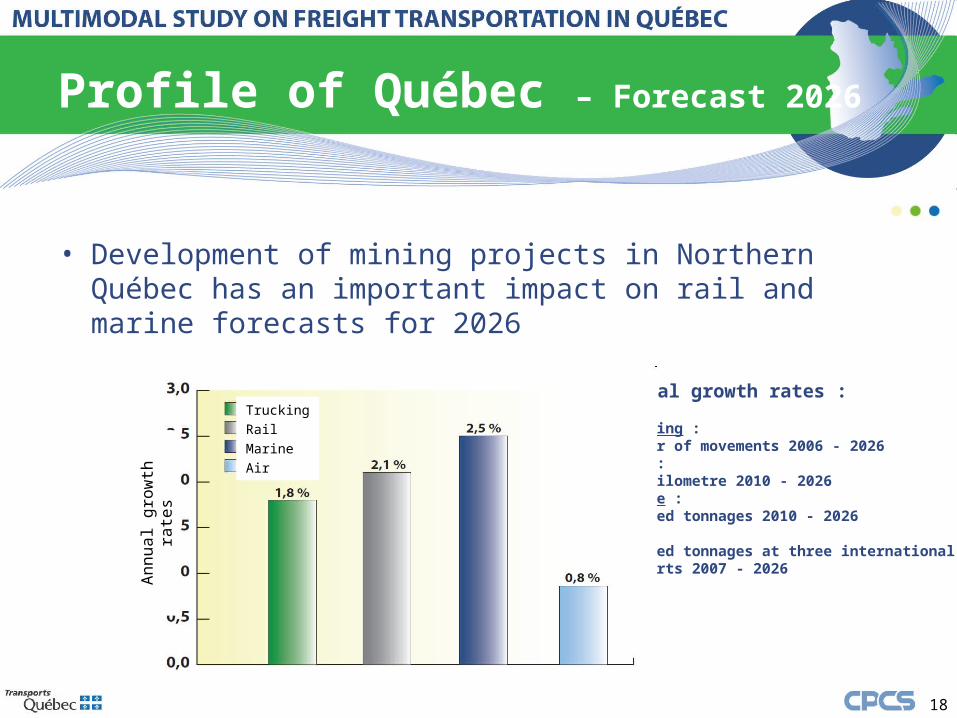
Profile of Québec – Forecast 2026
• Development of mining projects in Northern Québec has an important impact on rail and marine forecasts for 2026
Annual growth rates :
Trucking : Number of movements 2006 - 2026Rail :Ton-kilometre 2010 - 2026Marine : Handled tonnages 2010 - 2026Air : Handled tonnages at three internationalairports 2007 - 2026
Annu
al g
row
th ra
tes
TruckingRailMarineAir
19
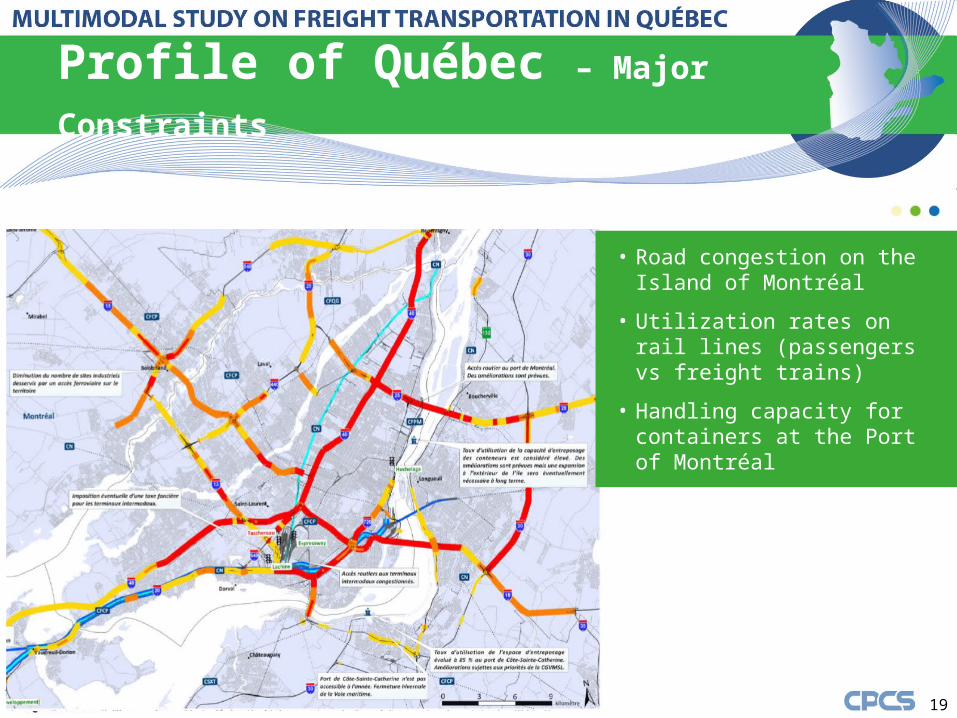
Profile of Québec – Major Constraints
• Road congestion on the Island of Montréal
• Utilization rates on rail lines (passengers vs freight trains)
• Handling capacity for containers at the Port of Montréal
• Increase of air cargo
20
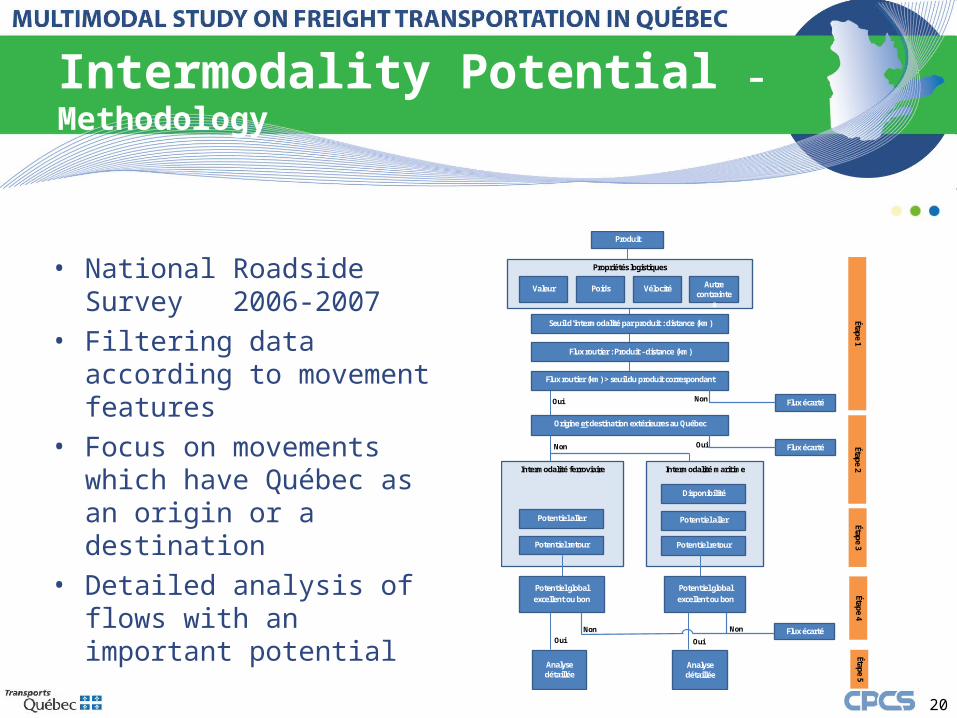
Intermodality Potential – Methodology
• National Roadside Survey 2006-2007
• Filtering data according to movement features
• Focus on movements which have Québec as an origin or a destination
• Detailed analysis of flows with an important potential
Propriétés logistiques
Produit
Valeur Poids Vélocité
Seuil d’intermodalité par produit : distance (km)
Flux routier : Produit - distance (km)
Flux routier (km) > seuil du produit correspondant
Autre contrainte
s
Origine et destination extérieures au Québec
Intermodalité ferroviaire
Intermodalité maritime
Potentiel aller
Potentiel retour
Potentiel global excellent ou bon
Potentiel aller
Potentiel retour
Disponibilité
Potentiel global excellent ou bon
Analyse détaillée
Analyse détaillée
Oui Non
Oui
Flux écarté
Flux écarté Non
Oui Oui Flux écarté Non Non
Étape 1 Étape 2
Étape 3 Étape 4
Étape 5

Intermodality Potential – Analysis
21
Aggregated flows by region with an Intermodality potential
• 17 flows = 17 440 truck movements which represent 6% of all moves (291 200) and 26% of total km travelled
•No flows between 2 Québec regions
•Montréal, Montérégie and Québec City represent 75% of the movements with intermodality potential
Intermodality Potential – Observations
• Detailed qualitative analysis of the 17 flows (step 5) :– Precise O/Ds, commodities, transportation equipments, etc.
• Identification of many constraints to intermodality :– Multiple precise O/Ds– Consolidation of goods supplied by competitors– Short distances– Irregular flows– Higher delays/cost compared to trucking– Specialized equipment non-available
22

Intermodality Potential – Observations
Additional observations…
• RAIL : Best opportunities are located where rail intermodal options already exist (ex. between Montréal and U.S.). Non-existence of intermodal equipments doesn’t seem to be a frequent constraint
• MARINE : No line services, insufficient volumes, closure of the St. Lawrence Seaway during 3 months (Ontario and Midwest) and longer marine distance (U.S. East Coast)
• TRUCKING : Choice of trucking often justified by its lower cost, more appropriate logistics, flexibility (last minute delivery, JIT, no need for consolidation)
23
Intermodality Potential – Observations
• Global incentives might increase intermodality, however, only a low proportion of movements have the features associated with those types of supply chains
• Using a mode or another is an individual decision. The result of this analysis doesn’t mean there’s no opportunity to shift from the road mode to another one, even between 2 regions in Québec
24
Thank you for your attention!Questions or comments?
Claude [email protected]
(418) 643-1772
www.mtq.gouv.qc.ca
25

Additional slides
26
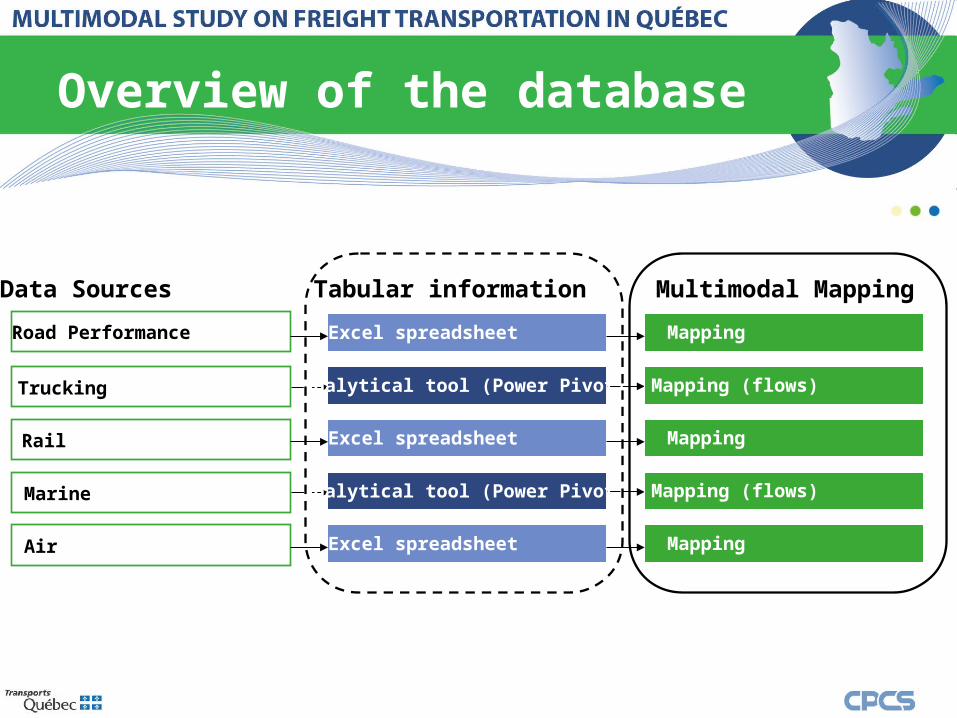
Overview of the database
Excel spreadsheetRoad Performance Mapping
Data Sources Multimodal MappingTabular information
Trucking
Rail
Marine
Air
Analytical tool (Power Pivot) Mapping (flows)
Excel spreadsheet Mapping
Analytical tool (Power Pivot) Mapping (flows)
Excel spreadsheet Mapping
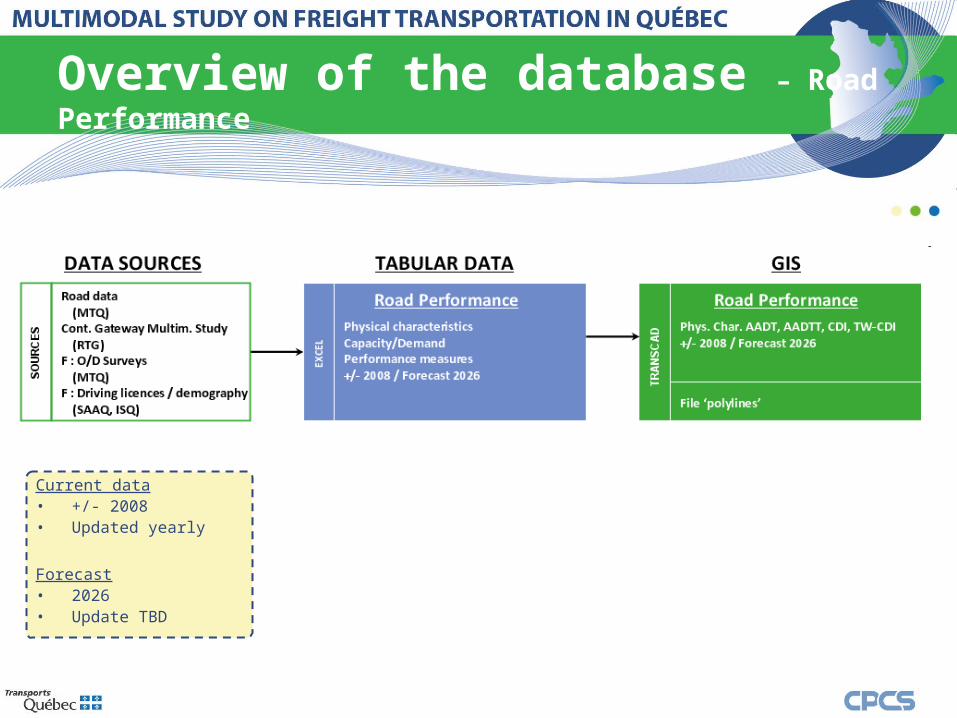
Overview of the database – Road Performance
Current data• +/- 2008• Updated yearly
Forecast• 2026• Update TBD
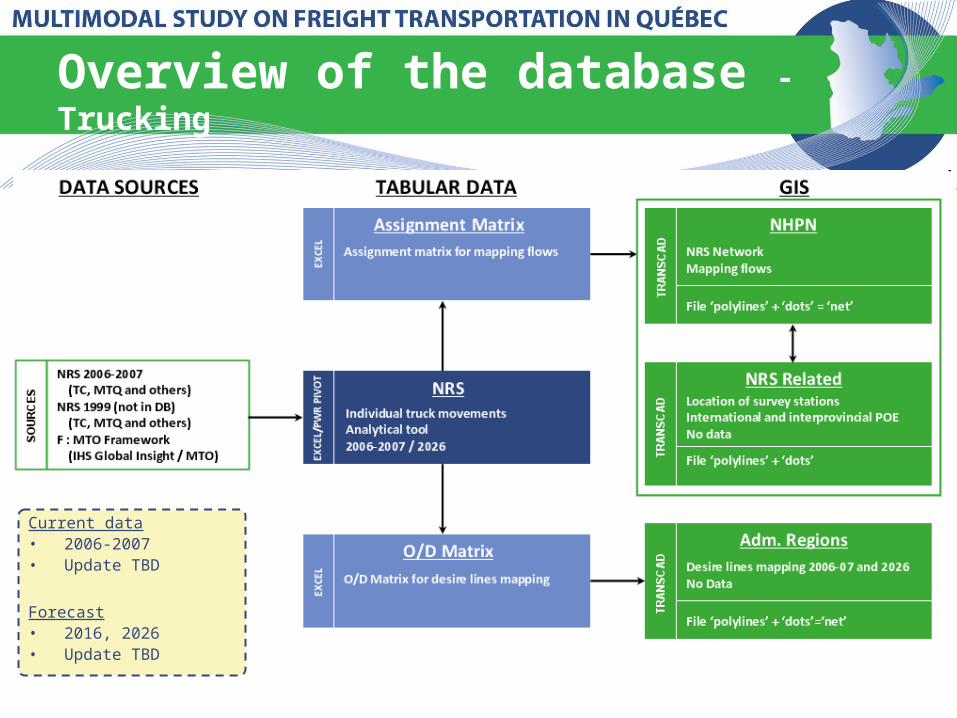
Overview of the database - Trucking
Current data• 2006-2007• Update TBD
Forecast• 2016, 2026• Update TBD
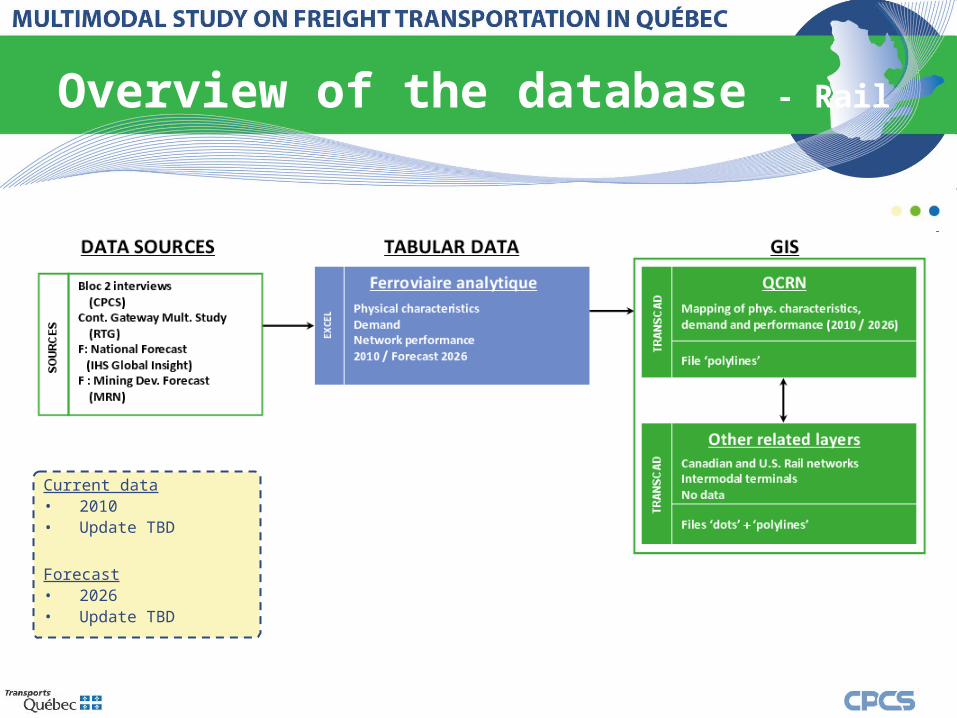
Overview of the database - Rail
Current data• 2010• Update TBD
Forecast• 2026• Update TBD

Overview of the database - Marine
Current data• 2000 - 2011• Updated yearly
Forecast• 2026 (base year 2010)• Update TBD

Overview of the database - Air
Aircraft Movements• 2006 - 2010• Yearly update
possible
Cargo Capacity• Week of 09/2011• Ponctual update
possible
Airport Data• Current : 2007• TC ceased to do
the forecast
33
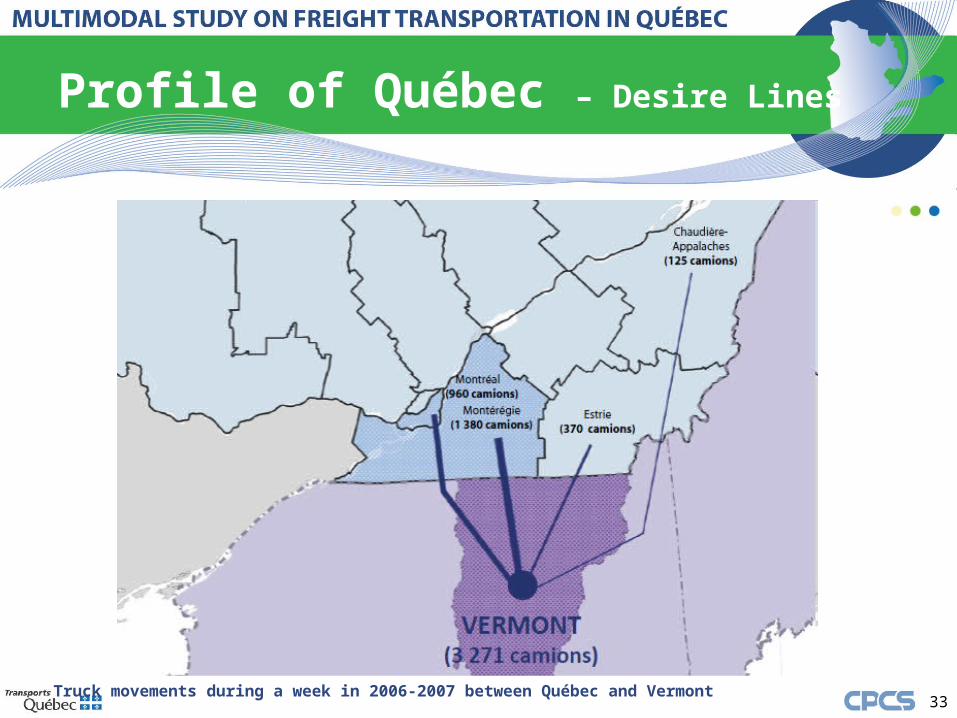
Profile of Québec – Desire Lines
Truck movements during a week in 2006-2007 between Québec and Vermont
34
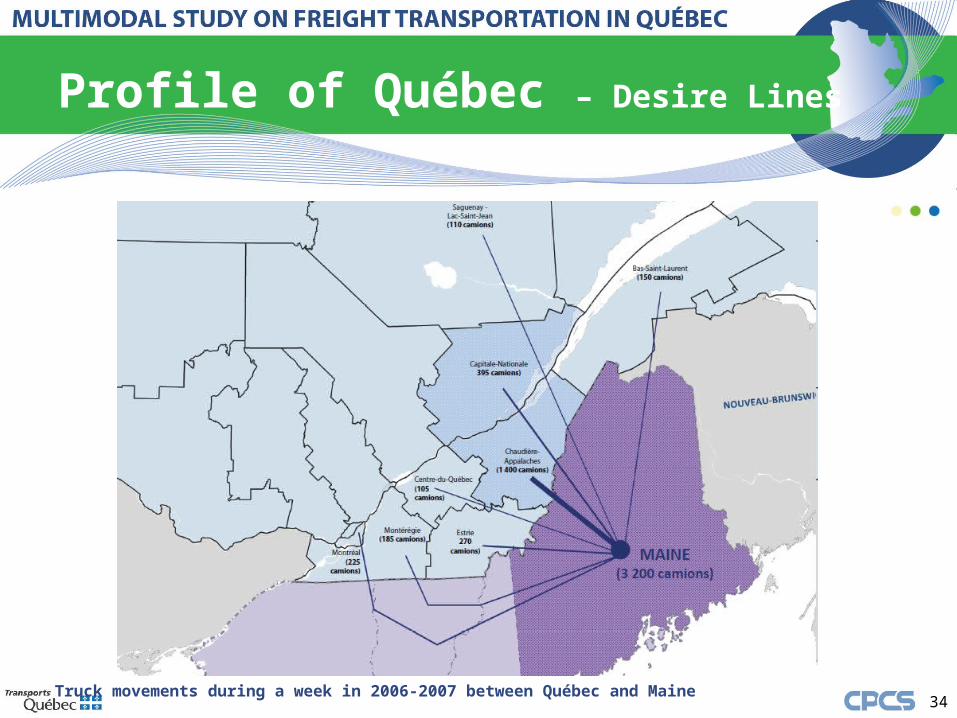
Profile of Québec – Desire Lines
Truck movements during a week in 2006-2007 between Québec and Maine

35
Profile of Québec – Desire Lines
Truck movements during a week in 2006-2007 between Québec and Michigan

![CartemotoneigeSagLac2014-15 [Unlocked by ] sentier lac st-jean.pdf · 6.6 trans-quÉbec 83 trans-quÉbec 93 trans-quÉbec 93 trans-quÉbec 93 trans-quÉbec 93 trans-quÉbec 93 trans-quÉbec](https://static.documents.pub/doc/80x56/5b2cb5eb7f8b9ac06e8b5a01/cartemotoneigesaglac2014-15-unlocked-by-sentier-lac-st-jeanpdf-66-trans-quebec.jpg)


