Abstract This research focuses on the investigation of the location determinants ofmultinational corporations’ investments in EU countries. Investment projects are ad-dressed by making a distinction between greenfield investments and M&A projects.Besides traditional factors (such as market characteristics) the effect of innovationcapabilities and the institutional environment are incorporated in the analysis. Theuse of a multilevel model makes it possible to empirically assess the effect of na-tional and regional characteristics on the location decision of multinationals. Theresults suggest that greenfield investments and M&A are similar in their locationdeterminants, although the former have a stronger correlation with highly educatedpopulations. Urbanisation, associated with land cost, as well as national (rather thanregional) markets are insignificant. Finally, we find no evidence for the importanceof political stability within Europe.
Keywords Multinationals · Investment · Regions · European Union
Zusammenfassung Diese Studie beschäftigt sich mit den Faktoren, die die Stand-ortwahl multinationaler Unternehmen in ihrem Investitionsverhalten beeinflussen.Ausländische Direktinvestitionen werden im Kontext dieser Arbeit unterteilt inGreenfied Projekte und Fusionen und Übernahmen (M&A). Neben traditionellenStandortfaktoren (wie beispielsweise Markteigenschaften) wird im Rahmen diesesArtikels der Effekt der regionalen Innovationsfähigkeit und der institutionellen Rah-menbedingen untersucht. Die Verwendung einer Mehrebenenanalyse ermöglicht esempirisch den Effekt von sowohl nationalen als auch regionalen Faktoren in Bezugauf die Standortwahl multinationaler Unternehmen näher zu betrachten. Standort-faktoren, die Greenfield und M&A-Projekte beeinflussen, weisen große Ähnlichkeitauf, wenn gleich Greenfield Investitionen eine stärkere Korrelation mit dem Bil-dungsniveau der Bevölkerung aufweist. Urbanisierung und die damit verbundenenGrundstückskosten, wie auch die nationale (anders als die regionale) Marktgrö-ße zeigen keinen signifikanten Effekt auf. Abschließend konnte keine Evidenz füreinen Effekt der politischen Stabilität auf die standörtliche Wahl multinationalerUnternehmen in Europa gefunden werden.
1 Introduction
In recent years, many observers in both policy and academic circles argue that for-eign direct investment (FDI) is of growing importance for the economic performanceof countries and regions as it plays a primary role in the global (re)organisation ofproduction (WTO 1996; Dicken 2007; Yeung and Coe 2015; Iammarino 2018). Ina firm perspective, Multinational Companies (MNCs) constantly make decisions thatare related to the search for new locations, by acquiring or merging with other firms(Guadalupe et al. 2012; Ascani 2018) or by setting up entirely new plants abroad(Head and Mayer 2004). Considering that these decisions can have a significant eco-nomic impact on recipient locations (e.g. Bellak et al. 2008; Ascani and Gagliardi2015), the attraction of FDI has rapidly gained centre stage in the agenda of policymakers all over the world. This primarily implies that countries and regions becomemore appealing for the activities of MNCs. In fact, a healthy and enabling environ-ment for business is needed in order successfully attract global FDI, retain it overtime and maximise the gains associated with its presence (OECD 2002). Indeed,a vibrant business environment encourages both domestic and foreign investment,it stimulates innovation and the accumulation of skills, as well as it contributes toa more competitive climate.
Although prior academic works have devoted a large effort to understand theentry choice of MNCs (e.g. Nocke and Yeaple 2007; Raff et al. 2009; Becker andFuest 2011) as well as their role in fostering economic development, growth and in-novation (e.g. Liu and Zou 2008; Wang and Wong 2009), most studies either focuson single-country cases or only concentrate on a narrow set of location determi-nants and mostly adopt an a-spatial lens of analysis. In this context, the objectiveof this research is not only to provide novel insights into the factors that affect thelocation strategies of MNCs, but also to produce an integrated framework of anal-ysis of MNCs’ location decisions of greenfield FDI and M&A, by building on and
K
Multinational investments across Europe: a multilevel analysis 69
expanding the findings of recent contributions (e.g. Crescenzi et al. 2014; Ascaniet al. 2016). By means of a quantitative analysis of the location factors that influ-ence the geography of European MNCs’ investment projects within the EU overthe period 2012–2017, therefore, this paper integrates in a unified theoretical andempirical framework the (i) traditional location factors of foreign investment with(ii) the innovation capabilities of regions, as well as (iii) their institutional contexts.Integrating these diverse elements also calls for a careful consideration of the het-erogeneous spatial levels at which every pull factor of global FDI operates, as somelocational determinants have an inherently local flavour while others are connectedto country-level considerations (Iammarino and McCann 2013). Furthermore, thechanging composition of FDI in the EU in recent years with the share of foreignfirms producing manufacturing goods declining over time, and the number of foreignfirms providing services increasing (Capello et al. 2011) requires a careful inves-tigation of the different location choices by adopting a fine-sliced division of thedifferent economic activities, as there can be remarkable differences in the locationdeterminants of manufacturing plants and service facilities (Py and Hatem 2009).
This research, hence, aims at contributing to the current academic debate in atleast four respects. First, it introduces a third set of explanatory variables (i.e. insti-tutional factors) in the framework used by Crescenzi et al. (2014), in considerationof the findings of Bartik (1985), Ang (2008), Bellak and Leibrecht (2009) and As-cani et al. (2016), who all provide evidence that the institutional environment ofrecipient locations matters for the location decision of MNCs. Hence, this researchaims at providing a comprehensive analysis of the location determinants of MNCs’investment projects. Second, the present analysis of FDI location determinants is notlimited to greenfield projects, as customary in the literature on firm location choices,but we extend our reach by accounting for M&A. Previous contributions, in fact,suggest that the location determinants strongly differ according to the entry mode ofthe foreign company (e.g. Basile 2004). Third, this research provides insights at thelocal level, thus narrowing down the analysis within countries, by including data onNUTS3 level for multiple nations, as advocated by recent studies on MNCs and FDI(Iammarino and McCann 2013; Iammarino 2018). The existing academic literatureon the location determinants of MNCs, instead, mainly consists of national-levelstudies (e.g. Devereux and Griffith 1998b; Cleeve 2008; Mohamed and Sidiropou-los 2010; Ascani et al. 2016). Besides, several contributions have included data onthe subnational level for NUTS1 regions (e.g. Basile et al. 2008) or NUTS2 (e.g.Cantwell and Piscitello 2005; Crescenzi et al. 2014), or US subnational units (e.g.Head et al. 1995, 1999). Only a limited number of studies employ data at a lowergeographical level than NUTS2, including Guimaraes et al. (2000) and Crozet et al.(2004) who provide an analysis of the location choices of MNCs using data onNUTS3 regions for Portugal and France, respectively. However, there is a relevantlack of empirical evidence employing such a geographical level of data refinementfor multiple countries or for political and economic unions comparable to the EU.Hence our research also aims at filling this gap by providing insights about thelocation determinants of MNCs’ investment projects across the EU at the NUTS3spatial scale. Last but not least, the scope of the dataset used in this research isnot limited to one level of analysis only, since this research also takes into account
K
70 J. Kleineick et al.
factors operating at the national level shaping the decisions of MNCs. This hierar-chical structure of the data requires the use of a multilevel model (MLM), whichallows for the introduction of factors on two or more levels of observation. Throughthe application of this methodological approach, this research aims to offer new,comprehensive and original insights into the location determinants of foreign directinvestment projects within the EU.
This article is structured as follows: the next section establishes the theoreticalbackground of the study by reviewing and contextualizing the previous literatureon the location choices of MNCs. Subsequently, the data for the empirical analysisis presented and the methodological framework is described. Next, we discuss theresults of different multilevel models. Finally, we offer some concluding remarksand recommendations for further research.
2 Theoretical background
In this section we first address the MNC choice of entry into foreign markets, bydescribing the cases of greenfield FDI and M&A. Subsequently, we discuss therole, sectoral composition and spatial scale of the traditional location drivers, theregional innovation capabilities and the institutional factors that the literature onMNCs’ location strategies has investigated. In so doing our aim is to integratethese different perspectives into a conceptual model that provides the basis for ourempirical investigation.
2.1 The entry mode: Greenfield investments and M&A projects
An extensive body of academic literature focuses on the location decisions of MNCs.A traditional approach to this is the well-known Ownership-Location-Internalisationparadigm (OLI), introduced by Dunning (1977, 1979), according to which the deci-sion of companies to undertake foreign investment is based on the co-occurrence ofthree set of advantages: firm-specific advantages that arise from owning certain keyresources, such as knowledge (Ownership), Location-advantages that are associatedwith the host region of the investment (e.g. resources, labour force) and, finally,Internalisation-advantages deriving from the benefits associated to the exploitationof the firm-specific advantages within the company boundaries at the chosen foreignlocation. Greenfield FDI represents the typical form of foreign engagement referringto the combination of these three sets of advantages, involving the establishment ofentirely owned subsidiaries in a new geographic market (Wang and Wong 2009,Bertrand et al. 2007). As such, these greenfield ventures provide the highest form ofcontrol over internal resources and knowledge but are also likely to have the highestcosts (Hennart and Park 1994). These costs include the establishment of both, thephysical facilities and the relationships and networks that are necessary to operateeffectively (Andersson et al. 1997).
As an addition to the three above-mentioned motives of the Ownership-Loca-tion-Internalisation paradigm, Cantwell (1989) considers that rather than utilizingcapabilities already at hand, companies can invest abroad in search of capabilities
K
Multinational investments across Europe: a multilevel analysis 71
that are not available in their home markets, thus undertaking “knowledge seeking”investments. Consequently, MNCs may supplement their firm specific technologiesby expanding internationally to access new localized knowledge (Ascani 2018),since some knowledge is partially tacit and the transfer requires frequent interaction(Kogut and Zander 1992; Boschma 2005).
MNCs, in fact, can use M&A as an alternative entry mode in order to facilitatetheir internationalisation strategy. This type of investment is defined as the take-overof (a part of) the assets of already established businesses abroad (Ó hUallacháinand Reid 1997). Through that, the acquiring firm obtains the resources of the targetfirm, such as its knowledge base, technology and human resources, and it also gainsaccess to the new market and to key constituencies at local level (Newburry andZeira 1997; Iammarino and McCann 2013).
The decision about the internationalisation strategy of a business is closely relatedto the growth strategy of the company (Wang 2009a). Greenfield investment isthe most typical way to exploit the advantages of internal growth, while M&A isrelated to external growth (Wang 2009b). Therefore, greenfield FDI can be attractivewhen firm-specific technological and organisational competences define a firm’sability to compete on the market, since the company has the possibility to duplicate(parts of) their know-how, their routines, and the physical property (Hennart andPark 1993) across locations. If a company, instead, aims at (immediate) accessto the technologies and the local market experience of a target firm, a takeovercan be preferable (Ó hUallacháin and Reid 1997; Cantwell and Santangelo 2002).M&A projects, therefore, seem to be a less risky entry mode compared to greenfieldinvestment.
Although the decomposition of FDI shows that M&As constitute the bulk of FDI(Brakman et al. 2007), there is strong academic evidence that greenfield projectscan be more favourable for economic growth and development in the host region(Javororcik and Kaminski 2009; Neuhaus 2005; Miskinis and Byrka 2014). Reasonsfor that can especially be found in the direct effects of this type of investment thathave impact on capital formation, technological and innovative progress, employ-ment, and human resource development and the indirect effects that arise from spill-overs, leading to competitive and productivity growth in the host region. Importantly,the location determinants of foreign subsidiaries can differ according to the entrymode (Basile 2004), and since the present research aims at providing insights on thelocation determinants of MNCs’ investment projects, it is important to not limit theanalysis to greenfield FDI, but also to take into account M&A projects.
2.2 Traditional location determinants
With respect to the location determinants of MNCs’ investment projects, traditionalapproaches to the analysis of this topic have alternatively included a number offactors. Early studies, such as Head et al. (1995, 1999), Guimaraes et al. (2000)and Crozet et al. (2004), consider the cumulative nature of foreign direct invest-ment as an important determinant of a firm’s location choice, thus highlighting thatprevious investment in the same industry or from the same country of origin pos-itively influences the probability of additional investment in the same area. This
K
72 J. Kleineick et al.
type of agglomeration dynamics is explained by inter-firm technological spill-overs,the availability of specialised labour, and the access to intermediate inputs withinthe value chain, echoing the work of Marshall (1920). In a similar vein, Head andMayer (2004) suggest that market access considerations of MNCs are also crucial,indicating that foreign firms also tend to locate where the concentration of localdemand is high. Market size and market growth constitute, indeed, a recurrent tradi-tional motive in most analyses (Schneider and Frey 1985; Wheeler and Mody 1992;Head and Mayer 2004; Botric and Škuflic 2006; Basile et al. 2008; Cleeve 2008;Mohamed and Sidiropoulos 2010).
With respect to the effect of labour market conditions on the location choiceof foreign subsidiaries the findings in the academic literature remain mixed, withsome studies suggesting a positive relationship between labour costs and the numberof foreign subsidiaries of MNCs (e.g. Guimaraes et al. 2000; Defever 2006), andothers concluding that this relationship remains weak (Woodward 1992; Devereuxand Griffith 1998; Head et al. 1999; Head and Mayer 2004) or even negative (Botricand Škuflic 2006; Py and Hatem 2009). A possible explanation for these differentfindings might be that, on the one hand, higher wages can reflect the availabilityof skilled workers, therefore having a positive effect, but, on the other hand, higherwages lead to an increase in costs of companies, therefore having a negative effect.Similarly, the unemployment rate can refer to high availability of labour (positiveeffect on FDI as in Botric and Škuflic 2006; Py and Hatem 2009), but also to a lackof suitable work force (c.f. Disdier and Mayer 2004). Possibly, these differences canbe caused by differences in terms of the type of activity that is relocated in a foreignregion.
Finally, some studies use measurements of urbanisation in order to estimate theeffect of metropolitan areas and land costs on the attraction of foreign direct in-vestment. The results of Basile (2004) also show a positive impact of urbanisationon the number of MNCs’ foreign subsidiaries, suggesting that agglomerations ofconsumers make regions more attractive for foreign investors.
2.3 Regional innovation capabilities
The second set of factors which has an effect on the location decision of MNCs canbe considered as innovation capabilities of a region. Crescenzi et al. (2014) arguethat this set of factors is frequently overlooked in recent quantitative contributions,while it has rather become the focus of in-depth case studies. However, the lattertype of studies, while exploring the nuances of the dynamics at hand for a specificcase, have a low degree of generality compared to more formal quantitative research(Cantwell and Iammarino 2003). In order to fill this gap, Crescenzi et al. (2014)quantitively consider the regional endowment of innovation capabilities as a loca-tion determinant of foreign MNCs and detect a positive effect on the attraction ofMNCs’ investments in EU-25 countries, which is in line with the existing literatureon regional innovation (Pike et al. 2006). Beside the very limited number of studiesaccounting for innovation-related factors at the regional level on the location deci-sion of MNCs, several studies have focused on this relationship at the national level.Dunning (2013), for instance, argues that MNCs prefer to invest in regions with
K
Multinational investments across Europe: a multilevel analysis 73
a high regional productivity. This argumentation assumes that wage rates rise withproductivity growth, yet at a slower pace than the productivity growth. Accordingto Dunning (2013) this means that a higher rate of productivity growth leads toa decrease in unit costs and an increase in profitability and international competi-tiveness, making more productive regions more attractive for foreign investments.Cleeve (2008) finds in his research about the attraction of FDI to sub-Saharan Africathat human capital has the expected positive effect on the location decision of foreigninvestors. Similarly, Ascani et al. (2016) conclude that there is a significant relationbetween the educational level and the attraction of MNC’s foreign subsidiaries.
2.4 Institutional factors
Several studies take an institutional approach as a starting point in order to analysethe geography of MNCs. According to this approach, the institutional environmentof a region or a country matters for the location decision of MNCs. However, inthe academic literature there are many different ways to include this institutionalperspective in the empirical analysis. A number of contributions focuses on gov-ernment corruption as a factor influencing MNCs strategies, suggesting that highlycorrupted authorities discourage inward FDI (Asiedu 2006; Cleeve 2008; Du et al.2008; Mohamed and Sidiropoulos 2010). The taxation level of host locations hasalso received strong attention as an institutional factor. Starting with Hartman (1984),most studies show that FDI is strongly sensitive to taxation. For example, by us-ing sub-national data on FDI inflow in Malaysia, Ang (2008) concludes that thestatutory corporate tax rate has a significant negative effect on the total number ofFDI. This is in line with the findings of Head et al. (1995) about the location ofJapanese investment in the EU. Bellak and Leibrecht (2009) also take taxation intoaccount while studying the determinants of foreign direct investment in central andeastern European countries, by considering the effective average tax rate (EATR),since the EATR is a conceptually accurate measure of the corporate income tax bur-den when analysing the effect of taxation on the location decision of MNCs. Theirfindings suggest that taxation has the expected negative effect on the FDI volume.Buettner and Ruf (2007) exclusively focus on the effect of different types of taxeson the location of FDI. Contrary to the findings of Bellak and Leibrecht (2009) theyconclude that the statutory corporate income tax rate, rather than the EATR, func-tions as a determinant for the location decision of German multinationals. Moreover,Ascani et al. (2016) uses a business regulation index that contains different typesof costs associated with—inter alia—taxes. Based on their findings they concludethat this index has a significant positive effect on the location decisions of MNCs,which corresponds to their expectations, since a higher index reflects a less regulatedinstitutional environment.
Besides corruption and taxation, several other factors are considered by variousstudies in order to address the institutional approach while analysing the locationdecision of MNCs. In order to measure the institutional environment, Asiedu (2006)includes the effectiveness of the rule of law and concludes that this factor has theexpected positive effect on the attraction of FDI. Cleeve (2008) combines politicalfreedom and civil liberty into one institutional index and concludes that this index
K
74 J. Kleineick et al.
does not have a significant effect on the attraction of MNCs. Based on the findingsin the existing academic literature it has become clear that there is to some extentdisagreement about the impact of institutional factors on the location decision ofMNCs.
2.5 Conceptual model
As a result of the previous discussion, we integrate the main findings of the literatureinto the conceptual model in Fig. 1. This model contains all the factors that havea significant impact on the location decision of MNCs. The model considers theconcurrent and hierarchical role of different sets of location factors influencingthe strategic entry choices of MNEs. At the same time, these factors operate atmultiple spatial scales, namely national and local.. In the upper segment of Fig. 1 theinstitutional factors are included in the model. According to previous studies thesefactors can play an important role for the location decision of MNCs. However, theexisting literature does not indicate which set of factors has the greatest impact on thelocation choice of MNCs. In this research we consider that institutional factors canaffect the opportunity of MNCs to engage in a foreign market, thus influencing theirlocation strategies. These factors are measured on national level, as most institutionalstructures refer to country-wide rules and norms. In the middle segment of Fig. 1,traditional location factors encompass a plethora of drivers of MNC activity, rangingfrom market access considerations to agglomeration and efficiency rationales. Inthese terms, most of these elements operate at the regional scale as the decisions ofMNCs regard the specific subnational economic geography of countries (Iammarinoand McCann 2013). Nevertheless, we consider also that the market size of therecipient country can be a relevant factor of attraction at the national scale as demandlinkages can transcend regional boundaries. The third segment of Fig. 1 includes,finally, the innovation capabilities of regions, as these factors represent key driversthat the literature has long acknowledged to be highly heterogeneous within countries(Crescenzi et al. 2014). With this sketch of conceptual model in mind, our empirical
institutional factors
• taxation• corruption• political stability
traditional location factors
• national market size• regional market size• regional market potential• regional (un)employment• sectoral agglomeration• sectoral productivity• labour costs
innovation capabilities
• human capital• regional innovative dynamism
Foreign subsidiaries of MNCs• greenfield
projects• M&A projects
national level regional level
Fig. 1 Conceptual Model
K
Multinational investments across Europe: a multilevel analysis 75
exercise aims at operationalising the wide set of relationships discussed above, byaccounting for the geographical heterogeneity of the different localisation factors.
3 Data
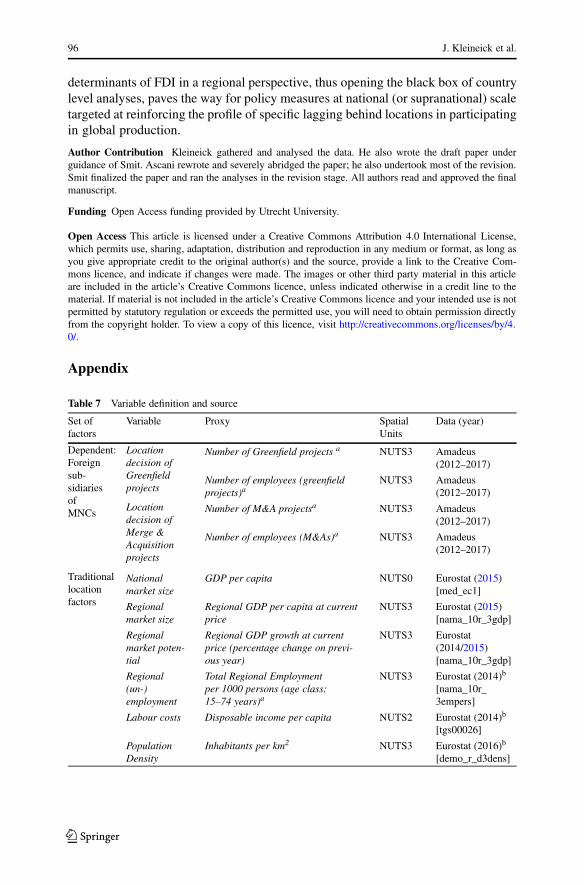
This section describes in detail the data employed in the empirical analysis.A schematic overview of the various indicators and their sources can be found inAppendix Table 7.
3.1 MNC investment projects
Data regarding FDI projects is provided by the Amadeus database compiled byBureau van Dijk. This database consists of company accounts reported to nationalstatistical offices concerning 11 million public and private companies in 41 Europeancountries. This company-level dataset provides the year, the country and regionwhere the company was founded, the ownership structure and the sector of activity.Based on this dataset a selection is made including firms that were newly created inEU countries in the period 2012–2017 with a percentage of assets owned by non-residents of at least 10%.1 This count data about the number of greenfield investmentsrefers to the quantity of investment projects in a region. A second selection is madein order to include the number of M&A projects in EU countries. Therefore, all targetcompanies are selected in the Amadeus database and aggregated by their locationon NUTS3 level. For both entry modes, the Amadeus database did not provideinformation about the NUTS3 region of a company for Austria, Greece, Malta andUK. In order to aggregate data on investment projects in these countries, the postcodeof each individual investment project is translated into the corresponding NUTS3region. Data for this transformation is provided by Eurostat (2018). In Table 1 thedistribution of investment projects is provided on national level. In total 11,404greenfield projects and 8387M&A were carried out by European MNC in the EUcountries during the period 2012–2017.
However, sample size requirements of an MLM do not allow to include all EU-28 countries in the econometric model. This is especially due to the smallness ofsome countries and consequently the small number of NUTS3 regions (see Table 1for a comparison between the official number of NUTS3 regions per country and thenumber of NUTS3 regions included in this research). Based on the findings of Maasand Hox (2005) about group size requirements in multilevel analyses, countries withan insufficient number of NUTS3 regions (<10) are necessarily excluded from theanalyses. These countries are Cyprus, Estonia, Ireland, Luxemburg, Latvia, Maltaand Slovakia. Since the dataset covers the post-crisis period from 2012 to 2017,Greece is also excluded from the econometric model, due to the singularity of therecovery process of the Greek economy. Besides the two different entry modes, the
1 This selection is based on Capello et al. (2011). However, using the Amadeus database it was not possibleto reconduct the data used in the corresponding article even though the selection method seems to be thesame. This might be due to different available versions of the Amadeus database.
K
76 J. Kleineick et al.
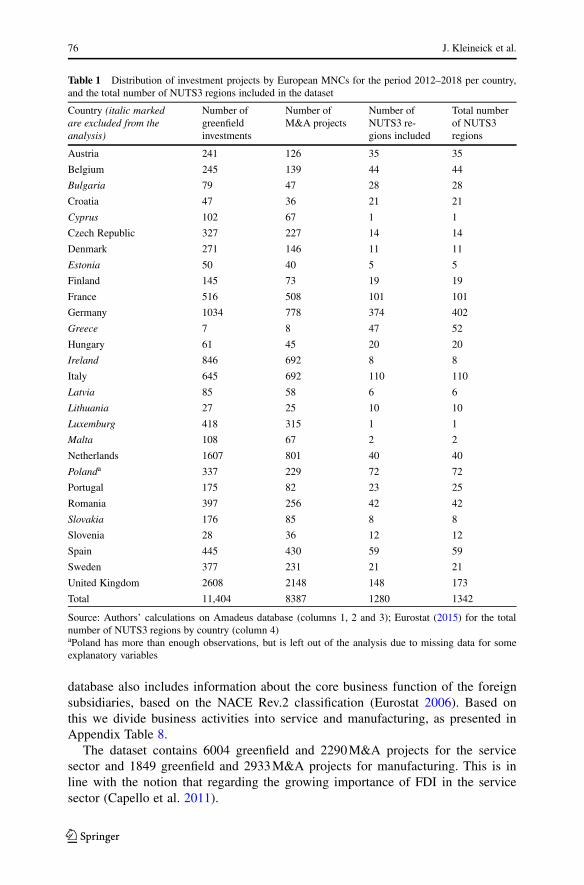
Table 1 Distribution of investment projects by European MNCs for the period 2012–2018 per country,and the total number of NUTS3 regions included in the dataset
Country (italic markedare excluded from theanalysis)
Number ofgreenfieldinvestments
Number ofM&A projects
Number ofNUTS3 re-gions included
Total numberof NUTS3regions
Austria 241 126 35 35
Belgium 245 139 44 44
Bulgaria 79 47 28 28
Croatia 47 36 21 21
Cyprus 102 67 1 1
Czech Republic 327 227 14 14
Denmark 271 146 11 11
Estonia 50 40 5 5
Finland 145 73 19 19
France 516 508 101 101
Germany 1034 778 374 402
Greece 7 8 47 52
Hungary 61 45 20 20
Ireland 846 692 8 8
Italy 645 692 110 110
Latvia 85 58 6 6
Lithuania 27 25 10 10
Luxemburg 418 315 1 1
Malta 108 67 2 2
Netherlands 1607 801 40 40
Polanda 337 229 72 72
Portugal 175 82 23 25
Romania 397 256 42 42
Slovakia 176 85 8 8
Slovenia 28 36 12 12
Spain 445 430 59 59
Sweden 377 231 21 21
United Kingdom 2608 2148 148 173
Total 11,404 8387 1280 1342
Source: Authors’ calculations on Amadeus database (columns 1, 2 and 3); Eurostat (2015) for the totalnumber of NUTS3 regions by country (column 4)aPoland has more than enough observations, but is left out of the analysis due to missing data for someexplanatory variables
database also includes information about the core business function of the foreignsubsidiaries, based on the NACE Rev.2 classification (Eurostat 2006). Based onthis we divide business activities into service and manufacturing, as presented inAppendix Table 8.
The dataset contains 6004 greenfield and 2290M&A projects for the servicesector and 1849 greenfield and 2933M&A projects for manufacturing. This is inline with the notion that regarding the growing importance of FDI in the servicesector (Capello et al. 2011).
K
Multinational investments across Europe: a multilevel analysis 77
While our data on MNCs’ investment projects allow us to proxy the foreignpresence by region within the EU, we cannot account for the intensity of eachinvestment, such as the investment volume or the number of employees working inthe foreign firm. We acknowledge this might be a limitation in our study, but forthe aim of our paper, which is that of analyzing the location determinants of MNCs,the discrete nature of our data is sufficiently adequate to assess the role of diverselocation strategies of MNCs. Furthermore, similar data is use in most prior studies(e.g. Head and Mayer 2004; Defever 2006; Crescenzi et al. 2014).
3.2 Explanatory variables
In order to analyse the location decision of MNCs, three sets of explanatory variablesare included in the econometric model. In Appendix Table 7 detailed information isprovided including the proxy for each variable, the territorial unit, and the source ofthe data for each variable.
3.2.1 Traditional location determinants
The first set of explanatory variables can be summarized as the traditional locationdeterminants since they are “standard” proxies, customary in the literature on thelocation decision of MNCs. As presented in the previous discussion, the variablesincluded in this set refer to the general market conditions at both national andregional scale.
National and regional market size To start with the market size most studiesinvestigate the effect of the national market size through including the national GDPor the GDP per capita (Schneider and Frey 1985; Wheeler and Mody 1992; Headand Mayer 2004; Botric and Škuflic 2006; Cleeve 2008; Mohamed and Sidiropoulos2010). Basile et al. (2008) includes data at the sub-national level with regional GDPper capita and the regional gross value added (GVA), while Crescenzi et al. (2014)include measurements on national and regional level. We follow the literature andinclude the regional as well as the national market size, measured by the nationaland the regional GDP per capita in Euro at current price level.
Regional market potential Following Head and Mayer (2004), regional marketpotential can also be a key element in driving MNC strategies and we capture thiswith the regional GDP growth rate.
Regional (un)employment by sector As presented in the previous section MNC’sinvestment projects are characterized by a cumulative nature (Head et al. 1995, 1999;Guimaraes et al. 2000). We include a proxy for the number of people working inmanufacturing and in the service sector reflects the agglomerative power of bothbusiness activities in a region.
Regional labour market With respect to the labour market conditions two proxiesare included in the analysis: the unemployment rate of regions and, due to the lack
K
78 J. Kleineick et al.
of available data on regional labour costs, the average disposable income per personper NUTS2 region is included in the analysis. Since this is not the actual averagewage of a person in a NUTS3 region, the assumption is made that data on NUTS2regions is the same for each corresponding NUTS3 region. However, this meansthat conclusions are drawn on an aggregation level lower than that of the actualdata, which implies that the data is disaggregated. This can cause ecological fallacy,which refers to the incorrect assumption that certain relationships between variablesobserved at the aggregated level are the same at lower level of aggregation. Inparticular, NUTS2 level data contain less extreme observations than NUTS3 leveldata, due to the fact that it is aggregated. Through the use of more precise data,the results would come slightly closer to the reality which implies smaller standarddeviations. However, due to the fact that the variable functions as a control variable,this might not cause any methodological issues.
Population density Finally, we incorporate population density as a proxy for ur-banisation. This is in line with the argumentation of Bartik (1985) who stresses thatpopulation density does not only refer to the level of urbanisation but also to theland costs, since residential and industrial users compete for land.
3.2.2 Regional innovation capabilities
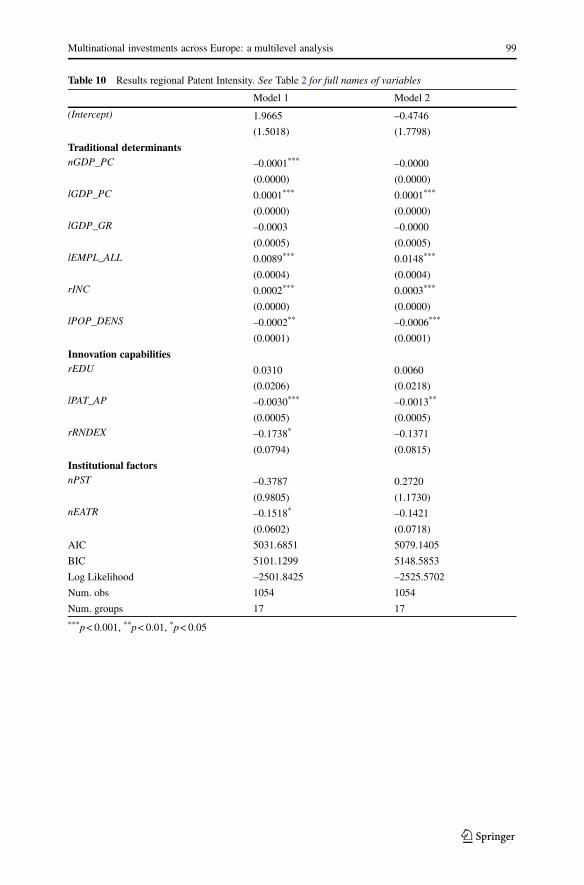
The second set of explanatory variables reflects the innovation capabilities of a re-gion in order get more insight into the effect of the local knowledge context on theattraction of foreign MNCs. Existing studies remain scant as there is only a lim-ited number of quantitative analyses that takes this set of explanatory variables intoaccount. Also, the findings in the academic literature show some extent of disagree-ment, as presented in the theoretical section above. The results of Crescenzi et al.(2014) provide evidence that both R&D and patent intensity have a positive effect onthe location decision of MNCs. We depart from this evidence to study how foreignMNCs respond to local innovation capabilities in designing their location strategies.
Human capital We employ three different measures for the regional innovationenvironment. We start with human capital as defined by the participation rate intertiary education (level 5–8) of the age class 25–64 years for NUTS2 regions.
R&D and patents Subsequently we consider a narrower definition of regional in-novative dynamism by including regional R&D expenditure, measured as percentageof the regional GDP, and the regional patent intensity based on the number of patentapplications to the EPO per million inhabitants.
Regional productivity In addition to the three variables above, one further indi-cator is added to the models that are specified according to the business functionof the investment. For investment projects (both entry modes) with primary focuson manufacturing or within the service sector, the Gross Value Added (GVA) ispart of the set of the innovation capabilities. Based on the conclusion of Dunning(2013) who states that the regional productivity (output per worker) matters for the
K
Multinational investments across Europe: a multilevel analysis 79
Table 2 Descriptive statistics of all variables (unstandardized, N= 1204)
rINC Disposable income 16,599.50 4573.24 5400 17,300 39,000
lPOP_DENS Population density 620.22 1507.11 1.90 155.20 21,242.80
Innovation capabilities
rRNDEX R&D expenditure 1.80 1.34 0.06 1.49 8.80
rEDU Tertiary enrolmentrate
29.33 9.01 11.50 27.90 74.80
lPAT_AP No. Patent applica-tions
113.46 119.41 0.23 81.33 590.06
rGVA_MANU_PC
Productivity (manu-facturing)
0.01 0.004 0.001 0.01 0.02
rGVA_SERVICE_PC
Productivity (ser-vices)
0.01 0.01 0.001 0.01 0.12
Institutional factors
nPST Political stability 0.56 0.29 –0.06 0.51 1.02
nSCIT Statutory corporateincome tax
26.03 6.90 10.00 25.00 35.40
nEATR Effective corporatetax rate
24.22 6.04 9.00 23.50 33.40
nCOR Corruption 70.56 13.38 43 81 88
Variables prefixed with n are measured at the national level, with r at the NUTS 2 level, and with I at theNUTS 3 level. Produced using Stargazer (Hlavac 2018)
K
80 J. Kleineick et al.
attraction of foreign direct investments by MNCs, the GVA per worker is includedin the relevant analyses. As for the number of investment projects, the GVA valueis specified according to the NACE Rev.2 classification (see Table 2).
3.2.3 Institutional factors
As discussed in the conceptual section, an increasing number of studies account forthe role of the institutional environment in shaping MNCs’ location decisions.
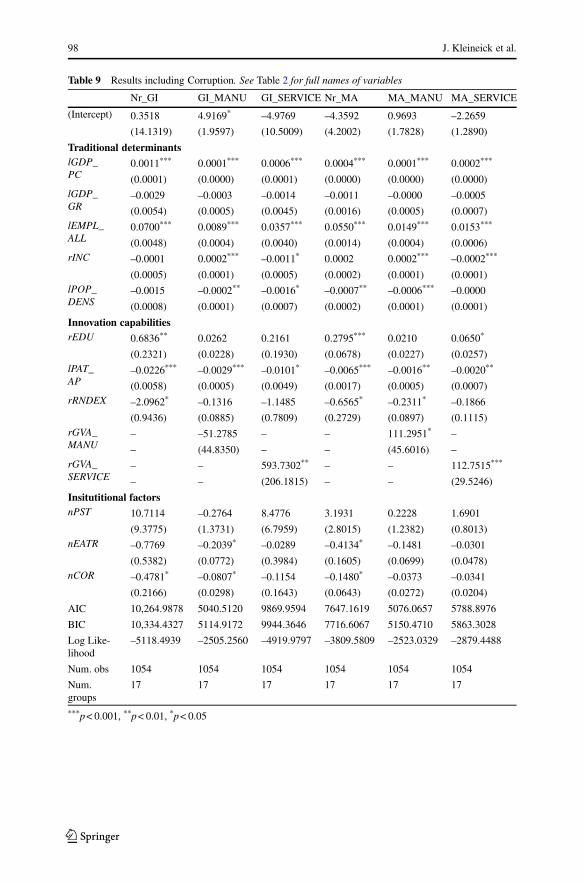
Corruption Most of these researches show that government corruption has a neg-ative effect on the attractiveness of a location (Cleeve 2008). However, evidence isnot unambiguous as other studies fail to detect any significant relationship betweengovernment corruption and inward FDI (Wijeweera and Dollery 2009). We includea corruption perception index (nCOR) as an explanatory variable to understand thisfundamental aspect of government quality in attracting foreign MNCs. Higher val-ues indicate a higher perceived level of corruption. However, this variable is closelycorrelated with one of our taxation variables, and is therefore omitted from our maintables.
Taxation A second crucial dimension emerging from the literature regards the levelof corporate taxation (Devereux and Griffith 1998a). Nevertheless, the discussion ofthe studies of Bellak and Leibrecht (2009) and of Buettner and Ruf (2007) show thatthere is to some inconsistency in the academic literature about the effect of differentmeasurements for corporate taxation. Due to the mixed evidence this study includestwo well-known measures of taxation, namely the statutory corporate income taxand the effective average tax rate (EATR) in order to contribute to the academicdebate and to fill this knowledge gap. Data for both variables is provided by theCentre for European Economic Research (Spengel et al. 2017).
Political stability Finally, political stability is included in this research as a loca-tion determinant of MNCs’ investment projects. Based on several investor surveys,Asiedu (2006) constructs a variable that measures the rule of law, using data de-rived from the International Country Risk Guide. Biswas (2002) measures politicalstability through the duration of a regime by applying the definition of Clague et al.(1994) who state that for a democracy the duration of a regime refers to the numberof consecutive years that the country has been a democracy, while for an autocracy,duration refers to the number of years that a particular autocrat has been in power.Cleeve (2008) uses indices for political freedom and civil liberty and combinesthem in order to measure political stability. Since all different measurements showthe same effect on the location decision of MNCs, this research introduces as newproxy for political stability. By employing data from the World Bank (2016) we usethe indicators for political stability and absence of violence/terrorism as institutionalmeasures.
K
Multinational investments across Europe: a multilevel analysis 81
3.3 Methodology
We investigate the location determinants of MNCs by means of a quantitative ap-proach. Our dependent variable is the location of MNCs’ investment projects. We areable to split this variable according to the entry mode of the investment, i.e. green-field investments or M&A. Both are measured by taking into account the numberof projects per NUTS3 region. An overview of the number of investment projectsby country can be found in Table 1. Our data also allows to differentiate betweenmanufacturing and service activities (see Appendix Table 8), thus permitting ananalysis by sector and entry mode. The independent variables refer to three sets offactors, namely traditional drivers, innovation capabilities and institutional elements.Because this data includes different levels of aggregation (NUTS 0, NUTS 2 andNUTS 3) the observations are not independent, and we apply multilevel modellingto take this heteroscedasticity into account (Hox et al. 2017).
Due to the fact that the model contains different sets of variables and due thehierarchical structure of the data, the analysis is carried out stepwise for each mea-surement of the independent variable through the gradual inclusion of the predictors.Before running the empirical analysis, two important data transformations deservespecial attention. First, in order to prevent a violation of the assumptions of an MLM,the dependent variable is transformed by applying the logarithm to base 10. This isdone for all six measurements of the dependent variable, respectively the numberof foreign direct investments by entry mode and economic activity. Due to the factthat the Log (0)10 is undefinable, we increase each value by one, to anticipate pos-sible errors in the dataset—a well-known adjustment in the trade literature (Lindersand Groot 2006). Secondly, we standardize all independent variables. Descriptivestatistics before standardization are presented in Table 2.2
Our formula to be estimated in the main models is given in Eq. 1, where variablesprefixed with n are measured at the national level, with r at the NUTS 2 level, andwith l (for ‘local’) at the NUTS 3 level.3 Equation 1 is a random-intercept model; jrepresents the upper, national level, for which separate fixed effects are measured,and their variance is reported in the tables. We also estimate a random slope model,where the coefficient for lEMPL_ALL is allowed to vary by country; this model ispresented in Eq. 2.4 For further details, we refer to Sect. 4.1, below.
logGIij or logM Aij D ˇ0 C ˇj0 C ˇ1nGDP _P Cj C ˇ2lGDP _P C
C ˇ3lGDP _GR C ˇ4lEMPL_ALL C ˇ5rINC C ˇ6lPOP _DENS C ˇ7rEDU
C ˇ8lPAT _AP C ˇ9rRNDEXC ˇ10nPSTj C ˇ11nEAT Rj
or ˇ11nSCITj C ˇj0 C �
(1)
2 Q-Q plots as well as histograms of residuals are available upon request.3 Since the regional and local levels are not explicitly included in our multilevel model, we do not applysuffixes to these variables.4 In Table 6, one random slope model is presented where not lEMPL_ALL but lGDP_PC is allowed tovary.
K
82 J. Kleineick et al.
logGIij or logMAij D ˇ0 C ˇ1nGDP _P Cj C ˇ2lGDP _P C C ˇ3lGDP _GR
C ˇ4lEMPL_ALL C ˇj4lEMPL_ALL C ˇ5rINC C ˇ6lPOP _DENS
C ˇ7rEDU C ˇ8lPAT _AP C ˇ9rRNDEXC ˇ10nPSTj C ˇ11nEAT Rj
or ˇ11nSCITj C ˇj0 C �
(2)
3.4 Endogeneity and other robustness checks
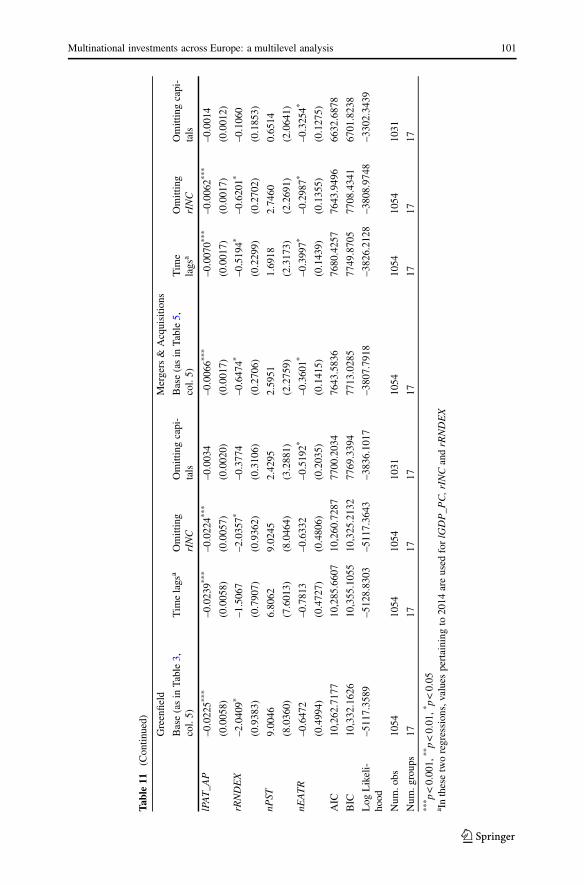
Although foreign direct investment is attracted to places with a large degree ofeconomic success, it also contributes directly to such success—in other words, thereis a risk of reverse causality in the model. To counter this, we rerun our mainanalyses with time-lagged variables, taking 2014 data from Eurostat for regionalGDP per capita, regional R&D expenditure and regional disposable income.
There is also a risk capital cities form outliers, impacting our results to a dis-proportionate degree. Particularly Central and Eastern European cities stand outmarkedly from the rest of their countries (Gorzelak and Smetkowski 2010). Onecould argue, however, that these are not outliers in the traditional sense; they formpart and parcel of the actual world, and strong non-linear contrasts in the data willsimply increase the standard errors in our estimates. Of course, the analysis withoutcapital regions does form a better basis for policy advice to non-capital regions.
Finally, our variable disposable income (rINC) is not the actual average wage.We will therefore also test whether omitting this variable changes the results.
4 Results
In this section, the results of the multilevel models are presented. As describedabove, each model is built stepwise, starting with an intercept-only model which isfollowed by a random intercept model. Then, the model is extended by includingadditional sets of explanatory variables. Finally, a random slope model is reported,in case it fits the data significantly better than the complete random intercept model.
4.1 The regional attraction of greenfield investments
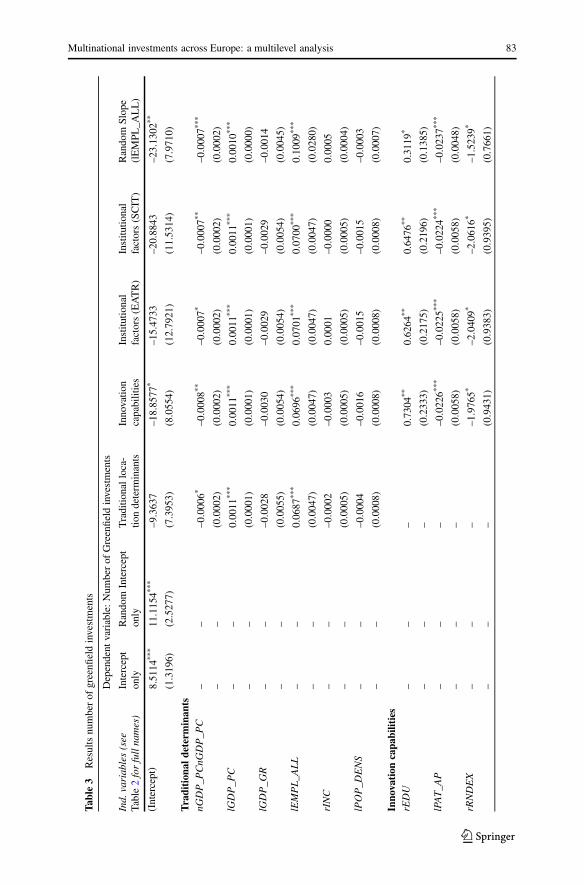
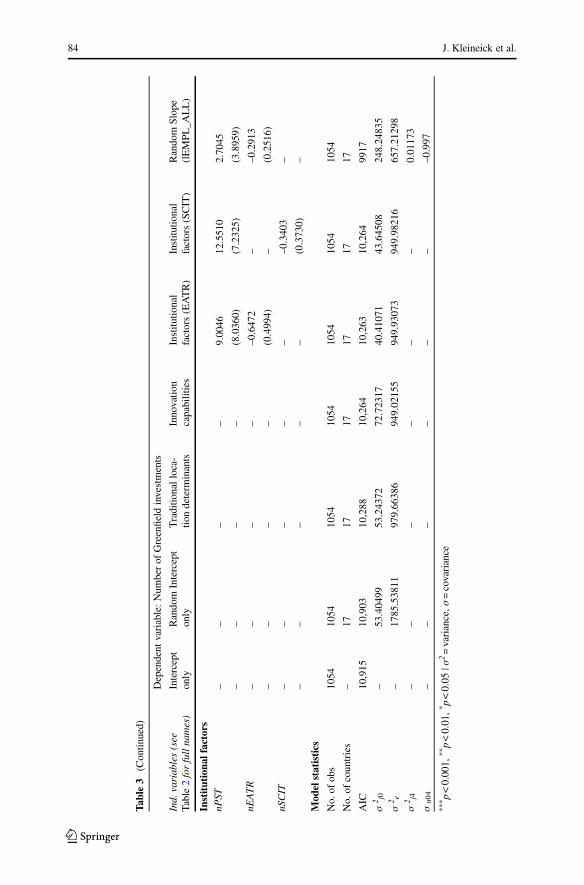
The impact of different location determinants on the regional concentration of green-field investments is presented in Table 3. In the first column the base model is pro-vided, including only the intercept. In the second model the intercept is allowedto vary across the 17 countries that are included in the analyses. The intra-classcorrelation in this model is 0.029 indicating that 2.9% of the variance is explainedon country level. Since this model does not contain any explanatory variables, theresidual variance (σ 2
e) represents unexplained error variance.The traditional location determinants are included in the third column. Starting
with the national GDP per capita the estimated results show a negative and weaklysignificant impact on the number of greenfield investments in a region, suggesting
K
Multinational investments across Europe: a multilevel analysis 83
Table3
Resultsnumberof
greenfi
eldinvestments
Dependent
variable:Num
berof
Greenfield
investments
Ind.
variables(see
Table2forfullnames)
Intercept
only
Random
Intercept
only
Traditio
nalloca-
tiondeterm
inants
Innovatio
ncapabilities
Institu
tional
factors(EATR)
Institu
tional
factors(SCIT)
Random
Slope
(lEMPL
_ALL)
(Intercept)
8.5114
***
11.1154*
**–9.3637
–18.8577
*–15.4733
–20.8843
–23.1302
**
(1.3196)
(2.5277)
(7.3953)
(8.0554)
(12.7921)
(11.5314)
(7.9710)
Tradition
aldeterm
inan
tsnG
DP_P
CnG
DP_P
C–
––0.0006*
–0.0008*
*–0.0007*
–0.0007*
*–0.0007*
**
––
(0.0002)
(0.0002)
(0.0002)
(0.0002)
(0.0002)
lGDP_P
C–
–0.0011
***
0.0011
***
0.0011
***
0.0011
***
0.0010
***
––
(0.0001)
(0.0001)
(0.0001)
(0.0001)
(0.0000)
lGDP_G
R–
––0.0028
–0.0030
–0.0029
–0.0029
–0.0014
––
(0.0055)
(0.0054)
(0.0054)
(0.0054)
(0.0045)
lEMPL_A
LL
––
0.0687
***
0.0696
***
0.0701
***
0.0700
***
0.1009
***
––
(0.0047)
(0.0047)
(0.0047)
(0.0047)
(0.0280)
rINC
––
–0.0002
–0.0003
0.0001
–0.0000
0.0005
––
(0.0005)
(0.0005)
(0.0005)
(0.0005)
(0.0004)
lPOP_D
ENS
––
–0.0004
–0.0016
–0.0015
–0.0015
–0.0003
––
(0.0008)
(0.0008)
(0.0008)
(0.0008)
(0.0007)
Inno
vation
capa
bilities
rEDU
––
–0.7304
**0.6264
**0.6476
**0.3119
*
––
–(0.2333)
(0.2175)
(0.2196)
(0.1385)
lPAT_A
P–
––
–0.0226*
**–0.0225*
**–0.0224*
**–0.0237*
**
––
–(0.0058)
(0.0058)
(0.0058)
(0.0048)
rRNDEX
––
––1.9765*
–2.0409*
–2.0616*
–1.5239*
––
–(0.9431)
(0.9383)
(0.9395)
(0.7661)
K
84 J. Kleineick et al.
Table3
(Contin
ued)
Dependent
variable:Num
berof
Greenfield
investments
Ind.
variables(see
Table2forfullnames)
Intercept
only
Random
Intercept
only
Traditio
nalloca-
tiondeterm
inants
Innovatio
ncapabilities
Institu
tional
factors(EATR)
Institu
tional
factors(SCIT)
Random
Slope
(lEMPL
_ALL)
Institutiona
lfactors
nPST
––
––
9.0046
12.5510
2.7045
––
––
(8.0360)
(7.2325)
(3.8959)
nEATR
––
––
–0.6472
––0.2913
––
––
(0.4994)
–(0.2516)
nSCIT
––
––
––0.3403
–
––
––
–(0.3730)
–
Mod
elstatistics
No.of
obs
1054
1054
1054
1054
1054
1054
1054
No.of
countries
–17
1717
1717
17
AIC
10,915
10,903
10,288
10,264
10,263
10,264
9917
σ2 j0
–53.40499
53.24372
72.72317
40.41071
43.64508
248.24835
σ2 e
–1785.53811
979.66386
949.02155
949.93073
949.98216
657.21298
σ2 j4
––
––
––
0.01173
σu0
4–
––
––
––0.997
*** p<0.001,
**p<0.01,*p<0.05
|σ2=variance,σ=
covariance
K
Multinational investments across Europe: a multilevel analysis 85
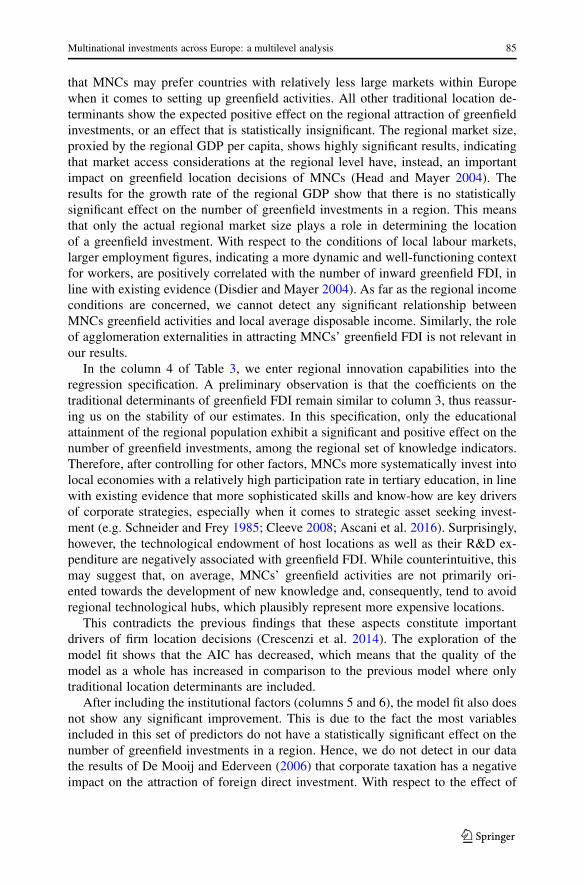
that MNCs may prefer countries with relatively less large markets within Europewhen it comes to setting up greenfield activities. All other traditional location de-terminants show the expected positive effect on the regional attraction of greenfieldinvestments, or an effect that is statistically insignificant. The regional market size,proxied by the regional GDP per capita, shows highly significant results, indicatingthat market access considerations at the regional level have, instead, an importantimpact on greenfield location decisions of MNCs (Head and Mayer 2004). Theresults for the growth rate of the regional GDP show that there is no statisticallysignificant effect on the number of greenfield investments in a region. This meansthat only the actual regional market size plays a role in determining the locationof a greenfield investment. With respect to the conditions of local labour markets,larger employment figures, indicating a more dynamic and well-functioning contextfor workers, are positively correlated with the number of inward greenfield FDI, inline with existing evidence (Disdier and Mayer 2004). As far as the regional incomeconditions are concerned, we cannot detect any significant relationship betweenMNCs greenfield activities and local average disposable income. Similarly, the roleof agglomeration externalities in attracting MNCs’ greenfield FDI is not relevant inour results.
In the column 4 of Table 3, we enter regional innovation capabilities into theregression specification. A preliminary observation is that the coefficients on thetraditional determinants of greenfield FDI remain similar to column 3, thus reassur-ing us on the stability of our estimates. In this specification, only the educationalattainment of the regional population exhibit a significant and positive effect on thenumber of greenfield investments, among the regional set of knowledge indicators.Therefore, after controlling for other factors, MNCs more systematically invest intolocal economies with a relatively high participation rate in tertiary education, in linewith existing evidence that more sophisticated skills and know-how are key driversof corporate strategies, especially when it comes to strategic asset seeking invest-ment (e.g. Schneider and Frey 1985; Cleeve 2008; Ascani et al. 2016). Surprisingly,however, the technological endowment of host locations as well as their R&D ex-penditure are negatively associated with greenfield FDI. While counterintuitive, thismay suggest that, on average, MNCs’ greenfield activities are not primarily ori-ented towards the development of new knowledge and, consequently, tend to avoidregional technological hubs, which plausibly represent more expensive locations.
This contradicts the previous findings that these aspects constitute importantdrivers of firm location decisions (Crescenzi et al. 2014). The exploration of themodel fit shows that the AIC has decreased, which means that the quality of themodel as a whole has increased in comparison to the previous model where onlytraditional location determinants are included.
After including the institutional factors (columns 5 and 6), the model fit also doesnot show any significant improvement. This is due to the fact the most variablesincluded in this set of predictors do not have a statistically significant effect on thenumber of greenfield investments in a region. Hence, we do not detect in our datathe results of De Mooij and Ederveen (2006) that corporate taxation has a negativeimpact on the attraction of foreign direct investment. With respect to the effect of
K
86 J. Kleineick et al.
political stability on the number of greenfield investments, the results indicate thatthere is no statistically significant relation.5
In the last column of Table 3 the results of the random slope model are presented.This model allows the slope of the relationship between the number of employeesand the number of greenfield investments in a region to vary across 17 countries(NUTS 0 regions). The decision to include the number of employees as the randomslope variable is due to the better model fit compared to the random slope modelsthat allow other predictors to vary across NUTS 0 regions. The random slope modelfits the data significantly better than the other multilevel models. This means that theeffect of the number of employees on the number of greenfield investments differsnot only in terms of the average number of greenfield investments (intercept) but alsoin the intensity of the relationship (slope) across countries: in some countries, therelationship between regions with strong employment concentrations and greenfieldinvestments—in other words, agglomeration effects—are stronger than in others.
4.2 Greenfield investments in manufacturing and in the service sector
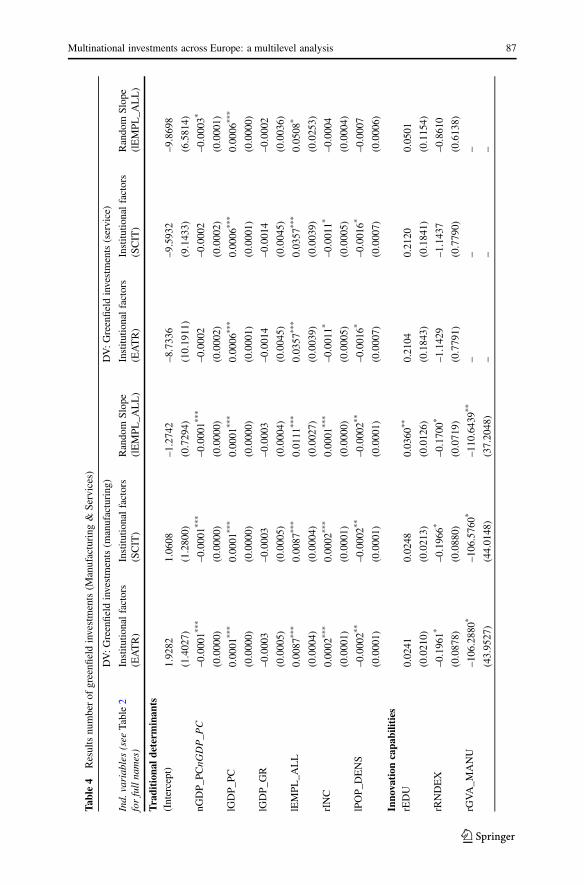
In Table 4 we evaluate whether the location determinants of foreign MNCs differaccording to sectors, by considering greenfield investments in manufacturing andthe service sector. For greenfield FDI in manufacturing the national GDP per capitahas a significant negative effect, thus driving the aggregate results shown in Ta-ble 3. However, the results on the regional GDP per capita suggest that the marketconditions of the specific region of the greenfield investment are important for theMNC strategy. Taken together, we interpret these results as an indication that MNCsprefer regions with good market opportunities in countries with a lower GDP percapita for their greenfield investments in manufacturing activities. These could be,for instance, the case of the most developed regions in the EU periphery, which areknown to be particularly attractive for foreign activities, especially in manufacturing.This interpretation is supported by a number of empirical findings in Petrakos andEconomou (2002), Traistaru et al. (2003), who highlight the process of relocation ofmanufacturing activity within the EU has benefitted capital cities and core regionsin the EU periphery. For greenfield investments in the service sector, instead, weonly detect a positive and statistically significant coefficient on the regional GDPper capita measure, thus, indicating that greenfield investments in this sector tendto locate in regions with larger local market, regardless of the national size of theeconomy. Based on this finding, it can be stated that MNCs tend to locate theirgreenfield investments in the service sector in core regions across the EU, whilegreenfield investments in manufacturing are preferably located in well-developedregions within relatively less advanced countries. With respect to the labour mar-ket conditions, greenfield investments in both business activities show statistically
5 A model including the CPI instead of the corporate income tax is provided in Appendix Table 9. Theresults show a statistically slightly significant negative effect on the number of greenfield investments,suggesting investments are less prevalent in areas with a higher (perceived) corruption levels. The estimatedcoefficients for other variables are barely impacted, but since nGDP is very correlated to the corruptionvariable, it had to be dropped from the analysis to prevent multicollinearity, making those results lessdependable.
K
Multinational investments across Europe: a multilevel analysis 87
Table4
Resultsnumberof
greenfi
eldinvestments(M
anufacturing
&Services)
DV:G
reenfield
investments(m
anufacturing)
DV:G
reenfield
investments(service)
Ind.
variables(see
Table2
forfullnames)
Institu
tionalfactors
(EATR)
Institu
tionalfactors
(SCIT)
Random
Slope
(lEMPL
_ALL)
Institu
tionalfactors
(EATR)
Institu
tionalfactors
(SCIT)
Random
Slope
(lEMPL
_ALL)
Tradition
aldeterm
inan
ts(Intercept)
1.9282
1.0608
–1.2742
–8.7336
–9.5932
–9.8698
(1.4027)
(1.2800)
(0.7294)
(10.1911)
(9.1433)
(6.5814)
nGDP_
PCnG
DP_P
C–0.0001*
**–0.0001*
**–0.0001*
**–0.0002
–0.0002
–0.0003*
(0.0000)
(0.0000)
(0.0000)
(0.0002)
(0.0002)
(0.0001)
lGDP_
PC0.0001
***
0.0001
***
0.0001
***
0.0006
***
0.0006
***
0.0006
***
(0.0000)
(0.0000)
(0.0000)
(0.0001)
(0.0001)
(0.0000)
lGDP_
GR
–0.0003
–0.0003
–0.0003
–0.0014
–0.0014
–0.0002
(0.0005)
(0.0005)
(0.0004)
(0.0045)
(0.0045)
(0.0036)
lEMPL
_ALL
0.0087
***
0.0087
***
0.0111
***
0.0357
***
0.0357
***
0.0508
*
(0.0004)
(0.0004)
(0.0027)
(0.0039)
(0.0039)
(0.0253)
rINC
0.0002
***
0.0002
***
0.0001
***
–0.0011*
–0.0011*
–0.0004
(0.0001)
(0.0001)
(0.0000)
(0.0005)
(0.0005)
(0.0004)
lPOP_
DENS
–0.0002*
*–0.0002*
*–0.0002*
*–0.0016*
–0.0016*
–0.0007
(0.0001)
(0.0001)
(0.0001)
(0.0007)
(0.0007)
(0.0006)
Inno
vation
capa
bilities
rEDU
0.0241
0.0248
0.0360
**0.2104
0.2120
0.0501
(0.0210)
(0.0213)
(0.0126)
(0.1843)
(0.1841)
(0.1154)
rRNDEX
–0.1961*
–0.1966*
–0.1700*
–1.1429
–1.1437
–0.8610
(0.0878)
(0.0880)
(0.0719)
(0.7791)
(0.7790)
(0.6138)
rGVA_M
ANU
–106.2880*
–106.5760*
–110.6439*
*–
––
(43.9527)
(44.0148)
(37.2048)
––
–
K
88 J. Kleineick et al.
Table4
(Contin
ued)
DV:G
reenfield
investments(m
anufacturing)
DV:G
reenfield
investments(service)
Ind.
variables(see
Table2
forfullnames)
Institu
tionalfactors
(EATR)
Institu
tionalfactors
(SCIT)
Random
Slope
(lEMPL
_ALL)
Institu
tionalfactors
(EATR)
Institu
tionalfactors
(SCIT)
Random
Slope
(lEMPL
_ALL)
rGVA_S
ERVICE
––
–586.9248
**591.6746
**430.8056
**
––
–(206.0814)
(205.2312)
(161.9645)
lPAT_A
P–
––
–0.0102*
–0.0102*
–0.0136*
**
––
–(0.0049)
(0.0049)
(0.0039)
Institutiona
lfactors
nPST
–0.1447
0.5666
0.0375
8.0236
8.3079
2.7366
(0.9105)
(0.8428)
(0.3683)
(6.2676)
(5.4851)
(3.0262)
nEATR
–0.1485*
––0.0741*
*0.0010
––0.0017
(0.0561)
–(0.0234)
(0.3951)
–(0.2006)
nSCIT
––0.0973*
––
0.0458
–
–(0.0430)
––
(0.2866)
–
Mod
elstatistics
Noof
obs
1054
1054
1054
1054
1054
1054
Noof.countries
1717
1717
1717
AIC
5063.5771
5064.8347
4783.2896
9869.6497
9869.6240
9449.5240
σ2 j0
0.6455
0.7409
1.9090
22.7989
22.6387
216.3746
σ2 e
6.7885
6.7855
5.01636
654.1343
654.1575
419.6978
σ2 j4
––
0.00011
––
0.0098
σj04
––
–0.995
––
–0.999
*** p<0.001,
**p<0.01,*p<0.05
|σ2=variance,σ=
covariance
K
Multinational investments across Europe: a multilevel analysis 89
significant positive results for the effect of regional employment, indicating thatMNCs prefer those regions where the employment rate is relatively high. However,this findings hold across specification for the manufacturing regressions, while ittends to lose statistical relevance in the case of services. Overall, we interpret thisas evidence that MNCs are attracted to locations with well-functioning local labourmarkets, especially as far as manufacturing operations are concerned. Another im-portant difference emerging from the sectoral analysis regard the role of paid wagesin a region, proxied by disposable income. In fact, while MNCs setting up foreigngreenfield activities in manufacturing are pulled to locations with higher wages, thusplausibly privileging more productive labour (c.f. Guimaraes et al. 2000; Defever2006), in the case of services we find (weak) evidence that MNCs adopt a moreefficiency-seeking strategy by locating in places with lower salaries (Dunning andLundan 2008).
Contrarily to expectations, investment projects in both manufacturing and servicestend to be overall located in regions where the population density is lower, referringto less urbanised regions that are associated with lower land costs, fundamentally inline, once again, with a type of efficiency seeking rationale.
With respect to the innovation capabilities of regions some differences emergedepending on the main sector of economic activity of the MNC investment. Theeducational attainment of the local labour force has a significant and positive effectonly in one specification regarding manufacturing activity (i.e. model with randomslope), while it remains insignificant in the other regressions. Similarly, R&D ex-penditure is significant and negative only for manufacturing investment. These setof results, on average, signal that the MNCs in our data are not systematically un-dertaking strategic asset-seeking FDI, and therefore the knowledge-related featureof the regional economy do not matter for their greenfield activities.
Institutional factors are also included in this empirical exercise. For greenfieldinvestments of both types of business activities the results suggest that this set ofexplanatory factors does not influence the number of investment projects, with theexception of taxation levels, that in the case of manufacturing activity representa clear detrimental factor that discourages MNCs’ investment, in line the extantevidence (Voget 2011).
It is worth noting that, gain, the random slope models, estimated for greenfieldinvestments in both business activities, significantly improves the model fit.
4.3 The regional attraction of M&A projects
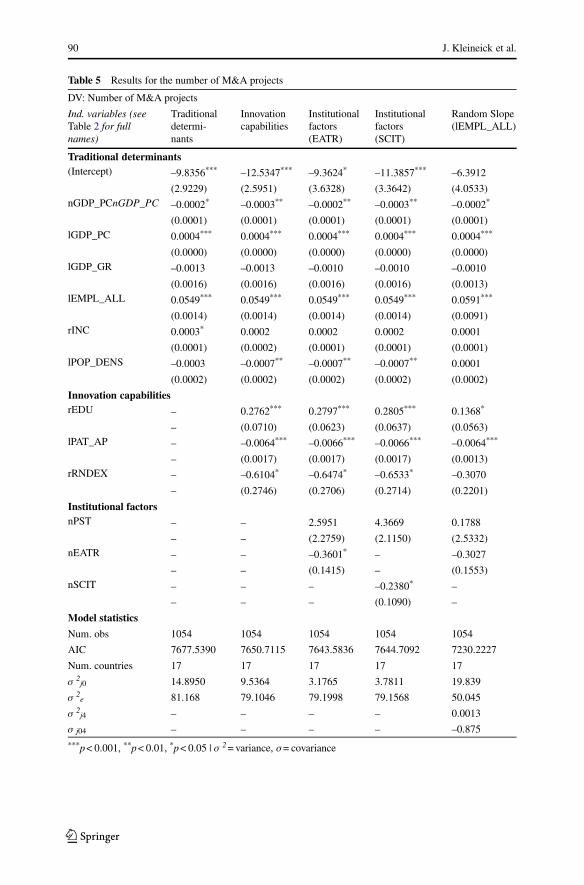
Given their inherently different nature, it is possible that the MNCs’ strategiesgoverning greenfield FDI differ from the location decisions behind M&A projects(Bertrand et al. 2007). Therefore, we perform the same empirical analysis for thecase of M&A. Table 5, nevertheless, shows that the location determinants of MNCsactivity do not differ much across entry modes. In fact, our results suggest thatM&A follow a similar pattern to greenfield FDI, suggesting that the choice of theentry mode of foreign MNCs does not strongly depend on the attributes of thelocations available. It is plausible that this choice instead is more dependent onindividual company features, as indicated by several studies (Nocke and Yeaple
K
90 J. Kleineick et al.
Table 5 Results for the number of M&A projects
DV: Number of M&A projects
Ind. variables (seeTable 2 for fullnames)
Traditionaldetermi-nants
Innovationcapabilities
Institutionalfactors(EATR)
Institutionalfactors(SCIT)
Random Slope(lEMPL_ALL)
Traditional determinants(Intercept) –9.8356*** –12.5347*** –9.3624* –11.3857*** –6.3912
Multinational investments across Europe: a multilevel analysis 91
2007; Guadalupe et al. 2012). Overall, the pattern of localisation that we detectfor the case of M&As reflect corporate strategies oriented towards the access oflocalised markets of core regions within countries that are economically peripheralwithin the EU, as indicated by the persistent positive sign on regional GDP percapita and the negative sign on the national GDP per capita variable. Invariably,a well-functioning the local labour market and the presence of a suitable workforcerepresent a key pull factor for investment (Crescenzi et al. 2014), while, similar tothe above results, we cannot find univocal evidence that more developed regionalinnovation capabilities constitute a positive determinant of M&As. In fact, withthe exception of an educated workforce, that is still positively evaluated by foreigncapital investors, the regional stock of knowledge captured by patents as well asthe local expenditure in R&D seem to be detrimental for the attraction of foreigninvestment. This could be the case if, on average, the rationale of most M&As inour dataset is market-seeking or efficiency-seeking, rather than directed towards theaccess of specific capabilities or knowledge bases (Guadalupe et al. 2012; Ascani2018). In this sense, foreign MNCs may prefer less expensive locations, where itis plausible that the frequency of activities oriented towards the generation of newtechnologies are far from being relevant. The efficiency-seeking character of theseinvestment decisions is also supported by the negative, yet weak, coefficients on thevariables capturing the taxation level of alternative locations. This also representsthe main difference with the case of aggregate greenfield activities examined above,where the relationship between the location choice and taxation was not statisticallysignificant. Since M&A projects frequently have an efficiency seeking motive (Neary2004), these findings are in line with the expectation that MNCs tend to cherry-picklocations with cost-advantages.
Finally, a random slope variable is introduced in the equation. The results arepresented in the last column of Table 5. The AIC has decreased substantially, whichmeans that the model fits the data better compared to the random intercept models.
4.4 M&A projects in manufacturing and in the service sector
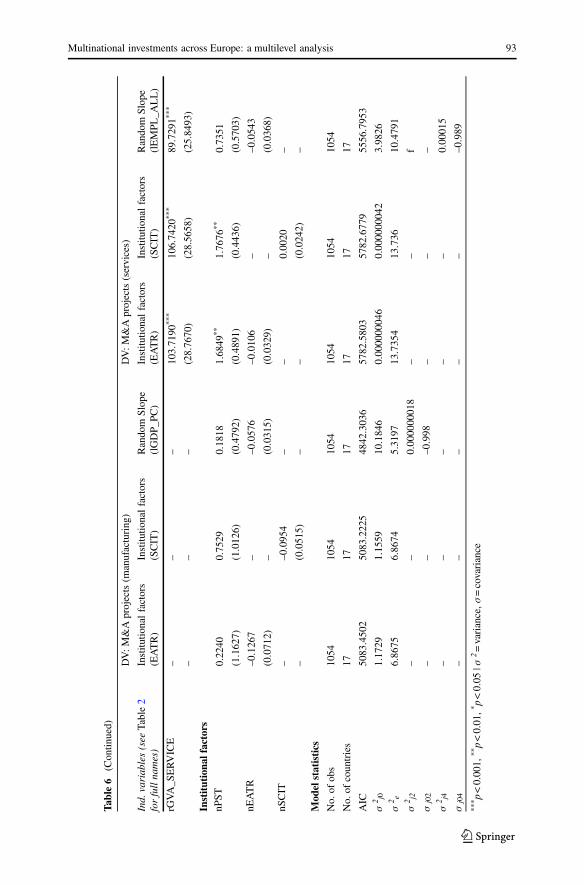
In Table 6 we present the results for the M&A location choice analysis split by sector.While the general trends identified above are also reflected in this set of results, somedifferences emerge across sectors of economic activity. Starting with the similarities,for M&As in both manufacturing and service the national market size weakly suggestthat MNCs locate in countries that exhibit relatively lower GDP, in line with theaggregate results, thus potentially indicating that most corporate activities move tothe periphery of the EU. On the contrary, for both business activities the regionalGDP per capita has a significant positive effect, corroborating the existing evidencethat the regional market size is highly valued by MNCs for their M&A projects. Thisis in line with the results of Brakman et al. (2007) who have concluded that especiallyhorizontal investments frequently have a market-seeking motive. Also, MNCs favourlocations with a higher employment rate since it reflects a larger endowment ofavailable labour force (Disdier and Mayer 2004). Regarding the differences acrosssectors, instead, we find mixed evidence on the average disposable income as a proxyfor the wages paid in a region, as this is clearly negative in the case of services while
K
92 J. Kleineick et al.
Table6
Resultsnumberof
M&Aprojects(M
anufacturing
&Service)
DV:M
&Aprojects(m
anufacturing)
DV:M
&Aprojects(services)
Ind.
variables(see
Table2
forfullnames)
Institu
tionalfactors
(EATR)
Institu
tionalfactors
(SCIT)
Random
Slope
(lGDP_
PC)
Institu
tionalfactors
(EATR)
Institu
tionalfactors
(SCIT)
Random
Slope
(lEMPL
_ALL)
Tradition
aldeterm
inan
ts(Intercept)
–0.3475
–0.8368
0.9694
–3.7881*
**–3.9562*
**–2.2414*
(1.7644)
(1.5134)
(1.1753)
(0.9109)
(0.8657)
(1.1096)
nGDP_
PCnG
DP_P
C–0.0001
–0.0001*
–0.0001*
–0.0001*
–0.0001*
–0.0001*
(0.0000)
(0.0000)
(0.0000)
(0.0000)
(0.0000)
(0.0000)
lGDP_
PC0.0001
***
0.0001
***
0.0001
*0.0002
***
0.0002
***
0.0002
***
(0.0000)
(0.0000)
(0.0000)
(0.0000)
(0.0000)
(0.0000)
lGDP_
GR
–0.0000
–0.0000
–0.0001
–0.0004
–0.0004
–0.0003
(0.0005)
(0.0005)
(0.0004)
(0.0007)
(0.0007)
(0.0006)
lEMPL
_ALL
0.0148
***
0.0148
***
0.0148
***
0.0151
***
0.0150
***
0.0161
***
(0.0004)
(0.0004)
(0.0004)
(0.0006)
(0.0006)
(0.0032)
rINC
0.0002
***
0.0002
***
–0.0001*
*–0.0002*
*–0.0002*
**–0.0002*
*
(0.0001)
(0.0001)
(0.0000)
(0.0001)
(0.0001)
(0.0001)
lPOP_
DENS
–0.0006*
**–0.0006*
**–0.0004*
**–0.0000
–0.0000
0.0001
(0.0001)
(0.0001)
(0.0001)
(0.0001)
(0.0001)
(0.0001)
Inno
vation
capa
bilities
rEDU
0.0188
0.0192
0.0351
*0.0643
***
0.0652
***
0.0356
(0.0225)
(0.0224)
(0.0141)
(0.0194)
(0.0194)
(0.0200)
lPAT_A
P–
––
–0.0020*
*–0.0019*
*–0.0025*
**
––
–(0.0007)
(0.0007)
(0.0006)
rRNDEX
–0.2638*
*–0.2644*
*–0.1645*
–0.1670
–0.1688
–0.1169
(0.0894)
(0.0893)
(0.0748)
(0.1089)
(0.1089)
(0.0977)
rGVA_M
ANU
77.7610
77.3767
174.9382
***
––
–
(44.4215)
(44.4282)
(39.9165)
––
–
K
Multinational investments across Europe: a multilevel analysis 93
Table6
(Contin
ued)
DV:M
&Aprojects(m
anufacturing)
DV:M
&Aprojects(services)
Ind.
variables(see
Table2
forfullnames)
Institu
tionalfactors
(EATR)
Institu
tionalfactors
(SCIT)
Random
Slope
(lGDP_
PC)
Institu
tionalfactors
(EATR)
Institu
tionalfactors
(SCIT)
Random
Slope
(lEMPL
_ALL)
rGVA_S
ERVICE
––
–103.7190
***
106.7420
***
89.7291*
**
––
–(28.7670)
(28.5658)
(25.8493)
Institutiona
lfactors
nPST
0.2240
0.7529
0.1818
1.6849
**1.7676
**0.7351
(1.1627)
(1.0126)
(0.4792)
(0.4891)
(0.4436)
(0.5703)
nEATR
–0.1267
––0.0576
–0.0106
––0.0543
(0.0712)
–(0.0315)
(0.0329)
–(0.0368)
nSCIT
––0.0954
––
0.0020
–
–(0.0515)
––
(0.0242)
–
Mod
elstatistics
No.
ofobs
1054
1054
1054
1054
1054
1054
No.
ofcountries
1717
1717
1717
AIC
5083.4502
5083.2225
4842.3036
5782.5803
5782.6779
5556.7953
σ2 j0
1.1729
1.1559
10.1846
0.000000046
0.000000042
3.9826
σ2 e
6.8675
6.8674
5.3197
13.7354
13.736
10.4791
σ2 j2
––
0.000000018
––
f
σj02
––
–0.998
––
–
σ2 j4
––
––
–0.00015
σj04
––
––
––0.989
*** p<0.001,
**p<0.01,*p<0.05
|σ2=variance,σ=
covariance
K
94 J. Kleineick et al.
ambiguous results emerge for the case of manufacturing. Nevertheless, consideringthat the random slope specification in column 3 delivers better estimates accordingto the AIC, we tend to consider this as our preferred specification. Therefore, theseset of results support, again, the efficiency-seeking nature of most MNCs investmentby M&As, in line with the idea that the cost-reducing rationale is a strong elementin the corporate strategies of these actors (Gereffi and Korzeniewicz 1994). Ourresults also suggest that existence of heterogeneous preferences of MNCs regardingurban agglomerations, as the population density variable exhibits a negative andstatistically significant coefficient in the case of manufacturing, signalling that theseactivities tend to locate in less urbanised areas where the land costs are lower, whileit remains non-significant for services.
With respect to the effect of regional innovation capabilities, the results of therandom slope model suggest that, controlling for a varying effect of the regionalmarket size across countries, the educational attainment and the sectoral GVA havea statistically significant effect on the number of investment projects in manufactur-ing, although the statistical relevance of the educational variable remains weak. Forservices, instead, while the sector GVA is also an important determinant of locationchoice, the educational level of the regional population remains insignificant in therandom slope model, signalling that tertiary activities may not be dependent on thistype of factor. Potentially, these are not high value added service activities for whichspecific skills are requested. Regarding the other variables, results remain similarto those presented above in the aggregate analysis. Overall, we find evidence thatM&A activities also respond to a marked market access rationale, especially at theregional level, and that also efficiency-seeking motives play a substantial role inshaping the patterns of MNCs’ investment, especially as far as manufacturing activ-ities are concerned. This is in line with the evidence that the location of Europeanmanufacturing has experiences a long shift towards locations offering a strongercost-advantage (Traistaru et al. 2003).
5 Conclusion
In this study we explored the location determinants of European MNCs’ investmentprojects in the countries of the EU by means of a quantitative multilevel analysisfocusing on both regional and national pull factors, thus accounting for the hierar-chical structure of the data and business dynamics. In so doing, we incorporatedand built on the main findings of the previous literature, by accounting for threemain sets of locational factors, namely: traditional drivers of FDI, knowledge-basedregional factors and the features of the institutional context. Moreover, in order toprovide a detailed analysis, FDI projects are also distinguished based on their en-try mode (i.e. greenfield investments and M&A). In order to test the sensitivity ofMNCs choices to sectoral dynamics we also considered the changing compositionof FDI in Europe by differentiating between manufacturing and service activities.
We identify a plethora of original results that only partially reflect existing empir-ical evidence and to some extent they expand the understanding of MNCs locationstrategies in new directions. The main results suggest that there are no major dif-
K
Multinational investments across Europe: a multilevel analysis 95
ferences in the location determinants of greenfield FDI and M&A projects withinEurope, as both types of foreign investment seems to be market-seeking and effi-ciency-seeking in nature. Contrary to the findings of Basile (2004) who concludesthat the location determinants of FDI differ according to the entry mode and to thehypothesis of Bertrand et al. (2007) who state that it is not reasonable to assume thatthe location determinants of greenfield investments and M&As are identical, our re-sults indicate the differences in the role of location determinants are minimal. Morespecifically, with respect to the traditional location determinants, MNCs seem tovalue a relatively larger regional market size, indicating that FDI is mostly attractedto economically “core” regions (Crescenzi et al. 2014). This is also supported bythe results with respect to the labour market conditions since FDI projects are con-centrated in regions where the employment rate and, consequently, the functioningof the local labour market is relatively efficient. However, the level of urbanisation,associated with land costs tends to discourage foreign MNCs, especially in manufac-turing activities, as these type of activities might not necessarily need urbanisationexternalities to thrive.
Regarding regional innovation capabilities, the results show that MNCs systemat-ically prefer locations endowed with a relatively highly educated population for theirinternational activities, as this is the case of greenfield FDI in manufacturing andM&As in tertiary activities mainly. Nonetheless, the more technologically-orientedfeatures of regional economies, such as their patent stock and their expenditure inR&D, are negatively correlated with foreign investment. This may support a view ofMNCs’ internationalisation in our data oriented towards a cost-reducing approach,whereby the most technologically advanced regions are not affordable locations formost foreign investment activities. Considering also that the main and most stableresult of the analysis indicates that market access considerations are important, wecan rule out that the search for novel knowledge capabilities guide the locationbehaviour of MNCs in our sample.
As far as the institutional dimension is concerned, the analysis provides someevidence that the effective average tax rate has a negative impact on the numberof investment projects, in line with the cost reducing motivation of foreign directinvestment projects. Political stability and government corruption both seem not todetermine the location of MNCs within Europe, probably due to the low variationof these institutional features within the EU.
Considering these articulated results, policy making aimed at attracting FDI, in theform of both greenfield projects and M&A, should primarily reinforce the regionaleconomic system in terms of market opportunities, quality of the local labour forceand functioning of the regional labour markets, as this emerge as the crucial spatialscale for successfully attracting MNCs. Importantly, this focus on the features ofthe local economy should lead to the attraction of specific inward FDI projectsthat can match the regional economic structure in terms of competences and inter-firm linkages, in order to generate additional local economic effects, as suggested byrecent empirical evidence (Ascani et al. 2019). It is also fundamental to consider thatthe advantages of core European regions over disadvantaged locations could increaseas a result of the stronger capacity of the former to attract MNCs. These dynamicscan occur both between and within countries. Therefore, considering the location
K
96 J. Kleineick et al.
determinants of FDI in a regional perspective, thus opening the black box of countrylevel analyses, paves the way for policy measures at national (or supranational) scaletargeted at reinforcing the profile of specific lagging behind locations in participatingin global production.
Author Contribution Kleineick gathered and analysed the data. He also wrote the draft paper underguidance of Smit. Ascani rewrote and severely abridged the paper; he also undertook most of the revision.Smit finalized the paper and ran the analyses in the revision stage. All authors read and approved the finalmanuscript.
Funding Open Access funding provided by Utrecht University.
Open Access This article is licensed under a Creative Commons Attribution 4.0 International License,which permits use, sharing, adaptation, distribution and reproduction in any medium or format, as long asyou give appropriate credit to the original author(s) and the source, provide a link to the Creative Com-mons licence, and indicate if changes were made. The images or other third party material in this articleare included in the article’s Creative Commons licence, unless indicated otherwise in a credit line to thematerial. If material is not included in the article’s Creative Commons licence and your intended use is notpermitted by statutory regulation or exceeds the permitted use, you will need to obtain permission directlyfrom the copyright holder. To view a copy of this licence, visit http://creativecommons.org/licenses/by/4.0/.
Appendix
Table 7 Variable definition and source
Set offactors
Variable Proxy SpatialUnits
Data (year)
Dependent:Foreignsub-sidiariesofMNCs
Locationdecision ofGreenfieldprojects
Number of Greenfield projects a NUTS3 Amadeus(2012–2017)
Number of employees (greenfieldprojects)a
NUTS3 Amadeus(2012–2017)
Locationdecision ofMerge &Acquisitionprojects
Number of M&A projectsa NUTS3 Amadeus(2012–2017)
Number of employees (M&As)a NUTS3 Amadeus(2012–2017)
Traditionallocationfactors
Nationalmarket size
GDP per capita NUTS0 Eurostat (2015)[med_ec1]
Regionalmarket size
Regional GDP per capita at currentprice
NUTS3 Eurostat (2015)[nama_10r_3gdp]
Regionalmarket poten-tial
Regional GDP growth at currentprice (percentage change on previ-ous year)
NUTS3 Eurostat(2014/2015)[nama_10r_3gdp]
Regional(un-)employment
Total Regional Employmentper 1000 persons (age class:15–74 years)a
NUTS3 Eurostat (2014)b
[nama_10r_3empers]
Labour costs Disposable income per capita NUTS2 Eurostat (2014)b
Multinational investments across Europe: a multilevel analysis 97
Table 7 (Continued)
Set offactors
Variable Proxy SpatialUnits
Data (year)
Innovationcapabili-ties
Human Capi-tal
Participation rate in tertiary ed-ucation (level 5–8; age class:25–64 years)
NUTS2 Eurostat (2015)[edat_lfse_04]
Regionalinnovativedynamism
Patent applications to the EPO permillion inhabitants
NUTS3 Eurostat (2011)b
[pat_ep_rtot]
Instrumental R&D expenditure perinhabitant (in Euro)
NUTS2 Eurostat (2013)b
[rd_e_gerdreg]
Regionalproductivity
Gross Value Addeda NUTS3 Eurostat (2014)b
[nama_10r_3gva]Institutionalfactors
Governmentcorruption
Corruption Perception Index NUTS0 TransparencyInternational(2017)
PoliticalStability
Political Stability and Absence ofViolence/Terrorism Index
NUTS0 World Bank(2016)
Taxation Statutory corporate income tax rate NUTS0 Spengel et al.(2017)
Effective average tax rate NUTS0 Spengel et al.(2017)
aVariable specified for NACE Rev.2 classes (total, manufacturing and service sector)bAll Eurostat data can be accessed by dataset name from https://ec.europa.eu/eurostat/data/database
Table 8 Sectors included
Business activity NACE Rev. 2 Description
Manufacturing B, C, D & E Manufacturing, mining and quarrying and other industry
F ConstructionService K Financial and insurance activities
M & N Professional, scientific, technical, administration and supportactivities
Multinational investments across Europe: a multilevel analysis 99
Table 10 Results regional Patent Intensity. See Table 2 for full names of variables
Model 1 Model 2
(Intercept) 1.9665 –0.4746
(1.5018) (1.7798)
Traditional determinantsnGDP_PC –0.0001*** –0.0000
(0.0000) (0.0000)lGDP_PC 0.0001*** 0.0001***
(0.0000) (0.0000)lGDP_GR –0.0003 –0.0000
(0.0005) (0.0005)lEMPL_ALL 0.0089*** 0.0148***
(0.0004) (0.0004)rINC 0.0002*** 0.0003***
(0.0000) (0.0000)lPOP_DENS –0.0002** –0.0006***
(0.0001) (0.0001)
Innovation capabilitiesrEDU 0.0310 0.0060
(0.0206) (0.0218)lPAT_AP –0.0030*** –0.0013**
(0.0005) (0.0005)rRNDEX –0.1738* –0.1371
(0.0794) (0.0815)
Institutional factorsnPST –0.3787 0.2720
(0.9805) (1.1730)nEATR –0.1518* –0.1421
(0.0602) (0.0718)
AIC 5031.6851 5079.1405
BIC 5101.1299 5148.5853
Log Likelihood –2501.8425 –2525.5702
Num. obs 1054 1054
Num. groups 17 17***p< 0.001, **p< 0.01, *p< 0.05
K
100 J. Kleineick et al.
Table11
Robustnesschecks.S
eeTable2forfullnames
ofvariables
Greenfield
Mergers&
Acquisitio
ns
Base(asin
Table3,
col.5)
Tim
elags
aOmitting
rINC
Omittingcapi-
tals
Base(asin
Table5,
col.5)
Tim
elags
aOmitting
rINC
Omittingcapi-
tals
(Intercept)
–15.4733
–12.1672
–15.3820
–7.3157
–9.3624*
–7.9189*
–9.0121*
–6.2916*
(12.7921)
(12.1541)
(12.7918)
(5.1130)
(3.6328)
(3.6802)
(3.6196)
(3.1939)
nGDP_P
C–0.0007*
–0.0007*
–0.0007*
–0.0000
–0.0002*
*–0.0002*
*–0.0002*
*0.0000
(0.0002)
(0.0002)
(0.0002)
(0.0001)
(0.0001)
(0.0001)
(0.0001)
(0.0001)
lGDP_P
C0.0011
***
0.0011
***
0.0011
***
0.0001
***
0.0004
***
0.0004
***
0.0004
***
0.0001
***
(0.0001)
(0.0001)
(0.0001)
(0.0000)
(0.0000)
(0.0000)
(0.0000)
(0.0000)
lGDP_G
R–0.0029
–0.0032
–0.0029
–0.0004
–0.0010
–0.0011
–0.0009
0.0002
(0.0054)
(0.0055)
(0.0054)
(0.0018)
(0.0016)
(0.0016)
(0.0016)
(0.0010)
lEMPL_A
LL
0.0701
***
0.0689
***
0.0701
***
0.0537
***
0.0549
***
0.0545
***
0.0547
***
0.0494
***
(0.0047)
(0.0048)
(0.0047)
(0.0021)
(0.0014)
(0.0014)
(0.0014)
(0.0012)
rINC
0.0001
0.0001
–0.0005
*0.0002
0.0002
–0.0003
*
(0.0005)
(0.0005)
–(0.0002)
(0.0001)
(0.0001)
–(0.0001)
lPOP_D
ENS
–0.0015
–0.0012
–0.0015
0.0005
–0.0007*
*–0.0006*
*–0.0007*
*–0.0002
(0.0008)
(0.0008)
(0.0008)
(0.0004)
(0.0002)
(0.0002)
(0.0002)
(0.0002)
rEDU
0.6264
**0.5892
**0.6350
**0.1834
*0.2797
***
0.2808
***
0.3115
***
0.1260
**
(0.2175)
(0.2087)
(0.2045)
(0.0787)
(0.0623)
(0.0619)
(0.0587)
(0.0477)
K
Multinational investments across Europe: a multilevel analysis 101
Table11
(Contin
ued)
Greenfield
Mergers&
Acquisitio
ns
Base(asin
Table3,
col.5)
Tim
elags
aOmitting
rINC
Omittingcapi-
tals
Base(asin
Table5,
col.5)
Tim
elags
aOmitting
rINC
Omittingcapi-
tals
lPAT_A
P–0.0225*
**–0.0239*
**–0.0224*
**–0.0034
–0.0066*
**–0.0070*
**–0.0062*
**–0.0014
(0.0058)
(0.0058)
(0.0057)
(0.0020)
(0.0017)
(0.0017)
(0.0017)
(0.0012)
rRNDEX
–2.0409*
–1.5067
–2.0357*
–0.3774
–0.6474*
–0.5194*
–0.6201*
–0.1060
(0.9383)
(0.7907)
(0.9362)
(0.3106)
(0.2706)
(0.2299)
(0.2702)
(0.1853)
nPST
9.0046
6.8062
9.0245
2.4295
2.5951
1.6918
2.7460
0.6514
(8.0360)
(7.6013)
(8.0464)
(3.2881)
(2.2759)
(2.3173)
(2.2691)
(2.0641)
nEATR
–0.6472
–0.7813
–0.6332
–0.5192*
–0.3601*
–0.3997*
–0.2987*
–0.3254*
(0.4994)
(0.4727)
(0.4806)
(0.2035)
(0.1415)
(0.1439)
(0.1355)
(0.1275)
AIC
10,262.7177
10,285.6607
10,260.7287
7700.2034
7643.5836
7680.4257
7643.9496
6632.6878
BIC
10,332.1626
10,355.1055
10,325.2132
7769.3394
7713.0285
7749.8705
7708.4341
6701.8238
Log
Likeli-
hood
–5117.3589
–5128.8303
–5117.3643
–3836.1017
–3807.7918
–3826.2128
–3808.9748
–3302.3439
Num
.obs
1054
1054
1054
1031
1054
1054
1054
1031
Num
.groups
1717
1717
1717
1717
*** p<0.001,
**p<0.01,*p<0.05
a Inthesetworegressions,values
pertaining
to2014
areused
forlGDP_P
C,rINCandrR
NDEX
K
102 J. Kleineick et al.
Table12
Correlatio
ntable.SeeTable2forfullnames
ofvariables
(1)
(2)
(3)
(4)
(5)
(6)
(7)
(8)
(9)
(10)
(11)
(12)
(13)
(14)
(15)
(16)
(17)
(18)
(19)
(20)
(21)
(22)
(23)
(24)
(25)
(26)
(1)
GI_MANU
10.61
0.54
00.53
0.51
0.38
–0.04
0.36
0.7
0.77
–0.08
–0.15
–0.09
–0.05
0.78
0.8
–0.16
0.25
–0.05
0.43
0.11
0.14
–0.06
–0.01
–0.02
(2)
GI_SE
RVIC
E0.61
10.3
–0.01
0.47
0.46
0.17
0.01
0.27
0.34
0.75
0.05
–0.07
0.06
0.02
0.96
0.58
–0.07
0.24
–0.03
0.37
0.12
0.14
–0.01
0.02
0
(3)
lEMPL_A
LL
0.54
0.3
10.01
0.11
0.12
0.74
–0.01
0.27
0.73
0.58
–0.17
–0.02
–0.12
–0.18
0.43
0.73
–0.05
0.18
–0.16
0.08
–0.07
–0.06
–0.08
0.01
–0.01
(4)
lGDP_G
R0
–0.01
0.01
10
00
–0.01
–0.01
0.02
–0.01
–0.04
0.01
–0.02
–0.05
–0.01
00.01
0–0
.03
–0.01
–0.01
–0.01
–0.02
–0.03
–0.05
(5)
lGDP_P
C0.53
0.47
0.11
01
10.21
0.23
0.49
0.3
0.64
0.32
0.09
0.36
0.04
0.54
0.52
0.04
0.43
0.31
0.72
0.52
0.56
0.25
0.21
0.18
(6)
lGDP_P
C14
0.51
0.46
0.12
01
10.23
0.26
0.47
0.29
0.62
0.33
0.12
0.37
0.06
0.53
0.51
0.08
0.4
0.34
0.7
0.54
0.57
0.28
0.23
0.2
(7)
lGVA
_MANU
0.38
0.17
0.74
00.21
0.23
10.24
0.08
0.65
0.39
–0.06
0.07
0.01
–0.06
0.26
0.54
0.05
0.12
0.18
0.07
0.12
0.12
0.19
0.21
0.18
(8)
lPAT_A
P–0
.04
0.01
–0.01
–0.01
0.23
0.26
0.24
10
–0.04
0.03
0.28
0.22
0.24
0.23
00
0.23
0.06
0.54
0.12
0.43
0.41
0.68
0.42
0.36
(9)
lPOP_D
ENS
0.36
0.27
0.27
–0.01
0.49
0.47
0.08
01
0.2
0.47
0.16
–0.08
0.15
–0.12
0.34
0.41
–0.14
0.46
–0.05
0.57
0.22
0.26
–0.03
–0.04
–0.06
(10)
MA_M
ANU
0.7
0.34
0.73
0.02
0.3
0.29
0.65
–0.04
0.2
10.65
–0.13
–0.14
–0.08
–0.13
0.5
0.84
–0.17
0.25
–0.07
0.24
00.02
–0.09
0–0
.03
(11)
MA_S
ervice
0.77
0.75
0.58
–0.01
0.64
0.62
0.39
0.03
0.47
0.65
10.05
–0.08
0.07
–0.05
0.85
0.93
–0.11
0.39
–0.03
0.5
0.17
0.2
–0.01
0.05
0.03
(12)
nCOR
–0.08
0.05
–0.17
–0.04
0.32
0.33
–0.06
0.28
0.16
–0.13
0.05
10.29
0.88
0.34
0.02
–0.01
0.25
0.49
0.54
0.26
0.54
0.56
0.46
0.36
0.33
(13)
nEATR
–0.15
–0.07
–0.02
0.01
0.09
0.12
0.07
0.22
–0.08
–0.14
–0.08
0.29
10.34
–0.24
–0.1
–0.11
0.96
00.31
0.05
0.53
0.5
0.35
0.23
0.24
(14)
nGDP_P
C–0
.09
0.06
–0.12
–0.02
0.36
0.37
0.01
0.24
0.15
–0.08
0.07
0.88
0.34
10.15
0.03
0.02
0.24
0.47
0.52
0.31
0.59
0.63
0.42
0.33
0.31
(15)
nPST
–0.05
0.02
–0.18
–0.05
0.04
0.06
–0.06
0.23
–0.12
–0.13
–0.05
0.34
–0.24
0.15
10
–0.09
–0.06
–0.13
0.39
–0.05
0.13
0.13
0.35
0.21
0.17
(16)
Nr_GI
0.78
0.96
0.43
–0.01
0.54
0.53
0.26
00.34
0.5
0.85
0.02
–0.1
0.03
01
0.74
–0.1
0.28
–0.04
0.43
0.14
0.16
–0.02
0.02
0.01
(17)
Nr_MA
0.8
0.58
0.73
00.52
0.51
0.54
00.41
0.84
0.93
–0.01
–0.11
0.02
–0.09
0.74
1–0
.14
0.37
–0.05
0.42
0.11
0.14
–0.03
0.04
0.02
(18)
nSCIT
–0.16
–0.07
–0.05
0.01
0.04
0.08
0.05
0.23
–0.14
–0.17
–0.11
0.25
0.96
0.24
–0.06
–0.1
–0.14
1–0
.09
0.3
–0.01
0.47
0.43
0.36
0.23
0.24
(19)
rEDU
0.25
0.24
0.18
00.43
0.4
0.12
0.06
0.46
0.25
0.39
0.49
00.47
–0.13
0.28
0.37
–0.09
10.12
0.55
0.29
0.36
0.13
0.29
0.21
(20)
rGVA
_MANU
–0.05
–0.03
–0.16
–0.03
0.31
0.34
0.18
0.54
–0.05
–0.07
–0.03
0.54
0.31
0.52
0.39
–0.04
–0.05
0.3
0.12
10.2
0.71
0.69
0.81
0.6
0.54
(21)
rGVA
_SERVIC
E0.43
0.37
0.08
–0.01
0.72
0.7
0.07
0.12
0.57
0.24
0.5
0.26
0.05
0.31
–0.05
0.43
0.42
–0.01
0.55
0.2
10.59
0.64
0.19
0.18
0.15
(22)
rINC
0.11
0.12
–0.07
–0.01
0.52
0.54
0.12
0.43
0.22
00.17
0.54
0.53
0.59
0.13
0.14
0.11
0.47
0.29
0.71
0.59
10.99
0.67
0.44
0.4
(23)
rINC20
140.14
0.14
–0.06
–0.01
0.56
0.57
0.12
0.41
0.26
0.02
0.2
0.56
0.5
0.63
0.13
0.16
0.14
0.43
0.36
0.69
0.64
0.99
10.65
0.44
0.4
(24)
rPAT_A
P–0
.06
–0.01
–0.08
–0.02
0.25
0.28
0.19
0.68
–0.03
–0.09
–0.01
0.46
0.35
0.42
0.35
–0.02
–0.03
0.36
0.13
0.81
0.19
0.67
0.65
10.63
0.54
(25)
rRNDEX
–0.01
0.02
0.01
–0.03
0.21
0.23
0.21
0.42
–0.04
00.05
0.36
0.23
0.33
0.21
0.02
0.04
0.23
0.29
0.6
0.18
0.44
0.44
0.63
10.93
(26)
rRNDEX14
–0.02
0–0
.01
–0.05
0.18
0.2
0.18
0.36
–0.06
–0.03
0.03
0.33
0.24
0.31
0.17
0.01
0.02
0.24
0.21
0.54
0.15
0.4
0.4
0.54
0.93
1
K
Multinational investments across Europe: a multilevel analysis 103
References
Andersson U, Johanson J, Vahlne JE (1997) Organic acquisitions in the internationalization process of thebusiness firm. Manag Int Rev 37:67–84
Ang JB (2008) Determinants of foreign direct investment in Malaysia. J Policy Model 30(1):185–189Ascani A (2018) The takeover selection decisions of multinational enterprises: empirical evidence from
European target firms. J Econ Geogr 18(6):1227–1252Ascani A, Gagliardi L (2015) Inward FDI and local innovative performance. An empirical investigation on
Italian provinces. Rev Reg Res 35:29–47Ascani A, Balland PA, Morrison A (2019) Heterogeneous foreign direct investment and local innovation
in Italian provinces. Struct Chang Econ Dyn. https://doi.org/10.1016/j.strueco.2019.06.004Ascani A, Crescenzi R, Iammarino S (2016) Economic institutions and the location strategies of European
multinationals in their geographic neighbourhood. Econ Geog 92(4):401–429Asiedu E (2006) Foreign direct investment in Africa: The role of natural resources, market size, govern-
ment policy, institutions and political instability. World Econ 29(1):63–77Bartik T (1985) Business location decisions in the United States: Estimates of the effects of unionization,
taxes, and other characteristics of states. J Bus Econ Stat 3:14–22Basile R (2004) Acquisition versus greenfield investment: the location of foreign manufacturers in Italy.
Reg Sci Urban Econ 34(1):3–25Basile R, Castellani D, Zanfei A (2008) Location choices of multinational firms in Europe: the role of EU
cohesion policy. J Int Econ 74(2):328–340Becker J, Fuest C (2011) Tax competition—Greenfield investment versus mergers and acquisitions. Reg
Sci Urban Econ 41(5):476–486Bellak C, Leibrecht M (2009) Do low corporate income tax rates affect FDI? Evidence from central and
east European countries. Appl Econ 41:2691–2703Bellak C, Leibrecht M, Riedl A (2008) Labour costs and FDI flows into Central and Eastern European
Countries: a survey of the literature and empirical evidence. Struct Chang Econ Dyn 19(1):17–37Bertrand O, Mucchielli JL, Zitouna H (2007) Location choices of multinational firms: the case of mergers
and acquisitions. J Econ Integr 22:181–209Biswas R (2002) Determinants of foreign direct investment. Rev Dev Econ 6(3):492–504Boschma R (2005) Proximity and innovation: a critical assessment. Reg Stud 39(1):61–74Botric V, Škuflic L (2006) Main determinants of foreign direct investment in the southeast European coun-
tries. Trans Stud Rev 13(2):359–377Brakman S, Garretsen H, van Marrewijk C (2007) Cross-border mergers and acquisitions: The facts as
a guide for international economics. In International Mergers and Acquisitions Activity Since 1990(pp. 23–49). Academic Press: Boston
Buettner T, Ruf M (2007) Tax incentives and the location of FDI: Evidence from a panel of Germanmultinationals. Int Tax Public Finance 14(2):151–164
Cantwell J (1989) Technological innovation and multinational corporations. Basil Blackwell, OxfordCantwell J, Iammarino S (2003) Multinational corporations and European regional systems of innovation.
Routledge, LondonCantwell J, Piscitello L (2005) Recent location of foreign-owned research and development activities by
large multinational corporations in the European regions: the role of spillovers and externalities. RegStud 39(1):1–16
Cantwell J, Santangelo GD (2002) M&As and the global strategies of TNCs. Dev Econ 40(4):400–434Capello R, Fratesi U, Resmini L (2011) Globalization and regional growth in Europe: past trends and
future scenarios. Springer, Berlin HeidelbergClague C, Keefer P, Knack S, Olson M (1994) Institutions and economic performance: A new look at
democracies and growth. In: Draft prepared for the institutional reform and the informal sector con-ference on economic and political institutions for sustainable development
Cleeve E (2008) How effective are fiscal incentives to attract FDI to Sub-Saharan Africa? J Dev Areas42(1):135–153
Crescenzi R, Pietrobelli C, Rabellotti R (2014) Innovation drivers, value chains and multinational corpo-rations in Europe. J Econ Geogr 14:1053–1086
Crozet M, Mayer T, Mucchielli JL (2004) How do firms agglomerate? A study of FDI in France. Reg SciUrban Econ 34(1):27–54
Defever F (2006) Functional fragmentation and the location of multinational firms in the enlarged Europe.Reg Sci Urban Econ 36(5):658–677
De Mooij RA, Ederveen S (2006) What a difference does it make? Understanding the empirical literatureon taxation and international capital flows. European Economy Economic Papers, no. 261
Devereux MP, Griffith R (1998a) Taxes and the location of production: evidence from a panel of USmultinationals. J Public Econ 68(3):335–367
Devereux MP, Griffith R (1998b) The taxation of discrete investment choices (No. W98/16). IFS workingpapers
Dicken P (2007) Global shift: mapping the changing contours of the world economy, 5th edn. SAGE,London
Disdier AC, Mayer T (2004) How different is Eastern Europe? Structure and determinants of locationchoices by French firms in Eastern and Western Europe. J Comp Econ 32:280–296
Du J, Lu Y, Tao Z (2008) Economic institutions and FDI location choice: evidence from US multinationalsin China. J Comp Econ 36:412–429
Dunning JH (1977) Trade, location of economic activity and the multinational enterprise: a search for aneclectic approach. In: Ohlin B, Hesselborn PO, Wijkman PM (eds) The International Allocation ofEconomic Activity. Macmillan, London, pp 19–51
Dunning JH (1979) Explaining changing pattern of international production: in defence of eclectic theory.Oxf Bull Econ Stat 41(4):269–296
Dunning JH (2013) Multinationals, Technology & Competitiveness. RLE International Business, vol 13.Routledge, London/New York
Dunning JH, Lundan S (2008) Multinational Enterprises and the Global Economy. Edward Elgar, Chel-tenham
Eurostat (2006) NACE Rev.2—Statistical classification of economic activities in the European Community.Office for Official Publications of the European Communities, Luxembourg
Eurostat (2015) Regions in the European Union. Nomenclature of territorial units for statistics NUTS2013.Office for Official Publications of the European Communities, Luxembourg
Eurostat (2018) TERCET NUTS-Postal Codes Matching Tables. https://ec.europa.eu/eurostat/tercet/flatfiles.do. Last access date: 6 April 2020.
Gereffi G, Korzeniewicz M (1994) Commodity chains and global capitalism. Praeger, WestportGorzelak G, Smetkowski M (2010) Regional development dynamics in central and eastern European coun-
tries. In: Gorzelak G, Bachtler J, Smetkowski M (eds) Regional development in central and easternEurope: development processes and policy challenges. Routledge Contemporary Russia and EasternEurope Series. Routledge, Abingdon
Guadalupe M, Kuzmina O, Thomas C (2012) Innovation and foreign ownership. Am Econ Rev 102:3594–3627
Guimaraes P, Figueiredo O, Woodward D (2000) Agglomeration and the location of foreign direct invest-ment in Portugal. J Urban Econ 47:115–135
Hartman DG (1984) Tax policy and foreign direct investment in the United States. Nat Tax J 37(4):475–487Head CK, Mayer T (2004) Market potential and the location of Japanese investments in the European
Union. Rev Econ Stat 86:949–972Head CK, Ries JC, Swenson DL (1995) Agglomeration benefits and location choice: evidence from
Japanese manufacturing investment in the United States. J Int Econ 38:223–247Head CK, Ries JC, Swenson DL (1999) Attracting foreign manufacturing: investment promotion and ag-
glomeration. Reg Sci Urban Econ 29:197–218Hennart JF, Park YR (1993) Greenfield vs. acquisition: The strategy of Japanese investors in the United
States. Manage Sci 39(9):1054–1070Hennart JF, Park YR (1994) Location, governance, and strategic determinants of Japanese manufacturing
investment in the United States. Strat Mgmt J 15(6):419–436Hlavac M (2018) Stargazer: well-formatted regression and summary statisitcs tables. R package (version
5.2.1.). https://CRAN.R-project.org/package=stargazer, last access date May 2018Hox JJ, Moerbeek M, van de Schoot R (2017) Multilevel analysis: Techniques and applications. Routledge,
New YorkIammarino S (2018) FDI and regional development policy. J Int Bus Policy 1(3–4):157–183Iammarino S, McCann P (2013) Multinationals and economic geography. In: Elgar E (ed) Chapter 7:
multinationals, Connectivity, global cities. Edward Elgar, Cheltenham, pp 284–319Javororcik BS, Kaminski B (2009) How to attract FDI and maximize its benefits. In: Winiecki J (ed)
Competitivness of New Europe. Routledge, London/New YorkKogut B, Zander U (1992) Knowledge of the Firm, Combinative Capabilities, and the Replication of Tech-
Multinational investments across Europe: a multilevel analysis 105
Linders G-J, de Groot HLF (2006) Estimation of the gravity equation in the presence of zero flows. Tin-bergen Institute Discussion Paper No. 06-072/3
Liu X, Zou H (2008) The impact of greenfield FDI and mergers and acquisitions on innovation in Chinesehigh-tech industries. J World Bus 43(3):352–364
Maas CJ, Hox JJ (2005) Sufficient sample sizes for multilevel modeling. Methodology 1(3):86Marshall A (1920) Principles of economics. Macmillan, LondonMiskinis A, Byrka M (2014) The role of investment promotion agencies in attracting foreign direct invest-
ment. Ekonomika 93(4):41–57Mohamed SE, Sidiropoulos MG (2010) Another look at the determinants of foreign direct investment in
MENA countries: an empirical investigation. J Econ Dev 35(2):75–95Neary JP (2004) Cross-border mergers as instruments of comparative advantage. Discussion Paper No.
4325. CEPR, LondonNeuhaus M (2005) FDI: the growth engine in central and eastern Europe. Dtsch Bank Res, EU Monitor
26:14–20Newburry W, Zeira Y (1997) Generic differences between equity international joint ventures (EIJVs), in-
ternational acquisitions (IAs) and international greenfield investments (IGIs): Implications for parentcompanies. J World Bus 32(2):87–102
Nocke V, Yeaple S (2007) Cross-border mergers and acquisitions vs. greenfield foreign direct investment:the role of firm heterogeneity. J Int Econ 72(2):336–365
OECD (2002) Foreign direct investment for development. Maximising benfitis, minimising costs. OECD,Paris, p 3 (https://www.oecd.org/investment/investmentfordevelopment/1959815.pdf.)
Ó Huallacháin B, Reid N (1997) Acquisition versus greenfield investment: the location and growth ofJapanese manufacturers in the United States. Reg Stud 31(4):403–416
Petrakos G, Economou D (2002) The spatial aspects of development in Southeastern Europe. Spatium8:1–13
Pike A, Rodriguez-Pose A, Tomaney J (2006) Local and regional development. Routledge, LondonPy L, Hatem F (2009) Internationalisation et localisation des services: Une analyse sectorielle et fonction-
nelle appliquée aux firmes multinationales en Europe. Econ Et Stat 426(1):67–95Raff H, Ryan M, Stälher F (2009) The choice of market entry mode: Greenfield investment, M&A and
joint venture. Int Rev Econ Finance 18(1):3–10Schneider F, Frey BS (1985) Economic and political determinants of foreign direct investment. World Dev
13(2):161–175Spengel C, Schmidt F, Heckemeyer JF, Nicolay K et al (2017) Effective tax levels using the Devereux/
Griffith methodology—update 2017. ZEW, MannheimTraistaru I, Nijkamp P, Resmini L (eds) (2003) The emerging economic geography in EU accession coun-
tries. Ashgate Publishing Limited, AldershotTransparency International (2017) Corruption Perceptions Index 2017. www.transparency.org/cpi, last ac-
cessed April 2020Voget J (2011) Relocation of headquarters and international taxation. J Public Econ 95:1067–1081Wang A (2009) The choice of market entry mode: cross-border M&A or greenfield investment. Int J Bus
Manag 4(5):241Wang M (2009) Manufacturing FDI and economic growth: evidence from Asian economies. Appl Econ
41(8):991–1002Wang M, Wong S (2009) What drives economic growth? The case of cross-border M&A and Greenfield
FDI activities. Kyklos 62(2):316–330Wheeler D, Mody A (1992) International investment location decisions: the case of US firms. J Int Econ
33(1–2):57–76Wijeweera A, Dollery B (2009) Host country corruption level and foreign direct investments inflows. Int J
Trade Glob Mark 2(2):168–178Woodward DP (1992) Locational determinants of Japanese manufacturing start-ups in the United States.
South Econ J 58:690–708World Bank (2016) Worldwide Governance Indicators. http://info.worldbank.org/governance/wgi/#home,
last access date April 2020WTO (1996) Foreign direct investment seen as primary motor of globalization, says WTO Director-Gen-
eral. WTO Press Release, vol 42Yeung HW, Coe NM (2015) Toward a Dynamic Theory of Global Production Networks. Econ Geogr
91:29–58
Publisher’s Note Springer Nature remains neutral with regard to jurisdictional claims in published mapsand institutional affiliations.