Munich Personal RePEc Archive Liberalization of Trade with Leading Trade Partners: Some Evidence from Bosnia and Herzegovina Safet Kurtovic and Blerim Halili and Nehat Maxhuni Faculty of Management and Business Economics, University of Travnik, Department of Economics, College“Biznesi”, Department of Economics, College “Biznesi” 10 October 2016 Online at https://mpra.ub.uni-muenchen.de/75053/ MPRA Paper No. 75053, posted 16 November 2016 07:07 UTC
Transcript
MPRAMunich Personal RePEc Archive
Liberalization of Trade with LeadingTrade Partners: Some Evidence fromBosnia and Herzegovina
Safet Kurtovic and Blerim Halili and Nehat Maxhuni
Faculty of Management and Business Economics, University ofTravnik, Department of Economics, College “Biznesi”, Departmentof Economics, College “Biznesi”
10 October 2016
Online at https://mpra.ub.uni-muenchen.de/75053/MPRA Paper No. 75053, posted 16 November 2016 07:07 UTC
Liberalization of Trade with Leading Trade Partners: Some Evidence from Bosnia and Herzegovina Abstract: In this study, the effect of trade liberalization with the leading trade partners on the B&H trade balance was researched. The theoretical framework includes a gravity model and econometric technique GMM dynamic panel. The research results have shown that export of products from B&H increased thanks to the growth of macroeconomic indicators of trading partners, dummy variables and the export of certain products according to the sector structure. On the other hand, imports of products in B&H decreased due to the decline of macroeconomic indicators of B&H, dummy variables and reduced imports of certain products according to the sector structure. Keywords: Trade liberalization, trade balance, imports, exports, trade deficit JEL Classification: F14, F31, F32 1. Introduction
The trade liberalization is considered as one of the most important processes that occurred in the world economy in recent decades (Caporale et al. 2011). It is well known that in economic theory there is a strong link between trade liberalization and economic growth. Consequently, the strategies of developing countries or countries in transition are based on a strategy of export-led growth vs. imports.The main benefits of higher exports is reflected in the growth of economic competitiveness in the world market, greater efficiency in the allocation of resources, the realization of economies of scale, technological spillovers, the diffusion of knowledge, the convergence of traded products, etc., (Santos-Paulino 2000; Caporale et al. 2009). Trade liberalization brings with itself the static and dynamic benefits. Static benefits are based on the reallocation of resources based on comparative advantages and straightening specialization, while the dynamic benefits are reflected through higher investment, growth in productivity, economies of scale, learning by doing and technology transfer. The dynamic benefits are dominant and represent the link between exports and economic growth (Krueger 1978; Santos-Paulino 2002; El-Wassal 2012). Trade liberalization has a positive effect on economy of the certain country in many ways. First, it leads to reduction in the price of imported products as a result of tariff reductions. Second, it increases consumer demand due to the lower import prices of products and services. Third, it increases domestic competitiveness in the international market due to tariff reductions of the trading partners. On the other hand, trade liberalization can threaten the domestic production and food security as a result of tariff reductions that are leading to a reduction in the relative price of imported products and imports of low-quality food (Bhgwati and Panagariya 1996; Srinivasan 2002; Robinson and Thierfelder 1999; EFTA Team 2004; Oktaviani and Puspitawati Haryadi 2008). Establishment of regional trade agreements has been supported by GATT, General Agreement on Trade in Services (GATS) and the Most-Favored-Nation (MFN) principle (Mihashi 2009). In 2015, the World Trade Organization (WTO) reported that there were 619 regional trade agreements, of which 413 were in force. Of the total number of signed agreements, 428 pertained
to free trade and customs union, i.e. were regulated by Article XXIV of the GATT 1947 or GATT 1994 (World Trade Organisation 2015). From the moment of its establishment, the WTO has supported the establishment of the regional trade agreements because it was believed that the proposed treaties will improve the multilateral trading system. The strong presence of regional trade organizations has led to the growth process of trade diversion and the restraint of multilateral trade flows (Pal 2004). The EU has launched the Stabilization and Association Process (Stabilization and Association Process - SAA) with Western Balkan countries in 2000 at the Summit in Zagreb. The agreement regulates trade liberalization between the EU countries and the signatory countries, i.e. gradual harmonization of legislation, integration of programs and policies with the EU and regional cooperation among signatory cuntries themselves. The main instrument of regional cooperation in the framework of the Stability Pact, in the field of trade policy, was the establishment of the Free Trade Agreement. A Free Trade Agreement was replaced by the establishment of CEFTA in 2006 (Bartlett 2008, Mostetsching 2011, Kurtovic and Talovic 2015). B&H signed a Stabilization and Association Agreement with the EU in 2008 which entered into force in 2015. Also in 2013 B&H signed an agreement with EFTA (European Free Trade Association), which entered into force in 2014. B&H has several signed bilateral free trade agreements with countries from the region and beyond (e.g., Serbia, Russia, Turkey, etc.). B&H, as part of ex-Yugoslavia, until 1992 has recorded a positive balance of trade. After the war B&H has initiated the process of liberalizing its trade system. The process took place in two directions: unilaterally and multilaterally. The economy of Bosnia and Herzegovina during the war from 1992 to 1995 was devastated which caused significant trade gap in the balance of trade, which meant significantly more imported than exported products. Observed from 1995 to 2015, B&H Balance of trade recorded a permanent deficit. The total export of B&H in 2014 amounted to 4,935 billion dollars, while total imports amounted to 9,210 billion dollars. The coverage of imports by exports in 2014 was 53.6%. In 1998, the export-import ratio was only 20.4% (Centralna Banka B&H 2014). B&H traditionally has the most intensive trade relations with the EU and the countries of former Yugoslavia. The share of exports into the EU-28 out of the total exports was 84.8%, while the share of imports of B&H from the EU-28 out of the total imports was 81.4% (European Commission 2015). The most important market for exports of B&H products is Croatia, where the total exports in the period from 2005 to 2014, were at 7,216 billion dollars, while imports were at 14,559 billion dollars. In second place is Germany, in which 6,678 billion dollars were exported at the same period and 11,277 billion dollars got imported. In third place is Italy in which 5,828 billion dollars got exported and 9,054 billion dollars imported. In fourth place is Serbia in which 5,377 billion dollars’ worth goods were exported and 9,611 billion dollars imported. Finally, B&H exports to Slovenia goods worth of 4,166 billion dollars and imports 5,619 billion dollars. B&H recorded a trade deficit with its major trading partners according to the specific sectors. However, in past few years, B&H recorded a trade surplus only with Italy and Austria. Observing the structure of the balance of trade, B&H imports the most capital-intensive products, and exports labor-intensive products; in fact, from its major trading partners B&H imports food and live animals, mineral fuels, lubricants and related materials, manufactured goods classified chiefly by material, chemicals and related products etc. On the other hand, B&H exports mainly machinery and transport equipment, mineral fuels, lubricants and related materials, miscellaneous manufactured articles, crude materials, inedible, except fuels etc. B&H in the process of trade liberalization is faced with the problem of low competitiveness of the
national economy and the high trade deficit. According to the global competitiveness index, in 2015 B&H was ranked on 140th place in the world, while the trade deficit amounted to -4264 billion dollars. The relative openness of the economy and the existence of a high current account deficit of -6.4%, and the reduction of customs duties had a negative impact on the reduction of the fiscal revenues and the growth of benefits for importers in relation to domestic consumers. Finally, certain positive effects of the participation in regional trade integration have been achieved. The main objective of this study is to research the following effects of the trade liberalization on the B&H balance of trade. First, to examine the extent to which certain macroeconomic indicators, dummy variables and products contribute to the growth of exports from Bosnia and Herzegovina, taking into consideration the sector structure. Second, to examine the extent to which certain macroeconomic indicators, dummy variables and products contribute to the growth of imports in B&H, taking into consideration the sector structure. Third, to examine the extent to which certain macroeconomic indicators, dummy variables and products contribute to the leveling of B&H balance of trade, taking into consideration the sector structure. The paper consists of sections as follows: Section 2 provides an overview of literature or research closely related to this paper’s research subject; Section 3 describes the economic model; Section 4 describes econometric techniques and databases used in the research; Section 5 provides the empirical results of the research and, finally, Section 6 contains the conclusion. 2. Literature Review
Santos-Paulino (2001; 2002; 2007) had examined the effect of trade liberalization on import growth in 22 selected developing countries in the period from 1976 to 1998. She applied econometric techniques dynamic panel. According to the author, the abolition of customs and trade restrictions has had a positive impact on the growth of imports in most of the analyzed countries. In addition, the high price and income elasticity as a result of changes in trade policy was determined. On the other hand, Asian countries have achieved dynamic growth thanks to the surplus of trade and balance of payments. Those countries that have had high-measures to protect their markets have realized the negative effect of trade liberalization. Greenaway et al. (2002) studied the effect of liberalization on economic growth in developing countries over a period of 20 years. They applied the dynamic growth model and found out that trade liberalization has a significant impact on GDP growth, but, at the same time, determine the presence of a time-lag. Li (2003) studied the effect of trade liberalization on 43 developing countries. He found out that the trade liberalization has the effect of the devaluation of exchange rates in most countries and at the very beginning of the process, while this effect was weaker later on. Benáček et al. (2003) investigated the effect of the trade liberalization on the example of the 27 industries.They found out that the trade balances of countries are affected by aggregate demand, foreign exchange rates, changes in customs, changes in physical and human capital, foreign direct investments inflows, growing the competitiveness of product quality and the depreciation of the national currency. Paas and Tafenau (2005) researched the regional trade integration of the EU countries and also the creation of regional trade potential clusters. In addition, they studied the Baltic region by applying the gravity model. They found out that geographic distance has a positive effect on trade flows between the countries concerned. They also conducted research that trade in the Baltic countries cannot be explained by new theories of trade because they are economies which have different comparative advantages. Pacheco-López and Thirlwall (2005) studied the effect of
the trade liberalization in 17 Latin American countries. They found out that most countries had faster growth after the trade liberalization. Wu and Zeng (2008) studied the effects of trade liberalization on developing countries.Their research is contrary to studies that argue that trade liberalization has a negative effect on the trade deficit of the developing countries. In fact, their study showed that the effect of trade liberalization is not so negative for developing countries. Wacziarg and Horn Welch (2008) studied the effect of trade liberalization on developed and least developed countries. They point out that liberalization is a milestone in the growth, inflow of investment and open economies. They found out that all countries that have liberalized from 1950 to 1998 achieved a higher rate of economic growth of 1.5%. Also, the rate of inflow of foreign investment has increased from 1.5 to 2%. GDP grew at a rate of 5% which is much higher than before the trade liberalization process. Countries that have achieved the benefits of liberalization are ones that were carrying out trade reforms, while those that have failed had had permanent political problems. Caporale et al. (2008; 2009) explored the impact of the Free Trade Agreements on trade flows between the EU-15 countries and in Central and Eastern European countries, such as Bulgaria, Hungary, Poland and Romania. Their research depended on the use of panel techniques. The results of their study showed that the countries of Central and Eastern Europe have the imbalance between imports and exports, and the low coverage of imports with exports, which leads to a trade deficit or trade asymmetry. A Free Trade Agreement has not led to changes in the structure of exports of EU-15exporting countries, and export labor-intensive products and high elasticity of demand of EU-15 countries is still present. Cieślik and Hagemejer (2011) studied trade liberalization of the Central and Eastern European countries and period from 1993 to 2004. Having applied the gravity model, they concluded that the variables had a positive effect on the increase in trade flows with the EU. This effect varied among the countries because they differ in economic strength and competitiveness. Braha et al. (2014) studied the impact of trade liberalization with the EU countries of the Western Balkans, and CEFTA from 2006. Applying the gravity model it was found out that export has a positive effect on GDP growth, and also that the export is decreasing with increased geographical distance between trading partners. Finally, research has shown that there is a positive impact of export growth in strengthening the competitiveness of the Western Balkan countries. 3. The Economic Model The gravity model of trade bears a strong similarity to Newton’s formula of gravitation. In this model, the two trading areas could be viewed as celestial objects and the value of trade could be viewed as the gravitational pull. Gravity models utilize the gravitational force concept as an analogy to explain the volume of trade, capital flows, and migration among the countries of the world. Jan Tinbergen used an analogy with Newton’s universal law of gravitation to describe the patterns of bilateral aggregate trade flows between two countries A and B as “proportional to the gross national products of those countries and inversely proportional to the distance between them,”(Chaney 2011). The trade (~gravitational pull) is dependent on the GDPs (~mass) of the two trading areas, and their physical distance. The bigger the GDP (~mass) between the two trading areas (~celestial objects) the greater is the trade (~gravitational pull). The trade between the two areas decays exponentially as distance increases (~ decrease in gravitational pull by the square of distance). The similarities end there as GMT can take other variables like infrastructure (~sources of friction) (Beronilla et al. forthcaming). Thus a mass of goods or labor or other factors of production supplied at origin 푖, 푌 , is attracted to a mass of demand for goods or labor
at destination 푗, 퐸 , but the potential flow is reduced by the distance between them, 푑 . Strictly applying the analogy
푋 = 푌퐸 /푑 (1)
gives the predicted movement of goods or labor between 푖 and 푗, 푋 (Anderson 2010). The gravity model is based on the assumption that trade between countries depends positively on their size and inversely on distance. Economically rich and geographically close countries trade more together than with third countries. In its simplest form, the gravity equation states that the bilateral trade between two countries is directly proportional to the product of the countries’ GDPs. Thus, larger countries will tend to trade more with each other, and countries that are more even in their relative sizes will also trade more (Braha et al. 2014). The basic form of the gravity equation is as follows (Batra 2004)
푇푟푎푑푒 = 퐴 ( )
( ) (2)
where 푇푟푎푑푒 is the bilateral trade between country 푖 and 푗; A is a constant; 퐺퐷푃 and 퐺퐷푃 are the respective real domestic products of the countries; 퐷푖푠푡푎푛푐푒 is the distance in kilometers between country 푖 and 푗. 4. Data and Methodology
In the study we have applied econometric technique dynamic panel. Our sample was balanced panel and presents data related to macroeconomic indicators, dummy variables, export and import of products from the major trading partners of Bosnia and Herzegovina. The model was analyzed on the basis of exports and imports, two groups of top ten trading partners. The first group of ten countries that import most products from B&H, for period from 2005 to 2014 and according to the sector structure, includes Croatia, Serbia, Germany, Italy, Slovenia, Austria, Hungary, France, Switzerland and the Czech Republic.The second group of ten countries from which B&H mainly imports products, in the period from 2005 to 2014 and according to the sector structure, includes Croatia, Serbia, Germany, Italy, Slovenia, Austria, Hungary, USA, Turkey and Russia. Data were taken from the database of the Agency for Statistics, Central Bank, Eurostat, the World Bank (World Data Indicators), the Ministry of Foreign Trade of B&H and http://countrymeters.info/en. In this study we have applied Arellano–Bond (Arellano and Bond 1991) and Arellano–Bover/Blundell–Bond (Arellano and Bover 1995; Blundell and Bond 1998) dynamic panel estimators are increasingly popular. Arellano–Bond estimation starts by transforming all regressors, usually by differencing, and uses the generalized method of moments (GMM) (Hansen 1982), and is called difference GMM. The GMM estimator is derived directly from a set of moment conditions. In applications of GMM in the literature, the moment conditions are typically derived directly from economic theory. Under rational expectations, implications of an economic theory can often be formulated as
퐸[푢(푤 , 휃 )/퐼 ] = 0. (3)
where푢(푤 , 휃 ) is a (potentially non-linear) function of future observations of a variable, 푤 ; while 퐼 is the information set available at time 푡. For a vector of variables contained in the information set, 푧 ∈ 퐼 , the condition in (1) implies the unconditional expectation
퐸[푢(푤 ,휃 )푥푧 ] = 0. (4)
which is a moment condition stating that the variables 푧 are uncorrelated with 푢(푤 , 휃 ). In many cases, the theoretical conditions in (2) turn out to be sufficient to derive a consistent estimator, 휃 (Nielsen 2005). GMM provides a framework that encompasses most estimation techniques used in economics. Instrumental variables estimation, although a predecessor to GMM, can be recast as a special case of GMM (Calderón et al. 2005). The general regression equation to be estimated is the
푦 , = 훼푦 , + 훽푋 , + 휇 푣 푒 , . (5)
where 푦 , is the dependent variable, 푋 , represents the explanatory variables of the model, 휇 is the individual specific effect, 푣 is the time specific effect, and 푒 , is the error term (푖 is individual index, and 푡 is the time index). The presence of the lagged as an explanatory variable does not allow the use of standard econometric techniques. The GMM method for dynamic panels provides solutions to the problems of simultaneity bias, reverse causality and omitted variables. Besides, it allows one to control for individual specific effects 휇 , and time effects 푣 , as well as to overcome the endogeneity bias (Caporale et al. 2009). There are two types of GMM estimators for dynamic panels: The first-differenced GMM estimator and the system GMM estimator. Within the GMM approach, one may choose the first-differenced estimator, which considers regression equations in first-differences instrumented by lagged levels of explanatory variables. Taking first-differences eliminates country-specific fixed-effects, thus solving the problem of the potential omission of time invariant country specific factors that may influence growth. To eliminate the country-specific effect, take first differences of equation (1) (Carkovic and Levine 2005)
Thus, this eliminates potential biases associated with unobserved fixed, country effects. Nevertheless, the first-differenced GMM estimator (Arellano and Bond 1991; Huchet-Bourdon et al. 2011) is not suitable when time series are persistent and the number of time series observations is small, like in the case of empirical growth models where data has to be averaged in order to avoid modelling cyclical dynamics (Bond et al. 2002; Huchet-Bourdon et al. 2011). The system GMM estimator combines the standard set of equations in first-differences with suitably lagged levels as instruments, with an additional set of equations in levels with suitably lagged first-differences as instruments. Although the levels of 푦 , are necessarily correlated with the individual-specific effects (휂 ) requires that the first-differences ∆푦 are not correlated with 휂 , permitting lagged first-differences to be used as instruments in the levels equations (Bond 2002). System GMM is a preferred approach since this approach has better finite sample properties when the instruments are weak, which occurs mainly when the GDP series is persistent. Moreover, it utilizes both lagged and differenced versions of the regressors as instruments in obtaining coefficient estimates. The GMM dynamic panel estimator uses the following moment conditions under two assumptions: i) the error term is not serially correlated and ii) the explanatory variables are not correlated with future realizations of the error term (Carkovic and Levine 2005)
The first difference estimator suffers from the following problem: the instruments available for first-differenced equations are weak when the explanatory variables are persistent over time. Such weak instruments can bias the coefficients when the sample size is small. Blundell and Bond (1998) proposed a new estimator that has superior finite sample properties. This new estimator combines the regression in differences with the regression in levels in a system of equations. Under the following additional assumption, this new estimator has been shown to have superior finite sample properties in an autoregressive model with panel data (Carkovic and Levine 2005) 퐸 푦 , . 휂 − 퐸 푦 , . 휂 , = 0푎푛푑퐸 푋 , . 휂 − 퐸 푋 , . 휂 , = 0 for all p and q (9)
Considering the second part of the system, which includes the regression in levels, the additional moment conditions are (Caporale et al. 2009)
퐸 푌 , − 푦 , . (푢 + 푒 , ) = 0푓표푟푠 = 1 (10)
퐸 푋 , − 푋 , . (푢 + 푒 , ) = 0푓표푟푠 = 1(11)
The GMM system estimator is more efficient than the GMM in differences; the GMM in first differences produces biased coefficients for small samples when the instruments are “weak” (Caporale et al. 2009). 5. Empirical Results
Table 1 presents the results of the effect of macroeconomic indicators and the dummy variables on the export of B&H products in the leading ten trading partners, ie. In Croatia, Serbia, Germany, Italy, Slovenia, Austria, Hungary, France, Switzerland and the Czech Republic. Gross domestic product (퐺퐷푃 ) of leading trade partners had a positive effect on the growth of export of products from Bosnia and Herzegovina. Most of the leading trade partners recorded GDP growth during the analyzed period. However, during the great financial crisis in 2008 and later, the GDP of certain trading partners has significantly decreased. Both Serbia and Croatia had a negative GDP growth from 2008 to 2014. Despite the decrease in GDP in these countries export of B&H products has increased considerably, because these countries are import dependent in terms of certain sectoral products. Mentioned countries together with Germany, Italy and Austria are considered to be the largest importers of B&H products, that are considered strategic trading partners. The positive effect on the growth of exports B&H products was studied in the case of dummy variables, i.e. signed trade agreements(퐴푐푐 ), similarity of language (퐿푎푛푔 ) and sharing a common border with trading partners(퐵표푟푑푒푟 ). B&H has signed bilateral and multilateral agreements (e.g. The Stabilisation and Association Agreement with the EU) with the leading
trade partners, while with the other countries B&H share membership in the trade zone of free trade, or CEFTA, 2006. And finally, the real effective exchange rate (푅퐸퐸푅 ) and number of population(푃표푝 ), of leading trade partners, had negative effect on export growth of B&H. The real effective exchange rate BA: Real effective exchange rate BAM appreciated against the real effective foreign currency exchange rates of most leading trade partners, which led to a reduction in exports from B&H. Table 1 Export of B&H products to the leading trade partners GMM system dynamic panel-data estimation Number of obs = 90 Group variable: country Number of groups = 10 Time variable: Year Obs per group: min = 9
avg = 9 max = 9
Number of instruments = 49 Wald chi2(7) = 882.59 Prob > chi2 = 0.0000
Note: *- significance at 10 percent level, **- significance at 5 percent level, ***- significance at 1 percent level. Table 2 presents the results of the effect of export products, according to the sector structure, on the export of B&H in the top ten trading partners, i.e., Croatia, Serbia, Germany, Italy, Slovenia, Austria, Hungary, the United States, Turkey and Russia. Based on the collected results we may conclude that all products, ranging from food and live animals (퐹퐿퐴푒푥푝표푟푡), beverages and tobacco (퐵푇푒푥푝표푟푡) (BT), crude materials, inedible, except fuels (퐶푀퐼퐸퐹푒푥푝표푟푡), mineral fuels, lubricants and related materials (푀퐹퐿푅푀푒푥푝표푟푡), animal and vegetable oils, fats and waxes (퐴푉푂퐹푊푒푥푝표푟푡), chemicals and related products (퐶푅푃푒푥푝표푟푡), manufactured goods classified chiefly by material (푀퐺퐶퐶푀푒푥푝표푟푡), miscellaneous manufactured articles (푀푀퐴푒푥푝표푟푡), commodities and ransactions (퐶푅푒푥푝표푟푡), have positive effect on export growth of B&H. B&H is the biggest exporter of manufactured goods classified chiefly by material (푀퐺퐶퐶푀푒푥푝표푟푡), miscellaneous manufactured articles (푀푀퐴푒푥푝표푟푡), machinery and transport equipment (푀푇퐸푒푥푝표푟푡) and mineral fuels, lubricants and related materials (푀퐹퐿푅푀푒푥푝표푟푡) etc. In the analyzed period, B&H was constantly increasing export almost of all products grouped according to sector structure. This means that the leading trade partners experienced growth in their industries, which indirectly led to an increase in demand for B&H products.
Table 2 Export of B&H products to the leading trade partners according to the sector structure GMM system dynamic panel-data estimation Number of obs = 90 Group variable: country Number of groups = 10 Time variable: Year Obs per group: min = 9
avg = 9 max = 9
Number of instruments = 55 Wald chi2(7) = 7.016407 Prob > chi2 = 0.0000
Note: *- significance at 10 percent level, **- significance at 5 percent level, ***- significance at 1 percent level. Table 3 presents the results of imports of products in B&H, according to the sector structure from the top ten leading trade partners. Gross domestic product (퐺퐷푃 )of BiH recorded modest growth until 2005, and during the global financial crisis in 2008 suffered significant decline. This has led to a reduction in imports of products which had a positive effect on the leveling of trade balance. Also, variables such as number of population(푃표푝 ), similarity of language (퐿푎푛푔 ) and sharing a common border with trading partners(퐵표푟푑푒푟 ), had positive effect on decline of import of products. However, real effective exchange rate (퐸푅푅퐸 ) and signed trade agreements(퐴푐푐 ) had negative effect on growth of import of products. The real effective exchange rate BAM was appreciated in relation to the real effective currency courses of the leading trade partners, which led to the growth of imports of goods and the growth of the trade deficit. Foreign products have become cheaper compering to domestic products. To this we can add the low elasticity of BiH demand or the high import-dependency on foreign products. In the end, signed trade agreements have a negative impact on the growth of imports of the product because by their signature liberalized trade of most analyzed products. Table 3 Import of B&H from the leading trade partners GMM system dynamic panel-data estimation Number of obs = 90 Group variable: country Number of groups = 10 Time variable: Year Obs per group: min = 9
avg = 9 max = 9
Number of instruments = 49 Wald chi2(7) = 248.87
Prob > chi2 = 0.0000 One-step results
Import Coef. Std. Err. z P>|z| [95% Conf. Interval] Import
Note: *- significance at 10 percent level, **- significance at 5 percent level, ***- significance at 1 percent level.
Table 4 presents the results of the effect of imports of the product, according to the sector structure, from the leading ten trading partners in B&H. Based on the results we conclude that all sectoral products, ranging from food and live animals (퐹퐿퐴푖푚푝표푟푡), beverages and tobacco (퐵푇푖푚푝표푟푡), crude materials, inedible, except fuels (퐶푀퐼퐸퐹푖푚푝표푟푡), mineral fuels, lubricants and related materials (푀퐹퐿푅푀푖푚푝표푟푡), chemicals and related products (퐶푅푃푖푚푝표푟푡), manufactured goods classified chiefly by material (푀퐺퐶퐶푀푖푚푝표푟푡), miscellaneous manufactured articles (푀푀퐴푖푚푝표푟푡), had positive effect on decline of imports of the products in B&H. On the other hand, in the case of animal and vegetable oils, fats and waxes (퐴푉푂퐹푊푖푚푝표푟푡) and commodities and ransactions (퐶푅푖푚푝표푟푡), a negative effect on growth of the import s of products was recorded. B&H is the biggest importer of mineral fuels, lubricants and related materials (푀퐹퐿푅푀푖푚푝표푟푡), manufactured goods classified chiefly by material (푀퐺퐶퐶푀푖푚푝표푟푡), machinery and transport equipment (푀푇퐸푖푚푝표푟푡), food and live animals (퐹퐿퐴푖푚푝표푟푡) and chemicals and related products (퐶푅푃푖푚푝표푟푡) etc. Based on the import of products we may conclude that the B&H economy is highly dependent on imports of foreign products, and that it has a very undeveloped petrochemical, machinery and transport industry and agricultural production. It is a country with an uncompetitive economy whose products are less sophisticated.
Table 4 Imports of B&H from the leading trading partner according to the sector structure GMM system dynamic panel-data estimation Number of obs = 90 Group variable: country Number of groups = 10 Time variable: Year Obs per group: min = 9
avg = 9 max = 9
Number of instruments = 55 Wald chi2(7) = 9562.90 Prob > chi2 = 0.0000
Note: *- significance at 10 percent level, **- significance at 5 percent level, ***- significance at 1 percent level. Table 5 presents the results of the effect of macroeconomic indicators and the dummy variables on the trade balance of B&H. Gross domestic product of B&H (퐺퐷푃 ) and gross domestic product of the leading trade partners 퐺퐷푃 have positive effect on leveling of the trade balance, i.e. decline of trade deficit of B&H. Growth of (퐺퐷푃 ) of B&H caused increase of growth of exports compering to imports of products. Also, growth of 퐺퐷푃 of the leading trade partners influence increase of growth of imports of products from B&H. In the case of other variables, such as number of population of B&H (푃표푝 ) and major trading partners 푃표푝 , similarity of language of the countries 퐿푎푛푔 and sharing the common border 퐵표푟푑푒푟 , a positive effect on leveling the balance of trade was recorded. However, in the case
of the real exchange rate (퐸푅푅퐸 ) and real exchange rates of the leading trade partners 퐸푅푅퐸 , and signed trade agreements 퐴푐푐 no positive effect has been recorded on leveling
of the balance of trade of B&H. The real effective exchange rate of BAM currency has appreciated against the major trading partners, according to the volume of trade exchange (for example, Croatia, Serbia, Turkey, Hungary, Italy, Germany and Russia), which has led to increased imports of products from mentioned countries, and thus to an increase in the trade deficit. On the other hand, the real effective exchange rate BAM has depreciated against the real effective exchange rate of the United States, Switzerland, Slovenia, Italy, France and the Czech Republic, which led to the growth of B&H exports, and thus to a reduction in trade deficit of B&H. The effect of imports is significantly more negative compared to the effect of exports on the trade balance of B&H. Finally, signed trade agreements did not affect positively on the leveling of the trade balance of B&H because they contributed to higher imports comparing to exports from B&H. Table 5 The effects of different factors on balance of trade of B&H GMM system dynamic panel-data estimation Number of obs = 90 Group variable: Country Number of groups = 10 Time variable: Year Obs per group: min = 9
avg = 9 max = 9
Number of instruments =52 Wald chi2(7) = 182.79 Prob > chi2 = 0.0000
Note: *- significance at 10 percent level, **- significance at 5 percent level, ***- significance at 1 percent level. Table 6 presents the results of the effect of imports of B&H products from the top ten trading partners (Croatian, Serbia, Germany, Italy, Slovenia, Austria, Hungary, the USA, Turkey and Russia) according to the sector structure. The research results show the positive effect of the reduction of import of beverages and tobacco (퐵푇푖푚푝표푟푡), mineral fuels, lubricants and related materials (푀퐹퐿푅푀푖푚푝표푟푡), chemicals and related products (퐶푅푃푖푚푝표푟푡), machinery and transport equipment (푀푇퐸푖푚푝표푟푡), miscellaneous manufactured articles (푀푀퐴푖푚푝표푟푡) on the leveling or reduction of deficit of trade balance, while the imports of products , such as food and live animals (퐹퐿퐴푖푚푝표푟푡), crude materials, inedible, except fuels (퐶푀퐼퐸퐹푖푚푝표푟푡), animal and vegetable oils, fats and waxes (퐴푉푂퐹푊푖푚푝표푟푡), manufactured goods classified chiefly by material (푀퐺퐶퐶푀푖푚푝표푟푡), commodities and ransactions (퐶푅푖푚푝표푟푡), had negative effects on leveling of trade of balance e.g., growth of trade deficit. In the analyzed period, B&H has succeeded to reduce the import of these products due to falling of domestic demand, the impact of the global economic crisis and the emergence of the substitution of cheaper imports of products from third countries. On the other hand, B&H is continuing to import these products from mentioned countries as a result of high dependency and due to under-developed industry and agriculture. Table 6 Effect of the imports of the products on the trade balance of B&H according to the sector structure GMM system dynamic panel-data estimation Number of obs = 90 Group variable: country Number of groups = 10 Time variable: Year Obs per group: min = 9
avg = 9 max = 9
Number of instruments = 55 Wald chi2(7) = 1141.01 Prob > chi2 = 0.0000
Note: *- significance at 10 percent level, **- significance at 5 percent level, ***- significance at 1 percent level. Table 7 presents the results of the effect of export products from B&H, to ten leading trade partners, i.e, Croatia, Serbia, Germany, Italy, Slovenia, Austria, Hungary, France, Switzerland and the Czech Republic according to the sector structure. Results of the research show that only manufactured goods classified as chiefly by material (푀퐺퐶퐶푀푒푥푝표푟푡) have positive effect on the leveling of the trade balance, while export of other products, such as beverages and tobacco (퐵푇푒푥푝표푟푡), mineral fuels, lubricants and related materials (푀퐹퐿푅푀푒푥푝표푟푡), chemicals and related products (퐶푅푃푒푥푝표푟푡), machinery and transport equipment (푀푇퐸푒푥푝표푟푡), miscellaneous manufactured articles (푀푀퐴푒푥푝표푟푡), food and live animals (퐹퐿퐴푒푥푝표푟푡), crude materials, inedible, except fuels (퐶푀퐼퐸퐹푒푥푝표푟푡), animal and vegetable oils, fats and waxes (퐴푉푂퐹푊푒푥푝표푟푡), manufactured goods classified chiefly by material (푀퐺퐶퐶푀푒푥푝표푟푡), commodities and transactions (퐶푅푒푥푝표푟푡), did not have positive effect on leveling of the trade balance or decrease of trade deficit. Based on the results we may conclude that B&H export is mainly based on raw materials and semi-final products. In addition, it is the economy that produces labor-intensive products. Accordingly, if B&H wants to improve the export of its products it is necessary to change the strategy of development of industrial policy, and produce highly sophisticated products that will be competitive on the world market. Table 7 The effect of export products on the trade balance of B&H according to the sector structure GMM system dynamic panel-data estimation Number of obs = 90 Group variable: country Number of groups = 10 Time variable: Year Obs per group: min = 9
avg = 9 max = 9
Number of instruments = 55 Wald chi2(7) = 129.62 Prob > chi2 = 0.0000
Note: *- significance at 10 percent level, **- significance at 5 percent level, ***- significance at 1 percent level. 6. Conclusion In the last two and half decades B&H has achieved modest results in the field of trade liberalization. The process of liberalization of B&H trade has not progressed as envisaged and did not give the expected results. The main reason for this situation is the slow implementation of economic reforms that were a condition for faster and more effective involvement into the integration of economic alliances. Besides this, B&H has signed a commercial agreement on Stabilization and Association with the EU countries and is a member of CEFTA 2006 Agreement, and is a signatory to several bilateral and multilateral agreements. Taking into consideration that B&H is among the transition countries, it is quite obvious that its economic development and trade policy are based on close co-operation with developed countries and neighbouring countries, i.e. the countries of former Yugoslavia. Among the ten leading trade partners of B&H are few EU countries, Serbia, the USA, Russia and Turkey. The most important trading partners, in terms of export and import products, are Croatia, Germany, Serbia and Italy. In the study we have applied the gravity model and econometric technique of dynamic panel. We analyzed the time series data from 2005 to 2014. We have studied the effect of macroeconomic indicators, dummy variables and sectoral structure of export and import of products with leading trade partners on the trade balance of B&H. Based on the research results we have come to the following conclusions. Firstly, in the period from 2005 to 2014, B&H succeeded to achieve growth in exports of products thanks to the GDP growth of its trading partners, signed trade agreementss, the similarity of language and sharing a common border with leading trade partners. Secondly, B&H has managed to achieve a reduction in imports of products from the leading trade partners, due to the decline of their own GDP, weak domestic demand and the effect of substitution of cheaper goods from third countries. On the other hand, the real effective exchange rate BAM and signed free trade agreements have had a negative impact on the reduction of imports. Thirdly, the leveling of trade balance of B&H was positively influenced by GDP, number of population and sharing common borders of both trading partners. Looking at the every single effect of imports on the trade balance of B&H, we have found out that the reduce imports of products, such as beverages and tobacco, mineral fuels, lubricants and related materials, chemicals and related products, machinery and transport equipment, miscellaneous manufactured articles, had a positive effect on the leveling of trade balance while imports of products such as food and live animals, crude materials, inedible, except fuels, animal and vegetable oils, fats and waxes, manufactured goods classified chiefly by material commodities and ransactions, had negative effect on the levelingof the trade balance. On the other hand, we have found out that the export of products, such as manufactured goods classified chiefly by material, had a positive effect on the balance of trade balance, while the export of products, such as beverages and tobacco, mineral fuels, lubricants and related materials, chemicals and related products, machinery and transport equipment, miscellaneous manufactured articles, food and live animals, crude materials, inedible, except fuels, animal and vegetable oils, fats and waxes, manufactured goods classified chiefly by material commodities and ransactions, had negative effect on the levelinge of the trade balance.
On the basis of previous studies it was confirmed that the liberalization of trade between the developed industrial countries and less developed industrial countries does not bring the positive effect on the less developed country. In fact, less industrialized countries have a negative trade balance and there is no convergence in trade exchange. According to the research findings, we may conclude that the B&H, through the process of liberalization of trade with the developed countries, recorded a trade deficit which is a result of the low competitiveness of the economy and labor-intensive production. Therefore, B&H in order to reduce the trade deficit must conduct changes in the macroeconomic policy, industrial policy, trade policy, the policy of attracting foreign direct investment and activation of domestic investment, as well as the policy change of exchange rate and so on. The reform of the given policies of B&H economy should strengthen its international competitiveness by production and exports of highly-sofisticated products, in order to try to reduce its high trade deficit. References Anderson, J.E. 2010. “The Gravity Model.” Working Paper No. 16576. National Bureau of Economic Research, Cambridge, MA. http://www.nber.org/papers/w16576.pdf Arellano, M. and S. Bond. 1991. “Some Tests of Specification for Panel Data: Monte Carlo Evidence and an Application to Employment Equations.” Review of Economic Studies 58, 277-297. http://people.stern.nyu.edu/wgreene/Econometrics/Arellano-Bond.pdf Arellano, M. and O. Bover. 1995. “Another look at the instrumental variable estimation of error-components models.” Journal of Econometrics 68, 29-51. http://www.cemfi.es/~arellano/arellano-bover-1995.pdf Bartlett, W. 2008. “Regional integration and free-trade agreements in the Balkans: Opportunities, obstacles and policy issues.” Economic Change and Restructuring, 42 (1), 25-46. DOI 10.1007/s10644-008-9062-4. https://www.researchgate.net/publication/23961414_Regional_integration_and_free-trade_agreements_in_the_Balkans_Opportunities_obstacles_and_policy_issues Batra, A. 2004. “India’s Global Trade Potential: The Gravity Model Approach.” ICRIER Working paper No. 151. Indian Council for Research on International Economic Relations. http://www.icrier.org/pdf/wp151.pdf Benáček, V., Prokop, L. and A.J. Víšek. 2003. “Determining Factors of the Czech Foreign Trade Balance: Structural Issues in Trade Creation.” Working Paper Series 3. Czech National Bank. http://www.cnb.cz/en/research/research_publications/cnb_wp/download/wp3-2003.pdf Beronilla, N. L., Esguerra, P. J. H. and J. Ocampo. forthcaming. “The economic potential via the gravity model of trade.” http://nap.psa.gov.ph/ncs/12thncs/papers/CONTRIBUTED/CPS-2%20Socio%20Economic%20Statistics%20II/CPS2_4_The%20Economic%20Potential%20via%20the%20Gravity%20Model%20of%20Trade.pdf Bhgwati, J. and A. Panagariya. 1996. “The Theory of Preferential Trade Agreements: Historical Evolution and Current Trends.” The American Economic Review, 86 (2), 82-87. http://academiccommons.columbia.edu/catalog/ac%3A152323
Blundell, R. and S. Bond. 1998. “GMM estimation with persistent panel data: an application to production functions.” Working Paper Series No. W99/4. The Institute for Fiscal Studies. https://core.ac.uk/download/pdf/1683580.pdf Bond, S. 2002. “Dynamic panel data models: A guide to micro data methods and practice.” Working paper CWP09/02. The Institute for Fiscal Studies Department of Economics, UCL. http://www.cemmap.ac.uk/wps/cwp0209.pdf Braha, K., Qineti, A., Smutka, L., Matejková, E. and M. Pietriková. 2014. “EU accession and trade integration: The gravity model of trade in the case of the EU candidate countries.” 142nd EAAE Seminar Growing Success? Agriculture and rural development in an enlarged EU, 29-30, May, Hungary. Calderón, C., Loayza, N. and K. Schmidt-Hebbel. 2005. “Does openness implay greater exposure?” https://www.cnb.cz/miranda2/export/sites/www.cnb.cz/en/research/seminars_workshops/2006/2006_02-21_Schmidt-Hebbel_b.pdf Caporale, M.G., Rault, C. and M.A. Sova. 2008. “On the Trade Balance Effects of Free Trade Agreements Between the EU-15 and the CEEC-4 Countries.” Working Paper No. 912. https://deepblue.lib.umich.edu/bitstream/handle/2027.42/64367/wp912.pdf?sequence=1&isAllowed=y Caporale, M.G., Rault, C., Sova, R. and A. Sova. 2009. “Trade Specialisation and Economic Convergence: Evidence from Two Eastern European Countries.” Discussion Papers 875. Deutsches Institut für Wirtschaftsforschung. http://www.diw.de/documents/publikationen/73/diw_01.c.96866.de/dp875.pdf Caporale, M.G., Rault, C., Sova, R. and A. Sova. 2011. “Europe Agreements and Trade Balance: Evidence form Four New EU Members.” Discussion Paper No. 5683. http://ftp.iza.org/dp5683.pdf Carkovic, M. and R. Levine. 2005. “Does Foreign Direct Investment Accelerate Economic Growth?” http://siteresources.worldbank.org/INTFR/Resources/fdi.pdf Centralna banka B&H. 2014. “Godišnji izvještaj.” Centralna banka BiH. http://www.cbbh.ba/files/godisnji_izvjestaji/2014/GI_2014_hr.pdf Chaney, T. 2011. “The Gravity Equation in International Trade: An Explanation.” http://www.tse-fr.eu/sites/default/files/medias/doc/by/chaney/distance.pdf Cieślik, A. and A. Hagemejer. 2011. “The Effectiveness of Preferential Trade Liberalization in Central and Eastern Europe.” Working Papers No. 21(61). https://www.wne.uw.edu.pl/files/7813/9628/4103/WNE_WP61_2011.pdf EFTA Team. 2004. “Study of Consequences from Entering into an FTA with EFTA.” Part IV: Advice on Trade and Investment Opportunities. Revised Draft Report, 1-97. http://www.thaifta.com/thaifta/portals/0/file/efta123004.pdf El-Wassal, A.K. 2012. “The Impact of Trade Liberalization on Trade Balance in Arab Countries.” Journal of Economic and Social Research, 14(2), 1-26. http://search.proquest.com/openview/8daeb0e840d6e9eb35762f1a00b5c2af/1.pdf?pq-origsite=gscholar
European Commission. 2015. European Union, Trade in goods with Bosnia-Herzegovina, Directorate -General for Trade.” European Commission, A4/G2. http://trade.ec.europa.eu/doclib/docs/2006/september/tradoc_113358.pd Greenaway, D., Morgan, W. and P. Wright. 2002. “Trade liberalisation and growth in developing countries.” Journal of Development Economics, 67, 229–244. http://www.uvm.edu/~wgibson/PDF/Greenaway%20et%20al.pdf Hansen, L.P. 1982. “Large Sample Properties of Generalized Method of Moments Estimators.” Econometrica 50(4), 1029-1054. http://faculty.chicagobooth.edu/john.cochrane/teaching/35904_asset_pricing/Hansen%20econometrica%20GMM.pdf Huchet-Bourdon, M., Le Mouël, C. and M. Vijil. 2011. “The relationship between trade openness and economic growth: Some new insights on the openness measurement issue.” https://hal-agrocampus-ouest.archives-ouvertes.fr/hal-00729399/document Li, H. 2003. “Trade Liberalization and Real Exchange Rate Movement.” IMF Working Paper 03/124. International Monetary Fund. https://www.imf.org/external/pubs/ft/wp/2003/wp03124.pdf Krueger, A.O. 1978. “Foreign Trade Regimes and Economic Development: Liberalisation Attempts and Consequences.” In Bhagwati, N.J. (Ed). Anatomy and Consequences of Exchange Control Regimes. National Bureau of Economic Research, New York. http://www.nber.org/chapters/c3849.pdf Kurtovic, S. and S. Talovic. 2015. Liberalization of Trade with the European Union and its Impact on the Reduction in Central European Free Trade Agreement 2006 Trade Balance Deficit.” International Journal of Economics and Financial Issues, 5(2), 552-565. http://www.econjournals.com/index.php/ijefi/article/download/1078/pdf Mihashi, K. 2009. “The Effect of Regional Trade Agreements on the Global Economy and Society.” Master of Thesis, The Georgetown University. Mostetsching, A.M. 2011. “CEFTA and The European Single Market: An appropriate preparatory exercise?” Master Thesis, Collage of Europe. Nielsen, H.B. 2005. “Generalized method of moments estimation.” http://www.econ.ku.dk/metrics/Econometrics2_05_II/LectureNotes/gmm.pdf Oktaviani, R. and E. Puspitawati Haryadi. 2008. “Impacts of ASEAN Agricultural Trade Liberalization on ASEAN-6 Economies and Income Distribution in Indonesia.” Working Paper Series, No. 51. Asia-Pacific Research and Training Network on Trade. http://www.unescap.org/sites/default/files/AWP%20No.%2051.pdf Paas, T. and E. Tafenau. 2005. “European trade integration in the Baltic Sea Region - A gravity model based analysis.” HWWA Discussion Paper 331. Hamburgisches Welt-Wirtschafts-Archiv (HWWA). http://ageconsearch.umn.edu/bitstream/26263/1/dp050331.pdf Pacheco-López, P. and A.P. Thirlwall. 2005. “Trade Liberalisation, the Balance of Payments and Growth in Latin America.” ftp://ftp.ukc.ac.uk/pub/ejr/RePEc/ukc/ukcedp/0505.pdf
Pal, P. 2004. “Regional Trade Agreements in a Multilateral Trade Regime: An Overview.” http://www.networkideas.org/feathm/may2004/survey_paper_RTA.pdf Robinson, S. and K. Thierfelder. 1999. “Trade Liberalization and Regional Integration: The Search for Large Numbers.” The Australian Journal of Agricultural and Resource Economics, 46(4), 585–604. http://ageconsearch.umn.edu/bitstream/118597/2/1467-8489.t01-1-00057.pdf Santos-Paulino, A.U. 2000. “Trade Liberalisation and Export Performance in Selected Developing Countries.” ftp://ftp.ukc.ac.uk/pub/ejr/RePEc/ukc/ukcedp/0012.pdf Santos-Paulino, A.U. 2001. “The Effects of Trad Liberalisation on Imports in Selected Developing Countries.” ftp://ftp.ukc.ac.uk/pub/ejr/RePEc/ukc/ukcedp/0110.pdf Santos-Paulino, A.U. 2002. “Trade Liberalisation and the Balance of Payments in Selected Developing Countries.” ftp://ftp.ukc.ac.uk/pub/ejr/RePEc/ukc/ukcedp/0202.pdf Santos-Paulino, A.U. 2007. “Trade Sustainability and Aid under Liberalization in Fragile Least Developed Countries.” Research Paper No. 26. UNU-WIDER. https://www.wider.unu.edu/sites/default/files/rp2007-26.pdf Srinivasan, T.N. 2002. “Developing Countries and the Multilateral Trading System After Doha,” Center Discussion Paper No. 842. Economic Growth Center. http://www.econ.yale.edu/growth_pdf/cdp842.pdf Wacziarg, R. and K. Horn Welch. 2008. “Trade Liberalization and Growth: New Evidence.” Working Paper 10152. National Bureau of Economic Research. Cambridge, MA. http://www.nber.org/papers/w10152.pdf World trade organization. 2015. “Regional trade agreements.” Facts and figures. In WTO Homepage. World Trade Organization. https://www.wto.org/english/tratop_e/region_e/region_e.htm. Wu, Y. and L. Zeng. 2008. “The Impact of Trade Liberalization on the Trade Balance in Developing Countries.” IMF Working Paper WP/08/14. International Monetary Fund. https://www.imf.org/external/pubs/ft/wp/2008/wp0814.pdf
Appendix
Figure A1 The export of B&H in the main trading partners
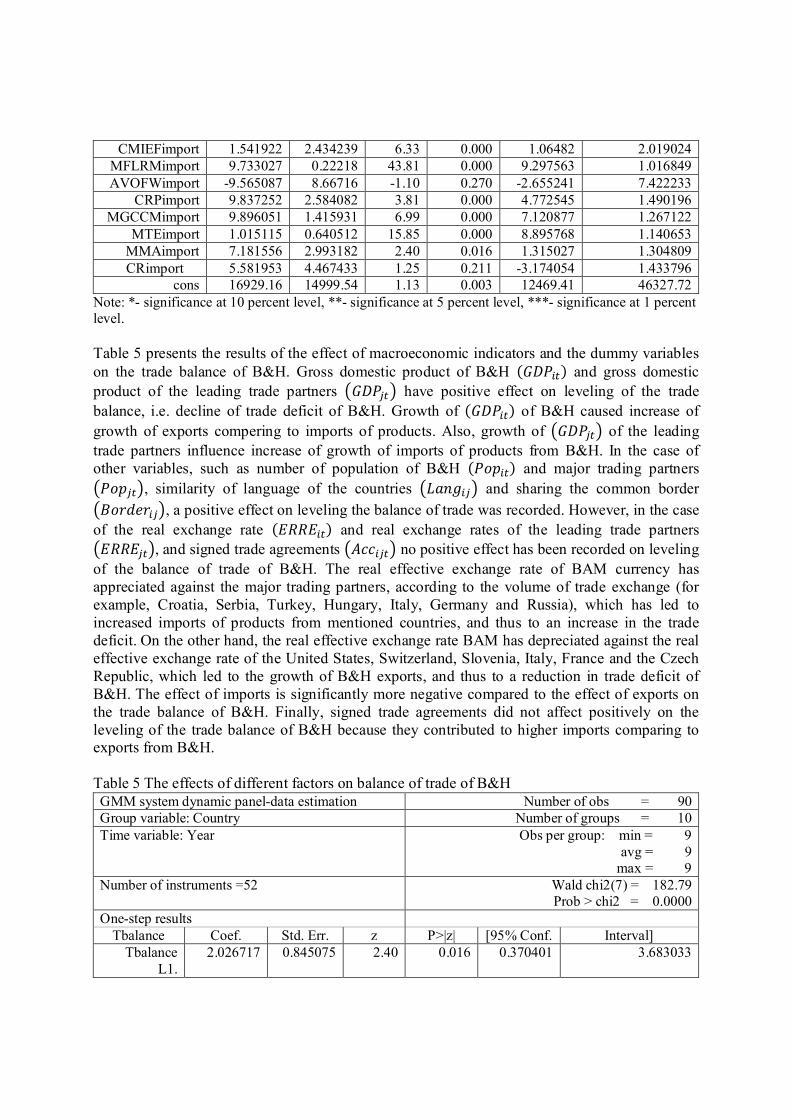
Figure A2 Imports of B&H from major trading partners
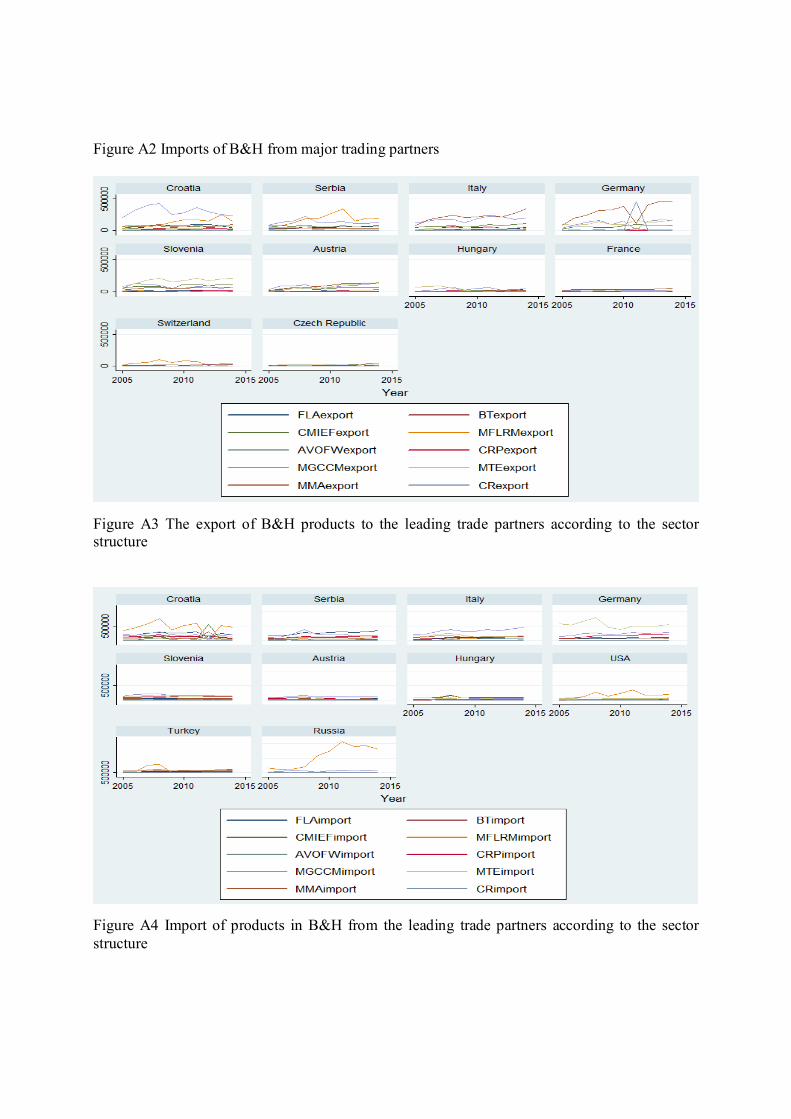
Figure A3 The export of B&H products to the leading trade partners according to the sector structure
Figure A4 Import of products in B&H from the leading trade partners according to the sector structure