Page 1
MPRAMunich Personal RePEc Archive
Determinants of students’ loyalty touniversity: A service-based approach
Mazhar Ali and Masood Ahmed
Shaheed Zulfikar Ali Bhutto Institute of Science &Technology,Karachi.Pakistan.
5 February 2018
Online at https://mpra.ub.uni-muenchen.de/84352/MPRA Paper No. 84352, posted 7 February 2018 18:38 UTC
Page 2
1
Determinants of students’ loyalty to university:
A service-based approach
Working Paper
First Author Mazhar Ali
Shaheed Zulfikar Ali Bhutto Institute of Science & Technology,Karachi.Pakistan [email protected] (Corresponding Author)
Second Author Masood Ahmed
Shaheed Zulfikar Ali Bhutto Institute of Science & Technology,Karachi.Pakistan
Page 3
2
Abstract
This study is conducted to find determinants of student loyalty to the university. The
determinants of student loyalty have been studied before, but the majority of the studies have
covered just main determinants of loyalty such as student satisfaction, service quality and
university image, but ignored university switching cost as a factor of student loyalty,
interrelationships of all these antecedents and their collective impact on student loyalty. Despite
many studies on student loyalty, the literature still lacks the comprehensive definition of student
loyalty. This study has been conducted to fill these knowledge gaps and propose a
comprehensive model depicting elaborate relationships of all important antecedents of student
loyalty. This study has covered perceived academic quality, perceived administrative quality,
physical facilities, student satisfaction, university image, and university switching cost as
determinants of student loyalty. The data is analyzed through Exploratory Factor Analysis and
structural equation modeling (SEM) using AMOS. The results reveal the significant impact of
student satisfaction and perceived university image on student loyalty. This study has important
implications for academics to enhance student loyalty.
Keywords:
student loyalty, university switching cost, perceived service quality, student satisfaction,
university image
Page 4
3
Introduction
Higher Education is critical to the development of a country (Annamdevula & Bellamkonda,
2016).It is desirable to offer high-quality education to students. In the current scenario, Higher
Education Institutes (HEIs) are facing severe competition to attract new students and retain
them.it is important for policymakers to device ways to increase student loyalty (Austin &
Pervaiz, 2017). Loyalty is not restricted to the duration of students stay at university but
continues even after their graduation (Giner & Peralt Rillo, 2016). Student Loyalty helps in
increasing student enrollment (Taecharungroj, 2014). Consequently, HEIs are increasingly
following marketing strategies to attract a large pool of students to their respective universities
(Hemsley-Brown & Oplatka, 2010). Academics are also capturing this development. Andreasen
and Kotler (2008) referred to extending marketing concept to not for profit organizations such as
hospitals, churches and universities. Ivy (2008) studied 7 Ps of Marketing. Lau (2016) studied
eight Ps of Marketing. In addition to 3 Ps of services marketing (People, Process, Physical
Evidence), Productivity and Quality of education was taken as 8th P. Universities are devising
marketing strategies to keep students loyal to them. Ogunnaike, Borishade, Sholarin and Odubela
(2014) in their study applied seven P’s of marketing to find their impact on student loyalty.
Universities are striving to establish a bond with students which they wish to continue even after
their graduation reaping benefits for both of them.
It is vital for university management to know what factors lead to student loyalty. The
antecedents of loyalty will guide management of universities to devise policies aiming at
retention of students. The main determinants of student loyalty are perceived service quality
(Douglas et.al, 2006), student satisfaction (Alves & Raposo, 2007a) and university image
(Nguyen & LeBlanc, 2001). Determining which facets of university experience are crucial for
student satisfaction and their magnitude of impact, are the continuous subject of inquiry
(Elsharnouby, 2015).Though there is an adequate number of research studies on determinants of
student loyalty but there are some following knowledge gaps identified in this study:
(1) There are studies on student loyalty conducted in one university (Mohammad Hani
Al-Kilani & Naseem Twaissi, 2017; Austin & Pervaiz, 2017) and also in multiple universities
(Pradeep Kumar Nair, & Neethiahnanthan Ari Ragavan, 2016; Hsu, Wang, Cheng, & Chen,
2016; Annamdevula & Bellamkonda, 2016; Choudhury, 2015) but generally were limited to few
antecedents of student loyalty except few studies (Helgesen & Nesset, 2007; Hennig-Thurau et
Page 5
4
al., 2001; Sultan & Yin Wong, 2012; Schlesinger, Cervera, & Pérez-Cabañero, 2016), which
have captured a holistic view of students’ loyalty and measured the impact of the multiple
determinants of student loyalty simultaneously. This study will be an addition to such sparse
studies which will not only look at various antecedents of student loyalty but also their
interrelationships.
(2) Switching cost as a very important antecedent of customer loyalty concept has not
been used in the context of university education, though it had been used by earlier studies (Blut,
Beatty, Evanschitzky, & Brock, 2014; Blut, Frennea, Mittal, & Mothersbaugh, 2015; de Matos,
Henrique, & de Rosa, 2013; Minarti & Segoro, 2014; Stan, Caemmerer, & Cattan-Jallet, 2013)
as a determinant of customer loyalty. Considering the Pakistani education system not having a
unified grading system, the different stream of courses in different universities and highly
diverse eligibility criteria for admitting students result in some switching costs to students
thinking of changing their universities. This antecedent is quite relevant to intense competition
among universities. The switching cost to change university is relevant to Pakistan in particular
and the world in general. It is going to contribute to the literature of student loyalty
(3) The definition of student loyalty has not been adapted considering its unique
conception. This study is going to adapt the highly cited definition of customer loyalty by Oliver
(1999).
In addition to the above-given justification of this research study, there are some
peculiarities of Pakistani education set up. Unlike western countries where students benefit from
soft education loans which they return once they start earning an adequate amount (Nedbalová,
Greenacre, & Schulz, 2014), most universities in Pakistan don’t provide loans; even if they do, it
is to be returned soon. The majority of the universities claims to offer scholarships, but only a
very small proportion of students avail it. When students have to earn while studying, they tend
to become more demanding considering themselves as customers. Another aspect is that
management of universities hardly keeps a formal relationship with their alumni by forming their
alumni bodies. In contrast to it, the students in the USA automatically become alumni members
(Hoffmann & Müller, 2008) while in Germany and Russia, graduating students are offered to
become alumni members (Iskhakova, Hilbert, & Hoffmann, 2016). Considering very low
tendency of universities in Pakistan to maintain a long-lasting relationship with its students, there
is a need to find out the level of attachment or loyalty students feel for their universities so that
Page 6
5
management of universities may reconsider the orthodox pattern of terminating their relationship
with students as soon as they graduate.
The objective of this research study is to fill these knowledge gaps and propose a
comprehensive model depicting major determinants of loyalty and their elaborate
interrelationships. This study aims to suggest management of universities to take measures to
optimize student loyalty. This paper has been organized as first it will cover the debate of
considering the students as customers, literature review of factors influencing student loyalty
then service quality models, research methodology, data analysis, discussion, conclusion,
managerial implications and finally areas of future research.
Students as customers
The concept of students as customers is not completely agreed upon. The proponents who are
drawing an analogy between students and customers believe that the service quality can be raised
by incorporating marketing mindset (Hennig-Thurau, Langer, & Hansen, 2001). The treatment of
students as customers is open to debate in academic circles
Getting a degree is not like buying a car, which only requires buyers to pay for it. The
students pay for education, but their tuition fee can’t buy them degree (Emery, Kramer, & Tian,
2001). Treating students as customers may free students from their responsibility of doing hard
work for success (Clayson & Haley, 2005). They may simply blame teachers in return for their
failure. The notion of “customer is always right” cannot be incorporated in imparting education
in universities (Bay & Daniel, 2001). The say of students may be accommodated at the cost of
academic excellence (Sirvanci, 1996). The academics are likely to serve the interest of students
better even if it is not appreciated by students.
The treatment of students as customers may make teachers please their students even at
the cost of compromising desired rigor (Clayson & Haley, 2005) .There is a conceptual gap
between what students and teachers want (Nguyen & Rosetti, 2013). There is a tendency of
students to critically evaluate demanding teachers which will affect the future progress of such
teaching staff (Yunker & Yunker, 2003). On the other side, there is a positive correlation
between grade students receive and their evaluation of teachers’ performance (Marsh & Roche,
2000). If teachers dilute the content of course, to make life easier for students and make them
happy by showing unnecessary generosity, it will be counterproductive in the long run. It will
also kill the basic premise of raising the quality of education by treating students like customers.
Page 7
6
Students have to grow intellectually which may require students to go through tough time at
university (Yeo & Li, 2014) .Other stakeholders such as employers, government and society may
be more apt to be treated like customers compared to students (Bogler & Somech, 2002).
The main criticism of treating students as customers lies in completely assuming students
to be as empowered and independent of acquiring products of their choice as they would like.
The criticism of treating students like customers fails to differentiate between Marketization and
Marketing.
Marketization
The academic competition among universities existed even centuries before but what has
changed over a decade or two is the Marketization of education resulting into the
commodification of education (Furedi, 2010). Here Marketization refers to the influence of
market competition on academic life (Judson & Taylor, 2014; Williams, Hartman, & Cavazotte,
2010). The most detrimental effect of marketization is its ability to transform relationship
between teachers and learners to a relationship between service provider and customer (Hall,
2017). It led to a metaphor of student as customer. As a result, student satisfaction got
importance like customer satisfaction. The performance of faculty is now judged mainly by
students’ feedback. Student feedback, whether positive or negative, helps Higher Education
Institution to improve quality of service(Robinson & Celuch, 2016) but heavy reliance on student
feedback may not be a good idea to improve quality of education (Yeo & Li, 2014).
The tuition fee structure also got affected by commercialization. The marketization of
education pushed up the cost of education because a high quality product is seldom available on
low price. The same trend is witnessed in private institutions of Higher education in Pakistan.
The rising cost of education is affecting its treatment as a public good (Judson & Taylor, 2014).
The Increasing commercial aspect of providing education is convincing students to be treated
like customers (Eagle & Brennan, 2007).
Marketing
Marketing aims to cater to consumer needs, while the societal aspect of marketing takes care of
not only customer needs but also its long-term impact on society (Kotler & Armstrong, 2009).
Drawing a parallel between the traditional view of customers and students is also against the
societal view of marketing which backs long-term benefit instead of short-term benefits
prevailing in commercialization. Students also don’t want to compromise on the quality of
Page 8
7
education in the guise of assumed consumer identity. Harvard University and Stanford
University have highly stringent standards but even then they continue to attract students around
the world. In the study of Koris, Örtenblad, Kerem, & Ojala (2015), students desired consumer
point of view only in peripheral aspects of education quality such as the behavior of
administrative staff and physical facilities available at the campus but wanted no compromise on
desired rigor in class rooms. The outcomes of poor quality of the education lead to not only
monetary cost, but also intangible costs such as student dissatisfaction, loss of reputation and
opportunity costs (Eagle & Brennan, 2007)
Contemporary view of service marketing
The criticism of considering students as customers is based on outdated marketing approach
(Mark, 2013). Service marketing now includes an aspect of co-creation of quality (Guilbault,
2016; Chavan, Bowden-Everson, Lundmark, & Zwar, 2014), where customers contribute in the
overall delivery of a service. In the same way, students participate in the service delivery. Their
hard work is also desired in addition to hard work, dedication and capability of the teacher.
Contemporary view of a student as co-producer of quality will not deteriorate the rigor required
for students to excel (Guilbault, 2016).
Education scenario in Pakistan
The Higher Education Commission of Pakistan governs higher education in Pakistan. It
evaluates the performance of universities and ranks them so that students can judge all potential
universities where they are seeking admission. It provides grants for scholarship within and
outside Pakistan. It provides financial and technical help to universities to raise the quality of
education in Pakistan. It has made different accrediting bodies for different disciplines. For
management science, National Business Accreditation Council (NBEAC) accredits the Bachelor
and Master programs of universities. Higher Education Commission of Pakistan ranks
universities on the basis of quality assurance, teaching quality, research, finance, facilities, social
integration and community development.
The mushroom growth of private educational institutions in Pakistan, especially business
schools, has given students more options to make their choices from. It is inevitable for
universities to listen to the voice of students (Elsharnouby, 2015). Rising competition is pushing
universities to raise the quality level so that students choose the same university for their future
Page 9
8
educational needs. It is costly to attract new students than to retain current students (Rojas-
Mendez, Vasquez-Parraga, Kara, & Cerda-Urrutia, 2009). The positive feedback of graduate
students of a university to their siblings, friends and relatives convinces them to prefer the same
university for their educational needs. When students choose an educational institute, they
consider many aspects such as perceived academic quality, perceived administrative quality,
perceived physical facilities and university image.
Literature Review
Perceived Service Quality
In earlier consumer literature, there is a debate about objective quality and perceived quality,
covered by Zeithaml (1988). Objective quality is technical superiority or inferiority of a product
based on some objective criteria. Perceived quality is a consumer’s judgment about product
quality. Technically, it is difficult to determine objective quality. Specification of a product
could only be explained objectively, but how well a product fulfills pre-determined criteria, is
always perceived, either by consumer or an expert. It is overall judgment rather than product
performance in one or two attributes.
Perceived service quality is an assessment of service delivered (Parasuraman, Zeithaml,
& Berry, 1988). Service Quality is an attitude toward service provider (Cronin & Taylor, 1992).
Perceived quality is broader or overall assessment of service (Sultan & Yin Wong, 2012). It is a
general perception resulting from objective information and reputation and not necessarily from
personal experience (Letcher & Neves, 2010). In this study, the university has been classified as
a service providing organization that is why university education will be treated like a service.
The reason of treating education sector like any other service lies in its embodiment of service
characteristics-Intangibility, Inseparability, Variability and Perishability (Shank,Walker &
Hayes, 1996; Winter & Chapleo, 2017; Yeo & Li, 2014).
Service quality has many dimensions in university setup. Douglas et.al (2006) mentioned
three components of service quality :(1) Physical goods (2) Explicit (3) Implicit. Physical goods
cover facilities to the student which expedite learning such as state of the art computer labs,
appealing infrastructure, canteen, uninterrupted internet service etc. Explicit service deals with
quality of teaching. Implicit service is about how students are treated by staff, especially when
they have any problem; whether the staff is courteous or not or is there a concern for feelings of
Page 10
9
students or not? Brown & Mazzarol (2009) refer to terms human-ware to connote people and
processes and hardware to connote physical infrastructure. Manzuma-Ndaaba, Harada, Romle, &
Shamsudin (2016) divide service into the core, augmented and tangible layers. The core includes
attainment of a degree, certificates and knowledge. Augment level covers courtesy of teachers
and staff and their sincerity and responsiveness. The tangible layer points to architecture of
building, library, labs and other learning facilities
Despite multidimensional aspects of service quality, the importance given by students to
different aspects of service quality is not same. Some aspects are more important than other.
Some are key areas (Devinder & Datta, 2003) and others supportive. The quality of teaching is a
core area (Hill, Lomas, & MacGregor, 2003), which affects overall evaluation of quality (Bowen
& Schneider, 1995).In the study of Douglas et. al (2006), students were asked to rank service
quality dimensions with respect to importance. Results showed that teaching ability, subject
knowledge, consistency of quality, information technology facilities were ranked more important
compared to the parking area, vending machines, decoration in tutorial rooms, layout of lecture
facilities, seminar rooms and cafeteria quality.
Service Quality Models
There are many service quality models but two of them-SERVEQUAL and SERVPERF-are way
ahead than other models in terms of usage and popularity. The SERVQUAL model was given
by Parasuraman et.al (1988) which measures service quality through the difference of
expectation and perception known as disconfirmation approach. It provides five dimensions of
service quality to measure service quality: Reliability, Responsiveness, Empathy, Tangibles and
Assurance. Later SERVQUAL was criticized over its scope (Brady & Cronin, 2001; Caruana,
Ewing, & Ramaseshan, 2000; Choudhury, 2015), predicted power (Letcher & Neves, 2010) and
dimensions (O’Neill, 2003; Cuthbert, 1996; Sahney, Banwet, & Karunes, 2004). To address
criticism another model SERVPERF was presented by Cronin & Taylor (1992). It considers
perceptions only to measure service quality. SERVPERF is a better measure than SERVPERF in
reliability, convergent and discriminant validity and higher explained variance(Abdullah, 2006;
Llusar & Zornoza, 2000; Parasuraman, Zeithaml, & Berry, 1994; Quester, Romaniuk, &
Wilkinson, 2015). Some specific scales related to education section sector were designed by
Abdullah (2006) and Kashif, Ramayah, and Sarifuddin (2016). The former was adapted from of
SERVPERF and later from SERVQUAL. When we look at the use of these service quality
Page 11
10
models in education section, we see use of SERVEQUAL (Jiewanto, Laurens, & Nelloh, 2012;
Kashif et al., 2016; Choudhury, 2015; Stodnick & Rogers, 2008) and SERVPERF(Alves &
Raposo, 2007a; Brown & Mazzarol, 2006; Helgesen & Nesset, 2007; Sultan & Ho Yin Wong,
2012a; Annamdevula & Bellamkonda, 2016) in many studies. Carrillat, Jaramillo, and Mulki
(2007) have reviewed research studies of 17 years and concluded that both SERVQUAL and
SERVQUAL are almost equal in importance. The usage either of two may depend on specific
objectives of the research study. Therefore, most researchers recommend that, if the objective of
the study is to predict service quality or to gauge its determinants, the SERVPERF measure
should be used (Sultan & Yin Wong, 2012). This research study will also use Skelton of
SERVPERF. It will use the perception of students to measure service quality.
This study will manifest service quality in three dimensions which are perceived
academic quality, perceived administrative quality and perceived physical facilities. This
conception of quality is taken from Sultan & Yin Wong (2013) due to its resemblance to the
setup of Pakistani universities. The things related to teaching and learning are part of academic
quality (Sultan & Yin Wong, 2013). The knowledge and expertise of the teacher in delivering
lectures and his response to student queries form the backbone of academic quality. The
activities which facilitate in conducting academic activities like administrative and support staff
conduct in solving student queries shape administrative quality (Sultan & Yin Wong, 2013). It
deals with the individual matters of students such as registration into and withdrawal from
course, the process of holding an event in the campus and process of applying for a reference
letter. Satisfaction with respect to support services is gauged through complaints and feedback of
students (Yeo & Li, 2014).Physical facilities include things like a cafeteria, parking, classroom
facilities, computer labs, sports facilities and avenues for entertainment (Douglas et.al, 2006).
Potential students expect university buildings to be well designed and aesthetically pleasing
(Winter & Chapleo, 2017). a capacious place for studying, working in Labs and studying in
library contribute to overall service quality (Yeo & Li, 2014).
Page 12
11
Figure1: quality dimensions
Student Satisfaction
A positive attitude after customer experience is satisfaction (Fornell, Johnson, Anderson, Cha, &
Bryant, 1996). Customer satisfaction of a product refers to favorableness of the individual’s
subjective evaluation of the various outcomes and experiences associated with buying it or using
it (Hunt, 1977). The concept of satisfaction emerges from customer’s evaluation of service
delivery in comparison to formed expectation (Nesset & Helgesen, 2009). Customer satisfaction
is a comparison of pre-purchase expectations and post-purchase performance (Anderson, Fornell,
& Lehmann, 1994).
A satisfied customer is likely to repurchase products and also patronize them in his social
circle by passing on favorable word of mouth (Cheng, 2011). When a student selects a
university, he also has a set of expectations from the university. Those expectations are normally
the result of university image in general public and promises made by the university. Higher
expectations set low tolerance level among students for low quality (Yeo & Li, 2014).When a
student studies in university for a couple of years, he gets many opportunities to evaluate service
quality. Quality of service affecting student satisfaction may include teachers’ expertise, offered
subjects, learning environment and classroom facilities. The study of Mazirah Yusoff, Fraser
McLeay, & Helen Woodruffe-Burton (2015) mentions 12 dimensions of student satisfaction
which are professional comfortable environment, student assessment and learning experiences,
Perceived Service Quality
Perceived Academic Quality
Perceived Administrative
Quality
Perceived Physical facilities
Page 13
12
classroom environment, lecture and tutorial facilitating goods, textbooks and tuition fees, student
support facilities, business procedures, relationship with the teaching staff, knowledgeable and
responsive faculty, staff helpfulness, feedback, and class size.
University Image
The image of higher education institute is one of the most important factors for selecting an
educational institute (Sahin & Singh, 2017). Image of university helps in getting a job (Polat,
Arslan, & Yavaş, 2016). The concept of the brand image may be applied in universities
(Landrum, Turrisi, & Harless, 1999). An image is a perception of an organization reflected in
associations held in consumer memory (Keller, 1993). The image can be described as ‘mental
representation of a real object that acts in place of that object’ (Capriotti, 1999 as cited by Beerli
Palacio, Díaz Meneses, & Pérez Pérez, 2002). The image of the university can be studied in the
guise of corporate image. Corporate image is an overall impression on customers as a result of
their usage experience with products (Zimmer & Golden, 1988).It is a public impression of the
corporation (Leiva, Ferrero, & Calderón, 2016).It is some sort of psychological personality
profile (Haedrich, 1993).
University image refers to the image perceived by the external public such as the
employer, Govt.Institutions, graduates and the general public and internal public such as
students, professors, administrative and service employees (Guedez & Osta, 2012).The
perception of companies about a university student is shaped by university image (Parameswaran
& Glowacka, 1995). The institute image has both functional and emotional aspects (Pérez &
Torres, 2017; Beerli Palacio et.al, 2002). Functional aspects deal with the things like educational
facilities and infrastructure and emotional aspects are linked to student feelings. University
image is shaped by different attributes of a university such as university location, type of
university, complexity in admission ,programs offered by university, budget level , tuition
fee(Galinienë, Marèinskas, Miḥkinis, & Drûteikienë, 2009) service to students, scientific
researches, academic staff , academic program and quality of university graduates (Polat et al.,
2016).
The image of an organization is not a unique entity. The image of an organization may be
different for different stakeholders (Nguyen & LeBlanc, 2001) .For instance; employees,
business partners, clients and shareholders may hold different images depending on their
experiences and associated interests. In the same way, the image of a university may be different
Page 14
13
for students, employees, employers and fund donors. This research study will measure students’
perceived image about their university in their social circle, in general public and among
employers.
University Switching Cost
The retention of customers could be enhanced through high customer satisfaction and
high perceived switching costs (Ranaweera & Prabhu, 2003). Switching cost is referred to as a
cost a buyer pays as a result of switching from one service provider to another (Porter,
1980).Switching cost refers to losses incurred upon moving from one supplier to other (El-
Manstrly, 2016). The cost is not limited to monetary form but also includes physical and
psychological costs (Jackson, 1985).Normally switching cost concept is used where consumers
have other choices available and they have the potential to switch. A higher switching cost leads
to retention of customers (Blut et.al, 2015; Keaveney & Parthasarathy, 2001) which is reflected
in the conception of behavioral loyalty (Jacoby & Kyner, 1973).
There are switching costs attached to the decision of taking admission to another
university such as financial cost, search cost, time cost and psychological costs (Mohamad &
Awang, 2009a). Students may have to pay higher tuition fee or they have to take some additional
courses. The students may have to contact different universities for finding out information
which takes additional effort and also consumes time. Students may have to go through a phase
of uncertainty (psychological cost) thinking whether their completed courses will be accepted by
the university they are seeking admission in, or not. The concept of switching has been ignored
by researchers who have worked on factors affecting student loyalty. In the wake of ample
choices available to students, it has been decided to incorporate this concept in this study.
Student Loyalty
Customer Loyalty is a vital measure of success in any organization (Nyadzayo &
Khajehzadeh, 2016). Loyalty is a feeling of attachment to goods or services which has a direct
impact on consumer behavior (Jones & Sasser, 1995). The most famous definition of loyalty is
given by Oliver (1999) which describes loyalty as ‘a deeply held commitment to rebuy or
repatronize a preferred product or service consistently in the future, despite situational influences
and marketing efforts having the potential to cause switching behavior’. This definition implies
multiple choices available to customers and their freedom to move from one service provider to
other. Loyal consumers tend to repurchase same brands again and again (Ram & Wu, 2016)
Page 15
14
which points towards behavioral loyalty. One main conceptual issue with behavioral loyalty is
that it often ignores latent loyalty, which is characterized by a highly favorable attitude toward
product but less frequent purchase due to competitive or social pressures (Dick & Basu, 1994).
Likewise, at times customers repurchase a product due to few options but don’t hold a favorable
opinion about the performance of product or service. Truly loyal consumers not only repurchase
same brands but also hold a favorable attitude toward brand/product (Ali, Kim, Li, & Jeon,
2016). Therefore, loyalty has two main subdivisions -Attitudinal Loyalty and Behavioral Loyalty
(Jacoby & Kyner, 1973). Our conception of loyalty encompasses both aspects of loyalty.
In the education sector, students also get exposed to many choices when they opt for
higher education. They can continue studying in the same institute where they were studying
before or they may try a new institute. If students are satisfied with their experience, then they
may remain loyal to their institutions. Student loyalty has both behavioral and attitudinal aspects
(Vianden & Barlow, 2014). Behavioral student loyalty is the intention to continue education at
the same university and also prefer the same institute for future educational needs (Mohamad &
Awang, 2009a). In terms of attitude, loyal alumni may support its alma mater through
institutional donations, providing a helping hand to graduates of the same university, placing
interns and spreading word of mouth (Hennig-Thurau et al., 2001).
Considering the unique nature of student loyalty, definition given by (Oliver, 1999) can
be adapted as ‘a deeply held commitment to repeat selection of a university for educational needs
in the presence of competitive options, advocate in one’s professional and social circle and, as
alumni, extend cooperation to its alma mater and its graduates’. Loyalty is not restricted to the
duration of students stay at the university but continues even after their graduation (Giner &
Rillo, 2016; Schlesinger et.al, 2016).
Iskhakova et.al. (2016) proposed a model for alumni loyalty. They mentioned strong
support of alumni in financial as well as non-financial matters. Even if alumni doesn’t come back
to study, its attitudinal loyalty (having a positive attitude about institution) can indeed be used to
raise the quality of education by engaging them in academic activities of universities. They
suggest that if students are considered alumni from day one, maximum support can be solicited
from them after graduation. In the current scenario of high competition and financial challenges,
alumni loyalty is very important for success (Schlesinger et al., 2016). Alumni body can help in
curriculum development and hiring of graduates (Hsu et.al, 2016))
Page 16
15
University Image & Loyalty
The corporate image does influence loyalty of customers (Nguyen & LeBlanc, 2001). Positive
corporate image increases purchase frequency and leads to customer retention (Bloemer & Gaby,
2002) but in the study of Cheng (2011), Image only had an impact on attitudinal loyalty but
insignificant impact on behavioral loyalty. Image of institute affects student loyalty (Helgesen &
Nesset, 2007).Image of the study program and university image both have an impact on student
loyalty (Helgesen & Nesset, 2007). In the study of Alves & Raposo (2007a), university image
had a significant impact on student loyalty. Brown and Mazzarol (2009) demonstrated the effect
of university image on student loyalty.Therefore, it is assumed that:
H1: Perceived University Image impacts Student Loyalty
Satisfaction & University Image
The link between satisfaction and corporate image is verified by Andreassen and Lindestad
(1998) especially when the customer is not well informed. The literature mentions the mutual
influence of satisfaction and image over each other. Beerli Palacio et al. (2002) in their study
found that cognitive and affective components of perceived university image influence student
satisfaction. In their study involving 6775 students, the overall university image influenced
student satisfaction. On the contrast, Alves and Raposo, (2007a) reported the highest impact of
university image on satisfaction. Helgesen and Nesset (2007) in their study about the antecedents
of student loyalty demonstrate that it is the satisfaction which drives university image rather than
image influencing student satisfaction. The satisfaction of students improves university image
(Ali et al., 2016; Sultan & Yin Wong, 2012; Taecharungroj, 2014). The relationship between
university image and student satisfaction is hypothesized as under:
H2: Student Satisfaction influences University Image
Service quality & university image
Service quality does influence university image (Jiewanto et al., 2012). A higher level of service
quality will lead to a favorable image of the service provider (Polat et al., 2016; Nguyen &
LeBlanc, 2001). Normally customers do have some image about the service they opt for; but the
actual delivery of service may improve or deteriorate brand image (Grönroos, 1984).The service
quality which lives up to expectation improves university image(Tan et al., 2013). Therefore, it
could be assumed that:
Page 17
16
H3 :(a) Perceived Academic Quality has an impact on University Image
H3: (b) Perceived Administrative Quality has an impact on University Image
H3 :(c) Perceived Physical Facilities have an impact on University Image
Service Quality & Student Loyalty
The service quality of university was broken into main components: Perceived Teaching Service
(PTS) and Perceived Administrative Service(PAS) by Lin and Tsai (2008). PTS deals with
teaching pedagogy and PAS deals with supportive services which are peripheral to learning such
as physical facilities and student affairs. Their study reported that PTS had a direct impact on
student loyalty while PAS had an insignificant direct impact. The direct impact of service quality
on student loyalty was not found in the studies of Mohamad and Awang (2009a) and Dabholkar,
Shepherd, and Thorpe (2000) but contrary to it, highest impact of service quality on student
loyalty was found in the study of Hennig-Thurau and Hansen (2001). Recently a positive
relationship between service quality and student loyalty was proposed by Manzuma-Ndaaba
et.al (2016) and empirically found in the study of Al-Kilani and Naseem Twaissi (2017). It leads
us to the following assumptions.
H4 : (a) Perceived Academic Quality has an impact on Student Loyalty
H4 : (b) Perceived Administrative Quality has an impact on Student Loyalty
H4 : (c) Perceived Physical Facilities have an impact on Student Loyalty
Service Quality & Satisfaction
The relationship between service quality and satisfaction has been reported in many studies
(Caruana et al., 2000; Chen, Hsiao & Lee, 2005). There are eight areas of service quality which
have a direct impact on satisfaction including valuable course offers, library quality, computers,
self-study area, public transport, attitude towards students, teaching and availability of quiet
areas. Good quality positively affects satisfaction and poor quality negatively influences
satisfaction. For instance; increase in class size will lead to decrease in student satisfaction
(Coles, 2002). Perceived service quality has a direct impact on student satisfaction (Ali et al.,
2016; Manzuma-Ndaaba et al., 2016; Sultan & Ho Yin Wong, 2014; Kärnä & Julin, 2015). It
leads us to the following hypothesis.
H5: (a) Perceived Academic Quality has an impact on Student Satisfaction
H5: (b) Perceived Administrative Quality has an impact on Student Satisfaction
Page 18
17
H5: (c) Perceived Physical Facilities have an impact on Student Satisfaction
Switching Cost & Student Loyalty
Perceived switching cost is an important factor in customer loyalty (El-Manstrly, 2016; Lewis,
2002). Many research studies reveal the fact that unsatisfied consumers may not defect in the
presence of high switching cost (Cheng, 2011).When the cost of switching from one service
provider to other exceeds perceived gains, an exit barrier comes into being (Jones & Suh,
2000).The switching cost leads to retention of customers (Caruana, 2003; Ghazali, Nguyen,
Mutum, & Mohd-Any, 2016) .In the study of cheng (2011), perceived switching cost had a
significant impact on both behavioral and attitudinal loyalty. Therefore, it could be assumed that:
H6 : University Switching Cost influences Student Loyalty
Student Satisfaction & Loyalty
There are a number of studies (Alves & Raposo, 2007a; Brown & Mazzarol, 2006; Helgesen &
Nesset, 2007; Mohamad & Awang, 2009a; Nesset & Helgesen, 2009; Paswan & Ganesh, 2009)
where student satisfaction has had a direct and significant impact on student loyalty. If students
feel satisfied with the academic and administrative quality, they tend to remain loyal to the
university and are more likely to choose the same institution for future needs. There is immense
empirical evidence regarding the effect of student satisfaction on loyalty (Annamdevula &
Bellamkonda, 2016; Khoo, Ha, & McGregor, 2017).Therefore, it is proposed that:
H7: Student Satisfaction influences Student Loyalty
Page 19
18
Figure 2: Conceptual framework
Methodology
The population for this research study was the bachelor students of all business schools of
Karachi. The universities and degree awarding institutions mentioned on the higher education
commission website have been considered for estimating population. The target population
included students of those private and semi Govt. Universities whose flagship programs were
business studies. The selection of universities excluded public universities whose cost of
education was significantly lower than private universities.
The sample size was 503 students from five universities. Initially, it was decided to collect
samples of 100 students from each university, but the number of students varied due to
inconsistent cooperation level and the different number of desired students in targeted
universities. Students were not given any financial or any other incentive to participate in this
study; they participated voluntarily. Out of 5 institutions, the three institutions were famous in
terms of Higher Education Commission (HEC) of Pakistan ranking and corporate image, while
the other two institutions were mediocre in the same criteria. It was an intended move to receive
diversified views of students. The students for research were supposed to be senior
Page 20
19
undergraduate students who had passed two to three years in business school. The reason of their
selection was that they had passed enough time in the institute or university to evaluate all facets
of quality education. Another important reason was that all of these students would be faced with
the decision of continuing in the same institute or choosing another business school for their
Master of Business Administration degree. The sampling technique was purposive.
It was basically a quantitative research employing survey research methodology. The
questionnaire was used for data collection. The items of perceived academic quality and
perceived administrative quality were adapted from Chen et.al (2005).The items of Physical
facilities, Student Satisfaction and University Image were adapted from Helgesen and Nesset
(2007). Since the items of switching cost related to university covering multidimensional aspects
were not available, therefore, items were designed keeping in view conceptual dimensions-
Financial, Time, Psychological - given by Mohamad and Awang (2009a). Its validity was
ensured through the face validity, convergent validity and discriminant validity. Items of student
loyalty were adapted from Hennig-Thurau, Langer and Hansen (2001). The items of Perceived
Academic Quality, Perceived Administrative Quality and Perceived Physical Facilities were
evaluated against 5 point scale ranging from “Very Satisfied” to “Very Dissatisfied” Options.
Perceived University Image was measured against 5 point scale ranging from “Very Good” to
“Very Bad”. Whereas, Student Satisfaction, Switching Cost and Student Loyalty were measured
against 5 point scale ranging from “Strongly Agree” to “Strongly Disagree”.
Data Analysis
The total sample size was 503 students. There was a very small number of cases having missing
values. According to hair et.al (2010), if such cases are very small to have any major impact on
the result, they could be deleted. Therefore, the filled questionnaires having any missing values
were deleted. The workable sample was 489. Since some items were contextualized and some
new items designed, it was needed to perform exploratory factor analysis (EFA
Page 21
20
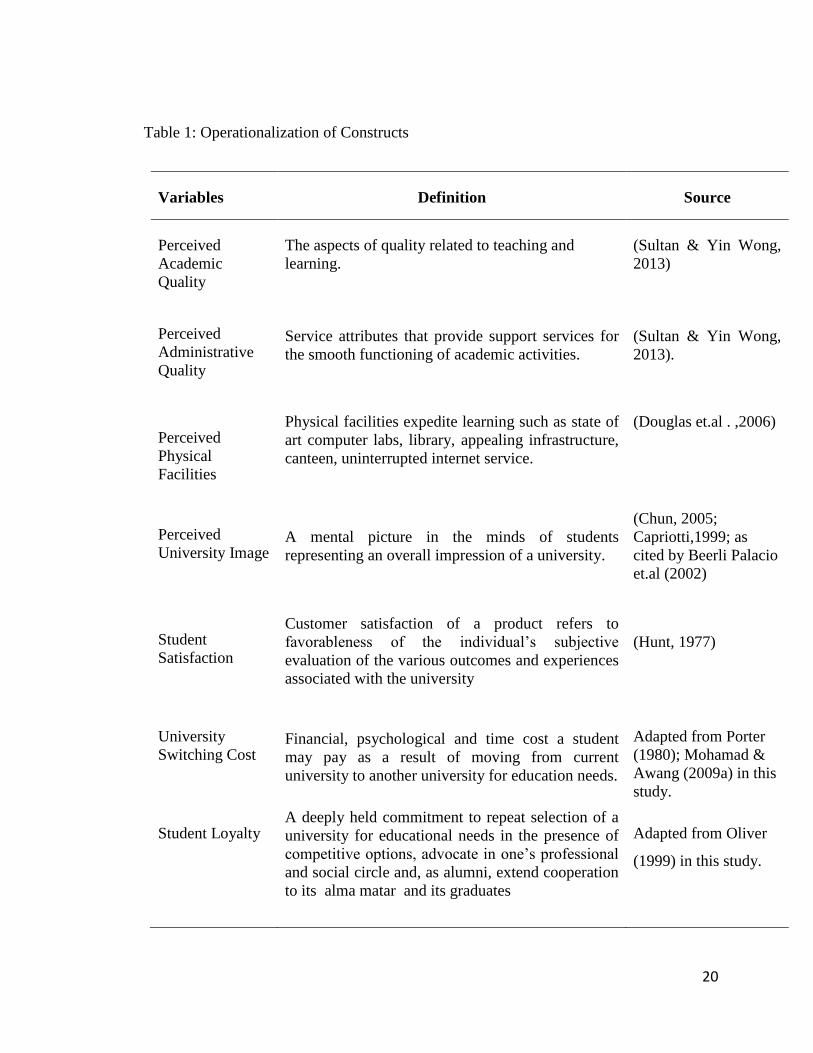
Table 1: Operationalization of Constructs
Variables Definition Source
Perceived
Academic
Quality
The aspects of quality related to teaching and
learning.
(Sultan & Yin Wong,
2013)
Perceived
Administrative
Quality
Service attributes that provide support services for
the smooth functioning of academic activities.
(Sultan & Yin Wong,
2013).
Perceived
Physical
Facilities
Physical facilities expedite learning such as state of
art computer labs, library, appealing infrastructure,
canteen, uninterrupted internet service.
(Douglas et.al . ,2006)
Perceived
University Image
A mental picture in the minds of students
representing an overall impression of a university.
(Chun, 2005;
Capriotti,1999; as
cited by Beerli Palacio
et.al (2002)
Student
Satisfaction
Customer satisfaction of a product refers to
favorableness of the individual’s subjective
evaluation of the various outcomes and experiences
associated with the university
(Hunt, 1977)
University
Switching Cost
Financial, psychological and time cost a student
may pay as a result of moving from current
university to another university for education needs.
Adapted from Porter
(1980); Mohamad &
Awang (2009a) in this
study.
Student Loyalty A deeply held commitment to repeat selection of a
university for educational needs in the presence of
competitive options, advocate in one’s professional
and social circle and, as alumni, extend cooperation
to its alma matar and its graduates
Adapted from Oliver
(1999) in this study.
Page 22
21
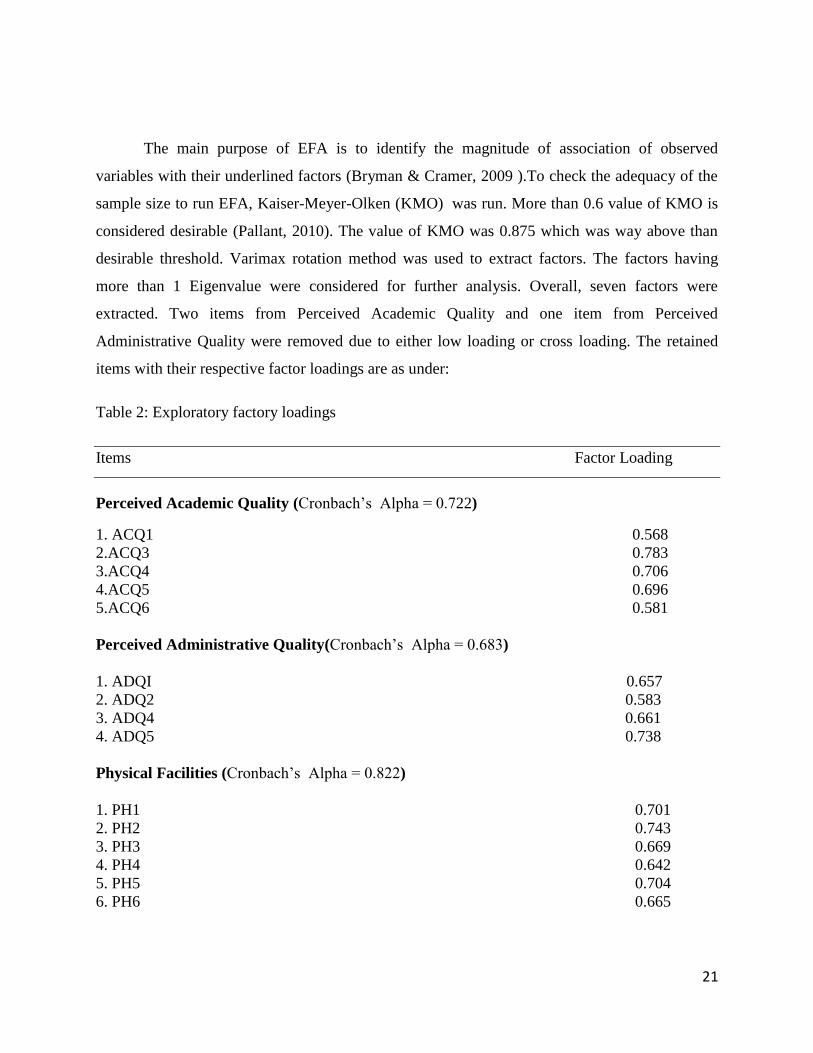
The main purpose of EFA is to identify the magnitude of association of observed
variables with their underlined factors (Bryman & Cramer, 2009 ).To check the adequacy of the
sample size to run EFA, Kaiser-Meyer-Olken (KMO) was run. More than 0.6 value of KMO is
considered desirable (Pallant, 2010). The value of KMO was 0.875 which was way above than
desirable threshold. Varimax rotation method was used to extract factors. The factors having
more than 1 Eigenvalue were considered for further analysis. Overall, seven factors were
extracted. Two items from Perceived Academic Quality and one item from Perceived
Administrative Quality were removed due to either low loading or cross loading. The retained
items with their respective factor loadings are as under:
Table 2: Exploratory factory loadings
Items Factor Loading
Perceived Academic Quality (Cronbach’s Alpha = 0.722)
1. ACQ1 0.568
2.ACQ3 0.783
3.ACQ4 0.706
4.ACQ5 0.696
5.ACQ6 0.581
Perceived Administrative Quality(Cronbach’s Alpha = 0.683)
1. ADQI 0.657
2. ADQ2 0.583
3. ADQ4 0.661
4. ADQ5 0.738
Physical Facilities (Cronbach’s Alpha = 0.822)
1. PH1 0.701
2. PH2 0.743
3. PH3 0.669
4. PH4 0.642
5. PH5 0.704
6. PH6 0.665
Page 23
22
Perceived University Image(Cronbach’s Alpha = 0.861)
1. IM1 0.833
2. IM2 0.768
3. IM3 0.800
4. IM4 0.785
Switching Cost (Cronbach’s Alpha = 0.650)
1. SC1 0.660
2. SC2 0.664
3. SC3 0.617
4. SC4 0.592
Student Satisfaction(Cronbach’s Alpha = 0.861)
1. SA1 0.772
2. SA2 0.790
3. SA3 0.637
4. SA4 0.710
Student Loyalty(Cronbach’s Alpha = 0.807)
1. SL1 0.474
2. SL2 0.744
3. SL3 0.789
4. SL4 0.822
5. SL5 0.826
6. SL6 0.728_______
The validity of the instrument is very important for research. The validity of the instrument was
ensured through convergent and discriminant validity. Convergent value shows the extent to which
items of a construct are correlated to construct itself. Table 3 shows that Average Variance
extracted (AVE) by each factor and Composite Reliability (CR). Ideally AVE should be 0.5 or
more. Three factors have more than 0.50 AVE while 4 factors have less than 0.50 AVE.
According to Fornell and Larcker (1981), if a construct's AVE is less than 0.50 but composite
reliability (CR) more than 0.60 then the construct would be assumed to have convergent validity. It
Page 24
23
is very clear from Table 3 that all constructs have more than 0.60 composite reliability. The second
type of construct validity is discriminant validity. It actually shows the uniqueness of a construct
compared to other constructs (Cooper & Schindler, 2008). It is established if AVE of a construct is
higher than its squared correlation with any other construct. It is evident in Table 3 that AVEs of
all constructs are higher than their squared correlation with other constructs.
Table3 : Convergent & Discriminant Validity_______________________________________
Constructs AVE CR PAQ PAD PH UI SC SL
Perceived Academic
Quality(PAQ) 0.45
0.84
Perceived Administrative
Quality(PAD) 0.44 0.75
0.10
Physical Facilities(PH) 0.47 0.84
0.14 0.13
University Image(UI) 0.63 0.87
0.05 0.05 0.18
Switching Cost(SC) 0.4 0.73
0.01 0.01 0.00
0.00
Student Loyalty(SL) 0.55 0.87
0.12 0.13 0.15
0.19 0.01
Student Satisfaction(SS) 0.53 0.82
0.16 0.21 0.16
0.18 0.03 0.40
___________________________________________________________________________
Since the data was collected from a single source, there was a probability of common method
bias. In order to check it, Harmon one-factor test was conducted. The maximum covariance
explained by one factor was 24.87%. Since it was significantly less than 50%, therefore, the
probability of common method bias was ruled out. The proposed hypotheses were checked
through structural equation modeling, whose result is as under:
Table 4: Goodness of fit indices for structural model
Fit Indices Model Value
Absolute Fit Measures
x2 (chi-square) 133.27
GFI (Goodness of Fit Index) 0.908
RMSEA (Root Mean Square Error of Approximation) 0.041
Incremental Fit Measures
AGFI (Adjusted Goodness of Fit Index) 0.889
Page 25
24
NFI (Normed Fit Index) > 0.866
CFI (Comparative Fit Index) 0.934
IFI (Incremental Fit Index) 0.034
RFI (Relative Fit Index)
0.848
Parsimony Fit Measures
PCFI (Parsimony Comparative of Fit Index) 0.825
PNFI (Parsimony Normed Fit Index 0.765
Table 5: Path analysis for structural model
Path β S.E. C.R. P Results
Perceived Academic → Student Satisfaction .21 .069 3.292 0.00 Supported
Quality
Perceived Administrative →Student Satisfaction .415 .066 5.426 0.00 Supported
Quality
Physical Facilities → Student Satisfaction .170 .054 2.616 .009 Supported
Perceived Academic → University Image -.071 0.078 -1.122 .262 Not Supported
Quality
Perceived Administrative → University Image -.047 .077 .584 .552 Not Supported
Quality
Physical Facilities → University Image .366 .066 5.238 0.00 Supported
Perceived Academic → Student Loyalty .107 .062 1.727 .084 Supported
Quality
Perceived Administrative → Student Loyalty -.067 .062 -.866 . 386 Not Supported
Quality
Physical Facilities → Student Loyalty .087 .053 1.275 .202 Not Supported
Student Satisfaction → University Image .403 .085 5.422 0.00 Supported
Student Satisfaction → Student Loyalty .553 .094 5.471 0.00 Supported
University Image → Student Loyalty .120 .049 1.996 .046 Supported
Switching Cost → Student Loyalty .104 .042 2.467 .014 Supported
Table 4 presents model fit indices. Overall, the model was a good fit. The value of GFI is 0.908
(>0.90) and AGFI= 0.889 (>0.80) and RMSEA=0.041 (<0.05).Other incremental fit and
Parsimony fit measures are either more than or close to benchmarks set by Hair, Black, Babin,
& Anderson (2010).
Table 5 presents path analysis with respect to different hypotheses. The first hypothesis was
about the impact of service quality on student satisfaction. As per the above-given result, the
impact of perceived academic quality (b=.21, p<.01), administrative quality (b=.41, p<.01) and
physical facilities (b=.17,p<0.01) on student satisfaction proved to be significant. The result is in
line with the findings of Annamdevula and Bellamkonda (2016),Khoo et.al (2017),
Subrahmanyam, (2017), Ali et.al (2016), Sultan and Yin Wong (2014), Coles (2002), Price,
Page 26
25
Matzdorf, Smith, & Agahi, (2003) and Chen et.al (2005). When students are satisfied they tend
to remain loyal to the university and choose the same university for further education.
The second hypothesis was about the effect of perceived service quality on student
loyalty. As it is evident from statistics that perceived administrative quality (b=-0.06, p>.05) and
perceived physical facilities (b=0.08, p>.05) have an insignificant impact on student loyalty.
Whereas the effect of perceived academic quality (b=.10, p<.10) on student loyalty is significant.
The results are very close to that of Lin and Tsai (2008)’s study, which produced mixed results;
as academic quality had a significant direct impact while administrative quality had an
insignificant direct impact on student loyalty. The impact of the perceived service quality on
loyalty is indirectly mediated through student satisfaction which conforms to the findings of
Giner and Rillo (2016), Annamdevula and Bellamkonda (2016), Subrahmanyam (2017), Khoo
et.al (2017), Mohamad and Awang (2009a), and Alves and Raposo (2007a). The direct influence
of perceived service quality was denied in the studies of Mohamad and Awang (2009a) and
Dabholkar et al. (2000). The result suggests the supremacy of perceived academic quality over
other quality dimensions because it affected student loyalty directly as well as indirectly through
the mediation of student satisfaction. Students may compromise on infrastructure, but not on the
basic purpose of education.
The third hypothesis was about the influence of student satisfaction on perceived
university image. The effect of student satisfaction (b=.40, p<.01) on university image is
significant. This study vindicates the stance of earlier studies (Ali et.al, 2016; Taecharungroj,
2014; Helgesen & Nesset, 2007; Sultan & Yin, 2012) regarding the effect of student satisfaction
on university image. When students are satisfied they tend to pass on favorable word-of-mouth
(WOM) in their social circle which contributes to image formation. Nothing could be better to
magnify the image of an institution than to satisfy students.
The fourth hypothesis was about the direct impact of the perceived service quality on
university image. The perceived academic quality (b=-.07, p>.05) and perceived administrative
quality (b=-.047, p>.05) had an insignificant impact on university image, while perceived
physical facilities (b=.36, p<.01) had a significant impact on university image. These quality
dimensions impact university image through the mediation of student satisfaction. Potential
students expect university buildings to be well designed and aesthetically pleasing (Winter &
Chapleo, 2017). These results contradict the findings of Nguyen & LeBlanc (1998) and Tan et.al
Page 27
26
(2013). It is a surprising finding. It shows concern of students for better facilities. This may even
make more sense considering the exorbitant fee structure of private universities. Higher cost has
made students more demanding. They spend a couple of hours in an institution which requires
soothing environment. It is especially a challenging situation for universities charging
unreasonable fees, but with the inadequate support of infrastructure.
The fifth hypothesis was about the effect of university switching cost on student loyalty.
University switching cost (b=.10, p<.05) has a significant impact on student loyalty. Since this
factor as an antecedent of student loyalty has been ignored so there are hardly any studies to
compare it with. General causal link of switching cost to customer loyalty has been reported in
previous studies such as Ghazali et al. (2016), Blut et. al. (2015), de Matos et al. (2013) , Minarti
and Segoro (2014), Lewis (2002), Keaveney, (2001), Burnham, Frels and Mahajan (2003); and
cheng (2011). It is an interesting finding. Switching cost was arguably tried for the very first time
as an antecedent of student loyalty. This study confirms the relevance of switching costs in the
context of the university. Universities need to enhance switching cost so that students could be
retained.
The sixth hypothesis was about the influence of student satisfaction on student loyalty.
The impact of student satisfaction (b=.55, p<.01) on student loyalty comes out as significant
which brings no surprise as satisfaction is most frequently used antecedent of loyalty. The
similar results were reported in many studies such as Annamdevula and Bellamkonda (2016);
Austin and Pervaiz (2017); Khoo et.al (2017); Subrahmanyam (2017); Taecharungroj (2014);
Brown and Mazzarol (2006), Mohamad and Awang (2009a); Nesset and Helgesen (2009),
Helgesen and Nesset (2007), Paswan and Ganesh (2009) and Alves and Raposo, (2007a). This
study contradicts the finding of Rojas-Méndez et.al (2009) which denied a direct impact of
student satisfaction on student loyalty. Student satisfaction is highly reflected in student loyalty.
In order to retain students, institutions have to satisfy students by providing a good environment,
effective learning and caring staff.
The last hypothesis was about the influence of university image on student loyalty. The
impact of perceived university image (b=.12, p<.05) on student loyalty was significant. The
effect of university image on student loyalty was observed by Helgesen and Nesset (2007),
Brown and Mazzarol (2009) and Alves and Raposo (2007a).Not many studies have used
university image as an antecedent of student loyalty as compared to student satisfaction and
Page 28
27
service quality. The image of an institution is very important among colleagues, employers and
friends. At times students change the institution to better brand themselves for future endeavors.
It is important for universities to keep monitoring their image in public and take every possible
step to improve the perception of people so that they have a favorable image of the institution.
This study checked relationships among determinants of student loyalty in addition to their
relationship with student loyalty. Based on the results, following model is being proposed:
Figure 3: Student loyalty model
Conclusion
This research study found determinants of student loyalty. The purpose of this research study
was to address few knowledge gaps prevalent in the literature review. The determinants of
student loyalty have been studied before, but the majority of the studies have covered just main
determinants of loyalty such as student satisfaction, service quality and university image but
ignored interrelationships of all these antecedents and their collective impact on student loyalty.
The other highlighted research gap is the complete exclusion of university switching cost as a
Page 29
28
determinant of student loyalty; though there is an ample number of research papers on the impact
of switching cost on customer loyalty. Adaptation of switching cost in education scenario is
almost absent from the literature review. The relevant literature on student loyalty still lacks a
comprehensive definition of student loyalty. This research study was conducted to cover these
research gaps.
Structural equation modeling was used to analyze data. There was a significant impact of
perceived academic quality, perceived administrative quality and perceived physical facilities on
student satisfaction which is in line with the plethora of studies on the relationship between
perceived service quality and satisfaction.
The effect of perceived service quality on university image showed a mixed trend.
Perceived academic quality and perceived administrative quality had an insignificant impact on
perceived university image while perceived physical facilities, surprisingly, showed significant
impact on university image.
Interestingly, the direct impact of perceived administrative quality and physical facilities
on student loyalty was insignificant, while perceived academic quality had a significant effect on
student loyalty. Administrative quality and physical facilities have a significant effect on student
loyalty through the mediation of student satisfaction which is again quite noticeable in the
literature review.
The effect of university switching cost on student loyalty was of prime interest of this
study because of the absence of its application in education sector despite its relevance. The
impact of different types of switching cost on student loyalty came out as positive and
significant. It shows that the higher the monetary, financial and time cost to make a switch from
one university to another, the more the chances the students will continue education in the same
university.
The influence of perceived university image on student loyalty was also positive and
significant. It makes students feel better when their university holds a good image in their social
circle, colleagues and in the corporate sector. The student satisfaction is one of the prerequisites
of forming a positive university image. This study confirmed the role of student satisfaction in
shaping the positive image of the university. When students are satisfied, they convey positive
feedback to external world which helps build good perception about the university.
Page 30
29
Implications for high education institutions
On the basis of study results, the following recommendations are extended to the management of
universities to enhance students’ loyalty to their respective universities:
This study has demonstrated the effect of physical facilities on university image. The concerned
authorities should invest in improving the physical infrastructure of the university to leave an
impact on student perception. If students find well-furnished class rooms with visual and audio
aids, then students’ interest in lecture could be enhanced. In the same way, sports facilities
improve physical fitness and healthy food offering of cafeteria overall well-being of students; as
a healthier body nurtures a healthy mind.
The basic purpose of going to university is education. The ability of teaching faculty
coupled with professional knowledge and supportive attitude is key to learning. A teacher should
respond to student queries courteously and in a friendly manner to encourage further interaction.
The faculty must be trained in modern pedagogy of teaching to kindle the interest of students in
the subject. The satisfaction of students regarding academic and physical facilities and
administrative facilities improves the image of the institution which in turn builds loyalty.
The administration of universities is often given least importance. This study has reflected
surprisingly high importance given by students. It shows that students are very sensitive in
resolving their queries in time. They want to be treated with care and respect. It is recommended
that office staff should be trained to properly behave with students and solve their problems. It is
suggested to tie the good performance of front employees with some financial reward in addition
to their salaries.
The university management should give some monetary incentive to its existing students
to continue education in Master program so that monetary switching cost could be increased. The
incentive could be in the form of loyalty discount on continuing education.
The University may issue loyalty cards to alumni to make them feel attached to the
university. Alumni may avail discounts on executive training and skill development programs. In
addition to these recommendations, it is suggested to engage alumni in the admission process
and curriculum development. The alumni may also be involved in the placement of graduates in
internships and permanent jobs. It will make alumni feel connected to their university and
enhance their attitudinal loyalty.
Page 31
30
This study has demonstrated the importance of student satisfaction in improving the
image of the university. The image also has an impact on student loyalty. In addition to working
on improving teaching quality, increasing administrative support and enhancing the quality of
physical facilities, there is a dire need of establishing Public Relations department to propagate
positives and underplay negatives to manage public image of the university. The university may
hold seminars, hold intra-university competitions and send students to exchange programs
nationally and internationally to improve university image.
Future Research
This study has tried switching cost as a new antecedent of student loyalty. The dimensions of
switching costs are very specific to Pakistan. It is highly recommended to use this construct in
other developing and developed countries considering their specific switching costs of moving
from one university to another. Though this study made a contribution of successfully
introducing a new determinant of loyalty, but unfortunately it could not achieve high reliability.
Other researchers can utilize this shortcoming as an opportunity to enhance reliability by
improving the construct development. Another area of research could be working on the
determinants of alumni loyalty. There are few studies in the literature review, so there is a big
margin of many research studies, especially considering country-specific variables of alumni
loyalty. The third area of research is a comparative study of determinants of loyalty using both
SERVQUAL and SERVPERF scales on the same sample. It will further help in improving both
types of scales.
Page 32
31
References:
Ali, F., Kim, W. G., Li, J., & Jeon, H.-M. (2016). Make it delightful: Customers’ experience, satisfaction
and loyalty in Malaysian theme parks. Journal of Destination Marketing & Management.
https://doi.org/10.1016/j.jdmm.2016.05.003
Al-Kilani, M. H., & Twaissi, N. (2017). Perceived quality of administrative services and its consequences
on students’ behavioral intentions. International Journal of Quality and Service Sciences, 9(1),
103-119. https://doi.org/10.1108/IJQSS-09-2016-0064
Alves, H., & Raposo, M. (2007a). Conceptual Model of Student Satisfaction in Higher Education. Total
Quality Management & Business Excellence, 18(5), 571–588.
https://doi.org/10.1080/14783360601074315
Anderson, E. W., Fornell, C., & Lehmann, D. R. (1994). Customer Satisfaction, Market Share, and
Profitability: Findings from Sweden. Journal of Marketing, 58(3), 53–66.
https://doi.org/10.2307/1252310
Andreasen, A. R., & Kotler, P. (2008). Strategic marketing for nonprofit organizations (pp. 44-53). Upper
Saddle River, NJ: Pearson/Prentice Hall
Asunción Beerli Palacio, Gonzalo Díaz Meneses, & Pedro J. Pérez Pérez. (2002). The configuration of
the university image and its relationship with the satisfaction of students. Journal of Educational
Administration, 40(5), 486–505. https://doi.org/10.1108/09578230210440311
Austin, A. J., & Pervaiz, S. (2017). The Relation Between “Student Loyalty” and “Student Satisfaction”
(A case of College/Intermediate Students at Forman Christian College). European Scientific
Journal, ESJ, 13(3). Retrieved from https://www.listerz.com/index.php/esj/article/view/8776
Bay, D., & Daniel, H. (2001). The Student Is Not the Customer—An Alternative Perspective. Journal of
Marketing for Higher Education, 11(1), 1–19. https://doi.org/10.1300/J050v11n01_01
Bloemer, J., & Gaby, O.-S. (2002.). Store satisfaction and store loyalty explained by customer- and store-
related factors.
Page 33
32
Blut, M., Beatty, S. E., Evanschitzky, H., & Brock, C. (2014). The Impact of Service Characteristics on
the Switching Costs–Customer Loyalty Link. Journal of Retailing, 90(2), 275–290.
https://doi.org/10.1016/j.jretai.2014.04.003
Blut, M., Frennea, C. M., Mittal, V., & Mothersbaugh, D. L. (2015). How procedural, financial and
relational switching costs affect customer satisfaction, repurchase intentions, and repurchase
behavior: A meta-analysis. International Journal of Research in Marketing, 32(2), 226–229.
https://doi.org/10.1016/j.ijresmar.2015.01.001
Bogler, R., & Somech, A. (2002). Motives to Study and Socialization Tactics Among University
Students. The Journal of Social Psychology, 142(2), 233–248.
https://doi.org/10.1080/00224540209603897
Bowen, D. E., & Schneider, B. (1995). Winning the service game. Harvard Business School Press,
Boston, MA.
Brady, M. K., & Cronin, J. J. (2001). Some New Thoughts on Conceptualizing Perceived Service Quality:
A Hierarchical Approach. Journal of Marketing, 65(3), 34–49.
https://doi.org/10.1509/jmkg.65.3.34.18334
Brown, R. M., & Mazzarol, T. (2006). Factors Driving Student Satisfaction and Loyalty in Australian
Universities: The Importance of Institutional Image. In 20th Annual Australia & New Zealand
Academy of Management (ANZAM) Conference Paper (pp. 1–12). Retrieved from
http://www.anzam.org/wp-content/uploads/pdf-manager/2069_BROWN_MAZZARO.PDF
Brown, R. M., & Mazzarol, T. W. (2009). The importance of institutional image to student satisfaction
and loyalty within higher education. Higher Education, 58(1), 81–95.
https://doi.org/10.1007/s10734-008-9183-8
BRYMAN, A & CRAMER, D. 2009. Constructing Variables. In Hardy, M and eds, AB (ed)
Handbook of Data Analysis, New York: Sage.
Page 34
33
Burnham, T. A., Frels, J. K., & Mahajan, V. (2003). Consumer Switching Costs: A Typology,
Antecedents, and Consequences. Journal of the Academy of Marketing Science, 31(2), 109–126.
https://doi.org/10.1177/0092070302250897
Capriotti, P. (1999). Planificación estratégica de la imagen corporativa. Barcelona: Ariel.
Caruana, A. (2003). The impact of switching costs on customer loyalty: A study among corporate
customers of mobile telephony. Journal of Targeting, Measurement and Analysis for Marketing,
12(3), 256–268. https://doi.org/10.1057/palgrave.jt.5740113
Caruana, A., Ewing, M. T., & Ramaseshan, B. (2000). Assessment of the Three-Column Format
SERVQUAL: An Experimental Approach. Journal of Business Research, 49(1), 57–65.
https://doi.org/10.1016/S0148-2963(98)00119-2
Celso Augusto de Matos, Jorge Luiz Henrique, & Fernando de Rosa. (2013). Customer reactions to
service failure and recovery in the banking industry: the influence of switching costs. Journal of
Services Marketing, 27(7), 526–538. https://doi.org/10.1108/JSM-01-2012-0019
Charles Emery, Tracy Kramer, & Robert Tian. (2001). Customers vs. products: adopting an effective
approach to business students. Quality Assurance in Education, 9(2), 110–115.
https://doi.org/10.1108/09684880110389681
Chatura Ranaweera, & Jaideep Prabhu. (2003). The influence of satisfaction, trust and switching barriers
on customer retention in a continuous purchasing setting. International Journal of Service
Industry Management, 14(4), 374–395. https://doi.org/10.1108/09564230310489231
Chavan, M., Bowden-Everson, J., Lundmark, E., & Zwar, J. (2014). Exploring the drivers of service
quality perceptions in the tertiary education sector: Comparing domestic Australian and
international Asian students. Journal of International Education in Business, 7(2), 150-180
Chen, Y. F., Hsiao, C. H., & Lee, W. C. (2005). How does student satisfaction influence student loyalty–
from the relationship marketing perspective. rnd2. ncue. edu. tw/ezcatfiles/b004/img/img/316/96-
1-4p. com
Page 35
34
Cheng, S. (2011). Comparisons of competing models between attitudinal loyalty and behavioral loyalty.
International Journal of Business and Social Science, 2(10), 149–166.
Christian Grönroos. (1984). A Service Quality Model and its Marketing Implications. European Journal
of Marketing, 18(4), 36–44. https://doi.org/10.1108/EUM0000000004784
Chun, R. (2005). Corporate reputation: Meaning and measurement. International Journal of Management
Reviews, 7(2), 91-109.
Clayson, D. E., & Haley, D. A. (2005). Marketing Models in Education: Students as Customers, Products,
or Partners. Marketing Education Review, 15(1), 1–10.
https://doi.org/10.1080/10528008.2005.11488884
Coles, C. (2002). Variability of student ratings of accounting teaching:evidence from a Scottish business
school. International Journal of Management Education, 2(2), 30–40.
COOPER, D.R & SCHINDLER, P.S. 2008. Business research methods. International 2nd ed.
Singapore: McGraw-Hill Education
Cronin, J. J., & Taylor, S. A. (1992). Measuring Service Quality: A Reexamination and Extension.
Journal of Marketing, 56(3), 55–68. https://doi.org/10.2307/1252296
Dabholkar, P. A., Shepherd, C. D., & Thorpe, D. I. (2000). A comprehensive framework for service
quality: an investigation of critical conceptual and measurement issues through a longitudinal
study. Journal of Retailing, 76(2), 139–173. https://doi.org/10.1016/S0022-4359(00)00029-4
Dahlia El-Manstrly. (2016). Enhancing customer loyalty: critical switching cost factors. Journal of
Service Management, 27(2), 144–169. https://doi.org/10.1108/JOSM-09-2015-0291
Dick, A. S., & Basu, K. (1994). Customer Loyalty: Toward an Integrated Conceptual Framework.
Journal of the Academy of Marketing Science, 22(2), 99–113.
https://doi.org/10.1177/0092070394222001
Elsharnouby, T. H. (2015). Student co-creation behavior in higher education: the role of satisfaction with
the university experience. Journal of Marketing for Higher Education, 25(2), 238–262.
https://doi.org/10.1080/08841241.2015.1059919
Page 36
35
Faizan Ali, Yuan Zhou, Kashif Hussain, Pradeep Kumar Nair, & Neethiahnanthan Ari Ragavan. (2016).
Does higher education service quality effect student satisfaction, image and loyalty?: A study of
international students in Malaysian public universities. Quality Assurance in Education, 24(1),
70–94. https://doi.org/10.1108/QAE-02-2014-0008
Firdaus Abdullah. (2006). Measuring service quality in higher education: HEdPERF versus SERVPERF.
Marketing Intelligence & Planning, 24(1), 31–47. https://doi.org/10.1108/02634500610641543
Fornell, C., Johnson, M. D., Anderson, E. W., Cha, J., & Bryant, B. E. (1996). The American Customer
Satisfaction Index: Nature, Purpose, and Findings. Journal of Marketing, 60(4), 7–18.
https://doi.org/10.2307/1251898
Fornell, C., & Larcker, D. F. (1981). Evaluating structural equation models with unobservable variables
and measurement error. Journal of marketing research, 39-50.
François A. Carrillat, Fernando Jaramillo, & Jay P. Mulki. (2007). The validity of the SERVQUAL and
SERVPERF scales: A meta‐ analytic view of 17 years of research across five continents.
International Journal of Service Industry Management, 18(5), 472–490.
https://doi.org/10.1108/09564230710826250
Furedi, F. (2010). Introduction to the marketisation of higher education and the student as consumer. The
marketisation of higher education and the student as consumer, 1-8.
Galinienë, B., Marèinskas, A., Miḥkinis, A., & Drûteikienë, G. (2009). The impact of study quality on the
image of a higher education institution. Informacijos Mokslai, 48, 68–81.
Ghazali, E., Nguyen, B., Mutum, D. S., & Mohd-Any, A. A. (2016). Constructing online switching
barriers: examining the effects of switching costs and alternative attractiveness on e-store loyalty
in online pure-play retailers. Electronic Markets, 26(2), 157–171. https://doi.org/10.1007/s12525-
016-0218-1
Giner, G. R., & Peralt Rillo, A. (2016). Structural equation modeling of co-creation and its influence on
the student’s satisfaction and loyalty towards university. Journal of Computational and Applied
Mathematics, 291, 257–263. https://doi.org/10.1016/j.cam.2015.02.044
Page 37
36
Guédez & Osta, 2012 F.C. Guédez, T.K.M. Osta Factores del a imagen institucional universitaria:
Perspectiva desde el sector del público interno, personal administrativo Revista Ingeniería
Industrial, 11 (2012), pp. 71–84
Guilbault, M. (2016). Students as customers in higher education: reframing the debate. Journal of
Marketing for Higher Education, 26(2), 132–142.
https://doi.org/10.1080/08841241.2016.1245234
Haedrich, G. (1993). Images and Strategic Corporate and Marketing Planning. Journal of Public
Relations Research, 5(2), 83–93. https://doi.org/10.1207/s1532754xjprr0502_03
Hair, J. F., Black, W. C., Babin, B. J., & Anderson, R. E. (2010). Multivariate data analysis (7th ed.).
Pearson
Hall, H. (2017). The marketisation of higher education - symptoms, controversies, trends (Working Paper
No. 36/2017). Institute of Economic Research. Retrieved from
http://econpapers.repec.org/paper/peswpaper/2017_3ano36.htm
Helgesen, Ø., & Nesset, E. (2007). Images, Satisfaction and Antecedents: Drivers of Student Loyalty? A
Case Study of a Norwegian University College. Corporate Reputation Review, 10(1), 38–59.
https://doi.org/10.1057/palgrave.crr.1550037
Hennig-Thurau, T., Langer, M. F., & Hansen, U. (2001). Modeling and managing student loyalty: An
approach based on the concept of relationship quality. Journal of Service Research, 3(4), 331–
344.
Hill, Y., Lomas, L., & MacGregor, J. (2003). Students’ perceptions of quality in higher education. Quality
assurance in education, 11(1), 15-20.
Hoffmann, S., & Müller, S. (2008). Intention postgradualer Bindung: Warum Studenten der
Wirtschaftswissenschaften nach dem Examen dem Alumniverein beitreten wollen.
Schmalenbachs Zeitschrift Für Betriebswirtschaftliche Forschung, 60(6), 570–600.
Page 38
37
Hsu, S.-H., Wang, Y.-C., Cheng, C.-J., & Chen, Y.-F. (2016). Developing a decomposed alumni
satisfaction model for higher education institutions. Total Quality Management & Business
Excellence, 27(9–10), 979–996. https://doi.org/10.1080/14783363.2015.1054102
Hunt, H. K. (1977). Conceptualization and Measurement of Consumer Satisfaction and Dissatisfaction.
Marketing Science Institute.
Iskhakova, L., Hilbert, A., & Hoffmann, S. (2016). An Integrative Model of Alumni Loyalty—an
Empirical Validation Among Graduates From German and Russian Universities. Journal of
Nonprofit & Public Sector Marketing, 28(2), 129–163.
https://doi.org/10.1080/10495142.2015.1006490
Jackson, B. B. (1985). Build customer relationships that last (Vol. 11, pp. 120-128). Harvard Business
Review.
Jacoby, J., & Kyner, D. B. (1973). Brand Loyalty vs. Repeat Purchasing Behavior. Journal of Marketing
Research, 10(1), 1–9. https://doi.org/10.2307/3149402
Jacqueline Douglas, Alex Douglas, & Barry Barnes. (2006). Measuring student satisfaction at a UK
university. Quality Assurance in Education, 14(3), 251–267.
https://doi.org/10.1108/09684880610678568
Jane Hemsley‐ Brown, & Izhar Oplatka. (2010). Market orientation in universities: A comparative study
of two national higher education systems. International Journal of Educational Management,
24(3), 204–220. https://doi.org/10.1108/09513541011031565
Jiewanto, A., Laurens, C., & Nelloh, L. (2012). Influence of Service Quality, University Image, and
Student Satisfaction toward WOM Intention: A Case Study on Universitas Pelita Harapan
Surabaya. Procedia - Social and Behavioral Sciences, 40, 16–23.
https://doi.org/10.1016/j.sbspro.2012.03.155
Jiwat Ram, & Ming-Lu Wu. (2016). A fresh look at the role of switching cost in influencing customer
loyalty: Empirical investigation using structural equation modelling analysis. Asia Pacific
Page 39
38
Journal of Marketing and Logistics, 28(4), 616–633. https://doi.org/10.1108/APJML-11-2015-
0172
Jonathan Ivy. (2008). A new higher education marketing mix: the 7Ps for MBA marketing. International
Journal of Educational Management, 22(4), 288–299.
https://doi.org/10.1108/09513540810875635
Jones, T.O. & Sasser, W.E. (1995), ``Why satisfied customer defects'', Harvard Business Review,
November-December, pp. 88-99
Juan Carlos Bou Llusar, & César Camisón Zornoza. (2000). Validity and reliability in perceived quality
measurement models: An empirical investigation in Spanish ceramic companies. International
Journal of Quality & Reliability Management, 17(8), 899–918.
https://doi.org/10.1108/02656710010325237
Judson, K. M., & Taylor, S. A. (2014). Moving from Marketization to Marketing of Higher Education:
The Co-Creation of Value in Higher Education. Higher Education Studies, 4(1), 51.
https://doi.org/10.5539/hes.v4n1p51
Devinder, K., & Datta, B. (2003). A study of the effect of perceived lecture quality on post-lecture
intentions. Work Study, 52(5), 234-243.. https://doi.org/10.1108/00438020310485967
Kashif, M., Ramayah, T., & Sarifuddin, S. (2016). PAKSERV – measuring higher education service
quality in a collectivist cultural context. Total Quality Management & Business Excellence, 27(3–
4), 265–278. https://doi.org/10.1080/14783363.2014.976939
Keaveney, S. M., & Parthasarathy, M. (2001). Customer Switching Behavior in Online Services: An
Exploratory Study of the Role of Selected Attitudinal, Behavioral, and Demographic Factors.
Journal of the Academy of Marketing Science, 29(4), 374–390.
https://doi.org/10.1177/03079450094225
Keller, K. L. (1993). Conceptualizing, measuring, and managing customer-based brand equity. Journal of
Marketing, 57(1), 1–22. https://doi.org/10.2307/1252054
Page 40
39
Koris, R., Örtenblad, A., Kerem, K., & Ojala, T. (2015). Student-customer orientation at a higher
education institution: the perspective of undergraduate business students. Journal of Marketing
for Higher Education, 25(1), 29–44. https://doi.org/10.1080/08841241.2014.972486
Kotler, P., & Armstrong, G. (2009). Principles of Marketing (13 edition). Upper Saddle River, N.J:
Prentice Hall.
Koushiki Choudhury. (2015). Evaluating customer-perceived service quality in business management
education in India: A study in topsis modeling. Asia Pacific Journal of Marketing and Logistics,
27(2), 208–225. https://doi.org/10.1108/APJML-04-2014-0065
Landrum, R. E., Turrisi, R., & Harless, C. (1999). University Image: The Benefits of Assessment and
Modeling. Journal of Marketing for Higher Education, 9(1), 53–68.
https://doi.org/10.1300/J050v09n01_05
Lau, M. M. Y. (2016). Effects of 8Ps of services marketing on student selection of self-financing sub-
degree programmes in Hong Kong. International Journal of Educational Management, 30(3),
386-402.
Leiva, R., Ferrero, I., & Calderón, R. (2016). Corporate Reputation in the Business Ethics Field: Its
Relation with Corporate Identity, Corporate Image, and Corporate Social Responsibility.
Corporate Reputation Review, 19(4), 299–315. https://doi.org/10.1057/s41299-016-0008-x
Letcher, D. W., & Neves, J. S. (2010). Determinants of undergraduate business student satisfaction.
Research in Higher Education Journal, 6, 1.
Lewis, P. 2002. The psychology affecting loyalty of electricity and gas customers. The Global Energy
Marketing Conference in University of Vaasa, Finland,
lin, C., & Tsai, Y. H. (2008). Modeling Educational Quality and Student Loyalty: A Quantitative
Approach Based on the Theory of Information Cascades. Quality & Quantity, 42(3), 397–415.
https://doi.org/10.1007/s11135-006-9051-5
Page 41
40
Lin, C., & Tsai, Y. H. (2008). Modeling Educational Quality and Student Loyalty: A Quantitative
Approach Based on the Theory of Information Cascades. Quality & Quantity, 42(3), 397–415.
https://doi.org/10.1007/s11135-006-9051-5
Lynne Eagle, & Ross Brennan. (2007). Are students customers? TQM and marketing perspectives.
Quality Assurance in Education, 15(1), 44–60. https://doi.org/10.1108/09684880710723025
Manzuma-Ndaaba, N. M., Harada, Y., Romle, A. R., & Shamsudin, A. S. (2016). Cognitive, Affective
and Conative Loyalty in Higher Education Marketing: Proposed Model for Emerging
Destinations. International Review of Management and Marketing, 6(4S), 168–175.
Mark, E. (2013). Student satisfaction and the customer focus in higher education. Journal of Higher
Education Policy and Management, 35(1), 2–10. https://doi.org/10.1080/1360080X.2012.727703
Marsh, H. W., & Roche, L. A. (2000). Effects of grading leniency and low workload on students’
evaluations of teaching: Popular myth, bias, validity, or innocent bystanders? Journal of
Educational Psychology, 92(1), 202–228. https://doi.org/10.1037/0022-0663.92.1.202
Martin O’Neill. (2003). The influence of time on student perceptions of service quality: The need for
longitudinal measures. Journal of Educational Administration, 41(3), 310–325.
https://doi.org/10.1108/09578230310474449
Mazirah Yusoff, Fraser McLeay, & Helen Woodruffe-Burton. (2015). Dimensions driving business
student satisfaction in higher education. Quality Assurance in Education, 23(1), 86–104.
https://doi.org/10.1108/QAE-08-2013-0035
Michael A. Jones, & Jaebeom Suh. (2000). Transaction‐ specific satisfaction and overall satisfaction: an
empirical analysis. Journal of Services Marketing, 14(2), 147–159.
https://doi.org/10.1108/08876040010371555
Minarti, S. N., & Segoro, W. (2014). The Influence of Customer Satisfaction, Switching Cost and Trusts
in a Brand on Customer Loyalty – The Survey on Student as im3 Users in Depok, Indonesia.
Procedia - Social and Behavioral Sciences, 143, 1015–1019.
https://doi.org/10.1016/j.sbspro.2014.07.546
Page 42
41
Mohamad, M., & Awang, Z. (2009a). Building corporate image and securing student loyalty in the
Malaysian higher learning industry. Journal of International Management Studies, 4(1), 30–40.
Nedbalová, E., Greenacre, L., & Schulz, J. (2014). UK higher education viewed through the
marketization and marketing lenses. Journal of Marketing for Higher Education, 24(2), 178–195.
https://doi.org/10.1080/08841241.2014.973472
Nesset, E., & Helgesen, Ø. (2009). Modelling and Managing Student Loyalty: A Study of a Norwegian
University College. Scandinavian Journal of Educational Research, 53(4), 327–345.
https://doi.org/10.1080/00313830903043117
Nguyen, A., & Rosetti, J. (2013). Overcoming potential negative consequences of customer orientation in
higher education: closing the ideological gap. Journal of Marketing for Higher Education, 23(2),
155–174. https://doi.org/10.1080/08841241.2013.860941
Nguyen, N., & LeBlanc, G. (2001). Image and reputation of higher education institutions in students’
retention decisions. International Journal of Educational Management, 15(6), 303–311.
https://doi.org/10.1108/EUM0000000005909
Nguyen, A., & Rosetti, J. (2013). Overcoming potential negative consequences of customer orientation in
higher education: Closing the ideological gap. Journal of Marketing for Higher Education, 23(2),
155-174.
Nha Nguyen, & Gaston LeBlanc. (1998). The mediating role of corporate image on customers’ retention
decisions: an investigation in financial services. International Journal of Bank Marketing, 16(2),
52–65. https://doi.org/10.1108/02652329810206707
Nha Nguyen, & Gaston LeBlanc. (2001). Image and reputation of higher education institutions in
students’ retention decisions. International Journal of Educational Management, 15(6), 303–311.
https://doi.org/10.1108/EUM0000000005909
Nyadzayo, M. W., & Khajehzadeh, S. (2016). The antecedents of customer loyalty: A moderated
mediation model of customer relationship management quality and brand image. Journal of
Retailing and Consumer Services, 30, 262–270. https://doi.org/10.1016/j.jretconser.2016.02.002
Page 43
42
Ogunnaike, O. O., Borishade, T. T., Sholarin, A., & Odubela, O. O. (2014). Empirical Analysis of
Marketing Mix Strategy and Student Loyalty in Education Marketing. Mediterranean Journal of
Social Sciences, 5(23), 616–625.
Oliver, R. L. (1999). Whence Consumer Loyalty? Journal of Marketing, 63, 33–44.
https://doi.org/10.2307/1252099
Pallant, J. 2010. SPSS survival manual: a step by step guide to data analysis using SPSS. 4th
ed. Maidenhead: McGraw-Hill
Parameswaran, R., & Glowacka, A. E. (1995). University Image: Journal of Marketing for Higher
Education, 6(2), 41–56. https://doi.org/10.1300/J050v06n02_04
Parasuraman, A., Zeithaml, V. A., & Berry, L. L. (1988). SERVQUAL: A multiple-item scale for
measuring consumer perceptions of service quality. Journal of Retailing, 64(1), 12–40.
Parasuraman, A., Zeithaml, V. A., & Berry, L. L. (1994). Reassessment of Expectations as a Comparison
Standard in Measuring Service Quality: Implications for Further Research. Journal of Marketing,
58(1), 111–124. https://doi.org/10.2307/1252255
Paswan, A., and G. Ganesh. 2009. Higher education institutions: Satisfaction and loyalty among
international students. Journal of Marketing for Higher Education 19, no. 1: 65–84.
Patlán Pérez, J., & Martínez Torres, E. (2017). Evaluation of the organizational image of a university in a
higher education institution. Contaduría Y Administración, 62(1), 123–140.
https://doi.org/10.1016/j.cya.2016.01.007
Peter F. Cuthbert. (1996). Managing service quality in HE: is SERVQUAL the answer? Part 2. Managing
Service Quality: An International Journal, 6(3), 31–35.
https://doi.org/10.1108/09604529610115858
Polat, S., Arslan, Y., & Yavaş, E. (2016). IMPORTANCE LEVEL OF IMAGE ATTRACTORS IN THE
PROCESS OF UNIVERSITY SELECTION: AN APPLICATION ON PROSPECTIVE
UNIVERSITY STUDENTS IN TURKEY. KASTAMONU EĞİTİM DERGİSİ, 24(4). Retrieved
from http://79.123.169.199/ojs/index.php/Kefdergi/article/view/678
Page 44
43
Porter, M. E. (1980), ‘Competitive Strategy, New York: Free Press
Price, I. F., Matzdorf, F., Smith, L., & Agahi, H. (2003). The impact of facilities on student choice of
university. Facilities, 21(10), 212-222.
Quester, P. G., Romaniuk, S., & Wilkinson, J. W. (2015). A Test of Four Service Quality Measurement
Scales: The Case of the Australian Advertising Industry. In Proceedings of the 1995 World
Marketing Congress (pp. 384–391). Springer, Cham. https://doi.org/10.1007/978-3-319-17311-
5_54
Robinson, N. M., & Celuch, K. G. (2016). Strategic and bonding effects of enhancing the student
feedback process. Journal of Marketing for Higher Education, 26(1), 20–40.
https://doi.org/10.1080/08841241.2016.1146386
Rojas-Mendez, J. I., Vasquez-Parraga, A. Z., Kara, A., & Cerda-Urrutia, A. (2009). Determinants of
Student Loyalty in Higher Education: A Tested Relationship Approach in Latin America. Latin
American Business Review, 10(1), 21–39. https://doi.org/10.1080/10978520903022089
Sahin, O., & Singh, U. S. (2017). A Literary Excavation of University Brand Image Past to Present.
International Journal of Social Sciences and Educational Studies, 3(3), 174–187.
https://doi.org/10.23918/ijsses.v3i3p174
Sami Kärnä, & Päivi Julin. (2015). A framework for measuring student and staff satisfaction with
university campus facilities. Quality Assurance in Education, 23(1), 47–66.
https://doi.org/10.1108/QAE-10-2013-0041
Sangeeta Sahney, D.K. Banwet, & S. Karunes. (2004). A SERVQUAL and QFD approach to total quality
education: A student perspective. International Journal of Productivity and Performance
Management, 53(2), 143–166. https://doi.org/10.1108/17410400410515043
Schlesinger, W., Cervera, A., & Pérez-Cabañero, C. (2016). Sticking with your university: the importance
of satisfaction, trust, image, and shared values. Studies in Higher Education, 1–17.
https://doi.org/10.1080/03075079.2015.1136613
Page 45
44
Shank, M. D., Walker, M., & Hayes, T. (1996). Understanding professional service expectations: Do we
know what our students expect in a quality education? Journal of Professional Services
Marketing, 13(1), 71 –89. doi:10.1300/J090v13n01_08
Sirvanci, M. (1996). Are students the true customers of higher education?. Quality Progress, 29(10), 99.
Stan, V., Caemmerer, B., & Cattan-Jallet, R. (2013). Customer loyalty development: The role of
switching costs. Journal of Applied Business Research, 29(5), 1541.
Stodnick, M., & Rogers, P. (2008). Using SERVQUAL to Measure the Quality of the Classroom
Experience. Decision Sciences Journal of Innovative Education, 6(1), 115–133.
https://doi.org/10.1111/j.1540-4609.2007.00162.x
Subrahmanyam, A. (2017). Relationship between service quality, satisfaction, motivation and loyalty: A
multi-dimensional perspective. Quality Assurance in Education, 25(2), 171–188.
https://doi.org/10.1108/QAE-04-2013-0016
Subrahmanyam Annamdevula, & Raja Shekhar Bellamkonda. (2016). Effect of student perceived service
quality on student satisfaction, loyalty and motivation in Indian universities: Development of
HiEduQual. Journal of Modelling in Management, 11(2), 488–517. https://doi.org/10.1108/JM2-
01-2014-0010
Sultan, P., & Yin Wong, H. (2012). Service quality in a higher education context: an integrated model.
Asia Pacific Journal of Marketing and Logistics, 24(5), 755–784.
https://doi.org/10.1108/13555851211278196
Sultan, P., & Yin Wong, H. (2013). Antecedents and consequences of service quality in a higher
education context: a qualitative research approach. Quality assurance in education, 21(1), 70-95..
(2012b). Service quality in a higher education context: an integrated model. Asia Pacific Journal
of Marketing and Logistics, 24(5), 755–784. https://doi.org/10.1108/13555851211278196
Sultan, P., & Yin Wong, H. (2014). An integrated-process model of service quality, institutional brand
and behavioural intentions: The case of a University. Managing Service Quality: An International
Journal, 24(5), 487–521. https://doi.org/10.1108/MSQ-01-2014-0007
Page 46
45
Susie Khoo, Huong Ha, & Sue L.T. McGregor. (2017). Service quality and student/customer satisfaction
in the private tertiary education sector in Singapore. International Journal of Educational
Management, 31(4), 430–444. https://doi.org/10.1108/IJEM-09-2015-0121
Taecharungroj, V. (2014). University Student Loyalty Model: Structural Equation Modelling Of Student
Loyalty in Autonomous, State, Transformed, and Private Universities in Bangkok. Scholar, 6(1).
Retrieved from http://www.assumptionjournal.au.edu/index.php/Scholar/article/view/56
Tan, P. K., Mohd Suradi, N. R., Saludin, M. N., Ishak, A., Hashim, I., Ismail, E. S., & Nazar, R. (2013).
The impact of complaint management and service quality on organizational image: A case study
at the Malaysian public university library. AIP Conference Proceedings, 1522(1), 1447–1453.
https://doi.org/10.1063/1.4801300
Tor Wallin Andreassen, & Bodil Lindestad. (1998). Customer loyalty and complex services: The impact
of corporate image on quality, customer satisfaction and loyalty for customers with varying
degrees of service expertise. International Journal of Service Industry Management, 9(1), 7–23.
https://doi.org/10.1108/09564239810199923
Vianden, J., & Barlow, P. J. (2014). Showing the Love: Predictors of Student Loyalty to Undergraduate
Institutions. Journal of Student Affairs Research and Practice, 51(1), 16–29.
https://doi.org/10.1515/jsarp-2014-0002
Williams, L. J., Hartman, N., & Cavazotte, F. (2010). Method Variance and Marker Variables: A Review
and Comprehensive CFA Marker Technique. Organizational Research Methods, 13(3), 477–514.
https://doi.org/10.1177/1094428110366036
Winter, E., & Chapleo, C. (2017). An exploration of the effect of servicescape on student institution
choice in UK universities. Journal of Further and Higher Education, 41(2), 187–200.
https://doi.org/10.1080/0309877X.2015.1070400
Yeo, R. K., & Li, J. (2014). Beyond SERVQUAL: The competitive forces of higher education in
Singapore. Total Quality Management & Business Excellence, 25(1–2), 95–123.
https://doi.org/10.1080/14783363.2011.637802
Page 47
46
Yunker, P. J., & Yunker, J. A. (2003). Are Student Evaluations of Teaching Valid? Evidence From an
Analytical Business Core Course. Journal of Education for Business, 78(6), 313–317.
https://doi.org/10.1080/08832320309598619
Zeithaml, V. A. (1988). Consumer Perceptions of Price, Quality, and Value: A Means-End Model and
Synthesis of Evidence. Journal of Marketing, 52(3), 2–22. https://doi.org/10.2307/1251446
Zimmer, M.R., & Golden, L.L. (1988). Impressions of retail stores: A content analysis of consumer
images. Journal of Retailing, 64(3), 265–293