Munich Personal RePEc Archive The conditional pricing of currency and inflation risks in Africa’s equity markets Odongo Kodongo and Kalu Ojah University of the Witwatersrand 20. May 2014 Online at http://mpra.ub.uni-muenchen.de/56100/ MPRA Paper No. 56100, posted 26. May 2014 08:50 UTC
Transcript
MPRAMunich Personal RePEc Archive
The conditional pricing of currency andinflation risks in Africa’s equity markets
Odongo Kodongo and Kalu Ojah
University of the Witwatersrand
20. May 2014
Online at http://mpra.ub.uni-muenchen.de/56100/MPRA Paper No. 56100, posted 26. May 2014 08:50 UTC
Conditional Pricing of Currency and Inflation Risks in Africa’s Equity Markets
Page 3
1. Introduction
Africa’s financial markets, many of which have recently instituted liberalization measures,
including abolition of capital controls, have attracted increased interest among international investors,
largely on account of their low, sometimes negative, correlations with the rest of the world (see e.g.,
Harvey, 1995), which makes them attractive for portfolio diversification. The importance of Africa’s
financial markets as international investment destinations is not confined to their low correlations with
global markets. It may be explained by many other factors including the fast pace of growth of Africa’s
economies – in the last decade, six out of ten fastest growing economies globally were in Africa (AfDB,
2013). Many studies have also shown that the performance of Africa’s stock markets in the recent past
has been remarkable. For instance, Allen et al. (2011) show that stock markets in Africa have recorded
impressive risk adjusted returns, with Sharpe indexes as high as 2.47 for Tanzania, 0.49 for Botswana,
and 0.42 for Tunisia in 2008; even when converted into US dollar terms, the African region recorded an
average annual stock return of 21.8% in 2008.
The potential for diversification benefits presented by Africa’s capital markets becomes clearer
when one considers the fact that many of the stock markets in the region performed better, on a risk-
adjusted basis, than most other markets around the world during the 2007/8 financial crisis with some
markets surprisingly generating positive returns (Allen et al., 2011). Similarly, studies have found a
positive relationship between risk and expected returns in various stock markets in Africa (Alagidede and
Panagiotidis, 2009). This implies that investors who venture into these markets are appropriately
rewarded with higher returns for assuming greater risk. Appropriate rewarding of risk appears useful in
attracting foreign money to Africa’s financial markets. According to AfDB (2013), total external financial
flows to Africa reached a historic high of an estimated USD 186.3 billion in 2012, up from USD 158.3
billion in 2011, with the flow of foreign direct investment, portfolio investment, official development
assistance and remittances quadrupling since 2001.
In spite of the immense diversification benefits promised by Africa’s markets, and financial
sector reforms undertaken by many countries in the continent in the last two decades, most of the markets
have relatively higher volatility of asset returns driven by thin trading and low liquidity, perceived high
political and sovereign risk, relatively weaker regulatory environment and state of development, and lack
of high quality accounting data (Abdalla and Murinde, 1997; Appiah-Kusi and Menya, 2003; Alagidede
and Panagiotidis, 2009). Further, a set of factors including high risk aversion and home bias among
international investors, inadequate information about Africa’s markets, global credit tightening, as well as
increased volatility of exchange markets (Giovannetti and Velucchi, 2009) characterize many of Africa’s
financial markets. A combination of these factors is believed to have driven up risk premia in Africa’s
Conditional Pricing of Currency and Inflation Risks in Africa’s Equity Markets
Page 4
assets markets, making them unattractive relative to more mature markets. To what extent do these factors
actually drive equity risk premia in Africa?
We seek the answer to this question by focusing mainly on one of the most important risk factors
– volatility in exchange markets. Our study attempts to establish whether the observed volatility of
foreign exchange rates contributes to risk premia in Africa’s equity markets. We examine this issue from
the perspective of the global investor interested in Africa’s equity as a foreign investment. We assume the
Purchasing Power Parity principle does not hold in the short-run so that investors resident in different
countries have different investment and consumption opportunity sets. In such an investment
environment, investors evaluate asset returns in their domestic currency terms and take a keen interest in
movements of foreign exchange rates because such movements might affect the domestic value of their
foreign (African) equity investment returns. If they perceive exchange rate volatility to be a significant
factor affecting their net returns, such investors would price foreign exchange risk, in the sense that it
would command a premium that would constitute a part of the overall required rate of return on their
African equity investments.
The literature is not very clear on the linkage between foreign exchange rates and stock prices in
Africa. Whereas bivariate cointegration tests have not been able to find evidence of the existence of long-
run relationship between stock prices and real exchange rates for African countries (Ndako, 2013;
Kodongo and Ojah, 2013), a long run relationship exists when the world equity market (the apparent
mechanism linking the two financial markets) is introduced (Kodongo and Ojah, 2013). And, although
not conspicuous from recent studies (Arief et al., 2009; AfDB, 2011; Aly and Strazicich, 2011), it is
believed that economic episodes such as the recent global financial crisis and the European debt crisis
adversely affected several African economies through reduced official development assistance, foreign
direct investment inflows and worker’s remittances to Africa (AfDB, 2013). Since these transmission
channels may simultaneously impact the exchange market (supply of foreign exchange) and the stock
market (foreign demand for assets), developments in the world financial markets may cause currency risk
to be priced in the stock markets.1 Thus, an understanding of the pricing of currency risk in equity
markets is of interest to investors, who would find such knowledge an important ingredient in formulating
hedging strategies, and to policy makers, who would utilize such knowledge in formulating and
implementing regulatory policies meant to ensure macroeconomic stability and enhance the investability
of their financial markets.
1 Indeed, AfDB (2013) suggests that a majority of Africa’s economies are exposed to developments in Europe, the USA and China, through the exports channel. In 2011, one-third of Africa’s merchandise exports went to the European Union (down from 37% in 2006) and more than 11% to the United States against 16% in 2006, while exports to China increased to around 10% of total exports from around 6% in 2006 and exports to India rose to 6% in 2011 from around 4.5% in 2006 (AfDB, 2013: 19)
Conditional Pricing of Currency and Inflation Risks in Africa’s Equity Markets
Page 5
Yet, Kodongo and Ojah (2011) have found that foreign exchange risk does not command a
significant unconditional premium in Africa’s major equity markets. This study takes a different approach
from that in Kodongo and Ojah (2011). We attempt to determine whether foreign exchange risk is priced
in Africa’s equity markets in the conditional sense. The conditional pricing approach is motivated by the
fact that investors generally form expectations, and hence determine their required rates of return, on the
basis of information available at the beginning of their investment decision. Such information, neglected
by Kodongo and Ojah (2011), ought to be incorporated by researchers in empirical asset pricing studies
(Dumas and Solnik, 1995). We also examine data from a larger sample – ten countries – to provide a
broader representation and therefore strengthen generalization. Findings from this study are important to
policy in several ways. First, securities markets regulatory bodies and financial markets agencies in
African countries should work together towards instituting operationally viable derivative securities
markets within their financial jurisdictions, with a view to availing reliable risk management tools to
equity markets investors. Second, to minimize volatility in the real exchange rates, and therefore the
premium it commands in the stock market, governments should ensure stability in nominal exchange rates
and in prices of goods and services in general.
2. Related literature
The pricing of foreign exchange risk in stock markets has been examined by many studies. Early
empirical investigations were largely based on the unconditional versions of the models. Conducted in
varied markets, some of the unconditional tests fail to detect any evidence of currency risk pricing
(Jorion, 1991; Loudon, 1993; Kodongo and Ojah, 2011); others find mixed and inconclusive results (Choi
et al., 1998; Iorio and Faff, 2002); yet others present results that are consistent with high degrees of
currency risk exposure (Dominguez and Tesar, 2001; Carrieri and Majerbi, 2006). The failure to resolve
the issue of currency risk pricing is not desirable from the point of view of investors and corporate finance
managers. For instance, company financial managers find it difficult to justify corporate hedging practices
in the absence of full knowledge of currency risk pricing. Failure to reject the hypothesis that currency
risk is not priced in financial markets implies that investors are not willing to pay a premium for firms
with active hedging policies (Dufey and Srinivasulu, 1983; Smith and Stulz, 1985). Inconsistency of
research findings by studies based on unconditional asset pricing models has motivated the search for
alternative model frameworks. Thus, conditional asset pricing models have recently become popular tools
for testing for currency risk pricing.
According to Dumas and Solnik (1995), it is natural to test any asset pricing model in its
conditional form. The duo observe that investors’ decisions are informed by conditioning information
such as interest rates and past equity prices, which empirical tests cannot afford to ignore. Using a
Conditional Pricing of Currency and Inflation Risks in Africa’s Equity Markets
Page 6
parsimonious econometric specification allowing for time-varying currency risk, they conclude that
stochastic changes in foreign exchange rates are associated with changes in equity prices and constitute
additional sources of risk to investors in the stock markets of Japan, Germany, USA and the UK. De
Santis and Gerard (1998) also find currency risk premium to constitute a significant portion of the total
risk premium in these four major equity markets. Similar findings have been reported from other financial
markets (Doukas et al., 1999; Tai, 1999; MacDonald, 2000; Carrieri, 2001; Kolari et al., 2008).2 Recently,
Aysun and Guldi (2011) compare the performance of linear models and that of non-linear models in
explaining currency risk exposure. They find that the proportion of firms with exposures is understated in
both emerging markets and the USA under a linear model, but that the frequency of exposure increases
when non-linear models are used. Studies that have employed the stochastic discount factor (SDF) model
(Zhang, 2006; Cappiello and Panigirtzoglou, 2008) also demonstrate that currency risk premiums are
time-varying and account for a significant part of the excess returns on international assets.3 In an
interesting theoretical application of the SDF model, Verdelhan (2010) explains exchange rate risk premia
in the context of the uncovered interest rate parity puzzle. The model’s features include pro-cyclical real
interest rates and time-varying risk aversion.
Some evidence of currency risk pricing is also available from the emerging markets. Phylaktis
and Ravazzolo (2004) use a parsimonious multivariate GARCH-M process to find that currency risk
premium is time-varying and substantial and forms a big part of the total risk premium; it is bigger and
more variable when markets are segmented. Under a partial market segmentation framework, Carrieri et
al. (2006) find that local currency risk commands a significant premium, which is, however, smaller, on
average, than domestic equity market risk, but which increases substantially during crisis periods, when it
can be almost as large as market risk. Using a Value-at-Risk decomposition technique, Sirr et al. (2011)
demonstrate significant variation in foreign exchange risk in emerging markets. More recently, Antell and
Vaihekoski (2012) use a covariance stationary specification in a multivariate GARCH-M setup to test a
conditional international asset pricing model; they find that currency risk is priced in both Swedish and
Finnish stock markets, and that the price and the risk premium are lower after the floatation of the
currencies, especially for Finland.
The SDF model has also been used successfully to estimate currency risk premia in various
countries in the emerging markets. Drobetz et al. (2002) use the SDF model to find that the relative value
2 Using an alternative methodology, Du and Hu (2012) appear to refute the findings of Kolari et al. (2008). 3 Time variation in equity risk premia has been attributed to many factors. Jagannathan and Wang (1996) argue that
during a recession, financial leverage of troubled firms increases, causing their systematic risk, measured by CAPM beta, to increase. Brooks et al. (1992) also point out that the maturity and growth of firms tend to change the riskiness (beta) of the firm over time. Zhang (2006) observes that the sensitivity to changes in macroeconomic conditions by financially constrained firms may cause their betas to vary over time. Therefore, the market risk premia should be higher at economic downturns to compensate for the adverse risk exposure.
Conditional Pricing of Currency and Inflation Risks in Africa’s Equity Markets
Page 7
of the US dollar is significantly priced in the emerging markets studied. Poghosyan and Kočenda (2008)
find that real factors play a small role in determining foreign exchange risk, while nominal and monetary
factors have a significant impact in the post-transition economies of the European Union. Similarly,
Poghasyan (2010) find results suggesting that U.S. inflation and consumption growth are important
factors driving the risk premium in the Gulf Cooporation Council (GCC) countries.
From the literature it is clear that conditional asset pricing models, if well specified, appear to be
better suited than unconditional asset pricing models to succeed in finding currency and inflation risks
priced in international equity markets. However, we must point out that the pricing of foreign exchange
risk has not been investigated in Africa’s equity markets in the conditional sense. Thus, whether the
findings from less exotic emerging markets outside Africa can be generalized to Africa’s nascent stock
markets is still an open empirical question.4
We employ the stochastic discount factor (SDF) model with the world equity portfolio and
foreign exchange risk as priced factors. Our SDF model allows for time-variation in the pricing kernel
and risk premia. We assume that a set of information existing at the beginning of each month conditions
investors’ decisions. We proxy the conditioning information by four macroeconomic variables believed
by international finance researchers to be able to predict equity returns. The conditioning variables
include three international variables, namely, the gross returns on the MSCI world equity portfolio,
dividend yield on the MSCI world equity portfolio in excess of the Eurodollar deposit rate and the USA
term premium. At the local level, we use inflation rates.5 In addition, consistent with several existing
studies, we also use the January dummy. All conditioning variables (except the January dummy) are
lagged one period and those that are not stationary in levels are Hodrick and Prescott (1997) filtered. Our
investigation covers ten major equity markets in Africa: Botswana, Egypt, Ghana, Kenya, Mauritius,
Morocco, Namibia, Nigeria, South Africa and Tunisia, the choice of which we discuss in section 3.3.
Our study adds to the existing literature on conditional currency risk pricing by incorporating a
new set of countries. Further, in our robustness check, we estimate the SDF model with real exchange rate
decomposed into inflation and nominal exchange rate. Interestingly, we find strong evidence suggesting
that both inflation risk and nominal exchange risk are priced with time varying risk premia. This is a
material contribution to the literature, which has so far, tended not to study the pricing of inflation in asset
markets, especially in the conditional sense. The balance of this paper is structured as follows. Section 3
presents the theoretical model that underpins this study and the empirical procedures, and describes the
4 Allen et al. (2011) profile Africa’s major equity markets in ways that highlight their evolution as well as inform
potential international investors about their attractiveness. For additional background information about Africa’s national equity markets, see Kenny and Moss (1998) and Nellor (2008). 5 Other potential variables from Africa’s local economies are discussed in the section 3.3.
Conditional Pricing of Currency and Inflation Risks in Africa’s Equity Markets
Page 8
data. Section 4 presents the primary empirical estimates of the models and explores additional tests as a
way of providing robustness checks for the baseline results. Section 5 concludes.
3. Methodology and data
3.1 The theoretical model
The Baseline SDF models
The first order condition for an investor-consumer’s portfolio decision problem are:6
, = 1 (1)
where ∙ is the conditional expectations operator, is the investor-consumer’s intertemporal
marginal rate of substitution also known as the pricing kernel, , is the gross return anticipated on
asset , = 1, 2, … , at time + 1. Cochrane (2000) demonstrates that equation (1) is equivalent to
linear stochastic discount factor models of the form:
= +′ (2)
where is a × 1 vector of factor loadings and, is a × 1 vector of factors. The
stochastic discount factor (SDF) model assumes that returns are conditional on the full set of market-wide
information, Ω, available to investors at time t.7 Since Ω is not observable, econometric tests of the SDF
model are performed by proxying Ω by a set of a few carefully selected and judiciously transformed
instrumental variables, ∈ Ω, assumed to contain time t information. The instrument set can be used
to scale the factors, in a situation in which the factors are expected only to conditionally price assets, to
give (Cochrane, 1996; Lettau and Ludvigson, 2001; Hodrick and Zhang, 2001):
= + + ′ + ′ ⊗ (3)
where is the vector of scaled and unscaled factors; is a scalar, implying that one conditioning
variable is used at a time; ⊗ is the Kronecker product (multiply each term in the bracket by every factor).
If there are only two factors, we drop the time-varying intercept following Cochrane (1996), and express
equation (3) as a five-factor model with parameters ! and !" being allowed to vary over time:
6 Cochrane (2000) discusses the conditions under which these equations hold. Also see Kodongo (2011) for a more detailed derivation of the models that follow. 7 Thus, the conditional asset pricing model in equation (1) can also be expressed as , |Ω = 1.
Conditional Pricing of Currency and Inflation Risks in Africa’s Equity Markets
Page 9
= + !$, + !"$", + !$, + !"$", (4)
Cochrane (2000) also demonstrates that equation (1) implies a factor model structure of the form:
, = % +%&, + %"&," +…+ %'&,' (5)
where the term % is the price of the zero-beta asset (or the risk-free asset if one exists); %( is the risk
per unit of the expected return on factor ); &.( ) = 1, 2,… is the quantity of risk in asset i associated
with each factor j. By the definition of the covariance, the beta representation in equation (5) is
transformed into a relationship of the following form:
The scaled factor model in equations (3) and (4) can be tested unconditionally by applying the Law of
Iterated Expectations8. Plugging equation (4) into equation (1), the unconditional sample moment
conditions which we evaluate using the Generalized Method of Moments (GMM) are expressed
parsimoniously as:
9: ; = :∑ => + ′ + ′⊗ ?@, − 1B:C = D = 1,2, … , E (7)
where ; is the set of all parameters (a, b) to be estimated and 0 is an n-vector of zeros. Non-zero
elements of indicate the importance of a factor as a determinant of the pricing kernel. We model
equation (7) with two factors: the world market risk factor and the currency risk factor. Inclusion of the
currency risk factor is informed by Zhang (2006), who finds that exchange risk premiums contribute
significantly to the excess returns on international assets, and that the conditional International Capital
Asset Pricing Model (ICAPM) with exchange risk performs better than all international asset pricing
models that have been hitherto investigated.
8 The law states that taking an expected value using less information of an expected value that is formed on more
information, gives the expected value using less information (Cochrane, 2000). For instance, F GH = G.
Conditional Pricing of Currency and Inflation Risks in Africa’s Equity Markets
Page 10
Estimation of factor risk premia
Using the parameterization in equation (6) and following previous studies (Harvey and Kirby, 1995;
Shanken and Zhou, 2007; Iqbal et al., 2010), the sample moment conditions to be evaluated are:
9: I = :∑
JKKKKL
@ − MN6 − MN. − MN." −ON.P
@ − Q% − ∑ %( @01/RMNS T,01/RMNT,UONT,U7'(C VW
WWWX = D:C (8)
where a circumflex indicates that the parameter is an estimate; I is the vector of all parameters; Q is an n-
vector of ones; @ is an n-vector of asset returns with mean vector M6; is a k-vector of scaled and
unscaled factors with mean vector M.; and O(,.P = YZ (,. There are a total of 2 E + moment
conditions in system (8). We estimate the system’s parameters through the sequential GMM procedure of
Ogaki (1992). Accordingly, we partition the moment conditions 9: I into two sub-vectors:
9: I = :∑ [ ℎ, Iℎ", I, I"]:C (9)
The first sub-vector ℎ, I contains E + 2 moment conditions and yields E + 2 parameters
I consisting of means of returns and means and variances of factors. The first sub-system is therefore
exactly identified so that its GMM estimator I = @_ ′, ′, ON.P′′ is independent of the weighting matrix.
The second sub-vector is defined as ℎ", I, I" where I" = a consists of the risk free rate of return
and factor risk premia. By plugging I into the last n moment conditions and setting
1 b⁄ ∑ >ℎ",I, I"?:C = 0, the estimator I" = a is obtained.
Since a is a + 1 < E-vector, the second sub-system is over-identified and the weighting
matrix used in the GMM estimation matters. Shanken and Zhou (2007) suggest use of the identity matrix
or the inverse of estimates of the variance-covariance matrix of the n moment conditions. Harvey and
Kirby (1995) demonstrate that the GMM estimator I" is fully efficient. Iqbal et al. (2010) point out that
the estimator is not subject to errors-in-variables problem because there are no generated regressors
employed in the estimation of the risk premia; rather, only the means and variances of returns and factors
from the first stage of the sequential GMM process are used. The sequential GMM approach is
particularly suitable because, like the GARCH process, it is robust to heteroskedasticity. Further, Hall
(1993: 404) explains that under the GMM approach, one need not make an explicit specification of the
Conditional Pricing of Currency and Inflation Risks in Africa’s Equity Markets
Page 11
data generating process. This can be contrasted with the traditional techniques of estimation, such as
maximum likelihood procedures, where a data generating process, typically informed by an explicitly
defined probability density function, necessarily forms a part of the estimation process. If the model is
misspecified, that is, if the specified distribution function turns out not to accurately reflect the true data
generating process, such traditional techniques are likely to give biased parameter estimates: the GMM
does not suffer this shortcoming.9
Stability tests in conditional asset pricing models
Unconditional asset pricing models have proved ineffective in capturing time-varying risk
premiums. This is largely because the theoretical underpinnings of the unconditional models impose
strong assumptions on the underlying probability distributions and investors’ attitudes toward risk to
obtain the time-invariant linear factor structures. Consequently, conditional models have become
attractive in empirical asset pricing investigations. However, conditional asset pricing models only work
well if they are correctly specified in the sense that the instrumental variables used can correctly capture
the dynamics of risk premiums. Ghysels (1998) points out the danger of committing serious pricing errors
if the factor risks are inherently misspecified in conditional asset pricing models. He shows that
conditional models may have larger pricing errors than unconditional models and attributes this result to
structural shifts, the existence of which causes parameter instability.
Garcia and Ghysels (1998) further document the importance of testing for structural changes in
the context of emerging markets, especially given the strong political and economic idiosyncrasies that
have disrupted these markets in comparison with world markets. To check the structural instability in the
SDF parameters, they propose the sup-LM test of Andrews (1993). The null hypothesis for the sup-LM
test is that there are no structural shifts so that parameters are stable. This is tested against the alternative
that there is a single structural break at some unknown point in time. We compute the sup-LM statistic as
the largest of LM statistics computed at 5% increments between 15% and 85% of the sample. The
calculated sup-LM statistic is evaluated against critical values in Table 1 of Andrews (2003).
3.3 Data and preliminary analysis
A summary of key facts about the African countries sampled for this study is displayed in Table
1. The countries are sampled on the basis of the “relative trading activity” (a liquidity proxy) of the
9 For instance, in their work, Moerman and VanDjik (2010), model a GARCH process in which the market risk premium is restricted to be an exponential function of, while the exchange risk premia are a linear function of, the information variables; further, because of the frequent violations of the normality assumption by asset returns, they use a quasi maximum likelihood procedure to estimate the log-likelihood function. Such restrictions need not be imposed, and a particular distribution of returns need not be specified, under the GMM approach.
Conditional Pricing of Currency and Inflation Risks in Africa’s Equity Markets
Page 12
countries’ respective stock markets. Following Allen et al. (2011), we measure relative trading activity as
the total value of shares traded on an exchange, as at end of 2009, scaled by the GDP of the exchange’s
host country for the year 2009. Although liquidity levels for many of the sampled markets are very low by
the standards of markets in industrial countries, foreign investor participation in many of the sampled
markets is very vibrant. Indeed, for many of the markets, the volume of foreign transactions is, typically,
a substantial proportion of total volume within a period: for instance, foreign investor participation at the
end of 2011 was about 52% at the Nairobi Securities Exchange (Nyangoro, 2013) and about 56% of the
total volume at the Nigerian Stock Exchange.10
Table 1 about here
Other than market liquidity, the data in Table 1 show that the countries chosen are also the most
trade competitive and have the most viable capital markets in African. Through this set of countries, we
also sought to capture a sufficiently representative sample in terms of the level of economic development
and spectrum of economic activity. Availability of data and lengths of time over which the data are
available also played an important role in informing country choice. Thus, the ten stock markets chosen
are some of the most vibrant in Africa, with the longest available stock index data series. The analysis
uses aggregate equity market data. All categories of data and all returns are measured in US dollars for
the period 1997:1 to 2009:12. This is the period during which foreign investors’ participation had been
allowed in most of Africa’s financial markets (also see official liberalization dates in Table 1) and over
which financial time series data are consistently available for the sampled countries. Observations are
sampled at monthly intervals.
Three distinct exchange rate regimes can be identified from the ten sampled countries. According
to IMF (2008), Morocco, Namibia and Tunisia operate a conventional fixed peg: Namibia has pegged
one-for-one against the South African rand while Morocco and Tunisia have pegged against a basket of
currencies of key trading partners; Botswana operates a crawling peg (against a basket comprising of the
South African rand and the US dollar); South Africa operates and independent float. The rest of the
countries officially operated a freely floating regime during the study period. However, a country’s actual
(de facto) exchange rate regime might differ from her officially declared (de jure) exchange rate regime
and, in reality, some countries that have declared to have floated their currencies actually only targeted
stable exchange rates (Buluba and Otker-Robe, 2002). The duo attribute divergences between stated and
actual policies to concerns about political costs of undertaking visible devaluations under a formal peg or
10 Accessed April 25, 2013 at http://connectnigeria.com/articles/2013/01/21/foreign-investments-in-the-nigerian-stock-exchange-was-56-at-n733-billion-in-2012/
Conditional Pricing of Currency and Inflation Risks in Africa’s Equity Markets
Page 13
the “fear of floating” to limit the potential impact of large exchange rate exposure on the domestic
economy. Indeed, in the new IMF classification that tries to address discrepancies between de jure
regimes and de facto regimes, the rest of the sampled countries’ exchange rate systems fall under
“managed floating with no predetermined path for the exchange rate” (Buluba and Otker-Robe, 2002;
IMF, 2008). Thus, other than Namibia, the exchange rates systems for a majority of the countries are
flexible enough that risk-averse investors would be concerned about the effect of such flexibility on return
from their portfolio investments.
Recent studies (e.g., Patnaik et al., 2010) have, however, demonstrated that Africa, in general,
exhibits a shift towards greater exchange rate flexibility. Nonetheless, our model also attempts to address
apparent low flexibility in the nominal exchange rates of some of the countries by using real exchange
rates. Real exchange rates are preferred because they capture both inflationary forces and nominal
exchange rates, both of which, theoretically, have a mutual relationship with cross-border capital flows.
Because it incorporates inflation, which responds to domestic production and income levels, among other
time-varying macroeconomic fundamentals, real exchange rates, even for countries that operate a
conventional fixed peg, are likely to exhibit a great deal of flexibility. From this perspective, we expect
that risk-averse international investors would be concerned about the effect of (real exchange rate)
fluctuations on returns from their portfolio investments. The relatively more flexible real exchange rate
regimes allow us to model and explore the pricing of foreign exchange risk in the sampled equity markets.
However, to the extent that real exchange rates may not fully address the issue of flexibility of the
exchange rate systems, our tests examine the extent to which foreign exchange restrictions are built into
overall return requirements demanded by international equity investors.
The exchange rate is defined as the African currency price of the US dollar so that a positive
change indicates depreciation of the African currency. For each African country, the real exchange rate is
calculated as the product of the nominal exchange rate with respect to the US dollar and the CPI of the
USA relative to the CPI of the foreign country: for instance, the real exchange rate (RER) of the
Moroccan dirham (MD) with respect to the US dollar ($) is computed as fg/$ = fg/$ × jklmno jklf,6,pp,⁄ , where NER is the nominal exchange rate. To ease comparability with the extant
literature, the “Afro” real exchange rate is constructed as in Kodongo and Ojah (2011). Similar exchange
rate measures have been used variously in the literature (Vassalou, 2000; Carrieri and Majerbi, 2006).
The relative change in the value of foreign currency, q, used in parameter estimation, is then calculated
as q = ln t − uEtR, where t is the “African” real rate of exchange at time t. Inflation is measured as
the monthly rate of change in the consumer price index.
Returns on all indexes provided in African currencies are converted into US dollar returns
through the nominal exchange rate using the formula: Zg = ln1 + Z. − ln 1 + tg, where Z. is the
Conditional Pricing of Currency and Inflation Risks in Africa’s Equity Markets
Page 14
foreign (African) currency-measured return and tg is the change in the value of the US dollar. As already
explained, the study takes the view of a global investor seeking diversification opportunities in foreign
(African) equity portfolios. The random rate of return on an index is computed as Z, = ln l, − ln l,R,
where l, is the value of African stock market index, i, at time t. The gross return on an index is the
random rate of return on the index plus one.
Choice of conditioning variables
Dumas and Solnik (1995) explain that instrumental variables can be proxied by endogenous
variables, such as financial market variables, that are observed frequently. The general criteria for
inclusion of such economic and financial variables are that they must be predictors of return or leading
indicators of business cycle (Drobetz et al., 2002). Importantly, conditioning variables should
approximate the information set used by investors in setting prices.
Several studies have investigated the predictability of equity returns in the industrial and
emerging markets. Fama and French (1988) find that dividend yields have systematic forecast power
across different time periods and return horizons in the USA. Predictable variation in stock returns is, in
turn, tracked by variables commonly used to measure default and term premiums in bond returns.11 They
conclude that dividend yield and the default spread capture similar variation in expected stock and bond
returns. Ang and Bekaert (2007) find that dividend yields predict excess returns only at short horizons and
do not have any long-horizon predictive power. Keim and Stambaugh (1986) find, based on the
conditional estimates, that there is at best a weak positive January seasonal (effect) in the market beta of
the difference in returns between small and large firms. Gultekin and Gultekin (1983) find evidence of
seasonal patterns of stock returns: the seasonality is manifested in significantly large mean returns in the
turn of the tax year, usually January. Systematically higher returns in the month of January, christened the
January effect in the literature, have also been reported in some emerging market economies (Claessens et
al., 1993). Giovannini and Jorion (1987) find that increases in interest rates are associated with
predictable increases in the volatility of returns in the foreign exchange market and in the US stock
market, and that expected returns both in the stock market and in the foreign exchange market are
negatively correlated with nominal interest rates. Geske and Roll (1983) find that stock returns are
negatively related to both expected and unexpected inflation. Our preliminary analysis (Table 2) also
show that stock returns in the sampled countries are inversely related to local inflation.
11 The authors define the default-premium as the difference between the yield on a market portfolio of corporate bonds and the yield on Treasury bonds of the same maturity. The term-premium variable is the difference between the Aaa yield (or treasury notes), usually of ten-year maturity, and the one-month Treasury bill rate.
Conditional Pricing of Currency and Inflation Risks in Africa’s Equity Markets
Page 15
In practice, the selection of instrumental variables can also be guided by previous studies of a
similar design. In addition to worldwide factors (such as the dividend yield on world market portfolio and
the Eurodollar deposit rate) assumed to apply uniformly across countries, Harvey (1991) considers the
following local instruments: lagged own-country equity market index returns, country-specific dividend
yield, country-specific short-term interest rates, foreign exchange rate changes, and local maturity
spreads. Dumas and Solnik (1995) find that the inclusion of non-dollar interest rates reduces the finite-
sample properties of estimates and show that instrument choice is important in determining the success of
asset pricing models tests. In contrast, Buckberg (1995) reports substantial improvements in return
prediction following inclusion of lagged local market instruments. Accordingly, Buckberg’s instruments
set includes lagged local dividend yield and the lagged return on the dollar-local currency exchange rate.
Our choice of instrument variables borrows from the existing studies. We make use of ordinary
least squares multiple linear regression of gross market index returns on potential predetermined variables
frequently used in the literature. The debt markets are not very well developed in the majority of our
sampled countries; thus, we could not get enough long term interest rates to develop term premia.
Equally, aggregate (market) dividend yields are not available for many of the sampled countries and when
available, the series are too short to be of meaningful use. Thus, we investigate a small set of potential
local market instruments, including short-term interest rates, lagged local market index returns, exchange
rates and local inflation. None of them reports significant coefficients in the predictive regressions. This
finding is in contrast with the findings of Garcia and Ghysels (1998) for a range of emerging markets and
Iqbal et al. (2010) for Pakistan, perhaps an indication of the uniqueness of Africa’s equity markets and
why findings from other emerging markets may not be generalized to Africa’s markets.
Figure 1 about here
The lagged values of local inflation reports the largest t-statistics of all the local variables
examined. We therefore include it in the study’s instrument variables set. Several worldwide variables
report low standard errors in many of the equations, implying good African equity returns predictive
power. Thus, in addition to the African country inflation, this study uses lagged values of the following
four worldwide instrument variables: the MSCI world equity portfolio returns, the MSCI world equity
portfolio dividend yield in excess of the Eurodollar rates, and the USA term premia.12 Consistent with
many asset pricing studies, we also include the January dummy. A key strength of the resulting
instrument variables set is that it affords us a direct comparison with the existing literature.
12
The USA term premium is measured as the difference between monthly returns on ten-year US Treasury bond
and monthly returns on three-month US Treasury bills.
Conditional Pricing of Currency and Inflation Risks in Africa’s Equity Markets
Page 16
The Generalized Method of Moments, used for empirical estimation in this study, rests on the
assumption that instrument variables are stationary. Figure 1 display the time series properties of the
conditioning variables. The figure shows that the lagged values of the excess MSCI world market
dividend yields and USA term premia are not stationary while lagged values of the domestic inflation and
gross MSCI world market equity portfolio returns appear stationary. To deal with the problem of non-
stationarity and to ensure that the conditioning variables have the ability to capture the time series
properties of the risk factors, empirical implementation makes use of their cyclical components of the
lagged values of the USA term premia (UTP), and excess world dividend yield (WDX). The cyclical
components of the two conditioning variables are extracted using the Hodrick-Prescott (1997) filter.
Visual investigation (Figure 2) shows that the variables, so constructed, are stationary. The Dickey-Fuller
statistics for the hypothesis of a unit root, reported in panel B of Table 3, confirm the visual observation.
Figure 2 about here
To demonstrate the ability of the conditioning variables to predict gross returns, we run an
ordinary least squares regression of gross returns on equity indexes in the sampled countries on the
reconstructed set of conditioning variables. Results are displayed on Table 2. R-squared values indicate
that the five conditioning variables explain up to 18.6% of gross returns for Mauritius. The lowest R-
squared value is 3.31% for Nigeria. The recorded return predictability is generally consistent with (and in
many cases slightly better than) those reported in other equity markets (see e.g., Harvey, 1991; Dumas
and Solnik, 1995). The Wald test for the restriction that all coefficients equal zero rejects the null in three
countries: Ghana, Nigeria and South Africa. Other than Nigeria, whose stock return predictability is
especially low, the excess world equity portfolio dividend yield appears to be an important predictor
variable for equity returns in all the countries. Importantly, each of the conditioning variables, excepting
African inflation, as already explained, is significant in at least one of the equations.
Table 2 about here
Descriptive statistics
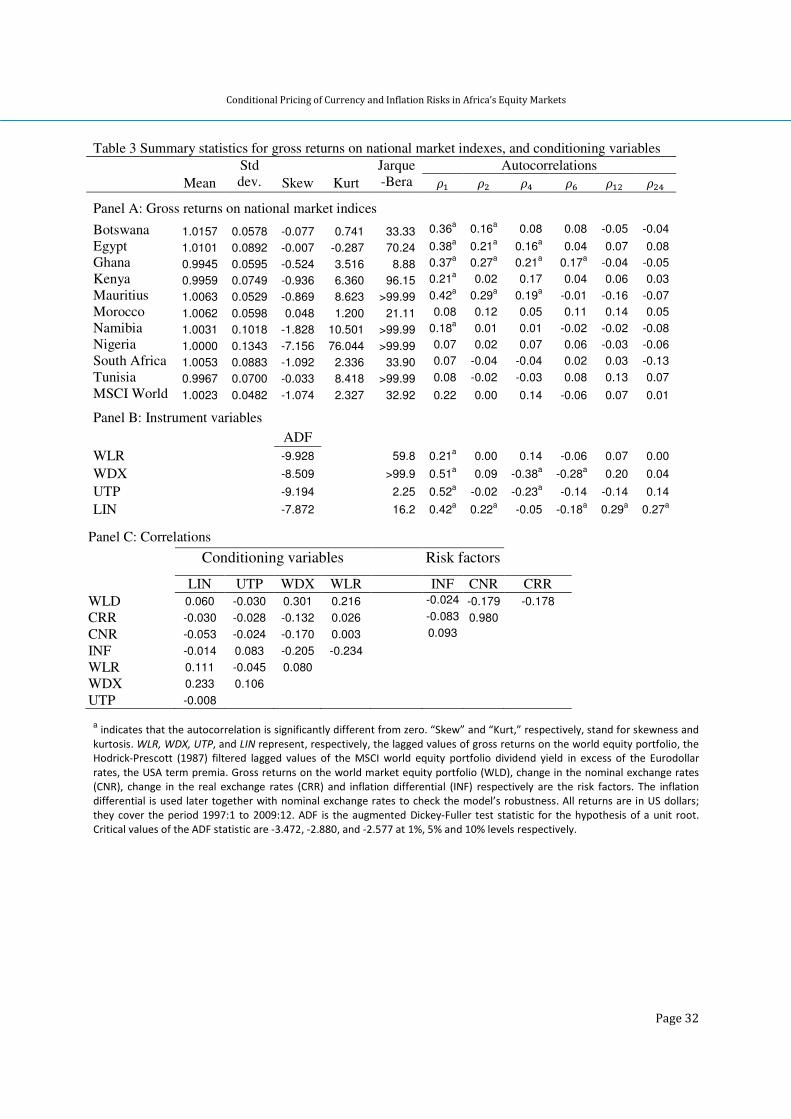
Panel A of Table 3 presents a summary of stock market index returns and their autocorrelations.
The assumption of normality appears to be violated by the distributions of returns for all the national
market indices as well as the MSCI world equity portfolio index. This is not surprising as evidence
suggests that the assumption of normality is frequently violated in asset price returns (see e.g., Brooks et
Conditional Pricing of Currency and Inflation Risks in Africa’s Equity Markets
Page 17
al., 2005). The presence of non-normal return behavior in African capital markets implies that investors
are likely to demand more compensation than that implied by return volatility.
Table 3 about here
High positive first order autocorrelation (above 10%), implying high return predictability, is
observed for six of the ten countries and the world equity portfolio index. Ghana exhibits the highest
persistent return predictability with its autocorrelation function remaining significant up to the ninth lag
(0.143). Positive autocorrelation of returns implies that below-average [above-average] returns tend to be
followed by other below-average [above-average] returns. Thus, we would expect negative [positive]
returns the month following that in which large negative [positive] returns are reported. Consistent with
the literature (e.g., Dumas and Solnik, 1995), high and persistent serial dependence is also observed on
many of the conditioning variables (panel B). Serial dependence largely dies out by the twenty fourth lag.
Panel C depicts the correlation matrix for the risk factors and conditioning variables. The
correlation coefficients are low in all cases, the highest being – 0.234 between the lagged gross MSCI
world equity portfolio returns and domestic inflation. Importantly, note that the correlation between
nominal exchange rates and inflation, as constructed for this study, is very close to zero. Low correlations
among factors and instruments are desired for the efficiency of GMM estimates.
4. Empirical results
We now present empirical results for the estimates of the SDF models discussed in section 3. As
already explained, each conditioning variable is incorporated separately into the SDF model. Results are
presented separately for each of the different specifications. Inferences are based on the J-statistic of
Hansen’s (1982) optimal iterative GMM.13 We also provide results for some robustness checks here.
4.1. Parameter estimates
Table 4 contains estimation outputs for parameters of the stochastic discount factor () as defined
in equation (7). These parameters provide information on the importance of each factor in determining the
pricing kernel. The table also contains estimates of factor risk premia (a) as presented in equation (8).
These parameters impart information on the relative importance of each factor in influencing expected
returns of equity securities in Africa’s capital markets. The model includes two risk factors, namely, the
world market equity portfolio returns and real foreign exchange rate changes. Consistent with Cochrane
(1996), we use model specifications in which the conditioning variables are not separately included in the
13 The Hansen and Jagannathan (1997) distance may alternatively be used. However, Hodrick and Zhang (2001) explain that
inferences on the validity of a model based on the HJ-distance equal zero are always similar to inferences based on the J-statistic.
Conditional Pricing of Currency and Inflation Risks in Africa’s Equity Markets
Page 18
pricing kernel. Many other authors (Lettau and Ludvigson, 2001; Drobetz et al., 2002; Iqbal et al., 2010),
have employed this approach successfully in conditional asset pricing studies in various equity markets.
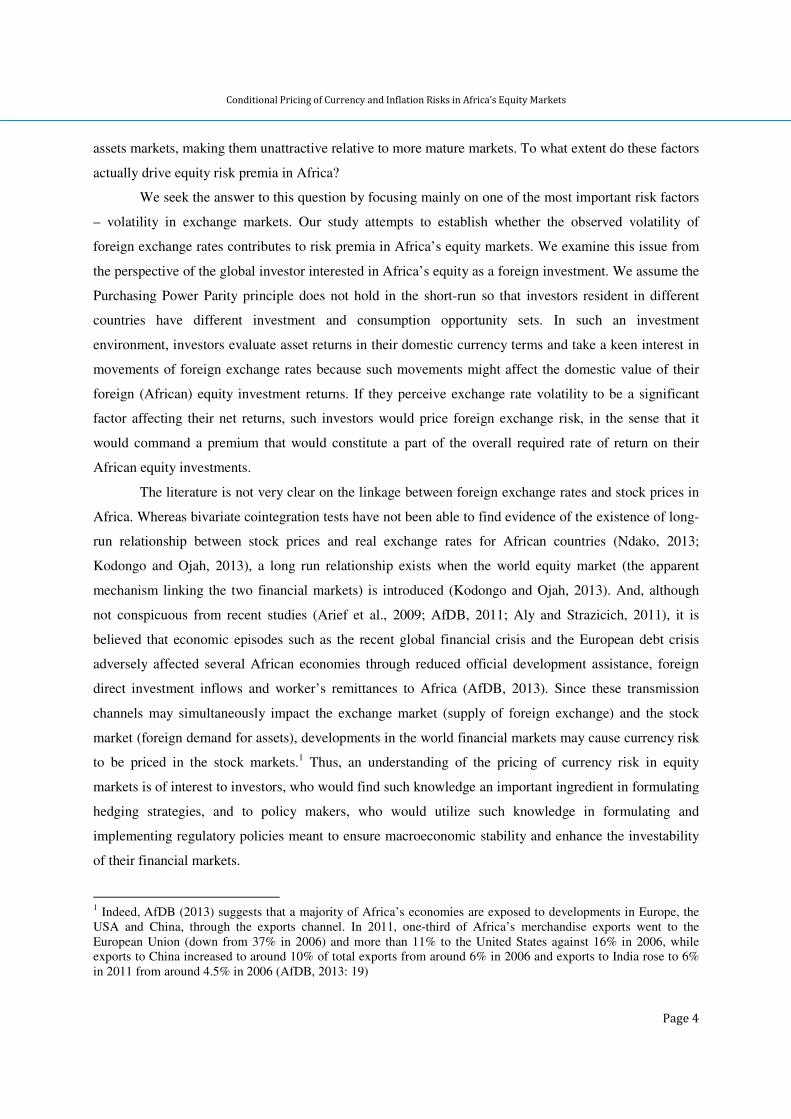
Table 4 shows that the real exchange risk factor significantly enters the pricing kernel in the
equity securities when risk factors are scaled by the lagged MSCI world equity portfolio returns (Panel A)
and the January dummy (panel D). In both models, both the constant and the time varying exchange risk
factors enter the kernel. However, the time-varying real exchange rate factor enters the pricing kernel in
three of the models (panels, A, D and E). In the remaining model specifications, none of the risk factors
significantly explains the pricing kernel for equity securities in Africa.
Table 4 about here
Parameter estimates for factor risk premia yield interesting results. The zero-beta asset return lies
between 0.5 percent and 1.2 percent per month, which is reasonable for Africa’s money markets. If the
zero-beta asset can be proxied by Treasury bills, the explanation for the moderate to high zero-beta rate
draws from the heavy demand for domestic debt to finance short-term budget deficits in most of the
economies studied. The average Treasury bills annualized percentage rate for seven of the countries for
which data is available over the study period was 11.45% (approximately, 0.955% per month).14 Thus, the
estimated zero-beta rate is a reasonable estimate of the observed risk-free rates of return. This finding
satisfies one of the criteria prescribed by Lewellen et al. (2010), i.e., that conditional asset pricing models
must be evaluated against their ability to estimate risk premia that are close to the observed values. We
interpret the high t-statistics associated with the zero-beta factor to imply that the factor is a suitable
proxy for other potential factors affecting equity returns, excluded in our model.
The time-varying component of the world equity market risk factor is significantly priced in four
of the five specifications. However, we document mixed findings for the real exchange risk factor. The
factor appears to be conditionally priced, with time-varying risk premia, in only two specifications –
where risk factors are scaled by lagged returns on the world market equity portfolio (panel A) and United
States term premium (panel C). These results do not therefore lead to a clear, unanimous inference about
time variation in real exchange risk premia in Africa’s stock markets. However, in addition to the two
specifications above, the January dummy specification (panel D), also finds the time-invariant real
exchange risk factor priced. That makes three out of five specifications, giving us reasonable evidence to
infer that the real exchange risk factor generally commands significant time-invariant premia in the equity
markets studied. This contradicts the unconditional pricing results in Kodongo and Ojah (2011).
14
The average annualized percentage Treasury bills rates for each country were: Egypt – 8.89; Ghana – 25.01; Kenya – 10.51;
Morocco – 4.12; Namibia – 8.806; Nigeria – 12.39 and South Africa – 10.45 (source: International Financial Statistics). No
Treasury bills rates were available for the remaining sampled countries for the period.
Conditional Pricing of Currency and Inflation Risks in Africa’s Equity Markets
Page 19
Diagnostic statistics give a “clean bill of health” to our model specifications. First, the J-statistic,
the optimal GMM test for over-identifying restrictions, yields p-values greater than 10% for all the
specifications. Thus, the data do not reject the model specifications at any of the conventional levels of
significance. The Sup-LM statistics also indicate that SDF parameter estimates for all the model
specification are stable over time. We use the Wald statistic to examine the joint significance of the factor
risk estimates: the statistics strongly reject the hypothesis that all factor risk coefficients are zero for all
the model specifications tested.
Our findings on foreign exchange risk pricing suggest important implications. First, foreign
investors keen to diversify their portfolios in the better performing African equity markets should do so
on the understanding that their returns are generally exposed to currency risk and must be hedged against
currency fluctuations. However, the pricing of currency risk must be interpreted within context of the
particular currency system in each country. Thus, for fixed peg regimes such as, Morocco, Namibia and
Tunisia, international equity investors would demand a currency premium to compensate them for
unexpected currency devaluations and revaluations in the destination market. The premium may also be
justified on the grounds that restrictions imposed on free fluctuations of exchange rates may prevent
investors from realizing above average returns from favorable currency movements. For Botswana’s
crawling peg regimes, patterns of exchange rate movements are still unpredictable as they depend largely
on movements in the rand and the dollar, which are in themselves random. However, for international
investors whose domestic returns are denominated in the two currencies in the basket, investing in
Botswana pula-denominated assets would be less risky and hedging may not be necessary.
For the remaining countries in the sample, exchange rate regimes are sufficiently flexible that
their movements are largely random. Many of these countries also frequently suffer inadequate foreign
currency reserves further exposing their currencies to irregular fluctuations which may be harmful to
investors’ unhedged portfolio positions in the short run. Similarly, most of the markets, with the
exception of South Africa, have very thin currency trading, relative to more developed markets, which
increase the possibility of relatively high currency volatility. As Buluba and Otker-Robe (2002) explain,
the depth and size of foreign exchange markets may affect exchange rate volatility. These observations
point to a clear need for portfolio hedging against currency fluctuations by international investors.
Figure 3 about here
The foregoing observations also point to the need to broaden financial markets to include more
innovative financial products and instruments, such as derivatives, that can aid in the hedging of exposure
to currency and other risks encountered by equity investors. Other than South Africa, most of the
countries studied here have yet to develop vibrant derivative markets which can aid investors in hedging
Conditional Pricing of Currency and Inflation Risks in Africa’s Equity Markets
Page 20
their exposure against several risk sources. In this regard, African financial markets regulatory authorities
should consider the establishment of viable derivative markets within their jurisdictions or expediting the
development of these markets if such mechanisms have already been initiated. Although macroeconomic
episodes, such as the recent global financial crisis, show that the derivatives tend to encourage speculative
activities, which raises volatility in the financial markets with potential destabilization consequences, our
recommendation is premised on the desirability of derivatives as tools for risk hedging and price
discovery. Thus, African countries that effect this recommendation must also legislate strong regulatory
measures to discourage potentially disruptive speculative uses of derivatives.
Next, we evaluate pricing errors of our estimates. Results are displayed in Figure 3. The straight
line in each panel is the 45o line, along which all correctly priced assets/portfolios should lie. Looking at
the plots, it is clear that pricing errors are fairly large for several countries especially in the specifications
in which equity returns are conditioned by lagged values of the United States term premia. The existence
of large pricing errors in conditional asset pricing is, however, not novel to this study: it has been reported
elsewhere in the emerging equity markets studies (Iqbal et al., 2010) as well as in advanced equity
markets studies (Fletcher and Kihanda, 2005; Schrimpf et al., 2007). In general, our pricing error
estimates are actually much smaller than those recorded in some less exotic emerging markets (see e.g.,
Iqbal et al., 2010). Scaling risk factors by the other conditioning variables induces some reduction in
pricing errors but still do not fully account for the variation in returns in the African equity markets.
However, Namibia and Botswana are outliers in the better performing (by pricing errors)
specifications. For Namibia, leptokurtosis in index returns may explain the large pricing error. Hwang and
Satchell (1999) demonstrate that kurtosis is an important factor in modeling emerging market returns.
Incidentally, we do not observe a similar error for Nigeria, whose data also exhibit thick tails. Although
the descriptive statistics for Botswana do not reveal any serious departures from the “norm,” the country
has the largest positive average equity returns for the period under investigation. The pricing error is the
difference between the average returns and the predicted returns.
In the context of pricing errors, the “best performing” conditioning variable appears to be the
African inflation. Thus, of the macroeconomic variables investigated, local inflation seems to be the most
capable of predicting future business cycles in the real economies of the African countries studied. This
observation appears inconsistent with the earlier OLS regressions in which this variable showed the least
ability to predict equity returns.
4.2 Some robustness checks
4.2.1 The pricing of nominal exchange risk and inflation risk
Conditional Pricing of Currency and Inflation Risks in Africa’s Equity Markets
Page 21
Although empirical investigations of the international asset pricing models with foreign exchange
risk abound, as our literature survey shows, relatively little has been done to investigate the role of
inflation. Inflation is an important issue for developing countries and is more sensitive to external shocks
than other variables such as economic growth (Darne and Ripoll-Bresson 2004). For instance, in recent
years, Africa’s average inflation rate has increased to around 9% in 2012, from 8.5% in 2011 and 7% in
2010 (AfDB, 2013). The AfDB report documents the policy dilemmas African monetary authorities have
to contend with to keep inflationary pressures and fluctuating nominal exchange rates in check. In their
study, Iwata and Wu (2006) uses the SDF to find that more than 80% of the volatilities of the currency
risk premia can be accounted for by the standard macroeconomic shocks that drive output and inflation.
The economic relevance of the influence of expected inflation on stock returns can also be substantial as
recently demonstrated by Katzura and Spierdijk (2013).
The key role played by inflation in international asset returns has been recognized by the many
theoretical models that suggest a close link between inflation and foreign exchange risk. In their model,
Adler and Dumas (1983) incorporate the two variables jointly as the real exchange risk factor. However,
this specification, which informed our baseline tests reported in Section 4.1, implies that the prices of
inflation and nominal exchange rate risk are restricted to be equal. Relaxing this restriction, leads to a
model in which asset returns depend on their sensitivity to both inflation and nominal exchange rate risks
(Moerman and van Dijk, 2010). The unconditional pricing of inflation in equity returns has been
investigated (Vassalou, 2000; Duarte, 2010). However, our literature survey found only one study
(Moerman and van Dijk, 2010) that has investigated inflation as a conditionally priced factor with time
varying risk premia in equity returns. The study found inflation risk significantly priced in the G5
(France, Germany, Japan, UK, and USA) equity markets.
Given our findings on the conditional pricing of the real exchange risk, we now attempt to
establish whether nominal exchange rate risk and inflation risk are separately priced in the African
countries’ stock markets. We run the GMM regressions with the same conditioning variables as before.
However, the new estimations make use of three risk factors: the world equity market portfolio, the
nominal exchange rates and the inflation differential. The inflation differential is computed as:
lw = ln 1 +;o − ln 1 + ;x (10)
where ;o is the African inflation and ;x is the world (proxied by the USA) inflation. African inflation is
computed as the equal weighted average of the rates of inflation for the ten sampled countries. For each
country, inflation is defined as the monthly rate of change in the consumer price index: ln jkl −ln jkl. We derive the new pricing kernel by extending equation (4) into the following seven-factor
Conditional Pricing of Currency and Inflation Risks in Africa’s Equity Markets
Page 22
constant-weights model. Parameters !, !" and !y are allowed to vary with time while the remaining
parameters capture the time-invariant properties of the risk factors.
where WLD represents the world market equity portfolio, RXR denotes the change in real exchange rate
CXR is the change in the nominal exchange rate, INF is the inflation differential and CON is a
Conditional Pricing of Currency and Inflation Risks in Africa’s Equity Markets
Page 24
conditioning variable; ' is the gross return on factor , or interaction between factor and conditioning
variable, k, at time + 1; a circumflex above a coefficient denotes the GMM estimate of the coefficient.
Table 5 about here
Farnsworth et al. (2002) demonstrate that the standard deviations of the fitted values of a
regression of the model pricing errors, − 1, on instrumental variables set, z, should explain
how well a particular model specification accounts for predictable variation in returns.15 The smaller the
sample standard deviation, the better is the model specification’s ability to “explain” return variation. The
one strength of this diagnostic check is that standard deviation measure does not place any penalty on
model specifications that get the average return wrong.
We perform this test for each of the ten countries in the sample; the results are presented in Table
5. In terms of the average standard deviation, the table shows that the specification with LIN as the
conditioning variable appears to perform the best in capturing the time series predictability of gross
returns on national equity indexes for the two-factor (real exchange risk) model. Thus, consistent with
inference drawn from the J-statistic, the African inflation still proves to be the “best performer” – i.e., it is
the most able, of the instrumental variables, to capture dynamics of the business cycles in the economies
examined. It is worth noting that one of the specifications with better cross-sectional performance, JAN,
also turns out to be the “worst performer” from a time-series perspective. For the three-factor model
(nominal exchange rates and inflation), the United States tem premium (UTP) is the best performer from
a time series perspective. This confirms Harvey’s (1991) contention that USA macroeconomic variables
are good predictors of equity returns in other countries. Incidentally, UTP was also the worst performer
on the cross-sectional perspective. The latter observation is demonstrates that the Farnsworth et al. (2002)
methodology is not biased by the ability of a model specification to correctly capture average returns.
5. Conclusions
Africa’s financial markets have recently attracted increased interest among international investors,
largely on account of their low, sometimes negative, correlations with the rest of the world, which makes
them attractive for portfolio diversification and also perhaps due to the fact that Africa has some of the
fastest growing economies in the world today. Studies have also found a positive relationship between
risk and expected returns in various stock markets in Africa. Total external financial flows to Africa
15
Schrimpf et al. (2007) and Iqbal et al. (2010) implement a variant of this approach in which the vector of excess asset
returns, rather than gross returns, is employed in the regressions. Consistent with Farnsworth et al. (2002), they both find that
conditional asset pricing models struggle to capture time-varying predictability of stock returns. Indeed, differences in results
are not expected provided that the same risk-free rate of return is used to compute excess returns for all portfolios/assets.
Conditional Pricing of Currency and Inflation Risks in Africa’s Equity Markets
Page 25
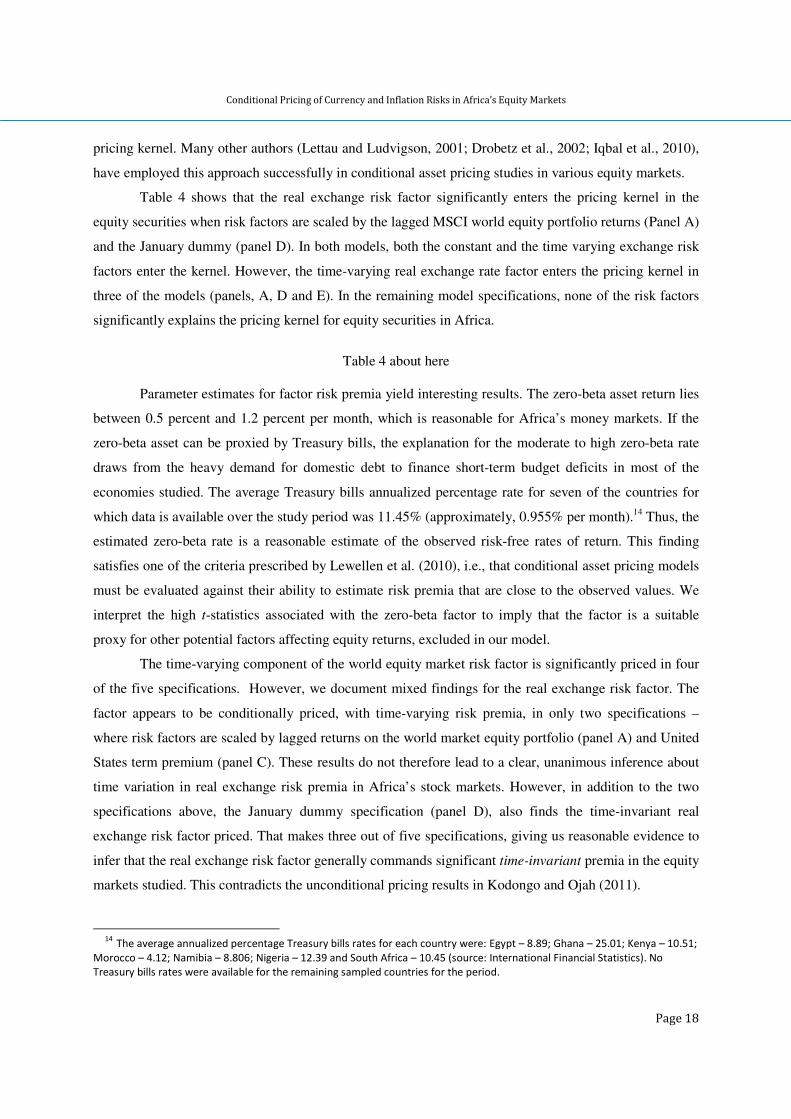
reached a historic high of an estimated USD 186.3 billion in 2012, up from USD 158.3 billion in 2011,
with the flow of foreign direct investment, portfolio investment, official development assistance and
remittances quadrupling since 2001 (AfDB, 2013). Yet most of Africa’s financial markets have relatively
higher volatility of asset returns driven by thin trading and low liquidity, perceived high political and
sovereign risk, relatively weaker regulatory environment and state of development, and lack of high
quality accounting data. Further, inadequate information about Africa’s markets, global credit tightening,
as well as increased volatility of foreign exchange markets, characterize many of Africa’s financial
markets. A combination of these factors is believed to have driven up risk premia in Africa’s assets
markets, making them unattractive relative to more mature markets.
To what extent do these factors actually drive equity risk premia in Africa? Our study uses the
SDF model in an attempt to establish whether the observed volatility of foreign exchange rates
contributes to risk premia in Africa’s equity markets. We use a two-factor model with the world market
equity portfolio and (real) foreign exchange rate changes as risk factors. Different specifications of the
two-factor model, in which the factors are scaled by conditioning variables, are examined. Scaling factors
helps to capture time variation in risk premia. To approximate the time-varying risk premia, five
conditioning variables, namely, the gross return on the MSCI world equity portfolio, MSCI world equity
portfolio dividend yield in excess of the Eurodollar rate, the USA term premium, the January dummy and
African inflation are used.
As a robustness check, we run a three factor model with nominal exchange rates and inflation
differential separately as priced factors. None of the specifications is rejected but pricing errors are larger.
We also run a test of the dynamic performance of the model specifications following Farnsworth et al.
(2002). The test finds that the specification that prices average returns best (African inflation) also
performs the best in capturing the time series predictability in asset returns for the two-factor model.
However, the United States term premium performs better than other conditioning variables for the three-
factor model. These findings give contradictory signals – while the two-factor model concurs with Garcia
and Ghysels (1998) that local variables (in our case, inflation) perform better in predicting equity returns
in local markets, the three-factor model results appear to conform to the Harvey’s (1991) argument that
USA macroeconomic variables (USA term premia) can help explain equity returns in other countries.
In the main, our empirical results suggest that the world market equity factor does not, in general,
significantly contribute to the pricing kernel in Africa’s equity markets. However, the world market factor
is found to have significant time-varying risk premia. Further, there is evidence suggesting that foreign
exchange rate changes have significant time-invariant risk premia under the two factor model and both
are priced conditionally and unconditionally under the three-factor structures. Finally, we also find strong
evidence to suggest that inflation is priced both conditionally and unconditionally in Africa’s equity
Conditional Pricing of Currency and Inflation Risks in Africa’s Equity Markets
Page 26
markets. These findings suggest some implications. First, international investors in Africa’s equity
markets must ensure that their positions are hedged against currency risk. Second, security markets
regulators in African countries should establish well-functioning derivative markets to help investors
hedge their positions against adverse shocks emanating from factors exogenous to the stock markets.
Finally, African governments should put measures in place to ensure price stability. These measures,
collective, will enhance the investability of Africa’s financial markets.
References
Abdalla, I. S. A., Murinde, V., 2007. Exchange rate and stock price interactions in emerging financial markets: evidence on India, Korea, Pakistan and Philippines. Applied Financial Economics 7, 25-35.
Adam, A. M., 2009. Financial liberalization and growth in Ghana: an application of the ARDL bounds testing approach. http://ssrn.com/abstract=1349547
Adler, M., Dumas, B., 1983. International portfolio choice and corporation finance: a synthesis. Journal of Finance 38, 925–984.
AfDB, 2011. The impact of the US credit rating downgrade and European debt crisis on Africa”, in Africa
Emerging Issues, Vol. 1, African Development Bank, Tunis. AfDB, 2013. Promoting structural transformation and better use of natural resources. African economic
outlook, 2013. African Development Bank, Tunis. Alagidede, P., Panagiotidis, T., 2009. Modelling stock returns in Africa's emerging equity markets,
International Review of Financial Analysis, 18, 1−11. Allen, F., Otchere, I. and Senbet, L. W. (2011). African financial systems: a review. Review of
Development Finance 1, 79−113. Aly, H. Y., Strazicich, M. C., 2011. Global financial crisis and Africa: is the impact permanent or
transitory? Time series evidence from North Africa. American Economic Review Papers & Proceedings 2011, 101:3, 577–581. http://www.aeaweb.org/articles.php?doi=10.1257/aer.101.3.577
Andrews, D. W. K., 1993. Tests for parameter instability and structural change with unknown change point. Econometrica 61, 821–856.
Andrews, D. W. K., 2003. Tests for parameter instability and structural change with unknown change point: A corringedum. Econometrica 71, 395–397.
Ang, A., Bekaert, G., 2007. Stock return predictability: is it there?” Review of Financial Studies 20, 651–707.
Antell, J., Vaihekoski, M., 2012. Pricing currency risk in the stock market: Evidence from Finland and Sweden 1970–2009, Journal of International Financial Markets, Institutions & Money, 22, 120−136.
Appiah-Kusi, J., Menyah, K., 2003. Return predictability in African stock markets. Review of Financial Economics 12, 247 – 270.
Arieff, A., Weiss, M. A., Jones, V. C., 2009. The global economic crisis: impact on sub-Saharan Africa and global policy responses. CRS Report for Congress, Congressional Research Service 7-5700.
Aysun, U., Guldi, M. (2011). Exchange rate exposure: a nonparametric approach. Emerging Markets Review 12, 321−337.
Bekaert, G., Harvey, C. R., Lundblad, C. T., 2003. Equity market liberalization in emerging markets. Journal of Financial Research 26, 275 – 299.
Brooks, R. D., Faff, R. W., Lee, J. H., 1992. The form of time variation of systematic risk: some Australian evidence. Applied Financial Economics 2, 190–198.
Buckberg, E., 1995. Emerging stock markets and international asset pricing. World Bank Economic Review 9, 51–74.
Cappiello, L., Panigirtzoglou N., 2008. Estimates of foreign exchange risk premia: a pricing kernel approach. Empirical Economics 35, 475–495.
Conditional Pricing of Currency and Inflation Risks in Africa’s Equity Markets
Page 27
Carrieri, F., 2001. The effects of liberalization on market and currency risk in the European Union. European Financial Management 7, 259–290.
Carrieri, F., Errunza, V., Majerbi, B., 2006. Local risk factors in emerging markets: are they separately priced? Journal of Empirical Finance 13, 444–461.
Carrieri, F., Majerbi, B., 2006. The pricing of exchange risk in emerging stock markets. Journal of International Business Studies 37, 372–391.
Choi, J. J., Hiraki, T., Takezawa, N., 1998. Is foreign exchange risk priced in the international capital markets? Journal of Financial and Quantitative Analysis 33, 361–382.
Claessens, S., Dasgupta, S., Glen, J., 1993. Stock price behavior in emerging markets. In Claessens, S., Gooptu, S. (eds.) Portfolio investment in developing countries, World Bank Discussion Paper No. 228. Washington DC.
Cochrane, J. H., 1996. A cross-sectional test of an investment-based asset pricing model. Journal of Political Economy 104, 572–621.
Cochrane, J. H., 2000. Asset pricing. http://www-gsb.uchicago.edu/fac/john.cochrane/research/papers Darne, O., Ripoll-Bresson, L., 2004. Exchange rate regime classification and real performances: new
De Santis, G., Gerard, B., 1998. How big is the premium for currency risk? Journal of Financial Economics 49, 375–412.
Dominguez, K. M. E., Tesar, L. L., 2001. A re-examination of exchange rate exposure. American Economic Review 91, 396–399.
Doukas, J., Patricia, H. H., Lang, L. H. P., 1999. The pricing of currency risk in Japan. Journal of Banking & Finance 23, 1–20.
Drobetz, W., Stürmer, S., Zimmermann, H., 2002. Conditional asset pricing in emerging stock markets. Swiss Journal of Economics and Statistics 138, 107–526.
Du, D., Hu, O., 2012. Exchange rate risk in the US stock market, Journal of International Financial Markets, Institutions & Money, 27, 137−150.
Duarte, F. M., 2010. Inflation and the cross section of stock returns. Working paper, Massachusetts Institute of Technology. http://economics.mit.edu/files/6254
Dufey, G., Srinivasulu, S. L., 1983. The case for corporate management of foreign exchange risk, Financial Management 12, 54–62.
Dumas B., Solnik, B., 1995. The world price of foreign exchange risk. Journal of Finance 50, 445–470. Fama, E., French, K., 1988. Dividend yields and expected stock returns. Journal of Financial Economics
22, 3–25. Farnsworth, H., Ferson, W., Todd, S., 2002. Performance evaluation with stochastic discount factors.
Journal of Business, 75, 473–503. Ferson, W. E., 1995. Theory and empirical testing of asset pricing models. In Jarrow, R. A., Maksimovic,
V., Ziemba, W. T. (eds.), Handbooks in Operations Research and Management Science Vol. 9, North-Holland, 145–200.
Fletcher, J., Kihanda, J., 2005. An examination of alternative CAPM-based models in UK stock returns. Journal of Banking and Finance 29, 2995–3014.
Garcia, R., Ghysels, E., 1998. Structural change and asset pricing in emerging markets. Journal of International Money and Finance, 15, 455–473.
Geske, R., Roll, R., 1983. The fiscal and monetary linkage between stock returns and inflation. Journal of Finance 38, 1–33.
Ghysels, E., 1998. On stable factor structures in the pricing of risk: do time-varying betas help or hurt? Journal of Finance 53, 549–573.
Giovannetti, G., Velucchi, M., 2009. Africa’s financial markets: a spillover analysis of shocks. European Report on Development, Florence, Italy.
Giovannini, A., Jorion , P., 1987. Interest Rates and risk premia in the stock market and in the foreign exchange market. Journal of International Money and Finance 6, pp.107–123.
Conditional Pricing of Currency and Inflation Risks in Africa’s Equity Markets
Page 28
Gultekin, M. N., Gultekin, N. B., 1983. Stock market seasonality: International evidence,” Journal of Financial Economics 12, 469–481.
Hansen, L. P., 1982. Large sample properties of the generalized method of moments estimators. Econometrica 50, 1029–1054.
Hansen, L. P., Jagannathan, R., 1997. Assessing specification errors in stochastic discount factor models. Journal of Finance 52, 591–607.
Harvey, C. R. (1995). Predictable risk and return in emerging markets. Review of Financial Studies, 8, 773−816.
Harvey, C. R., 1991. The world price of covariance risk. The Journal of Finance 46, 111–157. Harvey, C. R., Kirby, C. M., 1995. Analytical tests of factor pricing models. Duke University Working
paper, Durham NC. Hodrick, R. J., Prescott, E. C., 1997. Postwar U.S. business cycles: An empirical investigation. Journal of
Money, Credit and Banking 29, 1–16. Hodrick, R., Zhang, X. 2001. Evaluating the specification errors of asset pricing models. Journal of
Financial Economics 62, 327–376. Hwang, S., Satchell, S. E., 1999. Modeling emerging market risk premia using higher moments.
International Journal of Finance and Economics 4, 271–296. IMF, 2008. De facto classification of exchange rate regimes and monetary policy frameworks.
http://www.imf.org/external/np/mfd/er/2008/eng/0408.htm Iorio, A. D., Faff, R., 2002. The pricing of foreign exchange risk in the Australian equities market.
market perspective. Journal of International Money and Finance 29, 897 – 918. Iwata, S., Wu, S., 2006. Macroeconomic shocks and the foreign exchange risk premia. Macroeconomic
Dynamics 10, 439 – 466. Jagannathan, R., Wang, Z., 1996. The conditional CAPM and the cross-section of expected returns.
Journal of Finance 51, 3–53. Jarque, C. M., Bera, A. K., 1987. A test for normality of observations and regression residuals.
International Statistical Review 55, 163–172. Jorion, P., 1991. The pricing of exchange rate risk in the stock market. Journal of Financial and
Quantitative Analysis 26, 363–376. Katzura, T., Spierdijk, L. 2013. Stock returns and inflation risk: economic versus statistical evidence.
Working paper, University of Gronigen. http://www.rug.nl/staff/l.spierdijk/inflation_risk_exposure_revision_february_2013.pdf
Keim, D. B., Stambaugh, R. F., 1986. Predicting returns in the bond and stock markets. Journal of Financial Economics 17, 357–390.
Kenny, C., Moss, T., 1998. Stock markets in Africa: Emerging lions or white elephants? World Development 26, 829-843.
Kodongo, C. O., 2011. Foreign exchange risk and the flow of international portfolio capital: evidence from Africa’s capital markets. PhD Thesis, University of the Witwatersrand. http://hdl.handle.net/10539/11429
Kodongo, O., Ojah, K., 2011. Foreign exchange risk pricing and equity markets segmentation in Africa. Journal of Banking and Finance 35, 2295–2310.
Kodongo, O., Ojah, K., 2013. Foreign exchange rates and stock prices: evidence from major African markets. In Bahmani-Oskooee, M. (ed.) Exchange Rates in Developed and Emerging Markets:
Practices, Challenges and Economic Implications, Nova Scientific Publishers, Hauppauge, New York. Kolari, J. W., Moorman, T. C., Sorescu, S. M., 2008. Foreign exchange risk and the cross-section of stock
returns. Journal of International Money and Finance 27, 1074–1097. Lettau, M., Ludvigson, S., 2001. “Resurrecting the (C)CAPM: a cross-sectional test when risk premia are
time-varying. Journal of Political Economy 109, 1238–1287.
Conditional Pricing of Currency and Inflation Risks in Africa’s Equity Markets
Page 29
Lewellen, J., Nagel, S., Shanken, J., 2010. A skeptical appraisal of asset pricing tests. Journal of Financial Economics 96, 175 – 194.
Loudon, G. F., 1993. Foreign exchange exposure and the pricing of currency risk in equity returns: some Australian evidence. Pacific-Basin Finance Journal 1, 335–354.
MacDonald, R., 2000. Is the foreign exchange market ‘risky’? Some new survey-based results. Journal of Multinational Financial Management 10, 1–14.
Moerman, G. A., van Dijk M. A., 2010. Inflation risk and international asset returns. Journal of Banking and Finance 34, 840–855.
Ndako, U. B., 2013. Dynamics of stock prices and exchange rates relationship: evidence from five sub-Saharan African financial markets. Journal of African Business 14, 47 – 57.
Nellor, D., 2008. The rise of Africa’s “frontier” markets. Finance and Development, The International Monetary Fund, Washington DC.
Newey, W. K., West, K. D., 1987. A simple, positive semi-definite, heteroskedasticity and autocorrelation consistent covariance matrix. Econometrica 55, 703–708.
Nyangoro, O., 2013. Foreign portfolio flows and stock market performance in Kenya: case of Nairobi securities exchange. Department of Economics, University of Nairobi. https://editorialexpress.com/cgi-bin/conference/download.cgi?db_name=CSAE2013&paper_id=921
Ogaki, M., 1993. Generalized method of moments: Econometric applications. In Maddala et al. (eds.), Handbook of Statistics Vol. 11, North Holland, Amsterdam, 455–488.
Patnaik, I., Shah, A., Sethy, A., Zeileis, A., 2010.A new global database of de facto exchange rate regimes. http://macrofinance.nipfp.org.in/PDF/12_6Pr_Patnaik_PSSZ2010_world.pdf
Phylaktis, K., Ravazzolo, F., 2004. Currency risk in emerging equity markets. Emerging Markets Review
5, 317–339. Poghosyan, T., 2010. Determinants of the foreign exchange risk premium in the Gulf Cooperation
Council countries. IMF Working Paper WP/10/255, Washington DC. Poghosyan, T., Kočenda, E., 2008. Macroeconomic sources of foreign exchange risk in new EU
members. IPC Working Paper Series No. 62. University of Michigan. Schrimpf, A., Schroder, M., Stehle, R., 2007. Cross-sectional tests of conditional asset pricing models:
Evidence from the German stock market. European Financial Management 13, 880–907. Shanken, J., Zhou, Z., 2007. Estimating and testing beta pricing models: Alternative methods and their
performance in simulations. Journal of Financial Economics 84, 40–86. Sirr, G., Garvey, J., Gallagher, L., 2011. Emerging markets and portfolio foreign exchange risk: an
empirical investigation using a value-at-risk decomposition technique. Journal of International Money and Finance 30, 1749−1772.
Smith, C., Stulz, R., 1985. The determinants of firms’ hedging policies, Journal of Financial and Quantitative Analysis 20, 391–406.
Smith, P. N. and Wickens, M. R., 2002. Asset pricing with observable stochastic discount factors. Discussion Papers in Economics, Paper No. 2002/03, University of York.
Stulz, R. M., 1981. On the effects of barriers to international investment. The Journal of Finance 36, 923–934.
Tai, Chu-Sheng, 1999. Time-varying risk premia in foreign exchange and equity markets: evidence from Asia–Pacific countries. Journal of Multinational Financial Management 9, 291–316.
Verdelhan, A., 2010. A habit-based explanation of the exchange rate risk premium. Journal of Finance 65, 123 – 146.
World Economic Forum, 2009a. The Africa competitiveness report. World Economic Forum, Geneva. World Economic Forum, 2009b. The global enabling trade index report. World Economic Forum,
Geneva. Zhang, X., 2006. Specification tests of international asset pricing models. Journal of International Money
and Finance 25, 275–307.
Conditional Pricing of Currency and Inflation Risks in Africa’s Equity Markets
1 From the websites of the relevant stock exchanges, as of end of December 2009.
2 Total value of shares traded at an exchange, in 2009, as a proportion of the country’s 2009 GDP, reported in Allen
et al. (2011). Of the other African countries with these data, Cote d’Ivoire scored 0.58. However, available data series for Cote d’Ivoire is not long enough that we could include it in our sample.
3 As of 2009, on the scale 1 (highly restricted by law) to 7 (not restricted by law) (World Economic Forum, 2009a).
4 Dates are those reported in Bekaert et al. (2003) except for Ghana and Mauritius whose liberalization dates are from, respectively, Adam (2009) and the African Development Bank website: http://www.afdb.org/fileadmin/uploads/afdb/Documents/Publications/24108404-EN-MAURITIUS.PDF
5 As of 2009, on a scale 1 (least competitive) to 7 (most competitive). (World Economic Forum, 2009a). 6 See also Allen et al. (2011). For Botswana, Namibia and Mauritius, there are restrictions on the amount of foreign
ownership for some “strategic” companies.
Conditional Pricing of Currency and Inflation Risks in Africa’s Equity Markets
Page 31
Table 2 Regression of gross returns on lagged conditioning variables
Intercept WLR WDX UTP INF JAN Wald R2
Botswana 0.643 (6.88)
0.361*** (3.99)
-7.935* (-1.74)
9.101 (1.11)
-1.499 (-1.38)
-0.030* (-1.87)
4.52 [0.0004]
0.1266
Egypt 0.682 (4.66)
0.380*** (2.68)
17.047** (2.39)
-19.577 (-1.53)
-1.26 (-0.74)
0.030 (1.19)
3.41 [0.0046]
0.0985
Ghana 1.045 (10.40)
-0.045 (-0.46)
5.444 (1.11)
2.533 (0.29)
-0.276 (-0.24)
0.010 (0.56)
1.62 [0.1528]
0.0492
Kenya 0.885 (7.10)
0.182 (1.51)
17.414*** (2.87)
-25.539** (2.34)
-2.311 (1.60)
-0.015 (-0.69)
2.59 [0.0243]
0.0766
Mauritius 0.615 (7.45)
0.415*** (5.19)
8.948** (2.22)
-13.043* (-1.80)
0.444 (0.46)
0.010 (0.75)
7.13 [0.0000]
0.1861
Morocco 0.899 (9.03)
0.137 (1.42)
0.095** (2.08)
-22.458** (-2.57)
1.612 (1.39)
0.012 (0.73)
2.51 [0.0285]
0.0744
Namibia 0.623 (3.65)
0.425** (2.58)
14.693* (1.77)
-18.765 (-1.26)
0.332 (0.17)
-0.021 (-0.75)
2.24 [0.0481]
0.0670
Nigeria 0.897 (3.93)
0.114 (0.52)
7.360 (0.66)
-9.788 (0.49)
2.431 (0.91)
-0.067* (-1.74)
1.07 [0.3759]
0.0331
South Africa 0.883 (5.91)
0.169 (1.17)
15.948** (2.19)
-20.113 (-1.54)
0.104 (0.06)
-0.009 (-0.36)
1.45 [0.2046]
0.0443
Tunisia 1.034 (8.88)
0.016 (0.15)
19.116*** (3.37)
-25.718** (-2.52)
0.522 (0.39)
-0.001 (-0.04)
2.55 [0.0264]
0.0755
The table uses data for the period 1997:1 through 2009:12. The two values reported in the body of the table are, respectively, the coefficient of the explanatory variable and its corresponding t-statistic (in parentheses). The dependent variables are the respective gross returns on the local country equity market index, measured in US dollars. The explanatory variables are the January dummy (JAN) and lagged values of returns on the world market portfolio (WLR), monthly dividend yield on the world market portfolio in excess of the Eurodollar rate (WDX), the monthly USA term premium (UTP), the one-month African inflation (LIN). “Wald” is the F-statistic from the test that all regression coefficients are zero; its accompanying p-value is in square brackets. R2 is the coefficient of determination.*, **, and *** denote statistical significance at 10%, 5% and 1% respectively.
Conditional Pricing of Currency and Inflation Risks in Africa’s Equity Markets
Page 32
Table 3 Summary statistics for gross returns on national market indexes, and conditioning variables