a b 10 April 2019 Municipal Market Guide Chief Investment Office Global Wealth Management Special revenues disputed Munis attract assets Taxable equivalent yields Seeking shelter This report has been prepared by UBS Financial Services Inc. (UBS FS). Analyst certification and required disclosures begin on pg. 16.
Transcript
ab
10 April 2019
Municipal Market GuideChief Investment Office Global Wealth Management
� Special revenues disputed
� Munis attract assets
� Taxable equivalent yields
Seeking shelter
This report has been prepared by UBS Financial Services Inc. (UBS FS). Analyst certification and required disclosures begin on pg. 16.
DESKTOP PUBLISHINGCognizant Group – Srinivas Addugula, Sunil Vedangi
Cover photo: istock.com
At a glanceThe municipal bond market has exhibited extraordinary strength since the first of the year. Tax exempt mutual funds have continued to attract assets, as individual investors in some states grapple with higher effective marginal income tax rates. Not surprisingly, credits spreads also have narrowed. The spread between BBB and AAA municipals has declined to 75 basis points, to a level not seen in a decade. The favorable environment is likely to persist for some time, as the forward calendar of new issues remains manageable.
We have received numerous inquiries re-garding the prospects for an inverted mu-nicipal yield curve. While the Treasury curve has inverted periodically, the high grade municipal curve has never done so. We at-tribute the absence of inversion to the im-plicit risk that Congress conceivably could revise the Internal Revenue Code in the future to the detriment of the tax exempt bonds. The municipal market's unique op-tional redemption features also may play a role in the absence of historical inversions.
Unlike tax exempt mutual funds, which opened strong right out of the gate, mu-nicipal ETFs had a slower start to the year.
The flows did accelerate in March, how-ever, with the two largest ETFs receiving a disproportionate amount of interest. Closed-end funds, meanwhile, posted double digit returns for the first quarter.
In this month's edition of the Municipal Market Guide, we throw a spotlight on a recent decision by the US Court of Appeals for the First Circuit. In a move that sur-prised many market participants, the ap-pellate court ruled that municipal debtors are not obliged to remit special revenues to creditors during the pendency of their bankruptcy proceeding. We expect the decision will result in some revenue bond downgrades.
In light of the economic expansion still un-derway, as well as the market's technical strength, we do not expect the First Circuit decision to have an immediate adverse im-pact on municipal credit quality. However, over the longer term, the court decision may undermine confidence in the recovery values for distressed debt and reinforces our belief that debtors in Chapter 9 have significant advantages in their negotiations with creditors.
Total return by sector
Source: ICE BofAML, Bloomberg, UBS, as of 8 April 2019
2018 TR
2019 YTD TR
In %
Treasuries
Taxable FI Agg
Munis
Build America Bonds
Emerging Markets
Preferreds
High Yield
Investment Grade
Agencies
TIPs
S&P 500
0 5 10 15–10 –5 20
Municipal Market Guide APRIL 2019 3
Market view
0
5,000
–15,000
–20,000
–5,000
–10,000
0
10,000
4
3
2
1
5
Jan-18Mar-15 Aug-16Oct-13May-12Dec-10
Historically low yields
US presidentialelection
Rate volatility
Rate volatility
Meredith Whitney“60 minutes”
interview
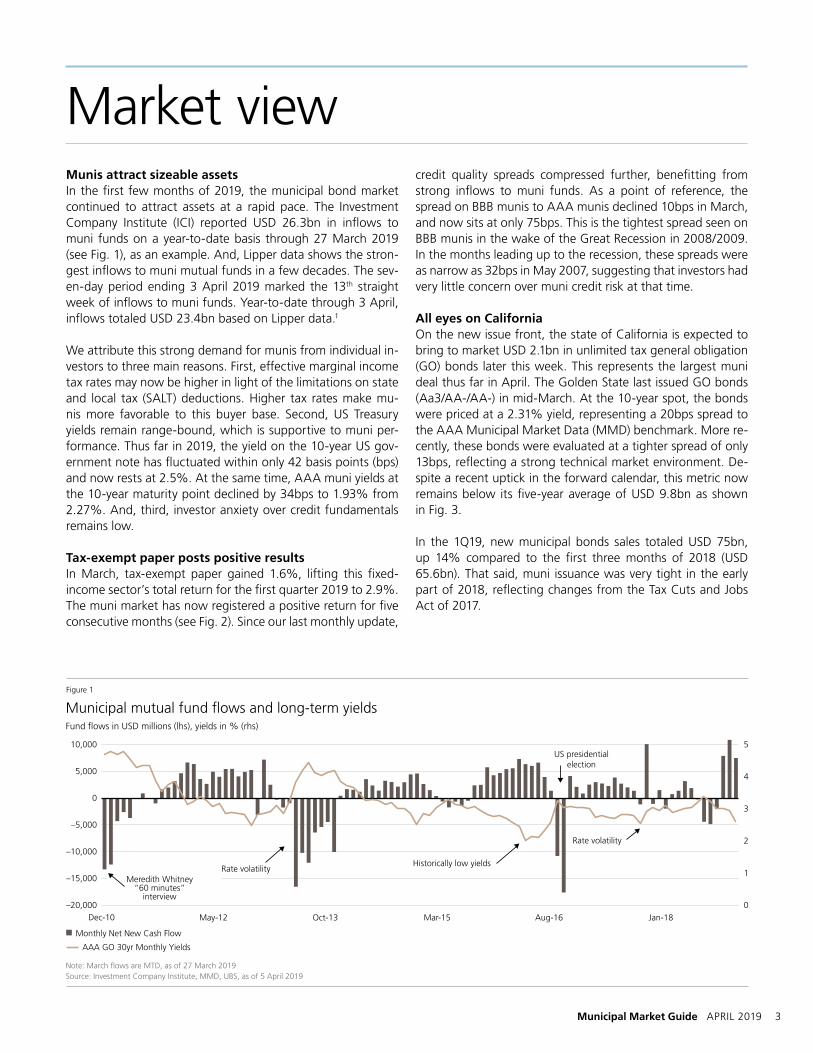
Municipal mutual fund flows and long-term yields
Note: March flows are MTD, as of 27 March 2019Source: Investment Company Institute, MMD, UBS, as of 5 April 2019
Monthly Net New Cash Flow
Figure 1
Fund flows in USD millions (lhs), yields in % (rhs)
AAA GO 30yr Monthly Yields
Munis attract sizeable assets In the first few months of 2019, the municipal bond market continued to attract assets at a rapid pace. The Investment Company Institute (ICI) reported USD 26.3bn in inflows to muni funds on a year-to-date basis through 27 March 2019 (see Fig. 1), as an example. And, Lipper data shows the stron-gest inflows to muni mutual funds in a few decades. The sev-en-day period ending 3 April 2019 marked the 13th straight week of inflows to muni funds. Year-to-date through 3 April, inflows totaled USD 23.4bn based on Lipper data.1
We attribute this strong demand for munis from individual in-vestors to three main reasons. First, effective marginal income tax rates may now be higher in light of the limitations on state and local tax (SALT) deductions. Higher tax rates make mu-nis more favorable to this buyer base. Second, US Treasury yields remain range-bound, which is supportive to muni per-formance. Thus far in 2019, the yield on the 10-year US gov-ernment note has fluctuated within only 42 basis points (bps) and now rests at 2.5%. At the same time, AAA muni yields at the 10-year maturity point declined by 34bps to 1.93% from 2.27%. And, third, investor anxiety over credit fundamentals remains low.
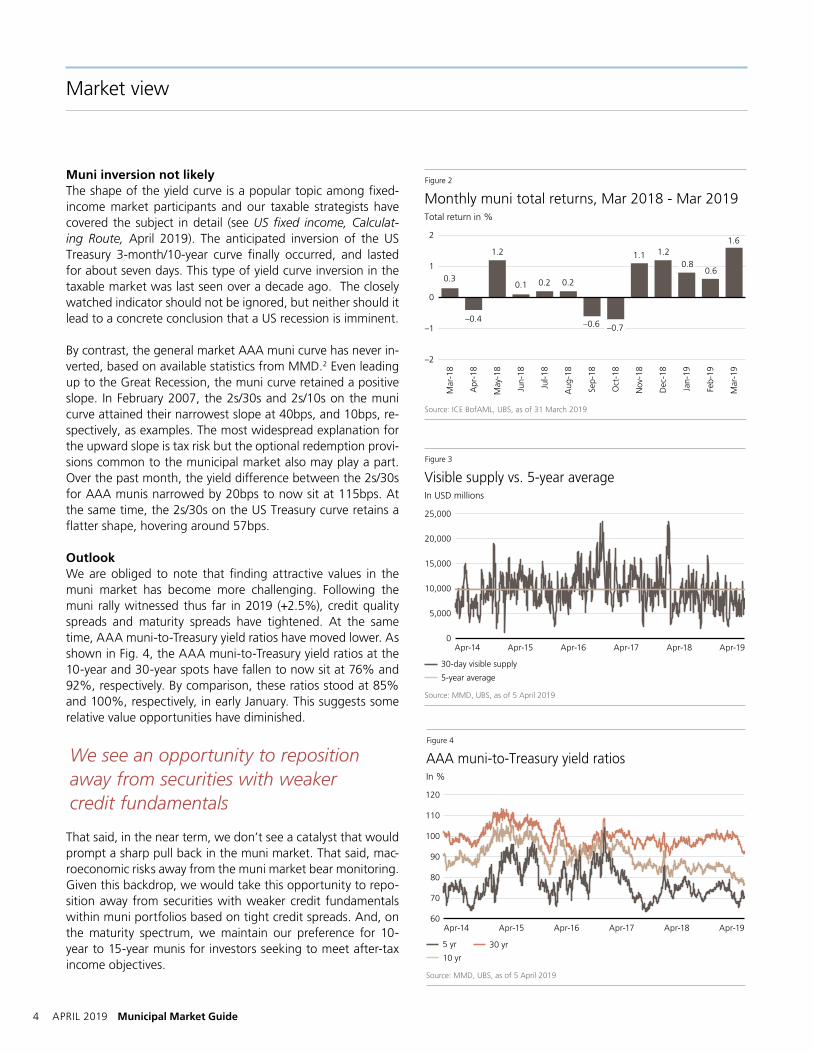
Tax-exempt paper posts positive resultsIn March, tax-exempt paper gained 1.6%, lifting this fixed-income sector’s total return for the first quarter 2019 to 2.9%. The muni market has now registered a positive return for five consecutive months (see Fig. 2). Since our last monthly update,
credit quality spreads compressed further, benefitting from strong inflows to muni funds. As a point of reference, the spread on BBB munis to AAA munis declined 10bps in March, and now sits at only 75bps. This is the tightest spread seen on BBB munis in the wake of the Great Recession in 2008/2009. In the months leading up to the recession, these spreads were as narrow as 32bps in May 2007, suggesting that investors had very little concern over muni credit risk at that time. All eyes on California On the new issue front, the state of California is expected to bring to market USD 2.1bn in unlimited tax general obligation (GO) bonds later this week. This represents the largest muni deal thus far in April. The Golden State last issued GO bonds (Aa3/AA-/AA-) in mid-March. At the 10-year spot, the bonds were priced at a 2.31% yield, representing a 20bps spread to the AAA Municipal Market Data (MMD) benchmark. More re-cently, these bonds were evaluated at a tighter spread of only 13bps, reflecting a strong technical market environment. De-spite a recent uptick in the forward calendar, this metric now remains below its five-year average of USD 9.8bn as shown in Fig. 3.
In the 1Q19, new municipal bonds sales totaled USD 75bn, up 14% compared to the first three months of 2018 (USD 65.6bn). That said, muni issuance was very tight in the early part of 2018, reflecting changes from the Tax Cuts and Jobs Act of 2017.
4 APRIL 2019 Municipal Market Guide
Muni inversion not likely The shape of the yield curve is a popular topic among fixed-income market participants and our taxable strategists have covered the subject in detail (see US fixed income, Calculat-ing Route, April 2019). The anticipated inversion of the US Treasury 3-month/10-year curve finally occurred, and lasted for about seven days. This type of yield curve inversion in the taxable market was last seen over a decade ago. The closely watched indicator should not be ignored, but neither should it lead to a concrete conclusion that a US recession is imminent.
By contrast, the general market AAA muni curve has never in-verted, based on available statistics from MMD.2 Even leading up to the Great Recession, the muni curve retained a positive slope. In February 2007, the 2s/30s and 2s/10s on the muni curve attained their narrowest slope at 40bps, and 10bps, re-spectively, as examples. The most widespread explanation for the upward slope is tax risk but the optional redemption provi-sions common to the municipal market also may play a part. Over the past month, the yield difference between the 2s/30s for AAA munis narrowed by 20bps to now sit at 115bps. At the same time, the 2s/30s on the US Treasury curve retains a flatter shape, hovering around 57bps.
Outlook We are obliged to note that finding attractive values in the muni market has become more challenging. Following the muni rally witnessed thus far in 2019 (+2.5%), credit quality spreads and maturity spreads have tightened. At the same time, AAA muni-to-Treasury yield ratios have moved lower. As shown in Fig. 4, the AAA muni-to-Treasury yield ratios at the 10-year and 30-year spots have fallen to now sit at 76% and 92%, respectively. By comparison, these ratios stood at 85% and 100%, respectively, in early January. This suggests some relative value opportunities have diminished.
We see an opportunity to reposition away from securities with weaker credit fundamentals
That said, in the near term, we don’t see a catalyst that would prompt a sharp pull back in the muni market. That said, mac-roeconomic risks away from the muni market bear monitoring. Given this backdrop, we would take this opportunity to repo-sition away from securities with weaker credit fundamentals within muni portfolios based on tight credit spreads. And, on the maturity spectrum, we maintain our preference for 10-year to 15-year munis for investors seeking to meet after-tax income objectives.
Market view
Monthly muni total returns, Mar 2018 - Mar 2019
Source: ICE BofAML, UBS, as of 31 March 2019
Figure 2
Total return in %
–2
–1
0.30.1
1.62
1
0
Mar
-18
Mar
-19
Jun-
18
Jul-1
8
Apr
-18
May
-18
Oct
-18
Nov
-18
Dec
-18
Jan-
19
Feb-
19
Aug
-18
Sep-
18
1.1
–0.6
1.21.2
–0.4
0.20.20.6
–0.7
0.8
Apr-18Apr-17Apr-16Apr-15Apr-14 Apr-19
25,000
20,000
0
15,000
5,000
10,000
Visible supply vs. 5-year average
Source: MMD, UBS, as of 5 April 2019
Figure 3
30-day visible supply
5-year average
In USD millions
Apr-18Apr-17Apr-16Apr-15Apr-14 Apr-19
120
100
110
60
90
70
80
AAA muni-to-Treasury yield ratios
Source: MMD, UBS, as of 5 April 2019
Figure 4
5 yr
10 yr
30 yr
In %
Municipal Market Guide APRIL 2019 5
Portfolio themesTake note of taxable-equivalent yields (TEYs)The effective tax rate may now be higher for some taxpayers in light of the limitation on state and local tax (SALT) deductions, making munis more appealing. Presently, a 2.5% muni with a 12-year maturity has a TEY of 4.22%, given a top marginal rate of 40.8% (including the 3.8% net investment income tax (NIIT)). For investors residing in a state with a high personal income tax rate such as New York or California, the TEY on munis at the 12-year maturity spot can exceed 5%.
Here are some examples. For a New York State resident, a 2.5% in-state tax-exempt municipal yield has a TEY of just shy of 5%, given a top marginal rate of 49.62% [37% federal tax + 3.8% NIIT + 8.82% state tax]. For a New York City resident, the TEY jumps to 5.38%, given a top marginal rate of 53.5%. This includes federal, a 3.8% NIIT, state, and city tax [37% + 8.82% + 3.8% + 3.876%]. At the same time, California resi-dents face a 54.1% top marginal rate [37% federal tax + 3.8% NIIT + 13.3% state tax]. In this instance, a 2.5% in-state tax-exempt muni yield has a TEY of 5.45%. By comparison, levels on high quality 12-year corporate bonds sit at only 3.5%, sug-gesting TEYs for munis can be compelling. TEYs for other select states that impose high income taxes are shown in Fig. 1.
Seek value in Alternative Minimum Tax (AMT) bonds The current AMT spread on an A rated revenue bond at the 15-year maturity point (see Fig. 2) now stands at about 25 basis points (bps)1. Although spreads on this private activity sector have steadily narrowed over the past few years, the incremen-tal yield advantage offered on AMT vs. non-AMT bonds war-rants consideration from investors not subject to the AMT, in our view. General airport revenue bonds present just such an opportunity. Bear in mind that fewer taxpayers are subject now to the AMT, reflecting changes from the Tax Cuts and Jobs Act of 2017. And, from a credit standpoint, airports are better in-sulated from challenges posed by unfunded pension liabilities than most types of municipal bonds (see Municipal Brief, Air-port Obligors: Risk Assessment Framework, 5 September 2018).
Consider taxable munis for tax-deferred mandates Taxable municipal bonds are attractive for tax-deferred in-vestment accounts such as IRAs, 401(k)s, and pension funds, where tax-exempt municipal bonds would traditionally be in-appropriate. First, the asset class exhibits relatively low default rates when compared to corporate bonds.2 Second, the secu-rities often provide incrementally higher yields vis à vis other forms of taxable debt. These bonds also appeal to US tax-able investors as many of these bonds are exempt from state and local taxes within the state of issuance (see our Education note Understanding bonds, an overview of taxable municipal bonds, 21 August 2018.)
Figure 3
Municipal returns by maturity segment Returns in %, duration in years
Maturity March 2019 total return
2019 YTD total return
Effective duration
Municipals 1–3 Yrs 0.4 1.0 1.8
Municipals 3–7 Yrs 0.7 1.9 3.9
Municipals 7–12 Yrs 1.4 3.0 5.9
Municipals 12–22 Yrs 1.9 3.0 7.9
Municipals 22+ Yrs 2.5 3.4 10.2
Source: ICE BofAML, UBS, as of 5 April 2019
Figure 1
Taxable-equivalent yields (TEYs) for select states Tax rates and yields, in %
State Max. statetax rate
Max. federal + state tax rate
TEY on a 2.5% tax-exempt muni
California 13.30 54.1 5.45
New York City 12.696 53.5 5.38
Hawaii 11.00 51.8 5.19
New Jersey 1 10.75 51.6 5.16
Oregon 9.90 50.7 5.07
Minnesota 9.85 50.7 5.07
District of Columbia 8.95 49.8 4.98
Vermont 8.75 49.6 4.96
New York 8.82 49.6 4.96
Maryland 2 8.60 49.4 4.94
Wisconsin 7.65 48.5 4.85
Connecticut 6.99 47.8 4.79
Note: Top federal tax rate = 40.8% including a 3.8% net investment income tax. 1 for marginal income USD 5 million and above2 assumes a 2.85% local tax on average plus the 5.75% state tax rateSource: Tax Foundation (20 March 2019), UBS, as of 5 April 2019
Apr-18Apr-17Apr-16Apr-15Apr-14 Apr-19
42
22
32
37
27
AMT vs. non-AMT spread for A rated revenue bonds
Source: MMD, UBS, as of 5 April 2019
Figure 2
AMT revenue A/A 15 yr - Non-AMT revenue A/A 15 yr
In bps
6 APRIL 2019 Municipal Market Guide
Closed-end funds updateSolid 1Q for CEFsClosed-end funds (CEFs) have posted double-digit returns so far this year. The yield on the 10-year Treasury declined in the last month, while SIFMA moved lower (see Fig. 1), both fac-tors helping fuel performance. As shown in Fig. 2, municipal closed-end funds continued to move up in the last month and as such we see them as fully valued (see Fig. 3) vs. their 52-week and two-year average discounts. Municipal CEF fund performance has weakened a bit lately, and with the tax dead-line fast approaching we may see bit of a pullback in fund prices as well.
In other news, Eaton Vance Municipal Bond Fund (EIM) an-nounced a tender offer for up to 10% of the shares at 98% of net asset value (NAV) beginning 18 April 2019. The announce-ment includes two additional tenders of up to 5% (outstand-ing shares at that time), based on certain discount levels fol-lowing completion of the initial tender. This tender offer is an option for shareholders to close the discount by tendering their shares. We expect the tender offer to be oversubscribed and proportional shares to be accepted. EIM is currently trad-ing at an 8% discount vs. its one-year average discount of 11%. In the first quarter, most closed-end funds have nar-rowed their discounts.
For additional information please refer to the press release by the fund. Funds often use tender offers and share buybacks in an attempt to reduce the discount. While tender offers have not been a particularly effective long-term tool to reduce dis-counts, we may see reduction in the in the short term.
Distribution CutsEarlier this month, we saw distribution cuts for Pimco Munici-pal Income Fund III (PMX), Pimco California Municipal Income Fund III (PZC), Pimco New York Municipal Income Fund (PNF), Pimco New York Municipal Income Fund II (PNI) and Pimco New York Municipal Income Fund III (PYN). Post-cut, these funds’ payouts are more in line with their peer group. Fund prices have traded lower since the cut. Generally, when funds are trading at significant premiums, distribution cuts will lead to share price weakness.
As always, please refer to the most recent edition of the Closed-end Fund Coverage Universe report for leverage, rat-ings, valuations, and distribution rates on the funds that we cover.
Figure 3
ValuationsFunds under coverage, in %
Fund Type Current average discount
52 - week average discount
2-year averagediscount
Municipal national leveraged –2.9 –6.1 –4.2
Municipal non leveraged –4.9 –6.2 –4.8
California leveraged –1.8 –5.5 –2.9
New Jersey leveraged –8.5 –13.5 –8.9
New York leveraged –3.2 –5.7 –4.0
Source: Bloomberg, UBS, as of 4 April 2019
Dec
-18
Oct
-18
Au
g-1
8
Jun
-18
Ap
r-18
Feb
-18
Feb
-19
Ap
r-19
2
1.5
1.75
0.75
1.25
1
SIFMA Index, currently at 1.48%
Source: Bloomberg, UBS, as of 3 April 2019
Figure 1
In %
YTD 2019 market returns vs. NAV returns
Source: Bloomberg, UBS, as of 4 April 2019
Figure 2
Funds under coverage, in %
10
5
0
10
15
National Non leveraged New Jersey New YorkCalifornia
3
5
Market NAV
3
11 11
13
44 4
Municipal Market Guide APRIL 2019 7
Exchange-traded funds update1Q19 Municipal ETF flows: Accelerating after a slow start
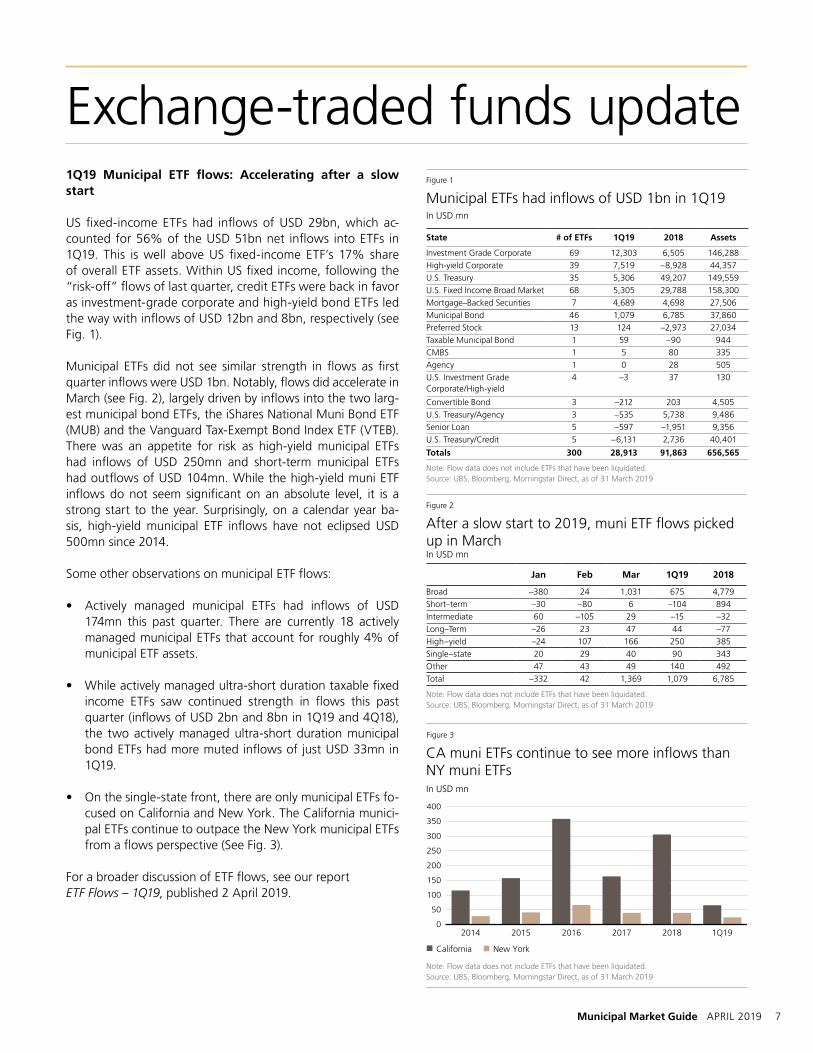
US fixed-income ETFs had inflows of USD 29bn, which ac-counted for 56% of the USD 51bn net inflows into ETFs in 1Q19. This is well above US fixed-income ETF’s 17% share of overall ETF assets. Within US fixed income, following the “risk-off” flows of last quarter, credit ETFs were back in favor as investment-grade corporate and high-yield bond ETFs led the way with inflows of USD 12bn and 8bn, respectively (see Fig. 1).
Municipal ETFs did not see similar strength in flows as first quarter inflows were USD 1bn. Notably, flows did accelerate in March (see Fig. 2), largely driven by inflows into the two larg-est municipal bond ETFs, the iShares National Muni Bond ETF (MUB) and the Vanguard Tax-Exempt Bond Index ETF (VTEB). There was an appetite for risk as high-yield municipal ETFs had inflows of USD 250mn and short-term municipal ETFs had outflows of USD 104mn. While the high-yield muni ETF inflows do not seem significant on an absolute level, it is a strong start to the year. Surprisingly, on a calendar year ba-sis, high-yield municipal ETF inflows have not eclipsed USD 500mn since 2014.
Some other observations on municipal ETF flows:
• Actively managed municipal ETFs had inflows of USD 174mn this past quarter. There are currently 18 actively managed municipal ETFs that account for roughly 4% of municipal ETF assets.
• While actively managed ultra-short duration taxable fixed income ETFs saw continued strength in flows this past quarter (inflows of USD 2bn and 8bn in 1Q19 and 4Q18), the two actively managed ultra-short duration municipal bond ETFs had more muted inflows of just USD 33mn in 1Q19.
• On the single-state front, there are only municipal ETFs fo-cused on California and New York. The California munici-pal ETFs continue to outpace the New York municipal ETFs from a flows perspective (See Fig. 3).
For a broader discussion of ETF flows, see our report ETF Flows – 1Q19, published 2 April 2019.
Figure 1
Municipal ETFs had inflows of USD 1bn in 1Q19 In USD mn
U.S. Fixed Income Broad Market 68 5,305 29,788 158,300
Mortgage–Backed Securities 7 4,689 4,698 27,506
Municipal Bond 46 1,079 6,785 37,860
Preferred Stock 13 124 –2,973 27,034
Taxable Municipal Bond 1 59 –90 944
CMBS 1 5 80 335
Agency 1 0 28 505
U.S. Investment Grade Corporate/High-yield
4 –3 37 130
Convertible Bond 3 –212 203 4,505
U.S. Treasury/Agency 3 –535 5,738 9,486
Senior Loan 5 –597 –1,951 9,356
U.S. Treasury/Credit 5 –6,131 2,736 40,401
Totals 300 28,913 91,863 656,565
Note: Flow data does not include ETFs that have been liquidated. Source: UBS, Bloomberg, Morningstar Direct, as of 31 March 2019
Figure 2
After a slow start to 2019, muni ETF flows picked up in MarchIn USD mn
Jan Feb Mar 1Q19 2018
Broad –380 24 1,031 675 4,779
Short–term –30 –80 6 –104 894
Intermediate 60 –105 29 –15 –32
Long–Term –26 23 47 44 –77
High–yield –24 107 166 250 385
Single–state 20 29 40 90 343
Other 47 43 49 140 492
Total –332 42 1,369 1,079 6,785
Note: Flow data does not include ETFs that have been liquidated. Source: UBS, Bloomberg, Morningstar Direct, as of 31 March 2019
CA muni ETFs continue to see more inflows than NY muni ETFs
Note: Flow data does not include ETFs that have been liquidated.Source: UBS, Bloomberg, Morningstar Direct, as of 31 March 2019
Figure 3
In USD mn
300
350
250
200
150
100
50
0
400
2014 2015 2017 2018 1Q192016
California New York
8 APRIL 2019 Municipal Market Guide
SPOTLIGHT
On the First Circuit
The corporate bankruptcy bar announced its arrival on the doorstep of the municipal market on 13 July 2013. On that date, Detroit sought protection from creditors by filing for bankruptcy. The Motor City’s subsequent decision to adopt an adversarial negotiating posture with its creditors was re-warded when the bankruptcy court granted Detroit’s emer-gency manager broad latitude to demand concessions from bondholders.
The resulting plan of adjustment, which granted higher recoveries to pensioners than to capital market creditors, demonstrated that municipal debtors operating in Chapter 9 exercise more control over their destiny than do their cor-porate counterparts. In the intervening years, we have borne witness to municipal investors’ dwindling confidence in the strength of their negotiating position vis-à-vis distressed debtors. A recent decision by the US Court of Appeals for the First Circuit is likely to amplify those concerns among traditional municipal bondholders.
Special revenue protections disputedThe Puerto Rico Oversight, Management, and Economic Sta-bility Act (PROMESA) was enacted by Congress in June 2016 in response to the territory’s escalating fiscal crisis. Among its provisions, PROMESA authorized the creation of a Finan-cial Oversight and Management Board for Puerto Rico (the “Oversight Board” or the “Board”) to preside over the is-land’s finances and its restructuring negotiations with credi-tors. The law also allows Puerto Rico’s government debtors to seek bankruptcy protection. One of PROMESA’s key provi-sions, Title III, is based upon the language of Chapter 9 of the US Bankruptcy Code.
Less than a year after PROMESA’s enactment, in May 2017, the Commonwealth government and many of its operating agencies commenced insolvency proceedings under Title III. The Puerto Rico Highway and Transportation Authority (the “Authority” or “HTA”) sought court protection and in-structed its bond trustee to cease making monthly payments towards debt service from reserve accounts. The Authority contended that making any further payments would consti-tute an act by bondholders to exercise control over its prop-erty in violation of the automatic stay provisions of the US Bankruptcy Code.1
Not surprisingly, the Highway and Transportation Authority’s bondholders objected. They initiated adversary proceedings in June against the Commonwealth, the Board, and the Au-thority (among others). In their complaint to the US District Court, the creditors claimed that any failure to remit cash
from the reserve account violated the provisions of Chapter 9. They also asserted that money held in the reserve account was placed in trust for bondholders and therefore was sub-ject to an enforceable lien in their favor.2
The Board and HTA moved to dismiss the creditors’ com-plaint. After holding a hearing on the merits, the US Dis-trict Court agreed with the Oversight Board and HTA and granted the debtors’ motion to dismiss the case. The District Court decision surprised many market participants, as it con-tradicted other judicial decisions and ignored the legislative intent of the 1988 amendments to the US Bankruptcy Code. The creditors appealed the lower court decision to the First Circuit in Boston, which handles appeals from Puerto Rico.
A critical decisionOn 26 March, the First Circuit Court of Appeals affirmed the District Court’s decision and dismissed the creditors’ appeal. In doing so, the appellate court rejected arguments that the Jefferson County (AL) bankruptcy should serve as a precedent for the proceedings in Puerto Rico. In its opinion, the court decided that “Jefferson County did not address whether the debtor’s payments were voluntary or mandatory.”3 This was a surprising conclusion, to say the least, as the Jefferson Coun-ty court explicitly excluded pledged special revenues from the automatic stay, and cited legislative intent in doing so.4
The Court of Appeals concluded that an examination of leg-islative intent was unnecessary because the unambiguous language in the Code made that type of analysis superflu-ous. Writing on behalf of a unanimous court, Judge Juan Torruella instructed the creditors that “Section 928 does not mandate the turnover of special revenues or require conti-nuity of payments of the (HTA) Bonds during the pendency of the Title III proceeding.”5 In effect, the court granted the Commonwealth of Puerto Rico and its agencies broad discre-tion to decide whether enterprise revenue explicitly pledged to bondholders will be paid during the course of its bank-ruptcy proceedings.
ConsequencesIn the wake of the court’s ruling, the rating agencies are like-ly to reexamine their existing criteria to determine whether a utility revenue bond rating may exceed the rating on cor-responding general obligations from the same municipality. Fitch has already announced that the court decision may re-sult in lower ratings for bonds in the utility, transportation, and special tax sectors.6 Kroll Bond Rating Agency has sug-gested that the immediate impact of the court decision is likely to be restrained, but over the longer term enterprise
Municipal Market Guide APRIL 2019 9
SPOTLIGHT On the First Circuit
revenue bond quality will suffer. We expect the rating agen-cies to see a closer nexus between general obligation (GO) bonds and the revenue bonds of the same issuer. Moody’s has adopted this approach more frequently than has its com-petitors.
The Oversight Board now has more leverage in its negotia-tions with creditors. Bondholders may appeal the appellate court decision but, the likelihood of success is low, in our view. In the meantime, the Oversight Board and the Com-monwealth itself are likely to maintain an aggressive negoti-ating stance to extract concessions from investors.
ConclusionIn the course of the last decade, we have witnessed an uptick in the number of distressed public sector borrowers adopt-ing a more adversarial posture with creditors. The tactics honed in corporate bankruptcies will be introduced more often whenever municipal borrowers begin to falter under the weight of a serious debt burden or encounter a liquidity crisis.
By and large, investors have taken this disquieting trend in stride. The US will soon set a record for the longest period of economic expansion in its history. The frequency with which municipalities file for bankruptcy remains relatively low. A decade-long rally in equities has diminished concerns over the ability of state and local governments to increase their employer contributions while simultaneously satisfying de-mands for public services.
And yet, to paraphrase the late economist Herbert Stein, what cannot go on forever must surely stop. It is only then that the Court of Appeals decision will have an immediate and adverse impact on the municipal bond market. Barring a reversal on appeal, municipal bond investors are obliged to accept the idea that the debtors in a Chapter 9 (or Title III) proceeding have a disproportionate amount of influence. They will be more likely to adopt a combative approach and to interfere with the transmittal of pledged revenue as a means of extracting bondholder concessions.
For institutional investors, this has raised the stakes of invest-ing in high-yield securities and placed a premium on credit surveillance. For private clients, particularly those building laddered portfolios, the temptation to engage in speculative purchases to enhance yield just became more challenging. Rating volatility among investment grade credits is also likely to increase in the wake of this decision.
More legal maneuveringThe Commonwealth of Puerto Rico has not provided investors with a comprehensive annual financial report for the past three fiscal years. In the absence of reliable financial statements, traditional municipal credit analysis has given way to scrutiny of legal proceedings now underway in a variety of venues. In prior reports, we have argued that bondholder recoveries will be predicated on the outcome of litigation, which has few precedents.
Despite their periodic disputes over expenditure priorities, the Rosselló Administration and the Oversight Board both have adopted a similar approach in negotiations with island creditors. We believe the decision by the First Circuit will encourage the island’s debtors to pursue more aggressive legal tactics in court. Two recent actions exemplify this disturbing trend.
First, the Oversight Board (via its Special Claims Committee and the Official Committee of Unsecured Creditors) filed an objection to the validity and enforceability of two series of general obligation (GO) bonds.7 The plaintiffs argue that the sale of the Series 2012 and Series 2014 GO bonds violated the territory’s constitutional debt limit. The claim of invalidity is asserted despite the fact that the Commonwealth made representations to the contrary at the time of sale.
Second, the Oversight Board has filed a motion with the court that it is prepared to file hundreds of complaints against bondholders who purchased the bonds whose validity is now being challenged. The Oversight Board and the Unsecured Creditors Committee believe they have legal grounds to recover and claw back payments made on the challenged bonds.
In adopting the adversarial posture, the Oversight Board may just be seeking greater concessions from creditors. In doing so, however, Puerto Rico is undermining the implicit trust that individual investors place in the municipal bond market.
10 APRIL 2019 Municipal Market Guide
California
Beginning 1 April, all out-of-state retailers must begin collect-ing sales tax to products being shipped to California. Despite a retailer not having a physical presence in the state, any online retailer that has more than 200 transactions or more than USD 100,000 in sales per year must collect sales tax. The state has estimated the new law to generate USD 544 million in the first fiscal year.
The Federal Emergency management Agency (FEMA) denied the California Department of Water Resources request for USD 306 million in reimbursements for costs related to the repairs of the upper portion of the Oroville Dam. FEMA’s policy restricts reimbursable payments to damages incurred as a result of a declared disaster, such as the one declared at the dam in 2017. The Agency’s independent forensic report released in January 2018 identified that there were several reasons for the spillways failure but that only lower portions of the project were eligible for reimbursement. According to FEMA, the upper sections of the structure had pre-existing flaws prior to 2017. Notably, the Oroville Dam’s main flood-control spillway re-opened on 2 April since its closure in 2017.
ConnecticutThe state’s outlook received a boost from stable to positive on 19 March, when S&P affirmed its general obligation, ap-propriation and moral obligation ratings of A, A- and BBB, re-spectively. The outlook revision came ahead of the state’s USD 1 billion transaction, which sold on 25 March. The agency also revised the outlook on the state’s special tax obligation trans-portation fund to positive and affirmed its A+ rating which is capped at one notch above the state’s general obligation rating. The revision was driven by increases in the state’s re-serves, which the agency cites as strong.
Moody’s upgraded the city of Hartford’s issuer rating from B2 to B1 and revised its outlook from stable to positive on 19 March. Notably, the rating is equivalent to the city’s general obligation rating but does not apply to the city’s outstanding debt, which the state of Connecticut has committed to pay. Moody’s attributes the ratings boost to improved finances and the strong oversight provided by the state’s Municipal Ac-countability Review Board (MARB). Moody’s rates the city’s outstanding indebtedness A2, one notch lower than the state to reflect the possible risk of payment interruption or reduc-tion.
GeorgiaThe federal government announced on 22 March that it will provide the Municipal Electric Authority of Georgia (MEAG) USD 3.7 billion in loan guarantees to complete the Vogtle nuclear power plant expansion. The project overrun costs and timeline have grown rapidly. The project is USD 14bn over budget and five years behind schedule. The De-partment of Energy’s announcement comes after the Federal Energy Regulatory Commission (FERC) denied JEA’s attempt to discontinue financial support of the project.
Atlanta mayor Keisha Bottoms is seeking to establish an in-dependent Department of Transportation to assume the func-tions been previously carried out by several departments in-cluding the Department of Public Works and the Department of City Planning. Mayor Bottoms believes that the restructur-ing will streamline funding and project delivery. The proposal requires city council approval, which is expected to begin de-liberations on 22 April.
IllinoisVoters in the Village of South Chicago Heights and the Vil-lage of Willowbrook approved home rule status on 2 April. Home rule status allows local governments to raise revenues without seeking voter approval each time it wants to increase its taxes. Municipalities with a population over 25,000 are designated with such status while others must seek voter ap-proval in order to receive such designation. Having home rule status allows issuers greater financial flexibility as expenditures rise which currently includes an estimated 15 percent of the state’s local governments.
Chicago voters elected Lori Lightfoot in a landslide election. Lightfoot garnered 74 percent of the vote against contender Toni Preckwinkle. The mayor-elect is a former federal prosecu-tor and has been active in Chicago’s legal and government sectors but has never held an elective office. Former Mayor Emmanuel appointed Lightfoot as co-chair of the Chicago Po-lice Accountability Task Force in 2016 and as president of the Chicago police board in 2015. Lightfoot will be sworn in as the city’s 56th mayor on 20 May.
New Jersey
Governor Phil Murphy signed the Clean Stormwater and Flood Reduction Act into law on 18 March allowing local
In the news 11 March 2019 – 8 April 2019
Municipal Market Guide APRIL 2019 11
governments to create stormwater utilities to help improve infrastructure. Municipalities, counties and certain other en-tities are now authorized to issue debt which may be payable from fees and charges as a dedicated revenue stream. The new law is intended to help certain issuers who encounter flooding and combined sewer systems overflows, damaging properties and discharging untreated wastewater and storm-water.
New York
The state legislature passed a USD 175.5 billion spending bud-get on 1 April, which increased public education funding by USD 1 billion (to USD 27.9 billion) with more than USD 700 million diverted to lower income school districts. The budget also increased water infrastructure funding by USD 500 mil-lion. The state expects to reduce expenditures elsewhere by closing three prisons due to inmate population declines. Other budget highlights include congestion pricing for New York City and a permanent two-percent property tax cap. The bud-get also implements several voter initiatives, including compel-ling employers to provide three hours of paid time to cast a ballot and USD 10 million to help counties pay for the roll-out of advance voting programs.
The Metropolitan Transportation Authority is slated to receive congestion pricing revenue after the state ap-proved a plan to charge vehicles entering portions of mid to lower Manhattan. The Authority will benefit from the fees charged to vehicles and support an estimated USD 15 billion in financing to fund the system’s significant infra-structure needs. Though the amount of the actual fee has not been announced, its existence will likely discourage mo-torists from driving into designated areas and stimulate rail and bus ridership. Both Moody’s and S&P have indicated that congestion pricing is a positive development for the MTA whose recent ratings of A1 and A by Moody’s and S&P were assigned negative outlooks.
Residents in both the Elizabethtown-Lewis Central School District (ELCS) and Westport Central School District (WCS) voted to merge in December 2018. Both school district’s finances, socioeconomic indicators and tax bases are very similar facing related challenges of increased costs resulting in recent program reductions. After conducting a consolidation study, the Districts found that the merged entity could reduce costs while expanding class offerings and increase its extracurricular programs. The effective date of the merger is 1 July 2019.
The Securities and Exchange Commission (SEC) has charged the College of New Rochelle’s (“CNR” or the “College”) former controller Keith Borge with defrauding municipal securities by misrepresenting the schools deteriorating finances. The US Attorney’s Office for the Southern District of New York also announced criminal charges against Borge claiming that he knowingly published falsified financial figures in addition to using endowment funds for operations, all of which, without communicating the College’s financial woes to its Board of Directors. Borge worked at the College for thirty-seven years within various financial roles. The College is expected to cease operations in August of 2019 and has entered into a Memorandum of Understanding to explore strategic options with Mercy College. Notably, the current agreement does not include Mercy College purchasing any of CNR’s assets or becoming responsible for assuming any of CNR’s liabilities, including its USD 45 million of indebtedness.
Pennsylvania
On 4 April, a federal judge in Pennsylvania dismissed a lawsuit filed in March 2018 by several trucking organizations against the Pennsylvania Turnpike Commission (PTC). The lawsuit claimed that excessive toll rates are placing an undue burden on interstate commerce while diverting revenue to other state transit projects unrelated to the Turnpike. US District Court Judge Yvette Kane rejected the plaintiffs’ assertions that the tolls constituted a barrier to interstate commerce given motorists have alternate routes for interstate travel. The trucking organizations have al-ready filed their intent to appeal to the 3rd US Circuit Court of Appeals. The lawsuit has brought significant attention to PTC’s escalating debt levels, which triggered eleven consecutive years of toll hikes. State Auditor General Eugene DePasquale released a report last month requesting state lawmakers to provide con-tinued relief for PTC and seek alternative revenue sources to fund infrastructure needs as continued toll increases are unsustainable.
VirginiaGovernor Ralph Northam signed a law increasing a regional gas tax to help fund highway improvements. The law increased the tax on each gallon of gas by 7 cents as well as boosting taxes on diesel and truck registrations. The taxes are expected to raise almost USD 300 million to fund improvements on I-81 and other interstates across the Commonwealth. Virginia was one of 43 states which introduced 231 transportation funding bills in the first quarter of 2019 with measures ultimately being approved in Alabama, Arkansas and Utah as of publication.
Historical events’ impact on muni-to-Treasury (m/T) yield ratio (1986 through present)
Source: MMD, UBS, as of 8 April 2019
Figure A8
AAA GO 30 yr – Treasury 30 yr
m/T ratio, in %
14 APRIL 2019 Municipal Market Guide
Apr-19Apr-18 Jun-18 Aug-18 Dec-18 Feb-19Oct-18
110
100
70
90
80
AAA muni-to-Treasury yield ratios
Source: MMD, UBS, as of 8 April 2019
Figure A9
10 yr
30 yr
In %
Apr-19Apr-18 Jul-18 Jan-19Oct-18
220
190
70
160
130
100
Industrial Corporate and BABs spreads
Source: ICE BofAML, UBS, as of 8 April 2019
Figure A11
U.S Industrial Corp 10+yr OAS
BABS Build America Bond Index OAS
Option adjusted spreads, in bps
Apr-19Apr-18 Jun-18 Aug-18 Dec-18 Feb-19Oct-18
90
85
65
80
75
70
A muni GO versus A Industrial Corp. yield ratio
Source: MMD, Bloomberg, UBS, as of 8 April 2019
Figure A10
10 year
30 year
In %
Apr-19Apr-17 Aug-17 Dec-17 Aug-18 Dec-18Apr-18
84
78
80
82
70
76
74
72
Tax-exempt to BABs yield ratio
Source: ICE BofAML, UBS, as of 8 April 2019
Figure A12
Tax-exempt Munis YTM to BABS YTM
In %
350
300
250
150
0
50
200
100
Apr-18Apr-17Apr-16Apr-15Apr-14 Apr-19
IL
NJ
PA
CT
CA
NY
TX
FL
10-year GO spreads for select states
Source: MMD, UBS, as of 8 April 2019
Figure A13
State spreads, in bps
Chartbook relative value
Municipal Market Guide APRIL 2019 15
Market view1 J.P.Morgan, Municipal Markets Weekly, 5 April 2019 2 Municipal Market Data (MMD) supplies muni yield curves from 1981
through present.
Portfolio themes1 Spreads are based on Municipal Market Data (MMD‘s) general market
curves as of 5 April 2019. 2 The 10-year cumulative default rate of investment grade munis and
global corporate bonds is 0.1% and 2.32% respectively. Moody‘s, US Municipal Bond Defaults and Recoveries, 1970–2017, 31 July 2018.
Spotlight1 King & Spaulding, First Circuit Finds Chapter 9 Special Revenue Provi-
sions Permit Voluntary Payment But Do Not require Them, 2 April 2019.2 United States Court of Appeals for the First Circuit, Nos. 18–1165 and
18–1166, 26 March 2019.3 United States Court of Appeals for the First Circuit, Nos. 18–1165 and
18–1166, 26 March 2019.4 James Spiotto, “The First Circuit Court of Appeals Ruling on ‘Assured‘
Should be Reheard or Reversed,“ Muninet Guide, 3 April 2019. In Jef-ferson County, the court stated that “11 USC Section 922(d) excludes continued payment of these pledged revenues to the lienholder form being stayed under 11 USC Section 362(a) or 11 USC Section 922(s).“
5 United States Court of Appeals for the First Circuit, Nos. 18–1165 and 18–1166, 26 March 2019.
6 Fitch Ratings, “Appeals Court Ruling on Special Revenues Could Affect Municipal Debt“, 2019.
7 James Spiotto, Puerto Rico’s Repudiation of General Obligation Bonds: A Real Risk or Just Kabuki Theater, MuniNet Guide, 5 February 2019.
Endnotes
16 APRIL 2019 Municipal Market Guide
Required disclosures
UBS Closed-End Funds Ratings and Definitions
UBS Financial Services Rating Definition and criteria
Buy Higher stability of principal and higher stability of distribution
Hold Potential loss of principal, lower degree of distribution stability
Sell High potential for loss of principal and distribution risk
Municipal bonds: Although historical default rates are very low, all munici-pal bonds carry credit risk, with the degree of risk largely following the par-ticular bond‘s sector. Additionally, all municipal bonds feature valuation, return, and liquidity risk. Valuation tends to follow internal and external factors, including the level of interest rates, bond ratings, supply factors, and media reporting. These can be difficult or impossible to project accu-rately. Also, most municipal bonds are callable and/or subject to earlier than expected redemption, which can reduce an investor’s total return. Because of the large number of municipal issuers and credit structures, not all bonds can be easily or quickly sold on the open market.
Closed-end fundsInvestment Risk: Performance results reflect past performance and is no assurance that a fund will meet its investment objective. Market Risk: The market value, net asset value (NAV) and distribution rate of a fund’s shares will fluctuate with market conditions. Leverage Risk: Each fund’s use of leverage (borrowing to increase invest-ments) creates the possibility of higher volatility and greater risk for the fund’s per share NAV, market price, distributions and returns. Credit Risk: Refers to the possibility that the issuer of the bond will not be able to make principal and interest payments (default).
Statement of risk
Each research analyst primarily responsible for the content of this research report, in whole or in part, certifies that with respect to each security or issuer that the analyst covered in this report: (1) all of the views expressed accurately reflect his or her personal views about those securities or issu-
Prepayment Risk: Issuers may exercise their option to prepay principal ear-lier than scheduled, forcing the fund to reinvest in lower-yielding securities.Interest Rate Risk: Fixed-income securities will decline in value if market interest rates rise. Reinvestment Risk: If market interest rates decline, income earned from the fund’s portfolio may be reinvested at rates below that of the original bond that generated the income. Liquidity Risk: This is the risk that the fund may not be able to sell securi-ties in its portfolio at the time or price desired by the Fund. Below Investment Grade Risk: Investments rated below investment grade (typically referred to as “junk”) are generally subject to greater price volatil-ity and illiquidity than higher rated investments. Management risk: The risk that investment management decisions may not produce the desired results.
Analyst certificationers; and (2) no part of his or her compensation was, is, or will be, directly or indirectly, related to the specific recommendations or views expressed by that research analyst in the research report.
UBS does and seeks to do business with issuers covered in its research reports. As a result, investors should be aware that the firm may have a con-flict of interest that could affect the objectivity of UBS research reports.
For a complete set of required disclosures relating to the companies that are the subject of this report, please mail a request to UBS CIO Wealth Man-agement Research Business Management, 1285 Avenue of the Americas, 20th Floor, Avenue of the Americas, New York, NY 10019.
Municipal Market Guide APRIL 2019 17
Required disclosures
Agency credit ratings
S&P Moody’s Fitch/IBCA Definitions
Investment grade
AAA Aaa AAA Issuers have exceptionally strong credit quality. AAA is the best credit quality.
AA+ Aa1 AA+AA Aa2 AA Issuers have very strong credit quality.AA- Aa3 AA-
A+ A1 A+A A2 A Issuers have high credit quality.A- A3 A-
BBB+ Baa1 BBB+BBB Baa2 BBB Issuers have adequate credit quality, This is the lowest Investment Grade category.BBB- Baa3 BBB-
Non-investment grade
BB+ Ba1 BB+BB Ba2 BB Issuers have weak credit quality. This is the highest Speculative Grade category.BB- Ba3 BB-
B+ B1 B+B B2 B Issuers have very weak credit quality.B- B3 B-
CC Ca CC+CC Issuers have very high risk of default.CC-
D C DDD Obligor failed to make payment on one or more of its financial commitments. This is the lowest quality of the Speculative Grade category.
For purposes of this report, ETFs include index-linked funds regulated under the Investment Company Act of 1940 that trade on US securities exchanges under exemptive relief from the Securities and Exchange Commission. The shares of all of the ETF issuers discussed in this Report are listed on U.S. securities exchanges. The ETFs are either open-end, registered investment companies (including UITs) operating under an exemptive order from the SEC, or collective investment vehicles, formed as grantor trusts, limited partnerships or similar structures that offer pass-through tax treatment to investors. The different structures provide different rights for investors. For example, ETFs registered under the Investment Company Act of 1940 must stand ready at all times to redeem shares (albeit only in creation unit size) whereas those ETFs that are not subject to registration under the Investment Company Act of 1940 may suspend redemptions at any time. We refer to ETFs registered with the SEC under the Investment Company Act of 1940 as “40 Act ETFs” and to non-registered ETFs as “33 Act ETFs.” All of the ETFs discussed in this Report track an index of financial instruments or pro-vide exposure to a single commodity type.
Exchange Traded Funds (ETFs) DisclosureUS-registered, open-ended index-linked funds are redeemable only in Cre-ation Unit size aggregations through an Authorized Participant, and may not be individually redeemed. Many ETFs are redeemable only on an “in-kind” basis. The public trading price of a redeemable lot of ETFs may be different from their net asset value, and ETFs could trade at a premium or discount to the net asset value. UBS AG or its affiliates act as authorized participants for many of the ETFs discussed in this report. In addition, UBS is a regular issuer of traded financial instruments and privately issued financial products that may be linked to the ETFs mentioned in this Report. UBS regularly trades in ETFs. Through these and other activities, UBS may engage in transac-tions involving ETFs that are inconsistent with the strategies in this report.
ETFs are subject to the same risks as the underlying securities and commis-sions may be charged on every trade, if applicable. This definition does not imply that ETFs are endorsed by the Securities and Exchange Commission. ETFs are sold by prospectus, which contains details about ETFs, including investment objectives, risks, charges and expenses. Clients should read the prospectus and consider this information carefully before investing. Clients may obtain more information about ETFs, including copies of prospectuses or summary, from their UBS FS financial advisor.
18 APRIL 2019 Municipal Market Guide
DisclaimerUBS Chief Investment Office‘s ("CIO") investment views are prepared and published by the Global Wealth Management business of UBS Switzerland AG (regulated by FINMA in Switzerland) or its affiliates ("UBS").
The investment views have been prepared in accordance with legal require-ments designed to promote the independence of investment research.
Instrument/issuer-specific investment research – Risk information: This publication is for your information only and is not intended as an offer, or a solicitation of an offer, to buy or sell any investment or other specific product. The analysis contained herein does not constitute a personal recommendation or take into account the particular investment objectives, investment strategies, financial situation and needs of any specific recipient. It is based on numerous assumptions. Different assumptions could result in materially different results. Certain services and products are subject to legal restrictions and cannot be offered worldwide on an unrestricted basis and/or may not be eligible for sale to all investors. All information and opinions expressed in this document were obtained from sources believed to be reliable and in good faith, but no repre-sentation or warranty, express or implied, is made as to its accuracy or com-pleteness (other than disclosures relating to UBS). All information and opinions as well as any forecasts, estimates and market prices indicated are current as of the date of this report, and are subject to change without notice. This publica-tion is not intended to be a complete statement or summary of the securities, markets or developments referred to in the report. Opinions expressed herein may differ or be contrary to those expressed by other business areas or divisions of UBS as a result of using different assumptions and/or criteria.
In no circumstances may this document or any of the information (including any forecast, value, index or other calculated amount ("Values")) be used for any of the following purposes (i) valuation or accounting purposes; (ii) to determine the amounts due or payable, the price or the value of any financial instrument or financial contract; or (iii) to measure the performance of any financial instrument including, without limitation, for the purpose of tracking the return or perfor-mance of any Value or of defining the asset allocation of portfolio or of comput-ing performance fees. By receiving this document and the information you will be deemed to represent and warrant to UBS that you will not use this document or otherwise rely on any of the information for any of the above purposes. UBS and any of its directors or employees may be entitled at any time to hold long or short positions in investment instruments referred to herein, carry out transac-tions involving relevant investment instruments in the capacity of principal or agent, or provide any other services or have officers, who serve as directors, either to/for the issuer, the investment instrument itself or to/for any company commercially or financially affiliated to such issuers. At any time, investment decisions (including whether to buy, sell or hold securities) made by UBS and its employees may differ from or be contrary to the opinions expressed in UBS research publications. Some investments may not be readily realizable since the market in the securities is illiquid and therefore valuing the investment and iden-tifying the risk to which you are exposed may be difficult to quantify. UBS relies on information barriers to control the flow of information contained in one or more areas within UBS, into other areas, units, divisions or affiliates of UBS. Futures and options trading is not suitable for every investor as there is a sub-stantial risk of loss, and losses in excess of an initial investment may occur. Past performance of an investment is no guarantee for its future performance. Addi-tional information will be made available upon request. Some investments may be subject to sudden and large falls in value and on realization you may receive back less than you invested or may be required to pay more. Changes in foreign exchange rates may have an adverse effect on the price, value or income of an investment. The analyst(s) responsible for the preparation of this report may interact with trading desk personnel, sales personnel and other constituencies for the purpose of gathering, synthesizing and interpreting market information.
Research publications from CIO are written by UBS Global Wealth Manage-ment. UBS Investment Research is written by UBS Investment Bank. Except for economic forecasts, the research process of CIO is independent of UBS Investment Research. As a consequence research methodologies applied and assumptions made by CIO and UBS Investment Research may differ, for example, in terms of investment horizon, model assumptions, and valuation methods. Therefore investment recommendations indepen-dently provided by the two UBS research organizations can be different.
The compensation of the analyst(s) who prepared this report is determined exclusively by research management and senior management (not including investment banking). Analyst compensation is not based on investment bank-ing, sales and trading or principal trading revenues, however, compensation may relate to the revenues of UBS as a whole, of which investment banking, sales and trading and principal trading are a part.Tax treatment depends on the individual circumstances and may be subject to change in the future. UBS does not provide legal or tax advice and makes no representations as to the tax treat-ment of assets or the investment returns thereon both in general or with refer-ence to specific client‘s circumstances and needs. We are of necessity unable to take into account the particular investment objectives, financial situation and needs of our individual clients and we would recommend that you take financial and/or tax advice as to the implications (including tax) of investing in any of the products mentioned herein.This material may not be reproduced or copies cir-culated without prior authority of UBS. Unless otherwise agreed in writing UBS expressly prohibits the distribution and transfer of this material to third parties for any reason. UBS accepts no liability whatsoever for any claims or lawsuits from any third parties arising from the use or distribution of this material. This report is for distribution only under such circumstances as may be permitted by applicable law. For information on the ways in which CIO manages conflicts and maintains independence of its investment views and publication offering, and research and rating methodologies, please visit www.ubs.com/research.
Additional information on the relevant authors of this publication and other CIO publication(s) referenced in this report; and copies of any past reports on this topic; are available upon request from your client advisor.
Important Information About Sustainable Investing Strategies: Incorpo-rating environmental, social and governance (ESG) factors or Sustainable Investing considerations may inhibit the portfolio manager’s ability to partici-pate in certain investment opportunities that otherwise would be consistent with its investment objective and other principal investment strategies. The returns on a portfolio consisting primarily of ESG or sustainable investments may be lower than a portfolio where such factors are not considered by the portfolio manager. Because sustainability criteria can exclude some invest-ments, investors may not be able to take advantage of the same opportunities or market trends as investors that do not use such criteria. Companies may not necessarily meet high performance standards on all aspects of ESG or sustain-able investing issues; there is also no guarantee that any company will meet expectations in connection with corporate responsibility, sustainability, and/or impact performance.Distributed to US persons by UBS Financial Services Inc. or UBS Securities LLC, subsidiaries of UBS AG. UBS Switzerland AG, UBS Europe SE, UBS Bank, S.A., UBS Brasil Administradora de Valores Mobiliarios Ltda, UBS Asesores Mexico, S.A. de C.V., UBS Securities Japan Co., Ltd, UBS Wealth Man-agement Israel Ltd and UBS Menkul Degerler AS are affiliates of UBS AG. UBS Financial Services Incorporated of Puerto Rico is a subsidiary of UBS Financial Services Inc. UBS Financial Services Inc. accepts responsibility for the content of a report prepared by a non-US affiliate when it distributes reports to US per-sons. All transactions by a US person in the securities mentioned in this report should be effected through a US-registered broker dealer affiliated with UBS, and not through a non-US affiliate. The contents of this report have not been and will not be approved by any securities or investment authority in the United States or elsewhere. UBS Financial Services Inc. is not acting as a municipal advisor to any municipal entity or obligated person within the meaning of Sec-tion 15B of the Securities Exchange Act (the "Municipal Advisor Rule") and the opinions or views contained herein are not intended to be, and do not consti-tute, advice within the meaning of the Municipal Advisor Rule.
External Asset Managers / External Financial Consultants: In case this research or publication is provided to an External Asset Manager or an Exter-nal Financial Consultant, UBS expressly prohibits that it is redistributed by the External Asset Manager or the External Financial Consultant and is made available to their clients and/or third parties.