Page 1
Municipal Solid Waste Treatment Concept
for West-Zone Bangalore, India
by order of
Mr. Kiron Shah, Chairman
Electronics City Industrial Township Authority (ELCITA)
Bangalore 560 100, INDIA
prepared by
associated partners
Hannover, February 2016
Municipal Solid Waste Treatment Concept for West-Zone Bangalore, India
Page 2
Project Director & Chief Editor
PD Dr.-Ing. habil. Dirk Weichgrebe
Division Head,
Division of Waste Management, Mass Flow Analysis and Anaerobic Technologies
Institute of Sanitary Engineering and Waste Management (ISAH)
Leibniz University Hanover
Welfengarten 1, 30167 Hannover, Germany
Chief Editor
Dr.-Ing. Dipl.-Geogr. Matthias Kuehle-Weidemeier
Chief Executive Officer
Wasteconsult International
Gartenstr. 4, 30851 Langenhagen, Germany
Associate Editors
Moni Mohan Mondal
Vishwas Vidyaranya
Christopher Speier
Institute of Sanitary Engineering and Waste Management
(ISAH)
Leibniz University Hanover
Welfengarten 1, 30167 Hannover, Germany
Dr. Ketel Ketelsen
Dr. Karsten Kanning
iba GmbH
Friesenstraße 14
30161 Hannover
Study Period: June 2015 – January 2016
Report Publication: February 2016
Hannover, February 2016
Page 3
Acknowledgements
This study would not have been possible without the help and involvement of the people to
whom we wish to express our sincere gratitude:
First and foremost to the team from The Forward Foundation and ELCITA who performed
the waste characterization study and further data collection on ground in Bangalore
and also contributed with their experience and knowledge to this report.
Grateful to the Mayor, Commissioner, officials and all the workers of BBMP who helped
in conducting this study successfully.
Page 4
II
Table of contents
1 Project description ............................................................................................................................................... 9
2 Input waste quantity and characteristics ........................................................................................................ 10
2.1 Methodology ........................................................................................................................................................................ 10
2.2 Waste composition ............................................................................................................................................................. 10
2.3 Detailed chemical composition ....................................................................................................................................... 12
2.4 Comparison of Carbon, oDM and TOC contents (for D2D) ...................................................................................... 13
2.5 Respiration Activity (RA4 / AT4) ..................................................................................................................................... 14
2.6 Gross calorific value ........................................................................................................................................................... 14
3 Selection of general waste treatment type ..................................................................................................... 15
3.1 Overview ................................................................................................................................................................................ 15
3.2 Waste incineration ............................................................................................................................................................. 15
3.3 Mechanical-biological treatment (MBT) ...................................................................................................................... 15
3.4 Bioreactor landfill ............................................................................................................................................................... 17
3.5 Conclusion ............................................................................................................................................................................. 18
4 Description of Mechanical-Biological waste Treatment processes (MBT) .................................................... 19
4.1 Types of mechanical-biological waste treatment...................................................................................................... 19
4.2 Main material flows ........................................................................................................................................................... 24
4.2.1 Input materials .......................................................................................................................................................... 24
4.2.2 MBT output ................................................................................................................................................................ 24
5 Evaluation / pros and cons of the process types............................................................................................. 27
5.1 Aerobic MBT prior to landfill for the production of compost like output .......................................................... 27
5.2 MBTs with anaerobic digestion ....................................................................................................................................... 27
5.3 Aerobic MBT (or MBS) with biological drying (BD) ................................................................................................... 27
5.4 Mechanical-physical stabilization (MPS) ..................................................................................................................... 27
5.5 Pre-decision .......................................................................................................................................................................... 27
6 General description of process steps and machinery in aerobic MBT / MBS plants .................................... 29
6.1 Manual sorting and removal of impurities .................................................................................................................. 29
6.2 Mechanical treatment ....................................................................................................................................................... 29
6.2.1 Functions of mechanical treatment .................................................................................................................... 29
6.2.2 Shredding and homogenisation ........................................................................................................................... 29
6.2.3 Separation of coarse and fine fractions ............................................................................................................ 30
6.2.4 Separating FE and NF metals ................................................................................................................................ 30
6.2.5 Processing the high-calorific fraction ................................................................................................................ 30
6.2.6 Ejection of impurities and recyclables using sensors ..................................................................................... 30
Page 5
III
6.3 Biological treatment (aerobic) ........................................................................................................................................ 30
6.3.1 Intensive decomposition (degradation).............................................................................................................. 30
6.3.2 Maturation ................................................................................................................................................................. 31
6.3.3 Shape and encapsulation of composting windrows ....................................................................................... 31
6.4 Wastewater treatment ...................................................................................................................................................... 32
6.5 Waste gas (exhaust air) treatment ................................................................................................................................ 32
6.5.1 Machinery ................................................................................................................................................................... 32
6.5.2 Wet and acidic scrubber ......................................................................................................................................... 32
6.5.3 Biofilter ....................................................................................................................................................................... 32
6.5.4 Regenerative thermal oxidisers ............................................................................................................................ 33
6.5.5 Waste gas combustion ............................................................................................................................................ 34
7 Local conditions in Bangalore........................................................................................................................... 35
7.1 Size and location ................................................................................................................................................................. 35
7.2 Climate ................................................................................................................................................................................... 35
7.3 Geology, sub soil.................................................................................................................................................................. 35
7.4 Infrastructure and transport ............................................................................................................................................ 35
7.5 Technical standards for the project ............................................................................................................................... 36
8 Process selection and dimensioning of the waste treatment plant ............................................................... 37
8.1 Chosen concept ................................................................................................................................................................... 37
8.2 Waste Collection Development and Impact on the modular development of the MBT ................................. 37
8.3 Level of Automation ........................................................................................................................................................... 38
8.4 Bio-drying Process .............................................................................................................................................................. 38
8.5 Composting (rotting) process .......................................................................................................................................... 41
8.6 Construction of the aerobic biological treatment ..................................................................................................... 43
8.6.1 Process options ......................................................................................................................................................... 43
8.6.2 Tunnel processing ..................................................................................................................................................... 43
8.6.3 Membrane covered processing ............................................................................................................................. 44
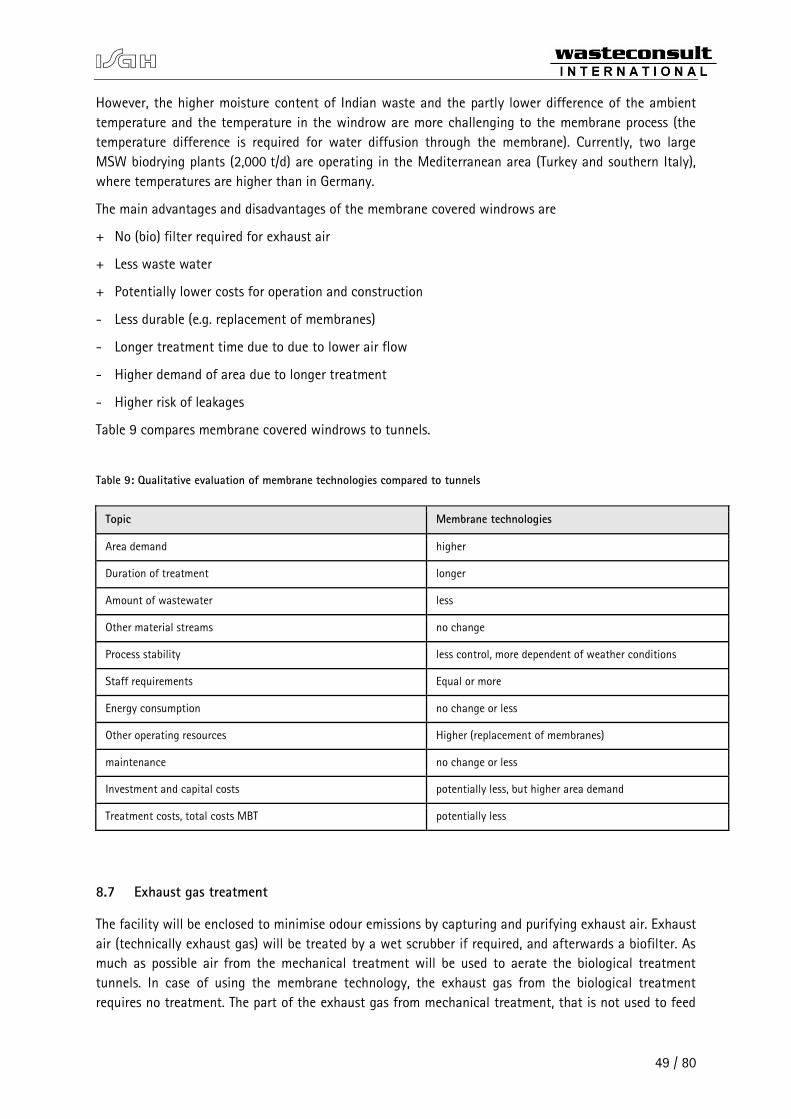
8.7 Exhaust gas treatment ...................................................................................................................................................... 49
8.8 Waste water treatment, water balance ........................................................................................................................ 50
8.9 Plant dimensions ................................................................................................................................................................. 50
8.10 Mass balance and properties of the output fractions .............................................................................................. 50
8.10.1 Operation mode .............................................................................................................................................................. 50
8.10.2 Moisture in Bangalore waste ................................................................................................................................ 50
8.10.3 Calorific value in Bangalore waste...................................................................................................................... 51
8.10.4 Size distribution of Bangalore waste .................................................................................................................. 51
8.10.5 Mass balance and output qualities ..................................................................................................................... 52
Page 6
IV
8.10.6 Energy balance .......................................................................................................................................................... 56
8.10.7 Biological treatment and wastewater ................................................................................................................ 57
8.10.8 Exhaust air.................................................................................................................................................................. 58
8.11 Area and infrastructural demand ................................................................................................................................... 60
8.11.1 Area demand .............................................................................................................................................................. 60
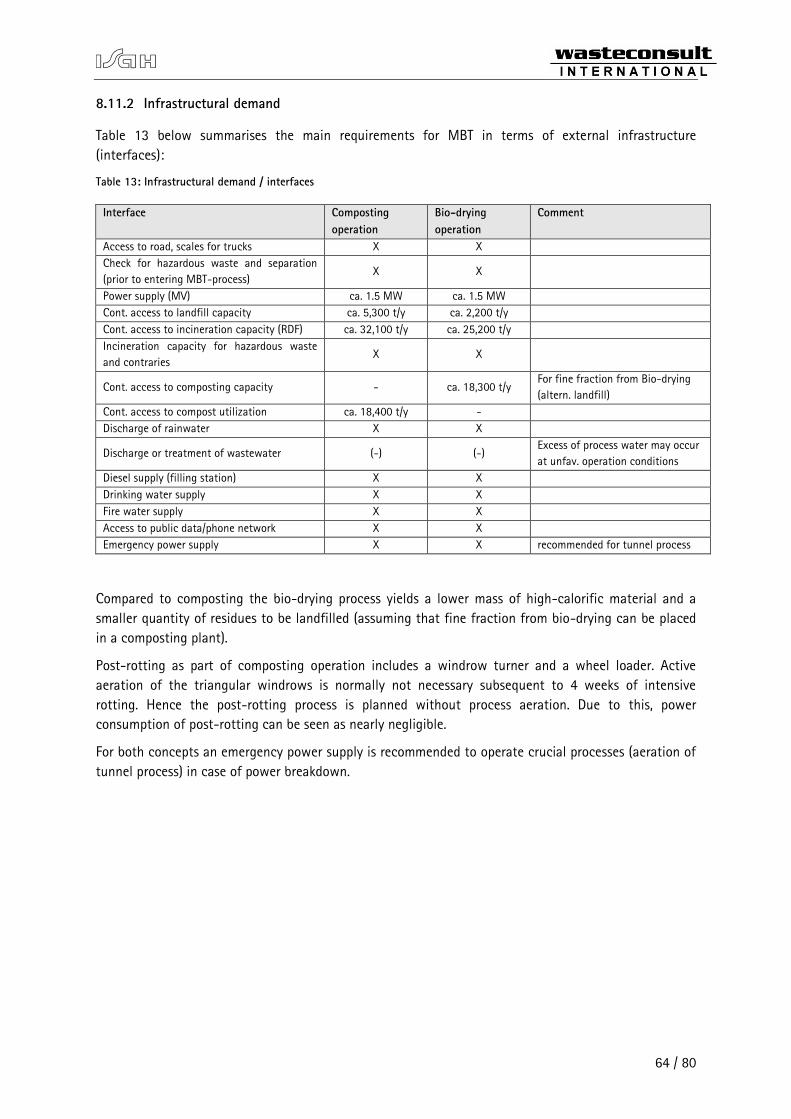
8.11.2 Infrastructural demand ........................................................................................................................................... 64
8.12 Machine equipment ........................................................................................................................................................... 65
8.13 Costs ....................................................................................................................................................................................... 66
8.13.1 Estimation of investment costs ............................................................................................................................ 66
8.13.2 Investment costs ....................................................................................................................................................... 67
8.13.3 Investment costs of membrane technique ........................................................................................................ 68
8.13.4 Staff and operation resources .............................................................................................................................. 69
9 Health and safety ............................................................................................................................................... 71
9.1 Introduction .......................................................................................................................................................................... 71
9.2 Risk Assessment ................................................................................................................................................................... 71
9.3 Prevention measures .......................................................................................................................................................... 71
9.3.1 Measures in the facilities ....................................................................................................................................... 71
9.3.2 Personal Protective Equipment (PPE) ................................................................................................................. 73
9.3.3 Information, instruction and training ................................................................................................................ 74
9.3.4 Protection against external risks ......................................................................................................................... 74
9.4 Safety in the facility ........................................................................................................................................................... 75
9.4.1 Instrumentation and control (I&C) protection measures ............................................................................. 75
9.4.2 Emergency stop system .......................................................................................................................................... 75
9.4.3 Emergency power supply........................................................................................................................................ 75
9.4.4 Other measures ......................................................................................................................................................... 75
9.5 Explosion protection .......................................................................................................................................................... 75
9.6 Fire protection ...................................................................................................................................................................... 76
9.7 Electrical grounding and lightning protection ........................................................................................................... 76
9.8 Handling of corrosive substances ................................................................................................................................... 76
10 Bibliography ....................................................................................................................................................... 78
Page 7
V
List of Figures
Figure 1: Overall MSW composition for West Zone, Bangalore City ......................................................................................... 10
Figure 2: Basic approach of MBT ......................................................................................................................................................... 16
Figure 3: Bailed secondary fuel from MBT ........................................................................................................................................ 17
Figure 4: Reception, intermediate storage and feeding the shredder ....................................................................................... 20
Figure 5: Inside trommel screen ........................................................................................................................................................... 20
Figure 6: Outside encapsulated trommel screen ............................................................................................................................. 21
Figure 7: Metal separation ..................................................................................................................................................................... 21
Figure 8: Tunnel hall with tunnel doors on the left side............................................................................................................... 22
Figure 9: Optical sorting from two suppliers .................................................................................................................................... 22
Figure 10: Simplified process chart of MBTs with a major landfill (or compost like) fraction .......................................... 23
Figure 11: Simplified process chart of biological and physical drying plants ......................................................................... 24
Figure 12: Mass flow of the total of Germany’s MBT plants (various technologies) ............................................................ 25
Figure 13: Share of the various fraction of the total solid output of the total of German MBTs from different
technologies ........................................................................................................................................................................................ 26
Figure 14: Biofilter ................................................................................................................................................................................... 33
Figure 15: RTO and acid scrubber (black in the image centre) ................................................................................................... 34
Figure 16: Process diagram for Bio-drying operation .................................................................................................................... 40
Figure 17: Process diagram for Composting operation ................................................................................................................. 42
Figure 18: Composting tunnels with open doors ............................................................................................................................ 44
Figure 19: Membrane tunnel system supplied by BioE ................................................................................................................. 44
Figure 20: Membrane cover system supplied by Convaero .......................................................................................................... 45
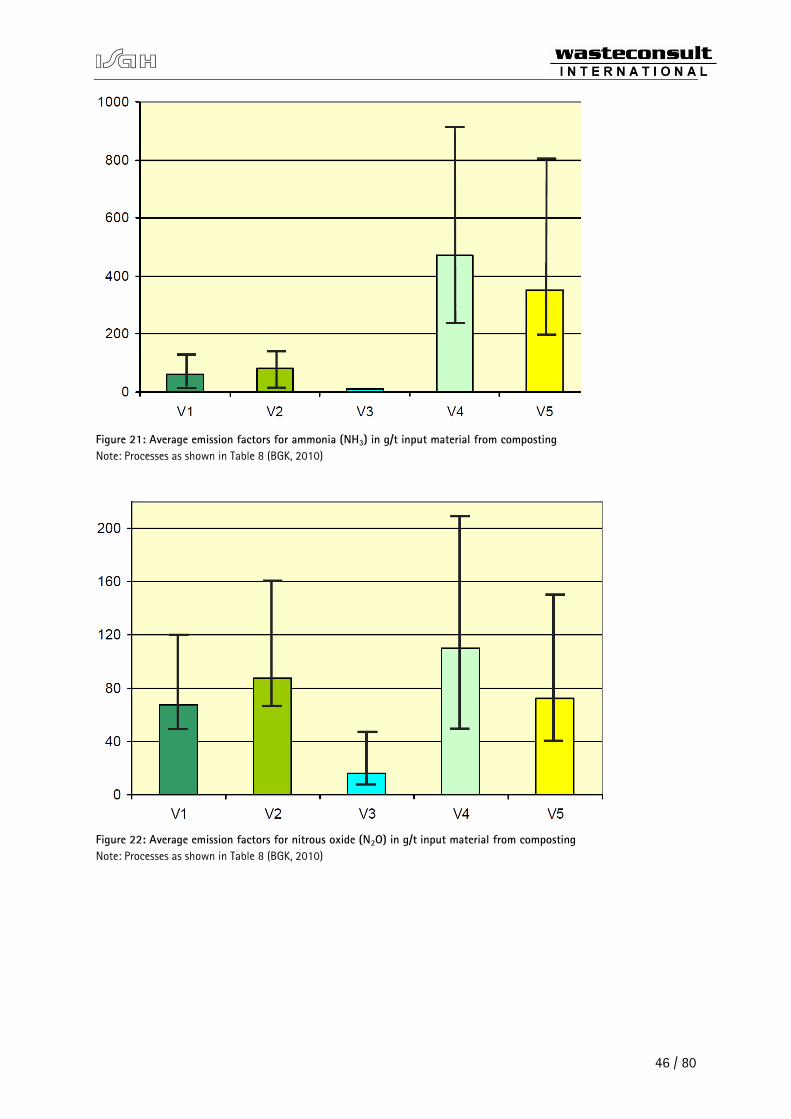
Figure 21: Average emission factors for ammonia (NH3) in g/t input material from composting ................................... 46
Figure 22: Average emission factors for nitrous oxide (N2O) in g/t input material from composting ............................ 46
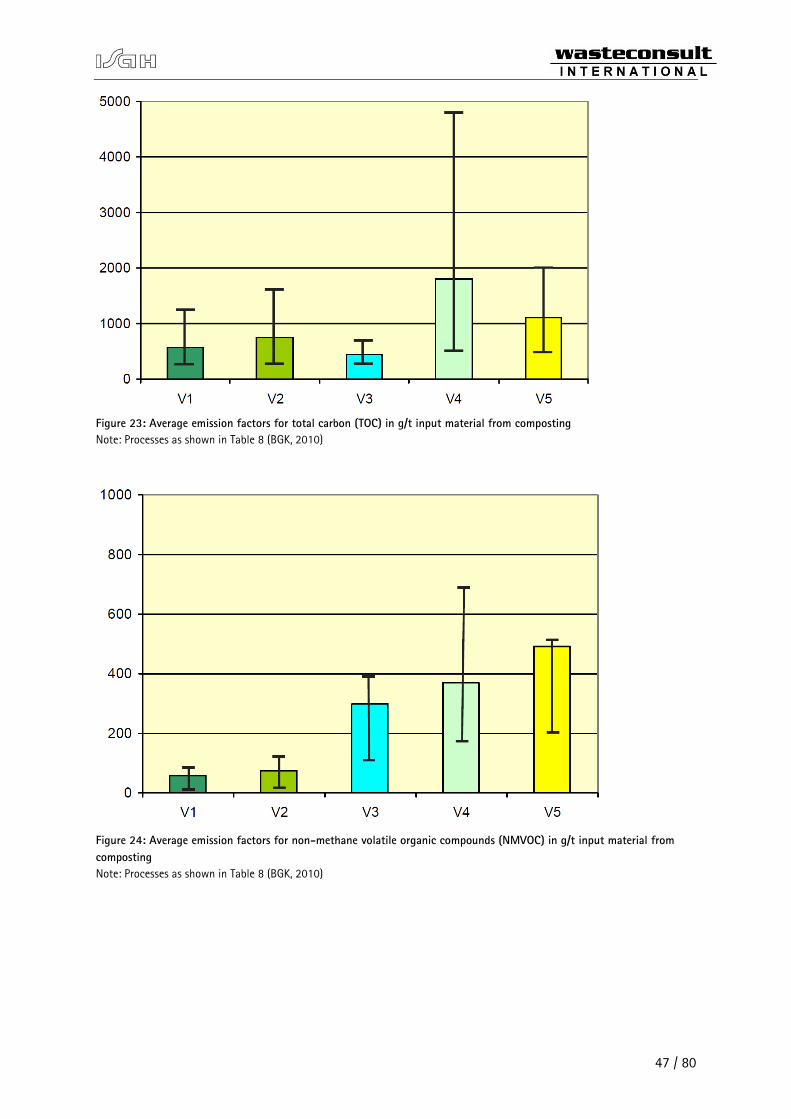
Figure 23: Average emission factors for total carbon ) in g/t input material from composting ....................................... 47
Figure 24: Average emission factors for non-methane volatile organic compounds (NMVOC) in g/t input material
from composting ................................................................................................................................................................................ 47
Figure 25: Average emission factors for methane in g/t input material from composting ................................................ 48
Figure 26: Average carbon dioxide equivalents in g/t input material from composting ..................................................... 48
Figure 27: Moisture, Organic dry matter (oDM) and mineral dry matter (mDM) in Bangalore waste ............................ 51
Figure 28: Mass balances of MBT ........................................................................................................................................................ 52
Figure 29: Mass flow for composting operation ............................................................................................................................. 54
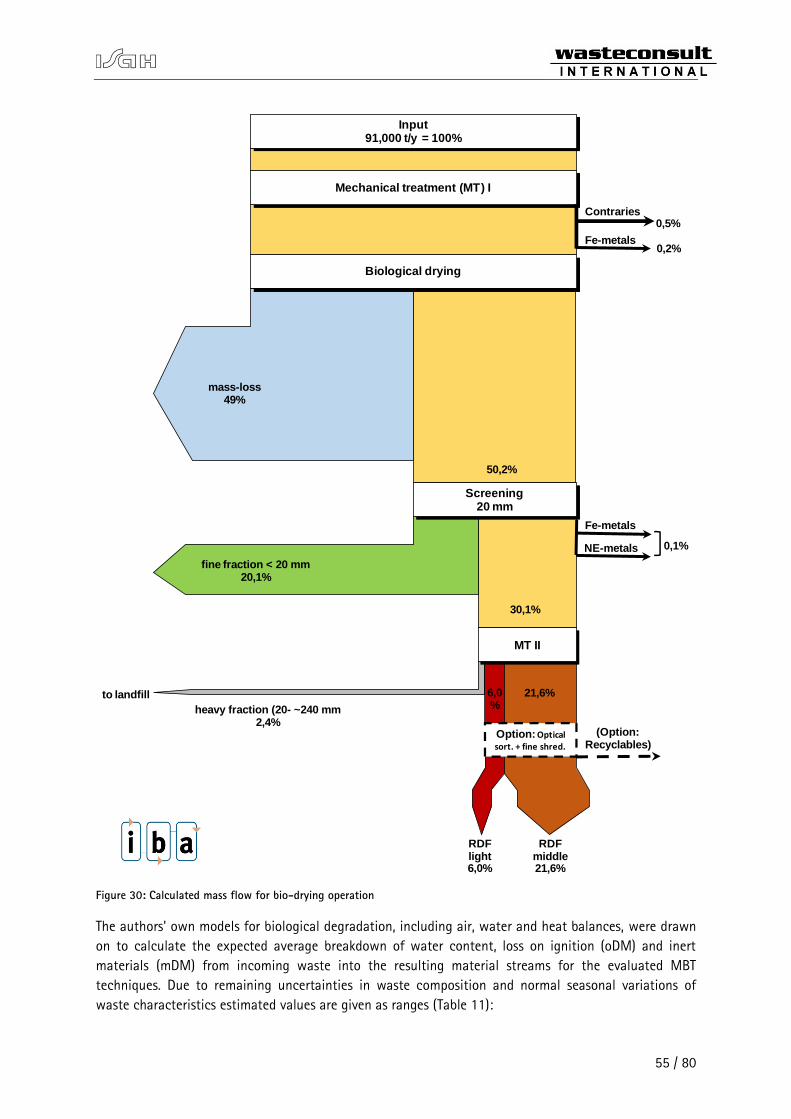
Figure 30: Mass flow for bio-drying operation ................................................................................................................................ 55
Figure 31: Energy balances of MBT ..................................................................................................................................................... 57
Figure 32: Concept of exhaust air flow.............................................................................................................................................. 59
Figure 33: Overview plant layout MBT (incl. post-rotting / maturation) ................................................................................. 61
Page 8
VI
Figure 34: Layout waste reception and mechanical treatment .................................................................................................. 62
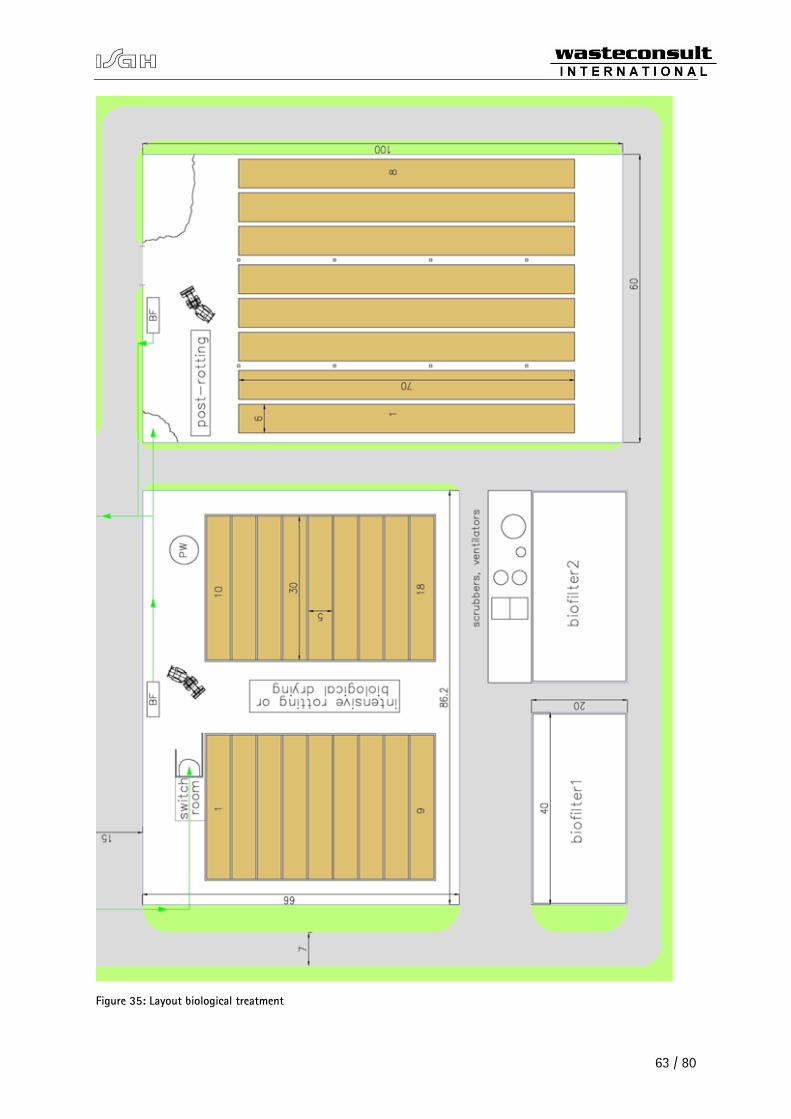
Figure 35: Layout biological treatment .............................................................................................................................................. 63
Page 9
VII
List of Tables
Table 1: Primary waste categories by weight- overall composition .......................................................................................... 11
Table 2: D2D Waste categories in different strata and fraction groups ................................................................................... 12
Table 3: Detailed chemical composition ............................................................................................................................................ 13
Table 4: Comparison of carbon contents with oDM and TOC for D2D ..................................................................................... 13
Table 5: Respiration activity RA4 (AT4) .............................................................................................................................................. 14
Table 6: Gross Calorific value of the waste in West Bangalore .................................................................................................. 14
Table 7: Solid output streams by fraction (wt.%) in terms of overall output (excluding rotting and drying losses) for
different types of plants, showing the average and range of German installations .................................................... 25
Table 8: Grouping into types of processes in BGK 2010 ............................................................................................................... 45
Table 9: Qualitative evaluation of membrane technologies compared to tunnels ................................................................ 49
Table 10: Mass balance of MBT (output) ........................................................................................................................................... 52
Table 11: Characterization of MBT-output ....................................................................................................................................... 56
Table 12: Estimated area demand ....................................................................................................................................................... 60
Table 13: Infrastructural demand / interfaces ................................................................................................................................. 64
Table 14: Main process equipment – Reception, MT I and MT II ............................................................................................... 65
Table 15: Main process equipment – Optional components MT II ............................................................................................. 65
Table 16: Main process equipment – Intensive rotting/Bio-drying and post-rotting .......................................................... 66
Table 17: Main process equipment – Exhaust air treatment ....................................................................................................... 66
Table 18: Investment costs MBT in Euro (composting operation) .............................................................................................. 68
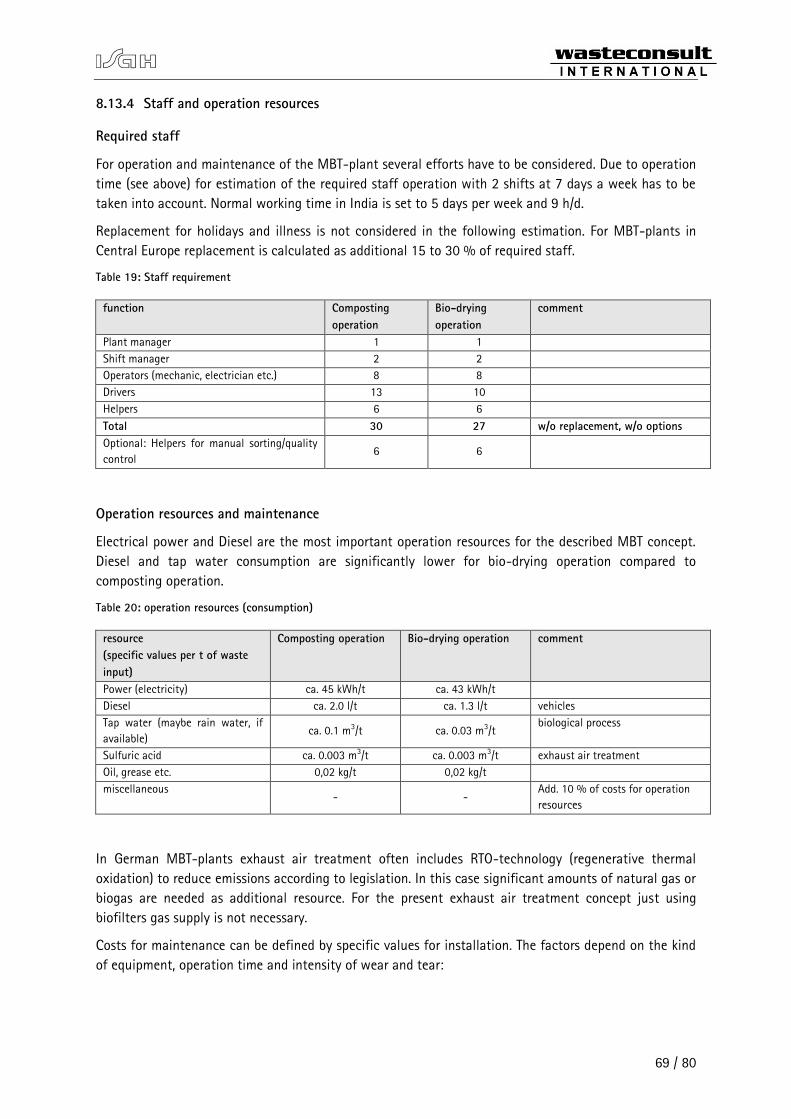
Table 19: Staff requirement .................................................................................................................................................................. 69
Table 20: operation resources (consumption) .................................................................................................................................. 69
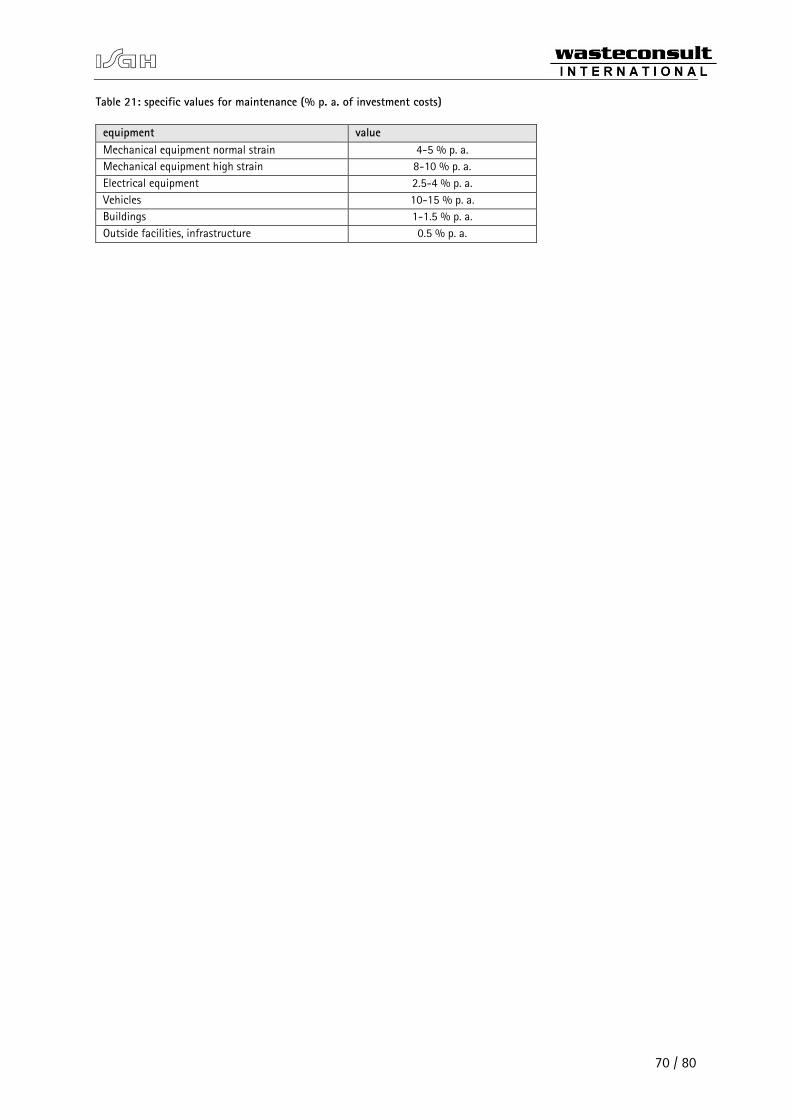
Table 21: specific values for maintenance (% p. a. of investment costs) ................................................................................ 70
Table 22: Common air exchange rates for the ventilation system ............................................................................................ 72
Table 23: Zone classification according to the EU directive 94/9/EC ....................................................................................... 76
Page 10
VIII
List of Abbreviations
BBMP Bruhat Bengaluru Mahanagara Palike
D2D Door-to-Door
FE Ferrous Material
GCV Gross Calorific Value
HD High Density (Areas)
HDPE High Density Polyethylene
INR Indian Rupee
ISAH Institute for Sanitary Engineering and Waste Management, Hannover
LD Low Density (Areas)
LS Litter Spots
MBS Mechanical Biological Stabilisation
MBT Mechanical Biological Treatment
MD Medium Density (Areas)
mDM Mineral Dry Matter
MPS Mechanical Physical Stabilisation
MSW Municipal Solid Waste
NCV Net Calorific Value
NF Non-ferrous Material
oDM Organic Dry Matter
PVC Polyvinyl chloride
RDF Refuse Derived Fuel
RTO Regenerative thermal oxidisation
SRF Specified Recovered Fuel
SS Street Sweeping
TFF The Forward Foundation
TOC Total Organic Carbon
VOC Volatile Organic Compound
Page 11
9 / 80
1 Project description
Bangalore city in India has a population of around 10 million. The city is under the jurisdiction of Bruhat
Bengaluru Mahanagara Palike (BBMP) which is the municipal body. The administrative area is divided
into 8 zones and 198 wards (BBMP, 2015).
A detailed waste characterization study was conducted for the west zone of Bangalore by The Forward
Foundation (TFF), Bangalore in collaboration with Electronic City Industrial Township Authority (ELCITA),
Bangalore and BBMP under the guidance of Institute for Sanitary Engineering and Waste Management
(ISAH), Leibniz Universität Hannover, Germany. The study area comprised of 44 wards with a total area
of approximately 46.70 km2 with a population of about 1.66 million.
Based on the results from this study, Wasteconsult International based out of Langenhagen (near
Hanover), Germany has been engaged to develop an appropriate waste treatment solution for the study
area. Following the study, several meetings and discussions were conducted in Bangalore from Aug 10-
13, 2015 with all stake holders, where the status of waste characterization study was assessed and
further steps in the project for collection, transfer and treatment were discussed in brief. During the
meetings, it was communicated that the concept must have a high level of health and safety standards
to avoid direct contact of the workers with dirty and unsegregated waste. A balance between high level
of automation in the treatment process and maximum possible labour intensity needs to be achieved.
The aim of this project is to develop a reliable, approved and successful waste processing facility. This
requires the availability of a reliable process, machinery and personnel with appropriate skills, education
and working morale.
The main objectives of this feasibility report are:
1. Concept development:
• Evaluation and selection of different process technology for waste treatment
• Plant sizing, Material flow balance, Preliminary plant layout, Material receipt, handling and storage
• Comparison of different concepts and Budget estimates
• Process specifications and utility requirements
• By-product specifications for recycling market and downstream treatment suggestions
• Automation level required (e.g. minimising manual handling), Plant Safety – Health and
Environment
2. Treatment design
• Process design of the selected waste treatment solution
• Plant sizing and material flow balances, process specification and utility requirement
• Formulating the criteria for different end products and downstream treatment
• Formulating appropriate standards for automation, health & safety
• Setting standards for emission and design of appropriate treatment systems
• Cost estimates for the treatment solution
Remark: This is a concept study. Before building the plant, detailed engineering and verification of
process parameters is necessary.
Page 12
10 / 80
Organic 62.6%
Plastics 9.9%
Paper and Cardboard 8.8%
Textiles 4.6%
Fines 4.2% Composites
3.3%
Biomedical Waste 2.0%
Intert 1.6%
Glass 1.4%
Liquids 0.4%
Wood 0.3%
Hazardous HH Waste 0.3% Metals
0.3%
Mixed WEEE 0.1%
2 Input waste quantity and characteristics
2.1 Methodology
For conception and dimensioning of a waste treatment plant, sound data about waste composition and
also about chemical and biological properties and physical data like density is required.
Values for the quantity and composition of the waste are taken or adopted on the basis of the waste
characterization study performed by ISAH, TFF, ELCITA and BBMP (Weichgrebe et al., 2015).
The area of west zone was stratified based on population density into high, medium and low density
areas. The average per capita waste generation was found to be 0.431 kg/d, however variations were
observed among different strata.
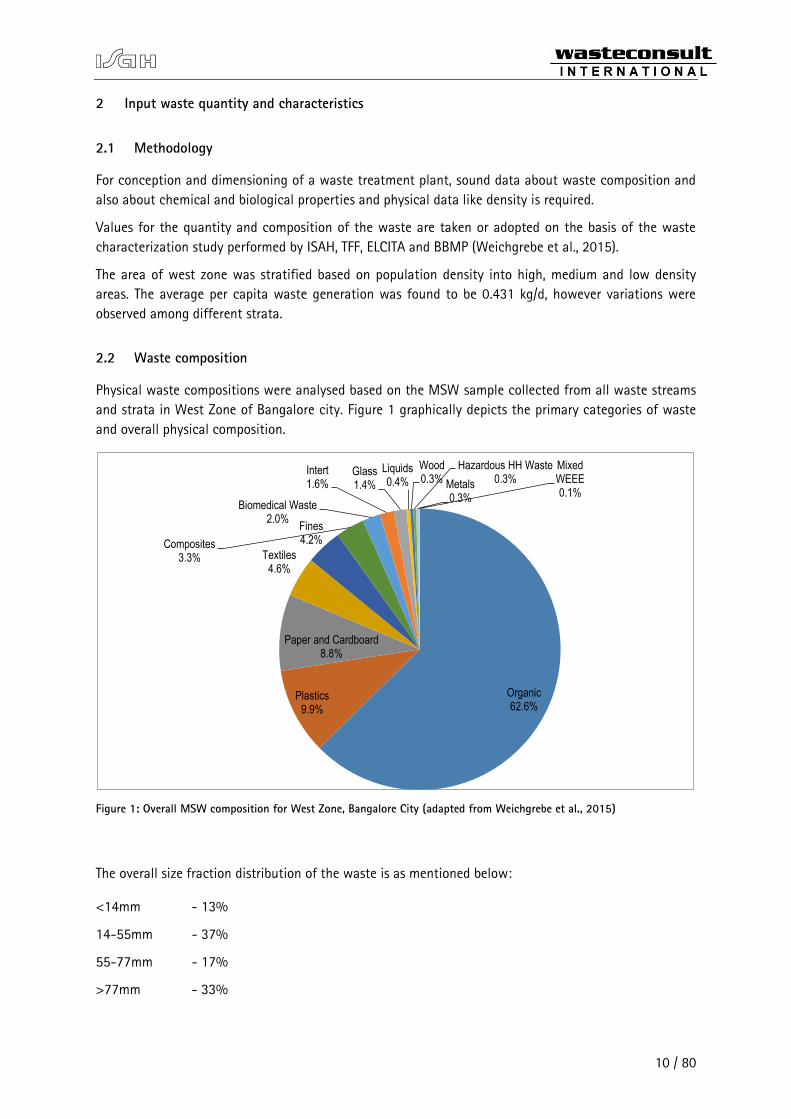
2.2 Waste composition
Physical waste compositions were analysed based on the MSW sample collected from all waste streams
and strata in West Zone of Bangalore city. Figure 1 graphically depicts the primary categories of waste
and overall physical composition.
Figure 1: Overall MSW composition for West Zone, Bangalore City (adapted from Weichgrebe et al., 2015)
The overall size fraction distribution of the waste is as mentioned below:
<14mm - 13%
14-55mm - 37%
55-77mm - 17%
>77mm - 33%
Page 13
11 / 80
The detailed waste composition is as mentioned in Table 1.
Table 1: Primary waste categories by weight- overall composition (Weichgrebe et al., 2015)
Primary Categories Est. Percentage [%] Cum. Percentage [%] Est. Sample [kg]
Organic 62.63 62.63 11347.69
Plastics 9.92 72.55 1798.02
Paper and Cardboard 8.76 81.31 1587.27
Textiles 4.60 85.92 834.06
Fines 4.18 90.09 756.58
Composites (Al, plastic, paper) 3.30 93.39 597.65
Biomedical Waste (mostly
napkins)
2.03 95.42 367.90
Inert 1.61 97.03 292.30
Glass 1.45 98.48 261.86
Liquids 0.42 98.90 76.12
Wood 0.35 99.24 62.57
Hazardous Household Waste 0.34 99.58 60.92
Metals 0.30 99.88 53.87
Mixed Waste of Electrical and
Electronic Equipment
0.12 100.00 22.07
Total 100 18118.89
The waste characterization involved size separation by screening and also sorting. This was conducted
for all the waste streams – Door-to-Door (D2D) collection, litter spots (LS) and street sweeping (SS). The
fine fraction (<14mm) was mostly organic waste; however it could not be physically characterized.
Page 14
12 / 80
Table 2: D2D Waste categories in different strata and fraction groups (from Weichgrebe et al., 2015)
Primary Waste
Categories
Share of Fractions [%]
>77 mm 55-77 mm 14-55 mm All together
Organic 11.75 12.68 36.31 60.74
Plastics 6.67 2.30 0.86 9.84
Paper 5.82 2.03 0.71 8.56
Textiles 3.31 0.57 0.22 4.10
Composites 2.15 0.47 0.25 2.87
Biomedical 1.74 0.41 0.09 2.25
Glass 0.96 0.22 0.10 1.27
Inerts 0.24 0.14 0.15 0.53
Hazardous 0.18 0.12 0.13 0.43
Metals 0.17 0.06 0.07 0.30
Wood 0.08 0.03 0.06 0.16
Mixed WEEE 0.05 0.04 0.04 0.14
Fines 0.00 0.00 0.00 8.39
Liquids 0.00 0.00 0.00 0.42
Total 33.11 19.08 39.00 100.00
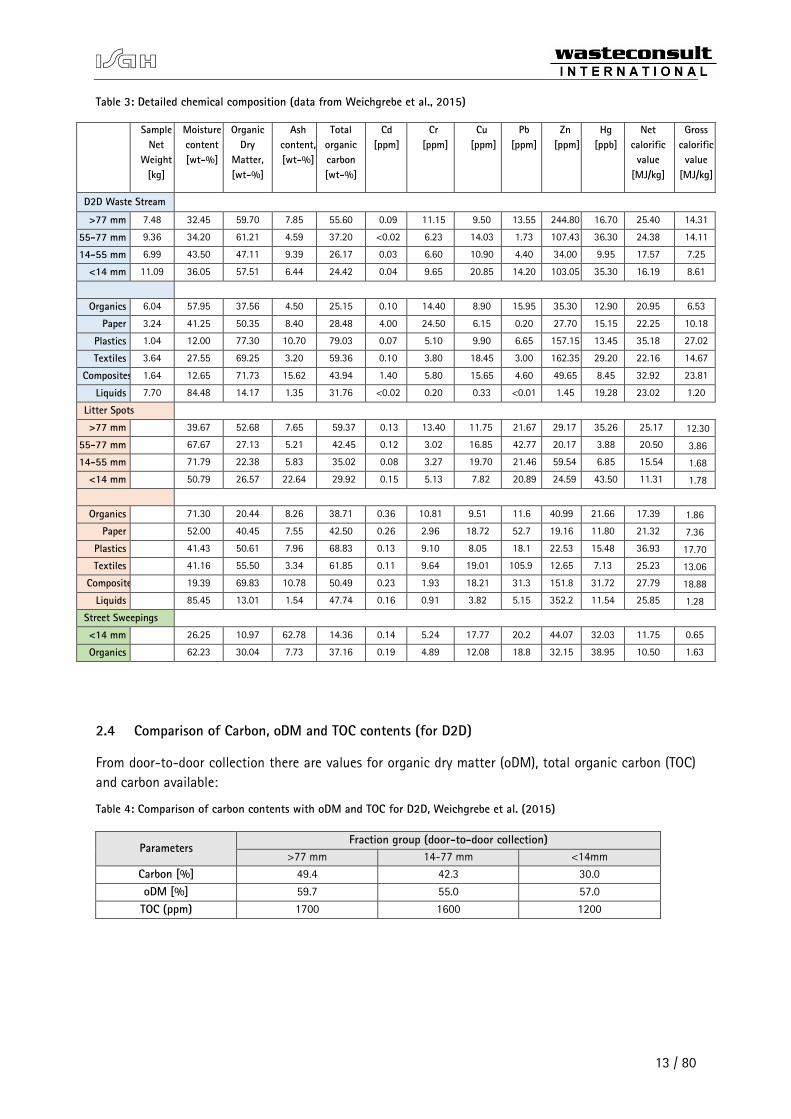
2.3 Detailed chemical composition
Table 3 shows detailed chemical data of the various screening fractions and waste components. Based
on experience, the moisture contents are too low for this type of waste. This is probably caused by the
fact that moisture partly evaporated during the sorting and screening process. This has to be considered
while using moisture contents and net calorific values for the dimensioning of the waste treatment
plant.
Page 15
13 / 80
Table 3: Detailed chemical composition (data from Weichgrebe et al., 2015)
Sample
Net
Weight
[kg]
Moisture
content
[wt-%]
Organic
Dry
Matter,
[wt-%]
Ash
content,
[wt-%]
Total
organic
carbon
[wt-%]
Cd
[ppm]
Cr
[ppm]
Cu
[ppm]
Pb
[ppm]
Zn
[ppm]
Hg
[ppb]
Net
calorific
value
[MJ/kg]
Gross
calorific
value
[MJ/kg]
D2D Waste Stream
>77 mm 7.48 32.45 59.70 7.85 55.60 0.09 11.15 9.50 13.55 244.80 16.70 25.40 14.31
55-77 mm 9.36 34.20 61.21 4.59 37.20 <0.02 6.23 14.03 1.73 107.43 36.30 24.38 14.11
14-55 mm 6.99 43.50 47.11 9.39 26.17 0.03 6.60 10.90 4.40 34.00 9.95 17.57 7.25
<14 mm 11.09 36.05 57.51 6.44 24.42 0.04 9.65 20.85 14.20 103.05 35.30 16.19 8.61
Organics 6.04 57.95 37.56 4.50 25.15 0.10 14.40 8.90 15.95 35.30 12.90 20.95 6.53
Paper 3.24 41.25 50.35 8.40 28.48 4.00 24.50 6.15 0.20 27.70 15.15 22.25 10.18
Plastics 1.04 12.00 77.30 10.70 79.03 0.07 5.10 9.90 6.65 157.15 13.45 35.18 27.02
Textiles 3.64 27.55 69.25 3.20 59.36 0.10 3.80 18.45 3.00 162.35 29.20 22.16 14.67
Composites 1.64 12.65 71.73 15.62 43.94 1.40 5.80 15.65 4.60 49.65 8.45 32.92 23.81
Liquids 7.70 84.48 14.17 1.35 31.76 <0.02 0.20 0.33 <0.01 1.45 19.28 23.02 1.20
Litter Spots
>77 mm
39.67 52.68 7.65 59.37 0.13 13.40 11.75 21.67 29.17 35.26 25.17 12.30
55-77 mm
67.67 27.13 5.21 42.45 0.12 3.02 16.85 42.77 20.17 3.88 20.50 3.86
14-55 mm
71.79 22.38 5.83 35.02 0.08 3.27 19.70 21.46 59.54 6.85 15.54 1.68
<14 mm
50.79 26.57 22.64 29.92 0.15 5.13 7.82 20.89 24.59 43.50 11.31 1.78
Organics
71.30 20.44 8.26 38.71 0.36 10.81 9.51 11.6 40.99 21.66 17.39 1.86
Paper
52.00 40.45 7.55 42.50 0.26 2.96 18.72 52.7 19.16 11.80 21.32 7.36
Plastics
41.43 50.61 7.96 68.83 0.13 9.10 8.05 18.1 22.53 15.48 36.93 17.70
Textiles
41.16 55.50 3.34 61.85 0.11 9.64 19.01 105.9 12.65 7.13 25.23 13.06
Composites
19.39 69.83 10.78 50.49 0.23 1.93 18.21 31.3 151.8 31.72 27.79 18.88
Liquids
85.45 13.01 1.54 47.74 0.16 0.91 3.82 5.15 352.2 11.54 25.85 1.28
Street Sweepings
<14 mm
26.25 10.97 62.78 14.36 0.14 5.24 17.77 20.2 44.07 32.03 11.75 0.65
Organics
62.23 30.04 7.73 37.16 0.19 4.89 12.08 18.8 32.15 38.95 10.50 1.63
2.4 Comparison of Carbon, oDM and TOC contents (for D2D)
From door-to-door collection there are values for organic dry matter (oDM), total organic carbon (TOC)
and carbon available:
Table 4: Comparison of carbon contents with oDM and TOC for D2D, Weichgrebe et al. (2015)
Parameters Fraction group (door-to-door collection)
>77 mm 14-77 mm <14mm
Carbon [%] 49.4 42.3 30.0
oDM [%] 59.7 55.0 57.0
TOC (ppm) 1700 1600 1200
Page 16
14 / 80
2.5 Respiration Activity (RA4 / AT4)
Compared to literature values of raw waste the given results are low. This could be a result of the rather
long storage period of the waste samples, which means the actual values could assumed to be higher.
Moreover, this test is not yet standardized in India and was executed with equipment from Germany
under Indian conditions.
Table 5: Respiration activity RA4 (AT4), Weichgrebe et al. (2015)
Sample Waste streams
Oxygen uptake (mg O2/ g DM)
Moisture content
[%]1 > 77 mm
14 – 77
mm < 14 mm
Limit Value for Waste Deposit
on Landfill1
Door-to-Door 50 15.0 19.4 5.8 < 5
Litter Spots 50 22.4 25.2 25.9 < 5
Street Sweepings 50 24,3² 12.8 < 5 1
As per German Landfill Ordinance, 2
Only for Organic Fraction
2.6 Gross calorific value
For the identification of appropriate waste treatment and recovery techniques, the knowledge of the
calorific value of the waste is important, especially for thermal energy recovery processes. Table 6 shows
the calorific values according to waste streams and size fractions. Additionally, two different mixtures of
waste streams were calculated depending on the individual share of each waste stream for different
waste sources and collection characteristics. By this, varying waste generation and collection
characteristics can be projected for a downstream waste treatment.
Table 6: Gross Calorific value of the waste in West Bangalore, Weichgrebe et al. (2015)
Waste
Streams
Parameter Gross Calorific Value [MJ/kg] Total
GCV
[MJ/kg]
D2D:LS:SS D2D:LS:SS
>77
mm
55-77
mm
14-55
mm
<14
mm
50%:30%:20% 60%:30%:10%
D2D GCV 14.31 14.11 7.25 8.61 11.02 5.51 6.61
% share 34 % 19 % 38 % 9 %
LS GCV 12.30 3.86 1.68 1.78 5.83 1.75 1.75
% share 35 % 17 % 36 % 12 %
SS GCV 0.65 4.21 0.84 0.42
% share 26 % 15 % 36 % 24 %
Overall GCV [MJ/kg] 8.10 8.78
Page 17
15 / 80
3 Selection of general waste treatment type
3.1 Overview
There are two proven and more sustainable ways of treating municipal solid waste (MSW) to avoid the
direct landfilling of solid waste:
Mass burn (incineration) includes flue gas treatment and slag handling.
Mechanical-biological treatment processes are usually operated with reuse of the output (i.e.
RDF) and/or with landfilling of the stabilized low-volume process outputs.
3.2 Waste incineration
Incineration, also often called “waste to energy”, can be useful when the waste is comparatively dry and
has enough components with a high calorific value to enable an auto-thermal process with a high
generation of usable energy. For a sustainable recovery of energy, not only electricity but also the
generated heat should be used. As a reference, the EU Waste Framework Directive (Annex II, R13)
requires a minimum energy efficiency of 65% which can only be achieve with heat recovery.
Incineration requires a fixed, constant amount of appropriate fuel with constant average properties. In
case of changing waste amounts or qualities, severe economic and technical problems can be expected.
The mixed solid waste investigated in Bangalore consists mainly (63%) of (moist) organic materials
(Figure 1) and the calorific value is low (less than 9 MJ/kg gross calorific value, see Table 6). This will
lead to low energy production in the incinerator. In combination with the high construction costs of
incinerators, incineration as a solely solution would not be appropriate in this project. Drying the waste
with abundant heat could increase the heat caloric value but this is not in-line with the Indian waste
hierarchy of the MSW Rules 2000 or even does not lead to a sustainable or economic solution under the
local conditions.
However, if Waste Incineration Plants are installed in places where there is a demand of heat and or
power and the calorific value of the waste is higher (e.g. in central Europe), they can play an important
role in holistic waste management concepts.
3.3 Mechanical-biological treatment (MBT)
Mechanical-biological waste treatment (MBT technology) is a material-specific process. Mixed (residual)
waste is separated into various fractions, each of which is treated and, if possible, recycled in a way that
is customised to its properties, as shown in Figure 2. The core elements of MBT are mechanical or
physical separation technologies and the biological treatment of biodegradable waste components
unless they are diverted to recycling (e.g. paper). Most MBT plants divide their input into a fine fraction
for biological treatment and a coarse high-calorific fraction that undergoes extended mechanical
treatment. Mechanical-biological stabilisation plants (MBS) deviate from this concept as their entire
input (or in a few places only the mechanically separated, high-calorific fraction) undergoes biological
drying. High calorific fractions from MBT and MBS are mostly used as refuse derived fuel (RDF), but can
be also separated in various materials for recycling. The latter requires a market / destination for the
separated materials.
Page 18
16 / 80
Figure 2: Basic approach of MBT
The objectives of mechanical-biological waste treatment vary depending on the location, waste flow,
legal and economic situation, and they can thus be weighted differently as follows:
minimising climate-relevant methane emissions from landfills
decreasing landfill leachate contamination
reducing landfill void consumption
filling existing landfill volume capacities
minimising thermal waste treatment
separating recyclable materials
producing a high-calorific secondary fuel (RDF / SRF)
Mechanical biological treatment processes with subsequent energy recovery from the high calorific
fraction are appropriate for the project tasks. They are comparatively flexible and can be better adapted
to changing waste quantities and qualities than mass burn incineration. However, MBT plants are only
successful if they are tailor-made according to the output usage. The subsequent utilization is
inseparable part of the MBT and should be prepared for as early as possible. Figure 3 shows the high
calorific fraction converted into a process product.
Page 19
17 / 80
Figure 3: Bailed secondary fuel from MBT
Source: Kuehle Weidemeier
3.4 Bioreactor landfill
Sometimes, bioreactor landfills are seen as an alternative to waste treatment. Bioreactor landfills are
sealed landfills with forced leachate recirculation and water infiltration. They require proper sealing with
landfill membranes and a leachate treatment system. They produce biogas (methane) which is collected
by gas wells in the landfill, but can also be operated with forced aeration as an aerobic system. The
landfill gas of anaerobic systems is used to produce electrical energy in gas motors. It is important, that
the gas capture rate is limited and a part of the methane, that is a strong greenhouse gas, is lost to the
atmosphere. After the stabilisation of the organic matter in the landfill by the infiltration process and
the biological degradation processes in the landfill (takes usually decades), there is still a landfill full of
waste left.
Bioreactor landfills are not a significant step forward in waste management; they are just slightly better
landfills. Mechanical-biological treatment hat lots of advantages over bioreactor landfills:
Page 20
18 / 80
Benefits of MBT over bioreactor landfill:
Full control and prevention of gaseous emissions in enclosed systems
Industrial process in which the total waste is involved. No dry (not affected) zones such as in a
landfill
Leaves more stabilized material in the landfill (Aerobic degradation is more effective on poorly
biodegradable substances than the anaerobic processes in the landfill)
Higher gas yield and capture (intensive treatment and no loss of open installation areas or leaks
in a landfill)
Valuable resources (metals, wood, plastics, paper, etc.) are recycled and not lost in the landfill
Producing a high calorific solid fuel
Less land consumption and avoidance of burden for future generations
3.5 Conclusion
Considering the waste properties and the target of a long term sustainable and sanitary solution,
mechanical-biological techniques are the most appropriate processes. Hence, MBT is chosen as the
appropriate system for this project. It has to be pointed out, that the utilisation of the MBT output
products, especially the high calorific secondary solid fuel is required for a meaningful operation of a
MBT. Concepts and markets for that should be prepared as early as possible. There are lots of different
MBT technologies. The next chapters describe the main groups of MBT processes and do a pre-section
amongst them.
Page 21
19 / 80
4 Description of Mechanical-Biological waste Treatment processes (MBT)
4.1 Types of mechanical-biological waste treatment
Mechanical-biological waste treatment plants are grouped into the following types based upon the main
technology used in the biological stage:
MBT with a major landfill or compost fraction
o Aerobic processing
o MBT with ‘dry’ anaerobic treatment
o MBT with ‘wet’ anaerobic treatment
MBT (MBS) for solid recovered fuel (SRF/RDF) production
o Short aerobic drying process (BD) and efficient material separation after drying for
combustion and recycling
Mechanical-physical drying plant (MPS). Similar to MBS, but drying with fossil energy and no
biological step
Anaerobic technologies yield both solid output streams and biogas (methane) that can be used as a
source of energy. Anaerobic stages are always followed by an aerobic treatment phase. Installations with
digestion stages can operate as full-stream or partial-stream fermenters (in relation to the input to
biological treatment).
The choice of MBT machinery is based upon the following factors:
the treatment objective
the type and composition of waste
the requirements for subsequent biological treatment
the requirements for energy recovery
Basic elements of most MBT plants:
Input control /selection, input buffering / bunker (reception hall)
Extraction of material with high energy content (high calorific value) by sieving (diameter >60-
150 mm / ~3-6´´) or other technologies
Metal separation
o Magnetic separator for ferrous metals (always available)
o Eddy current separator for non-ferrous met. (many plants)
Biological treatment of fine fraction (e.g. < 60 mm)
Intermediate storage facility
If necessary, further mechanical treatment of biologically treated fraction for the withdrawal
calorific constituents by sieving or air classification
If necessary, further processing of the calorific fraction
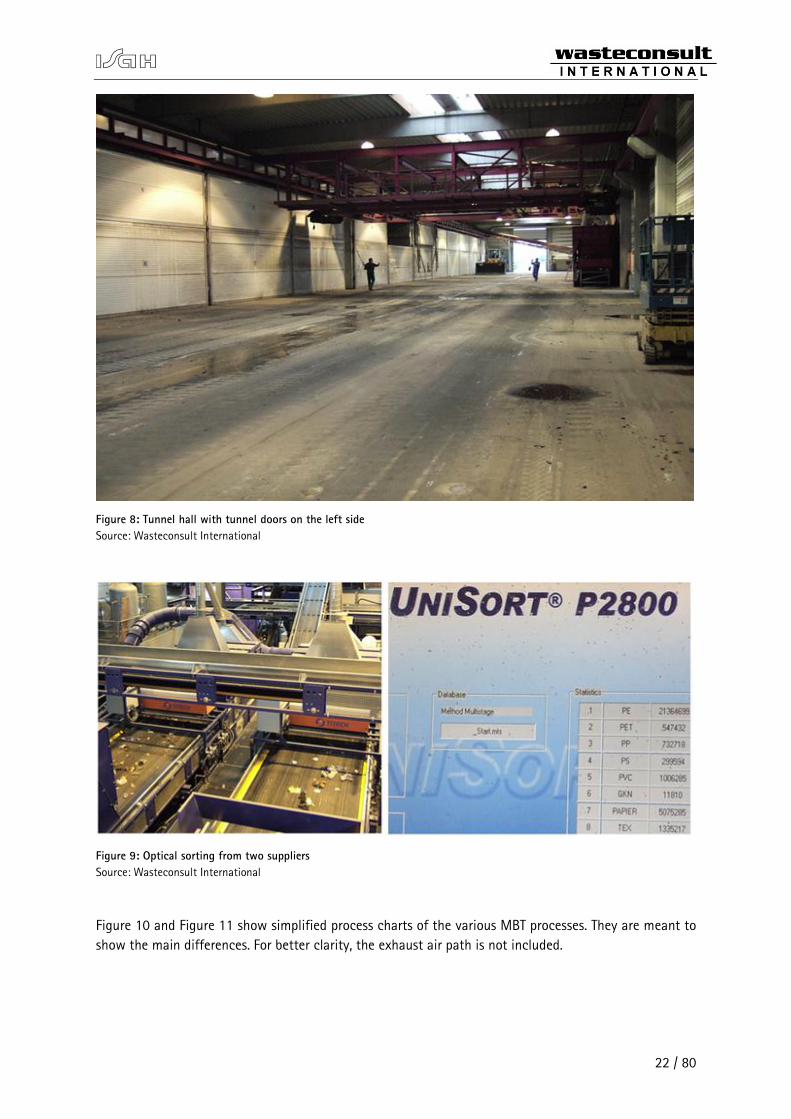
In biological drying plants, usually the entire input is shredded and fed to the biological drying process.
Separation can be done better after the drying. Figure 4 to Figure 9 visualizes a selection of important
Page 22
20 / 80
Figure 4: Reception, intermediate storage and feeding the shredder
Source: Wasteconsult International
Figure 5: Inside a trommel screen
Source: Wasteconsult International
Page 23
21 / 80
Figure 6: Outside encapsulated trommel screen
Source: Wasteconsult International
Figure 7: Metal separation (Doedens 1998)
Page 24
22 / 80
Figure 8: Tunnel hall with tunnel doors on the left side
Source: Wasteconsult International
Figure 9: Optical sorting from two suppliers
Source: Wasteconsult International
Figure 10 and Figure 11 show simplified process charts of the various MBT processes. They are meant to
show the main differences. For better clarity, the exhaust air path is not included.
Page 25
23 / 80
Figure 10: Simplified process chart of MBTs with a major landfill (or compost like) fraction
Page 26
24 / 80
Figure 11: Simplified process chart of biological and physical drying plants
4.2 Main material flows
4.2.1 Input materials
Input material of MBT plants usually consists mainly of the mixed residual fraction left over after
source-separated waste collections or mixed household and household like commercial waste. Besides
household waste and commercial waste with similar properties, these facilities sometimes also process a
smaller amount of commercial waste, bulky waste, sorting residues, sewage sludge and grit chamber
residues.
4.2.2 MBT output
Table 7 is an example for the average breakup of solid material flows at German MBT plants handling
residual waste. A distinction is made between MBT (upstream of a landfill) and MBS (primary objective:
producing alternative fuels, biological drying) technology.
Page 27
25 / 80
Table 7: Solid output streams by fraction (wt.%) in terms of overall output (excluding rotting and drying losses) for
different types of plants, showing the average and range of German installations (Kühle-Weidemeier, M. et. al. 2007)
Fraction Percentage by weight
MBS/MPS MBT
FE metals 4.2 (2.6-7.0) 3 (0.3-4.8)
NF metals 0.4 (0-0.9) 0.1 (0-0.7)
Impurities 1.3 (0-8.7) 2 (0-12)
Other 6.4 (0-33) 5 (0-22)
Landfill fraction (compost-like output) 12 (0-26) 41 (19-64)
Other low-calorific material 8.9 (0-39) 3 (0-21)
High-calorific fraction 67 (28-97) 46 (29-77)
Note: A few MBT plants have now been retrofitted to add NF separators, which were not installed at the time when these
measurements were taken. The NF material stream would have increased currently.
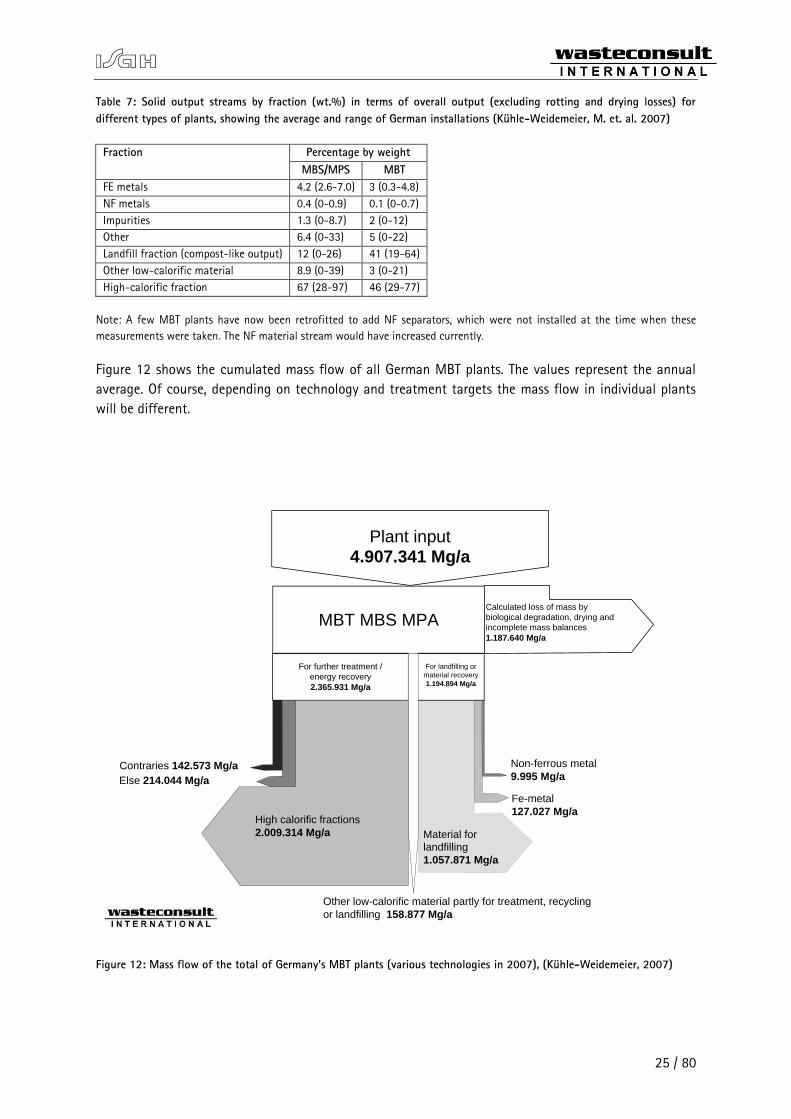
Figure 12 shows the cumulated mass flow of all German MBT plants. The values represent the annual
average. Of course, depending on technology and treatment targets the mass flow in individual plants
will be different.
Figure 12: Mass flow of the total of Germany’s MBT plants (various technologies in 2007), (Kühle-Weidemeier, 2007)
MBT MBS MPA
For further treatment /
energy recovery
2.365.931 Mg/a
For landfilling or
material recovery
1.194.894 Mg/a
Plant input4.907.341 Mg/a
Material for
landfilling
1.057.871 Mg/a
Non-ferrous metal
9.995 Mg/a
Fe-metal
127.027 Mg/a
Other low-calorific material partly for treatment, recycling
or landfilling 158.877 Mg/a
High calorific fractions
2.009.314 Mg/a
Contraries 142.573 Mg/a
Else 214.044 Mg/a
Calculated loss of mass by
biological degradation, drying and
incomplete mass balances
1.187.640 Mg/a
Page 28
26 / 80
The output fractions coming out of different technologies in Germany is mentioned in Figure 13. It has
to be noted that the MPS data is based on only 3 plants and the high content of RDF output might have
been influenced by input composition.
Figure 13: Share of the various fraction of the total solid output of the total of German MBTs from different technologies
(Kühle-Weidemeier, 2007)
The huge amount of the high calorific fraction in the MPS output is likely caused by local / plant and
waste specific reasons (only 3 MPS plants). All data shown about mass flows are meant as an illustrating
example. However waste composition differs in other countries and may be much different from waste
composition in Germany which will lead to different output composition.
Page 29
27 / 80
5 Evaluation / pros and cons of the process types
5.1 Aerobic MBT prior to landfill for the production of compost like output
+ Lowest investment costs of all modern MBT types
+ Smaller units are also feasible
+ Simple and the most reliable MBT process
+ 50% or more landfill diversion
- No biogas production
- Pure energy consumer due to required aeration (negative energy balance if the recovered energy
from produced secondary fuel is not taken into account)
- Comparably long biological treatment time (4-12 weeks depending on treatment targets)
5.2 MBTs with anaerobic digestion
+ Biogas production that can exceed the energy demand of the MBT by far
- Higher investment costs due to more sophisticated process
- MBTs with anaerobic stages are more complex than aerobic MBTs
- The anaerobic process is more sensitive than the aerobic
- Operation requires higher skills of the operational personnel
5.3 Aerobic MBT (or MBS) with biological drying (BD)
+ Reliable aerobic process
+ Tunnel / box system with good emission control
+ Dried material allows enhanced sorting and material recovery
+ 65-90 % landfill diversion
- Increased risk of fires
- No biogas production (but huge amount of refuse derived fuel RDF with high calorific value)
- Energy consumption through aeration
5.4 Mechanical-physical stabilization (MPS)
MPS is excluded due to high fossil energy consumption in general, especially due to the comparatively
high moisture content of Bangalore’s waste to that of Germany.
5.5 Pre-decision
A main objective of the project is to establish a reliable, approved and successful waste processing
facility. This requires the availability of a reliable process, reliable machinery and personnel with
appropriate skills, education and working morale.
Under the current situation, a simple and robust process will offer the best precondition to fulfil the
project targets described in the previous paragraph. MBTs with anaerobic process steps are sophisticated
units that require skilled personnel with an in-depth understanding of the chemical and biological
Page 30
28 / 80
processes in the reactor, the influence of feedstock variations and how to react to a wide variety of
possible complications in the biological process. While for the given conditions (treatment of mixed solid
waste) an aerobic process is comparatively easy to handle and tolerant to unfavourable process
conditions, anaerobic digestion processes are easy to “kill”, difficult to handle and time consuming to
recover. Depending on the technology, MBTs need a wastewater management, especially (e.g. 0.5-
0.7 m³/t in wet anaerobic MBTs that requires treatment.
Due to the sensitivity and complexity of the process, anaerobic processes are excluded from the process
selection based on the premises of this project. Hence, an aerobic plant with composting step, an
aerobic biological drying plant or a combination of both will be subject of closer investigations in this
project. However, the process will have a negative energy balance which can be recovered by the reuse
of the products. Also, the skilled personnel have to understand and maintain the process with proper air
and water management to avoid self-ignition.
Page 31
29 / 80
6 General description of process steps and machinery in aerobic MBT / MBS plants
6.1 Manual sorting and removal of impurities
Improperly sorted items and large impurities are first removed by hand or using grippers before
mechanical treatment truly begins. This step prevents damage to technological systems and avoids
introducing hazardous substances or items that might stop the technology from working properly.
According to the waste characterisation, currently not much contraries have to be expected, but this
may change following the economic growth.
6.2 Mechanical treatment
6.2.1 Functions of mechanical treatment
Mechanical processing prepares waste for subsequent treatment. The degree of processing is determined
mainly by the application for high-calorific coarse fraction and biological treatment process for the fine
fraction.
Mechanical treatment has the following functions:
Removal and/or processing (e.g. shredding) impurities
screening out fine fraction with a high level of degradable organic components for biological
treatment (not at MBS plants)
sorting, shredding or customising high-calorific waste fractions for energy recovery (in the MBT
plant’s main stream before or after biological treatment)
ejecting heavy fractions
separating groups of materials for recycling (e.g. metals)
breaking down and homogenising waste components for biological treatment
customising high-calorific output material
6.2.2 Shredding and homogenisation
In the first stage of mechanical processing, waste is prepared for subsequent treatment, pre-shredded to
the necessary maximum size and thereby also homogenised for the first time. The shredding process also
opens containers and bags etc., and increases the surface area of the waste components, improving the
breakdown of degradable organic elements for biological treatment.
The decision of pre-shredding the material depends upon the waste’s properties. The machinery used in
this phase varies in terms of its shredding effect and depends on the type of waste to be treated. Most
often, the plants use breaking (e.g. single or multi-shaft breakers), cutting (rotary shear or cutting mill)
or shearing (screw mill) machinery. One alternative is high-pressure compactors, which combine
shredding and sorting of fractions that will undergo biological treatment. Depending on the waste
properties, pre-shredding can be avoided for some waste streams and replaced by just a bag opener.
Page 32
30 / 80
6.2.3 Separation of coarse and fine fractions
The separation of high-calorific coarse waste fractions and the fine fraction destined for biological
treatment is largely performed using screening (drum, vibrating and star screens). As a result of the
waste characterization of West Zone, Bangalore (Weichgrebe et al., 2015), the screen cuts are chosen to
be 10 mm and 60 mm. Air-classifiers are used occasionally and a few plants also utilise ballistic
separators.
High-pressure compactors are used in some plants with anaerobic digestion to separate the wet organic
fraction from the dry fractions.
6.2.4 Separating FE and NF metals
Magnets remove ferrous metals; non-ferrous (NF) metals are extracted using eddy current separation
systems.
6.2.5 Processing the high-calorific fraction
The resulting high-calorific fraction can undergo additional processing prior to energy recovery, if
necessary. This depends on the customer’s specifications. Apart from additional shredding, other steps
include further removal of metals and other impurities, such as rocks or other inert, non-combustible
materials.
6.2.6 Ejection of impurities and recyclables using sensors
Some plants also utilise sensor-based sorting technologies (optical NIR sensors) in order to remove PVC,
for example, from the high-calorific value fraction. The PVC's high chlorine level lowers the fuel quality.
Sensor-based sorting can also be used remove recyclables like paper, wood or selected plastic material
from coarse and sometimes even from the fine fraction.
6.3 Biological treatment (aerobic)
6.3.1 Intensive decomposition (degradation)
The stages of biodegradation follow first-order kinetics, corresponding to a curve that first falls steeply
before showing an asymptotic motion. Most decomposition by mass occurs when the degradation curve
is steep during a period that typically lasts two to three weeks. This phase is known as intensive
decomposition because of the significant break-down of material (which is simultaneously accompanied
by the most intense phase of emission activity).
Aerobic degradation releases carbon dioxide, water, ammonia and heat as the main (gaseous) products
of metabolism. The temperature typically is around 50-60°C in the intensive decomposition phase, and is
even higher in MBS plants. The temperature has a sanitising effect on the waste. The water content,
aeration and temperature are the key process and control parameters in composting.
Enclosing or encapsulating the intensive decomposition stage is a core element of efforts to minimise
emissions and optimise process efficiency. After around 3-5 weeks starts the maturation phase with
much lower emissions. This phase is more feasible for not completely enclosed processing, but due to
Page 33
31 / 80
higher process efficiency and better emission control often the complete biological treatment is done
encapsulated.
At MBS plants, the overall biological degradation process is restricted to a hot (intensive) decomposition
(drying) phase lasting 7 to 14 days, during which moisture is expelled from waste through the exhaust
air and is not replaced.
6.3.2 Maturation
Substances that are tough to decompose or unusable decomposition and transformation products
release humic substances during the maturation phase. Maturation takes ca. 4 to 8 weeks depending on
the process and feedstock and stabilization requirements.
6.3.3 Shape and encapsulation of composting windrows
6.3.3.1 Box, container and tunnel windrows
In this method, waste rots in actively aerated concrete tunnels or containers that can be closed securely
and allows a high level of emission control. This enclosed system permits comparatively accurate control
of the composting process by measuring and regulating temperature and oxygen levels in the exhaust
air. Process conditions can be tailored exactly to the stage of decomposition as each tunnel contains
material of the exact same age. The material is turned upon input and removal. The rotting time is short
(2 to 4 weeks) as the parameters can be easily controlled. However, to produce mature compost (as
against raw compost) it could be subjected to odour emissions.
6.3.3.2 Linear windrows
This technique composts material in fortified open-air composting lines (which may also be covered by a
roof or enclosed) that are actively aerated on an individual basis. Special turning machinery turns the
windrows line by line.
6.3.3.3 Table windrows
Table windrows are over-sized windrows that are typically set up throughout almost entire halls and
equipped with automatic turning machinery (bucket wheel or screw system). A ventilation floor provides
active aeration. The aeration floor is divided into segments, allowing aeration intensity to be adjusted
based upon how well the material is decomposing.
6.3.3.4 Triangular windrows
Triangular windrows are laid out in elongated lines in a hall or in a space covered by a roof structure.
Material is stacked by a closed cabin wheel loader, for instance, and turned by a closed cabin wheel
loader or a windrow turner. Triangular windrows mostly employ passive aeration and are mainly used for
maturation when the demand for oxygen is no longer quite as high.
Page 34
32 / 80
6.3.3.5 Composting and homogenisation drums
A few installations begin biological treatment in a steel drum that rotates very slowly. The turning
motion slightly shreds and homogenises the material, improving bioavailability and also helping to
aerate the mixture. Integrated nozzles can inject moisture, if needed. The residence time is one to seven
days. Material then undergoes conventional rotting. Composting drums are rarely used because of their
high cost of operation.
6.4 Wastewater treatment
Unless a plant is wastewater-free, wastewater that is not re-circulated is treated prior to discharge. This
step typically takes place in landfill leachate treatment units or the wastewater is sent to the local
sewage sludge treatment plant (depending on the NH4, COD load, heavy metals, etc.) through the sewer
network, depending on availability and permission. Wastewater treatment is thus not typically part of
the mechanical-biological treatment plant itself (except the MBT with full wet anaerobic fermentation).
Requirements for discharge before mixing may necessitate pre-treatment before wastewater is
discharged into the sewer network.
The following techniques or often combinations thereof are essentially suitable for treatment: biological
treatment with ultra filtration, reverse osmosis and/or activated carbon adsorption.
6.5 Waste gas (exhaust air) treatment
6.5.1 Machinery
A combination of gas scrubber (not required for wet anaerobic digestion plants) and at least one
downstream process are generally used to treat waste gas generated by MBT plants. The downstream
process is usually a biofilter and in Germany, it is a regenerative thermal oxidation (RTO). RTO achieves
the highest level of exhaust gas purification but has a high energy consumption, especially in aerobic
MBT plants.
6.5.2 Wet and acidic scrubber
The scrubbing process captures dust and humidifies dry waste gas from mechanical treatment before it
enters the biofilter. It also washes out some nitrogen compounds.
The main function of an acidic scrubber is to remove nitrogen compounds that would lead to the release
of nitrogen oxide (NOx) and nitrous oxide (N2O), caused by processes in the biofilter, from waste gas. Any
ammonium nitrogen in the waste gas stream is transferred into the scrubbing liquid (generally diluted
sulphuric acid), which usually achieves the required fertilizer quality.
6.5.3 Biofilter
In a biofilter, the waste gas flows extensively through a bundle of organic material (often root wood)
whose surface is teeming with microorganisms.
Conditions must be put in place to facilitate microorganism growth in order to achieve the necessary
degradation efficiency of odour and volatile organic carbons (excluding methane). In particular, these
conditions include having consistent and suitable temperature and moisture conditions, a suitable pH
Page 35
33 / 80
level and adequate surface area contamination for degradation, i.e. not too large (degradable material
per m² and hour). Figure 14 shows the surface of a biofilter in Germany.
Figure 14: Biofilter
Source: Wasteconsult International
6.5.4 Regenerative thermal oxidisers
Regenerative thermal oxidisation (RTO) is a flameless oxidation technique that involves a heated bed of
ceramic material. The function of an RTO is to reduce greenhouse gas emissions (e.g. methane), odour
and to dispose of other organic substances that have an impact on the environment and human health.
Non-catalytic regenerative thermal oxidisers can essentially be broken down into the following systems:
RTO systems with a combustion chamber (largely three chamber systems)
RTO systems without a combustion chamber (largely one chamber systems)
RTO systems consist of an oxidation zone and heat exchange system before and after the oxidation
zone. Crude gas is preheated to the oxidation temperature of ca. 800°C to 1,000°C in the upstream heat
exchange element (Stockinger, 2004).
The RTO can source some of its operating energy and temperature from the oxidation of organic waste
gas components, except in the start-up phase. For the rest, a supply of biogas or fossil gas is required.
Page 36
34 / 80
RTO is an appropriate solution for MBTs with a high load of volatile organic carbon in the exhaust gas.
When this exceeds about 1500ppm, RTO can be run auto thermal and needs no or very few external
energy / heating except for the start procedure. These conditions can be found in some anaerobic MBTs.
Aerobic MBTs usually have much lower VOC loads in the exhaust gas, however, higher levels VOC can be
expected in India due to experiences on ground. This causes enormous costs for feeding fossil gas to
heat the RTO and in some cases the operation of the RTO causes more greenhouse emissions than it
avoids. Hence, RTO is often a good solution for anaerobic MBT but less for aerobic MBT. Although VOC is
expected to be high in India, increased aeration leads to a reduction of VOC levels and thereby waives
the need for RTO.
Figure 15: RTO and acid scrubber (black in the image centre)
Source: Wasteconsult International
6.5.5 Waste gas combustion
Three of the German plants do not treat waste gas in an RTO, but send it to an incineration plant as
waste or secondary fuel where it is used as supply air. These plants have a backup RTO that is used when
the incinerators are under maintenance. Feeding the exhaust gas to the incinerator requires special
corrosion protection measures in the incinerator. This way of treatment is interesting, when a biofilter is
not appropriate for exhaust gas treatment and otherwise a RTO would be required.
Page 37
35 / 80
7 Local conditions in Bangalore
7.1 Size and location
Bangalore is the capital city of Karnataka, India. It has an area of around 1300 sq. km. (BBMP
restructuring, 2015) and is located at an altitude of 949 m above sea level (BBMP, 2015). It lies in 12°
58' N latitude and 77° 38' E longitude and has the following climatic conditions:
7.2 Climate
Mean annual temperature – 24.1 °C
Average temperature in hottest month(April) – 28 °C
Average temperature in the coolest month(December) – 21.1 °C
Annual Precipitation – 905 mm
Annual average relative humidity – 62.5% (Bangalore Climate Maps, 2015)
Annual average wind speed – 2.82 m/s
Annual average solar radiation – 5.26 kwh/m2/d (Synergy Enviro Engineers, 2015)
Low effect of monsoon, comparatively even distribution of rainfall
The actual location of the proposed treatment plant has not been identified yet and hence the above
climate data is assumed for the calculations in this feasibility study.
7.3 Geology, sub soil
No information is available for the plant location about the earthquake, inundation or risks due to any
other natural disaster. Therefore, this study doesn’t take into account any special requirements related
to them. These risks must be evaluated during further planning of the project.
No information about the sub soil at the plant location is available either. This study assumes that the
sub soil has normal load-bearing properties that don’t require any special foundation work. This should
be further reviewed during the further planning once the project location is chosen.
7.4 Infrastructure and transport
As the site had not been determined at the time of this study, information also cannot be provided
regarding the local situation with regards to:
Transport connections (road and rail)
Connection to utilities and waste management infrastructure (electricity, gas, drinking water,
wastewater, telephone, data etc.)
Distance to the landfill and the planned incinerator for the high-calorific fraction
Distance to the next development, especially housing and any protected areas
Size and layout of the building plot.
This study estimates the area required for the MBT plant and develops a rough surface layout. It does
not take account of any special requirements or limitations relating to the aforementioned points.
Infrastructural interfaces for which no specific local rules exist are located at the boundaries of the
building plot.
Page 38
36 / 80
This study assumes that trucks or compactors / trucks with press containers will be used to transport the
solid output streams.
7.5 Technical standards for the project
Discharge limit values set by the local Pollution control board are considered for the discharge of
contaminated wastewater. This study assumes that the wastewater is generated relatively consistently
and, if necessary, discharged without restriction after treatment according to the limit values. On the
other hand, surface water will not be generated all the time because of the nature of precipitation. A
rainwater collection basin is planned to even out discharge volumes. It can also be used as a fire
extinguishing water reservoir.
There are no specific requirements for discharging exhaust air from the MBT plant into the environment
in India. This study assumes that dust and odour emissions are to be limited in accordance with the
state of the art and achieve the air pollution limit values set by the local Pollution control Board and
protect the health of workers and population.
This study presumes that solid waste generated by the MBT plant should be adequately stabilised and
thus meet requirements in the range of EU criteria regarding e.g. gas formation potential and respiration
activity. This study considers water content and loss on ignition to be the indicative parameters. The
study also ensures that the landfill fraction meets any standards set by MSW Rules 2000, India.
Any other legislations or statutory requirements for this project must be considered during further
planning and implementation of the project.
Page 39
37 / 80
8 Process selection and dimensioning of the waste treatment plant
8.1 Chosen concept
In chapter 3 mechanical biological waste treatment processes (MBT) were identified as the most feasible
waste treatment option for waste from West Zone, Bangalore. Later in chapter 5.5 the pre-decision was
made that only aerobic MBT processes will be considered for the waste treatment plant.
Currently it is little known about the local market for output fractions from the MBT plant. Even less is
known about the future development of these markets and about the change of waste properties. To be
able to react to changing markets and waste properties, a very flexible concept of the MBT plant is the
best option.
This flexibility is achieved by choosing a plant design that allows the classic production of compost like
output and secondary solid fuels as well as doing biological drying and converting nearly all of the
waste in a secondary fuel. The required machinery is very similar and the plant is designed in a way that
it can be easily switched between both operation modes or even a combination of both.
The main difference lies in the operation mode of the biological treatment and a partly different
sequence of the mechanical treatment aggregates. The following chapters describe the two operation
modes separately as if there were two different MBT pants.
8.2 Waste Collection Development and Impact on the modular development of the MBT
Currently there is mixed waste collection in Bangalore. With the future implementation of a new waste
collection system, increasing waste segregation is expected. This segregation affects the plant operation
when it is run in compost production mode. In composting mode, the separately collected fractions are
discharged on different heaps in the reception hall (flat bunker).
Hazardous waste will be directly discharged in an appropriate container.
Segregated wet (organic) waste will be accumulated daily as long (max. 1 day) as storage capacity is
available. Then the plant is fed with the wet fraction only until the wet waste input heap is cleared. The
fine output (<60mm) of the segregated wet waste mechanical processing will be put in a composting
tunnel, that is only fed with segregated wet (organic waste). These tunnels have to be clearly marked to
avoid mixing of compost from (comparatively clean) segregated wet waste and compost like material
from mixed waste. The coarse fraction of this process (>60mm) will be put to the coarse fraction of the
processing of the rest.
The rest is mechanically processed in the time before and after the mechanical processing of segregated
wet waste is done. This fraction can be either processed for and by biological drying or composting and
separation of a coarse fraction.
When the plant runs in full bio-drying operation (total waste input goes to bio-drying for solid fuel
production), the segregated wet fraction can be mixed with the dry / mixed fraction, and segregation
would not be required in this case.
Page 40
38 / 80
8.3 Level of Automation
There are four main reasons for automation of major parts of the process:
Workers health: Minimising contact between waste and workers
Public health: Automation facilitates emission control
Process efficiency: Increasing throughput (minimising retention time)
Reliable output quality: Automated process control especially in biological treatment and
sorting of output fractions
The waste will be fed in the process by a material handler. Moving the waste in the plant will be done by
wheel loaders (biological treatment and reception hall) and conveyors (mechanical processing). All
material separation steps are done mechanically (screen, wind sifters, magnetic metals separators, eddy
current metal separators, optional sensor based optical sorting (NIR). Manual picking of waste
components may only be done optionally for quality control and enhancement of output fractions.
Moisture, temperature and aeration control of the biological treatment is computerised.
8.4 Bio-drying Process
The main objective of this process is to obtain a high quality secondary fuel such as RDF that can
substitute primary fuels in industrial boilers, cement kilns, co-incineration plants, etc. Apart from RDF
production, recyclables such as ferrous and non-ferrous metals, high quality plastics and contraries such
as car batteries are separated during the operation. The treatment line is designed such that it is easy to
switch to the composting operation if required. The overview of this process is shown in Figure 16.
The waste delivered waste is transferred to the bunkers by the waste collection and transfer trucks.
There it can be selectively discharged (on heaps) depending on the type of waste. The first step involves
removal of large contraries such as large batteries (not common in the current waste) by spreading the
waste using a wheel loader or a grab so that larger hazardous components and pollutants are removed
before further processing. These contraries need to be sent to appropriate recycling or disposal facilities.
The waste is then loaded to shredders which reduce the particle size to about 150 mm. Shredding is also
important to cut the ropes and other similar materials which can entangle the machinery in the MBT. A
separate bag opener might not be required since shredding will open up the bags. The shredded output
is then passed through an over belt magnetic separator to remove ferrous metals. The recovered metals
are stored in separate containers and can be directly sent to recycling.
The waste is then fed into closed drying tunnels using wheel loaders where the waste is dried using
exothermal heat from the intensive rotting of waste. The process typically takes about two weeks and
the tunnels are operated to such that both composting and bio-drying processes can be accommodated.
During this process, the organics are partially degraded. To remove fine mineral parts / inerts, etc. the
output from bio-drying is passed through a (vibrating) screen of 20 mm screen diameter (in case of a
one line plant this will be a graded 20 mm / 60 mm trommel screen like in compost operation).
The fine fraction after biological drying can be further processed through composting or directly used for
various purposes in landfill construction depending on its characteristics and on demand for the
material. The particles greater than 20mm are passed through another magnetic ferrous metal separator
and afterwards through an eddy current separator which will extract the non-ferrous metals. The metals
can be stored separately and directly sent for recycling.
Page 41
39 / 80
The remaining fraction is then passed through a three fraction separating wind sifter that will separate
the light, medium and heavy particles. The heavy particles will mostly be minerals and can be sent for
landfill or for reuse as construction material. The light and medium fractions (potentially secondary fuel)
can optionally be separately processed through optical sorting for removal of high quality plastics (for
recycling), wood and unwanted components like PVC.
The optical sorting along with an additional quality control unit where negative sorting can be
performed manually in an isolated cabin is optional and depends on many factors such as quality
requirement by the RDF buyers, pollutant levels in this waste stream, cost of implementation, etc.
Alternately, the recovered materials from the optical sorting process such as high quality plastics can be
sent for recycling directly.
Page 42
40 / 80
Figure 16: Process diagram for Bio-drying operation
D2D, LS SS
Removal of
contraries
Shredding
Magnetic
Separation
Bio-drying
Vibrating
screen Fine particles
Eddy current
Wind sifting – 3
fraction
separation
Optical sorting/ Quality
control
Light Middle Heavy
Fine Shredding
RDF Landfill Ferrous
metals Non-
Ferrous
metals
For
composting
Magnetic
Separation
<20mm
Recyclables
>20mm
Waste input
Waste Input
Page 43
41 / 80
8.5 Composting (rotting) process
The main objective of this alternative is to separate the (fine) organic fraction of the waste from the
remaining coarse fraction and produce compost and a secondary fuel. The quality of the compost should
be applicable for agricultural purposes or at least for land reclamation purposes. The secondary fuel can
substitute primary fuels in industrial boilers, cement kilns, co-incineration plants, etc. Apart from these
main products, recyclables such as ferrous and non-ferrous metals, high quality plastics and contraries
are separated during the process. The treatment line is designed such that it is easy to switch to the Bio-
drying operation if required. The overview of this process is shown in Figure 17.
The delivered waste is transferred to the bunkers by the waste collection and transfer trucks. There it
can be selectively discharged (on heaps) depending on the type of waste. The first step involves removal
of large contraries such as large batteries (not common in the current waste) by spreading the waste
using a wheel loader or a grab so that larger hazardous components and pollutants are removed before
further processing. These contraries need to be sent to appropriate recycling or disposal facilities. The
waste is then loaded to a shredder that reduces the particle size to about 150 mm. This homogenises the
waste, creates fresh surfaces for the biological process and opens bags. Shredding is also important to
cut the ropes and other similar materials which can entangle the machinery in the MBT. The latter is the
main reason for installing a shredder in this case. Alternately, after the removal of contraries, waste can
be processed through a bag opener instead of shredding. In further progress of the plant design it should
be evaluated, whether the high amount of ropes (remains from garlands, a special property of Indian
waste) requires shredding / such fine shredding or if shredding can be avoided and replaced by a cheaper
bag opener.
The output from the either of the above process is then passed through an over belt magnetic separator
to remove ferrous metals. The recovered metals are stored in separate containers and can be directly
sent to recycling. The waste is then processed through a screen of 60 mm size and the undersize and
oversize particles are transferred to separate conveyors.
The <60 mm fraction is loaded into tunnels using wheel loaders where the waste is composted for about
4-6 weeks and the tunnels are built to such that both composting and bio-drying processes can be
accommodated. During this process, the organics are degraded.
The composting output is transported under a magnetic separator and then an eddy current separator
(currently optional, decision made after detailed calculation of the mass balance) to remove ferrous and
non-ferrous metals that can be separated for recycling. This fraction is then passed through a 3 fraction
separating wind sifter that will separate the light, medium and heavy particles.
Page 44
42 / 80
Figure 17: Process diagram for Composting operation
D2D, LS SS
Removal of
contraries
Shredding
Bag opening
Magnetic
Separation
Composting
Screening 60mm
Magnetic
Separation Magnetic
Separation
Wind sifting – 3
fraction
separation
Light Middle Heavy
Screening
<4mm 20-60mm 4-20mm
Fine
compost Medium
compost Coarse
compost Landfill RDF Non-ferrous
metals
Ferrous
metals
Eddy current
Wind sifting –
3 fraction
separation
Optical sorting/ Quality
control
Light Middle Heavy
Fine Shredding
Eddy current
<60mm >60mm
Recyclables
Waste Input
Page 45
43 / 80
The heavy particles will mostly be minerals and can be sent for landfill or for reuse as construction
material (e.g. for roads on landfills). The middle fraction will be further screened to produce fine
compost (<4 mm), medium compost (4-20 mm) and coarse compost (20-60 mm). The decision for a
4 mm fraction is only based on Indian regulations. Such a fine fraction is not common in other countries
and will cause problems in practical screen operation (closing of screen holes). Deviation from this
screening diameter should be discussed with the authorities due to other purification measures in the
concept (wind sifter). The different grades of compost can be used for different purposes such as in
agriculture, forestry, land reclamation, etc. based on the quality and legislative requirements for its use.
It can also be upgraded with additives for reaching the fertilizer quality. The light fraction from the wind
sifter can be handed to the secondary fuel stream and optionally processed through an optical sorter or
manual quality control as described in the bio-drying section.
The waste fraction greater than 60 mm is transported through a magnetic separator and then an eddy
current separator to remove ferrous and non-ferrous metals that can be separated for recycling. This
fraction is then passed through a three fraction separating wind sifter that will separate the light,
medium and heavy particles.
These fractions can be then be separately processed through optical sorting for removal of high quality
plastics (for recycling), wood and unwanted components like PVC. The optical sorting along with and
additional quality control unit where negative sorting can be performed manually in an isolated cabin is
optional and depends on many factors such as quality requirement by the RDF buyers, pollutant levels in
this waste stream, cost of implementation, etc. Alternately, the recovered materials from the optical
sorting process such as high quality plastics can be sent for recycling directly. The heavy fraction from
the wind sifter can be sent to landfill if it’s mainly inert materials or minerals.
8.6 Construction of the aerobic biological treatment
8.6.1 Process options
To reach best process efficiency and minimise emission, aerobic biological treatment will be done in
closed tunnels / boxes. This can be either done in concrete tunnels or membrane covered tunnel-like
construction. The system decision will be done after cost calculation.
8.6.2 Tunnel processing
This enclosed system permits comparatively accurate control of the biological process by measuring key
parameters like temperature, humidity and oxygen levels in the exhaust air. Process conditions can be
tailored exactly to the stage of decomposition as each tunnel contains material of the exact same age.
The material is turned upon input and removal. The rotting time is short as the parameters can be easily
controlled. Figure 18 shows a tunnel processing unit.
Page 46
44 / 80
Figure 18: Composting tunnels with open doors
Source: Wasteconsult International
8.6.3 Membrane covered processing
Semi-permeable membrane covers (for example GOREtex®) are a hybrid form of tunnel or in-vessel
composting on the one hand, and covered windrow composting on the other. The semi-permeable
membrane cover, which is water-resistant but also permeable to gas and steam, prevents water logging.
The cover and the active aeration it provides should create process conditions under which odours, VOCs
and other emissions are largely contained.
Figure 19: Membrane tunnel system supplied by BioE
Source: Wasteconsult International
Page 47
45 / 80
Figure 20: Membrane cover system supplied by Convaero
Source: Convaero
Investigations published by BGK (2010) demonstrated that the level of emissions from membrane
covered composting plants is equal or often lower than emissions from conventional biofilters.
The BGK documented emissions based upon the installation's degree of encapsulation, as shown in Table
8.
Table 8: Grouping into types of processes in BGK 2010
Abbreviation Type of process variations
V1 Enclosed composting
V2 Partially enclosed composting
V3 Composting under a semi-permeable membrane
V4 Open-air composting of organic waste (biowaste bin) together with green waste
V5 Open-air composting of green waste
It is apparent that the variations within a single process are greater than the variations from one
process to the next (BGK, 2010). The varying emission outputs are plotted in Figure 21 to Figure 26.
Page 48
46 / 80
Figure 21: Average emission factors for ammonia (NH3) in g/t input material from composting
Note: Processes as shown in Table 8 (BGK, 2010)
Figure 22: Average emission factors for nitrous oxide (N2O) in g/t input material from composting
Note: Processes as shown in Table 8 (BGK, 2010)
Page 49
47 / 80
Figure 23: Average emission factors for total carbon (TOC) in g/t input material from composting
Note: Processes as shown in Table 8 (BGK, 2010)
Figure 24: Average emission factors for non-methane volatile organic compounds (NMVOC) in g/t input material from
composting
Note: Processes as shown in Table 8 (BGK, 2010)
Page 50
48 / 80
Figure 25: Average emission factors for methane (CH4) in g/t input material from composting
Note: Processes as shown in Table 8 (BGK, 2010)
Figure 26: Average carbon dioxide equivalents (CO2-eq) in g/t input material from composting
Note: Processes as shown in Table 8 (BGK, 2010)
As MBT (mixed waste) and organic waste composting processes are very similar, it can be assumed that
membrane covers also provide good conditions for the process and emission control of MBT processes. In
fact, membrane covers are applied in several MBT plants (MBT prior to landfill) in Germany and other
European countries. They are successfully applied also in a German MBT plant with biological drying.
Page 51
49 / 80
However, the higher moisture content of Indian waste and the partly lower difference of the ambient
temperature and the temperature in the windrow are more challenging to the membrane process (the
temperature difference is required for water diffusion through the membrane). Currently, two large
MSW biodrying plants (2,000 t/d) are operating in the Mediterranean area (Turkey and southern Italy),
where temperatures are higher than in Germany.
The main advantages and disadvantages of the membrane covered windrows are
+ No (bio) filter required for exhaust air
+ Less waste water
+ Potentially lower costs for operation and construction
- Less durable (e.g. replacement of membranes)
- Longer treatment time due to due to lower air flow
- Higher demand of area due to longer treatment
- Higher risk of leakages
Table 9 compares membrane covered windrows to tunnels.
Table 9: Qualitative evaluation of membrane technologies compared to tunnels
Topic Membrane technologies
Area demand higher
Duration of treatment longer
Amount of wastewater less
Other material streams no change
Process stability less control, more dependent of weather conditions
Staff requirements Equal or more
Energy consumption no change or less
Other operating resources Higher (replacement of membranes)
maintenance no change or less
Investment and capital costs potentially less, but higher area demand
Treatment costs, total costs MBT potentially less
8.7 Exhaust gas treatment
The facility will be enclosed to minimise odour emissions by capturing and purifying exhaust air. Exhaust
air (technically exhaust gas) will be treated by a wet scrubber if required, and afterwards a biofilter. As
much as possible air from the mechanical treatment will be used to aerate the biological treatment
tunnels. In case of using the membrane technology, the exhaust gas from the biological treatment
requires no treatment. The part of the exhaust gas from mechanical treatment, that is not used to feed
Page 52
50 / 80
the biological treatment, requires dust removal, but a smaller biofilter to avoid odour emissions from
waste discharge, bunkers and mechanical treatment would be still recommended.
8.8 Waste water treatment, water balance
Waste water from the process will be used to moisturise the waste in the biological processing. In
general, the aerobic process requires water and loses water on the exhaust air path. Due to the high
moisture content of the waste, a comparatively high air throughput will be applied. For intermediate
storage, a process water buffer tank is considered.
8.9 Plant dimensions
The West Zone of Bangalore produces 267,000 t of waste annually. This could either be treated in a
large two line facility, or in 2-3 smaller, decentralised units. The decentralised option will be more
expensive in construction and operation, but may reduce costs and effort for collection (transfer) and
transport. In this project, a 91,000 t/a unit is recommended for initial evaluations. That means that
the total amount of money spent initially will be less. More important, it allows verifying assumptions
and obtaining locally full scale operational experience, before spending money for the treatment of the
total amount of waste. In opposite to a larger plant, setting up two process lines would be too expensive
as there is machinery available that can cover this amount with just one line. The mode of the Plant
(machine sequence and operation mode of the biological treatment) can be switched between rotting
(composting) and biological drying. The MBT plant will separate the biological and mechanical processes
in different halls, in order to optimize the aeration management, to maintain fire and safety standards
and to keep the plant design flexible to changing framework conditions.
8.10 Mass balance and properties of the output fractions
8.10.1 Operation mode
The MBT plant's design is based upon the following framework data:
Delivery volume: 91,000 t/a of municipal solid waste (Door-to-Door (D2D) collection, litter spots
(LS) and street sweeping (SS), 50%:30%:20%)
Daily throughput: 249 t/d
Delivery time: 365 d/a, 16 h/d
Time of operation: 365 d/a, 14 h/d (2 shifts per day)
Maintenance during operation (if possible) or at night shift / end of day shift.
8.10.2 Moisture in Bangalore waste
The study is based upon a waste composition of Door-to-Door (D2D) collection, litter spots (LS) and
street sweeping (SS) of 50%:30%:20%. The moisture contents shown in Table 3 would lead to an overall
moisture content of round about 43 mass-% related to the wet matter. This low moisture content might
be explained due to moisture loss (drying at warm air temperature) during the waste sorting process in
the waste characterisation study. Based on our experience, the overall moisture content of that kind of
waste will be between 50 and 55% or even more. Hence, we did not use the moisture values from the
waste characterisation study and set (increased) the expected moisture content to 50 %.
Page 53
51 / 80
The study estimates an average loss on ignition (oDM) of 37 % in relation to fresh mass. The level of
inert material (mDM) averages 13 % (Figure 27).
The relative high water content (compared to central European waste) requires a customised treatment
concept for the MBT facility. The study takes this factor into account both from a technical and design
standpoint.
Figure 27: Moisture, Organic dry matter (oDM) and mineral dry matter (mDM) in Bangalore waste
8.10.3 Calorific value in Bangalore waste
The waste analyses reveal a gross calorific value averaging 8.1 MJ/kg for waste composition of Door-to-
Door (D2D) collection, litter spots (LS) and street sweeping (SS) of 50%:30%:20% (see chapter 2.6).
Based on this the following estimations presume a lower calorific value of the input waste averaging 7.0
to 7.5 MJ/kg.
8.10.4 Size distribution of Bangalore waste
For the size distribution of the waste input to the MBT-plant see chapter 2.2.
According to the process concept after removal of contraries pre-shredding of the delivered waste is
presupposed. By this, the size distribution is shifted to a higher portion of small particles. As
consequence the fraction < 60 mm from the first screening step (while composting operation) will
be significantly higher than estimated based on the size distribution of the non-shredded waste.
The data for the non-shredded waste lead to a portion < 60 mm of approx. 55 %. For the shredded
waste a higher level of 65 to 70 % is assumed for mass balancing.
moisture50%
inerts (mDM)13%
oDM37%
Page 54
52 / 80
8.10.5 Mass balance and output qualities
Material streams and mass balances were calculated for the two MBT operation concepts based on the
waste composition (Figure 28 andTable 10):
Figure 28: Calculated mass balances of MBT
Table 10: Mass balance of MBT (output)
Output t/y Composting operation Bio-drying operation Use/discharge
Contraries 400 400 Waste incineration
metals (ferrous and non-ferrous) 300 300 recycling
RDF middle 22,300 19,700 Thermal utilization
RDF light 9,800 5,500 Thermal utilizsation
Compost < 4 mm 4,600 - Agricultural utilization
Compost 4-20 mm 11,000 - Agricultural utilization
Compost 20-60 mm 2,800 - Agricultural utilization
Fine fraction (dry) for composting - 18,300 Composting (agricultural utilization)
or landfill
Solid residues (heavy fraction) 5,300 2,200 landfill
Mass and water loss 34,500 44,600 Exhaust air treatment, atmosphere
Total 91,000 91,000
contraries1%
metals0%
RDF (middle + light)
35%
compost(0-60 mm)
20%
landfill fraction
6%
wastewater0%
mass and water loss
38%
Composting
contraries1%
metals0%
RDF (middle + light)
28%
finefraction for
composting20%
landfill fraction
2%
wastewater0%
mass and water loss
49%
Bio-drying
Page 55
53 / 80
In the Bio-drying mode nearly 100 % of incoming waste passes through the drying process (2-3 weeks
in tunnels) with a target water content of 20 % (average) after drying. In the Composting mode the
treatment time is estimated to 4 weeks in tunnels (intensive rotting) and subsequent 4 weeks post-
rotting (maturation). Ca. 68 % of incoming waste (fine fraction < 60 mm) pass through the biological
part of the composting process. The water content in the output of post-rotting averages ca. 30 %.
It is assumed that generation of wastewater has to be avoided during regular plant operation. To fulfil
this requirement, comparatively high amounts of air are needed in the biological process.
When looking at the mass balance, special attention should be paid to how the high amounts of water
in waste are handled. For this purpose mass flow according to the concepts for plant operation is
estimated and examined in more details (Figure 29 and Figure 30):
Page 56
54 / 80
Figure 29: Calculated mass flow for composting operation
Input91,000 t/y = 100%
mass and water loss37,9%
Mechanical treatment (MT) I
Composting
coarse fraction31,6%
24,5%
heavy fraction (0- 240 mm) to landfill 5,8%
RDFmiddle24,5%
RDFlight
10,8%
Contraries
Fe-metals
Fe-metals
NE-metals
0,5%
0,2%
0,1%
(Option:Recyclables)
fine fraction < 60 mm67,6%
output of rotting29,7%
MT II
compost < 4 mm 5,0%
compost 4-20 mm 12,1%
compost 20-60mm 3,0%
Option: Optical sorting + fine shredding
MT II
0,8%
Page 57
55 / 80
Figure 30: Calculated mass flow for bio-drying operation
The authors' own models for biological degradation, including air, water and heat balances, were drawn
on to calculate the expected average breakdown of water content, loss on ignition (oDM) and inert
materials (mDM) from incoming waste into the resulting material streams for the evaluated MBT
techniques. Due to remaining uncertainties in waste composition and normal seasonal variations of
waste characteristics estimated values are given as ranges (Table 11):
Input91,000 t/y = 100%
mass-loss49%
Mechanical treatment (MT) I
Biological drying
50,2%
Screening20 mm
fine fraction < 20 mm20,1%
30,1%
MT II
heavy fraction (20- ~240 mm2,4%
RDFmiddle21,6%
RDFlight6,0%
to landfill 21,6%6,0%
Contraries
Fe-metals
Fe-metals
NE-metals
0,5%
0,2%
0,1%
(Option:Recyclables)
Option: Optical sort. + fine shred.
Page 58
56 / 80
Table 11: Characterization of MBT-output
Input/output streams Dry matter content
[% of OM]
Organic dry matter
content
[% of DM]
Lower calorific value
[MJ/t]
Waste input 50,0 74,7 7,000-7,500
Both operation concepts
Contraries 55-65 70-80 10,000-13,000
metals (ferrous and non-ferrous,
incl. impurities)
90-100 0-20 0-4,000
Composting operation
RDF middle 50-60 75-85 9,000-13,000
RDF light 60-70 80-90 11,000-14,000
Compost < 4 mm 65-75 40-50 4,500-6,500
Compost 4-20 mm 60-70 60-70 5,500-7,500
Compost 20-60 mm 70-80 60-70 7,500-9,500
Solid residues (heavy fraction) 65-75 30-40 3,500-5,000
Bio-drying operation
RDF middle 75-85 75-85 13,000-17,000
RDF light 80-90 80-90 16,000-20,000
Fine fraction (dry) for composting 70-80 50-60 6,000-8,000
Solid residues (heavy fraction) 80-90 35-45 4,500-6,000
It is especially noticeable that the RDF fractions from composting operation have a higher water content
compared to bio-drying operation. This results in a higher proportion of mass and a lower calorific value.
8.10.6 Energy balance
The annual calorific load is calculated at ca. 185,000 MWh/a assuming an average lower calorific value
of ca. 7,300 MJ/t for incoming MSW. The following image shows how this breaks down into material
streams for the MBT operation modes evaluated here (Figure 31):
Page 59
57 / 80
Figure 31: Calculated energy balances of MBT
The estimated combinations of mass breakdown and energy content in the output streams lead to nearly
identical energy breakdowns for Composting and Bio-Drying operations. The main difference between
the operation modes is, that output fractions from bio-drying are drier compared to composting. Hence,
total mass of RDF from bio-drying is significantly lower and calorific values are higher.
8.10.7 Biological treatment and wastewater
The balance for bio-drying and for the first composting step (“intensive rotting”) is based upon an
enclosed and completely encapsulated tunnel process with air recirculation. Any exhaust air from the
process is collected by pipes and treated by air scrubbers and biofilters and then discharged to the
atmosphere.
Exhaust air from the process will be largely water-saturated and most of the water will leave the
process as steam with the exhaust air. Transporting and treating exhaust air effects cooling of the air.
However, cooling of exhaust air might generate some condensate, depending on weather conditions,
amount of process air and water content of waste input. This condensate has to be collected in the
process water system. Assuming high amounts of process air, during regular operation the collected
contraries1%
metals (incl. impurities)
0%
RDF (middle + light)
62%
compost(0-60 mm)
18%
landfill fraction
3%
energy loss16%
Composting
contraries1%
metals0%
RDF (middle + light)
62%
fine fraction for
composting19%
landfill fraction
2%
energy loss16%
Bio-drying
Page 60
58 / 80
water can be completely fed to the tunnel process again and no excess of process water has to be
discharged or treated as wastewater.
In addition, other techniques for bio-drying or composting allow exhaust air from the process to be
released into the environment without treatment by virtue of membrane cover filtration (membrane
techniques). However, if odour emissions have to be considered carefully, also for membrane techniques
a housing and exhaust air capture and treatment might be necessary due to emissions during windrow
turning. Depending on climate, at least a roof can be required for membrane processes for protection
against rain for example.
For composting operation a post-rotting process is necessary in addition to intensive rotting to produce
mature compost. For post-rotting triangular windrows turned by a windrow turner (see above) are
considered in a closed hall with exhaust air capture. Design of housing and air management for the
post-rotting process mainly depends on local requirements concerning odour emissions. Instead of a
closed hall a roofed area without exhaust air capture also can be an adequate solution. Alternatively
membrane technique can be used for post rotting, too.
8.10.8 Exhaust air
Fresh air is basically used to provide a healthy environment for the workers and to conduct heat and
moisture out of the waste. In order to fulfil those functions, big amounts of air will be required.
Therefore we calculate approx. 60,000 m3/h for reception, mechanical treatment and tunnel hall, and
another 90,000 m3/h for post-rotting.
Considering reutilization of not water saturated exhaust air from all waste treatment phases (reception,
mechanical treatment and biological treatment) we expect air exchange-rates of up to 2 times per hour
in reception, mechanical treatment and tunnel hall, and of 1.5 times per hour at post-rotting. Depending
on operation intensity, air exchange-rates can be switched to a lower level in post-rotting and to a
higher level in reception, mechanical treatment and tunnel hall. The exhaust air finally treated and
released to the environment amounts to approx. 150,000 m3/h. Figure 32 pictures a basic concept of the
air flow management in Bangalore.
Page 61
59 / 80
Figure 32: Concept of exhaust air flow
MT
II
30,0
00 m
³/h
Re
ce
pti
on
+ M
T I
Tu
nn
el h
all
Po
st-
rott
ing
60,0
00 m
³/h
Bio
filt
er
I
fresh
air
fresh
air
ded
uste
r
ded
uste
rT
un
ne
l pro
ce
ss
fresh
air
fresh
air
acid
scru
bb
er
acid
scru
bb
er
Bio
filt
er
II
60,0
00 m
³/h
90,0
00 m
³/h
75,0
00 m
³/h
75,0
00 m
³/h
atm
osp
here
150,0
00 m
³/h
150,0
00 m
³/h
ven
tila
tor
Exh
au
st
air
treatm
en
t
Op
tio
n:
byp
ass f
or
Bio
-dry
ing
op
era
tio
n
Page 62
60 / 80
8.11 Area and infrastructural demand
8.11.1 Area demand
The area demand for both concepts of MBT operation was estimated approximately based upon a rough
design concept and key figures (Table 12).
Table 12: Estimated area demand
Area demand in m2 Composting operation Bio-drying operation comment
Reception + Mechanical treatment I
(MT I)
1,800 1,800 Closed hall
Intensive rotting or biological drying
(tunnel process)
5,700 5,700 Closed hall
Post-rotting (triangular windrows) 6,000 - Closed hall or roofed area;
Post-rotting is not required
for Bio-drying operation
Mechanical treatment II (MT II) (incl.
loading of output)
3,000 3,000 Closed hall
Exhaust air treatment 2,500 2,500 Paved area
Auxiliary buildings 100 - 200 100 - 200 Control room, Repair shop,
social rooms as required
Sum Buildings 19,200 13,200
Infrastructure, transport 14,500 12,100 Mainly paved area
Total MBT 33,700 25,300
The differences between the two options are essentially linked to the fact that composting operation
requires additional space for post-rotting. The total area demand without post-rotting is identical,
assuming that switching between both modes of operation shall be possible.
The total area demand including infrastructural installations is estimated to ca. 34,000 m2 for
composting operation and ca. 26,000 m2 for biological drying. Hence area needed for post-rotting can
be estimated to ca. 8,000 m2.
For the plant layout main and auxiliary buildings are arranged in one possible configuration (optimized
for process flow and area demand). Areas for technical equipment that can be located outside are also
considered and necessary ways and areas for container handling, transportation and parking are
included.
The configuration and footprints of buildings can be varied and presumably have to be varied during
further planning steps according to local conditions and modifications in project tasks.
The proposed plant layout is shown in Figure 33 to Figure 35.
Page 63
61 / 80
Figure 33: Overview of the proposed plant layout MBT (incl. post-rotting / maturation)
Page 64
62 / 80
Figure 34: Layout waste reception and mechanical treatment
Page 65
63 / 80
Figure 35: Layout biological treatment
Page 66
64 / 80
8.11.2 Infrastructural demand
Table 13 below summarises the main requirements for MBT in terms of external infrastructure
(interfaces):
Table 13: Infrastructural demand / interfaces
Interface Composting
operation
Bio-drying
operation
Comment
Access to road, scales for trucks X X
Check for hazardous waste and separation
(prior to entering MBT-process) X X
Power supply (MV) ca. 1.5 MW ca. 1.5 MW
Cont. access to landfill capacity ca. 5,300 t/y ca. 2,200 t/y
Cont. access to incineration capacity (RDF) ca. 32,100 t/y ca. 25,200 t/y
Incineration capacity for hazardous waste
and contraries X X
Cont. access to composting capacity - ca. 18,300 t/y For fine fraction from Bio-drying
(altern. landfill)
Cont. access to compost utilization ca. 18,400 t/y -
Discharge of rainwater X X
Discharge or treatment of wastewater (-) (-) Excess of process water may occur
at unfav. operation conditions
Diesel supply (filling station) X X
Drinking water supply X X
Fire water supply X X
Access to public data/phone network X X
Emergency power supply X X recommended for tunnel process
Compared to composting the bio-drying process yields a lower mass of high-calorific material and a
smaller quantity of residues to be landfilled (assuming that fine fraction from bio-drying can be placed
in a composting plant).
Post-rotting as part of composting operation includes a windrow turner and a wheel loader. Active
aeration of the triangular windrows is normally not necessary subsequent to 4 weeks of intensive
rotting. Hence the post-rotting process is planned without process aeration. Due to this, power
consumption of post-rotting can be seen as nearly negligible.
For both concepts an emergency power supply is recommended to operate crucial processes (aeration of
tunnel process) in case of power breakdown.
Page 67
65 / 80
8.12 Machine equipment
The description of the main processes is given in previous chapters. Details of the proposed process
equipment are shown in Table 14.
Table 14: Main process equipment – Reception, MT I and MT II
component location number Throughput
Composting operation
Throughput
Bio-drying operation
Grab excavator Reception 1 18 t/h 18 t/h
Wheel loader Reception 1 18 t/h 18 t/h
Pre-shredder Reception 1 18 t/h 18 t/h
Box-feeder Reception 1 (reserve) (reserve)
Magnetic separator MT I 1 18 t/h 18 t/h
Drum screen MT I 1 18 t/h -
Vibrating screen MT II 1 6 t/h 9 t/h
Magnetic separators MT II 3 (2)* 6 t/h (each) 6 t/h (each)
Eddy current separators MT II 2 (1)* 6 t/h (each) 6 t/h (each)
Wind sifter MT II 2 (1)* 6 t/h (each) 6 t/h (each)
Compost screen MT II 1 4 t/h -*
Dust filter MT II 1 ca. 30,000 m3/h ca. 30,000 m3/h
Ventilator (hall) MT II 1 ca. 60,000 m3/h ca. 60,000 m3/h
*for bio-drying operation the compost-line is not in use
Table 15: Main process equipment – Optional components MT II
component location number Throughput
Composting operation
Throughput
Bio-drying operation
NIR-Sorter (optical sorting) MT II 2 5 t/h (each) 5 t/h (each)
Manual sorting boxes MT II 2 3 t/h (each) 3 t/h (each)
Fine shredder MT II 2 5 t/h (each) 5 t/h (each)
Page 68
66 / 80
Table 16: Main process equipment – Intensive rotting/Bio-drying and post-rotting
component location number Throughput
Composting operation
Throughput
Bio-drying operation
Tunnel-composting, tunnels Intensive rotting/
bio-drying 18
Treatment time: 4
weeks;
max. 450 m3 waste per
tunnel
Treatment time: 2-3
weeks;
max. 450 m3 waste per
tunnel
Tunnel-ventilators Intensive rotting/
bio-drying 18
max. 15,000 m3/h
(each)
max. 15,000 m3/h
(each)
Processwater storage Intensive rotting/
bio-drying 1 Capacity: ca. 200 m3 Capacity: ca. 200 m3
Wheel loader Intensive rotting/
bio-drying 1
Input: 12 t/h
Turning: 20 t/h
Output: 7 t/h
Input: 18 t/h
Turning: 15 t/h
Output: 9 t/h
Box-feeder Intensive rotting/
bio-drying 1 7 t/h 9 t/h
Ventilator (hall) Intensive rotting/
bio-drying 1 ca. 60,000 m3/h ca. 60,000 m3/h
Dust filter Intensive rotting/
bio-drying 1 ca. 60,000 m3/h ca. 60,000 m3/h
Post-rotting
(8 triangular windrows) Post-rotting
Treatment time: 4
weeks;
max. 550 m3 waste per
windrow
-
Windrow turner Post-rotting 1 (max.) 4,000 m3/h -
Wheel loader Post-rotting 1 40 t/h (input + output) -
Box-feeder Post-rotting 1 6 t/h -
Ventilator (hall) Post-rotting 1 ca. 90,000 m3/h -
Table 17: Main process equipment – Exhaust air treatment
component location number Throughput
Composting operation
Throughput
Bio-drying operation
Acid scrubber Exhaust air treatment 2 ca. 75,000 m3/h (each) ca. 75,000 m3/h (each)
Ventilator Exhaust air treatment 2 ca. 75,000 m3/h (each) ca. 75,000 m3/h (each)
Biofilter Exhaust air treatment 2 ca. 75,000 m3/h (each) ca. 75,000 m3/h (each)
Compared to bio-drying, composting operation needs some more equipment especially for post-rotting
and for screening (MT I and II).
8.13 Costs
8.13.1 Estimation of investment costs
The estimated costs are net costs as EURO (€) without tax, including design, construction,
commissioning, instruction, test operation, regular documentation and common warranties.
Following costs are not included:
Costs for area
Costs for land development outside of the plant area
Page 69
67 / 80
Costs for special foundation measures (due to abnormal ground quality or seismic risks)
Costs for waste incineration
Remark to cost estimation
The cost estimations are based on:
Executed projects of equivalent plants in Central Europe
Costs investigated in studies of central-European waste treatment plants
Reference facility information of suppliers
Costs for hall constructions approaching to Indian prices (2,000 Rs. per square feet or 287 €/m2
respectively)
With regard to the available information we increased the confidence of the estimated costs. However
because of ongoing development of market and maybe regional differences there is still a significant
uncertainty. Rising of material prices, increasing demand and limitation of suppliers capacities might
cause exceptional rising of prices.
8.13.2 Investment costs
Preliminary estimation of investment costs includes buildings, machine technology, electrical equipment
(power supply and automatic control system), vehicles for internal transport, outside facilities, costs for
planning and commissioning by a general contractor (Table 18). Ancillary construction costs and costs of
financing are not considered.
The investment costs are calculated including a post-rotting step for composting operation and
considering the option to switch between composting and bio-drying operation with very low effort. All
technical equipment for both operation modes is included. Also included are the costs for the required
building area for optional components in mechanical treatment (optical sorting, fine shredding, quality
control).
The additional machine and electrical equipment for the optional components is considered separately
(see last line of Table 18).
Page 70
68 / 80
Table 18: Investment costs MBT in Euro (composting operation)
Investment costs [€] Machine
equipment
(normal strain)
Machine
equipment
(high strain)
Electrical
equipment
Buildings Vehicles
Reception/Mechanical
treatment 2,738,000 347,000 463,000 1,541,000 576,000
Tunnel process (intensive
rotting or biological drying) 1,708,000 - 275,000 4,641,000 157,000
Post-rotting (only for
Composting) 386,000 - 39,000 1,260,000 473,000
Exhaust air treatment 1,478,000 - 148,000 504,000 -
Outside facilities 1,087,000
Planning and commissioning
(General contractor) 664,000
Total MBT 18,485,000
thereof Post-rotting 2,158,000
Additional investment costs
for optional components 1,839,000
The total investment costs (w/o optional components) result in specific investment costs of ca. 203 €/t.
This is at the lower end of comparable plants in Central Europe, mainly due to hall construction costs,
which we have calculated approaching to Indian prices. Regarding machine technology, quality
equipment is considered based on Central European price level.
In principle it has to be stated, that delivery time and time of plant operation (7 days per week, 2 shifts)
are comparatively long in relation to amount of incoming waste. Hence low treatment capacities and
throughputs of machine equipment are needed in the present case. This leads to higher investment costs
specific to throughput, because specific investment costs of machine equipment are higher for
equipment with low throughput. Regarding total costs, a shorter time of plant operation combined with
higher throughputs of machine equipment might save costs.
8.13.3 Investment costs of membrane technique
For Bio-drying operation, instead of 2-3 weeks biological treatment in tunnels, 4 weeks treatment with
membrane technique can be an alternative. Due to expected odour emissions during windrow turning,
housing is calculated for the required area for a concept with membrane technique (approx. 8,000 m2,
rough estimation based on supplier data). Combined with investment costs for process technology, Bio-
drying by membrane technique might save 10 to 15 % of investment costs of total MBT in the present
case.
For Composting operation 9 weeks treatment with membrane technique and a required area of approx.
12,000 m2 were specified by the supplier. Taking into consideration additional costs for housing total
MBT investment might be up to 20 % lower compared to the conventional concept described above (4
weeks of intensive rotting in tunnels + 4 weeks post-rotting using triangular windrows). It has to be
mentioned, that membranes have to be replaced after a few years of operation.
However confidence in the estimated costs of membrane technique is not as high as for conventional
techniques, due to lack of own data from realized membrane projects.
Page 71
69 / 80
8.13.4 Staff and operation resources
Required staff
For operation and maintenance of the MBT-plant several efforts have to be considered. Due to operation
time (see above) for estimation of the required staff operation with 2 shifts at 7 days a week has to be
taken into account. Normal working time in India is set to 5 days per week and 9 h/d.
Replacement for holidays and illness is not considered in the following estimation. For MBT-plants in
Central Europe replacement is calculated as additional 15 to 30 % of required staff.
Table 19: Staff requirement
function Composting
operation
Bio-drying
operation
comment
Plant manager 1 1
Shift manager 2 2
Operators (mechanic, electrician etc.) 8 8
Drivers 13 10
Helpers 6 6
Total 30 27 w/o replacement, w/o options
Optional: Helpers for manual sorting/quality
control 6 6
Operation resources and maintenance
Electrical power and Diesel are the most important operation resources for the described MBT concept.
Diesel and tap water consumption are significantly lower for bio-drying operation compared to
composting operation.
Table 20: operation resources (consumption)
resource
(specific values per t of waste
input)
Composting operation Bio-drying operation comment
Power (electricity) ca. 45 kWh/t ca. 43 kWh/t
Diesel ca. 2.0 l/t ca. 1.3 l/t vehicles
Tap water (maybe rain water, if
available) ca. 0.1 m3/t ca. 0.03 m3/t
biological process
Sulfuric acid ca. 0.003 m3/t ca. 0.003 m3/t exhaust air treatment
Oil, grease etc. 0,02 kg/t 0,02 kg/t
miscellaneous - -
Add. 10 % of costs for operation
resources
In German MBT-plants exhaust air treatment often includes RTO-technology (regenerative thermal
oxidation) to reduce emissions according to legislation. In this case significant amounts of natural gas or
biogas are needed as additional resource. For the present exhaust air treatment concept just using
biofilters gas supply is not necessary.
Costs for maintenance can be defined by specific values for installation. The factors depend on the kind
of equipment, operation time and intensity of wear and tear:
Page 72
70 / 80
Table 21: specific values for maintenance (% p. a. of investment costs)
equipment value
Mechanical equipment normal strain 4-5 % p. a.
Mechanical equipment high strain 8-10 % p. a.
Electrical equipment 2.5-4 % p. a.
Vehicles 10-15 % p. a.
Buildings 1-1.5 % p. a.
Outside facilities, infrastructure 0.5 % p. a.
Page 73
71 / 80
9 Health and safety
9.1 Introduction
This chapter describes the health and safety requirements of the MBT system for the city of Bangalore
and its equipment. It does not intent to be a full risk assessment; therefore that document has to be
prepared separately during the project execution.
These sections refer mostly to technical aspects that help in fulfilling the health and safety
requirements. It also contains structural and technical specifications derived from the equipment’s
safety requirements.
Organizational aspects and safety obligations are mentioned if relevant. The operation manual should
contain a complete description of them.
The health and safety concept assumes that only qualified employees will be part of the operation. This
concept follows international standards while accounting for Indian regulations.
9.2 Risk Assessment
Treatment of solid waste using MBT processes and the handling of different kind of residues including
biological waste represents a potential risk to the health and safety of employees.
The most important risks related to the operations are:
Health risks due to the potential exposure to airborne dust and bio-aerosols. During standard
operations, the exposure is low; however during maintenance and cleaning it increases. This
kind of exposure can arise mostly during reception of waste.
Health risk due to handling of hazardous waste and materials.
Risk of injuries in manual sorting or quality control cabins, due to the presence of sharp objects
in waste
Exposure to electromagnetic fields
Accidents related to heavy doors and gates, uncovered mobile equipment parts and conveyors
Explosion risk due to the presence of dust
Pollution risk due to the use of water polluting substances e.g. Diesel
Accidents caused by traffic within the facilities
9.3 Prevention measures
9.3.1 Measures in the facilities
9.3.1.1 General
The facility should be built in a way that, risks are prevented and controlled as much as possible. The
proper design and operation of the process minimizes the issues related to health and safety. For
reducing and avoiding the risks mentioned in the previous section, the following actions are planned:
Page 74
72 / 80
9.3.1.2 Reception and storage
In the reception gate, a radioactive radiation detector should be placed to reduce the risk of radioactive
materials entering the facility / process and the final products.
The bunkers have to operate under the principle of First in- First Out, in order to prevent the occurrence
of anaerobic processes in the waste on stock.
For the unloading process of waste into the bunkers, a full guideline has to be prepared. This guideline
should contain a description of the safe procedures and proper conduct.
9.3.1.3 Ventilation and exhaust air system
In all the buildings, a ventilation system should be installed. Depending on the conditions of each stage,
the air exchange rate is defined. Table 22 shows common exchange rates in different sections of MBT
plants:
Table 22: Common air exchange rates for the ventilation system
Location/Hall Air exchange rate per hour
Reception 1.5 - 2
Bunker Hall 1.5 - 2,5
Sorting cabins 10
Mechanical separation and sorting 1.5 - 3
Stabilization, composting and loading hall 15
Storage for secondary fuel 1.5 - 3
Depending on detailed engineering, final construction and machinery details, these rates may vary in the
final MBT plant. For the locations with a higher potential of air pollution e.g. Shredder or screens, a
separated extraction unit is installed. The exhaust air coming from the equipment is not part of the
exchange rates. A forced ventilation system working with fresh air should be installed in manual sorting
cabins. This prevents the contact between employees and harmful substances. Both extraction and
ventilation systems need to be constantly monitored; flowmeters and manometers are appropriate
control instruments. In case of a failure, visual and acoustic indications should appear. An air treatment
system should be installed for cleaning the polluted air coming from the extraction and ventilation unit
in the facilities. This system can consist of a wet scrubber and a biofilter. In this section, emergency
showers and eyewash station are mandatory due to the presence of corrosive / acidic substances. These
stations have to be in accordance with the Indian standard IS 10592.
9.3.1.4 Changing rooms
In order to isolate the elements that have been in contact with the waste and potential polluted
environment, a special room should be provided. The design should follow the concept of black-white
system.
The room should allow the employees to keep their street clothes separated from their work ones; these
two sections must be connected through a lavatory. The lavatory should be equipped with showers, soap
and hand disinfectant dispensers.
Rooms with other purposes e.g. break or meeting rooms should be located before the changing room.
Page 75
73 / 80
9.3.1.5 Equipment and machinery
All the installed machines must have an identification number according to the regulation, as well as a
quality certificate issued by the manufacturer.
In addition all the installed machines should have an emergency stop switch. Once the switch is
activated, the correspondent conveyors upstream are stopped along with the machine. Depending on the
case, a specific emergency stop sequence should be activated. Especially for those machines with
moving parts or elements which cannot be completely covered, the emergency stop switch must be
located in easily accessible places.
9.3.1.6 General measures
Adequate and frequent lighting at all the work stations and paths should be guaranteed.
All the platforms for both standard operation and maintenance activities must be designed and built
such that they provide the safest possible environment. They should contain non-slip areas on their
surface to prevent accidents. In order to access those, ladders and stairways must be planned
accordingly. The design of platforms and working surfaces should follow the subpart D of the OSHA
1910 standard.
Pits and all equipment underground should have enough protection and warning signs to avoid
accidents. A vaccination scheme against tetanus and hepatitis A and B is highly recommended.
Additionally, a good hygiene practices manual should be generated. Cleanliness is an important factor
for health and safety in waste treatment facilities. Dust and dirt removal from machinery, stairs, ladders
and floor is a daily task.
9.3.2 Personal Protective Equipment (PPE)
9.3.2.1 General
The use of PPE is crucial for reducing the risks within the facilities; however it is a secondary measure
that complements the design considerations and safety precautions. PPE is used as protection against
risks that cannot be minimized by other means. Employee must be trained to use PPE.
The PPE should fit perfectly to each employee. Otherwise it may be as risky as not wearing anything at
all.
9.3.2.2 Standard Operation Condition
A standard PPE contains feet, ears eye, head, hands, and body protection. Safety boots with a steel toe
cap are the appropriate footwear. Feet protection has to be worn at all time. For hearing protection, ear
plugs or ear muff should be provided. They have to assure the noise levels permitted by the regulation
(Standard OSHA 1926.52 and OSHA 3074 guideline). Frequent cleaning and change is suggested. This
kind of PPE is highly recommended when working near to the shredder, conveyors, screens, wind sifters,
composting halls etc.
Goggles are the best option for eye protection. They should have enough impact resistance and can be
adapted to prescription glasses. Eye protection has to be worn at all time. For protecting the head, an
impact resistant helmet is advised.
Page 76
74 / 80
In the case of hand protection, needle resistant gloves are mandatory especially in the manual sorting
cabin, aiming to protect the employees from possible injuries caused by sharp objects. This kind of gloves
is also suggested whenever waste is handled. In laboratory work and during sampling, nitrile gloves are
appropriate.
For body protection, as mentioned in the section 9.3.1, only work clothes are necessary. Extreme
weather conditions (high temperatures) have to be taken onto account when selecting the clothes. High
visibility clothes are recommended especially at night shifts and for traffic areas. The OSHA 3151-12R
guideline contains all the information regarding to selection of PPE according to the existing standards.
9.3.2.3 Additional PPE, special situations
In case of special conditions in the facilities, an additional set of PPE should be available for the
employees. As mentioned above, the main risk in the plant is under the presence of polluted air,
therefore during cleaning and maintenance face masks are mandatory to worn. For emergencies and
special situations, respiratory protection is needed. Simple filtering respirators are a good option. The air
is filtered during inhalation thus the exposure to the pollutants is minimized. Depending on the device
and the hazardous substances, the filters can be interchangeable and have to be replaced within a
certain period. The OSHA 3079 guideline contains all the information related to selection of respiratory
protection according to the existing standards.
9.3.3 Information, instruction and training
All the relevant health and safety information should be provided to the employees, so that they can
comply with all the established procedures and measures. The associated documents have to be
available every time for consultation. Safety signs have to be displayed in the locations where there is a
risk for the employees. The marked risks are the ones that could not be controlled by prevention
strategies and have to be dealt with. The safety signs should be in accordance with the standard IS
9457. As a complement of all the measures mentioned above, it is crucial to establish a training program
for the employees. At least one information session should be organized every year. The training should
also aim to promote a positive attitude towards the safety, and therefore safer work environment.
A comprehensive list of topics has to be compiled taking into account the regulation and legal
requirements. The appendix E of the OSHA 1910.120 standard gives a complete overview of a site-
specific training.
9.3.4 Protection against external risks
Around the facilities, adequate fencing should be built and it should have continuous surveillance. The
establishment of a buffer zone in accordance to the correspondent regulations of the Indian Ministry of
Environment and Forest must be considered. Additionally, a minimum distance to housing areas of 500m
should be kept. In addition to the vehicles that belong to the company, only vehicles for charging and
discharging of material should be allowed within the facilities.
Page 77
75 / 80
9.4 Safety in the facility
9.4.1 Instrumentation and control (I&C) protection measures
To avoid the occurrence of dangerous operation states due to the failure of the regular I&C devices, a
safety I&C system has to be implemented for the most risky equipment. The safety I&C system has to be
highly reliable and safe. Two different strategies can be used for the implementation of the safety I&C;
either a redundant wiring network or separated control system can be used. In case of an energy outage,
the safety I&C system must go to safe operation states or must be connected to the emergency power
supply. In case of a failure of any of the instruments, they should turn off and an alarm should be
triggered. Frequent maintenance and verification is compulsory for all I&C devices; specialized personal
has to conduct those actions.
9.4.2 Emergency stop system
An emergency system for the facilities should be planned. The main tasks of this system are to switch off
all the necessary machines and turn on all the relevant alarms. The system should be initiated manually
using emergency stop switches. These switches have to be placed in easily accessible locations e.g.
emergency exits and exit routes. After initiation of the system, the responsible person has to be
informed about the type and extent of the situation and at the same time, he/she has to establish a
contingency plan and take measures to safeguard the employees. An emergency action plan should be
generated in accordance with the requirements established in the OSHA 1910.38 standard.
9.4.3 Emergency power supply
In case of a power outage, the machines that must continue operation have to be connected to an
auxiliary power source. The machines that are automatically able to go into a safe condition after an
outage do not need to be connected to the auxiliary source. The auxiliary system consists of a UPS
(Uninterruptible Power Supply), which is responsible for the energy supply of the control system and the
small machinery. In addition to this, a standby generator e.g. Diesel generator must be available within
the facilities. This system must allow a safe stop/shut down of the plant as well the alarm and safety
systems to come into operation. In addition to that the signals for the exit routes, they should have
illumination signs powered by batteries. When an outage occurs, an indication (visual or acoustic) must
be given along with a notification of the incident.
9.4.4 Other measures
Due to the risk of ejection of particles from the shredder, it is not allowed to stay close to this area
during operation, without a plausible reason. In case of visitors, all the pertinent safety measurements
have to be presented to them before entering to the plant, additionally the appropriate PPE have to be
provided (helmet and googles). During the visit, the visitors should not be allowed to go anywhere in the
plant without supervision.
9.5 Explosion protection
The explosion risk due to the presence of dust is the highest in the air treatment process; especially in
the dust filtration stage.
Page 78
76 / 80
The ATEX (atmospheres explosives) directive 94/9/EC suggests the delimitation of different zones
depending on the frequency and probability of occurrence of an explosion event. The directive specifies
the appropriate electrical equipment that has to be installed depending on the zone. Table 23 shows the
zones and their description:
Table 23: Zone classification according to the EU directive 94/9/EC
Zone Type of danger Description Equipment
Group
Equipment
Category
20 Constant Permanent occurrence of dust II 1
21 Potential Intermittent occurrence of dust II 2
22 Minor Unlikely occurrence of dust or for
short periods
II 3
The Indian PESO (Petroleum and Explosives Safety Organization) approves the ATEX scheme for the
selection of equipment to be installed within hazardous areas. The input of raw gas to the filter is
classified in the zone 20, the dust conveyors in the zone 21 and an area of 1 m from the dust conveyors
in the zone 22. As a complementary measure, the discharge of the dust has to guarantee that all the
dust remains within the delimited zone. For the construction and further design considerations, the dust
explosion class St 1 applies. In all the locations where an explosion risks exists, naked light units and
sparks and activities that may evocate them are forbidden. Moreover sufficient signs must be placed in
the entrances in order to warn about restrictions and explosion risks. Walls, doors and gates that delimit
the zones with explosion risks, have to be gas and fire proof; the doors and gates should have a self-
closing system.
9.6 Fire protection
The facilities have to be built in accordance with the part 4 of the national building code of India IS SP7.
Surveillance with fire detecting cameras is required, especially in bunker, mechanical treatment and
secondary fuel storage area. The Subpart L of the OSHA 1910 standard contains all the legal
requirements related to fire suppression, detection and protection. Fire extinguishing installations and
measures are not subject of this study and have to be covered in later, more detailed design steps.
9.7 Electrical grounding and lightning protection
The facilities should be electrically grounded in accordance to the Indian standard IS 3043. The facilities
should have a lightning protection system in accordance to the Indian standard IS 2309
9.8 Handling of corrosive substances
As part of the air treatment system, an acid scrubber might be installed. Its operation requires the use of
acid and corrosives substances. The acid substances should be stored in double shell containers. The
scrubber should be surrounded by a retention dyke with no drainage; the size of the retention dyke
should be enough to contain the whole amount of washing water coming from the scrubber. Both
pipelines and equipment have to be made of chemical corrosion resistant material. All the pipelines that
transport corrosive or acid substances should have the least possible amount of flanges. There should be
a filling station adequate for the reception of acids and it has to be located outside the air treatment
Page 79
77 / 80
hall in a separated place with a corrosion resistant floor and a pump sump. The pump sump will be used
as retention dyke for possible leaks; the pumped effluent coming out of the sump should not be
connected to the sewer. If necessary, the sump has to be emptied before the filling starts, thus the
retention volume will be guaranteed. This area should support heavy traffic. The storage tank will be
filled from a tanker using a pump that is considered as an accessory of the tanker. Other substances
such as diesel and lubricants have to be stored at a distance from the corrosive substances. The storage
and handling of substances have to account for the Indian code of safety and depending on the specific
material appropriate guidelines has to be referred.
Page 80
78 / 80
10 Bibliography
Bangalore Climate Maps. (2015). Abgerufen am September 2015 von Climate Maps:
http://www.bangalore.climatemps.com/
BBMP. (2015). Zonal classification - Residential. Abgerufen am 25. September 2015 von BBMP:
http://bbmp.gov.in/zonal-classification-residential
BBMP restructuring. (April 2015). Abgerufen am September 2015 von
http://www.bbmprestructuring.org/wp/bbmp-in-the-bengaluru-metropolitan-area-bma/
BGK, Bundesgütegemeinschaft Kompost e.V. (2010): Betrieb von Kompostierungsanlagen mit geringen
Emissionen klimarelevanter Gase. Kehres, B.; Mähl, B.; Clemens, J.; Cuhls, C.; Reinhold, J.;
Müsken, J.. 1. Auflage 11. 2010.
Kühle-Weidemeier, M.; Langer, U. Hohmann, F. (2007): Anlagen zur mechanisch-biologischen
Restabfallbehandlung. Schlussbericht. Teil 1: Hauptbericht. Umweltforschungsplan (2006) des
Bundesministeriums für Umwelt, Naturschutz und Reaktorsicherheit. Abfallwirtschaft.
Förderkennzeichen (UFOPLAN) 206 33 301. Wasteconsult international. Im Auftrag des
Umweltbundesamtes.
Synergy Enviro Engineers. (2015). Abgerufen am 25. September 2015 von Synergy Enviro Engineers:
http://www.synergyenviron.com/tools/wind_data.asp?loc=Bangalore%2CKarnataka%2CIndia
Weichgrebe, D., Mondal, M.M., Vidyaranya, V., Speier, C., Zacharias, M., Murali, S., Peter, N., Urs, V.,
Bhaskar, U., Joseph, S., Mundkur, V., Sivaram, R. (2015): Municipal Solid Waste (MSW)
Characterization Study for West-Zone Bangalore, India