46
N. Kornilov, CRP-PFNS, Vienna, 21-25 Oct. 2013 en problems for neutron emission in fis
| Date post: | 16-Dec-2015 |
| Category: |
Documents |
| Upload: | cordell-parvin |
| View: | 219 times |
| Download: | 1 times |

N. Kornilov, CRP-PFNS, Vienna, 21-25 Oct. 2013
Open problems for neutron emission in fission

ENDF/B-7235U: AVERAGE ENERGY OF FISSION NEUTRONS
INCIDENT NEUTRON ENERGY, MeV
0 1 2 3 4 5
<E
>, M
eV
1.9
2.0
2.1
2.2evaluation 1999 (Kornilov et al)
evaluation 2004 (ENDF/B-7)
average for Eth (exp I)
IPPE+RI; 1990-95 (exp I)
Johansson, 1977 (exp II)
evaluation 2002 (Hambsch et al)
Keff=1
????????

What was happened recently? (10-15years)
EXPERIMENT• 2009. I.Guseva, et al, ISINN-16, 370,2009, EXFOR41516; (PNPI)• 2010. N.Kornilov, F.-J. Hambsch, et al, NSE, 165(1), 2010; NSE 169, 2011;
(IRMM)
EVALUATION• Can predict macroscopic experiment (Mac-data)
2006. ENDF/B-7. “Theoretical” Madland-Nix (LANL) model with adjusted parameters.
• Cannot predict Mac-data1999. N.V.Kornilov, A.B.Kagalenko, F.-J. Hambsch, Physics of Atomic Nuclei, 62(2), Semi-empirical “two Watt” model2010. N.V.Kornilov, NS&E, 169, 2011,290, Semi-empirical “scale method”2013. V.G. Pronyaev, GMA code for data evaluation. Covariance was included.
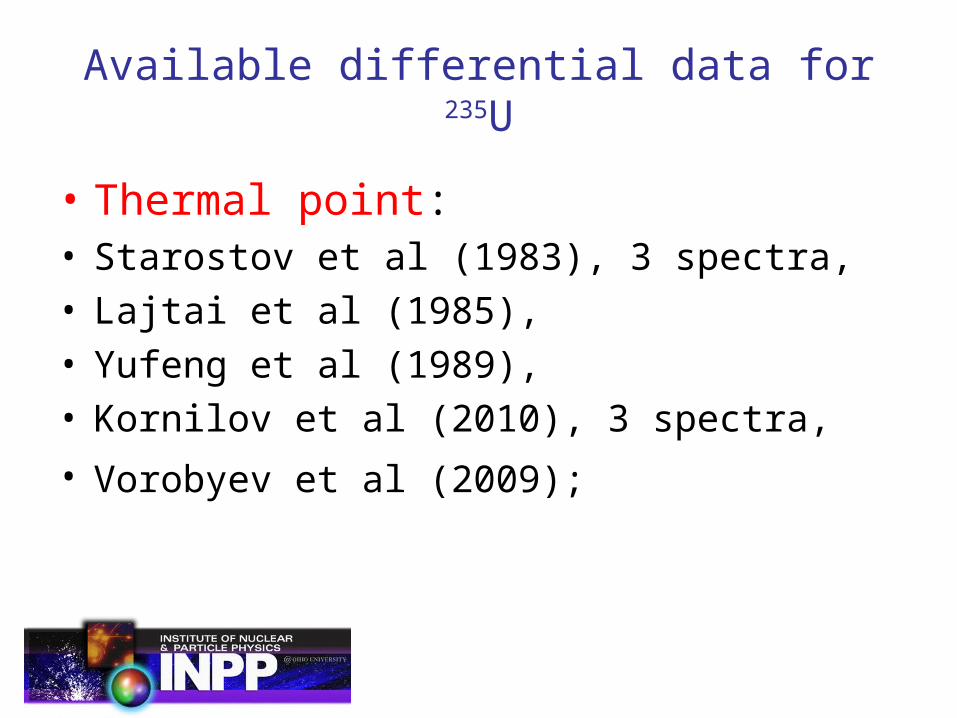
Available differential data for 235U
• Thermal point: • Starostov et al (1983), 3 spectra, • Lajtai et al (1985), • Yufeng et al (1989), • Kornilov et al (2010), 3 spectra,
• Vorobyev et al (2009);

Evaluation methods• Two Watt spectra
1. The PFN spectra may be described as a sum of two Watt distributions for light and heavy fragments with equal contribution:
S E E W E E T Ei i
x
i( , ) . ( , , ( ), )0 0
1
2
00 5
(1)
where Ti
x are the temperature parameters for nucleus x and light and heavy fragments (i=1,2),
E0 is the incident neutron energy, is the ratio of the total kinetic energy (TKE) at the moment of the neutron emission to full acceleration value. 2. Temperature parameters for any fissile system were calculated with 252Cf data according to the following formula:
l,hx
l,hCf x
* Cf
Cf* xT = T
E A
E A (2)
where E*=Er+Bn+E0-TKE, Er - energy release, Bn - binding neutron energy, E0 - incident neutron energy, A - mass number of fissile nucleus. The ratio of the Tl/Th=1.248 does not depends on fissile nucleus and incident energy. 3. There is the only free parameter was fitted to the experimental data [9-11] for incident neutron energy <6 MeV. The experimental data for 232Th, 233U, 235U, 238U, 237Np and 239Pu (24 spectra) have been described in the framework of this model inside the experimental errors.

Evaluation methods• Scale method
E1-E2, MeV <R> δR N points <0.3 0.999 0.034 19
0.3-0.5 1.020 0.025 11 0.5-0.7 1.011 0.033 11 0.7-1.0 0.997 0.021 16 1.0-1.5 0.987 0.017 27 1.5-2.0 0.990 0.013 21 2.0-2.5 1.006 0.013 20 2.5-3.0 1.010 0.009 12 3.0-4.0 1.009 0.012 23 4.0-5.0 1.003 0.017 28 5.0-6.0 1.004 0.014 25 6.0-7.0 1.006 0.013 21 7.0-8.0 0.988 0.027 20 8.0-9.0 0.960 0.032 16 9.0-10 0.974 0.062 11 10-11 0.959 0.112 11
The 235U PFNS SU(E) at energy E was calculated with equations:
s
CfCfCf
i
U
CfCf
s
a
EESaES
EXE
aEX
)()(
/
,
where as is scaling factor and ai is a normalization parameter for i-th experiment.
These parameters were found by a non-linear least square method.
The agreement experimental points and evaluated function is shown in Table.
For each energy interval one may estimate the uncertainties with equation:

Evaluation methods• Evaluation with GMA approach, (2013)
GMA approach to the evaluation of the standards• GMA: generalized least-squares fit of experimental data
developed by Wolfgang Poenitz for standard neutron reaction cross sections evaluation;
• Non-model fit: no physical or mathematical model used in the fit;
• Parameters of the fit are cross sections in the energy nodes (or groups) and normalization constants.

Are microscopic data (Mic-data) wrong?Criteria!?
Only one conclusion we should made: are experimental data
measured in different laboratory, different time, and so on….
in agreement or not!!!!
So they are true OR not?
What we have for PFNS at thermal point?

All experimental data together
0 2 4 6 8 10 12
0.6
0.8
1.0
1.2
1.4 Kornilov et al, 2010 Starostov et al, 1983 Lajtai et al, 1985 Yufeng et al, 1989
R(E
)
E (MeV)
0.1 1 10
0.6
0.8
1.0
1.2
1.4 Kornilov et al, 2010 Starostov et al, 1983 Lajtai et al, 1985 Yufeng et al, 1989
R(E
)
E (MeV)
Ratio to “scale method” evaluation

All evaluations together
0 2 4 6 8 10 120.6
0.8
1.0
1.2 Scale method [15] Kornilov, 1998 [1] Pronyaev, 2013 [16] ENDF/B-7, 2007
R(E
), <
E>=1.
974
MeV
E (MeV)
Obvious conclusion:
-ENDF/B-7 evaluation contradict to Mic data!
-This conclusion dos not depend on method used for evaluation!

Mic-Mac problem
0 2 4 6 8 10 120.80
0.85
0.90
0.95
1.00
1.05
1.10
R=C
/E
<E> (MeV)
Average cross sections:
Open points - 252Cf ; Mannhart.
Solid point - 235U;Scale method

Different microscopic experiments were applied for measurement of PFNS
1. Total Fission Fragment integrated experiment. In this type of experiment all fission fragment are integrated over TKE, masses, and emission angle relative to neutron detector. We should avoid any possible selection which may destroy PFNS shape (IRMM).
2. Differential Fission Fragment experiment. In this type of experiment PFNS are measuring relative to fixed direction of FF . The total PFNS may be calculated with integration of measured angular distributions over emission angle (PNPI).

ENDF/B-7 and PNPI experiment
0 2 4 6 8 10 120.6
0.8
1.0
1.2 Scale method [15] ENDF/B-7 Vorobyev, [4]
R(E
), <
E>=1.
974
MeV
E (MeV)

ENDF/B-7 and PNPI experiment
0 2 4 6 8 10 12 141.0
1.5
2.0
2.5
3.0
3.5
Kornilov et al, 2010 Starostov et al, 1983 scale method power fit Vorobyev et al, 2010
R(E
)=C
f/U
E (MeV)
Normalization factor k k=1.0195±0.0008 (Kornilov) L~ 3m, FWHM~2 ns k=0.9808±0.0016 (Starostov) L~ 2.5-6m, FWHM~4ns k=1 (Vorobyev) L= 0.5m, FWHM~2ns

Comparison of IRMM and PNPI experiments
Factor IRMM, 2010 PNPI, 2009
Flight path, m 3 0.5
FWHM, ns/m 0.6 4
Shielding n-detector Yes Yes, but thickness is small
Scattering on chamber Small, MC simulation Big? It was not estimated
Possible distortion effect It is not known Due to angle integration
Comparison with previous results
Agreement inside uncertainties Contradiction

Scattering on the FF detector materials
C.Budtz-Jorgensen, H-H. Knitter experiment (NP A, 490, 1988)
L=500 mm
Chamber Detector 20mmx10mm
130 mm
δ=0.5mm
μ=0.208
200 mm
μ=0.958
Cf-source

Model of PNPI experiment
Z
X
θm
φ
Neutron detector
FF source
FF detector like “belt” around axis OZ
R
H
θ
Мonte Carlo method. R=14см, H=7.2см. 0<φ<2π -cos(θm)< cos(θ)<cos(θm), cos(θm)=1, or 0.25
Neutron spectrum in CMS , )exp()(T
EEES , Т=0.65МeV.
CMS energy Ew=1.03 МeV. So in LS we should have Watt spectrum with <E> =1.5T+Ew=2.005MeV.

Integration over angles
0 2 4 6 8 10 12
0.6
0.8
1.0
1.2
1.4
no angle selection angle selection
R(E
) to
Wat
t sp
ectr
um
E (MeV)0 2 4 6 8 10 12
0.6
0.8
1.0
1.2
1.4
d=0.001
d=0.01
d=0.1
R(E
) ra
tio
to a
nalit
ical
fun
ctio
nE (MeV)

Differential experiment (conclusion)
• So, Differential Experiments (DE) may contain systematical distortion effects!
• Results of these experiments after proper corrections should be verified with total integral experiments and evaluations.
• ONLY these experiments (DE) gives us important information about fission mechanism!

Madland-Nix model
• Two FF or realistic distribution versus FF masses was included;
• Triangle “temperature distribution” was assumed to simulate wide spread of excitation energy according to TKE distribution, and multiple neutron emission;
• Optical model for absorption cross section;
• Selection of the slope for Level Density parameter a=A/c;
• Constant temperature assumption (Weisskopf type) for spectrum shape in CMS.
Assumptions 3 and 4 are weekest points.

The motivation of the LD parameter reduction

Weisskopf’s assumption
0 2 4 6 8 10
10-5
10-4
10-3
10-2
10-1
Weisskopf Level Density
N(E
), 1
/MeV
E (MeV)
25.1
0
/)2exp()(
,
),()()(
UaUU
EUU
UEEESLD
2
0
)/exp()()(
aTU
TEEEESW

Neutron spectra from (p,n) reactions
• 94Zr(p,n); Ep=8, 11 MeV (Zhuravlev et all, IPPE)
• 109Ag(p,n); Ep=7, 8, 9,10 MeV (Lovchikova et all, IPPE)
• 113Cd(p,n); Ep=7, 8, 9,10 MeV (Lovchikova et all, IPPE)
• 124Sn(p,n); Ep=10.2, 11.2 MeV (Zhuravlev et all, IPPE)
• 165Ho(p,n),181Ta; Ep=11.2MeV (Zhuravlev et all, IPPE)
• 181Ta(p,n); Ep=6, 7, 8, 9, 10 MeV (Lovchikova et all, IPPE)
• 103Rh(p,n), 104-106,108,110Pd(p,n), 107,109Ag(p,n), Ep=18, 22, 25 MeV (Grimes et al, LLNL)
• 51V(p,n), Ep=18, 22, 24, 26 MeV (Grimes et al, LLNL)
• 159Tb(p,n), 169Tm(p,n), Ep=25 MeV (Grimes et al, LLNL)
• 92-100Mo(p,n), Ep=25.6 MeV (Mordhorst et al, Un Hamburg)

Spectrum from (p,n) reaction113Cd(p,n), Ep=10MeV
1.0E-03
1.0E-02
1.0E-01
1.0E+00
1.0E+01
1.0E+02
1.0E+03
0.0 2.0 4.0 6.0 8.0 10.0 12.0
En, MeV
(n,p
), m
b/M
eV
G.N.LOVCHIKOVA,A.M.TRUFANOV, (48-CD-113(P,N)49-IN-113,,DE,,,EXP)
BCS, CS=2405, K&D
BCS, W-E CS=2405, K&D

Spectrum from 181Ta(p,n) reaction
0 1 2 3 4 5 6 710-4
10-3
10-2
10-1
100
101
102
103
6 MeV 8 MeV11 MeV
Sc(E
), m
b/M
eV
E, MeV

Madland-Nix model (conclusion)
• Madland-Nix model (LANL model) is semi-empirical model;
• Parameters of this model were selected to describe macroscopic results.
• The PFNS shape predicted with this model does not agree with microscopic experimental data.
• So, “Mic-Mac problem” was not solved till now!!!!!

Traditional assumption
• Main assumptions for modeling of neutron emission in fission:
1. formation of compound and decay to Fission Fragment;
2. neutron emission from excited FF after total acceleration
• Experimental data analysis:
Neutron energy distributions measured in Laboratory System LS are transformed to CMS. These data are described by equation with fitted parameters λ,T. After this the data return back to LS with following conclusion about reliability of main assumption. It seems this procedure may provide misunderstanding.
Model result should be compared with experiment in LS
PFNS ν(TKE) ν(A) ν(μ,E) ν(μ)

Model for Prompt Fission Neutron EmissionN. Kornilov et al, ISINN-12, Dubna, 2004N. Kornilov et al, NPA 786, 2007, 55-72
Neutron spectra for selected fission parameters are available now
Input data
• Y(A,TKE)
• Level density. (Level density model should be applied to extrapolate into FF mass range)
• Absorption cross section (optical model)
• Energy release and binding energies (G.Audi and A.H.Wapstra)
Assumptions
1. Neutron emission from excited, moving FF (full acceleration)
2. Total excitation energy U= Uh +Ul = Er-TKE
3. Uh and Ul from equilibrium (correction is possible)
This model = LANL model (Weisskopf assumption)

Experimental and calculated data (PFNS)
0 2 4 6 8 10 120
1
Scale method Ignatyuk LD W-E assumption Ignatyuk LD, a=a*0.65
R(E
), <
E>=1.
974M
eV
E (MeV)
0 2 4 6 8 10 120.0
0.5
1.0
Ignatyuk LD W-E Ignatyul LD, a=a*0.75 Mannhart evaluation
R(E
), <
E>=2.
121M
eV
E (MeV)
235U(th) 252Cf(sf)

Experimental and calculated data (ν(A))235U(th) 252Cf(sf)
80 100 120 140 1600.0
0.5
1.0
1.5
2.0
2.5
3.0 Nishio, 1998 Vorobyev, 2004 Ignatyuk LD W-E Ignatyuk LD, a=a*0.65
(A
)
A80 100 120 140 160
0.0
0.5
1.0
1.5
2.0
2.5
3.0
3.5 Budtz-Jorgenson [27] Ignatyuk LD W-E Ignatyul LD, a=a*0.75
(A
)
A

Experimental and calculated data (ν(TKE))235U(th) 252Cf(sf)
120 140 160 180 200 2200
1
2
3
4
5
6 Nishio, 1998 Maslin, 1967 Boldeman, 1971 Vorobyev, 2004 dTKE/dn=19MeV Ignatyuk LD W-E Ignatyuk LD, a=a*0.65 dTKE/dn=9.2MeV
(T
KE
)
TKE (MeV)120 140 160 180 200 220 2400
1
2
3
4
5
6
7
8 PNPI, 2001 dTKE/dn=13.5 MeV Ignatyul LD W-E Ignatyul LD, a=a*0.75 dTKE/dn=10 MeV
(T
KE
)
TKE (MeV)

ν(TKE)), S=(N-Z)/A?
• Experimental slope:
235U; 19 MeV/n, S=0.217
239Pu; 16 MeV/n, S=0.213
233U; 13 MeV/n, S=0.210
252Cf; 13 MeV/n, S=0.222
• Calculated result ~10 MeV/n

Slope estimation
Average <Bn> is ~6 MeV. The ν~2.5 in this eq. If <ε>~1.5 one may estimate the slope in eq.1, dU/dν~9 MeV.
So, we can explain what does mean value estimated with detail calculation in the model.

Experimental and calculated data (ν(μ))235U(th) 252Cf(sf)
-1.0 -0.5 0.0 0.5 1.00.0
0.2
0.4
0.6
0.8
1.0
Vorobyev, [4] Ignatyuk LD, 0.2-8MeV Ignatyul LD, a=a*0.65, 0.2-8MeV
n
/sr
, cosine to LF
-1.0 -0.5 0.0 0.5 1.00.0
0.2
0.4
0.6
0.8
1.0
Vorobyev, [4] Ignatyuk LD, 0.56-5.9MeV Ignatyul LD, a=a*0.65, 0.56-5.9MeV
n
/sr
, cosine to LF
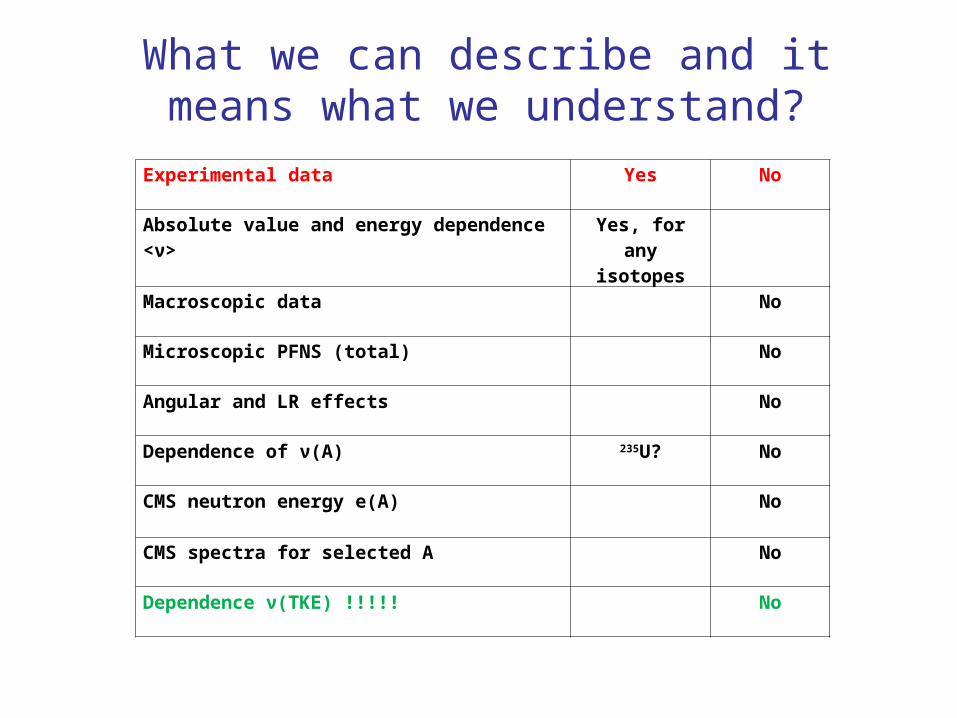
What we can describe and it means what we understand?
Experimental data Yes No
Absolute value and energy dependence <ν> Yes, for any isotopes
Macroscopic data No
Microscopic PFNS (total) No
Angular and LR effects No
Dependence of ν(A) 235U? No
CMS neutron energy e(A) No
CMS spectra for selected A No
Dependence ν(TKE) !!!!! No
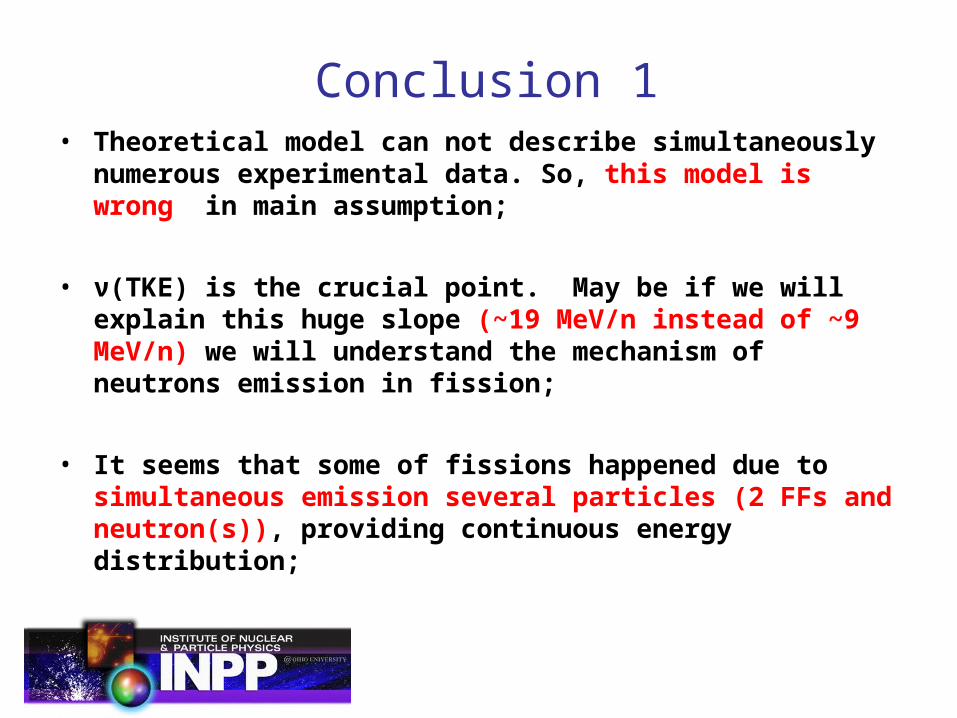
Conclusion 1• Theoretical model can not describe simultaneously numerous
experimental data. So, this model is wrong in main assumption;
• ν(TKE) is the crucial point. May be if we will explain this huge slope (~19 MeV/n instead of ~9 MeV/n) we will understand the mechanism of neutrons emission in fission;
• It seems that some of fissions happened due to simultaneous emission several particles (2 FFs and neutron(s)), providing continuous energy distribution;

Conclusion 2• Until detailed understanding of mechanism of neutron emission in
fission we have in hand only “semi-empirical models” for practical application;
• Contradiction between microscopic and macroscopic data (Mic-Mac problem) is still exist. May be this connected with energy-angular selection. So, we should spend more effort to investigate the influence of complicate nature of the neutron emission on macro-results.
• New experimental and theoretical efforts are extremely necessary to clarify the problem, to suggest new model, and to formulate new experiments for its investigation.

N.Corjan model.• IV. CONCLUSIONS
• During the neck rupture neutrons are released (become unbound) due to the non-adiabaticity of this process. They leave the fissioning system during the next few 10E−21 sec after scisssion, i.e., during the acceleration of the fission fragments. Even if the neutrons are released predominantly in the inter fragment region, they do not move perpendicular to the fission axis but instead they are focused (by the fragments) along the fission axis. This feature is unexpected. The resulting angular distribution of these neutrons with respect to the fission axis resembles with the experimental data for all prompt neutrons. This re-opens the 50 years old debate on the origin of the fission neutrons. For a quantitative comparison the e ects of ffreabsorption of the unbound neutrons by the imaginary potential and of the simultaneous separation of the fragments has to be included.

N.Corjan model.T=40E-22 s

Request for future total PFNS experiment
• All fission fragments should be integrated over angle, masses, and TKE. The efficiency of FF counting should be ~1 (as close as possible);
• Mass of fission chamber for fission counting should be reduced (as small as possible);
• 235U spectrum should be measured relative to 252Cf;
• Cf-source should be placed in the same chamber, and provide similar count rate;
• Time resolution <2ns (FWHM), and flight path ~3m;
• Shielding neutron detector to reduce counting of re-scattering neutrons (room neutrons);
• The scattering on the FF counter material should be simulated taking into account angular-energy selection effect.

The end

Total acceleration
0 2 4 6 8 10
1E-3
0.01
0.1
Budtz-Jorgensen, 1988 Skarsvag, 1963Y
scn(E
), 1
/MeV
E, MeV
Kornilov et al. Nucl Phys. A686, 187 (2001), Phys. Atomic Nuclei, 64, 1372 (2001) ~40% fission events for 252Cf(sf) and 235U(th) are accompanied by neutrons before total acceleration

2D distribution TKE * A0.0005
0.0010
0.0015
0.0020
0.0025
40
60
80
100
1E-5
1E-4
1E-3
80 100 120 140 16040
60
80
100
FF masses T
KE
-100
, MeV

Sharing of energy between fragments235U(th)
A
80 100 120 140 160
(A
)
0
1
2
3
4th=tl, ILD, Uh*0.9
corrected as 252CfNishio, 1997
235U(th)
A
80 100 120 140 160
(A
), M
eV0.0
0.5
1.0
1.5
2.0
2.5th=tl, ILD, Uh*0.9
corrected as for CfGrudzevichNishio, 1997

Conclusion for future experimental efforts
• New experimental efforts are necessary to answer the following very important questions:
• what is the nature of the “angular effect”, why the shape of the prompt fission neutron spectrum may change so drastically,
• what is the physical reason responsible for the formation of a more energetic spectrum in the integral experiments in comparison with microscopic data, and
• what is happening inside nuclear reactors.


