Page 1
ORIGINAL PAPER
Nanofibrillated cellulose (NFC) reinforced polyvinyl alcohol(PVOH) nanocomposites: properties, solubility of carbondioxide, and foaming
Yottha Srithep • Lih-Sheng Turng •
Ronald Sabo • Craig Clemons
Received: 26 January 2012 / Accepted: 14 May 2012 / Published online: 26 May 2012
� Springer Science+Business Media B.V. 2012
Abstract Polyvinyl alcohol (PVOH) and its nano-
fibrillated cellulose (NFC) reinforced nanocomposites
were produced and foamed and its properties—such as
the dynamic mechanical properties, crystallization
behavior, and solubility of carbon dioxide (CO2)—
were evaluated. PVOH was mixed with an NFC fiber
suspension in water followed by casting. Transmission
electron microscopy (TEM) images, as well as the
optical transparency of the films, revealed that the
NFC fibers dispersed well in the resulting PVOH/NFC
nanocomposites. Adding NFC increased the tensile
modulus of the PVOH/NFC nanocomposites nearly
threefold. Differential scanning calorimetry (DSC)
analysis showed that the NFC served as a nucleating
agent, promoting the early onset of crystallization.
However, high NFC content also led to greater thermal
degradation of the PVOH matrix. PVOH/NFC nano-
composites were sensitive to moisture content and
dynamic mechanical analysis (DMA) tests showed
that, at room temperature, the storage modulus
increased with decreasing moisture content. The
solubility of CO2 in the PVOH/NFC nanocomposites
depended on their moisture content and decreased
with the addition of NFC. Moreover, the desorption
diffusivity increased as more NFC was added. Finally,
the foaming behavior of the PVOH/NFC nanocom-
posites was studied using CO2 and/or water as the
physical foaming agent(s) in a batch foaming process.
Only samples with a high moisture content were able
to foam with CO2. Furthermore, the PVOH/NFC
nanocomposites exhibited finer and more anisotropic
cell morphologies than the neat PVOH films. In the
absence of moisture, no foaming was observed in the
CO2-saturated neat PVOH or PVOH/NFC nanocom-
posite samples.
Keywords Nanofibrillated cellulose (NFC) �Polyvinyl alcohol (PVOH) � Nanocomposites �Foaming
Introduction
In recent years, environmental concerns have led to an
increased interest in natural fibers and biodegradable
polymers. At the same time, new technologies orig-
inating from the fields of nanotechnology and nano-
composites have led to opportunities in many areas,
including materials from forest products (Ahola
2008). Cellulose microfibrils (MFs), which are
ordered uniquely in each of the cell wall layers of
wood, are tightly bound by multiple hydrogen bonds.
Mechanical homogenization or shearing of aqueous
Y. Srithep � L.-S. Turng (&)
University of Wisconsin–Madison, Madison, WI, USA
e-mail: [email protected]
R. Sabo � C. Clemons
U.S. Forest Service, Forest Products Laboratory,
Madison, WI, USA
123
Cellulose (2012) 19:1209–1223
DOI 10.1007/s10570-012-9726-0
Page 2
suspensions of cellulose has been used to break many
of the bonds, often after chemical or enzymatic
pretreatment, resulting in microfibrillated and even
nanofibrillated cellulose (NFC) if sufficient energy is
applied (Nakagaito and Yano 2004; Andresen et al.
2006; Iwamoto et al. 2007; Alemdar and Sain 2008).
NFC is gaining attention as a reinforcing filler in
thermoplastic matrices due to its numerous advanta-
ges, which include low density, renewability, high
specific properties, biodegradability, gas barrier prop-
erties, and unlimited availability (Siqueira et al. 2010;
Dufresne et al. 1997; Jonoobi et al. 2010). Despite
these attractive properties, the processing temperature
of these composites is restricted to about 200 �C due to
NFC degradation beyond this temperature, thus
restricting the type of matrix that can be used. For
instance, polycarbonate (PC) and polyamide (PA) are
typically processed at above 240 �C (Samir et al.
2005; Osswald 2006).
In this study, polyvinyl alcohol (PVOH), a biode-
gradable, water-soluble polymer, was chosen as a
matrix for cellulose-reinforced nanocomposites since
NFC production usually yields an aqueous gel.
Moreover, both PVOH and NFC are known for their
good gas barrier properties (Syverud and Stenius
2009; Sanchez-Garcia and Lagaron 2010; Tang and
Alavi 2011; Labuschagne et al. 2008). Low polarity
gas molecules, such as oxygen and carbon dioxide,
exhibit only weak interactions with the highly polar
hydroxyl groups in PVOH, resulting in its superior gas
barrier properties (Stern et al. 1987). When there are
no pores to allow for gas flow through a material, gas
permeability will depend on the dissolution of the gas
and its rate of diffusion in the particular material
(Syverud and Stenius 2009). However, no study has
investigated the sorption of CO2 in PVOH and PVOH/
NFC nanocomposites. Therefore, we measured the
solubility of CO2 in PVOH and PVOH/NFC nano-
composites, as well as its foaming behavior.
Polymeric foams find application as materials for
thermal and acoustic insulation, energy dissipation,
shock protection, packing, etc. (Avella et al. 2011).
Due to their small cell size and high cell density,
polymeric foams are light weight and offer better
thermal insulation compared to solid materials. This
study also carried out batch foaming experiments to
investigate the influence of NFC on cell size and cell
density using CO2 and/or water as the physical
foaming agents.
Experiments
Materials
NFC was prepared at the U.S. Forest Service, Forest
Products Laboratory (Madison, WI) according to a
procedure described by Saito and Isogai (Saito et al.
2006). In particular, fully bleached Kraft eucalyptus
fibers were oxidized with sodium hypochlorite
using tetramethylpiperidine-1-oxy radical (TEMPO)
sodium bromide as a catalyst. The TEMPO-mediated
oxidation was carried out at a pH of 10 at 25 �C for
3 h. The fibers were then thoroughly washed and
refined in a disk refiner with a gap of approximately
200 lm. The coarse fibers were separated by centri-
fuging at a force of 12,000 G, and the nanofiber
dispersion was concentrated to 1 % using ultrafiltra-
tion. A final clarification step was performed in
which the nanofiber dispersion was passed once
through an M-110EH-30 microfluidizer (Microflui-
dics, Newton, MA) with 200 and 87 lm chambers in
series.
Partially hydrolyzed (87–89 %) PVOH, Celvol
502�, was purchased from Celanese Chemicals, Ltd
(Dallas, TX). It had a weight-average molecular
weight (Mw) in the range of 13,000–23,000 and a
degree of polymerization of 150–300.
Processing
The NFC gel was diluted with deionized (DI) water.
After the NFC was thoroughly dispersed by magnetic
stirring for 30 min, water-soluble PVOH was added,
and stirring continued for 2 h on a hotplate at 60 �C
to dissolve the PVOH, thus enabling the polymer to
mix with the cellulose. PVOH solutions of 0, 2.5, 5,
and 10 wt% NFC content were prepared and the
resultant solutions appeared to be fully transparent.
Then, the mixtures were cast in Petri dishes with a
diameter of 90 mm and dried at room temperature
(about 25 �C) and atmospheric conditions for 7 days.
Final film thicknesses were approximately 0.8 mm.
Films were then stored at 90 % humidity and 80 �C to
equilibrate the moisture content in all films. Prior to
mechanical and thermal testing, some of the speci-
mens underwent additional conditioning to remove
any extra moisture.
A transmission electron microscope (TEM, LEO
912) was used to characterize the dispersion of NFC.
1210 Cellulose (2012) 19:1209–1223
123
Page 3
For dilute NFC–PVOH solutions, a drop was depos-
ited on a carbon-coated TEM grid and allowed to dry
prior to imaging. For TEM imaging of nanocompos-
ites, PVOH specimens containing 10 % NFC were cut
into 50–70 nm slices via an ultra-microtome at room
temperature. Before the sections became clustered, a
tweezers was used to separate them and TEM grids
were placed on the slices for imaging. The TEM was
operated at 120 kV at room temperature.
Tensile testing
Type V tensile specimens (ASTM D638—standard
test method for tensile properties of plastics) were
punched from films conditioned at 90 % humidity
using a cutting die. Prior to testing, samples were
stored for 4 days in the tensile testing room, which
was conditioned at 50 % humidity at 25 �C. The
static tensile modulus, strength, and strain-at-break
were measured on an Instron 5865. Tensile testing
was performed on all specimens using an initial
load of 2 N and a constant crosshead speed of
10 mm/min.
The experimental data obtained were compared
with three theoretical models to predict the Young’s
modulus of the composite materials. The first model
used the classical Rule of Mixtures approach where
the Young’s Modulus was calculated according to Eq.
(1). The other models were the Mean Field approach
of Halpin–Kardos (modified rule of mixture), as
shown in Eq. (2), and the Percolation approach, as
shown in Eq. (3) (Bulota et al. 2011; Davies 1971a).
E ¼ ErXr þ EmXm ð1ÞEn ¼ En
r Xr þ EnmXm ð2Þ
Davies suggested that the constant, n, be set to 1/5
based on theoretical analyses (Davies 1971b; Allen
et al. 1974; Bulota et al. 2011),
E ¼ 1� 2wþ Xrð ÞEmEr þ ð1� XrÞwE2r
ð1� XrÞEr þ ðXr � wÞEmð3Þ
where E is the nanocomposite modulus, Er is the
reinforcement modulus (which was assumed to be the
same as that of a dried NFC film prepared by
evaporating water from the NFC suspension), Em is
the matrix modulus, Xr is the fiber volume fraction,
and Xm is the matrix volume fraction. The percolation
volume fraction, w, is given by
w ¼ Xr � Xc
1� Xc
� �b
ð4Þ
where Xc is a percolation threshold (in this work it was
assumed to be 5 % based on the results of Bulota et al.
(2011) and b is the critical percolation exponent
which is equal to 0.4 for a three-dimensional system
(Siqueira et al. 2010).
Differential scanning calorimetry (DSC)
Differential scanning calorimetry (DSC) was per-
formed on a DSC Q20 (TA Instruments). The spec-
imens used for DSC characterization were taken from
the 90 % humidity room to a 30 % humidity room for
4 days prior to DSC testing to reduce the moisture
content in the samples. Specimens of 6–8 mg were
placed in aluminum sample pans and heated from 30 to
205 �C at a 10 �C/min heating rate and held at 205 �C
for 2 min to eliminate any prior thermal history yet
minimize degradation. Specimens were then cooled at
10 �C/min to 30 �C. The specimens were then
reheated to 205 �C and cooled down to room temper-
ature using the same temperature, holding time, and
cooling rates. The crystallization temperature (Tc) was
determined from the DSC cooling curves.
Thermogravimetric analysis (TGA)
Samples used for thermogravimetric analysis (TGA)
were dried at 90 �C for 2 days. TGA was performed
using a TGA Q50 (TA Instruments) from 25 to 600 �C
at a heating rate of 10 �C/min. Approximately 10 mg
of neat PVOH, neat NFC, or nanocomposites of
various NFC contents, were used for each test. The
loss of weight was recorded and normalized against
the initial weight.
Dynamic mechanical analysis (DMA)
Dynamic mechanical analysis (DMA) measurements
were performed on a DMA Q800 (TA Instruments) in
single cantilever mode. The specimens from the 90 %
humidity room were cut to approximately 35.2 by 12.7
by 0.8 mm and then kept in the testing room (50 %
humidity at 25 �C) for 4 days before the test. During
the DMA test, the specimens were heated at a rate of
3 �C/min from –20 �C to 150 �C with a frequency of
1 Hz and an amplitude of 50 lm. To study the effect
Cellulose (2012) 19:1209–1223 1211
123
Page 4
of moisture content on the dynamic mechanical
properties, additional specimens were dried in an
oven at 90 �C for 2 days prior to DMA testing for
comparison with the equilibrated specimens. The
DMA testing took around 1 h. The weight gain due
to moisture of the dried samples in 50 % humidity
at room temperature was around 0.02 %, which was
insignificant.
Sorption measurement
The main purpose of the sorption experiments was
to establish the amount of CO2 absorbed in the
PVOH and PVOH/NFC nanocomposites. The original
weights of these samples were measured using a
digital balance readable to 0.0001 g. Sorption of CO2
was facilitated by placing the specimens in a high-
pressure vessel under a CO2 gas pressure of 5.52 MPa
(800 psi) at room temperature for 1 day. No further
weight gain was detected in samples placed in the
pressure vessel for more than 1 day, suggesting that it
had reached steady state. Afterward, the vessel was
depressurized and the CO2-absorbed samples were
removed from the pressure vessel and placed on a
balance to record the CO2 sorption in the pressure
chamber and its desorption over time at atmospheric
pressure. The process of depressurization and remov-
ing the samples from the pressure chamber and
weighing them took around 40 s. Samples were kept
in an oil bath on the scale to reduce weight gain or loss
in the sample due to moisture.
Foam preparation
To study the foaming behavior and the effect of
moisture on foaming (i.e., using the absorbed water as
the plasticizer and/or physical blowing agent), neat
PVOH and its nanocomposites with different moisture
contents were foamed in a batch process. The samples
were either: (1) pre-conditioned at 90 % humidity for
2 days, or (2) dried in an oven at 90 �C for 2 days.
In the batch foaming process used in this study,
ASTM D638 Type V tensile test bars made of neat
resin and nanocomposites were punched from the
films and then placed in a pressure vessel filled with
CO2 at 5.52 MPa (800 psi) for 1 day, allowing ample
time for CO2 to diffuse into the samples. When
the specimens were removed from the pressure vessel
and brought to atmospheric pressure, supersaturated
specimens—which were thermodynamically unstable
due to the excessive gas dissolved in the polymer—
were produced. This resulted in the nucleation and
growth of gas microcells. After 2 h at room temper-
ature, the specimens were placed into a hot oil bath at
135 �C for 10 s to vaporize the moisture inside of the
specimens. If cells were not first allowed to nucleate
and begin to grow for this 2-h time period, placement
into a hot oil bath caused severe cracking of the matrix
due to the amount of vapor formed.
Scanning electron microscopy (SEM)
The cryogenically fractured surfaces were examined
using an SEM (LEO 1530) operated at 3 kV. The
samples were frozen in liquid nitrogen and then
fractured using two small pliers. All specimens were
sputter-coated with a thin layer of gold (*20 nm)
prior to examination.
Characterization of foams
The densities of the samples were measured by a
toluene displacement technique [ASTM D792 (stan-
dard test method for density and specific gravity
(relative density) of plastics)]. The density of toluene
at 20 �C is 868 g/cm3 (Poling et al. 2008). The weights
of unfoamed and foamed samples were measured
in air (Ma) and toluene (MT), and the density was
determined by:
Density ¼ 868Ma
MT
� �ð6Þ
The reported density is the average of five
replicates.
The average cell size and cell density of the PVOH
nanocomposites was quantitatively analyzed using an
image analysis tool (UTHSCSA ImageTool). The cell
density was calculated using the following formula
(Naguib et al. 2002),
Cell density ¼ N
L2
� �3=2
M ð7Þ
where N is the number of cells, L is the linear length of
the area, and M is the unit conversion factor resulting
in the number of cells per cm3. For cells of irregular
shape, the cell size was taken to be the largest opening
dimension.
1212 Cellulose (2012) 19:1209–1223
123
Page 5
Results and discussions
Dispersion of NFC in PVOH
Figure 1a and b show TEM images of a dilute NFC–
PVOH solution dried on carbon-coated grids and the
ultra-microtomed specimens, respectively. The TEM
images illustrate that NFC is an interconnected web
with fibrils having a diameter in the range of
10–50 nm. When dispersed in water, NFC forms
a very stable suspension due to the interfibrillar
repulsive forces created during the TEMPO pre-
treatment. Based on the TEM images, it was con-
cluded that NFC dispersed well in a PVOH water
solution. Further evidence for the uniformity of the
dispersion was the full transparency of the resulting
films as shown in Fig. 2 (Siro and Plackett 2010).
Tensile properties
Tensile tests were performed on specimens punched
from the cast films. Representative stress–strain
Fig. 1 TEM images for nanocomposites. a Sample was obtained by evaporating an NFC and PVOH water solution on a carbon-coated
grid. b Sample was obtained by cutting via ultra-microtome. Scale bars are 100 nm and 1,000 nm for (a) and (b), respectively
Fig. 2 Transparency (from
left to right) of neat PVOH
and PVOH/NFC
nanocomposites with 2.5, 5,
and 10 % NFC, respectively
Cellulose (2012) 19:1209–1223 1213
123
Page 6
curves are featured in Fig. 3. The addition of NFC
yielded stronger and stiffer composites but toughness
(measured as work of fracture) was reduced in
comparison to neat PVOH samples. The strain at
break for PVOH reinforced with 0, 2.5, 5, and 10 %
NFC were found to be 4.4, 3.2, 2.6, and 0.6,
respectively. The lower strain at break of PVOH/
NFC nanocomposites was probably due to the PVOH
itself reaching its maximum tensile strength. Neat
PVOH had the lowest value of ultimate tensile
strength and tensile modulus, which were 16.1 and
25.5 MPa, respectively. As the amount of NFC
increased, the ultimate tensile strength and tensile
modulus increased.
Experimental data in this work were compared with
theoretical models. For modeling mechanical proper-
ties of the composites, the tensile modulus of 100 %
NFC was assumed to be that of a dried NFC film
prepared by evaporating water from an NFC suspen-
sion. The NFC film was also punched out and tested
using the same tensile testing conditions as the PVOH/
NFC nanocomposites. The strain at break, tensile
modulus, and ultimate tensile strength of dried NFC
were 0.06, 3730 MPa, and 141.5 MPa, respectively. A
comparison of tensile moduli is presented in Fig. 4.
Theoretical modeling based on the modified rule of
mixtures and percolation theory was in good agree-
ment with experimental data. The rule of mixtures
seemed to overestimate reinforcement phenomena.
This could be due to the fact that the models assumed
unidirectional and uniform fiber orientation and dis-
tribution in addition to a perfect bond between the
matrix and the fiber (Bulota et al. 2011; Sharma 2002).
Thermal properties
PVOH is a semicrystalline polymer in which high
physical inter-chain and intra-chain interactions exist
due to hydrogen bonding between hydroxyl groups.
The introduction of nanosized cellulose fibers with
hydroxyl groups alters the intra-molecular and inter-
molecular interactions of the PVOH chains. This may
affect both the crystallization behavior and the phys-
ical structure of PVOH, resulting in variations in
properties of nanocomposite samples (Liu et al. 2007).
Because the PVOH degrades near its melting
temperature (Tang and Alavi 2011; Marten 2002),
three heating and two cooling cycles were performed
so that useful comparisons could be made. Results
from the initial heating cycle in DSC experiments
were discarded because they included the latent heat
from the water absorption in the samples.
Degradation
Figures 5 and 6 show the second and third heating
cycles, as well as the first and second cooling cycles, of
PVOH and PVOH/NFC nanocomposites. As shown in
Fig. 5, the endothermic peak, which occurred between
190 and 200 �C, is referred to as the melting peak of
PVOH. An exothermic peak, which occurred between
160 and 180 �C, was observed in all specimens and
corresponds to the crystallization of PVOH (cf.
Fig. 6). Note that the additional thermal scanning
cycles caused a decrease in the melting and crystal-
lization temperatures as well as the heat, suggesting
sample degradation (Probst et al. 2004; Holland and
Hay 2001). The magnitude of the shift increased with
Fig. 3 Tensile stress versus strain curve for the NFC and
PVOH nanocompositesFig. 4 Comparison of experimental data to models
1214 Cellulose (2012) 19:1209–1223
123
Page 7
increasing NFC concentration, indicating that NFC
might cause degradation of the polymer, likely
through residual moisture in NFC. This degradation
was further confirmed by TGA results.
Nucleating effect
Table 1 provides clear evidence that NFC also serves
as a nucleating agent as the crystallization temperature
(Tc) is higher with the addition of NFC. With the
addition of 2.5 % NFC, the crystallization peak of
PVOH is roughly 5 �C higher. Furthermore, the
crystallization regime was prolonged as compared to
neat PVOH. With further addition of NFC, however,
the crystallization peak temperature decreased. The
initial increase and then decrease of crystallization
temperatures with increasing NFC content could be
the result of several competing factors, including
enhanced nucleation for crystallization, material deg-
radation due to residual moisture in NFC, and/or
physical interactions between the polymer and rein-
forcements that restrict the segmental mobility of the
polymer chains. Similar effects by other nanosized
materials on the crystallization and degradation of
PVOH have been reported previously (Probst et al.
2004; Liu et al. 2007).
Furthermore, the enthalpy (DH), percent crystal-
linity (vc), and melting temperatures (Tm) calculated
from the second cooling scan are shown in Table 1.
The degree of crystallinity of PVOH was calculated
based on the following equation,
vc ¼DHm
wDH0m
ð8Þ
where w is the weight fraction of PVOH in the
composites, DHm is the measured heat of fusion, and
DH0m is the heat of fusion of a 100 % crystalline PVOH
which has a value of 150 J/g (Finch 1973). As shown
in Table 1, and similar to the change in crystallization
temperature, the degree of crystallinity of PVOH
increased slightly with a small addition of NFC, and
then decreased. This increase in crystallinity is
possibly due to the nucleating effect of the nanosized
NFC fibers. The same phenomena were observed for
tunicin whisker-reinforced plasticized starch (Mathew
et al. 2008) and carbon nanotube-reinforced PVOH
composites (Coleman et al. 2004). In addition, the
shoulders in the DSC thermograms in Fig. 5 indicate
Fig. 5 Comparison of the melting endotherms during the
second (solid line) and third (dashed line) heating scans of
PVOH and its nanocomposites with NFC
Fig. 6 Comparison of the crystallization exotherms during the
first (solid line) and second (dashed line) cooling scans of PVOH
and its nanocomposites with NFC
Table 1 DSC results based on the second heating and first cooling scan
Samples Tg (�C) Tm (�C) DH (J/g) Vc (%) Tc (�C)
PVOH 66.2 195.4 12.0 8.0 168.1
PVOH ? 2.5 %NFC 66.3 196.8 12.1 8.2 174.8
PVOH ? 5 %NFC 66.6 193.1 11.2 7.8 171.2
PVOH ? 10 %NFC 68.8 190.9 10.5 7.7 168.2
Cellulose (2012) 19:1209–1223 1215
123
Page 8
that the glass transition temperatures of PVOH and
PVOH/NFC nanocomposite samples were between 50
and 80 �C.
Thermal stability
The thermal stability of the neat PVOH and PVOH/
NFC nanocomposite samples were examined using
TGA. TGA results shown in Fig. 7 confirm that adding
NFC leads to increased degradation. The onset
degradation temperatures of the PVOH/NFC nano-
composites decreased with the addition of NFC.
As shown in Fig. 7, there was an initial and slow
weight loss of NFC until around 200 �C, which might
be attributed to both the loss of residual moisture in the
NFC as well as the slow degradation of NFC. The most
pronounced degradation began at approximately
200 �C, which was lower than the maximum temper-
ature of 205 �C used in the heating scans during the
DSC analysis. This supports the findings that the
material might have degraded at the end of the first
DSC heating scan (cf. Fig. 5). There was an approx-
imate 30 % char yield at temperatures above 500 �C.
Dynamic mechanical properties (DMA)
Since PVOH is a hydrophilic polymer, its properties
were strongly affected by the presence of moisture in
the samples (Bulota et al. 2011; Roohani et al. 2008).
For the study on the effects of moisture content in
PVOH and NFC on the mechanical properties, two sets
of specimens were prepared. The first set was removed
from the 90 % humidity room and reconditioned for
4 days at 50 % humidity and 25 �C prior to testing. To
further reduce the moisture content within the speci-
mens, the other set of samples was dried at 90 �C for
2 days prior to the DMA test. Figure 8 shows the
weight of PVOH/NFC nanocomposites, which were
dried at 90 �C, from the 90 % humidity room as a
function of time. The actual moisture contents of the
samples from the 90 and 50 % humidity rooms were
found to be around 21 and 7.5 %, respectively.
The logarithm of the storage modulus for PVOH
nanocomposites prepared at the two moisture contents
as a function of temperature are shown in Fig. 9. At
low temperatures (-25 to 0 �C), it was difficult to
observe any change in the storage modulus between
the two moisture contents. In the glassy state, the
tensile storage modulus, E, slightly decreased with
temperature. Then, the modulus dropped at a temper-
ature (around 25 or 50 �C) that depended on moisture
conditioning. The modulus dropped earlier for sam-
ples that were conditioned at 50 % humidity and
25 �C. At 25 �C, high moisture content samples were
soft and pliable but low moisture content samples led
to a hard material (Roohani et al. 2008). Interestingly,
for samples containing a lot of moisture and little or no
NFC (Fig. 9a), the rubbery modulus was found to
increase with temperature in the range of about
70–110 �C. This behavior might be caused by the
loss of moisture during the DMA test. On the other
hand, for dried samples (cf. Fig. 9b) at higher
temperatures, the modulus dropped consistently.
Regardless of the moisture content, the addition of
NFC increased the rubbery modulus of the PVOH/
NFC nanocomposites. Similar results have beenFig. 7 TGA curves for the PVOH/NFC nanocomposite
samples
Fig. 8 Weight of PVOH/NFC nanocomposites in a 90 %
humidity room as a function of time as they were dried at 90 �C
1216 Cellulose (2012) 19:1209–1223
123
Page 9
reported in other studies (Roohani et al. 2008; Lu et al.
2008).
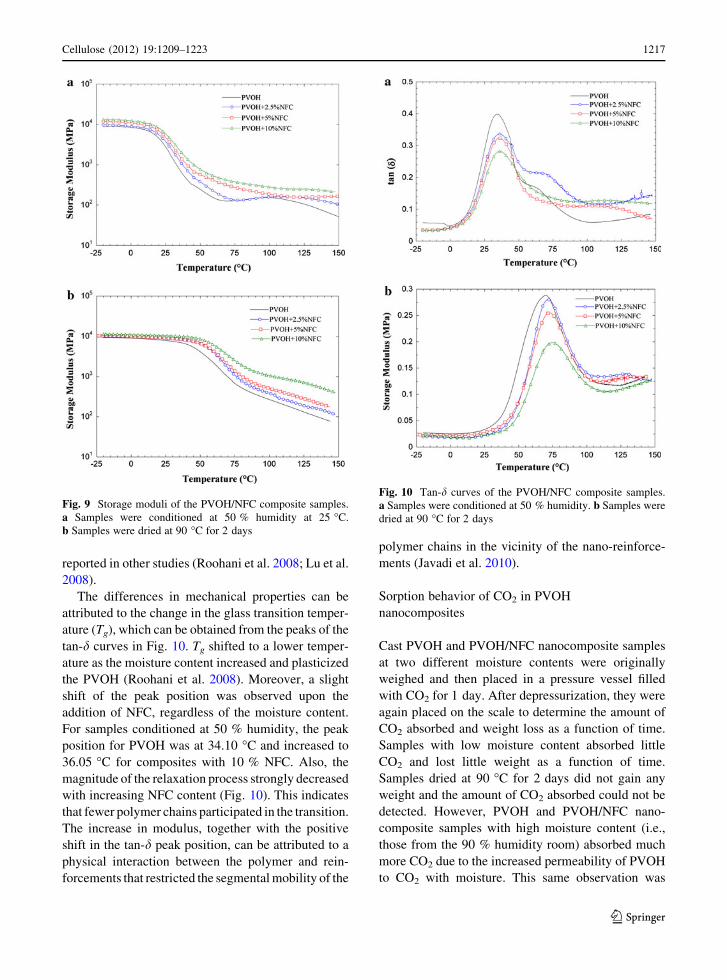
The differences in mechanical properties can be
attributed to the change in the glass transition temper-
ature (Tg), which can be obtained from the peaks of the
tan-d curves in Fig. 10. Tg shifted to a lower temper-
ature as the moisture content increased and plasticized
the PVOH (Roohani et al. 2008). Moreover, a slight
shift of the peak position was observed upon the
addition of NFC, regardless of the moisture content.
For samples conditioned at 50 % humidity, the peak
position for PVOH was at 34.10 �C and increased to
36.05 �C for composites with 10 % NFC. Also, the
magnitude of the relaxation process strongly decreased
with increasing NFC content (Fig. 10). This indicates
that fewer polymer chains participated in the transition.
The increase in modulus, together with the positive
shift in the tan-d peak position, can be attributed to a
physical interaction between the polymer and rein-
forcements that restricted the segmental mobility of the
polymer chains in the vicinity of the nano-reinforce-
ments (Javadi et al. 2010).
Sorption behavior of CO2 in PVOH
nanocomposites
Cast PVOH and PVOH/NFC nanocomposite samples
at two different moisture contents were originally
weighed and then placed in a pressure vessel filled
with CO2 for 1 day. After depressurization, they were
again placed on the scale to determine the amount of
CO2 absorbed and weight loss as a function of time.
Samples with low moisture content absorbed little
CO2 and lost little weight as a function of time.
Samples dried at 90 �C for 2 days did not gain any
weight and the amount of CO2 absorbed could not be
detected. However, PVOH and PVOH/NFC nano-
composite samples with high moisture content (i.e.,
those from the 90 % humidity room) absorbed much
more CO2 due to the increased permeability of PVOH
to CO2 with moisture. This same observation was
Fig. 9 Storage moduli of the PVOH/NFC composite samples.
a Samples were conditioned at 50 % humidity at 25 �C.
b Samples were dried at 90 �C for 2 days
Fig. 10 Tan-d curves of the PVOH/NFC composite samples.
a Samples were conditioned at 50 % humidity. b Samples were
dried at 90 �C for 2 days
Cellulose (2012) 19:1209–1223 1217
123
Page 10
reported in other studies (Piringer and Baner 2000;
Marten 2002; Brandrup et al. 1999). For the sake of
brevity, only samples conditioned at 90 % humidity
are presented.
Figure 11 shows a plot of the measured solubility of
CO2 (%) in PVOH and PVOH/NFC nanocomposites.
Note that the solubility of CO2 in the specimens
decreased as the NFC content increased because NFC,
which has high crystallinity, does not absorb CO2 as
reported by number of studies (Doroudiani et al. 2002;
Rachtanapun et al. 2003; Matuana et al. 1998). Neat
PVOH was found to have around 3 % CO2 solubility.
With the addition of 10 % NFC, the apparent solubil-
ity of CO2 decreased by as much as 33 %, which was
much higher than the 10 % that might be expected.
The additional reduction in weight gain might be
because of faster gas loss while depressurizing the
chamber and transferring the specimens to the scale.
Accelerated weight loss with the addition of NFC was
confirmed by desorption measurements.
The desorption curves for CO2 in the neat PVOH
and PVOH/NFC nanocomposite samples around one
to 2 h are illustrated in Fig. 12. There is around 40 s
delay after depressurizing and before weighing. The
weight loss during this short period of time can be
estimated by extrapolating the relatively flat mass loss
curves at time equals zero. The additional mass losses
for all of the samples were found to be less than 2.5 %
of the total mass uptake. Note that the samples were
weighed in an oil bath on the scale. Since it takes time
for the CO2 gas to pass through the oil to the
atmosphere, there is a short lag time in the weight
change. Thereafter, the slope became steeper as the
NFC content increased, especially for the
PVOH ? 10 % NFC specimen. Hence, the desorption
diffusivity became higher as the amount of NFC
increased. The increase in desorption diffusivity with
increasing fiber content might be due to the interface
between the fibers and the matrix which could provide
a channel through which gas can quickly escape from
the composites as reported in (Doroudiani et al. 2002;
Rachtanapun et al. 2003).
Foamed PVOH/NFC nanocomposites
To investigate their foaming behavior, specimens were
placed in hot oil after removal from the CO2 pressure
vessel. Both specimens that were conditioned at 90 %
humidity or dried prior to placement in the pressure
vessel were investigated. Dried PVOH nanocomposite
samples did not appear to foam at the conditions
used (Fig. 13). On the other hand, at a high moisture
content, some small cells can be clearly seen in the
neat PVOH (Fig. 14a). These cells are believed to be
caused by CO2 with moisture plasticizing the films,
which can lower the resistance to gas cell growth (Zhu
et al. 2010; Kumar and Nadella 2004). Note that there
were no visible cells found in the PVOH/NFC
nanocomposites. This is probably because the nano-
composites had a higher strength at room temperature
(Fig. 9a), which could hinder cell growth and reduce
cell size (Lee et al. 2005).
Figure 15 shows the SEM micrographs from the
center portion of the cross-section of the tensile bars
after foaming in a hot oil bath at 135 �C for 10 s. The
cell size found in the neat PVOH in Fig. 14a increased
with the hot oil treatment. This was due to the
moisture vapor that was generated at the oil bath
temperature and diffused into the cells, enlargingFig. 11 Solubility of CO2 in PVOH and their nanocomposites
with 2.5, 5, and 10 wt% NFC
Fig. 12 Desorption curves for CO2 in PVOH and PVOH/NFC
nanocomposites during the first hour; Mt is the amount of gas
lost at time t and M? is the mass uptake at infinite time
1218 Cellulose (2012) 19:1209–1223
123
Page 11
Fig. 13 SEM images of dried PVOH and PVOH/NFC nano-
composites after they were placed into a CO2 pressure vessel
and subjected to a rapid pressure drop and hot oil treatment:
a PVOH, b PVOH ? 2.5 % NFC, c PVOH ? 5 % NFC, and
d PVOH ? 10 % NFC. No visible foaming was observed
Fig. 14 SEM images of high moisture content PVOH and
PVOH/NFC nanocomposites after they were placed into a CO2
pressure vessel and subjected to a rapid pressure drop at room
temperature: a PVOH, b PVOH ? 2.5 % NFC, c PVOH ? 5 %
NFC, and d PVOH ? 10 % NFC
Cellulose (2012) 19:1209–1223 1219
123
Page 12
them. Furthermore, a greater number of cells formed
in the PVOH/NFC nanocomposites. The reasons for
the formation of these cavities in the PVOH/NFC
nanocomposites is probably due to very small cells
that were created after depressurization but that could
not be seen at the magnification in Fig. 14b–d; the
evaporation of moisture in the samples could enlarge
these cells. In general, placing samples into the CO2
pressure vessel for 1 day prior to depressurization
helped to pre-condition the samples and generate
small cells as nuclei. Subsequently, placing them into
a hot oil bath allowed the moisture in the samples to
evaporate and expand the pre-existing cell nuclei into
a system of dense cells. Without CO2 pre-condition-
ing, the moisturized sample exhibited severe cracking
in the hot oil bath.
The average cell size of the neat foamed PVOH was
32.6 lm and the cell morphology seemed more
isotropic (Fig. 16). For PVOH/NFC nanocomposites,
the cells became less uniform and more extended in
the planar directions (the long axis and width direc-
tions of the sample). This was probably due to the
preferable orientation of NFC fibers parallel to the film
surface that hampered gas diffusion and cell growth
in the thickness direction. In addition, cell size in
the PVOH/NFC nanocomposites generally decreased
with increasing NFC content and the cell density
increased, suggesting that NFC nucleates cells. These
results agree with findings from the literature on other
types of nanocomposites (Chandra et al. 2005; Yuan
et al. 2005; Gong et al. 2005). It should be pointed out
that a few larger cells observed in the PVOH/NFC
nanocomposites were likely formed by evaporated
vapor from the NFC instead of CO2, thus resulting in a
large error bar. The densities of the solid neat PVOH
and PVOH/NFC nanocomposites were all around
1,310 kg/m3, and that of the foamed samples were
1,082, 1,102, 1,050, and 1120 kg/m3 for PVOH,
PVOH ? 2.5 % NFC, PVOH ? 5 % NFC, and
PVOH ? 10 % NFC, respectively.
Fig. 15 SEM images of
high moisture content
PVOH and PVOH
nanocomposites foamed
after hot oil treatment:
a PVOH, b PVOH ? 2.5 %
NFC, c PVOH ? 5 % NFC,
and d PVOH ? 10 % NFC.
Arrows indicate the planar
direction (the long axis and
width directions of the
sample) of the sample
Fig. 16 The average cell size and cell density of foamed PVOH
nanocomposites
1220 Cellulose (2012) 19:1209–1223
123
Page 13
Tensile properties of foamed PVOH
nanocomposites
Tensile tests were performed on the foamed specimens
of the PVOH/NFC nanocomposites (cf. Fig. 17). The
specific Young’s modulus was obtained by dividing
the modulus by the density.
As shown in Fig. 17a, the addition of NFC increased
the specific Young’s modulus of both solid and foamed
samples significantly. The specific Young’s modulus
of the foamed specimens was generally higher than that
of their solid counterparts but there was no significant
difference in the specific strength (Fig. 17b). However,
the strain-at-break (Fig. 17c) of the foamed specimens
was lower. This can be attributed to the presence of
large cells that served as stress concentrators in the
foamed samples (Kramschuster et al. 2007).
Conclusions
NFC dispersed well in PVOH by blending a suspen-
sion of NFC with a solution of PVOH. PVOH/NFC
nanocomposite films were then formed by a casting/
evaporation technique. NFC had a reinforcing effect
on PVOH, as observed via both DMA and tensile tests.
However, toughness decreased as the amount of NFC
increased. The addition of NFC to PVOH was shown
to increase the crystallization and glass transition
temperatures, but it also caused thermal degradation of
the polymer, likely due to an increase in moisture. The
sorption degree of CO2 in the nanocomposites was
dependent on the moisture content in the samples as
solubility increased with higher moisture contents.
The solubility was around 3 % in neat PVOH condi-
tioned at 90 % humidity and decreased as the amount
of NFC increased. Moreover, the desorption diffusiv-
ity increased as more NFC was added. The moisture in
the neat PVOH and PVOH/NFC nanocomposites
acted as a plasticizer and enabled foaming by a batch
foaming process. In addition, vapor that came from the
evaporation of moisture in the samples also acted as a
physical blowing agent by diffusing into the cells and
enlarging them. Finally, the addition of NFC increased
cell density and decreased cell size in moisture-
enabled foamed PVOH/NFC nanocomposites.
Acknowledgments The financial support of the United States
Department of Agriculture National Institute of Food and Agricul-
ture Award (No. 2011-67009-20056) is gratefully acknowledged
in this research. The authors would also like to thank Dr. Srikanth
Pilla for his useful suggestions, Dr. Tom Kuster of the Forest
Products Laboratory for performing electron microscopy, and
Dr. Rick Reiner of the Forest Products Laboratory for preparing
cellulose nanofibers.
References
Ahola S (2008) Properties and interfacial behaviour of cellulose
nanofibrils. Dissertation, Helsinki University of Technology
Fig. 17 Specific mechanical properties of solid and foamed
PVOH/NFC nanocomposites: a specific Young’s modulus
(Pa/kg m3), b specific tensile strength (Pa/kg m-3), and
c strain at break
Cellulose (2012) 19:1209–1223 1221
123
Page 14
Alemdar A, Sain M (2008) Isolation and characterization of
nanofibers from agricultural residues-Wheat straw and soy
hulls. Bioresour Technol 99:1664–1671
Allen G, Bowden M, Todd S, Blundell D, Jeffs G, Davies W
(1974) Composites formed by interstitial polymerization of
vinyl monomers in polyurethane elastomers: 5. Variation
of modulus with composition. Polymer 15:28–32
Andresen M, Johansson LS, Tanem BS, Stenius P (2006)
Properties and characterization of hydrophobized micro-
fibrillated cellulose. Cellulose 13:665–677
ASTM D638-10 (2010) Standard test method for tensile prop-
erties of plastics. ASTM International, West Conshohoc-
ken, PA. doi:10.1520/D0638-10
ASTM D792-08 (2008) Standard test methods for density and
specific gravity (relative density) of plastics by displace-
ment, ASTM International, West Conshohocken, PA
Avella M, Cocca M, Errico M, Gentile G (2011) Biodegradable
PVOH-based foams for packaging applications. J Cell
Plast 47:271
Brandrup J, Immergut EH, Grulke EA (1999) Polymer hand-
book. Wiley, New York
Bulota M, Jaaskelainen A, Paltakari J, Hughes M (2011) Prop-
erties of biocomposites: influence of preparation method,
testing environment and a comparison with theoretical
models. J Mater Sci 46:3387–3398
Chandra A, Gong S, Yuan M, Turng LS, Gramann P, Cordes H
(2005) Microstructure and crystallography in microcellular
injection molded polyamide 6 nanocomposite and neat
resin. Polym Eng Sci 45:52–61
Coleman JN, Cadek M, Blake R, Nicolosi V, Ryan KP, Belton
C, Fonseca A, Nagy JB, Gun’ko YK, Blau WJ (2004) High
performance nanotube-reinforced plastics: understanding
the mechanism of strength increase. Adv Funct Mater
14:791–798
Davies W (1971a) The elastic constants of a two-phase com-
posite material. J Phys D Appl Phys 4:1176
Davies W (1971b) The theory of composite dielectrics. J Phys D
Appl Phys 4:318
Doroudiani S, Chaffey CE, Kortschot MT (2002) Sorption and
diffusion of carbon dioxide in wood-fiber/polystyrene
composites. J Polym Sci Pol Phys 40:723–735
Dufresne A, Cavaille JY, Vignon MR (1997) Mechanical
behavior of sheets prepared from sugar beet cellulose
microfibrils. J Appl Polym Sci 64:1185–1194
Finch CA (1973) Polyvinyl alcohol: properties and applications,
vol 339. Wiley, New York
Gong S, Yuan M, Chandra A, Kharbas H, Osorio A, Turng L
(2005) Microcellular injection molding. Int Polym Proc
20:202–214
Holland B, Hay J (2001) The thermal degradation of poly (vinyl
alcohol). Polymer 42:6775–6783
Iwamoto S, Nakagaito A, Yano H (2007) Nano-fibrillation of
pulp fibers for the processing of transparent nanocompos-
ites. Appl Phys A Mater 89:461–466
Javadi A, Srithep Y, Lee J, Pilla S, Clemons C, Gong S, Turng
LS (2010) Processing and characterization of solid and
microcellular PHBV/PBAT blend and its RWF/nanoclay
composites. Compos Part A Appl S 41:982–990
Jonoobi M, Harun J, Mathew AP, Oksman K (2010) Mechanical
properties of cellulose nanofiber (CNF) reinforced
polylactic acid (PLA) prepared by twin screw extrusion.
Compos Sci Technol 70:1742–1747
Kramschuster A, Gong S, Turng LS, Li T (2007) Injection-
molded solid and microcellular polylactide and polylactide
nanocomposites. J Biobased Mater Bio 1:37–45
Kumar V, Nadella KV (2004) Microcellular foams. In: Eaves D
(ed) Handbook of polymer foams. Smithers Rapra Press,
Shropshire, pp 243–268
Labuschagne PW, Germishuizen WA, Verryn SMC, Moolman
FS (2008) Improved oxygen barrier performance of poly
(vinyl alcohol) films through hydrogen bond complex with
poly (methyl vinyl ether-co-maleic acid). Eur Polym J
44:2146–2152
Lee LJ, Zeng C, Cao X, Han X, Shen J, Xu G (2005) Polymer
nanocomposite foams. Compos Sci Technol 65:2344–2363
Liu M, Guo B, Du M, Jia D (2007) Drying induced aggregation
of halloysite nanotubes in polyvinyl alcohol/halloysite
nanotubes solution and its effect on properties of composite
film. Appl Phys A Mater 88:391–395
Lu J, Wang T, Drzal LT (2008) Preparation and properties of
microfibrillated cellulose polyvinyl alcohol composite
materials. Compos A 39:738–746
Marten FL (2002) Vinyl alcohol polymers. Kirk-Othmer Encycl
Chem Technol. doi:10.1002/0471238961.2209142513011
820
Mathew AP, Thielemans W, Dufresne A (2008) Mechanical
properties of nanocomposites from sorbitol plasticized starch
and tunicin whiskers. J Appl Polym Sci 109:4065–4074
Matuana LM, Park CB, Balatinecz JJ (1998) Cell morphology
and property relationships of microcellular foamed pvc/
wood-fiber composites. Polym Eng Sci 38:1862–1872
Naguib HE, Park CB, Panzer U, Reichelt N (2002) Strategies for
achieving ultra low density polypropylene foams. Polym
Eng Sci 42:1481–1492
Nakagaito A, Yano H (2004) The effect of morphological
changes from pulp fiber towards nano-scale fibrillated cel-
lulose on the mechanical properties of high-strength plant
fiber based composites. Appl Phy A Mater 78:547–552
Osswald TA (2006) International plastics handbook: the
resource for plastics engineers. Hanser, Verlag
Piringer OG, Baner AL (2000) Plastic packaging materials for
food: barrier function, mass transport, quality assurance,
and legislation. Wiley-Vch, Weinheim
Poling BE, Thomson GH, Friend DG, Rowley RL, Wilding WV
(2008) Perry’s chemical engineer’s handbook. McGraw-
Hill, New York
Probst O, Moore EM, Resasco DE, Grady BP (2004) Nucleation
of polyvinyl alcohol crystallization by single-walled car-
bon nanotubes. Polymer 45:4437–4443
Rachtanapun P, Selke S, Matuana L (2003) Microcellular foam
of polymer blends of HDPE/PP and their composites with
wood fiber. J Appl Polym Sci 88:2842–2850
Roohani M, Habibi Y, Belgacem NM, Ebrahim G, Karimi AN,
Dufresne A (2008) Cellulose whiskers reinforced polyvi-
nyl alcohol copolymers nanocomposites. Eur Polym J 44:
2489–2498
Saito T, Okita Y, Nge T, Sugiyama J, Isogai A (2006) TEMPO-
mediated oxidation of native cellulose: microscopic anal-
ysis of fibrous fractions in the oxidized products. Carbo-
hydr Polym 65:435–440
1222 Cellulose (2012) 19:1209–1223
123
Page 15
Samir MASA, Alloin F, Dufresne A (2005) Review of recent
research into cellulosic whiskers, their properties and their
application in nanocomposite field. Biomacromolecules
6:612–626
Sanchez-Garcia MD, Lagaron JM (2010) On the use of plant
cellulose nanowhiskers to enhance the barrier properties of
polylactic acid. Cellulose 17:987–1004
Sharma S (2002) Economics of composites and reinforcements.
Composite materials, 1st edn. Narosa Publishing House,
New Delhi, pp 20–25
Siqueira G, Bras J, Dufresne A (2010) Cellulosic bionano-
composites: a review of preparation, properties and appli-
cations. Polymers 2:728–765
Siro I, Plackett D (2010) Microfibrillated cellulose and new
nanocomposite materials: a review. Cellulose 17:459–494
Stern S, Shah V, Hardy B (1987) Structure-permeability rela-
tionships in silicone polymers. J Polym Sci Pol Phys 25:
1263–1298
Syverud K, Stenius P (2009) Strength and barrier properties of
MFC films. Cellulose 16:75–85
Tang X, Alavi S (2011) Recent advances in starch, polyvinyl
alcohol based polymer blends, nanocomposites and their
biodegradability. Carbohydr Polym 85:7–16
Yuan M, Winardi A, Gong S, Turng LS (2005) Effects of nano and
micro fillers and processing parameters on injection molded
microcellular composites. Polym Eng Sci 45:773–788
Zhu B, Zha W, Yang J, Zhang C, Lee LJ (2010) Layered-silicate
based polystyrene nanocomposite microcellular foam using
supercritical carbon dioxide as blowing agent. Polymer
51:2177–2184
Cellulose (2012) 19:1209–1223 1223
123