May 2016 (Data as of April 30, 2016) National Association of Real Estate Investment Trusts® REITs: Building Dividends & Diversification® REITWatch ® NAREIT ® A Monthly Statistical Report on the Real Estate Investment Trust Industry
Transcript
May 2016(Data as of April 30, 2016)
National Association of Real Estate Investment Trusts®REITs: Building Dividends & Diversification®
REITWatch®
NAREIT®
A Monthly Statistical Report on the Real Estate Investment Trust Industry
NAREIT Disclaimer
NAREIT® does not intend this publication to be a solicitation related to any particular company, nor does
it intend to provide investment, legal or tax advice. Investors should consult with their own investment,
legal or tax advisers regarding the appropriateness of investing in any of the securities or investment
strategies discussed in this publication. Nothing herein should be construed to be an endorsement by
NAREIT of any specific company or products or as an offer to sell or a solicitation to buy any security or
other financial instrument or to participate in any trading strategy. NAREIT expressly disclaims any
liability for the accuracy, timeliness or completeness of data in this publication. Unless otherwise
indicated, all data are derived from, and apply only to, publicly traded securities. Any investment returns
or performance data (past, hypothetical or otherwise) are not necessarily indicative of future returns or
performance. Copyright 2016 by NAREIT®. NAREIT and REITWatch are the exclusive registered marks of
the National Association of Real Estate Investment Trusts®. Please direct all questions or comments to
John Barwick, Senior Director, Industry Information, NAREIT®, 1875 I Street, NW, Suite 600,
Washington, DC 20006 or call (202) 739-9400.
REITWATCH TABLE OF CONTENTS
I. Indicators of US REIT Investment Performance
REIT Industry Fact Sheet ................................................................................................................. 1
Investment Performance of the FTSE NAREIT US Real Estate Index Series ................................. 3
Investment Performance by Property Sector and Subsector ............................................................. 4
Selected Indicators of Equity Market Performance .......................................................................... 5
Historical Offerings of REIT Securities ........................................................................................... 6
REIT Payout Ratios: Dividend as a Percent of Funds from Operations ......................................... 33 REIT Dividends and Funds from Operations by Property Sector/Subsector .................................. 34 US REIT Industry Balance Sheet ................................................................................................... 35
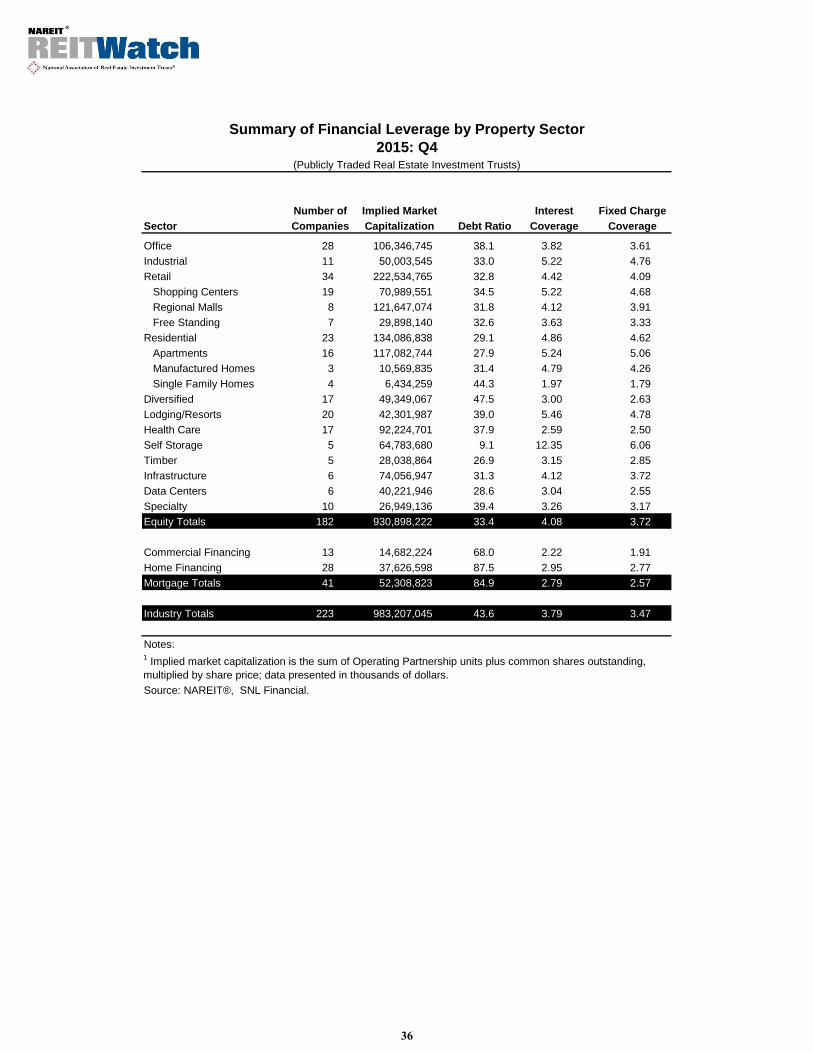
Summary of REIT Financial Leverage ........................................................................................... 36
IV. Indicators of Global Real Estate Investment Performance
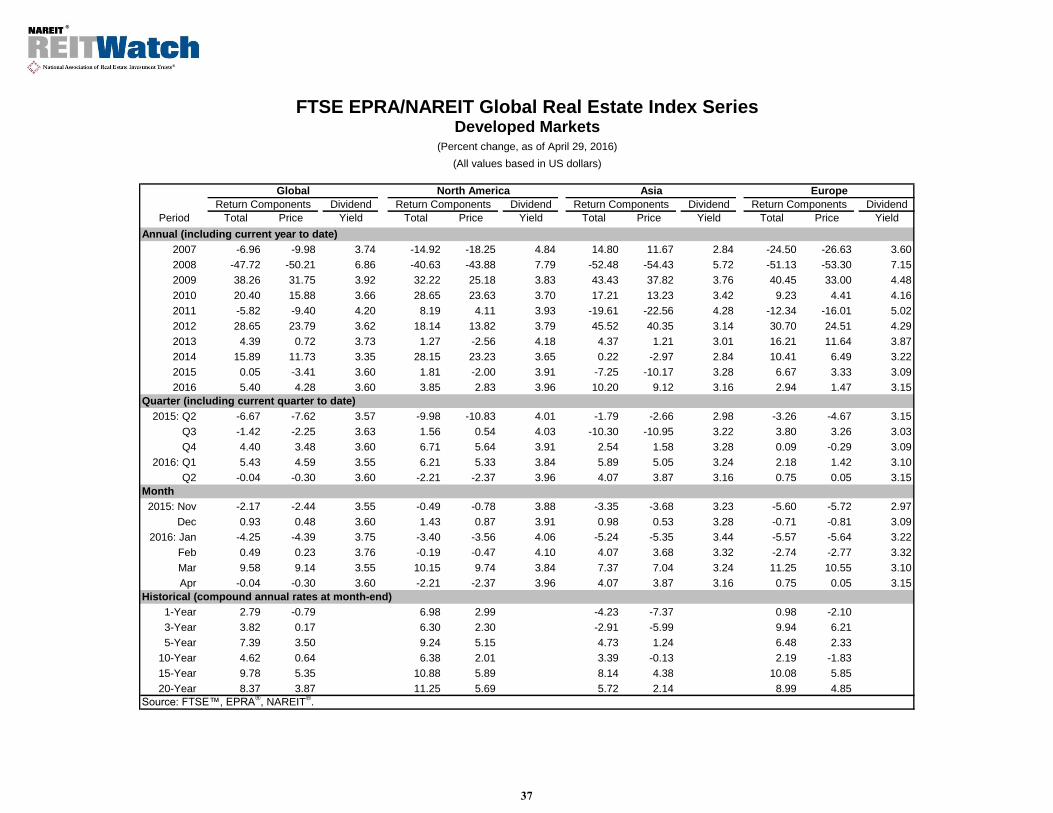
FTSE EPRA/NAREIT Global Real Estate Index Series Investment Performance ........................ 37
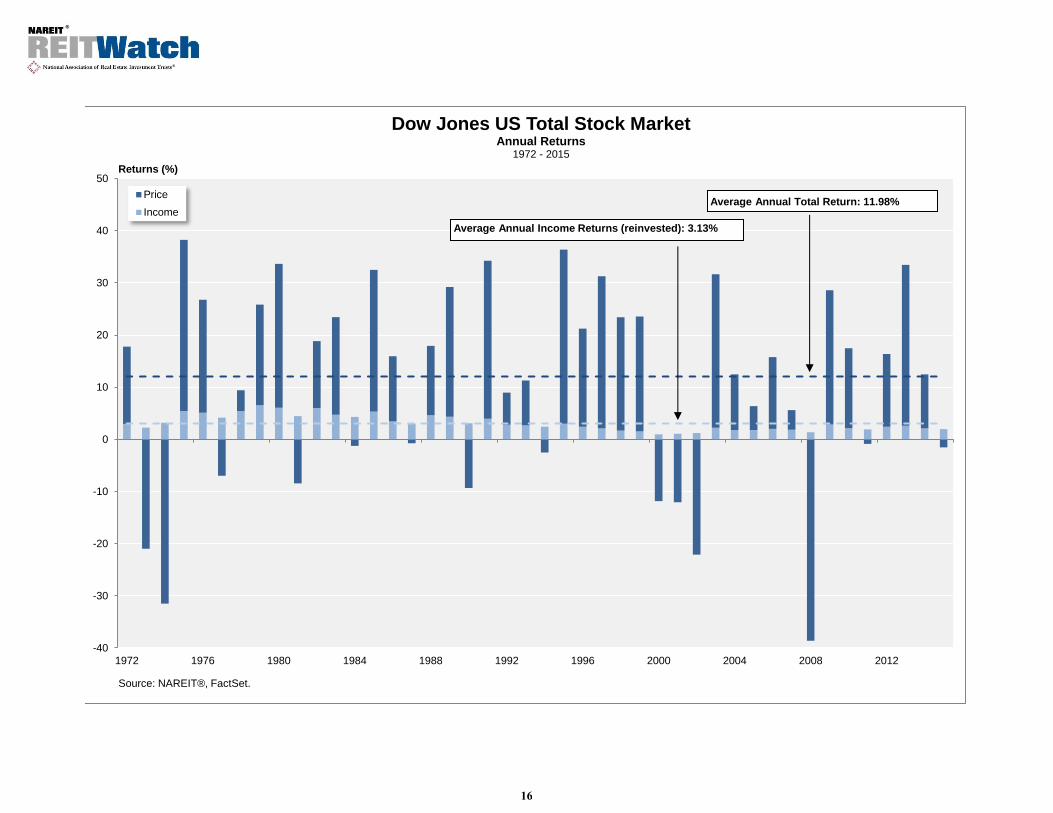
Investment Performance Year-to-date and compound annual total returns of the FTSE NAREIT All REITs Index, the FTSE NAREIT All Equity REITs Index,and leading US benchmarks for periods ending April 29, 2016:
Dow JonesAll
REITsAll
Equity REITsS&P500
Russell2000
NASDAQComposite
Industrial Average
2016: YTD 4.09 3.92 1.74 0.03 -4.27 2.83
1-Year 7.39 8.11 1.21 -5.94 -2.19 2.25
3-Year 6.57 6.97 11.26 7.53 14.17 8.82
5-Year 9.96 10.05 11.02 6.98 12.05 9.52
10-Year 6.25 6.72 6.91 5.42 8.58 7.34
15-Year 10.78 11.23 5.48 7.22 5.58 6.00
20-Year 10.39 10.94 7.92 7.48 7.19 8.41
25-Year 10.70 11.26 9.29 9.37 9.58 7.54
30-Year 9.15 10.35 9.99 8.58 8.77 7.96
35-Year 10.25 11.78 11.05 9.59 9.24 8.58
40-Year 11.65 13.27 11.03 - 10.44 7.47
1972 - 2016 9.77 12.00 10.29 - 8.67 6.99
Data in percent; highest return for the period in bold.
Returns in italics are price-only.
DividendsYield Comparison
- FTSE NAREIT All REITs: 4.28%
- FTSE NAREIT All Equity REITs: 3.86%
- S&P 500: 2.18%
Public listed REITs paid out approximately $46.5 billion and public non-listed REITs paid out approximately $4.5 billionin dividends during 2015.
On average, 66 percent of the annual dividends paid by REITs qualify as ordinary taxable income, 12 percent qualifyas return of capital and 22 percent qualify as long-term capital gains.
FTSE NAREIT
1
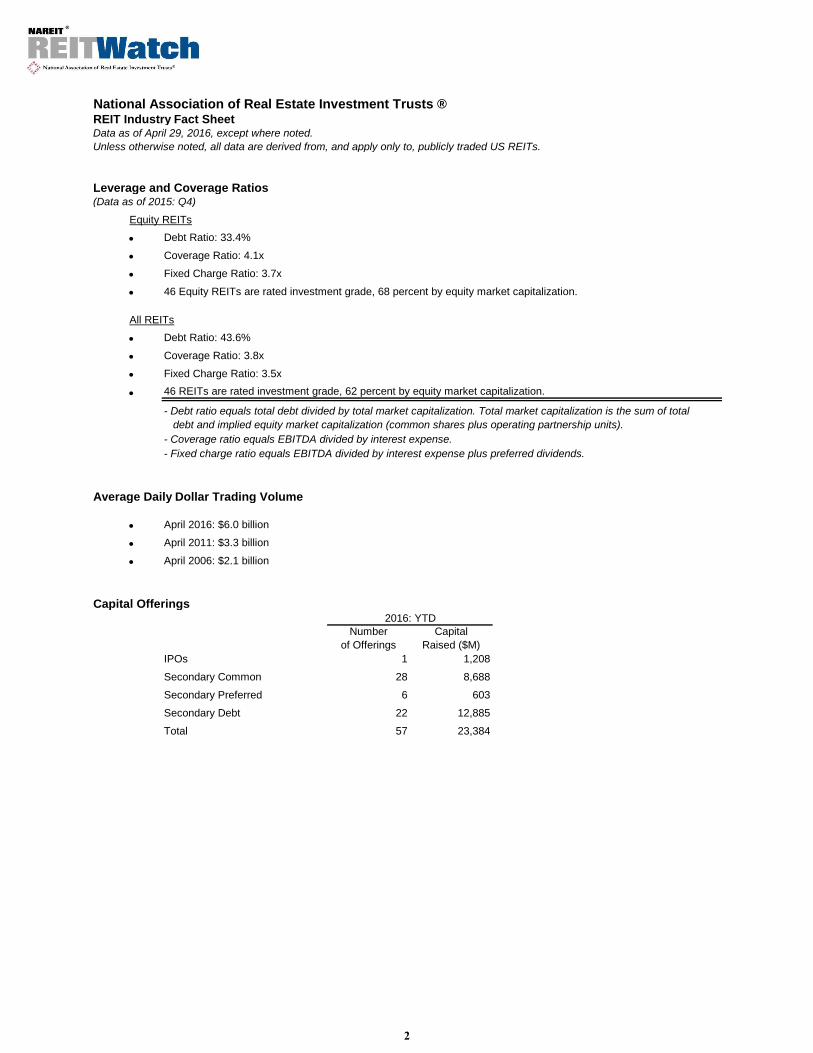
National Association of Real Estate Investment Trusts ®REIT Industry Fact SheetData as of April 29, 2016, except where noted.
Unless otherwise noted, all data are derived from, and apply only to, publicly traded US REITs.
Leverage and Coverage Ratios(Data as of 2015: Q4)
Equity REITs
46 Equity REITs are rated investment grade, 68 percent by equity market capitalization.
All REITs
46 REITs are rated investment grade, 62 percent by equity market capitalization.
- Coverage ratio equals EBITDA divided by interest expense.
- Fixed charge ratio equals EBITDA divided by interest expense plus preferred dividends.
Average Daily Dollar Trading Volume
April 2011: $3.3 billion
April 2006: $2.1 billion
Capital Offerings2016: YTD
Numberof Offerings
CapitalRaised ($M)
1 1,208
28 8,688
6 603
22 12,885
Total 57 23,384
- Debt ratio equals total debt divided by total market capitalization. Total market capitalization is the sum of total
debt and implied equity market capitalization (common shares plus operating partnership units).
Debt Ratio: 33.4%
Coverage Ratio: 4.1x
Fixed Charge Ratio: 3.7x
Debt Ratio: 43.6%
Coverage Ratio: 3.8x
Fixed Charge Ratio: 3.5x
IPOs
Secondary Common
Secondary Preferred
Secondary Debt
April 2016: $6.0 billion
2
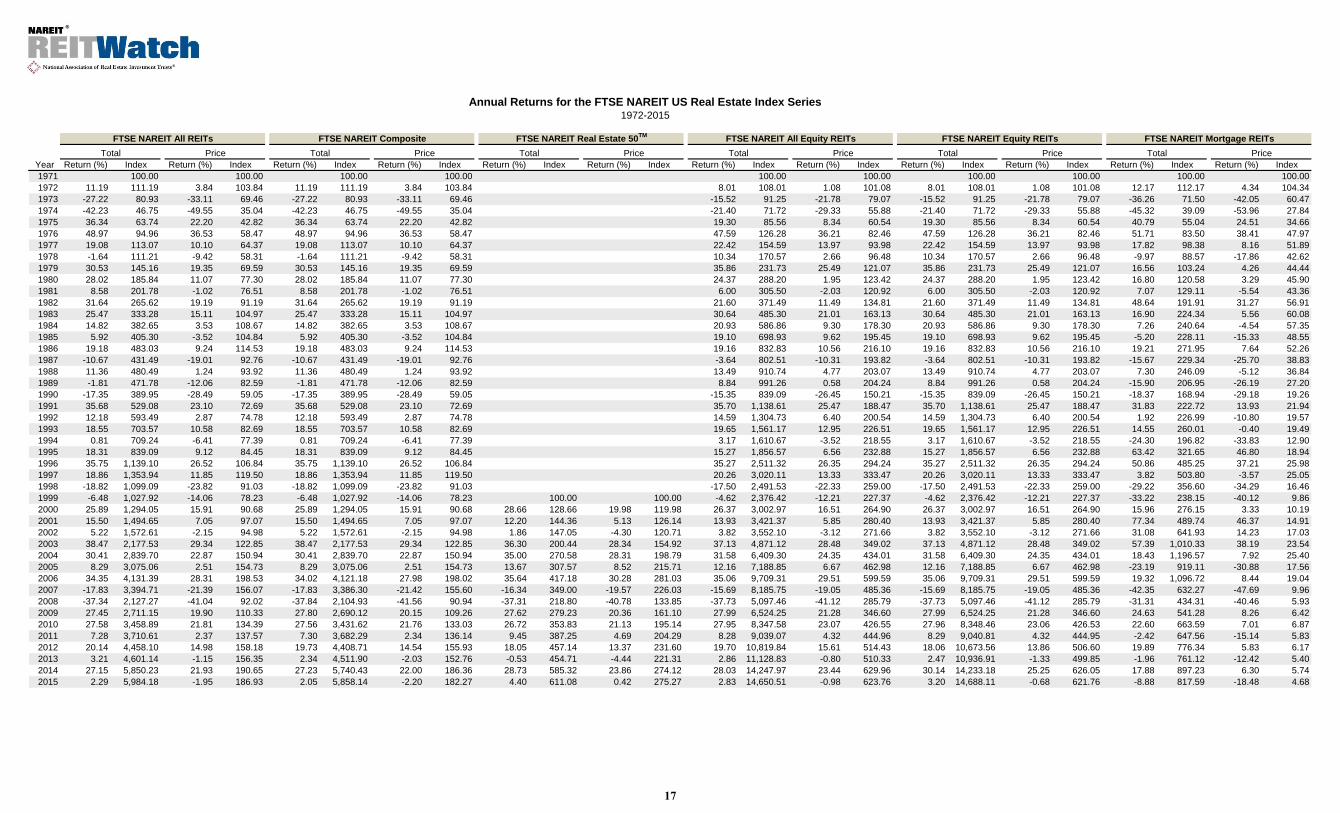
Exhibit 1Investment Performance:
FTSE NAREIT US Real Estate Index SeriesApril 29, 2016
FTSE NAREIT All REITs FTSE NAREIT Composite FTSE NAREIT Real Estate 50™ 1 FTSE NAREIT All Equity REITs FTSE NAREIT Equity REITs FTSE NAREIT Mortgage REITs
Returns (%) Dividend Returns (%) Dividend Returns (%) Dividend Returns (%) Dividend Returns (%) Dividend Returns (%) DividendPeriod Total Price Yield2 Total Price Yield2 Total Price Yield2 Total Price Yield2 Total Price Yield2 Total Price Yield2
Notes:1 The FTSE NAREIT Real Estate 50™ is designed to measure the performance of larger and more frequently traded REITs.
2 Dividend yield quoted in percent for the period end.
REIT.comTM National Association of Real Estate Investment Trusts®
All Things REITTMREITs: Building Dividends and Diversification
®
Disclaimer: The FTSE NAREIT US Real Estate Index Series ("Indexes") is calculated by FTSE International Limited ("FTSE"). All rights in the Indexes vest in FTSE® and the National Association of Real Estate Investment Trusts®("NAREIT"). FTSE is a trademark of the London Stock Exchange Plc and The Financial Times Limited and is used by FTSE under licence. NAREIT® is a trademark of the National Association of Real Estate Investment Trusts. NeitherFTSE nor NAREIT nor their licensors shall be liable (including in negligence) for any loss arising out of use of the Indexs by any person. All data are derived from, and apply only to, publicly traded securities.
3
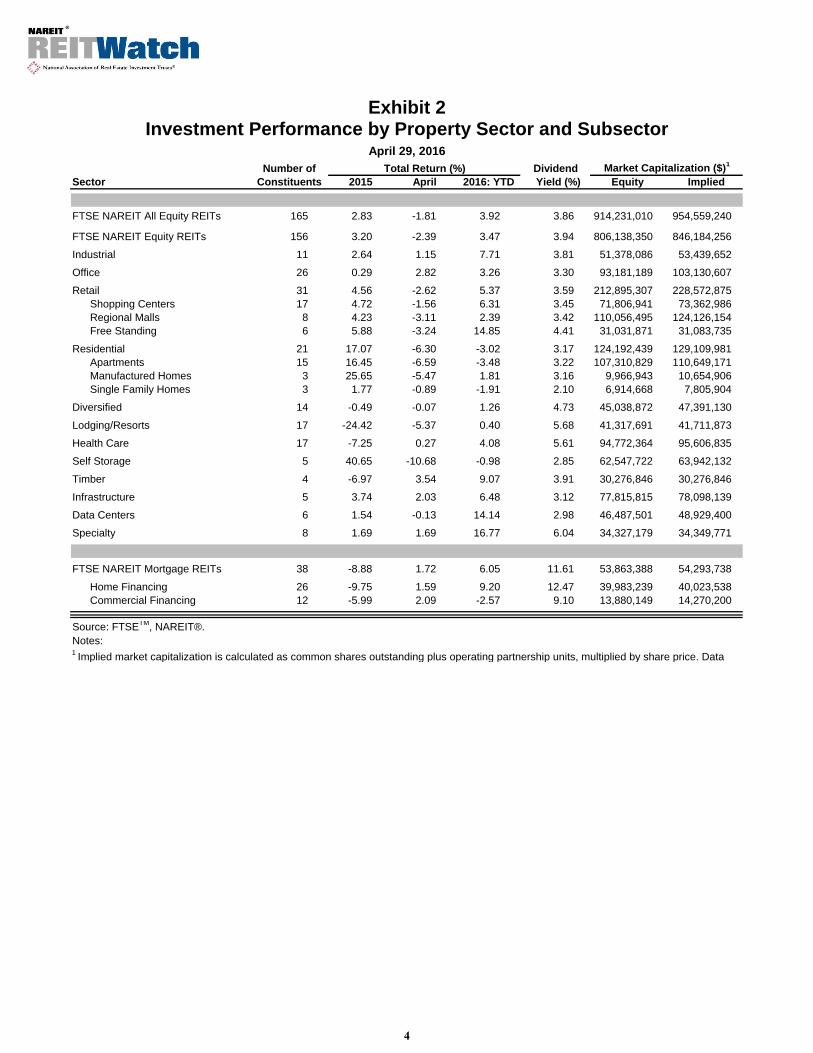
Exhibit 2Investment Performance by Property Sector and Subsector
April 29, 2016Number of Total Return (%) Dividend Market Capitalization ($)1
Sector Constituents 2015 April 2016: YTD Yield (%) Equity Implied
Source: FTSETM, NAREIT®.Notes:1 Implied market capitalization is calculated as common shares outstanding plus operating partnership units, multiplied by share price. Data presented in thousands of dollars.
4
Exhibit 3Selected Indicators of Equity Market Performance
(Period ending index levels and percent change)April 29, 2016
FTSE NAREIT Dow Jones NASDAQ US TreasuryPeriod All Equity REITs S&P 500 Industrials Russell 2000 Composite 10-Year Note1
FTSE NAREIT All REITs FTSE NAREIT Real Estate 50TMFTSE NAREIT Composite FTSE NAREIT All Equity REITs FTSE NAREIT Equity REITs FTSE NAREIT Mortgage REITs
17
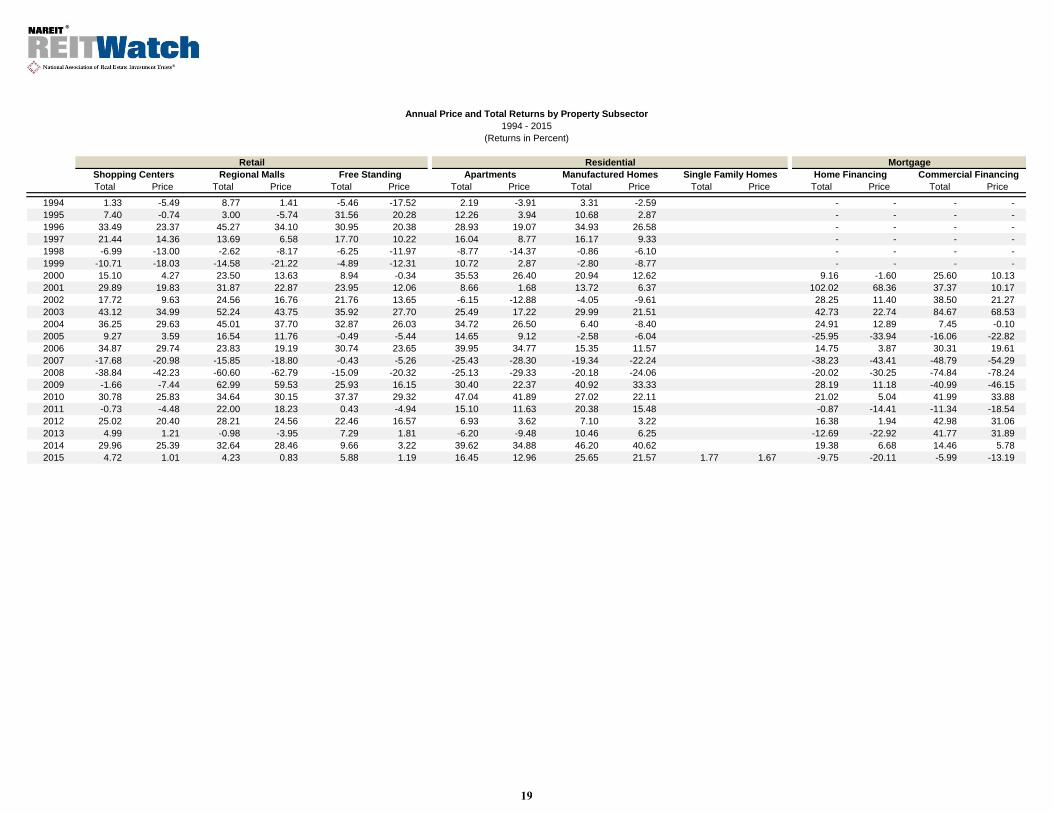
Annual Price and Total Returns by Property Sector
1994 - 2015(Returns in Percent)
Office Industrial Retail Residential Diversified Health Care Lodging/Resorts Self Storage Timber Infrastructure Data Centers Specialty MortgageTotal Price Total Price Total Price Total Price Total Price Total Price Total Price Total Price Total Price Total Price Total Price Total Price Total Price
Annual Price and Total Returns by Property Subsector1994 - 2015
(Returns in Percent)
Retail Residential MortgageShopping Centers Regional Malls Free Standing Apartments Manufactured Homes Single Family Homes Home Financing Commercial FinancingTotal Price Total Price Total Price Total Price Total Price Total Price Total Price Total Price
Equity Market Capitalization(Millions of dollars at year end)
Note:Market capitalization equals share price multiplied by the number of shares outstanding and does not include Operating Partnership Units.1The FTSE NAREIT Hybrid REIT Index was discontinued on December 17, 2010.
20
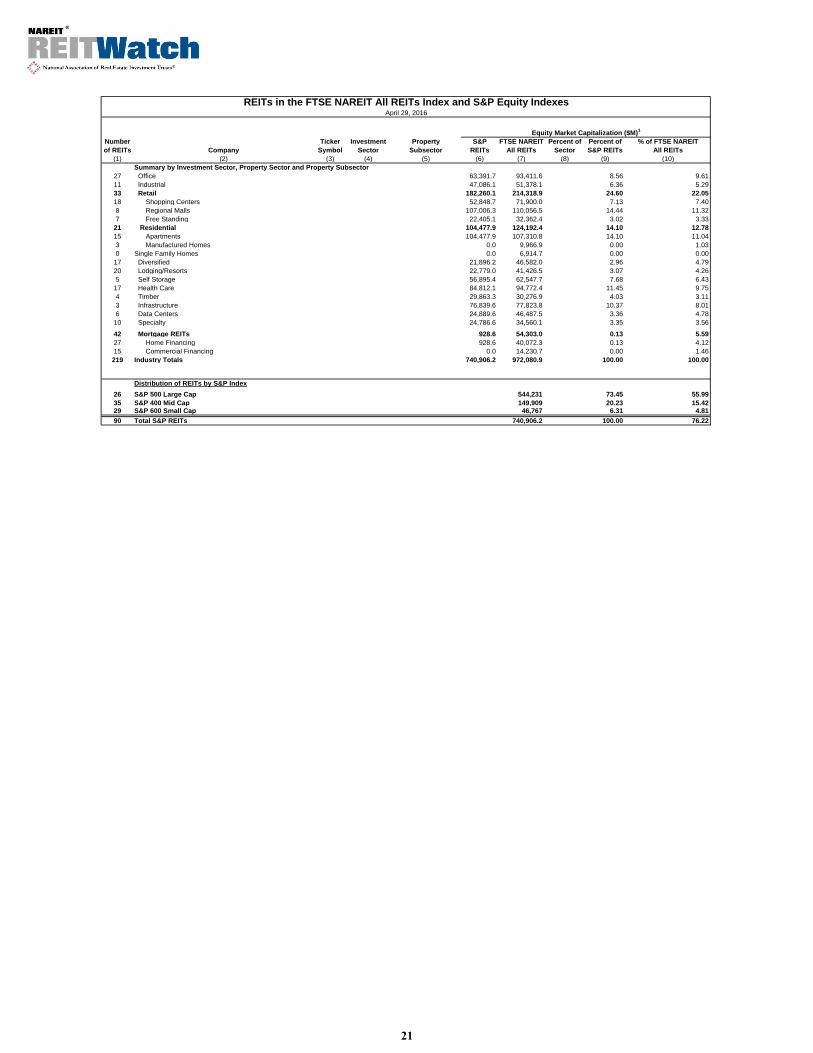
April 29, 2016
Number Ticker Investment Property S&P FTSE NAREIT Percent of Percent of % of FTSE NAREITof REITs Company Symbol Sector Subsector REITs All REITs Sector S&P REITs All REITs
(1) (2) (3) (4) (5) (6) (7) (8) (9) (10)Summary by Investment Sector, Property Sector and Property Subsector
Distribution of REITs by S&P Index26 S&P 500 Large Cap 544,231 73.45 55.9935 S&P 400 Mid Cap 149,909 20.23 15.4229 S&P 600 Small Cap 46,767 6.31 4.8190 Total S&P REITs 740,906.2 100.00 76.22
REITs in the FTSE NAREIT All REITs Index and S&P Equity Indexes
Equity Market Capitalization ($M)1
21
April 29, 2016REITs in the FTSE NAREIT All REITs Index and S&P Equity Indexes
S&P 500 Constituents Equity Market Cap ($M)1 Simon Property Group, Inc. 62,521.22 American Tower Corporation 44,318.03 Public Storage 42,264.14 Crown Castle International Corp 29,024.25 Weyerhaeuser Company 25,379.56 Equity Residential 24,776.77 General Growth Properties, Inc. 24,769.58 Welltower, Inc. 24,653.99 AvalonBay Communities, Inc. 24,198.5
10 Prologis, Inc. 23,797.011 Equinix, Inc. 22,593.512 Ventas, Inc. 20,876.713 Boston Properties, Inc. 19,768.014 Vornado Realty Trust 18,023.415 HCP, Inc. 15,732.416 Realty Income Corporation 14,776.317 Essex Property Trust, Inc. 14,462.018 Macerich Company 12,016.519 Host Hotels & Resorts, Inc. 11,961.720 Kimco Realty Corporation 11,558.921 Federal Realty Investment Trust 10,770.222 Extra Space Storage Inc. 10,487.723 SL Green Realty Corp. 10,464.124 Iron Mountain, Inc. 9,627.225 UDR, Inc. 9,149.226 Apartment Investment and Management Company Class A 6,260.526 Subtotal 544,230.7
S&P 400 Mid Cap Constituents1 Duke Realty Corporation 7,546.22 Mid-America Apartment Communities, Inc. 7,202.63 Regency Centers Corporation 7,193.64 Camden Property Trust 6,974.95 Alexandria Real Estate Equities, Inc. 6,820.56 Omega Healthcare Investors, Inc. 6,316.57 National Retail Properties, Inc. 6,172.28 Kilroy Realty Corporation 5,976.09 American Campus Communities, Inc. 5,830.5
10 Liberty Property Trust 5,157.211 Lamar Advertising Company Class A 5,069.312 Douglas Emmett, Inc 4,781.213 Weingarten Realty Investors 4,574.614 Highwoods Properties, Inc. 4,454.615 Taubman Centers, Inc. 4,183.216 Senior Housing Properties Trust 4,173.517 EPR Properties 4,155.318 Sovran Self Storage, Inc. 4,143.719 Equity One, Inc. 3,987.320 Hospitality Properties Trust 3,876.521 Corrections Corporation of America 3,559.822 DCT Industrial Trust Inc. 3,555.323 Communications Sales & Leasing Inc 3,497.524 Tanger Factory Outlet Centers, Inc. 3,362.325 Post Properties, Inc. 3,108.726 Healthcare Realty Trust Incorporated 3,094.927 Rayonier Inc. 3,054.228 LaSalle Hotel Properties 2,696.129 Urban Edge Properties 2,574.530 First Industrial Realty Trust, Inc. 2,522.531 Corporate Office Properties Trust 2,427.732 Mack-Cali Realty Corporation 2,274.533 Care Capital Properties, Inc. 2,231.634 WP GLIMCHER, Inc 1,930.335 Potlatch Corporation 1,429.635 Subtotal 149,908.9
S&P 600 Small Cap Constituents1 Medical Properties Trust, Inc. 3,165.62 PS Business Parks, Inc. 2,577.83 Education Realty Trust, Inc. 2,514.34 GEO Group Inc 2,374.95 Acadia Realty Trust 2,374.66 CoreSite Realty Corporation 2,296.17 Kite Realty Group Trust 2,258.48 Cousins Properties Incorporated 2,188.49 Lexington Realty Trust 2,071.6
10 Retail Opportunity Investments Corp. 1,942.811 EastGroup Properties, Inc. 1,930.112 Parkway Properties, Inc. 1,827.913 American Assets Trust, Inc. 1,801.314 DiamondRock Hospitality Company 1,788.315 LTC Properties, Inc. 1,741.516 Pennsylvania Real Estate Investment Trust 1,585.617 Chesapeake Lodging Trust 1,469.218 Sabra Health Care REIT, Inc. 1,373.719 Government Properties Income Trust 1,344.920 Saul Centers, Inc. 1,122.121 Franklin Street Properties Corp. 1,064.022 Summit Hotel Properties, Inc., 987.223 Capstead Mortgage Corporation 928.624 Agree Realty Corporation 799.425 Universal Health Realty Income Trust 726.326 CareTrust REIT Inc 725.627 Getty Realty Corp. 657.228 Cedar Realty Trust, Inc. 582.829 Urstadt Biddle Properties Inc. Class A 546.529 Subtotal 46,766.790 Total 740,906.2
Summary of REITs in S&P Equity Indexes
22
April 29, 2016REITs in the FTSE NAREIT All REITs Index and S&P Equity Indexes
Property Sector: Office1 Boston Properties, Inc. BXP Equity S&P 500 19,768.0 21.16 2.67 2.032 SL Green Realty Corp. SLG Equity S&P 500 10,464.1 11.20 1.41 1.083 Alexandria Real Estate Equities, Inc. ARE Equity S&P 400 6,820.5 7.30 0.92 0.704 Kilroy Realty Corporation KRC Equity S&P 400 5,976.0 6.40 0.81 0.615 Douglas Emmett, Inc DEI Equity S&P 400 4,781.2 5.12 0.65 0.496 Highwoods Properties, Inc. HIW Equity S&P 400 4,454.6 4.77 0.60 0.467 Gramercy Property Trust GPT Equity 3,551.3 3.80 0.378 Paramount Group, Inc. PGRE Equity 3,538.7 3.79 0.369 Equity Commonwealth EQC Equity 3,526.4 3.78 0.36
10 Piedmont Office Realty Trust, Inc. Class A PDM Equity 2,897.1 3.10 0.3011 Columbia Property Trust, Inc. CXP Equity 2,753.5 2.95 0.2812 Brandywine Realty Trust BDN Equity 2,619.2 2.80 0.2713 Hudson Pacific Properties, Inc. HPP Equity 2,617.6 2.80 0.2714 Corporate Office Properties Trust OFC Equity S&P 400 2,427.7 2.60 0.33 0.2515 Mack-Cali Realty Corporation CLI Equity S&P 400 2,274.5 2.43 0.31 0.2316 Empire State Realty Trust, Inc. Class A ESRT Equity 2,212.0 2.37 0.2317 Cousins Properties Incorporated CUZ Equity S&P 600 2,188.4 2.34 0.30 0.2318 Select Income REIT SIR Equity 2,068.0 2.21 0.2119 Parkway Properties, Inc. PKY Equity S&P 600 1,827.9 1.96 0.25 0.1920 New York REIT, Inc. NYRT Equity 1,606.6 1.72 0.1721 Government Properties Income Trust GOV Equity S&P 600 1,344.9 1.44 0.18 0.1422 Franklin Street Properties Corp. FSP Equity S&P 600 1,064.0 1.14 0.14 0.1123 NorthStar Realty Europe Corp. NRE Equity 751.7 0.80 0.0824 TIER REIT, Inc. TIER Equity 715.3 0.77 0.0725 First Potomac Realty Trust FPO Equity 486.3 0.52 0.0526 Easterly Government Properties, Inc. DEA Equity 445.9 0.48 0.0527 City Office REIT, Inc. CIO Equity 230.4 0.25 0.0227 Sector Totals 93,411.6 100.00 8.56 9.6112 S&P Sector Total 63,391.7
Property Sector: Industrial1 Prologis, Inc. PLD Equity S&P 500 23,797.0 46.32 3.21 2.452 Duke Realty Corporation DRE Equity S&P 400 7,546.2 14.69 1.02 0.783 Liberty Property Trust LPT Equity S&P 400 5,157.2 10.04 0.70 0.534 DCT Industrial Trust Inc. DCT Equity S&P 400 3,555.3 6.92 0.48 0.375 PS Business Parks, Inc. PSB Equity S&P 600 2,577.8 5.02 0.35 0.276 First Industrial Realty Trust, Inc. FR Equity S&P 400 2,522.5 4.91 0.34 0.267 EastGroup Properties, Inc. EGP Equity S&P 600 1,930.1 3.76 0.26 0.208 STAG Industrial, Inc. STAG Equity 1,358.8 2.64 0.149 Rexford Industrial Realty, Inc. REXR Equity 1,213.7 2.36 0.12
10 Terreno Realty Corporation TRNO Equity 979.4 1.91 0.1011 Monmouth Real Estate Investment Corporation Class A MNR Equity 740.0 1.44 0.0811 Sector Totals 51,378.1 100.00 6.36 5.297 S&P Sector Total 47,086.1
33 Sector Totals 214,318.9 24.60 22.0523 S&P Sector Total 182,260.1
23
April 29, 2016REITs in the FTSE NAREIT All REITs Index and S&P Equity Indexes
Property Sector: Residential1 Equity Residential EQR Equity Apartments S&P 500 24,776.7 23.09 3.34 2.552 AvalonBay Communities, Inc. AVB Equity Apartments S&P 500 24,198.5 22.55 3.27 2.493 Essex Property Trust, Inc. ESS Equity Apartments S&P 500 14,462.0 13.48 1.95 1.494 UDR, Inc. UDR Equity Apartments S&P 500 9,149.2 8.53 1.23 0.945 Mid-America Apartment Communities, Inc. MAA Equity Apartments S&P 400 7,202.6 6.71 0.97 0.746 Camden Property Trust CPT Equity Apartments S&P 400 6,974.9 6.50 0.94 0.727 Apartment Investment and Management Company Class A AIV Equity Apartments S&P 500 6,260.5 5.83 0.84 0.648 American Campus Communities, Inc. ACC Equity Apartments S&P 400 5,830.5 5.43 0.79 0.609 Post Properties, Inc. PPS Equity Apartments S&P 400 3,108.7 2.90 0.42 0.32
10 Education Realty Trust, Inc. EDR Equity Apartments S&P 600 2,514.3 2.34 0.34 0.2611 Monogram Residential Trust Inc MORE Equity Apartments 1,710.6 1.59 0.1812 Independence Realty Trust, Inc. IRT Equity Apartments 336.2 0.31 0.0313 NexPoint Residential Trust Inc NXRT Equity Apartments 301.0 0.28 0.0314 Preferred Apartment Communities, Inc. APTS Equity Apartments 275.1 0.26 0.0315 Bluerock Residential Growth REIT, Inc. Class A BRG Equity Apartments 210.1 0.20 0.0215 Subsector Totals 107,310.8 100.00 14.10 11.0410 S&P Subsector Total 104,477.91 Equity LifeStyle Properties, Inc. ELS Equity Manufactured Homes 5,746.3 57.65 0.592 Sun Communities, Inc. SUI Equity Manufactured Homes 3,955.9 39.69 0.413 UMH Properties, Inc. UMH Equity Manufactured Homes 264.7 2.66 0.033 Subsector Totals 9,966.9 100.00 0.00 1.030 S&P Subsector Total 0.01 American Homes 4 Rent Class A AMH Equity Single Family Homes 3,881.7 56.14 0.402 Colony Starwood Homes SFR Equity Single Family Homes 2,506.3 36.25 0.263 Silver Bay Realty Trust Corp. SBY Equity Single Family Homes 526.6 7.62 0.053 Subsector Totals 6,914.7 100.00 0.00 0.710 S&P Subsector Total 0.0
21 Sector Totals 124,192.4 14.10 12.7810 S&P Sector Total 104,477.9
Property Sector: Diversified1 Vornado Realty Trust VNO Equity S&P 500 18,023.4 38.69 2.43 1.852 VEREIT, Inc. Class A VER Equity 8,037.6 17.25 0.833 W. P. Carey Inc. WPC Equity 6,317.6 13.56 0.654 NorthStar Realty Finance Corp. NRF Equity 2,218.1 4.76 0.235 Lexington Realty Trust LXP Equity S&P 600 2,071.6 4.45 0.28 0.216 Washington Real Estate Investment Trust WRE Equity 1,953.6 4.19 0.207 Alexander's, Inc. ALX Equity 1,944.2 4.17 0.208 American Assets Trust, Inc. AAT Equity S&P 600 1,801.3 3.87 0.24 0.199 Global Net Lease Inc GNL Equity 1,432.0 3.07 0.15
10 Investors Real Estate Trust IRET Equity 737.0 1.58 0.0811 Winthrop Realty Trust FUR Equity 463.0 0.99 0.0512 One Liberty Properties, Inc. OLP Equity 391.2 0.84 0.0413 Gladstone Commercial Corporation GOOD Equity 371.4 0.80 0.0414 Whitestone REIT WSR Equity 362.3 0.78 0.0415 Armada Hoffler Properties, Inc. AHH Equity 346.6 0.74 0.0416 BRT Realty Trust BRT Equity 100.3 0.22 0.0117 HMG/Courtland Properties, Inc. HMG Equity 10.9 0.02 0.0017 Sector Totals 46,582.0 100.00 2.96 4.793 S&P Sector Total 21,896.2
Property Sector: Self Storage1 Public Storage PSA Equity S&P 500 42,264.1 67.57 5.70 4.352 Extra Space Storage Inc. EXR Equity S&P 500 10,487.7 16.77 1.42 1.083 CubeSmart CUBE Equity 5,203.3 8.32 0.544 Sovran Self Storage, Inc. SSS Equity S&P 400 4,143.7 6.62 0.56 0.435 National Storage Affiliates Trust NSA Equity 449.0 0.72 0.055 Sector Totals 62,547.7 100.00 7.68 6.433 S&P Sector Total 56,895.4
Property Sector: Health Care1 Welltower, Inc. HCN Equity S&P 500 24,653.9 26.01 3.33 2.542 Ventas, Inc. VTR Equity S&P 500 20,876.7 22.03 2.82 2.153 HCP, Inc. HCP Equity S&P 500 15,732.4 16.60 2.12 1.624 Omega Healthcare Investors, Inc. OHI Equity S&P 400 6,316.5 6.66 0.85 0.655 Senior Housing Properties Trust SNH Equity S&P 400 4,173.5 4.40 0.56 0.436 Healthcare Trust of America, Inc. Class A HTA Equity 3,770.5 3.98 0.397 Medical Properties Trust, Inc. MPW Equity S&P 600 3,165.6 3.34 0.43 0.338 Healthcare Realty Trust Incorporated HR Equity S&P 400 3,094.9 3.27 0.42 0.329 National Health Investors, Inc. NHI Equity 2,614.7 2.76 0.27
10 Physicians Realty Trust DOC Equity 2,442.0 2.58 0.2511 Care Capital Properties, Inc. CCP Equity S&P 400 2,231.6 2.35 0.30 0.2312 LTC Properties, Inc. LTC Equity S&P 600 1,741.5 1.84 0.24 0.1813 Sabra Health Care REIT, Inc. SBRA Equity S&P 600 1,373.7 1.45 0.19 0.1414 New Senior Investment Group Inc SNR Equity 898.6 0.95 0.0915 Universal Health Realty Income Trust UHT Equity S&P 600 726.3 0.77 0.10 0.0716 CareTrust REIT Inc CTRE Equity S&P 600 725.6 0.77 0.10 0.0717 Community Healthcare Trust, Inc. CHCT Equity 234.6 0.25 0.0217 Sector Totals 94,772.4 100.00 11.45 9.7512 S&P Sector Total 84,812.1
24
April 29, 2016REITs in the FTSE NAREIT All REITs Index and S&P Equity Indexes
Property Sector: Timber1 Weyerhaeuser Company WY Equity S&P 500 25,379.5 83.82 3.43 2.612 Rayonier Inc. RYN Equity S&P 400 3,054.2 10.09 0.41 0.313 Potlatch Corporation PCH Equity S&P 400 1,429.6 4.72 0.19 0.154 CatchMark Timber Trust, Inc. Class A CTT Equity 413.5 1.37 0.044 Sector Totals 30,276.9 100.00 4.03 3.113 S&P Sector Total 29,863.3
Property Sector: Infrastructure1 American Tower Corporation AMT Equity S&P 500 44,318.0 56.95 5.98 4.562 Crown Castle International Corp CCI Equity S&P 500 29,024.2 37.29 3.92 2.993 Communications Sales & Leasing Inc CSAL Equity S&P 400 3,497.5 4.49 0.47 0.364 InfraREIT, Inc. HIFR Equity 722.3 0.93 0.075 CorEnergy Infrastructure Trust, Inc. CORR Equity 253.9 0.33 0.036 Power REIT PW Equity 8.0 0.01 0.006 Sector Totals 77,823.8 100.00 10.37 8.013 S&P Sector Total 76,839.6
Property Sector: Data Centers1 Equinix, Inc. EQIX Equity S&P 500 22,593.5 48.60 3.05 2.322 Digital Realty Trust, Inc. DLR Equity 12,875.3 27.70 1.323 CyrusOne, Inc. CONE Equity 3,493.1 7.51 0.364 DuPont Fabros Technology, Inc. DFT Equity 2,924.0 6.29 0.305 QTS Realty Trust, Inc. Class A QTS Equity 2,305.5 4.96 0.246 CoreSite Realty Corporation COR Equity S&P 600 2,296.1 4.94 0.31 0.246 Sector Totals 46,487.5 100.00 3.36 4.782 S&P Sector Total 24,889.6
Property Sector: Specialty1 Iron Mountain, Inc. IRM Equity S&P 500 9,627.2 27.86 1.30 0.992 Gaming and Leisure Properties, Inc. GLPI Equity 6,462.8 18.70 0.663 Lamar Advertising Company Class A LAMR Equity S&P 400 5,069.3 14.67 0.68 0.524 EPR Properties EPR Equity S&P 400 4,155.3 12.02 0.56 0.435 Corrections Corporation of America CXW Equity S&P 400 3,559.8 10.30 0.48 0.376 OUTFRONT Media Inc. OUT Equity 2,961.1 8.57 0.307 GEO Group Inc GEO Equity S&P 600 2,374.9 6.87 0.32 0.248 Farmland Partners, Inc. FPI Equity 129.3 0.37 0.019 American Farmland Company AFCO Equity 116.7 0.34 0.01
10 Gladstone Land Corp. LAND Equity 103.6 0.30 0.0110 Sector Totals 34,560.1 100.00 3.35 3.565 S&P Sector Total 24,786.6
Investment Sector: Mortgage1 Annaly Capital Management, Inc. NLY Mortgage Home Financing 9,870.3 24.63 1.022 American Capital Agency Corp. AGNC Mortgage Home Financing 6,407.5 15.99 0.663 Two Harbors Investment Corp. TWO Mortgage Home Financing 2,859.9 7.14 0.294 New Residential Investment Corp. NRZ Mortgage Home Financing 2,788.1 6.96 0.295 Chimera Investment Corporation CIM Mortgage Home Financing 2,684.0 6.70 0.286 MFA Financial, Inc. MFA Mortgage Home Financing 2,559.2 6.39 0.267 Hatteras Financial Corp. HTS Mortgage Home Financing 1,535.2 3.83 0.168 Invesco Mortgage Capital Inc. IVR Mortgage Home Financing 1,460.0 3.64 0.159 CYS Investments, Inc. CYS Mortgage Home Financing 1,230.8 3.07 0.13
10 Redwood Trust, Inc. RWT Mortgage Home Financing 1,064.3 2.66 0.1111 PennyMac Mortgage Investment Trust PMT Mortgage Home Financing 1,002.5 2.50 0.1012 Capstead Mortgage Corporation CMO Mortgage Home Financing S&P 600 928.6 2.32 0.13 0.1013 ARMOUR Residential REIT, Inc. ARR Mortgage Home Financing 847.8 2.12 0.0914 American Capital Mortgage Investment Corp. MTGE Mortgage Home Financing 741.7 1.85 0.0815 Altisource Residential Corp. Class B RESI Mortgage Home Financing 650.6 1.62 0.0716 New York Mortgage Trust, Inc. NYMT Mortgage Home Financing 568.7 1.42 0.0617 Anworth Mortgage Asset Corporation ANH Mortgage Home Financing 472.5 1.18 0.0518 Apollo Residential Mortgage, Inc. AMTG Mortgage Home Financing 434.4 1.08 0.0419 Western Asset Mortgage Capital Corporation WMC Mortgage Home Financing 415.9 1.04 0.0420 AG Mortgage Investment Trust, Inc. MITT Mortgage Home Financing 380.0 0.95 0.0421 Dynex Capital, Inc. DX Mortgage Home Financing 319.6 0.80 0.0322 Great Ajax Corp. AJX Mortgage Home Financing 216.3 0.54 0.0223 Orchid Island Capital, Inc. ORC Mortgage Home Financing 210.7 0.53 0.0224 ZAIS Financial Corp. ZFC Mortgage Home Financing 116.0 0.29 0.0125 Ellington Residential Mortgage REIT EARN Mortgage Home Financing 112.1 0.28 0.0127 Cherry Hill Mortgage Investment Corp. CHMI Mortgage Home Financing 106.6 0.27 0.0128 Five Oaks Investment Corp. OAKS Mortgage Home Financing 89.0 0.22 0.0127 Subsector Totals 40,072.3 100.00 0.13 4.121 S&P Subsector Total 928.6
1 Starwood Property Trust, Inc. STWD Mortgage Commercial Financing 4,575.3 32.15 0.472 Blackstone Mortgage Trust, Inc. Class A BXMT Mortgage Commercial Financing 2,562.0 18.00 0.263 Colony Capital, Inc. Class A CLNY Mortgage Commercial Financing 1,974.9 13.88 0.204 Apollo Commercial Real Estate Finance, Inc. ARI Mortgage Commercial Financing 930.8 6.54 0.105 iStar Inc. STAR Mortgage Commercial Financing 745.5 5.24 0.086 Hannon Armstrong Sustainable Infrastructure Capital, Inc. HASI Mortgage Commercial Financing 742.4 5.22 0.087 Ladder Capital Corp. Class A LADR Mortgage Commercial Financing 725.9 5.10 0.078 Resource Capital Corp. RSO Mortgage Commercial Financing 376.8 2.65 0.049 Ares Commercial Real Estate Corporation ACRE Mortgage Commercial Financing 341.7 2.40 0.04
42 Sector Totals 54,303.0 0.13 5.591 S&P Sector Total 928.6
26 S&P 500 Large Cap 544,230.7 73.45 55.9935 S&P 400 Mid Cap 149,908.9 20.23 15.4229 S&P 600 Small Cap 46,766.7 6.31 4.8183 S&P Index Total 740,906.2 100.00 76.22
219 Industry Total 972,080.9 100.001 Equity market capitalization does not include operating partnership units or preferred stock.
25
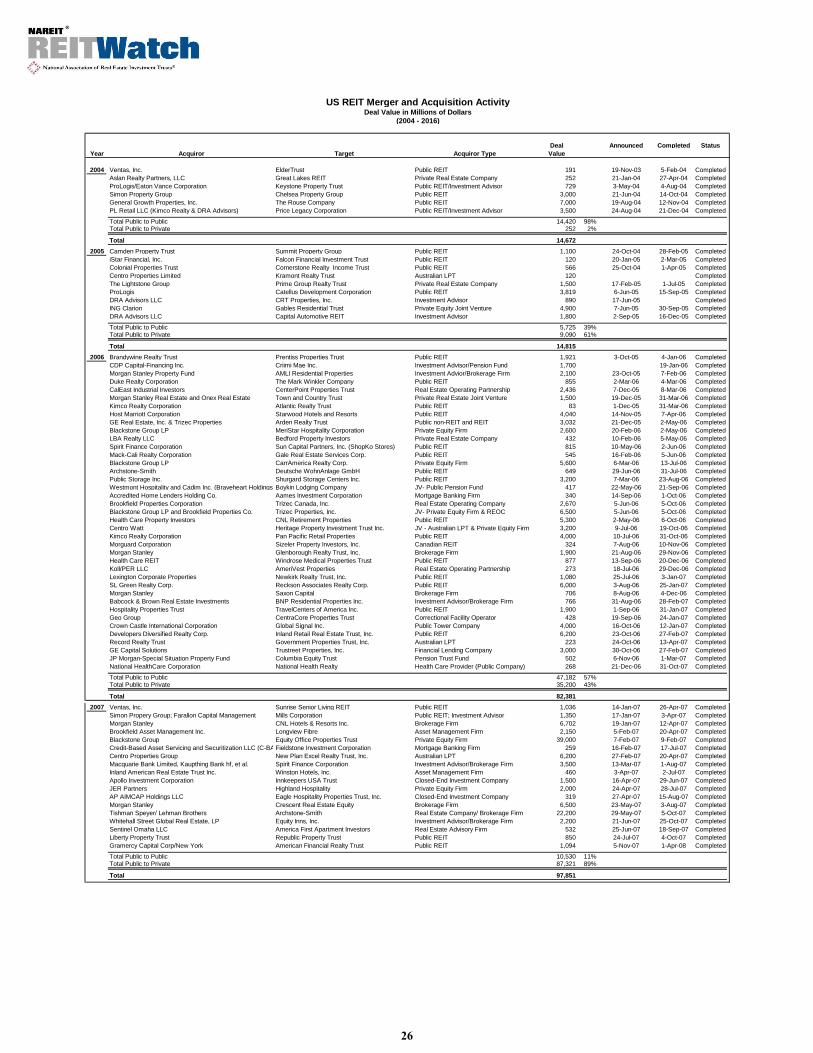
US REIT Merger and Acquisition ActivityDeal Value in Millions of Dollars
(2004 - 2016)
Deal Announced Completed StatusYear Acquiror Target Acquiror Type Value
2004 Ventas, Inc. ElderTrust Public REIT 191 19-Nov-03 5-Feb-04 CompletedAslan Realty Partners, LLC Great Lakes REIT Private Real Estate Company 252 21-Jan-04 27-Apr-04 CompletedProLogis/Eaton Vance Corporation Keystone Property Trust Public REIT/Investment Advisor 729 3-May-04 4-Aug-04 CompletedSimon Property Group Chelsea Property Group Public REIT 3,000 21-Jun-04 14-Oct-04 CompletedGeneral Growth Properties, Inc. The Rouse Company Public REIT 7,000 19-Aug-04 12-Nov-04 CompletedPL Retail LLC (Kimco Realty & DRA Advisors) Price Legacy Corporation Public REIT/Investment Advisor 3,500 24-Aug-04 21-Dec-04 Completed
Total Public to Public 14,420 98%Total Public to Private 252 2%
Total 14,6722005 Camden Property Trust Summit Property Group Public REIT 1,100 24-Oct-04 28-Feb-05 Completed
iStar Financial, Inc. Falcon Financial Investment Trust Public REIT 120 20-Jan-05 2-Mar-05 CompletedColonial Properties Trust Cornerstone Realty Income Trust Public REIT 566 25-Oct-04 1-Apr-05 CompletedCentro Properties Limited Kramont Realty Trust Australian LPT 120 CompletedThe Lightstone Group Prime Group Realty Trust Private Real Estate Company 1,500 17-Feb-05 1-Jul-05 CompletedProLogis Catellus Development Corporation Public REIT 3,819 6-Jun-05 15-Sep-05 CompletedDRA Advisors LLC CRT Properties, Inc. Investment Advisor 890 17-Jun-05 CompletedING Clarion Gables Residential Trust Private Equity Joint Venture 4,900 7-Jun-05 30-Sep-05 CompletedDRA Advisors LLC Capital Automotive REIT Investment Advisor 1,800 2-Sep-05 16-Dec-05 Completed
Total Public to Public 5,725 39%Total Public to Private 9,090 61%
Total 14,8152006 Brandywine Realty Trust Prentiss Properties Trust Public REIT 1,921 3-Oct-05 4-Jan-06 Completed
CDP Capital-Financing Inc. Criimi Mae Inc. Investment Advisor/Pension Fund 1,700 19-Jan-06 CompletedMorgan Stanley Property Fund AMLI Residential Properties Investment Advior/Brokerage Firm 2,100 23-Oct-05 7-Feb-06 CompletedDuke Realty Corporation The Mark Winkler Company Public REIT 855 2-Mar-06 4-Mar-06 CompletedCalEast Industrial Investors CenterPoint Properties Trust Real Estate Operating Partnership 2,436 7-Dec-05 8-Mar-06 CompletedMorgan Stanley Real Estate and Onex Real Estate Town and Country Trust Private Real Estate Joint Venture 1,500 19-Dec-05 31-Mar-06 CompletedKimco Realty Corporation Atlantic Realty Trust Public REIT 83 1-Dec-05 31-Mar-06 CompletedHost Marriott Corporation Starwood Hotels and Resorts Public REIT 4,040 14-Nov-05 7-Apr-06 CompletedGE Real Estate, Inc. & Trizec Properties Arden Realty Trust Public non-REIT and REIT 3,032 21-Dec-05 2-May-06 CompletedBlackstone Group LP MeriStar Hospitality Corporation Private Equity Firm 2,600 20-Feb-06 2-May-06 CompletedLBA Realty LLC Bedford Property Investors Private Real Estate Company 432 10-Feb-06 5-May-06 CompletedSpirit Finance Corporation Sun Capital Partners, Inc. (ShopKo Stores) Public REIT 815 10-May-06 2-Jun-06 CompletedMack-Cali Realty Corporation Gale Real Estate Services Corp. Public REIT 545 16-Feb-06 5-Jun-06 CompletedBlackstone Group LP CarrAmerica Realty Corp. Private Equity Firm 5,600 6-Mar-06 13-Jul-06 CompletedArchstone-Smith Deutsche WohnAnlage GmbH Public REIT 649 29-Jun-06 31-Jul-06 CompletedPublic Storage Inc. Shurgard Storage Centers Inc. Public REIT 3,200 7-Mar-06 23-Aug-06 CompletedWestmont Hospitality and Cadim Inc. (Braveheart Holdings LP)Boykin Lodging Company JV- Public Pension Fund 417 22-May-06 21-Sep-06 CompletedAccredited Home Lenders Holding Co. Aames Investment Corporation Mortgage Banking Firm 340 14-Sep-06 1-Oct-06 CompletedBrookfield Properties Corporation Trizec Canada, Inc. Real Estate Operating Company 2,670 5-Jun-06 5-Oct-06 CompletedBlackstone Group LP and Brookfield Properties Co. Trizec Properties, Inc. JV- Private Equity Firm & REOC 6,500 5-Jun-06 5-Oct-06 CompletedHealth Care Property Investors CNL Retirement Properties Public REIT 5,300 2-May-06 6-Oct-06 CompletedCentro Watt Heritage Property Investment Trust Inc. JV - Australian LPT & Private Equity Firm 3,200 9-Jul-06 19-Oct-06 CompletedKimco Realty Corporation Pan Pacific Retail Properties Public REIT 4,000 10-Jul-06 31-Oct-06 CompletedMorguard Corporation Sizeler Property Investors, Inc. Canadian REIT 324 7-Aug-06 10-Nov-06 CompletedMorgan Stanley Glenborough Realty Trust, Inc. Brokerage Firm 1,900 21-Aug-06 29-Nov-06 CompletedHealth Care REIT Windrose Medical Properties Trust Public REIT 877 13-Sep-06 20-Dec-06 CompletedKoll/PER LLC AmeriVest Properties Real Estate Operating Partnership 273 18-Jul-06 29-Dec-06 CompletedLexington Corporate Properties Newkirk Realty Trust, Inc. Public REIT 1,080 25-Jul-06 3-Jan-07 CompletedSL Green Realty Corp. Reckson Associates Realty Corp. Public REIT 6,000 3-Aug-06 25-Jan-07 CompletedMorgan Stanley Saxon Capital Brokerage Firm 706 8-Aug-06 4-Dec-06 CompletedBabcock & Brown Real Estate Investments BNP Residential Properties Inc. Investment Advisor/Brokerage Firm 766 31-Aug-06 28-Feb-07 CompletedHospitality Properties Trust TravelCenters of America Inc. Public REIT 1,900 1-Sep-06 31-Jan-07 CompletedGeo Group CentraCore Properties Trust Correctional Facility Operator 428 19-Sep-06 24-Jan-07 CompletedCrown Castle International Corporation Global Signal Inc. Public Tower Company 4,000 16-Oct-06 12-Jan-07 CompletedDevelopers Diversified Realty Corp. Inland Retail Real Estate Trust, Inc. Public REIT 6,200 23-Oct-06 27-Feb-07 CompletedRecord Realty Trust Government Properties Trust, Inc. Australian LPT 223 24-Oct-06 13-Apr-07 CompletedGE Capital Solutions Trustreet Properties, Inc. Financial Lending Company 3,000 30-Oct-06 27-Feb-07 CompletedJP Morgan-Special Situation Property Fund Columbia Equity Trust Pension Trust Fund 502 6-Nov-06 1-Mar-07 CompletedNational HealthCare Corporation National Health Realty Health Care Provider (Public Company) 268 21-Dec-06 31-Oct-07 Completed
Total Public to Public 47,182 57%Total Public to Private 35,200 43%
Total 82,3812007 Ventas, Inc. Sunrise Senior Living REIT Public REIT 1,036 14-Jan-07 26-Apr-07 Completed
Simon Propery Group; Farallon Capital Management Mills Corporation Public REIT; Investment Advisor 1,350 17-Jan-07 3-Apr-07 CompletedMorgan Stanley CNL Hotels & Resorts Inc. Brokerage Firm 6,702 19-Jan-07 12-Apr-07 CompletedBrookfield Asset Management Inc. Longview Fibre Asset Management Firm 2,150 5-Feb-07 20-Apr-07 CompletedBlackstone Group Equity Office Properties Trust Private Equity Firm 39,000 7-Feb-07 9-Feb-07 CompletedCredit-Based Asset Servicing and Securitization LLC (C-BASS)Fieldstone Investment Corporation Mortgage Banking Firm 259 16-Feb-07 17-Jul-07 CompletedCentro Properties Group New Plan Excel Realty Trust, Inc. Australian LPT 6,200 27-Feb-07 20-Apr-07 CompletedMacquarie Bank Limited, Kaupthing Bank hf, et al. Spirit Finance Corporation Investment Advisor/Brokerage Firm 3,500 13-Mar-07 1-Aug-07 CompletedInland American Real Estate Trust Inc. Winston Hotels, Inc. Asset Management Firm 460 3-Apr-07 2-Jul-07 CompletedApollo Investment Corporation Innkeepers USA Trust Closed-End Investment Company 1,500 16-Apr-07 29-Jun-07 CompletedJER Partners Highland Hospitality Private Equity Firm 2,000 24-Apr-07 28-Jul-07 CompletedAP AIMCAP Holdings LLC Eagle Hospitality Properties Trust, Inc. Closed-End Investment Company 319 27-Apr-07 15-Aug-07 CompletedMorgan Stanley Crescent Real Estate Equity Brokerage Firm 6,500 23-May-07 3-Aug-07 CompletedTishman Speyer/ Lehman Brothers Archstone-Smith Real Estate Company/ Brokerage Firm 22,200 29-May-07 5-Oct-07 CompletedWhitehall Street Global Real Estate, LP Equity Inns, Inc. Investment Advisor/Brokerage Firm 2,200 21-Jun-07 25-Oct-07 CompletedSentinel Omaha LLC America First Apartment Investors Real Estate Advisory Firm 532 25-Jun-07 18-Sep-07 CompletedLiberty Property Trust Republic Property Trust Public REIT 850 24-Jul-07 4-Oct-07 CompletedGramercy Capital Corp/New York American Financial Realty Trust Public REIT 1,094 5-Nov-07 1-Apr-08 Completed
Total Public to Public 10,530 11%Total Public to Private 87,321 89%
Total 97,851
26
US REIT Merger and Acquisition ActivityDeal Value in Millions of Dollars
(2004 - 2016)
Deal Announced Completed StatusYear Acquiror Target Acquiror Type Value
2008 American Campus Communities GMH Communities Trust Public REIT 1,400 12-Feb-08 11-Jun-08 CompletedHypo Real Estate Bank AG Quadra Realty Trust Brokerage Firm 179 29-Jan-08 14-Mar-08 CompletedBoston Properties Macklowe Properties (NYC Office Portfolio) Public REIT 3,950 24-May-08 10-Jun-08 CompletedAmerican Land Lease Green Courte Real Estate Partners Private Equity Firm 113 10-Dec-08 16-Mar-09 Completed
Total Public to Public 5,350 95%Total Public to Private 292 5%
Total 5,6422009 No Deals
2010 Brookfield Asset Management Inc. Crystal River Capital, Inc. Asset Management Firm 14 24-Feb-10 30-Jul-10 CompletedTiptree Financial Partners, LP Care Investment Trust, Inc. Real Estate Advisory Firm 97 16-Mar-10 13-Aug-10 CompletedHCP, Inc. HCR ManorCare, Inc. Public REIT 6,080 14-Dec-10 8-Apr-11 Completed
Total Public to Public 6,080 98%Total Public to Private 111 2%
Total 6,1912011 AMB Property Corp. ProLogis Public REIT 16,517 31-Jan-11 3-Jun-11 Completed
Ventas, Inc. Nationwide Health Properties, Inc. Public REIT 7,010 28-Feb-11 1-Jul-11 CompletedVentas, Inc. Cogdell Spencer, Inc. Public REIT 635 27-Dec-11 2-Apr-12 Completed
Total Public to Public 24,162 100%Total Public to Private 0%
Total 24,1622012 Realty Income Corp. American Realty Capital Trust, Inc. Public REIT 2,887 6-Sep-12 22-Jan-13 Completed
HCP, Inc. Emeritus; Blackstone JV (Portfolio Acquisition) Public REIT 1,730 16-Oct-12 31-Oct-12 CompletedAvalonBay Communities, Inc. / Equity Residential Archstone-Smith Trust, Inc. Public REIT 6,476 26-Nov-12 27-Feb-13 CompletedAmerican Realty Capital Properties, Inc. American Realty Capital Trust III, Inc. Public REIT 2,325 14-Dec-12 28-Feb-13 Completed
Total Public to Public 13,418 100%Total Public to Private 0 0%
Total 13,4182013 Cole Credit Property Trust II, Inc. Spirit Realty Capital, Inc. Non-traded REIT 2,835 22-Jan-13 17-Jul-13 Completed
Annaly Capital Management, Inc. CreXus Investment Corp. Public REIT 876 30-Jan-13 23-May-13 CompletedBrookfield Office Properties Inc. MPG Office Trust, Inc. Real Estate Operating Company 1,938 24-Apr-13 15-Oct-13 CompletedAmerican Realty Capital Properties, Inc. CapLease, Inc. Public REIT 2,048 28-May-13 5-Nov-13 CompletedMid-America Apartment Communities, Inc. Colonial Properties Trust Public REIT 4,112 3-Jun-13 1-Oct-13 CompletedAmerican Realty Capital Properties, Inc. American Realty Capital Trust IV, Inc. Public REIT 2,207 1-Jul-13 3-Jan-14 CompletedW. P. Carey Inc. Corporate Property Associates 16 Public REIT 4,041 25-Jul-13 31-Jan-14 CompletedAmerican Realty Capital Properties, Inc. Cole Real Estate Investments, Inc. Public REIT 10,281 23-Oct-13 7-Feb-14 CompletedEssex Property Trust, Inc. BRE Properties, Inc. Public REIT 6,141 9-Dec-13 1-Apr-14 Completed
Total Public to Public 29,706 86%Total Public to Private 4,773 14%
Total 34,4792014 Ventas, Inc. American Realty Capital Healthcare Trust, Inc. Public REIT 2,297 2-Jun-14 16-Jan-15 Completed
EDENS, Inc. AmREIT, Inc. Private Real Estate Company 620 31-Oct-14 18-Feb-15 CompletedNorthStar Realty Finance Corp. Griffin-American Healthcare REIT II, Inc. Public REIT 3,881 5-Aug-14 3-Dec-14 CompletedSelect Income REIT Cole Corporate Income Trust, Inc. Public REIT 2,987 2-Sep-14 29-Jan-15 CompletedGoldenTree Asset Management LP Origen Financial, Inc. Asset Manager 456 9-Sep-14 20-Jan-15 CompletedWashington Prime Group Inc. Glimcher Realty Trust Public REIT 4,323 16-Sep-14 15-Jan-15 CompletedOmega Healthcare Investors, Inc. Aviv REIT, Inc. Public REIT 2,822 31-Oct-14 1-Apr-15 CompletedGriffin Capital Essential Asset REIT, Inc. Signature Office REIT Inc. Public REIT - 24-Nov-14 10-Jun-15 Completed
Total Public to Public 16,309 94%Total Public to Private 1,076 6%
Total 17,3852015 The Blackstone Group LP Excel Trust, Inc. Asset Manager 1,021 10-Apr-15 31-Jul-15 Completed
Brookfield Asset Management Inc. Associated Estates Realty Corporation Asset Manager 1,690 22-Apr-15 7-Aug-15 CompletedIndependence Realty Trust, Inc Trade Street Residential, Inc. Public REIT 287 11-May-15 17-Sep-15 CompletedExtra Space Storage Inc. SmartStop Self Storage, Inc. Public REIT 855 15-Jun-15 1-Oct-15 CompletedLone Star Investment Advisors, LLC Home Properties, Inc. Asset Manager 5,156 22-Jun-15 7-Oct-15 CompletedChambers Street Properties Gramercy Property Trust Inc. Public REIT 1,489 1-Jul-15 17-Dec-15 CompletedGlobal Logistic Properties Limited Industrial Income Trust Inc. Public REIT 4,555 29-Jul-15 4-Nov-15 CompletedThe Blackstone Group LP Strategic Hotels & Resorts, Inc. Asset Manager 5,648 8-Sep-15 11-Dec-15 CompletedThe Blackstone Group LP BioMed Realty Trust Asset Manager 7,866 8-Oct-15 27-Jan-16 CompletedHarrison Street Real Estate Capital Campus Crest Communities, Inc. Private Equity Firm 1,900 16-Oct-15 2-Mar-16 CompletedStarwood Capital Group / Milestone Apartments REIT Landmark Apartment Trust, Inc. Investor Group 1,900 22-Oct-15 27-Jan-16 CompletedWeyerhaeuser Company Plum Creek Timber Company, Inc. Public REIT 8,462 8-Nov-15 19-Feb-16 CompletedAmerican Homes 4 Rent American Residential Properties, Inc. Public REIT 1,415 3-Dec-15 29-Feb-16 CompletedColony American Homes, Inc. Starwood Waypoint Residential Trust Public Real Estate Company 1,592 21-Sep-15 5-Jan-16 Completed
Total Public to Public 15,648 36%Total Public to Private 28,188 64%
Total 43,8362016 Brookfield Asset Management, Inc. Rouse Properties, Inc. Asset Manager 2,800 25-Feb-16 Pending
Apollo Commercial Real Estate Finance, Inc. Apollo Residential Mortgage, Inc. Public REIT 641 26-Feb-16 PendingARMOUR Residential REIT, Inc. JAVELIN Mortgage Investment Corp. Public REIT 85 2-Mar-16 6-Apr-16 CompletedAnnaly Capital Management, Inc. Hatteras Financial Corp. Public REIT 1,788 11-Apr-16 PendingApple Hospitality REIT, Inc. Apple REIT Ten, Inc. Public REIT 1,300 14-Apr-16 PendingCousins Properties Incorporated Parkway Properties, Inc. Public REIT 2,031 29-Apr-16 Pending
Total Public to Public 5,844 68%Total Public to Private 2,800 32%
Total 8,644
Industry Totals: 2004-2016Total Public to Public 194,374 53%Total Public to Private 169,104 47%
1 Implied market capitalization is the sum of Operating Partnership units plus common shares outstanding, multiplied by share price; data presented in thousands of dollars.
2015: Q4
36
FTSE EPRA/NAREIT Global Real Estate Index SeriesDeveloped Markets
(Percent change, as of April 29, 2016)(All values based in US dollars)
Global North America Asia EuropeReturn Components Dividend Return Components Dividend Return Components Dividend Return Components Dividend
Period Total Price Yield Total Price Yield Total Price Yield Total Price YieldAnnual (including current year to date)
Share Price ($): The closing price per share on the date noted.
52-Week Share Price ($): The high and low closing prices for the shares over the previous 52 weeks.
Price/FFO Multiples: Price on the date indicated divided by the FactSet mean FFO estimate for the current and following year.
FFO per Share Estimates ($): FactSet mean FFO estimate for the current and following year.
FFO Growth (%): The percentage change between the current and following year mean FFO estimate as reported by FactSet.
Debt/EBITDA Multiples Average Total Debt over the prior 2 quarters divided by the the most recent quarter's annualized EBITDA.
FFO Payout (%): Regular cash dividends paid on the company's primary issue of common stock as a percent of funds from operations, on a per-share basis.
Dividend Yield (%): The current indicated dividend rate annualized and divided by the current stock price.
Dividend Spread (%): The difference between the REIT dividend yield and the 10-year constant maturity treasury yield.
Total Returns (%): Total returns are calculated by taking the closing price for the current period, adding any dividends with an ex-dividend date in that period then subtracting the closing price for the previous period and dividing the result by the closing price of the prior period.
Month: The monthly total return as calculated at month-end.
Year to Date: The total return for the calendar year through the latest month-end.
One Year: The total return for the previous year.
Two Year: The annualized total return for the previous 2 years.
Three Year: The annualized total return for the previous 3 years.
Five Year: The annualized total return for the previous 5 years.
Equity Market Capitalization ($ Millions): Price on the date indicated times the number of common shares outstanding.
Implied Market Capitalization ($ Millions): Price on the date indicated times the number of shares outstanding including Operating Partnership Units.
Debt Ratio (%): A leverage ratio calculated by taking the REIT’s total debt and dividing it by the total market capitalization. Total capitalization is the sum of implied market capitalization and total debt.
Long-Term Issuer Rating: The long-term credit rating, as announced by Standard & Poors, and obtained from SNL Financial.
Average Share Volume: The average number of shares traded daily over the past month, represented in thousands.
Average Daily Dollar Volume: The average of the daily value of shares traded over the past month, represented in thousands. Daily value is computed by multiplying shares traded by the closing price on that date.
Relative Liquidity (%): Average daily dollar volume divided by equity market capitalization.
National Association of Real Estate Investment Trusts®
REITs: Building Dividends & Diversification®
1875 I St, NW, Suite 600, Washington D.C. 20006phone: 202-739-9400 • fax: 202-739-9401