(NASA-CR-197574) NEW TECHNOLOGIES FOR SPACE AVIONICS Final Report, 1994 (Lockheed Sanders) 85 p N95-18196 Unclas G3/19 0034975 https://ntrs.nasa.gov/search.jsp?R=19950011781 2018-11-29T18:01:00+00:00Z
This report documents the testing that was performed on both of the reaction jet driver(RID) prototypes which were designed and built by Lockheed Sanders. The first versionof the RJD, which will be referred to as prototype 1 throughout this report, was tested aspart of the concurrent engineering process to iron out the requirements and any existingbugs as the second generation was being developed. The second prototype, which will bereferred to as prototype 2, was tested to evaluate the performance of the RYD.
The fundamental objectives of the test and evaluation program were to evaluate the
suitability of Sanders' concept for an RID in a shuttle upgrade application and as part of anext generation vehicle. These objectives included testing the tools, resources andprocedures used as part of Sanders' concurrent engineering process. Also included in theobjectives was determining the design trade-offs associated with a transition from analog todigital based electronics with emphasis placed on flight control system integration of aMIL-1553 device. Some preliminary end of useful life signature indications for solenoidoperated valves typically used in aerospace propulsion applications were collected, whichallowed the comparison of a multi-stage pilot-operated valve with that of a direct actingvalve.
The four test sets performed on each prototype included basic functionality tests, burnduration and skew time tests, failure mode tests, and alternate load tests. The functionalitytests were run to determine if the prototypes functioned as per the requirements outlined inthe Reaction Jet Driver Digital Design Document. All tests met the requirements exceptwhere noted in section 3.1. The firing duration and skew time tests were run to verify thestart time and duration in which a solenoid was activated. The results showed that these
times matched the commanded times. The failure mode tests were run to verify therequirements in the design document. Again, all tests were successful and the results areoutlined in section 3.3.
In addition to testing the prototypes, the prototypes were used as a tool in testing a Marottadirect acting valve and two Marquardt pilot operated valves. When used, these valvesreplaced the load banks in the test configuration. Since the prototype was designed for
controlling the direct acting valves, these tests provided some useful data which could beused later in defining valve characteristics and solenoid end of useful life.
The following sections describe the test configuration, equipment, procedures, and results.Section 5 describes a parallel study that was performed as the tests were being run. Thatstudy consisted of RJD analysis performed with the FEAT (Failure Environment AnalysisTool) model.
2
2.0 Test Configuration
2.1 Prototype 1 Configuration
Prototype 1 and prototype 2 had slightly different test configurations. Prototype 1 requiredtwo PCs because Xilinx development work was being done on one PC while 1553
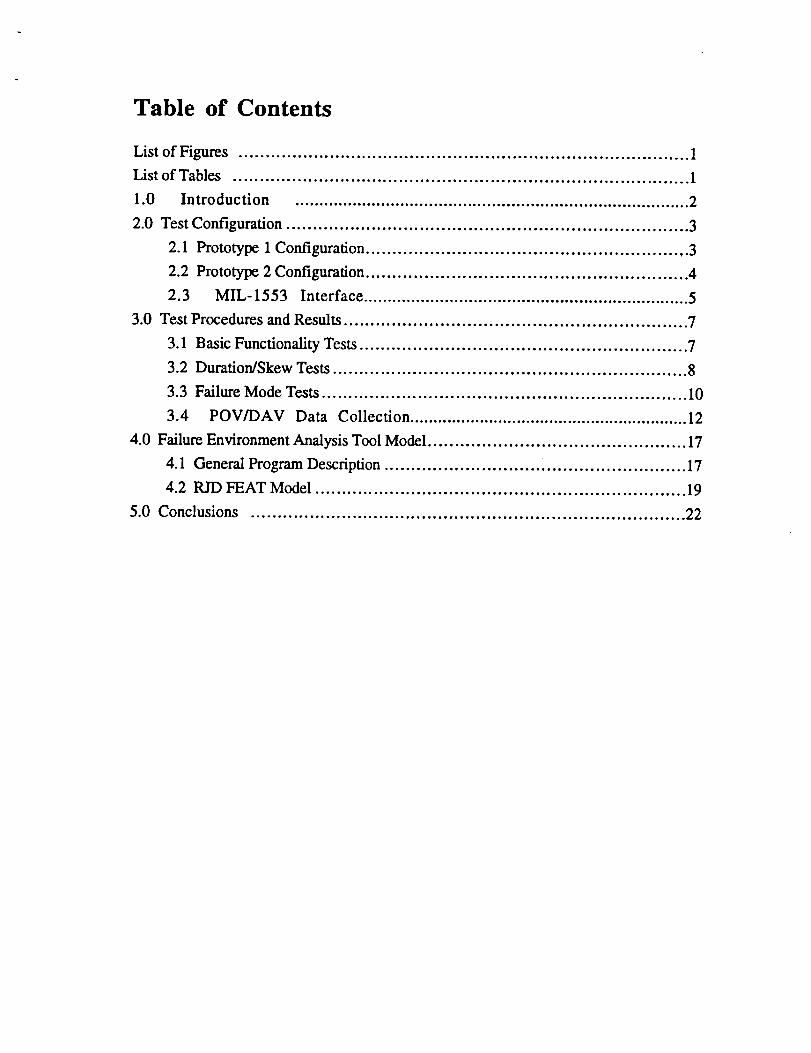
development work was being done in parallel on the other PC. Figure 1 shows a diagramof the prototype 1 test configuration. A 386 PC was used for the 1553 interface instead ofa 486 because equipment in the laboratory was limited.
The RJD required a single 28 Volt power supply. Although the prototype had a circuitbreaker installed to prevent damage to the prototype from high currents, the current limit
was set to 3.0 Amps on the power supply. The power supply is connected to the RIDthrough a simple on/off switching box. Another precaution was that the digital and analogsides of the prototype were never connected or disconnected while the unit was poweredup. This was recommended by Sanders personnel because the consequences of doing thatwere unknown.
The dummy loads that were connected to the RID were built for Lockheed Sanders tosimulate orbiter thruster loads. They consist of a coil in series with a small resistive load.There are two simulated thruster loads, one of which models a vernier Reaction Control
System (RCS) thruster, the other a primary RCS thruster. Each model has a separate load
for the fuel solenoid and the oxidizer solenoid. These dummy loads were replaced withactual valves in test set 4 which is described in section 4.4. However, since only one directacting valve was available, it was attached to the oxidizer side and a 25 Ohm power resistorwas attached to the fuel side. This resistor was sized such that it would draw
approximately the same amount of current as the dummy loads. If the resistor is not used,the fuel side appears as an open circuit and all of the associated switches indicate failure.
PC1 - 386
FUD GRAPHICAl. I,,,iTERFACE
RJD FACE PLATE SCHEMATIC
28 V POWER SUPPLY
l
1553 INTERFACE
SERIAL PORT
TO _L
FUD XlLINX INTERFACE
2B VDC POWER SUPPLy
'TEKTROND( DIGITN.. O_CLLISCOPE
Figure 1 - Prototype 1 Test Configuration
The 486 PC, which is labeled PC2 in Figure 1, runs the Xilinx software, XACT 5.0. PC2is used to download new designs to the Xilinx chip on the RJD digital board. Once anLCA, logic cell array, f'de has been created in XACT, it is used to create a bit streamrepresentation of that t'de. The bit stream file is then downloaded from the serial port ofPC2 to the digital board via the Xilinx XChecker cable. When power is first applied to thedigital board the Xilinx will read its program from either the PROM which resides on theboard or the XChecker cable. In order for the Xilinx to read the program from the cable,switch number 4 on DIP switch bank U36 must be in the off position and the PROM mustbe removed from the board. Otherwise, the Xilinx chip will read the program from thePROM. The location of U36 and the PROM can be found on the RID digital designschematics.
The 386 PC, labeled PC1 on Figure 1, runs the 1553 interface software used to send com-mands to the RID. The 1553 card inside PC1 is a DDC 65515. Since the graphicalinterface was developed with a different card, some minor software modifications wererequired. This difference in cards did not cause any problems once the modifications wereimplemented.
The RJD face plate contains 48 LEDs to indicate whether each of the 16 switches is open,closed, or failed. There are also four LEDs that indicate whether or not the fuel andoxidizer solenoids have shorted. These LEDs were instrumental in demonstrating the
device as well as providing output information to complete a majority of the tests that wererun.
A Tektronix 2440 digital oscilloscope was also used to collect data from the tests that wererun. Switch outputs on the RID analog board were probed to determine firing duration andskew times.
2.2 Prototype 2 Configuration
Figure 2 shows the test configuration for prototype 2. The main difference between Figure1 and Figure 2 is that Figure 2 has only one PC, PC2. Prototype 2 uses a Xilinx chip thatis too advanced for the Controls Development Laboratory's Xilinx workstation. Therefore,the Xilinx program was always loaded from the PROMs (now four PROMs instead of one)because no changes could be made to the program. The 1553 65515 card was moved fromPC 1 to PC2.
Another change to the test configuration which is not apparent by looking at the figures isthe power supply. The switch box, which allows the user to easily turn the power to the
RID on and off, always remains in the ON position. Prototype 2 requires that the voltageon the power supply be slowly increased to 28 Volts. If it is simply switched on, thesystem will lock up and will not accept commands from the 1553 interface. By poweringup slowly, most of the switches will come up in a fault state. However, these states are
reset when the graphical interface program is started.
In both prototypes there were lines available to input pressure transducer signals. Since nopressure signals were simulated in any of the tests, these lines were ignored. In prototype2, however, a pressure transducer fault would occur if these lines were left floating. Toeliminate this error the input signals were shorted to one of the switch outputs.
4
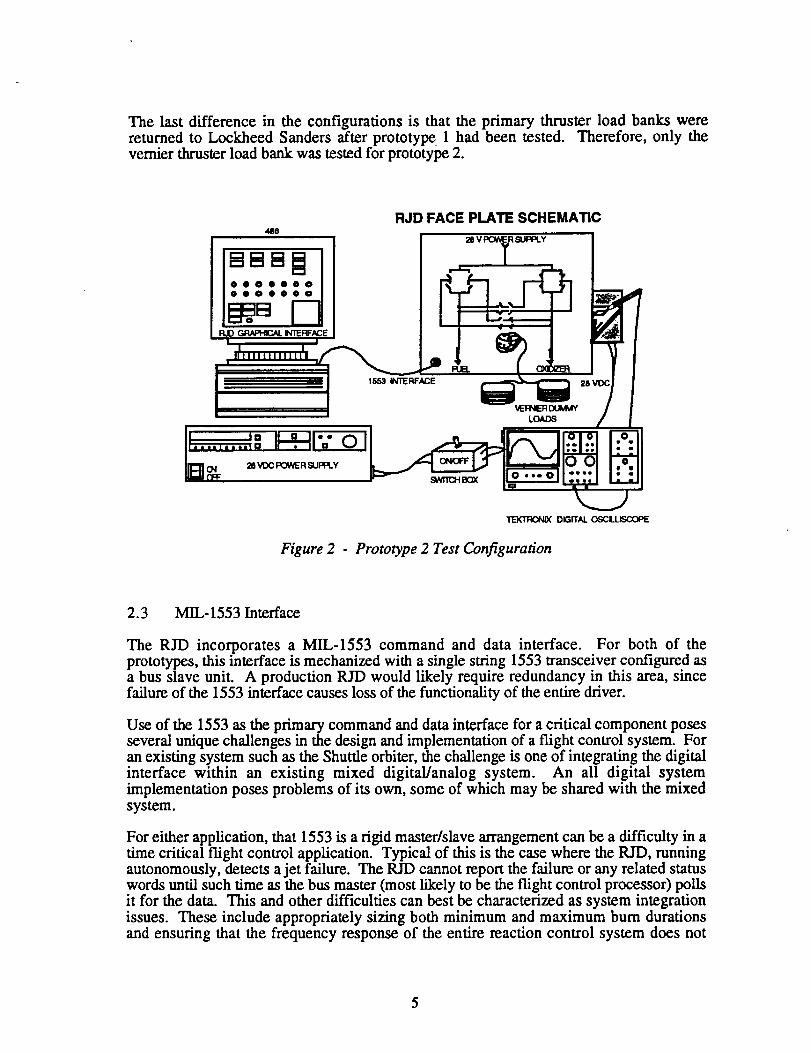
The last difference in the configurations is that the primary thruster load banks werereturned to Lockheed Sanders after prototype 1 had been tested. Therefore, only thevernier thruster load bank was tested for prototype 2.
PdD
RJD FACE PLATE SCHEMATIC
_,_VDC POWER SUPPLY
TEXTRONIX D)GITALOSCILUSCOPE
Figure 2 - Prototype 2 Test Configuration
2.3 MIL- 1553 Interface
The RJD incorporates a MIL-1553 command and data interface. For both of theprototypes, this interface is mechanized with a single string 1553 transceiver configured asa bus slave unit. A production RID would likely require redundancy in this area, sincefailure of the 1553 interface causes loss of the functionality of the entire driver.
Use of the 1553 as the primary command and data interface for a critical component posesseveral unique challenges in the design and implementation of a flight control system. Foran existing system such as the Shuttle orbiter, the challenge is one of integrating the digital
interface within an existing mixed digital/analog system. An all digital systemimplementation poses problems of its own, some of which may be shared with the mixedsystem.
For either application, that 1553 is a rigid master/slave arrangement can be a difficulty in atime critical flight control application. Typical of this is the case where the RID, runningautonomously, detects a jet failure. The RJD cannot report the failure or any related statuswords until such time as the bus master (most likely to be the flight control processor) polls
it for the data. This and other difficulties can best be characterized as system integrationissues. These include appropriately sizing both minimum and maximum bum durationsand ensuring that the frequency response of the entire reaction control system does not
combine with any overall flight control system operating frequency or vehicle structuralmode, thus avoiding signal aliasing or flight control instabilities.
The 1553-related testing that we conducted as part of this effort was merely a cursoryscratch at the surface of the above problems. This was necessitated by test and evaluationtime constraints and resource limitations. Basic testing was accomplished to establish aqualitative feel for the impact of the 1553 interface on the overall RJD's performance. Theresult of this testing was that the 1553 does not of itself introduce any unacceptable or evenperceptible latencies with respect to responses to f'tre commands. The bandwidth of the1553 interface as well as the entire RID digital complement was deemed satisfactory in thatthe entire system's net resolution was sufficient to encompass the shortest burn durationsthat a physical thruster might be expected to respond to and the longest burn command thatmight be part of a propellant dump sequence. The 1553 interface exhibited acceptablerepeatability of bum initiate timing and total bum durations.
6
3.0 Test Procedures and Results
Four sets of tests were performed on both prototype 1 and prototype 2. This sectionsummarizes the procedures followed when running the tests and the results of those tests.The results are given for both prototypes. If there was a discrepancy between prototype 1and prototype 2, it is noted in the relevant section.
3.1 Basic Functionality Test Set
A series of tests were run to verify the basic functionality of the POD prototype and theresults were compared to the specifications given in the Digital Design Report to verify thecorrectness. The tests in this section were performed only on the load banks.
The functionality tests included firing the jets for various durations, firing the jets withvarious fuel/oxidizer skew times, flushing the fuel and oxidizer tanks, reading data fromSRAM (Static Random Access Memory), and resetting the system. This verified that allfunctions worked properly before the direct acting valve or the pilot operated valve wasconnected to the system. With the exception of reading data from SRAM, the correctnessof all operations was verified visually by watching the LEDs on the front panel of theprototype. Since the built in test function runs at too high a frequency to see on the LEDs,
another feature was built into prototype 2 to slow the entire system down. This mode isused only for demonstration. To verify that the SRAM data collection was workingproperly, a sample of data was written to a file. The following paragraphs describe theresults of this test set.
Fire commands and fire duration settings were selected on the graphical interface and sent
to the RID via the 1553. The fire commands were executed successfully and changing theduration was visible on the LED front panel. This test was qualitative and actual
measurements of firing durations were not done until test set 2. One problem arose duringthis test which was very repeatable. If consecutive fire commands were sent at a high rate,a 1553 error would occur. The error prevented any further communication with the RJD
via the 1553 cable. Recovering from the error required quiuing the graphical interfaceprogram and restarting it. This problem was not investigated to determine the exact causeof the 1553 bus error because of time constraints. This problem was associated with thesecond prototype and not the first.
Fuel/oxidizer solenoid actuation skew times were verified in the same way that the firingtimes were verified. The test was qualitative and consisted of setting various skew timesand watching the LEDs on the front panel to verify that the solenoids were activated atdifferent times. Due to a problem with the interface program, the skew function did notwork on the fast prototype. Once a current version of the interface program was obtained,there was not another problem with the skew times in either prototype.
The flush commands were also verified visually. The flush oxidizer and flush fuelcommands are separate buttons on the graphical interface which toggle on and off. Bothfuel and oxidizer flush commands executed correctly. However, the implementation was
different between the first and second prototypes. The fast prototype would allow fuel andoxidizer to flush at the same time. The second prototype would not allow one side to flushif the other side was already flushing unless it was toggled three or more times.
To verify the SRAM data collection, the data was written to a file and plotted. The SRAMrendition of a solenoid current signature during a firing event was directly compared with
7
the signature as captured on an oscilloscope. The two signatures were found to overlayeach other, verifying the proper operation of the SRAM loading and interrogation logic and
indicating that any quantization errors introduced in the analog to digital conversion processwere negligible. The second prototype had both the file writing and plotting functions builtin, which was very useful.
The purpose of the reset function was to reset any switch failures. If the switch wasactually failed, it would immediately go back to the failed state once BIT was executed.During startup some of the switches come up in a failed state due to the rate at which power
is applied to the system. This provided an easy way to verify .the reset function workedproperly, which it did.
On the first prototype, all of the functionality tests were rerun after the program was down-loaded from the XChecker cable connected to the serial port of PC2 in the test setup. Thisverified that the program on the PROMs was the same as the Xilinx LCA program. It alsoverified our procedures for downloading a new program to the Xilinx chip.
3.2 Firing Duration/Skew Test Set
At the beginning of this test set current measurements were taken off the power supply todetermine how much power the prototype was consuming. While the prototype was idle orrunning CBIT, it drew approximately 0.4 Amps. The power supply was set to 28.0 V, sothe power consumption was 11.2 W.
Power = 28.0 V * 0.4 APower = 11.2 W
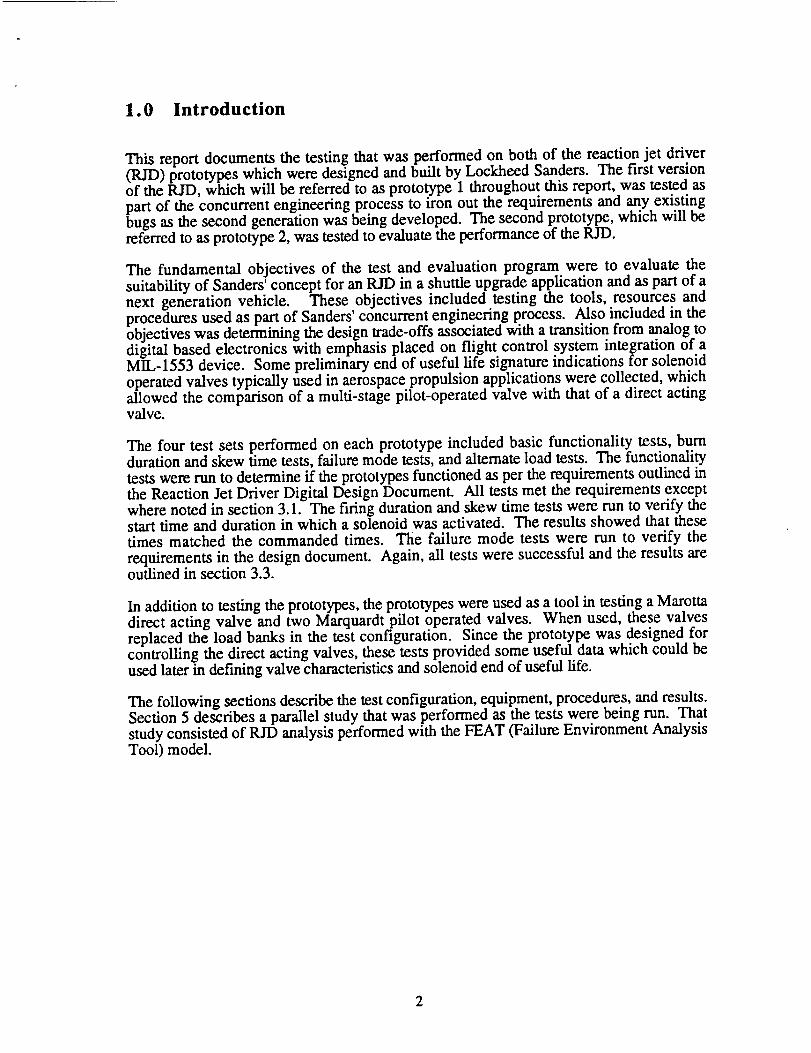
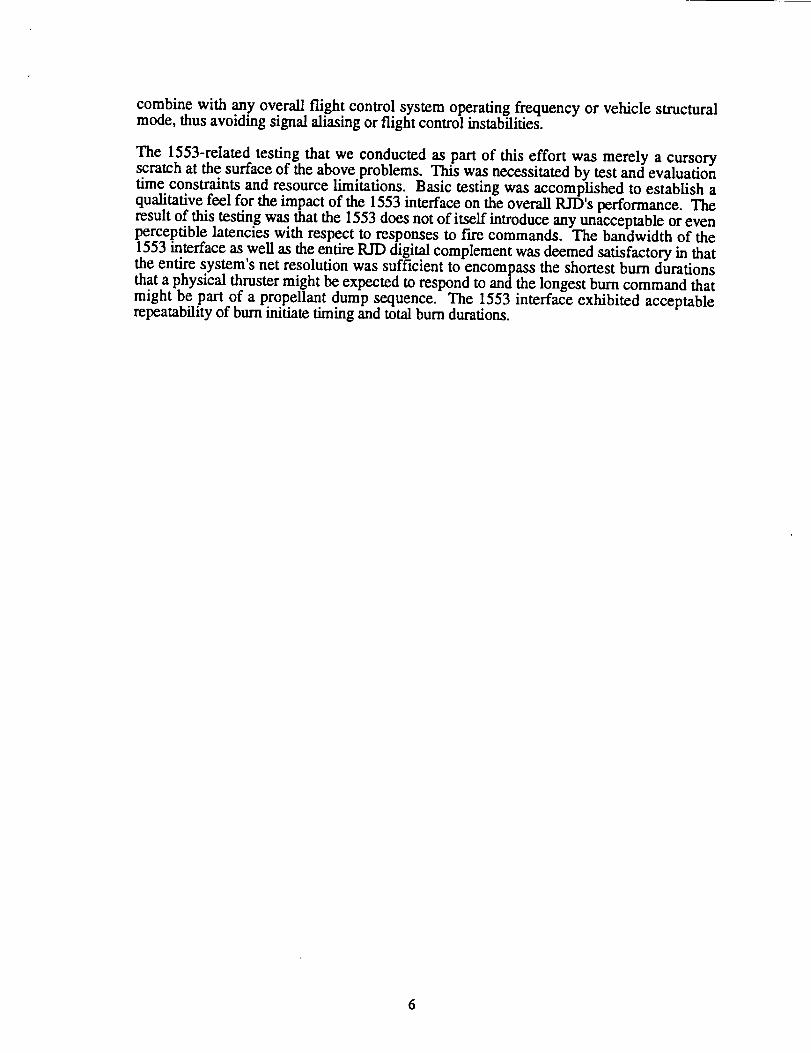
During a fining, the current increased to approximately 1.6 Amps, which increased thepower to 44.8 W. This is consistent with Figures 3 and 4 which show the fuel andoxidizer solenoid each drawing approximately 0.6 Amps.
Power = 28.0 V * 1.6 APower = 44.8 W
The accuracy of the firing duration was tested for a range of values. This was performedby connecting a probe from the oscilloscope to the transistors on the analog board. Thereare 16 transistors on the analog board that correspond to the 16 switches in the RIDsystem. A voltage is seen on a particular transistor when that switch is closed, so theduration time was measured by monitoring the voltages on the transistors. The data wasstored and read directly off the oscilloscope.
During prototype 1 testing, duration errors of about 10% were reported. Later, it wasdetermined that an incorrect signal was being monitored. Once that problem was solved,
all tests on prototype 1 and prototype 2 showed that firing durations were accurate to within10 msec and the fuel and oxidizer solenoids were being activated at exactly the same time.
Testing the fuel and oxidizer firing skews was performed by probing the transistors on theanalog board - exactly the same way the fwing duration tests were performed. However,the skew tests had the advantage of being able to verify the times with the data stored inSRAM. The data stored in SRAM is the voltage measured across a 1.0 Ohm resistor inseries with the solenoid. That voltage is amplified by a factor of 3.148 before the data is
8
stored.Therefore, the current data was equal to the voltage values stored in SRAM dividedby 3.148. Although the firing is stored in SRAM, the duration could not be verified
because data could only he collected for the commanded firing duration. Consequently, thecurrent drop was not
0.60 -
0.50
0.40
=... 0.30
0
" i ,-"-_ _ _ : : ! !.............. -."............... ]....:,,-......... !................ ";............ . .............. i............... i ............... _............... •................
O .2 0 ........;........:"..........................................._..............................................._.............................._................
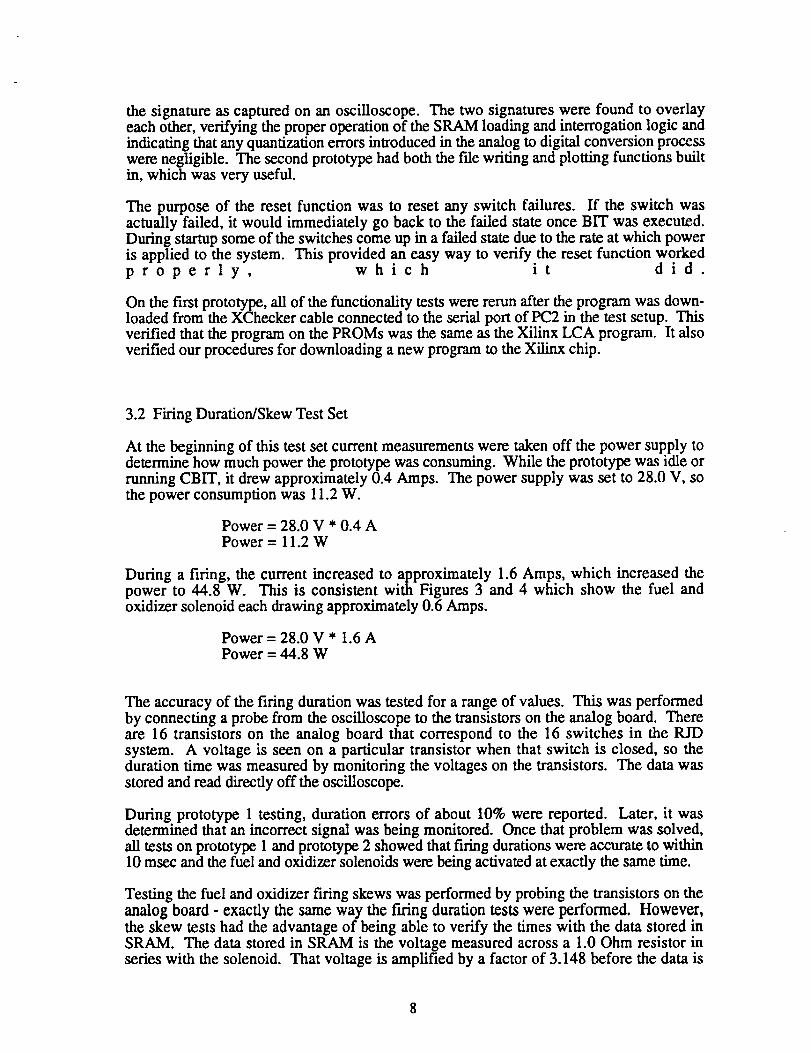
Figure 4 - Load Bank Firing Current Trace, Fuel Skew = 0.10 Seconds
captured in the data. Figures 3 and 4 show two skew time test cases. The fhing durationfor both of these plots is 0.2 seconds, but the plots do not verify that. Several skew valuesfor oxidizer and fuel were tested and they were all accurate to within 1.0 msec.
9
Onephenomena was uncovered while plotting the skew test data. Plots of the voltage datastored in SRAM showed a spike at the end of the firing. Lockheed Sanders advised thatthis was an artifact of the plotting package. The fact that there was not actually a spike wasverified by checking the data on the oscilloscope.
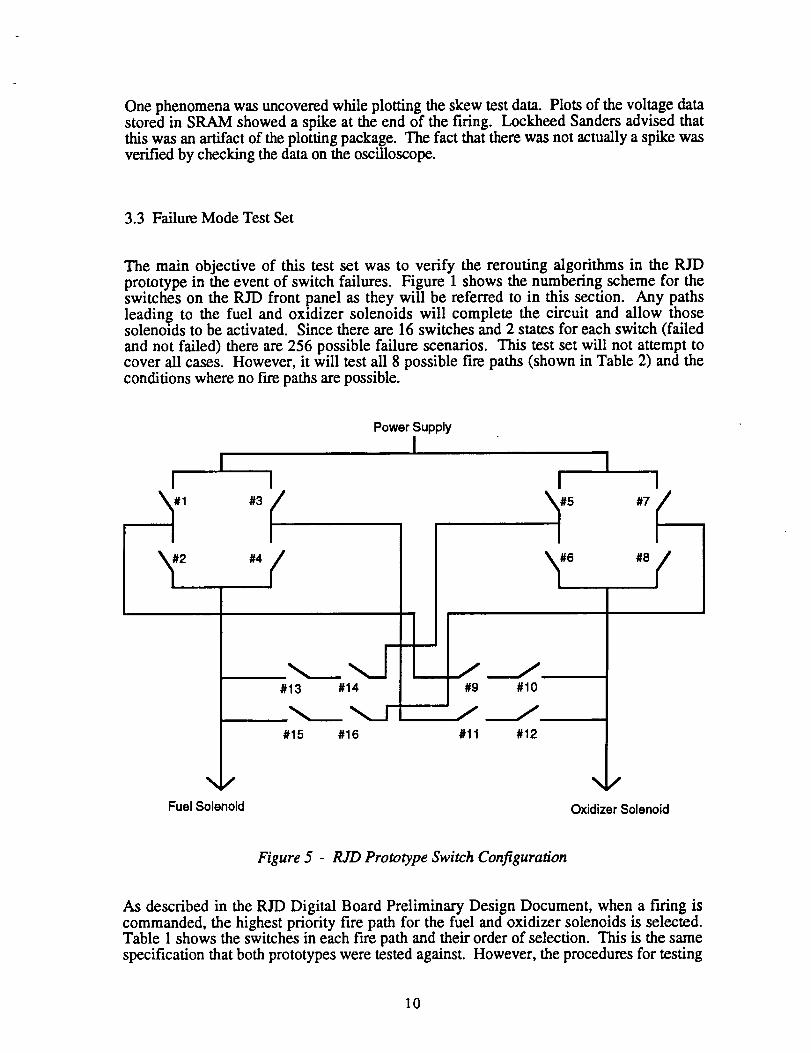
3.3 Failure Mode Test Set
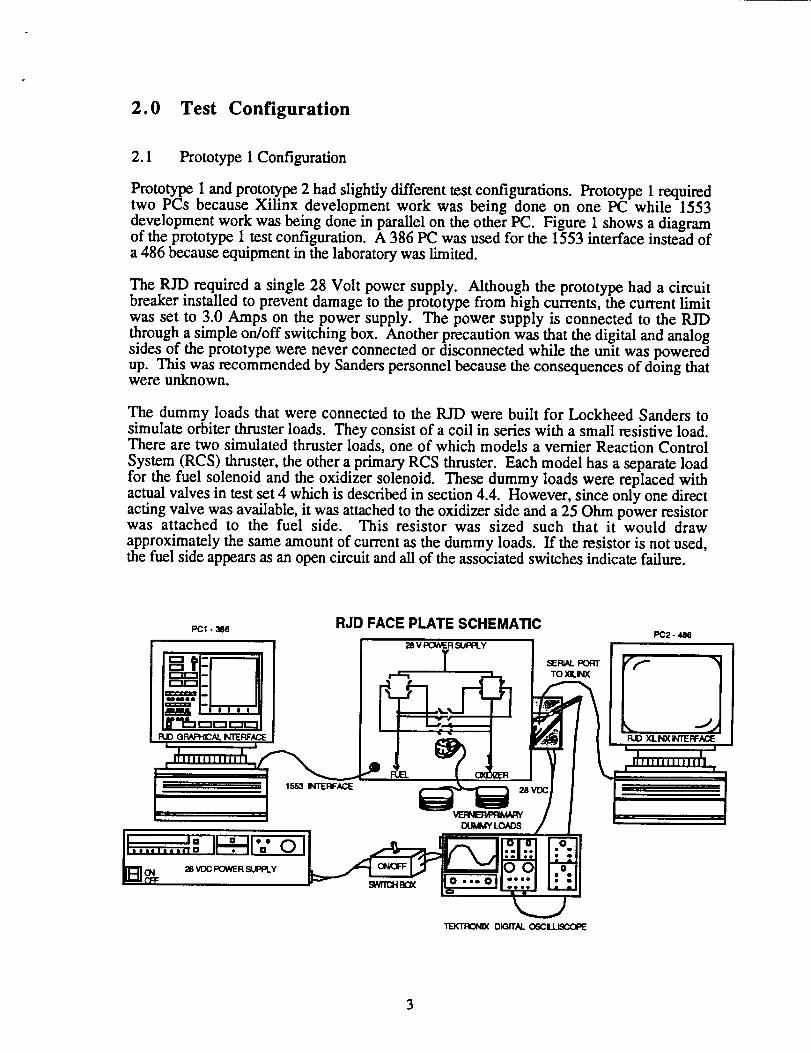
The main objective of this test set was to verify the rerouting algorithms in the RJDprototype in the event of switch failures. Figure 1 shows the numbering scheme for theswitches on the RJD front panel as they will be referred to in this section. Any pathsleading to the fuel and oxidizer solenoids will complete the circuit and allow thosesolenoids to be activated. Since there are 16 switches and 2 states for each switch (failed
and not failed) there are 256 possible failure scenarios. This test set will not attempt tocover all cases. However, it will test all 8 possible fire paths (shown in Table 2) and the
conditions where no fire paths are possible.
Power Supply
II I
I I I I
",,_d#15 #16 #11 #12
Fuel Solenoid Oxidizer Solenoid
Figure 5 - RJD Prototype Switch Configuration
As described in the RJD Digital Board Preliminary Design Document, when a firing iscommanded, the highest priority fire path for the fuel and oxidizer solenoids is selected.Table 1 shows the switches in each fire path and their order of selection. This is the samespecification that both prototypes were tested against. However, the procedures for testing
10
thetwo prototypeswere different. All results were recorded by verifying visually whichswitches were open, closed, or failed as indicated by the LEDs on the front panel.
The fu'st prototype was tested by modifying the Xilinx Logic Control Array (LCA) file thatcontained the program for the Xilinx field programmable gate array (Ft_A) chip and thendownloading that new program to the digital board. Failures were hardcoded into thedesign to simulate a hard failure in one or more of the switches. However, downloading anew program required resetting the power to the RID, so recovering from a failure within atest was not possible in this configuration. The failure scenarios that were tested areoutlined in Table 2.
Table 1 - Fire Path Description taken from the RJD Digital Board Preliminary DesignDocument. The order of fire path selection for the fuel solenoid is FPO, FP1, FP2, FP3and for the oxidizer solenoid the order is FP4, FP5, FP6, FPZ
Fire Path
#Path Description Switches in
Path
FP0 Fuel PRIM_I/SEC_I 1,2I II
FP 1 Fuel PRIM_ 1/SEC_ 1 3,4
FP2 Fuel PRIM_ I/SEC_2/SEC_3 5,14,13
FP3 Fuel PRIM_I/SEC_2/SEC_3 7,16,15
FP4 Oxidizer PRJM_I/SEC_I 5,6
FP5 Oxidizer PRIM_I/SEC_I 7,8
FP6 Oxidizer 1,11,12PRIM_I/SEC_2/SEC_3
FP7 3,9,10Oxidizer
PRIM_I/SEC_2/SEC_3
Table 2 - Failure Test Matrix
Switch # 1 2 3 4
-->
Test 1
Test 2 FTest 3 F
Test 4 F F
Test 5 F F
Test 6 F F
Test 7 F F
Test 8 F F F F
Test 9
Test 10
Test 11
Test 12 F
Test 13
Test 14
Test 15 F F
Test 16 F F
5 6
FF
F
FF
F
F
F
F
F
F
7 8 9 10
F
F
F
F
F F F
F
F F
11 12 13 14 15 16
F
F
F
F F F
F F F F
F F
11
Prototype2 testsusedthesame failure test matrix, but a different method of simulating fail-ures. This prototype had DIP switches on the digital board to select which switches to fail.Although this still did not create an actual hardware failure, it was more realistic thanchanging the software with certain failures and then running that same software to recoverfrom those failures. The DIP switches did feed directly into the Xilinx chip to createfailures, but one could switch them back and forth from failed to not failed without
resetting the whole system.
The second prototype also differed from the first in that once a failed switch was detectedall other switches that were in a common f'ire path were set to the failed state. This changedthe outcome of some of the tests. For example, in test #15, where switches #4, #6, #8 and#1 are failed, the first prototype would use both a fuel and an oxidizer cross-over path tocomplete a firing. There were no available paths for the second prototype for test #15.Since this was a change made to the design after the first prototype was delivered, bothtests were successful in that they met the specifications in their respective designdocuments.
All of the failure test results for prototype 1 and prototype 2 were as specified in the DigitalDesign Document. When a fire path was not operational because of a failure, the nexthighest priority fire path was selected.
3.4 POV/DAV Current Signature Data Collection
Some additional tests were performed on the direct acting valve (DAV) and the pilotoperated valve (POV) to determine what effect different pressures had on the opening timeof the valves. This was not a test of the RJD system, but a test to clarify somecharacteristics of the valves themselves.
The DAV was provided by Marotta. They did not provide specific operating constraints,but did recommend attaching a thermocouple to the valve to monitor the temperature if a
long series of short pulses was going to be used. The valve body temperatures should notexceed 48.9 ° C (120 ° F). No thermocouple was deemed necessary because the firingfrequency required to heat the valve to 48.9 ° was never approached.
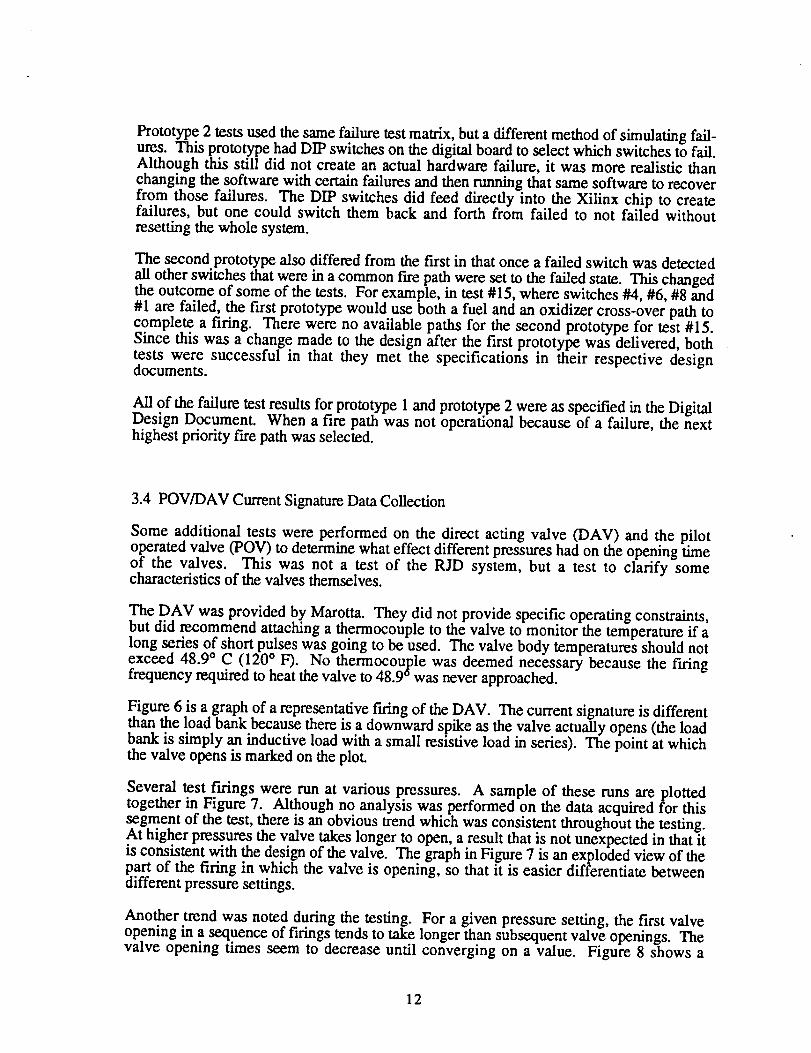
Figure 6 is a graph of a representative firing of the DAV. The current signature is differentthan the load bank because there is a downward spike as the valve actually opens (the loadbank is simply an inductive load with a small resistive load in series). The point at whichthe valve opens is marked on the plot.
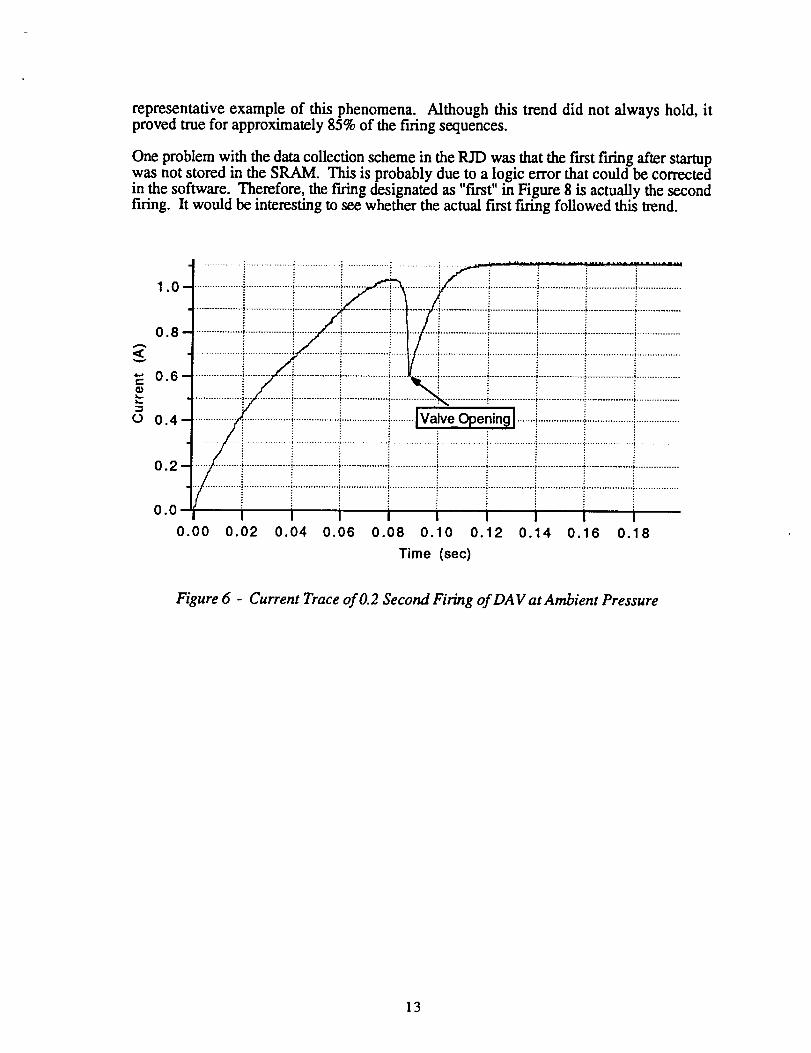
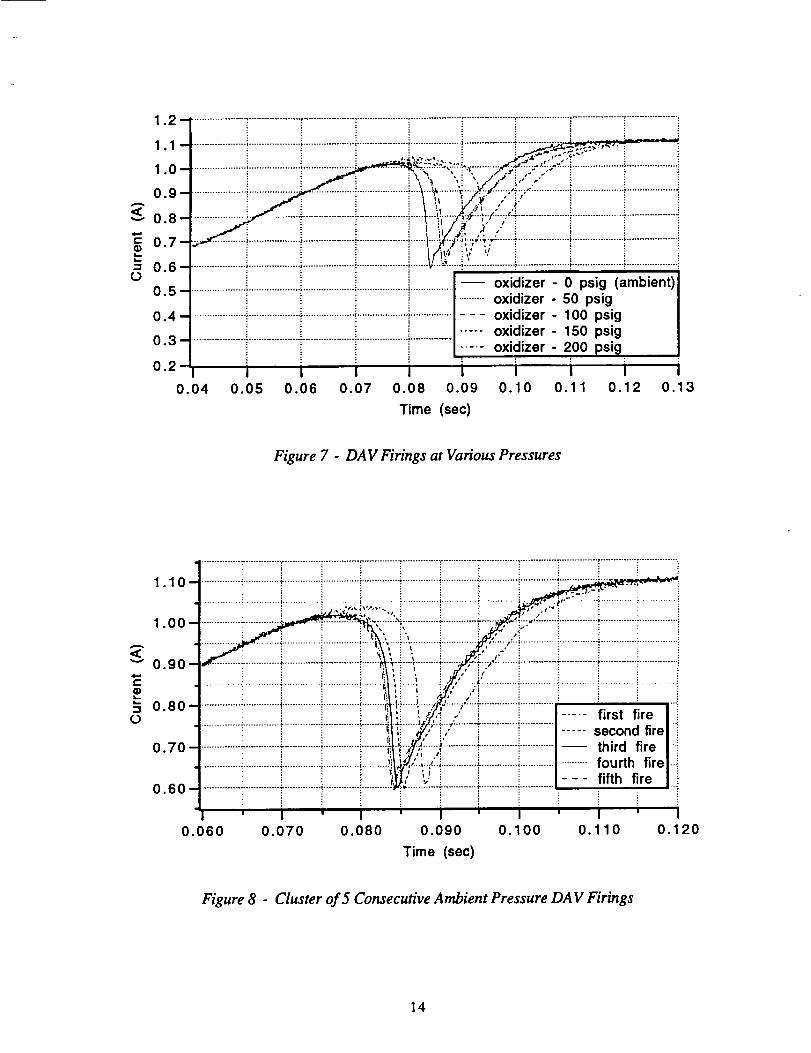
Several test f'wings were run at various pressures. A sample of these runs are plottedtogether in Figure 7. Although no analysis was performed on the data acquired for thissegment of the test, there is an obvious trend which was consistent throughout the testing.At higher pressures the valve takes longer to open, a result that is not unexpected in that itis consistent with the design of the valve. The graph in Figure 7 is an exploded view of thepart of the firing in which the valve is opening, so that it is easier differentiate betweendifferent pressure settings.
Another trend was noted during the testing. For a given pressure setting, the first valveopening in a sequence of firings tends to take longer than subsequent valve openings. Thevalve opening times seem to decrease until converging on a value. Figure 8 shows a
12
representativeexampleof this phenomena.Although this trend did not alwayshold, itprovedtruefor approximately85%of thef'uingsequences.
Oneproblemwith thedatacollectionschemein theRJD wasthatthefirst f'uing after startupwas not stored in the SRAM. This is probably due to a logic error that could be correctedin the software. Therefore, the f'u'ing designated as "f'trst" in Figure 8 is actually the secondfiring. It would be interesting to see whether the actual f'u'st f'uing followed this trend.
/
.................. " .................. i .................. " ......... i.................. i.................. i ................. -'.,.................. ;.................
.......... i .... ; -. i .....0.8 . _ . --.:.................... ..................-....................................
.................. _ .................. _ ......... i .................. i .................. i .................. _.................. i .................0.6 ................... :i............................... ....... i .................................. 6 .................. ; -................
............ _ ................. , ................. , ................ i ............... ';................. i .................. i ................ -:"................... i ................
0,2 ................ .........i.................. i................................... i ......... i ............... ;............... _.......... .z ............. _...............
.................. i .................. ; .................. ; .................. i .................. _.................. _.................. _.................. :,.................. i .................
0.00 0.02 0.04 0.06 0.08 O. 0 0.12 0.14 0.16 O. 8
Time (sec)
Figure 6 - Current Trace of O.2 Second Firing of DA V at Ambient Pressure
.............................................................i............................................................i..............T.............................................._._o ...............-..............i............................i...............i..............i.............................i..............+...............i :: i
.............. i ................................................... _............... i ............................ i ..... _.+."_ ....... _.......................• p,, iv,* ,o_ : i : s • r "'; " ;
0.60 ...............!..............; ............................+.......... [__e l i' I _ ' _ ' I ' I
0.060 0.070 0.080 0.090 O. O0 0.110 0.120
Time (see)
Figure 8 - Cluster of 5 Consecutive Ambient Pressure DA V Firings
14
The Marquardt pilot operated valves were acquired from the power and propulsion divisionat the Johnson Space Center. Personnel from that division provided operating limits for
those valves. Those limits consisted of a maximum fire duration of 1.0 second and a dutycycle of not more that one f'uing every 10 seconds.
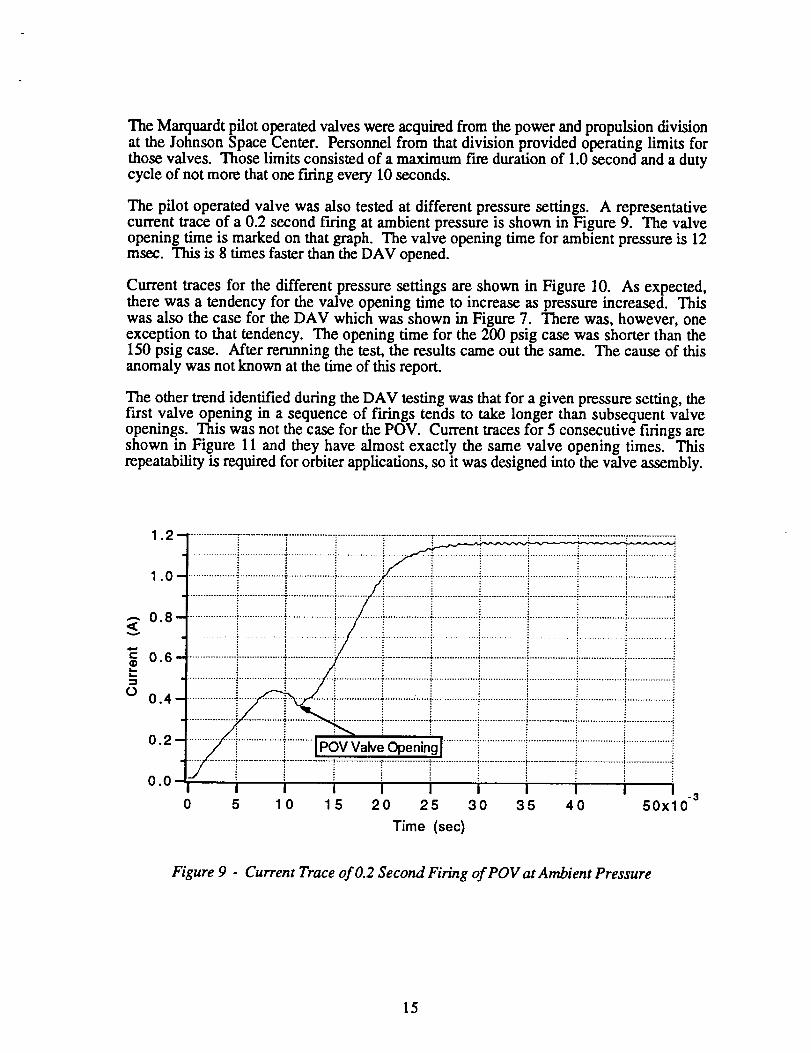
The pilot operated valve was also tested at different pressure settings. A representativecurrent trace of a 0.2 second f'L,'ing at ambient pressure is shown in Figure 9. The valveopening time is marked on that graph. The valve opening time for ambient pressure is 12msec. This is 8 times faster than the DAV opened.
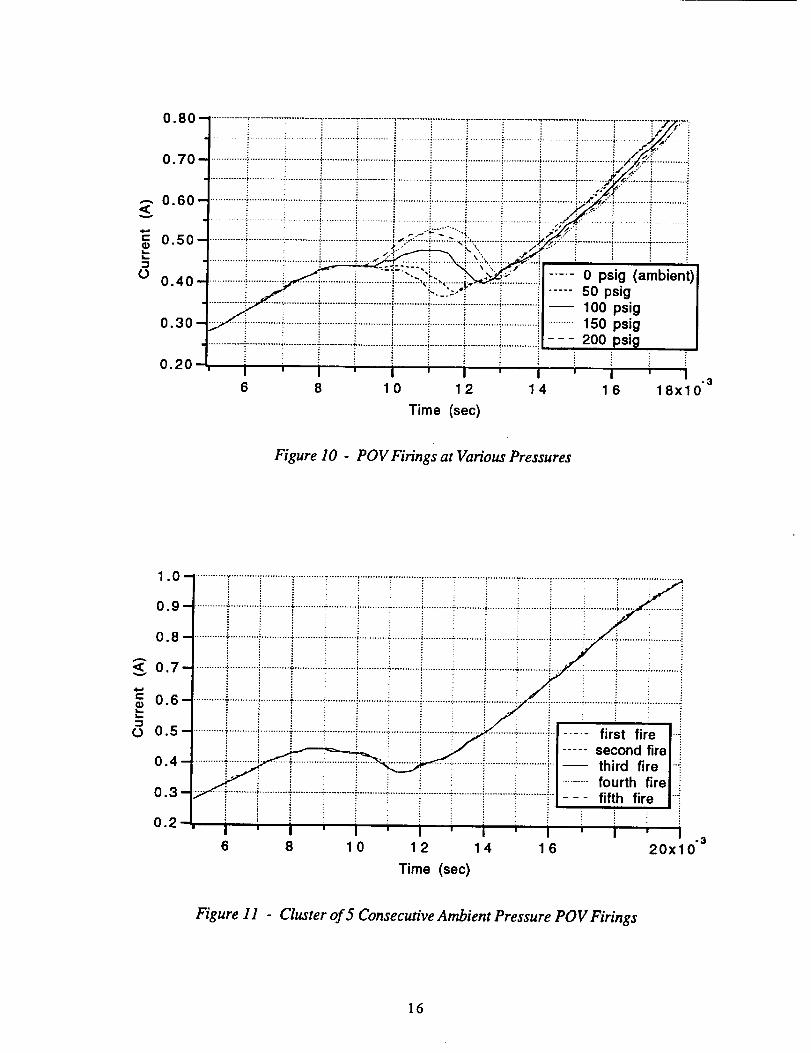
Current traces for the different pressure settings are shown in Figure 10. As expected,there was a tendency for the valve opening time to increase as pressure increased. Thiswas also the case for the DAV which was shown in Figure 7. There was, however, oneexception to that tendency. The opening time for the 200 psig case was shorter than the150 psig case. After rerunning the test, the results came out the same. The cause of thisanomaly was not known at the time of this report.
The other trend identified during the DAV testing was that for a given pressure setting, thef'u'st valve opening in a sequence of firings tends to take longer than subsequent valveopenings. This was not the case for the POV. Current traces for 5 consecutive flings areshown in Figure 11 and they have almost exactly the same valve opening times. Thisrepeatability is required for orbiter applications, so it was designed into the valve assembly.
1..................i.................t0.,1..................!_i .................t..........._i.................i..................i..................i..................i.................i02 i :: iO. 0 _ ...............;.................<"..........................................................................i..................i..................i..................i..................
0 5 10 15 20 25 30 35 40 50x10 "a
Time (sec)
Figure 9 - Current Trace of O.2 Second Firing of POV at Ambient Pressure
15
0.80 -
0.70 -
_ 0.60-0.50
0 0.40
0.30 -
0.20 -
:" : ! : j.. ' ..
_ i i [ i i i i i _-,,_..i./,,/'.."-.....i i..............;............._............;,............._..........................:.............._.............:............._..............,........_.....,,_..........
i i i i i i _ i i i .:-;_ _i i..............,.............._.............!............._,........................................_.............i..............i..............._-i .............
1.0/"4 ............r ..........._...........r ...........- ...........i!..........._...........:...........- ...........'..........._..............................................................i i i i i i i i i i i i i.._o.9--,............_......................!...........+...........i...........+........... -..........i- + . ....i ..............:/
0.5 d ...........i...........i..........._...........i............i...........i............!.........._'st fire l-i
0"4- I ......._d fire I-i/ _7"__" fourth fire_
0"3"i" ....... i ...........'..........._..........._......................._..........."...........- ..........._..........._...........'-I fifth fire Ii
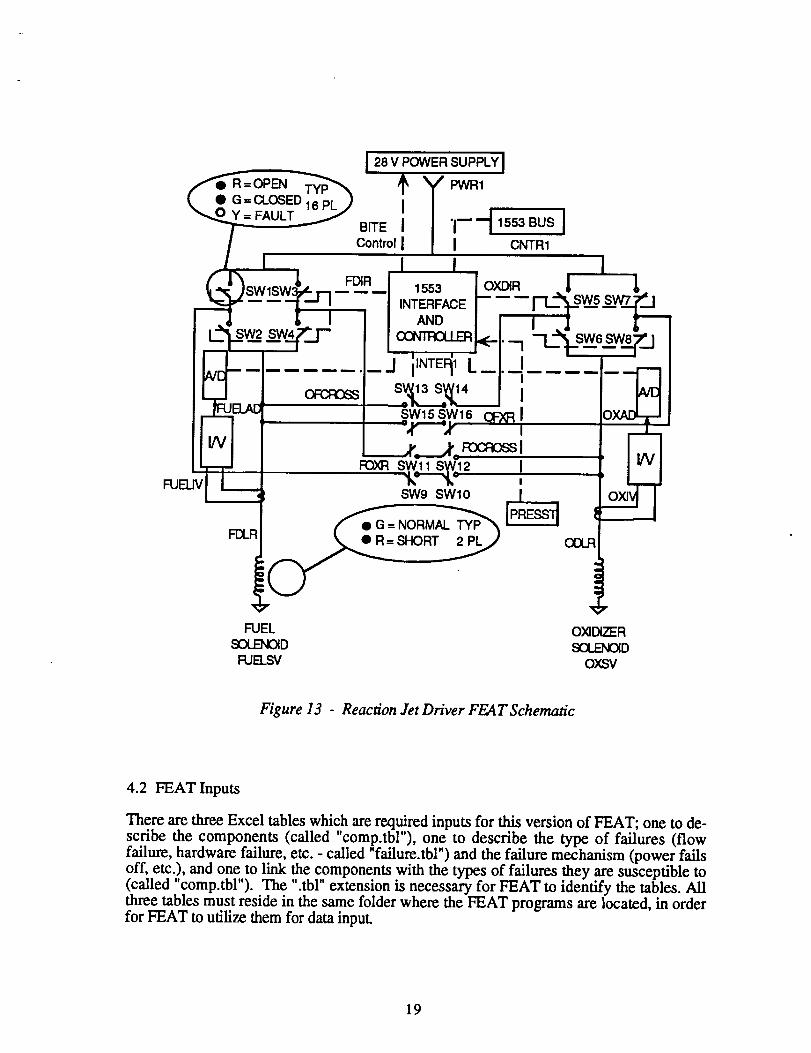
FEAT, Failure Environment Analysis Tool, is a failure propagation software tooldeveloped by Lockheed Engineering and Sciences Company (LESC) in Houston. It iscomprised of several distinct software modules. The logic digraph models analyzed byFEAT are created in the Digraph Editor. The RID model was done with FEAT version 3.2and Digraph Editor version 3.0 for the Macintosh. The RID logic digraph is shown inFigure 13. A UNIX version of FEAT was available but was not used in this effort.
Digraphs are built of "and" and "or" logic gates in what is referred to as "failure space", orin the environment of considering failure consequences rather than positive outcomeevents. FEAT models are created by choosing one undesirable end event and then mappingtoward that event through the various system components. Other end events must bemodeled through the use of additional FEAT models. FEAT is somewhat similar to FaultTree Analysis, but is unique in that the program has multiple failure capability. This allowsthe user to set failures in order to predict events involving the set failure in combinationwith other failures. Faults can be propagated both forwards and backwards by either
selecting a component as a source of failure for propagation forward, or as target fromwhich to map the failures backwards that could cause the selection to fail. FEAT indicateswhen multiple faults are required to cause a failure by color coding those paths.
Any Macintosh schematic saved in PICT format may be loaded into FEAT and matched tothe logic digraph under consideration. The only requirement is that the schematiccomponents be given a link name that matches the link name in the Microsoft Excel TM
formatted input tables and that each portion of a component, including the link name, isgrouped into one "block" in the drawing file.
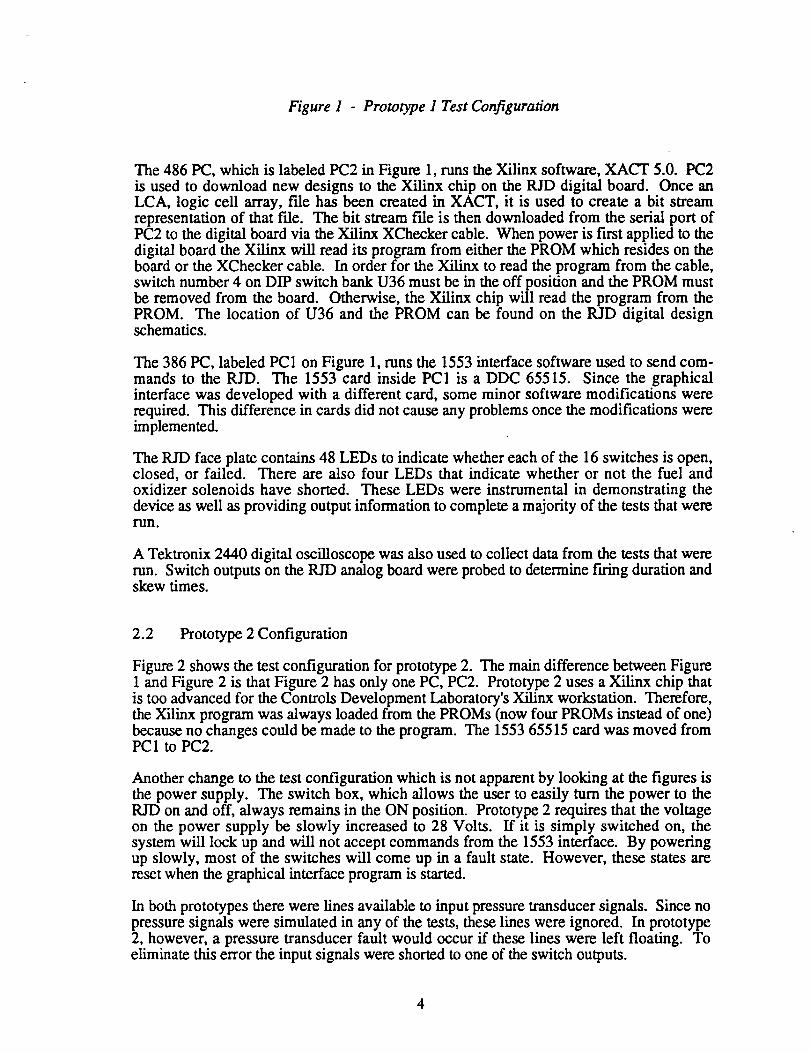
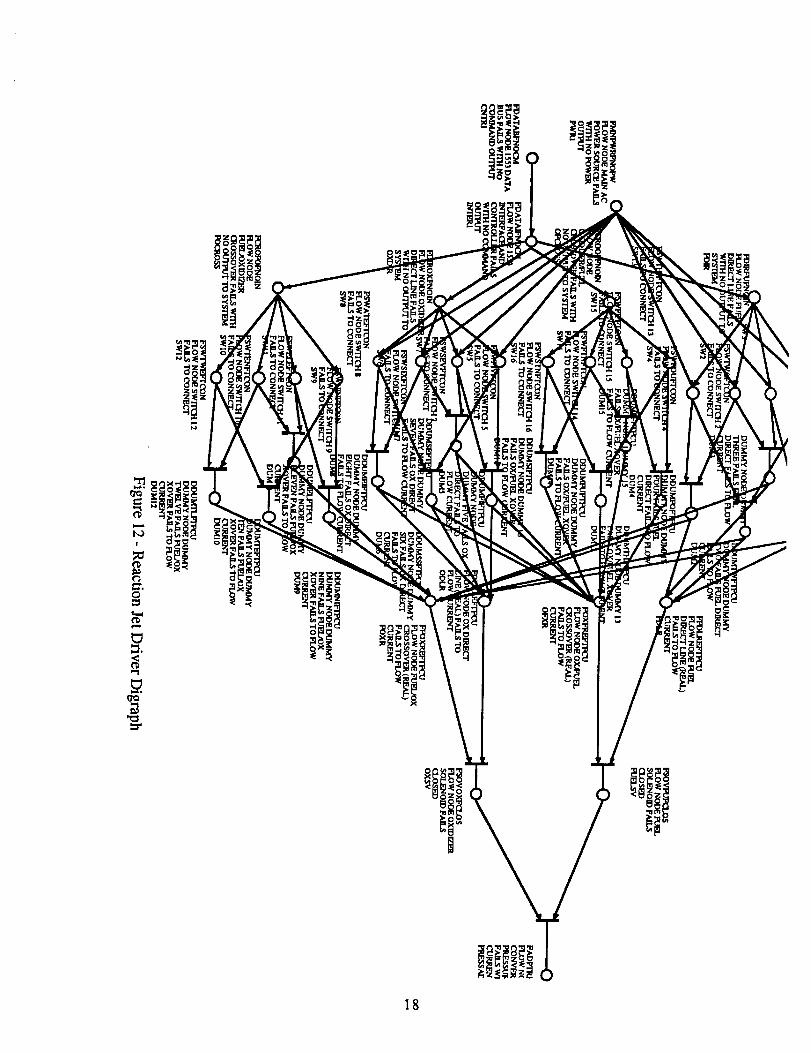
The schematic for the RID is shown in Figure 13. This model has 46 "and" and "or" gates
and highlights the redundant switching capability of the RJD. The model was developedunder the assumption that the undesirable end event is that no jets fire. The loss of the
power supply would cause this, as would loss of the controller. As the model shows, theswitch redundancy is such that you must lose both paths directly to each valve as well as
the crossover paths to lose fire capability on that valve. Failures that were not capable ofpropagation to disable a valve were not included.
The FEAT program is useful for highlighting propagation paths at the system level. Itcould also be used as a presentation tool for illustrating redundancy, robustness, andsystem failure propagation protection. However, getting into lower than component-leveldetails quickly becomes cumbersome for both the model constructor and the program. Therunning time of the program increases substantially as model complexity increases. Itbecame apparent while creating the RJD model that concentrating on the functionality of thesystem leading to the valve failures was a better approach than trying to simulate exacthardware failures in the model. Thus, the power failure propagates through the switchingnetwork to fail the valves, even though power failure does not "fail" the switches per se.
17
w
!
° !ii
18
R=OPEN
• G=CLOSED 16 PLY = FAULT
I 28 V POWER SUPPLY I
BITE I "1-- _ 1553 BUS I
Control I I CNTR1
iJNTEF_1 L I
OFCE_ ISW15SW16 OFXR I
I
.,r._.)'o R:x:_oss IRDXR SWl 1 SW12
"k'--_,"SW9 SWl0
I I I
INTERFACE | SW5 SWT-_AND / --
_P('- '-'1 SW6 SW8
1
FDLR. COJ:
FUEL OX]DEER_D SOLENOID
FUELSV OXSV
Figure 13 - Reaction Jet DHver FEAT Schematic
4.2 FEAT Inputs
There are three Excel tables which are required inputs for this version of FEAT; one to de-scribe the components (called "comp.tbl"), one to describe the type of failures (flowfailure, hardware failure, etc. - called "failure.tbr') and the failure mechanism (power failsoff, etc.), and one to link the components with the types of failures they are susceptible to(called "comp.tbr'). The ".tbr' extension is necessary for FEAT to identify the tables. Allthree tables must reside in the same folder where the FEAT programs are located, in orderfor FEAT to utilize them for data input.
19
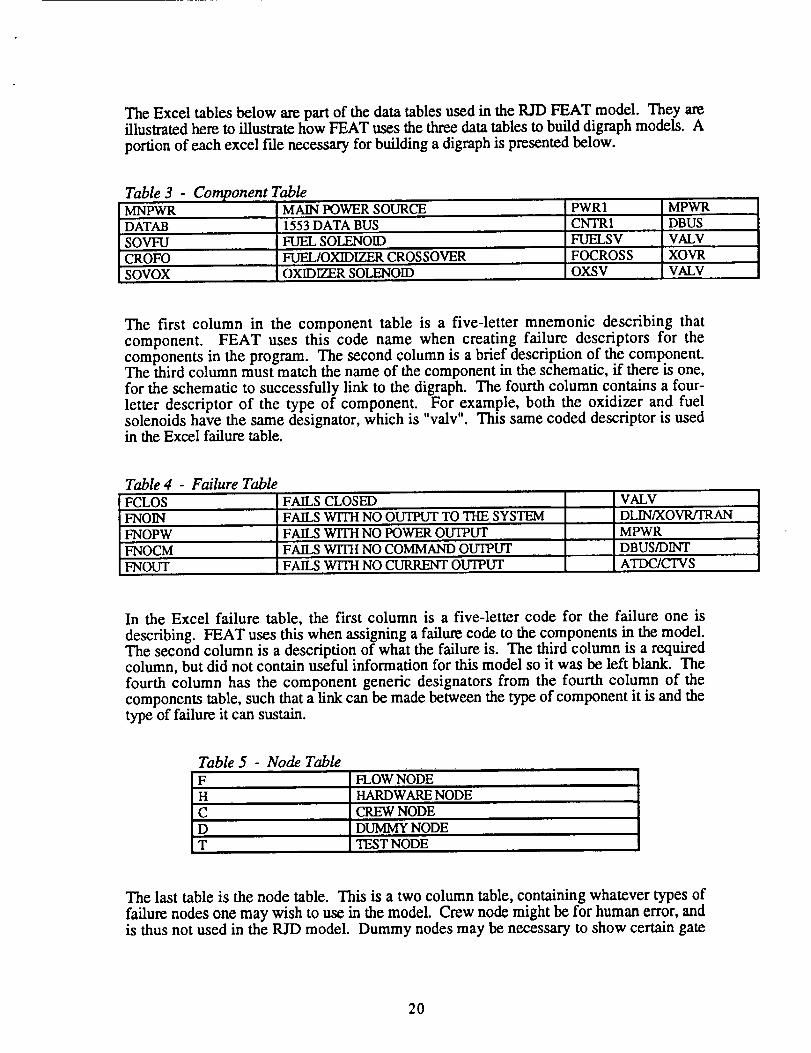
The Excel tables below are part of the data tables used in the RID FEAT model. They areillustrated here to illustrate how FEAT uses the three data tables to build digraph models. A
portion of each excel file necessary for building a digraph is presented below.
Table 3 - Component TableMNPWR MAIN POWER SOURCE PWR1 MPWR
DATAB 1553 DATA BUS CNfR1 DBUS
SOVFU FUEL SOLENOID FUELSV VALV
CROFO FUEL/OXIDIZER CROSSOVER FOCROSS XOVR
SOVOX OXIDI7F_R SOLENOID OXSV VALV
The first column in the component table is a five-letter mnemonic describing that
component. FEAT uses this code name when creating failure descriptors for thecomponents in the program. The second column is a brief description of the component.The third column must match the name of the component in the schematic, if there is one,
for the schematic to successfully link to the digraph. The fourth column contains a four-letter descriptor of the type of component. For example, both the oxidizer and fuelsolenoids have the same designator, which is "valv". This same coded descriptor is usedin the Excel failure table.
Table 4 - Failure Table
FCLOS FAILS CLOSED VALVFNOIN FAILS WITH NO OUTPUT TO THE SYSIV_2vl DLIN/XOVR/TRAN
FNOPW FAILS WITH NO POWER OUTPUT MPWRFNOCM FAILS WITH NO COMMAND OU'I_UT DBUS/DINT
FNOUT FAILS WITH NO CURRENT OUTPUT ATDCIL-fVS
In the Excel failure table, the first column is a five-letter code for the failure one is
describing. FEAT uses this when assigning a failure code to the components in the model.The second column is a description of what the failure is. The third column is a requiredcolumn, but did not contain useful information for this model so it was be left blank. The
fourth column has the component generic designators from the fourth column of thecomponents table, such that a link can be made between the type of component it is and the
type of failure it can sustain.
Table 5 - Node Table
F FLOW NODEIII
H HARDWARE NODE
C CREW NODEI I
D
T
DUMMY NODE11
TEST NODE
The last table is the node table. This is a two column table, containing whatever types of
failure nodes one may wish to use in the model. Crew node might be for human error, andis thus not used in the RJD model. Dummy nodes may be necessary to show certain gate
20
structuresdueto program limitations. For example, only two inputs are allowed per "and"gate. The only nodes used in the RID model are flow nodes and dummy nodes.
A lot of the finesse required in the use of the FEAT program and interpretation of its resultsinvolves ensuring that the data in the Excel tables is correct. The failures must be correctfor each component and the links between the components and which failures they cansustain must be appropriate and correct.
21
5.0 Conclusions
The first RJD prototype was tested so that feedback could be provided while the secondprototype was being developed. It was also used as a demonstration tool. It served well inboth capacities. The second prototype was tested to measure its performance. All of thefunctions advertised in the Digital Design Document were successfully completed. Thefiring and skew durations were measured with a digital oscilloscope and were within 10and 1 msec, respectively, of their commanded values for all test cases. Finally, anabundance of failure scenarios were tested and the prototype reacted to all of them as wasdescribed in the documentation. In addition to the success of the RJD tests, the concurrent
design process was also successful. The process was supported by internet connectivitybetween Lockheed Sanders and LESC, which allowed for very quick transfers of data and
updated versions of the 1553 graphical interface software which was under development.
The POV and the DAV testing was important in that the RJD system was proven to workwith actual hardware. The data received from those tests will be instrumental in more
clearly defining the characteristics and in studying the failure modes of the valves.
The FEAT program is better suited for system level design verification and analysis ratherthan modeling component-level details. It could be used as a presentation tool forillustrating redundancy, robustness, or system failure propagation protection.
Some work was still in progress at the end of this contract. An addition to theLabWindows program which provided the graphical interface to the RJD was not
completed. This addition consisted of a GPIB interface from the digital oscilloscope to thePC. The oscilloscope is triggered by a fire command and collects the subsequent data. Thedata is then transferred back to the PC into a data file which would be compared to the
SRAM data. Further analysis of the 1553 interface was also planned. The 1553 analysiswork included measuring data transfer latencies, effects of multiple slaves connected to asingle master, and general 1553 limitations.
22
Volumem: DesignDetails
Reaction Jet Driver Digital Board
Preliminary Design Document
Inna Gurevich/Tom Geocaris
1.0 Scope
This document contains the proposed design for the second iteration of Reaction Jet
Driver (RJD) Digital Board Prototype ( a brief description of the Analog design is found at
the end of this documen0. The RJD controller is a prototype system that interprets com-
mands from a flight control system and energizes the Fuel and Oxidizer Solenoids to con-
trol fuel and Oxidizer flow within the thrusters. The RJD has limited responsibility for
health management, but is designed to support a Vehicle Health Management based Avi-onics architecture.
This single jet system is intended as a precursor and a test-bed for a fully engineered sys-
tem for initiating and monitoring jet firings for a wide variety of platforms.
This RJD design document is subject to change per further design refinements.
1.1 Document Overview
2.0 Documents
2.1 Government Documents
Relevant Government Documents are included by reference in the Lockheed Documents
specified below.
2.2 Lockheed Documents
The following documents form a part of this Design Document to the extent specifiedherein. In the event of conflict between the documents referenced and the contents of this
document, the contents of this document shall be considered a superseding requirement.
Lockheed Sanders, Inc., "Conceptual Design For the Reaction Jet Driver Prototype".
Reaction Jet Driver Digital Bmtd Preliminary Design DocumeutDex_mber 23, 1994 I
Volume m: Design Details
3.0 Functional System Requirements
3.1 Definition
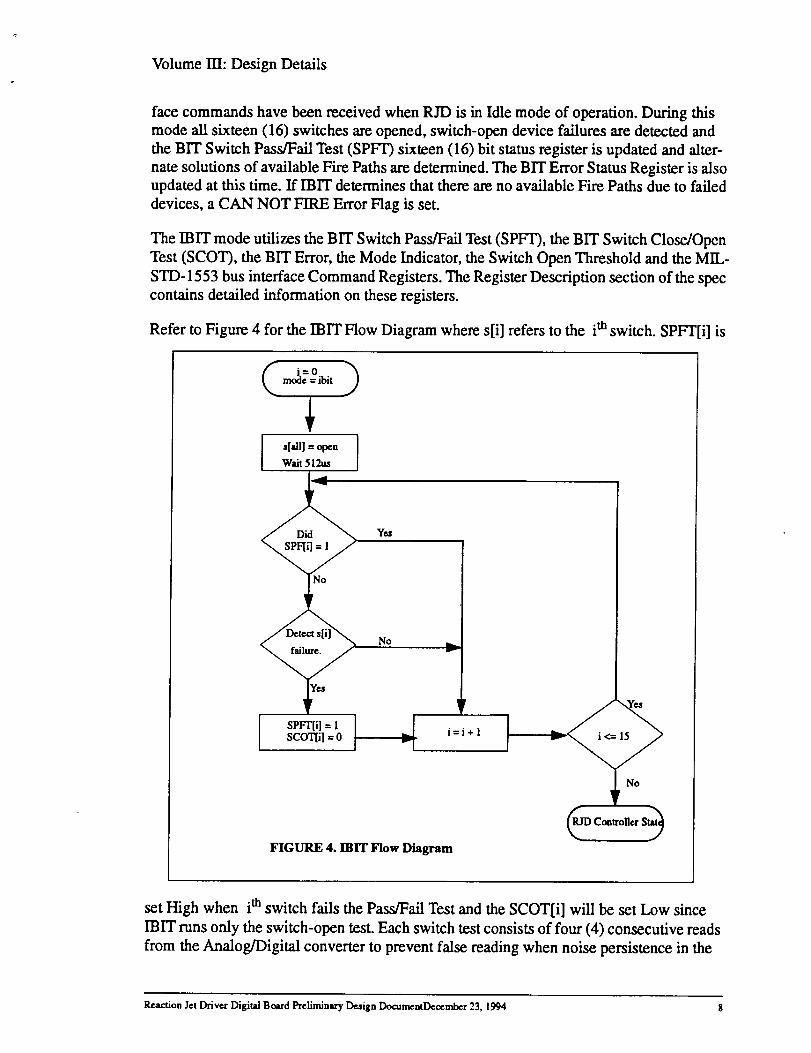
The RJD will energize the solenoids which control fuel and oxidizer valves. During a
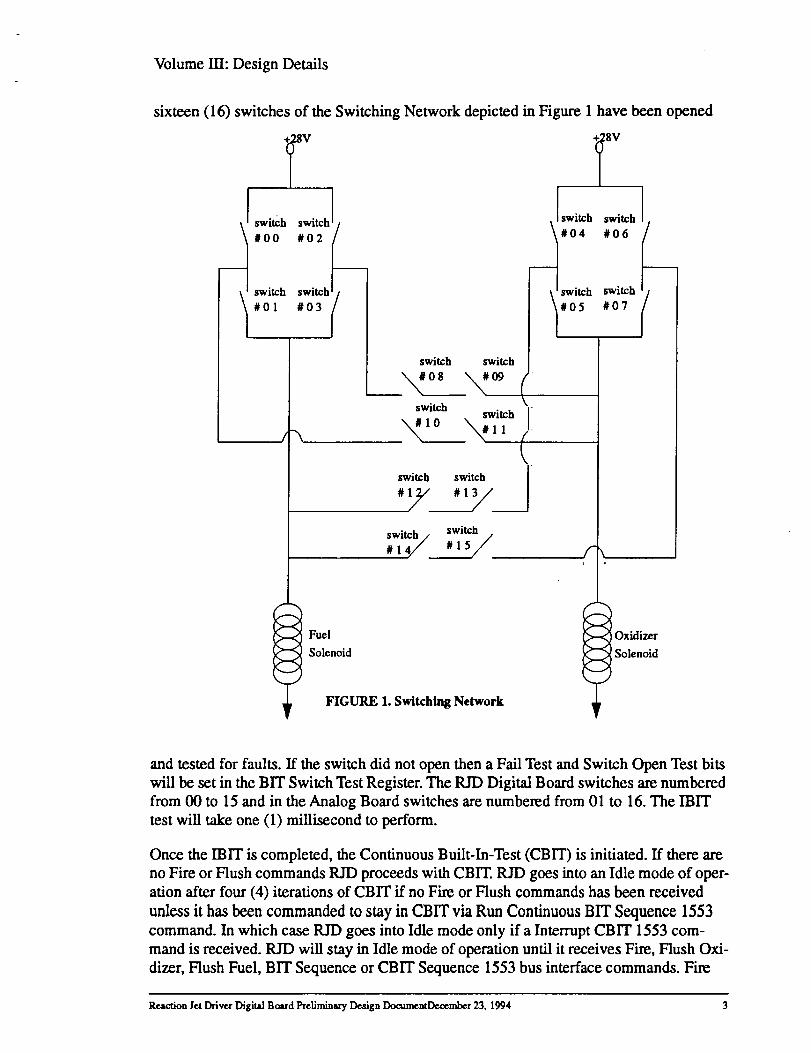
Built-In-Test (BIT) mode, the RJD will test for switch and solenoid failures and report on
their sums. At the receipt of a Fire command from the MIL-STD-1553 bus interface, RJD
will energize the solenoids in a safe and timely fashion, and will record significant events.
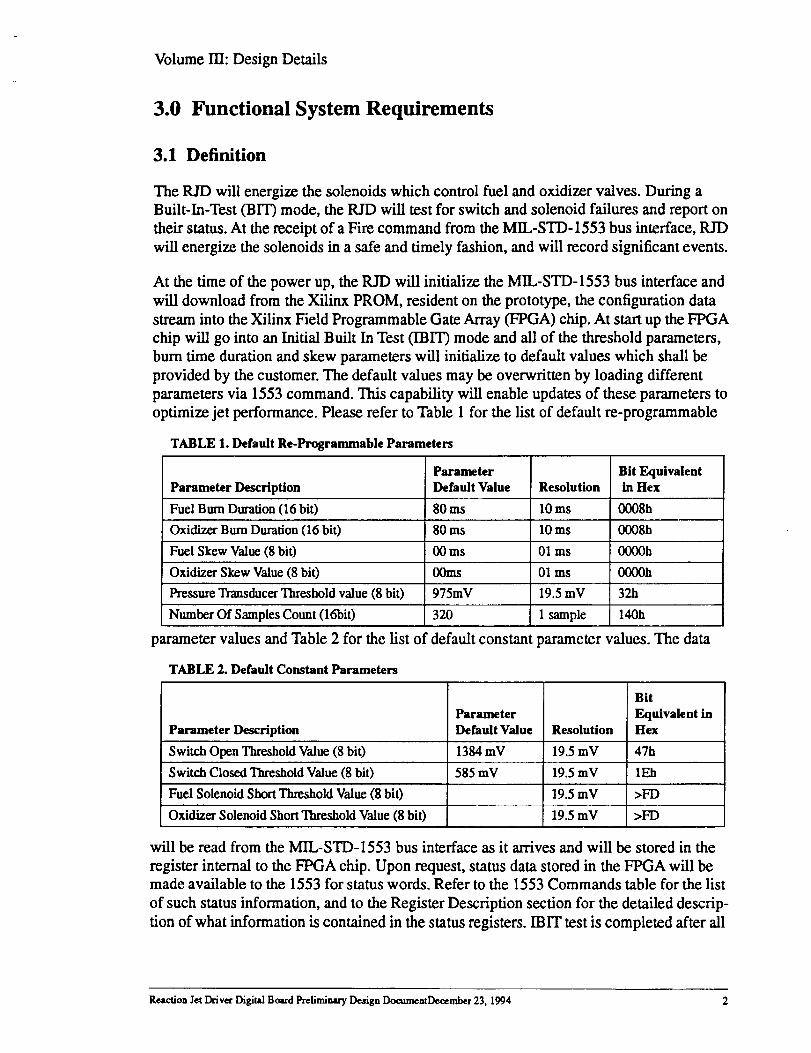
At the time of the power up, the RJD will initialize the MIL-STD-1553 bus interface and
will download from the Xilinx PROM, resident on the prototype, the configuration data
stream into the Xilinx Field Programmable Gate Array (FPGA) chip. At start up the FPGA
chip will go into an Initial Built In Test (IBIT) mode and all of the threshold parameters,
burn time duration and skew parameters will initialize to default values which shall be
provided by the customer. The default values may be overwritten by loading different
parameters via 1553 command. This capability will enable updates of these parameters to
optimize jet performance. Please refer to Table 1 for the list of default re-programmable
TABLE 1. Default Re-Programmable Parameters
Parameter Bit EquivalentParameter Description Default Value Resolution in Hex
Fuel Burn Duration (16 bit) 80 ms 10 ms 0008h
Oxidizer Bum Duration (16 bit) 80 ms 10 ms 0008h
Fuel Skew Value (8 bi0 00 ms 01 ms 0000h
Oxidizer Skew Value (8 bit) OOms O1 ms O000h
Pressure Transducer Threshold value (8 bit) 975mV 19.5 mV 32h
Number Of Samples Count (16bit) 32() .......... 1 sample 140h
parameter values and Table 2 for the list of default constant parameter values. The data
TABLE 2. Default Constant Parameters
Bit
Parameter Equivalent in
Parameter Description Default Value Resolution Hex
Switch Open Threshold Value (8 bit) 1384 mV 19.5 mV 47h
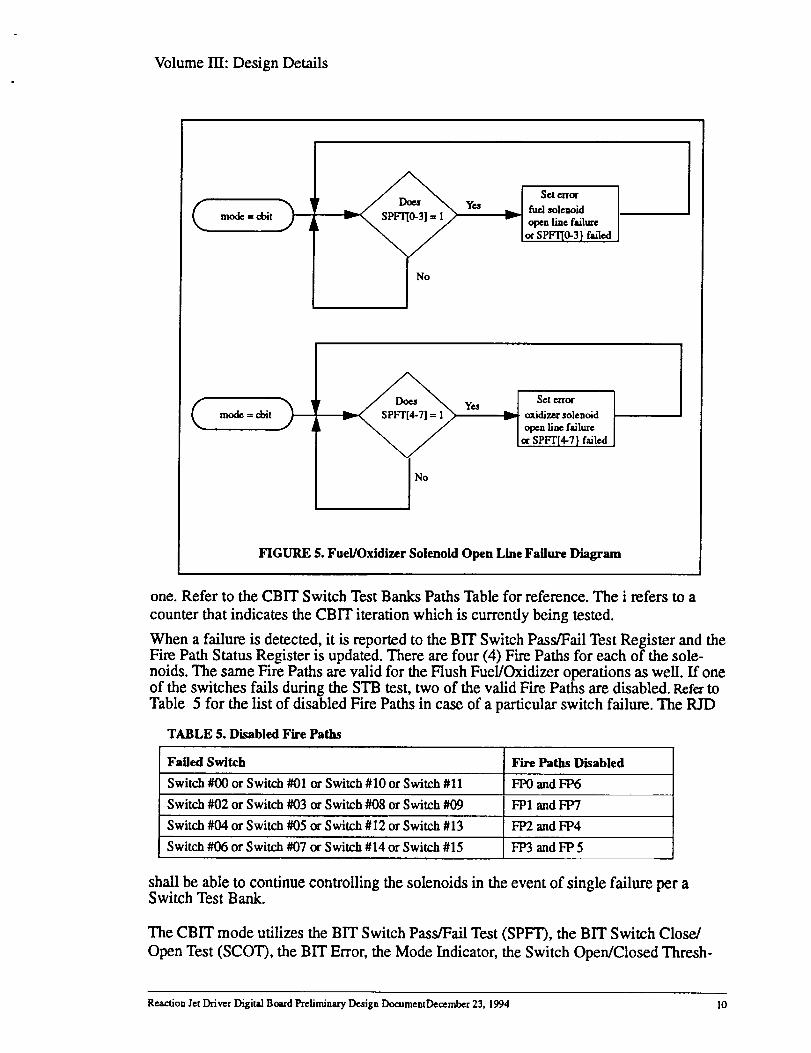
FIGURE 5. Fuel/Oxidizer Solenoid Open Line Failure Diagram
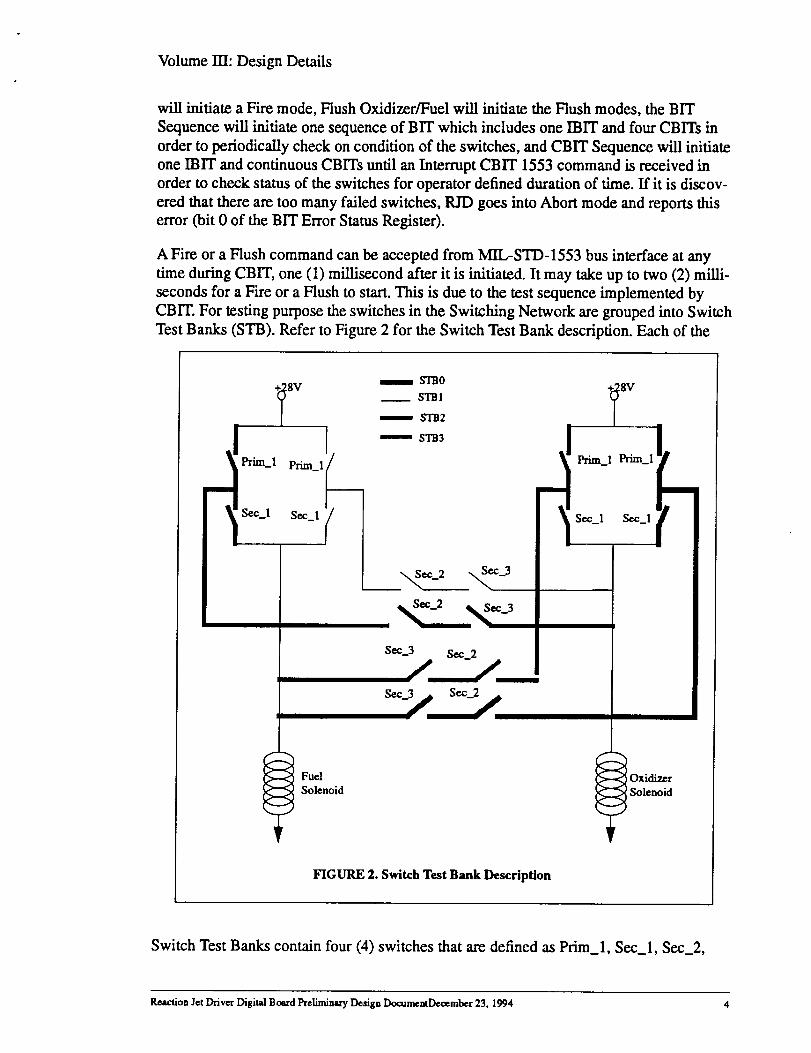
one. Refer to the CBIT Switch Test Banks Paths Table for reference. The i refers to a
counter that indicates the CBIT iteration which is currently being tested.
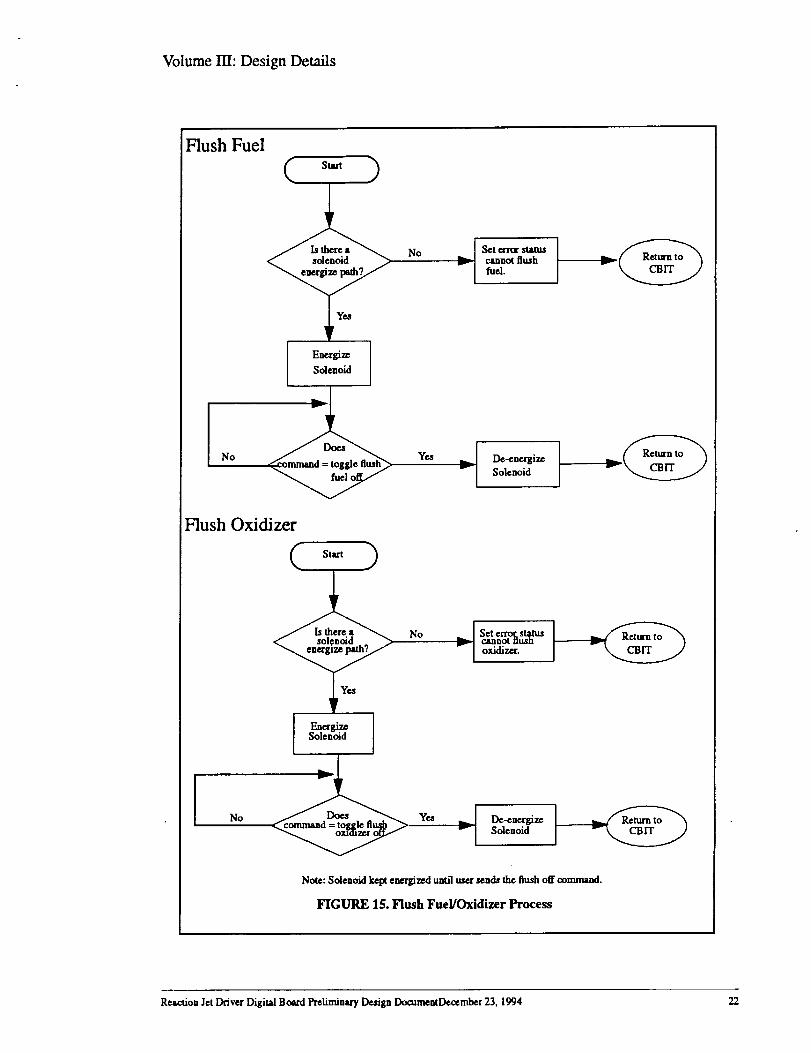
When a failure is detected, it is reported to the BIT Switch Pass/Fail Test Register and theFire Path Status Register is updated. There are four (4) Fire Paths for each of the sole-
noids. The same Fire Paths are valid for the Flush Fuel/Oxidizer operations as well. If oneof the switches fails during the STB test, two of the valid Fire Paths are disabled. Refer toTable 5 for the list of disabled Fire Paths in case of a particular switch failure. The RID
TABLE 5. Disabled Fire Paths
Failed Switch Fire Paths Disabled
Switch #00 or Switch #01 _ Switch #10 or Switch #1l FP0 and FP6
Switch #02 or Switch #03 or Switch #08 or Switch #09 FP1 and FP7
Switch #04 or Switch #05 or Switch #12 or Switch #13 FP2 and FP4
Switch #06 or Switch #07 or Switch #14 or Switch #15 FP3 and FP 5
shall be able to continue controlling the solenoids in the event of single failure per aSwitch Test Bank.
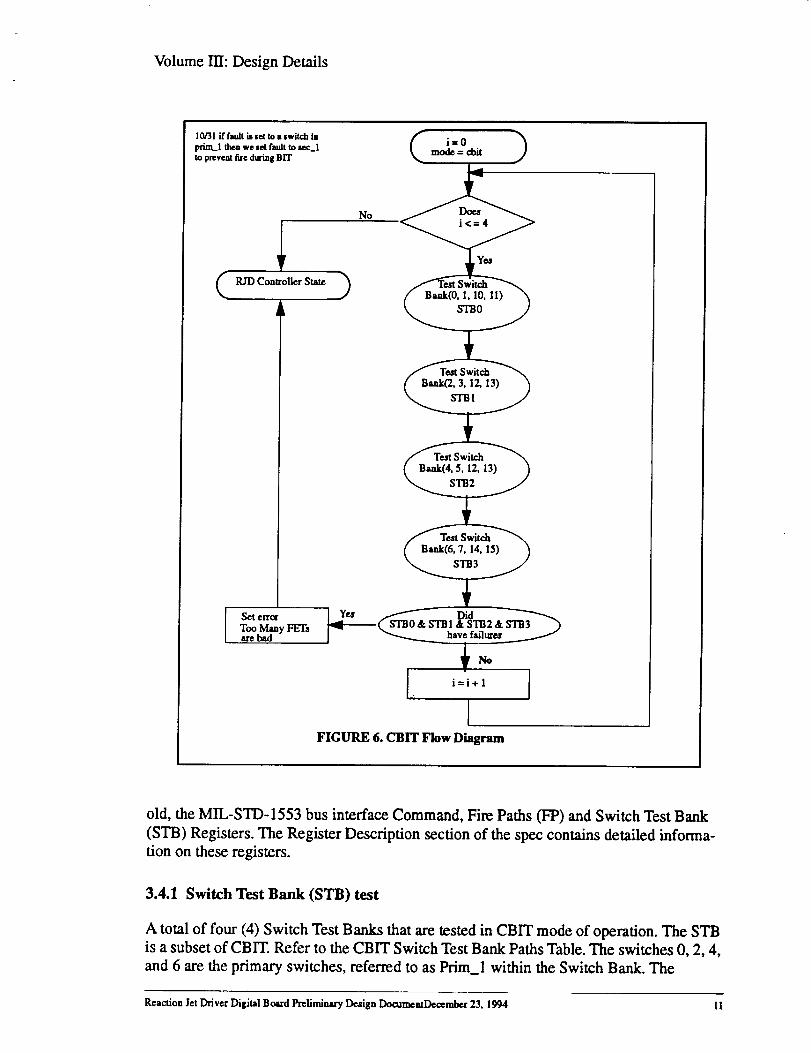
The CBIT mode utilizes the BIT Switch Pass/Fail Test (SPFT), the BIT Switch Close/
Open Test (SCOT), the BIT Error, the Mode Indicator, the Switch Open/Closed Thresh-
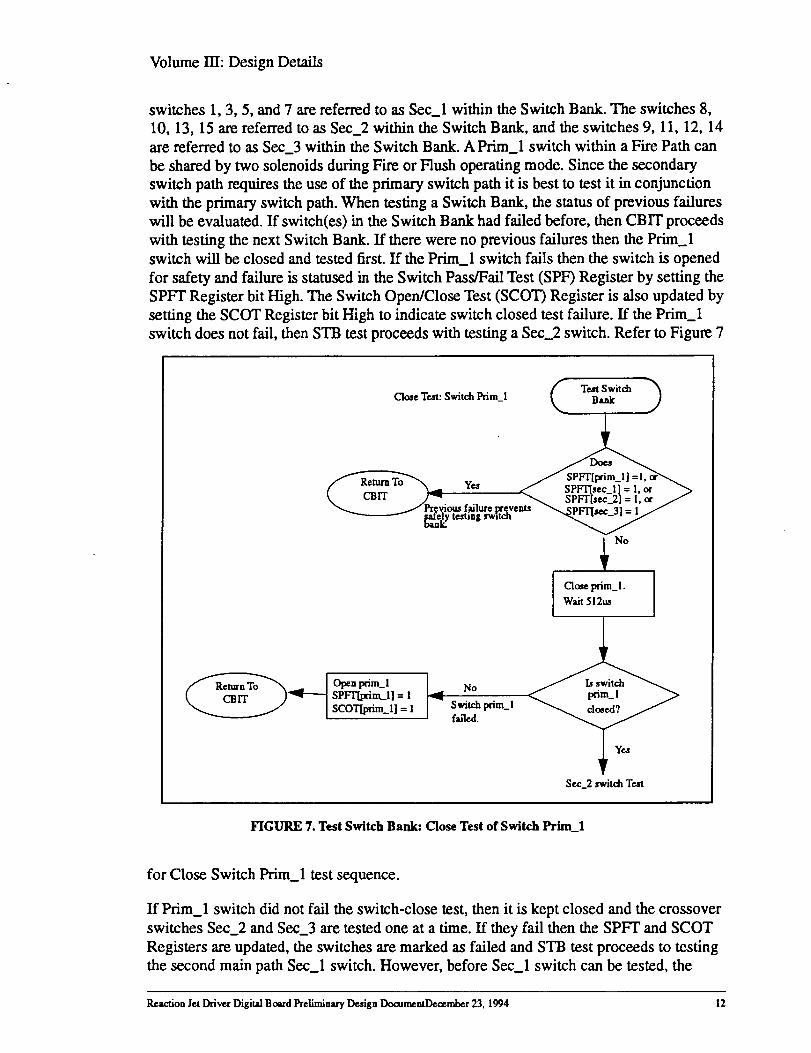
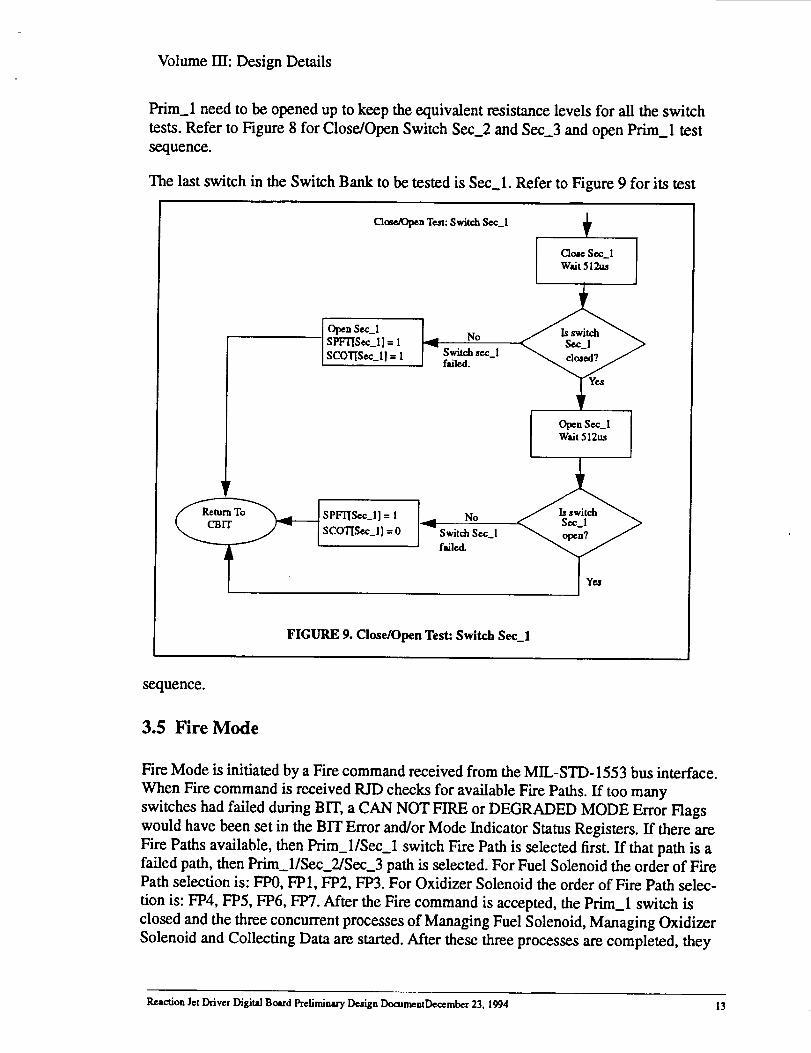
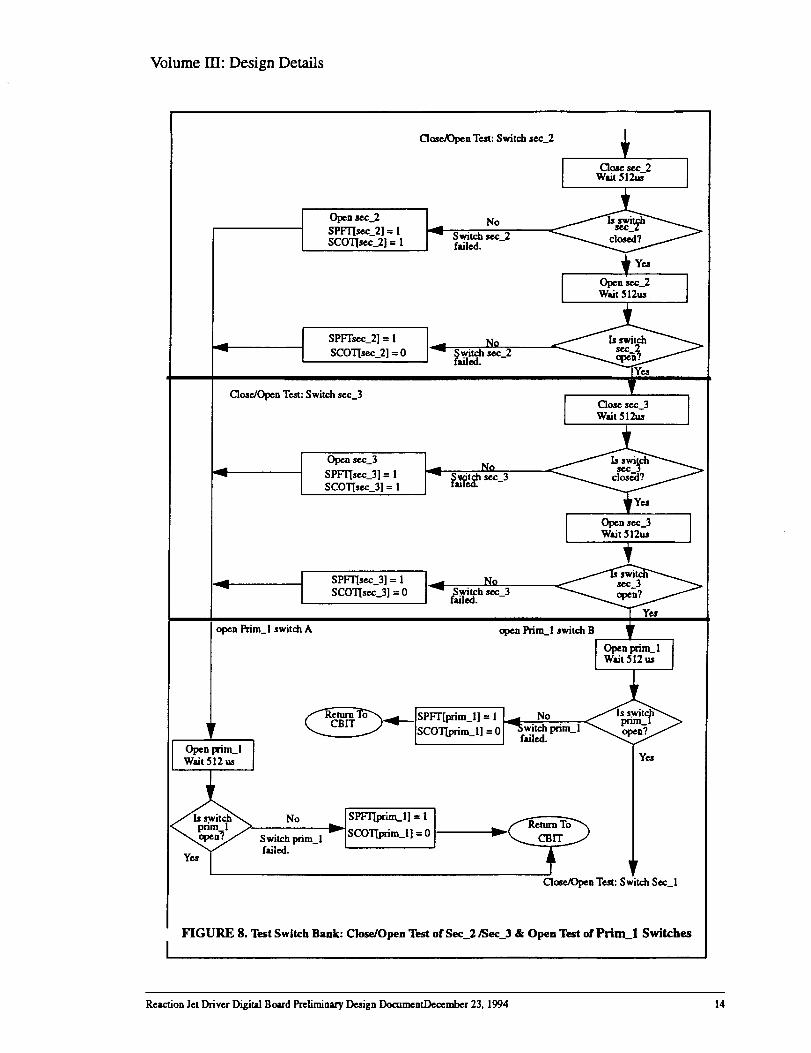
Prim_l need to be opened up to keep the equivalent resistance levels for all the switch
tests. Refer to Figure 8 for Close/Open Switch Sec_2 and Sec_3 and open Prim_l test
sequence.
The last switch in the Switch Bank to be tested is Sec_l. Refer to Figure 9 for its test
CloseK)pen Test: Switch See_l
Open See_lSPFT[See_I] = 1
SCOT[See_I] = 1 NoSwitch see_lfailed.
_ SPFT[See_I] = 1
.j [scortseej] =0
NoSwitch See l
failed.
Close Sec_lWait 512us
Open Sec_lWait 512us
FIGURE 9. Close/Open Test: Switch Sec_l
sequence.
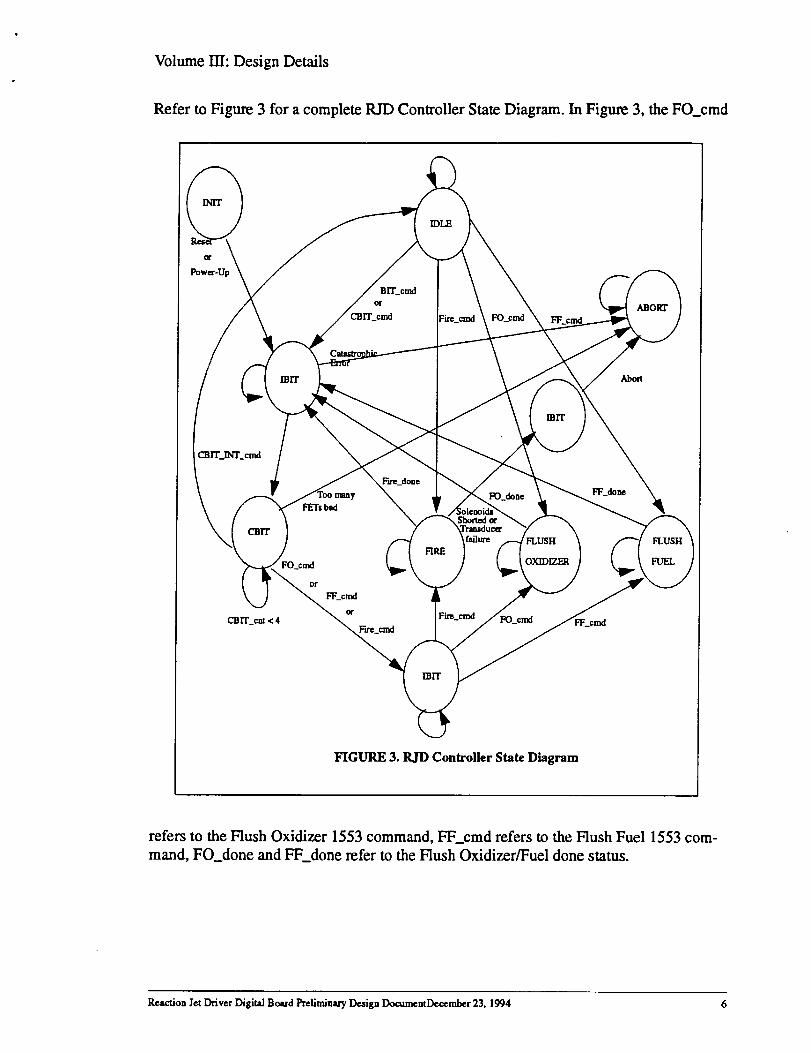
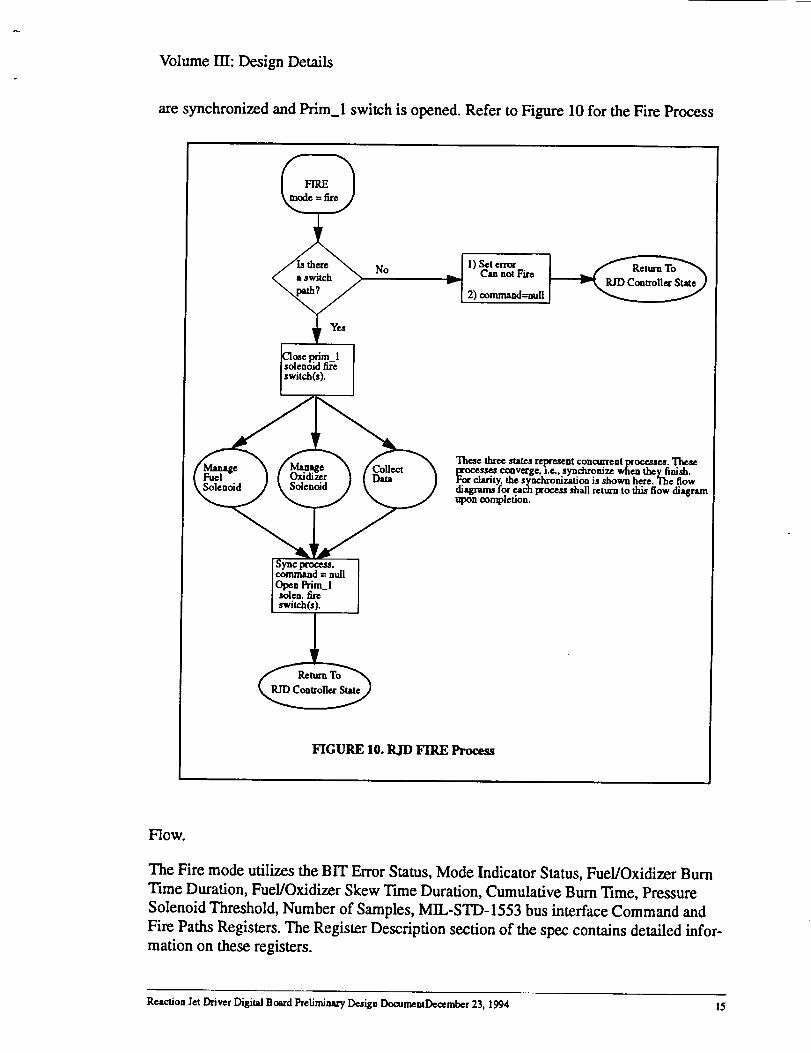
3.5 Fire Mode
Fire Mode is initiated by a Fire command received from the MIL-STD- 1553 bus interface.
When Fire command is received RID checks for available Fire Paths. If too many
switches had failed during BIT, a CAN NOT FIRE or DEGRADED MODE Error Flags
would have been set in the BIT Error and/or Mode Indicator Status Registers. If there are
Fire Paths available, then Prim_l/Sec_l switch Fire Path is selected first. If that path is afailed path, then Prim_l/Sec_2/Sec_3 path is selected. For Fuel Solenoid the order of Fire
Path selection is: FP0, FP1, FP2, _. For Oxidizer Solenoid the order of Fire Path selec-
tion is: FP4, FP5, FP6, FP7. After the Fire command is accepted, the Prim_l switch is
closed and the three concurrent processes of Managing Fuel Solenoid, Managing Oxidizer
Solenoid and Collecting Data are started. After these three processes are completed, they
are synchronized and Prim_l switch is opened. Refer to Figure 10 for the Fire Process
No
Cloee L_fi'm_l ]
solenoid fireswitch(s).
Syne process. I
command = null] Open Prim_!I solen, fire
I ,witch(s).
1) Set error
..._ Can not Fire
..v[ 2) command=null
These three smtea represent contmrrent processea. Theseprocesses converge, i.e.., synchronize when they finish.For clarity, the synchronization is shown here. The flowdiagrams for each process shall return to this flow diagraraupon completion.
FIGURE 10. RJD FIRE Process
Flow.
The Fire mode utilizes the BIT Error Status, Mode Indicator Status, Fuel/Oxidizer Burn
Time Duration, Fuel/Oxidizer Skew Tnne Duration, Cumulative Bum Time, Pressure
Solenoid Threshold, Number of Samples, MIL-STD-1553 bus interface Command and
Fire Paths Registers. The Register Description section of the spec contains detailed infor-
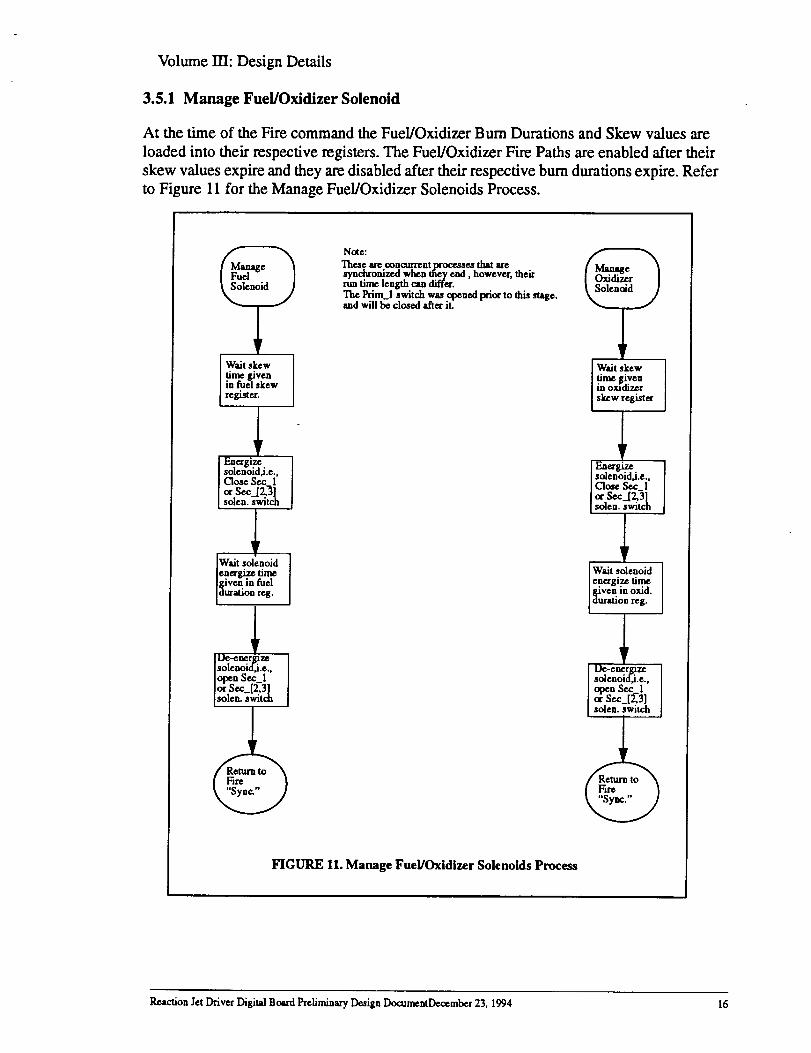
At the time of the Fire command the Fuel/Oxidizer Bum Durations and Skew values are
loaded into their respective registers. The Fuel/Oxidizer Fire Paths are enabled after their
skew values expire and they are disabled after their respective bum durations expire. Refer
to Figure 11 for the Manage Fuel/Oxidizer Solenoids Process.
These are concurrent processes that aresynchronized when tfiey end, however, thekrun time length can differ.The Prim_l switch was opened prior to this stage.and will be closed after it.
Wait skew { { Wait skewtime given ltimegivenin fuel skew I in omdizerregister. I skew register
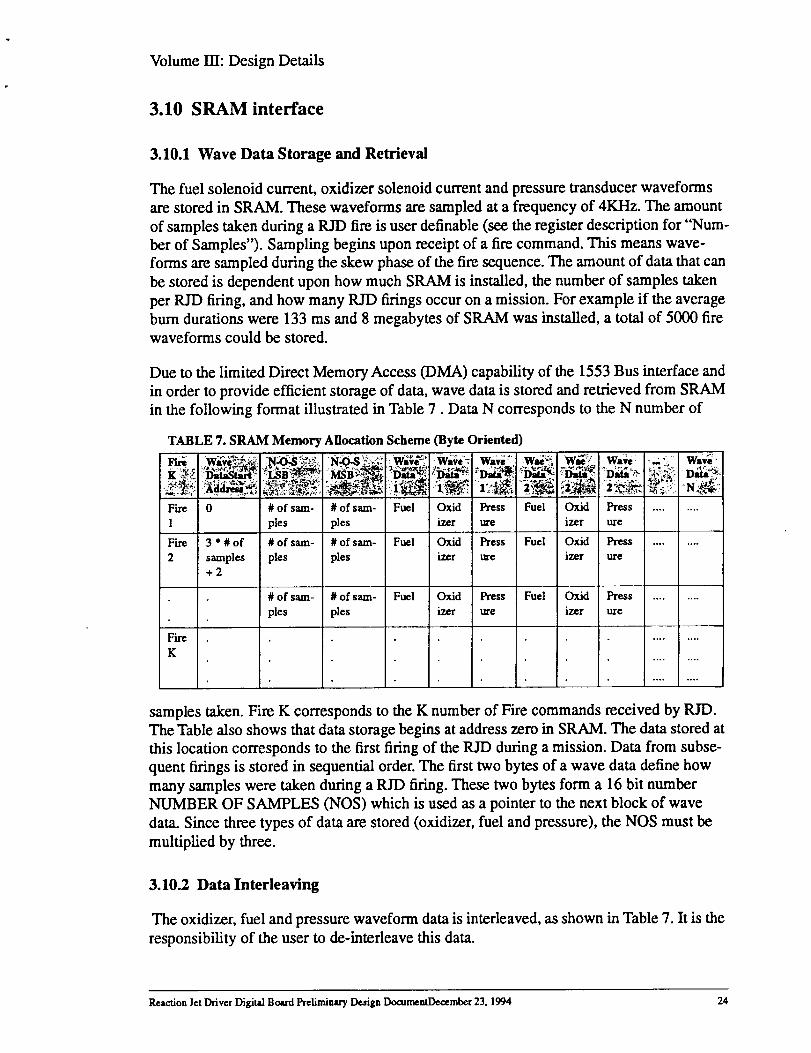
RID will store single mission significant information. The Fuel Solenoid, Oxidizer Sole-
noid and Pressure Transducer Waveforms will be stored in the on board SRAM and will be
available upon request via 1553 at completion of a mission. The Cumulative Bum Dura-
tion, the SRAM Data Length, the Solenoid Shorted Failure and Pressure Transducer Fail-
ures will be stored in the FPGA registers and will be available upon request via 1553during a mission.
The data waveforms from the A/D convener will be sampled at the rate of four (4) kilo-
hertz and thus have a resolution of .25ms. The number of samples to be taken will be pro-
vided via 1553 and loaded into the RID Number of Samples Register.
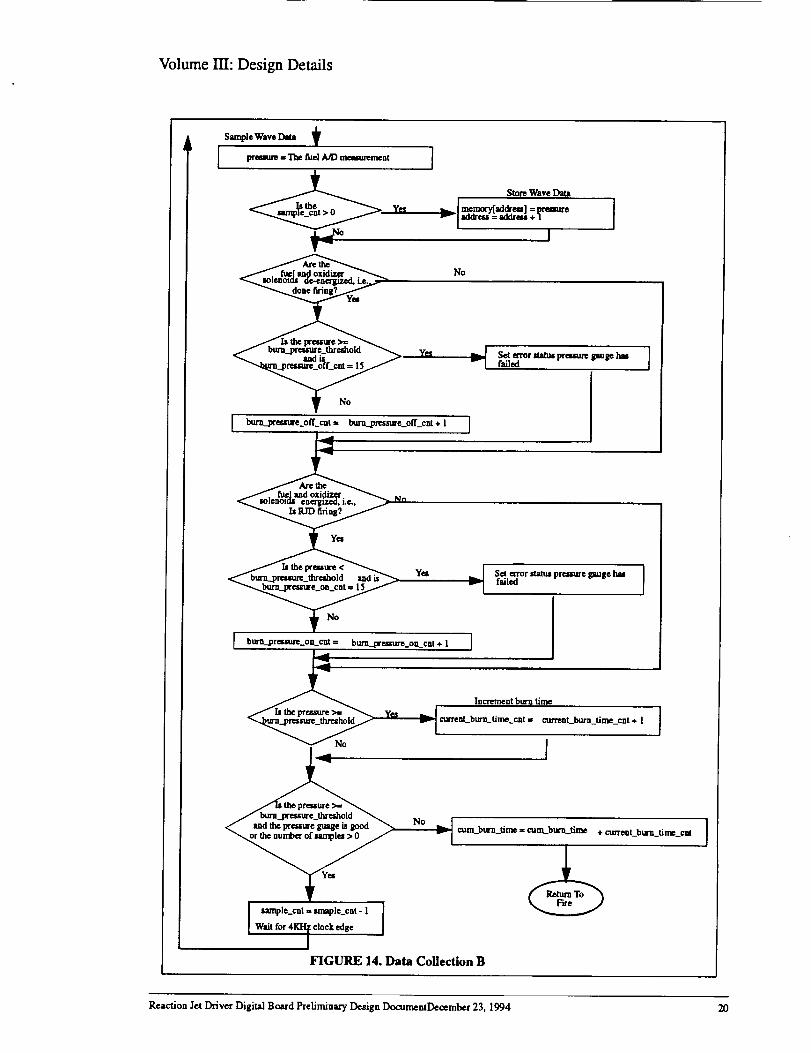
RJD will track the bum time duration during a Fire based on Pressure Transducer Wave-
form readings. The fire duration is considered the time duration that the Pressure Trans-
ducer reading is above the specified threshold. These bum durations will be accumulated
over all the Fires during a mission and stored in the Cumulative Bum 'llme Duration Reg-
ister. The number of samples requested should be large enough to cover the burn duration
period. If number of samples does not cover the whole bum duration, only those sampleswill be stored in SRAM, but the burn duration time will continue to be tacked and added tothe Cumulative Bum Time Duration.
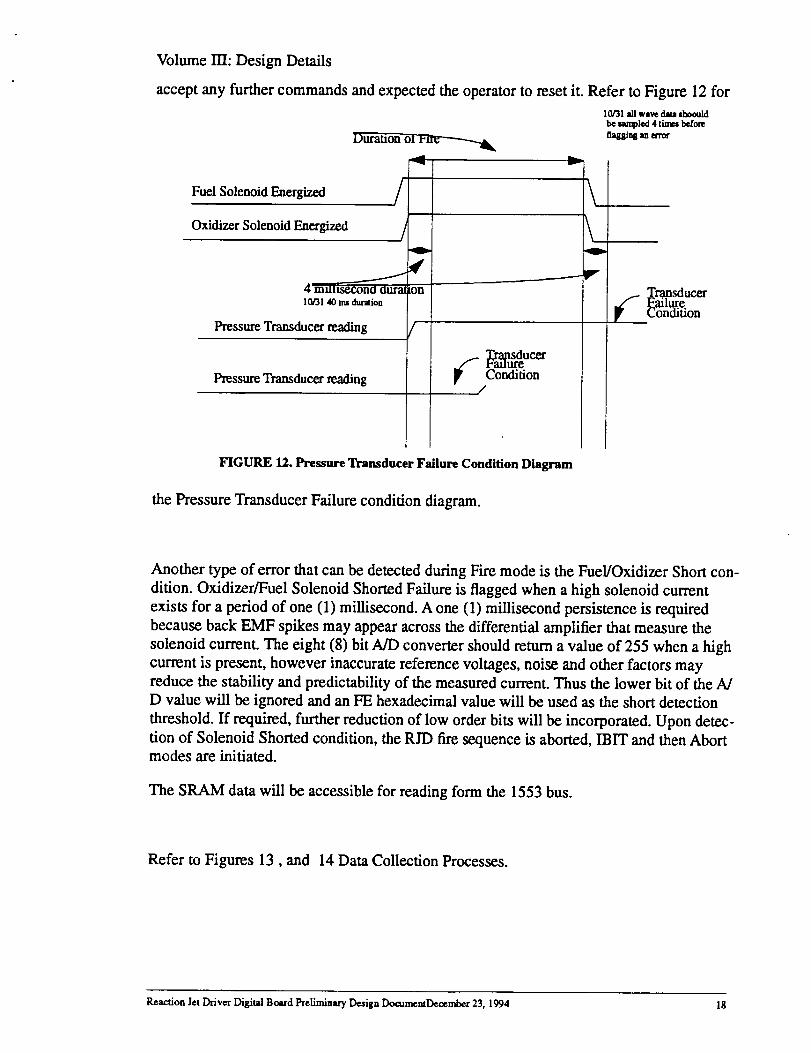
If the Pressure Transducer Waveform persists for over four (4) milliseconds after comple-
tion of firing then a transducer failure is suspected and a Pressure Transducer Failure error
bit in the BIT Error Status Register is set. The same failure condition is suspected if no
Pressure Transducer Waveform is detected for over four (4) milliseconds after the start of
the fire.In the case of such failure the RID runs an IBIT in order to update the status of
switch failures and then goes into an Abort mode. When in Abort mode, RID does not
Because the Number of Samples is programmable and the number of times an RJD is fired
during a mission is not know in advance, the amount to data stored in SRAM is unpredict-able. The SRAM Address Counter can be read via the 1553 bus interface to determine the
amount of data stored in the SRAM.
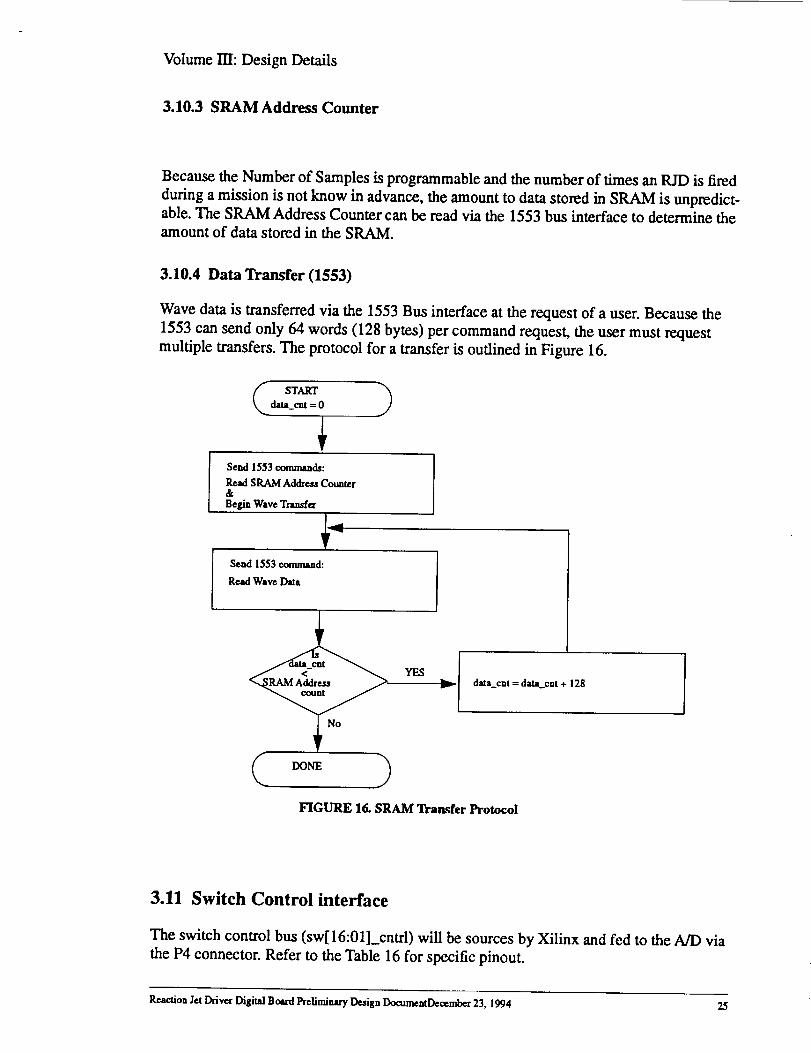
3.10.4 Data Transfer (1553)
Wave data is transferred via the 1553 Bus interface at the request of a user. Because the
1553 can send only 64 words (128 bytes) per command request, the user must request
multiple transfers. The protocol for a transfer is outlined in Figure 16.
STARTdata_eat -- 0 ]
Send 1553 conunands:
Read SRAM Address Counter&Begin Wave Tra_e_
Send 1553 command:
Read Wave Data
°1
FIGURE 16. SRAM Transfer Protocol
data_cnt = data_eat + 128
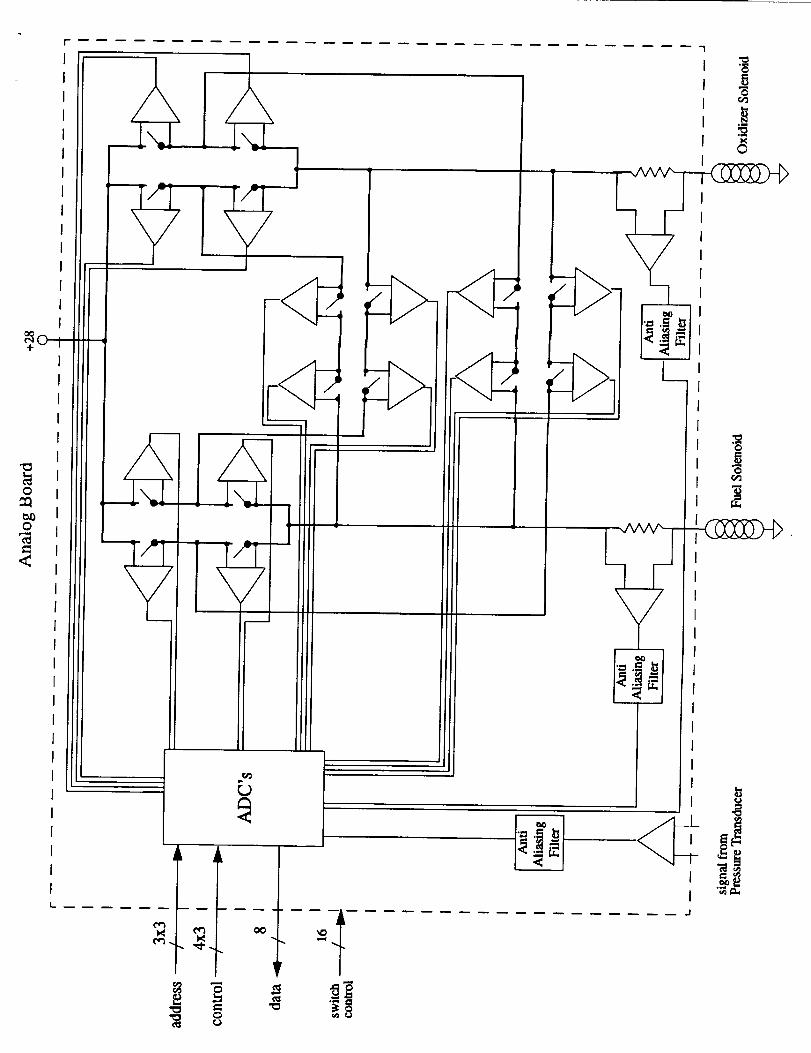
3.11 Switch Control interface
The switch control bus (sw[16:O1] cntrl) will be sources by Xilinx and fed to the A/D via
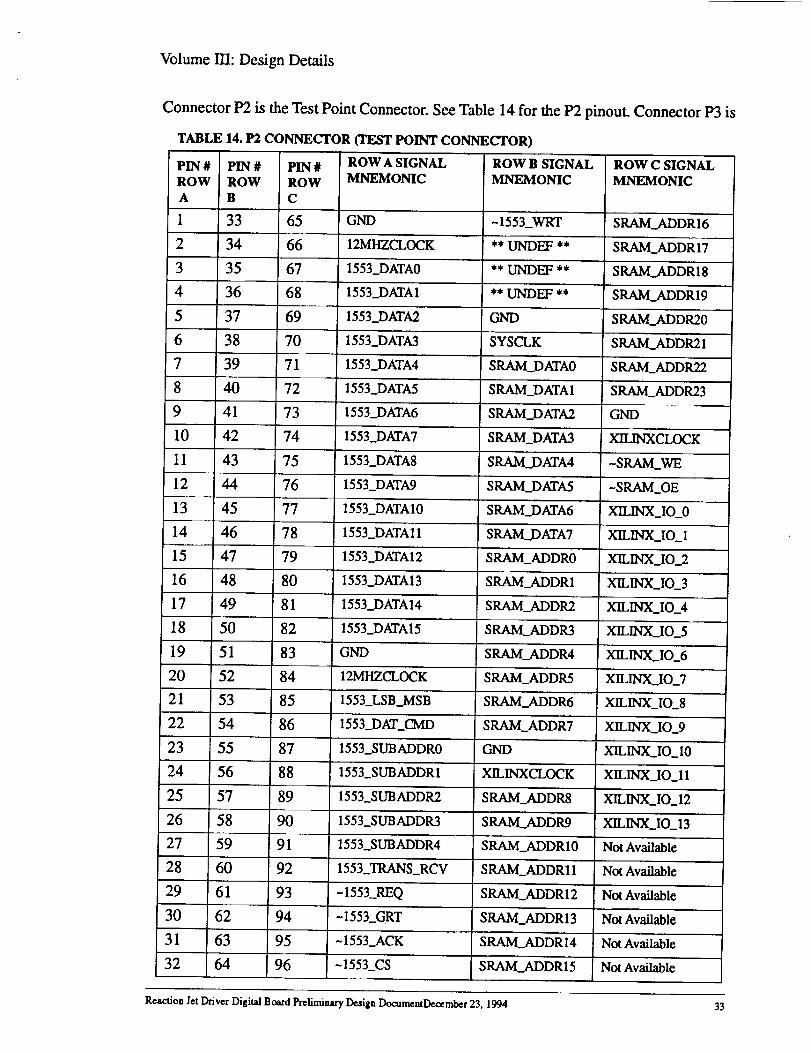
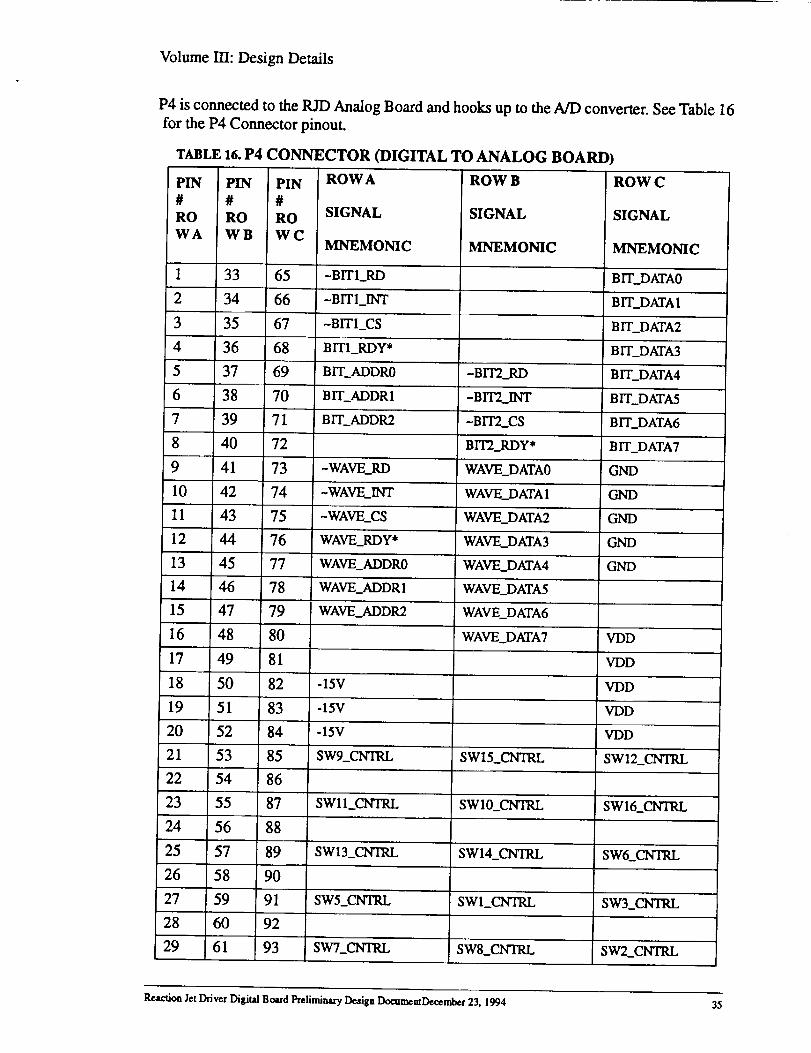
the P4 connector. Refer to the Table 16 for specific pinout.
There are two types of valve data available. One consist of a trace produced by
Hall Effect sensors attached to the valve. The idea is to measure the change in the mag-
netic field produced by energizing the valve solenoid coil as the valve actuators move
Solenoid Fuel Valve Study Decetriber 23, 1994 1
Volume IV: Solenoid End of Useful Life study
through the magnetic field. The subsequent trace of Hall sensor output voltage vs time,
clearly shows the opening of the main stage valve when mainstage pressure is applied as
in actual operation. One the other hand, another measurement that reflects the operation of
the valve is just the current vs time trace, C-T trace, associated with energizing the valve
solenoid. This method of test has the advantage that it is completely unintrusive, it
requires no additional measurement devices or sensors, and could serve as the basis of an
on-line valve diagnostic each time the valve is energized.
Measurements have been made using the C-T characteristic as a diagnostic in
valve performance. Typically, the information that one wants about valve operation can belisted as follows:
a) pilot opening time.
b) pilot opening stroke.
c) mainstage opening time.
d) mainstage opening stroke.
The pilot information, parts (a) and (b) are clearly reflected in the valve C-T characteristic,
while the mainstage characteristics are less pronounced. Since it is ultimately the main-
stage characteristics that are of the greatest interest for the proper functioning of the valve,
one must assure that the C-T characteristic can supply information corresponding to parts
(c) and (d) of the list above. After all, correct operation of the pilot stage does not guaran-
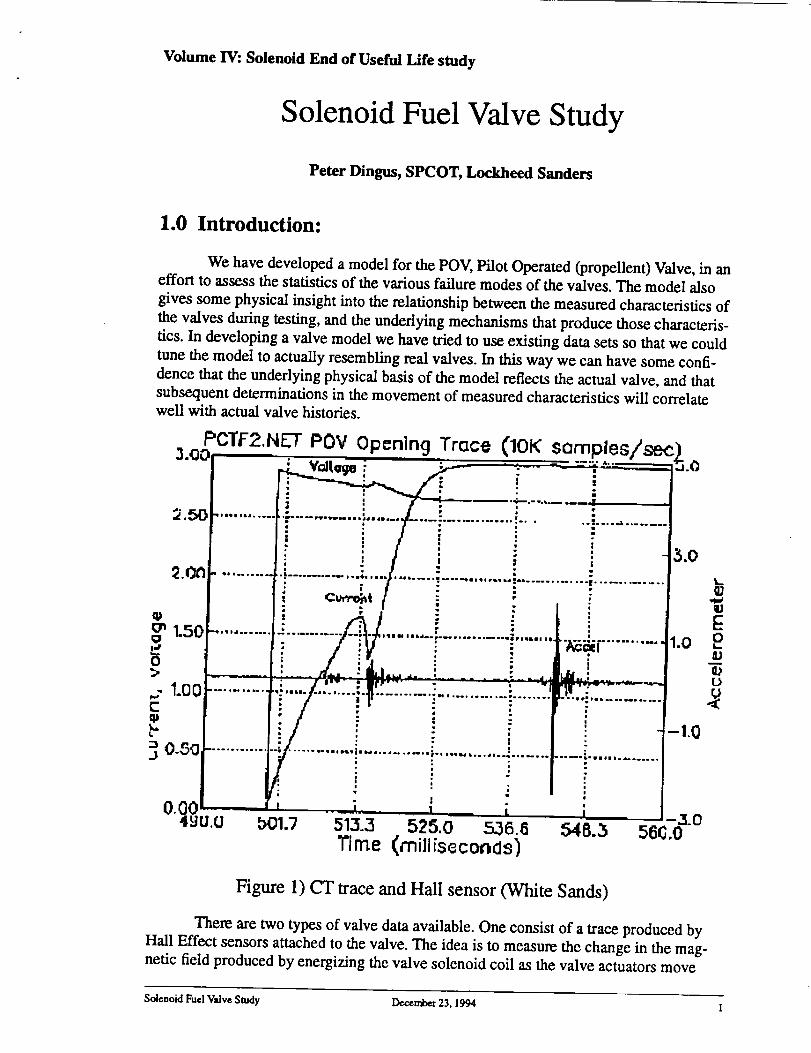
tee correct operation of the mainstage. The C-T trace data has been taken on POV valves
and has been correlated to the output of an accelerometer attached to the valve casing. The
accelerometer develops a signal as the result of physical vibrations of the casing due to the
shock of various valve actuators stopping against their stroke constraints. This then shows
the time associated with various valve actuators and can be superimposed on the C-T char-
acteristic to try to correlate various features on the C-T trace with actuator movement. Fig-
ure (1) shows one such plot. One can see two large signals developed by the
accelerometers. One corresponding to the dip of the first lobe in the C-T characteristic and
the second is associated with a small dip on the flat-top of the C-T trace. Both of these dips
indicate the stopping of the movement of armatures that open the two stages of the valve.
The first dip is associated with the end of the pilot stroke and the second with the end of
the mainstage stroke.
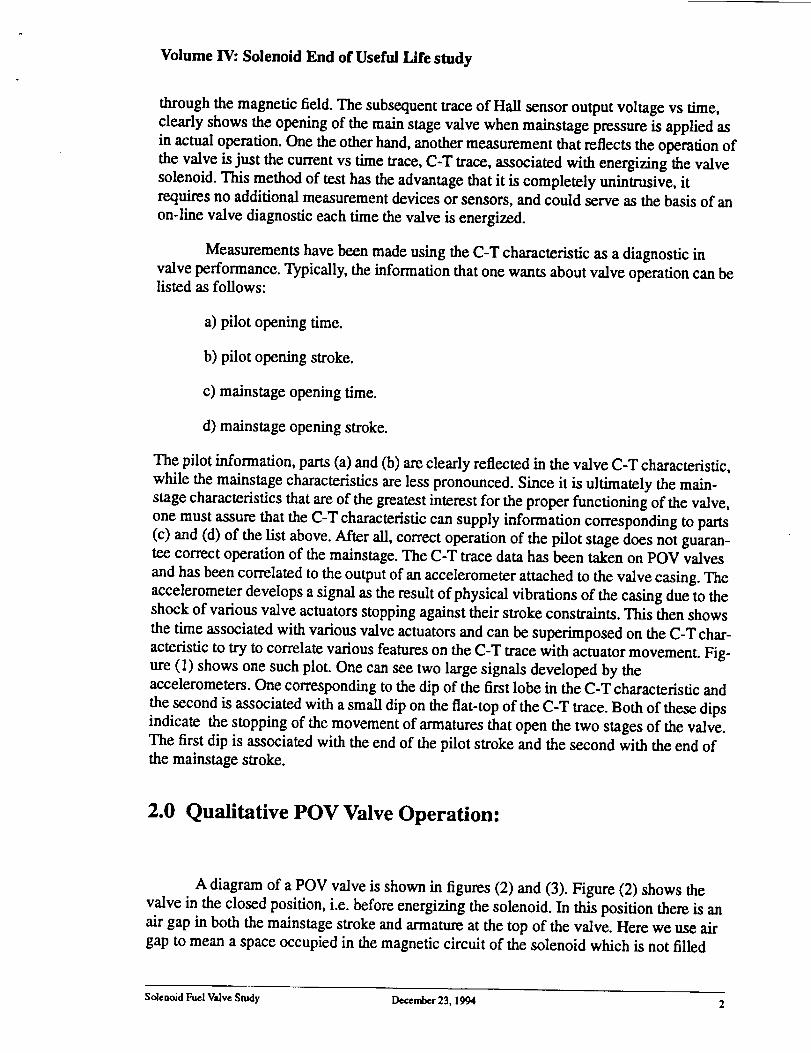
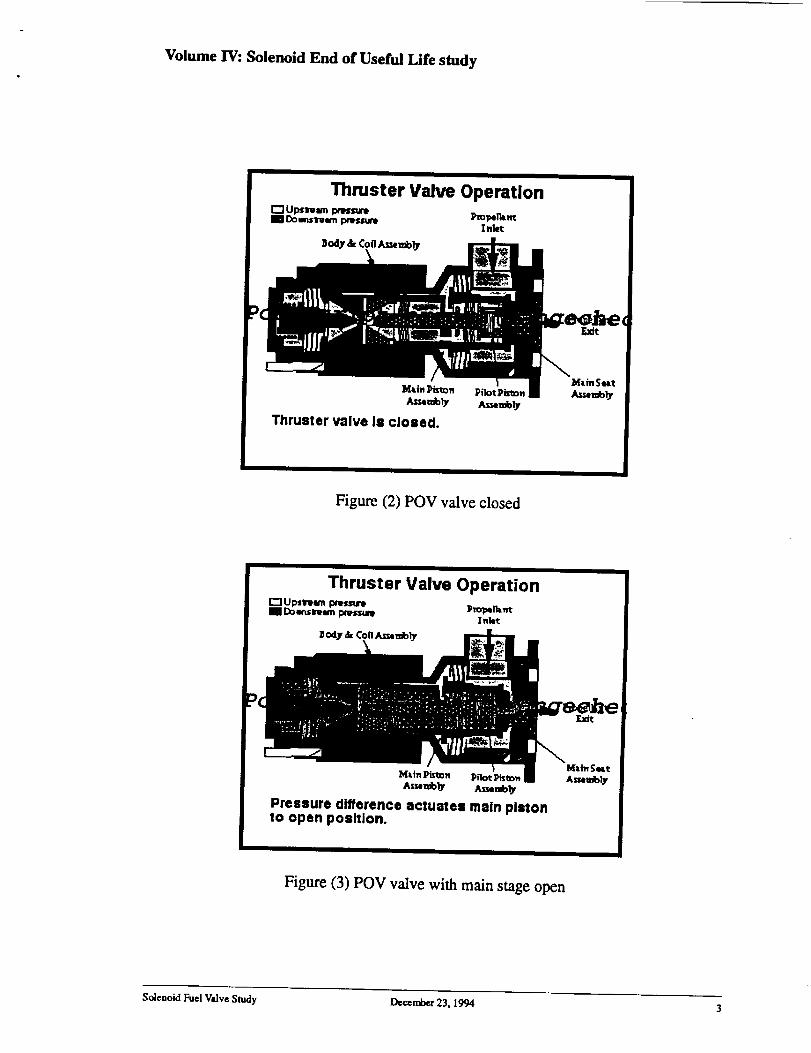
2.0 Qualitative POV Valve Operation:
A diagram of a POV valve is shown in figures (2) and (3). Figure (2) shows the
valve in the closed position, i.e. before energizing the solenoid. In this position there is an
air gap in both the mainstage stroke and armature at the top of the valve. Here we use air
gap to mean a space occupied in the magnetic circuit of the solenoid which is not filled
Solenoid Fuel Valve Study December 23, 1994 2
Volume IV: Solenoid End of Useful Life study
Figure (2) POV valve closed
Exit
Figure (3) POV valve with main stage open
Solenoid Fuel Valve Study Dccerr_r 23, 1994 3
Volume IV: Solenoid End of Useful Life study
with high permeability ferromagnetic material and the top of the valve is defined to be that
end of the valve cylinder which is opposite the fuel/oxidizer outlet. The mainstage poppet
and pilot seat at the outlet end of the valve is in contact with main stage seat, there is no air
gap here in the valve closed position. The inductance, L, of the overall valve system as
seen from the coil terminals is a function of these are gaps. As one energizes the coil, the
upper part of the pilot armature moves to close the upper gap. This increases the induc-
tance which produces the first dip in the C-T trace.
_la__L aLal ata-7- -y-., --£-
As_TaL increases _Tatdecreases. Such a large dip occurs because the at.T is relatively
large owing to the size of the gap involve and the _tr of the magnetic material relative to
the closed path of the entire magnetic circuit, 1. We find that:
AL GZm
L l + G_m
Where G is the gap size, 1 is the length of the closed magnetic field circuit, and x., is the
magnetic susceptibility. Thus for typical values like l~.2m, G~0.002m, and x., ~ I000, we
get _-_-100%. During the pilot's motion, it transmits a force through flexures and a spring
to the main stage armature and has opened the pilot valve. A pressure differential of about
34psid, due to the opening of the pilot valve, develops between the front and back of the
main stage poppet and forces open the mainstage valve. This in turn opens an air gap
between the mainstage poppet and seat, reducing the inductance seen at the coil terminals.
In this case, however, the change in L manifests itself in a shortening of the current rise-
L In this case at increase with at. Therefore for a properlytime, time constant, x = _. _ -T"
opening main stage we should see a smaller rise-time between the pilot induced dip in the
v Thus, in principle, weC-T trace and the time at which I reaches its final height, tpi,° t = _.
should be able to get all of the information necessary, as enumerated in the introduction, to
monitor the functioning of the POV valve from the C-T trace.
Solenoid Fuel Valve Study December 23, 1994 4
Volume IV: Solenoid End of Useful Life study
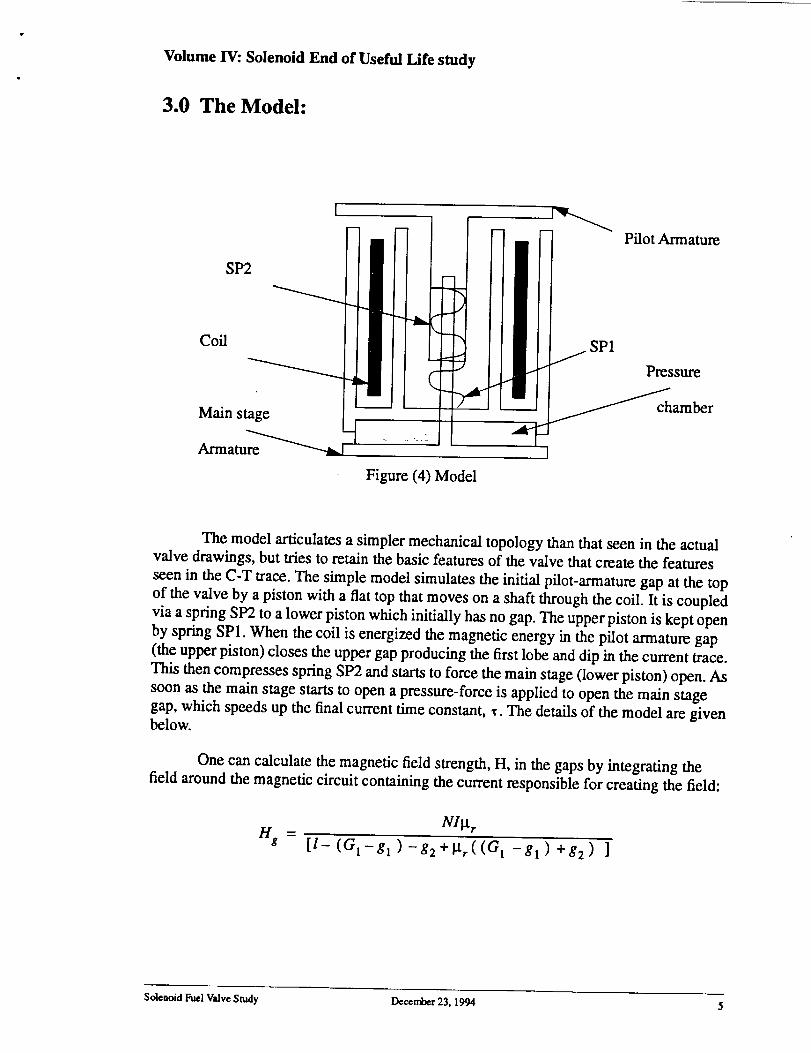
3.0 The Model:
Armaturi _Main s__._ _
i_ I1 pilot Armature
SP1
l_ Pressure
I
Figure (4) Model
The model articulates a simpler mechanical topology than that seen in the actual
valve drawings, but tries to retain the basic features of the valve that create the features
seen in the C-T trace. The simple model simulates the initial pilot-armature gap at the top
of the valve by a piston with a fiat top that moves on a shaft through the coil. It is coupled
via a spring SP2 to a lower piston which initially has no gap. The upper piston is kept open
by spring SP1. When the coil is energized the magnetic energy in the pilot armature gap
(the upper piston) closes the upper gap producing the first lobe and dip in the current trace.
This then compresses spring SP2 and starts to force the main stage (lower piston) open. As
soon as the main stage starts to open a pressure-force is applied to open the main stage
gap, which speeds up the final current time constant, _. The details of the model are given
below.
One can calculate the magnetic field strength, H, in the gaps by integrating the
field around the magnetic circuit containing the current responsible for creating the field:
Nll.t r
Hs = [l- (Gt-g I ) -g2+l.tr((Gl -gl ) +g2) ]
Solenoid Fuel Valve Study Decewber 23. 1994 5
w
Volume IV: Solenoid End of Useful Life study
where _, t2 axe the coordinates of the two tops representing the pilot armature and main
stage armatures respectively, and G1 is the pilot armature maximum gap opening. This is
shown in figure (4). The energies contained in the gaps due to the magnetic field are:
0Al
Vl _ tt° _ 2= H s dg
GII
A2 #72 . 2_
V2 = _toj o nsag
where A_, 2 is the surface area appropriate to contain the magnetic flux in the gap having
made the assumption that the fields in the gaps are uniform. The force associated with
changing the energy in the gap by changing the dimensions of the gap is r" = __._v.The
resulting equations of motion for the two position coordinates are:
2
_gl _ _toAl k2m _k,_tA k,_(gl_g2+go)_f_z_ _
Ot 2 2rap (I + _m (A + g2 ) ) 2 mp mt, mp
2
k frg2 _ _toA2 k2m ksp2 ) + p_t 2 2m m (1 + Zm (A + g2 ) ) 2 + (g 1 - g2 + go +m m m m (ce + g2 ) mm
where t2m== _trN'2: and t_, , % are constants which determine the initial force on the main
stage piston due to the fuel/oxidizer pressure and tn,(_.2 ) are the two spring constants. The
coordinates 8_.2 are the two piston displacements and a= G_ -gl , where G_ is the full gap
opening of the pilot armature, f,(1.2) are the frictional forces.
The inductance, as seen from the leads of the coil, can be written as
L = kmL"
[l+Xm(A+g 2) ]
SolenoidFuel ValveStudy Decen_r 23, 1994 6
Volume IV: Solenoid End of Useful Life study
where k,.,. = rt:t0N2a. A is the effective area of the magnetic circuit which links the coil
windings and is related to the gap areas. Finally the differential equation for the current in
terms of these parameters and relations is:
[l+_m(A+g2) ] L_-_ --_ -RI
L
These equations can be solved simultaneously for a self-consistent solution in the follow-
hag way:
2
bXl _ _ g t _X2 _gx aX3 _)I
bt Ot 2 i3-_ igt i3t Ot
2
3X 4 3g 2 3X s 3 gz
Ot Ot Ot Ot 2
The solution to these equations will give us the C-T trace for the model with all of the sup-
porting mechanics of the valve. We can then tune the model as a function of the various
mechanical parameters such as: the areas of the magnetic gaps a_._, the lengths of the
overall magnetic circuit 'T', the pressure constants %, kv, the spring constants st,_. 2, the
masses of the various armatures rap.,,, and the friction terms. We can using, a least squares
procedure, fit the model C-T trace to that of data taken on POV valves. Using a tuned
model will then allow us to vary critical parameters by a known amount and get statistical
information on the movement of features we can extract from the actual valve C-T charac-
teristic. These statistical results will allow us to make a quantitative assessment on thefunctional state of a valve under test.
4.0 The Fit
We were able to get test data from LESC, Kennedy, and White Sands. We selected
the White Sands POV current trace data to tune the model. The fit was performed using a
Simplex fitting program to step through iterations of a least squares function of the data
and model. We used the White Sands data because we were assured that pressure had been
applied to the main stage valve giving both pilot and main stage strokes the full range of
movement. In actual operation, in a rocket thruster, the POV valve requires a delta pres-
sure between the fuel inlet and outlet of 34psid - 53psid to open the main stage poppet.
The movement of the main stage poppet is reflected in the rise time between the pilot
induced current dip and the final current plateau of the CT trace. In all six parameters of
the model were varied to achieve a fit: the masses of the pilot and mainstage armatures,
my,.,; spring constants, k,po.2) ; the relative permeability of the armature/case material, ttr;
Solenoid Fuel Valve Study December 23, 1994 7
Volume IV: Solenoid End of Useful Life study
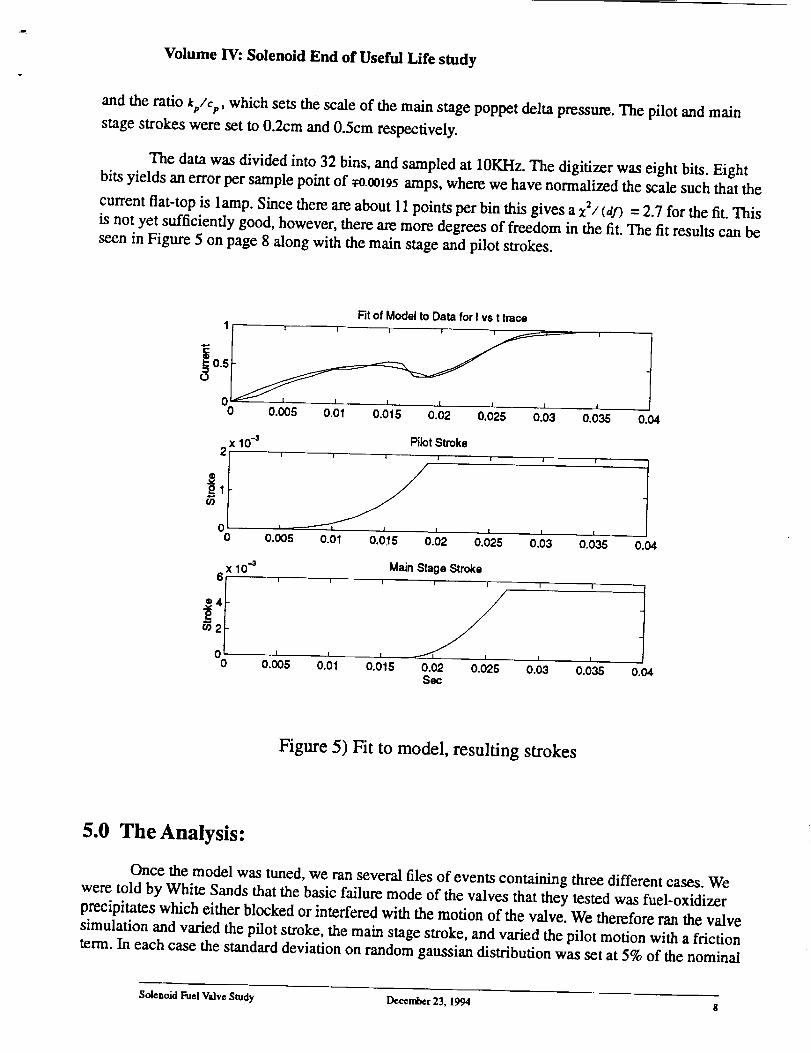
and the ratio k+,/c+,, which sets the scale of the main stage poppet delta pressure. The pilot and main
stage strokes were set to 0.2cm and 0.5cm respectively.
The data was divided into 32 bins, and sampled at 10KHz. The digitizer was eight bits. Eight
bits yields an error per sample point of +o.0ot95 amps, where we have normalized the scale such that the
current flat-top is lamp. Since there are about I1 points per bin this gives ax2/(af) = 2.7 for the fit. This
is not yet sufficiently good, however, there are more degrees of freedom in the fit. The fit results can be
seen in Figure 5 on page 8 along with the main stage and pilot strokes.
Fit of Mode! to Data for I vs t trace
0 I , I , 1 I I I
0 0.005 0.01 0.015 0.02 0.025 0.03|
0.035 0.04
x 104
+itO/
0
Pilot Stroke
i ! i i I I
i _ I I I
0.005 0.01 0.015 0.02 0.025 0.03I
0.O35 O.O4
x 10 46 t
+:l0 I i
0 0.005 0.01
Main Stage Strokei I I i 1'
I I
0.015 0.02 0.025 0.03 0.035Sec
0.04
Figure 5) Fit to model, resulting strokes
5.0 The Analysis:
Once the model was tuned, we ran several files of events containing three different cases. We
were told by White Sands that the basic failure mode of the valves that they tested was fuel-oxidizer
precipitates which either blocked or interfered with the motion of the valve. We therefore ran the valve
simulation and varied the pilot stroke, the main stage stroke, and varied the pilot motion with a friction
term. In each case the standard deviation on random gaussian distribution was set at 5% of the nominal
Solenoid Fuel Valve Study Decen/ber 23, 1994 8
Volume IV: Solenoid End of Useful Life study
value. In the case of the friction term, it was determined from the model that the nominal force corre-
sponding to the pilot armature acceleration is 2.1 Nts, thus the frictional force was varied so that 5%
of this value was varied on a gaussian distribution about a nominal of 0.2Nts. We ran 1500 events and
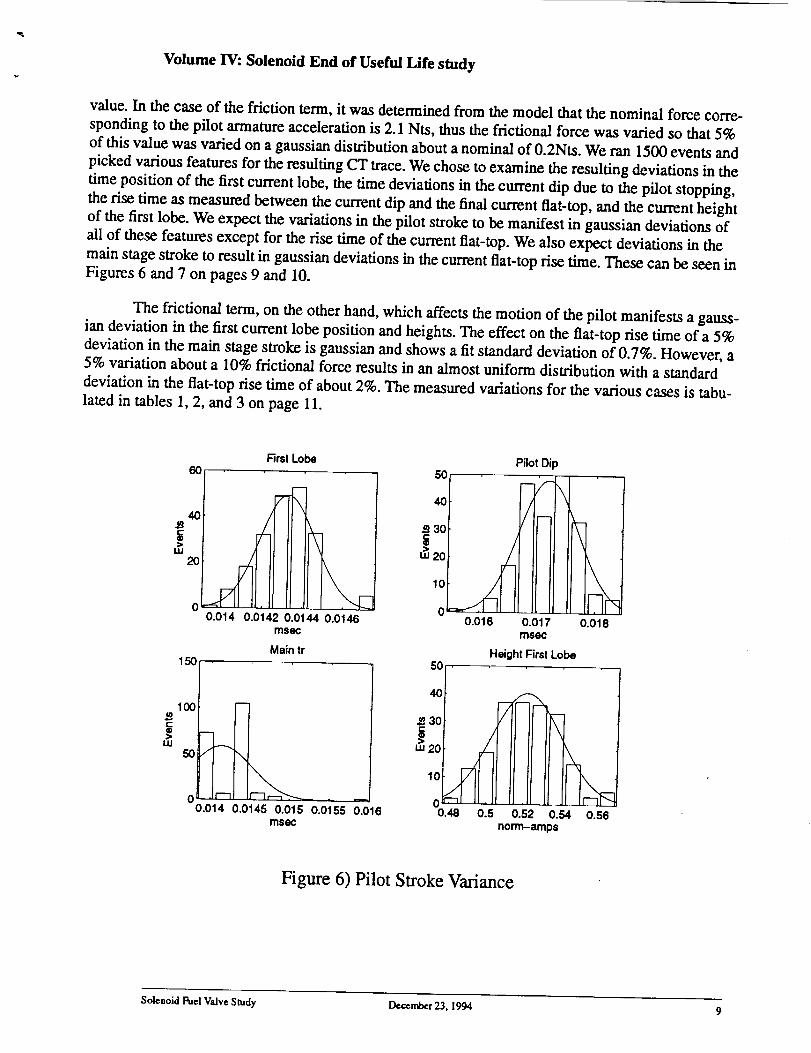
picked various features for the resulting CT trace. We chose to examine the resulting deviations in the
time position of the first current lobe, the time deviations in the current dip due to the pilot stopping,
the rise time as measured between the current dip and the final current flat-top, and the current height
of the first lobe. We expect the variations in the pilot stroke to be manifest in gaussian deviations of
all of these features except for the rise time of the current flat-top. We also expect deviations in the
main stage stroke to result in gaussian deviations in the current flat-top rise time. These can be seen in
Figures 6 and 7 on pages 9 and 10.
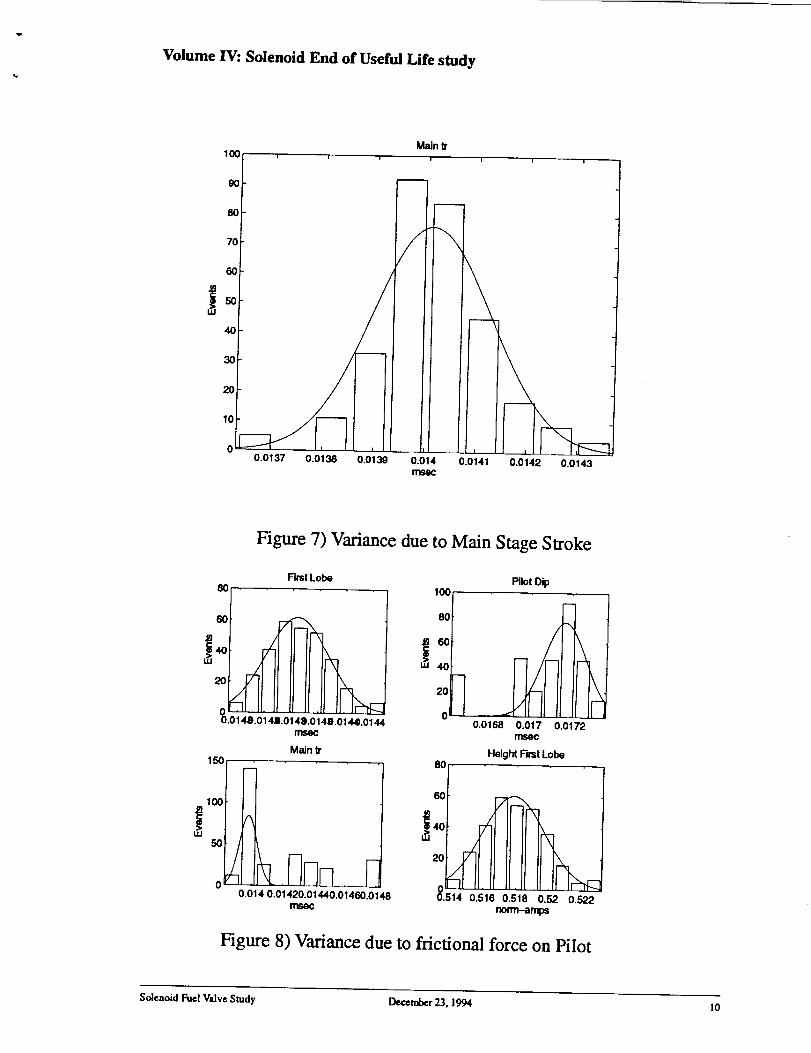
The frictional term, on the other hand, which affects the motion of the pilot manifests a gauss-
ian deviation in the first current lobe position and heights. The effect on the flat-top rise time of a 5%
deviation in the main stage stroke is gaussian and shows a fit standard deviation of 0.7%. However, a5% variation about a 10% frictional force results in an almost uniform distribution with a standard
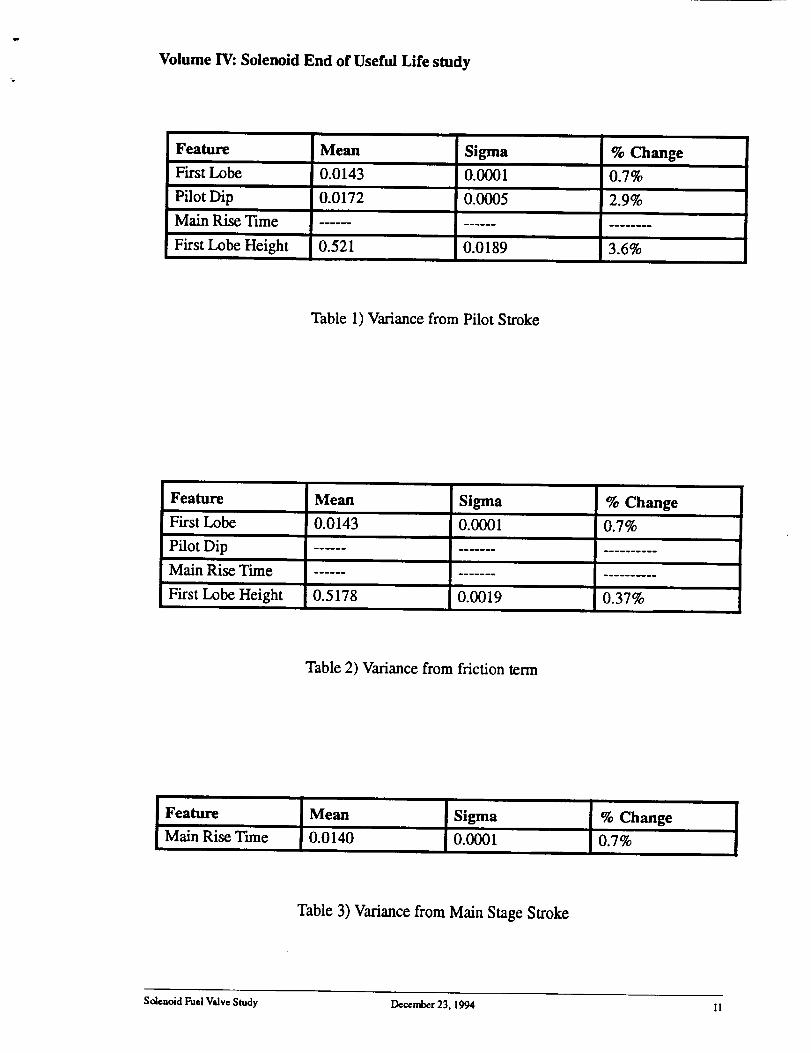
deviation in the flat-top rise time of about 2%. The measured variations for the various cases is tabu-
lated in tables 1, 2, and 3 on page 11.
60
40
20 _
m
r-
tll
First lobe
F
150
m
z-\
0.014 0.0142 0.0144 0.0146msec
Main tr
100
r\
0 .It-70.014 0.0145 0.015
msQc
.....
0.0155 0.016
_aol0
w 20_i
10
0
50
0.016
Pilot Dip
/-I
/,1I
0.017
Height First Lobe
,i t
IX 1I\ I
0.018
40
30
uJ20
10
?I
0 rImi il.0.48 0.5 0.52 0.54 0.56
non'n-amp$
Figure 6) Pilot Stroke Variance
Soleuoid Fuel Valve Study December 23. 1994 9
Volume IV: Solenoid End of Useful Life study
lO0
90
80
7o
6o
_5o40
3O
Main lr
2O
I0_-
0
/
/
0.0137 0.0138 0.013g
/
0.014 0.0141
_ ::::::::_0.0142 0.0143
,,>,
Hgure 7) Variance due to Main Stage Stroke
8O
J_6ot .....
40 ........
_' II II II I_q
0.0148,01441.014,9.014,B .0144.0144
Main Ir150
tO0
First Lobe Pilot Dip100.
5O
0.014 0.01420.01440.01460.0148
80- _.
| 60.40
o • • .-o.o1.,O.Ol,O.Ol,2msoc
Height Rrst Lobe80,
40 ¸,,>,
20 ,]1t.I1H.HII.Iftl
g.514 0.516 0.518 O.g2 0.522_-am_
Figure 8) Variance due to frictional force on Pilot
Solenoid Fuel Valve Study Decerrk)er 23, 1994 10
Volume IV: Solenoid End of Useful Life study
Feature
First Lobei
Pilot Dip
Main Rise Time
First Lobe Height
Mean
0.0143
0.0172
0.521
Sigmai
0.0001
0.0005
0.0189
% Change
0.7%
2.9%
I
3.6%I
Table 1) Variance from Pilot Stroke
Feature
First Lobe
Pilot Dip
Main Rise Time
First Lobe Height
Mean
0.0143
0.5178
Sigma
0.0001
I
0.0019
% Change
0.7%
0.37%
Table 2) Variance from friction term
Feature Mean Sigmai
Main Rise Tune 0.0140 0.0001
% Change
0.7%
Table 3) Variance from Main Stage Stroke
Solenoid Fuel Valve Study December 23, 1994 I 1
Volume IV: Solenoid End of Useful Life study
6.0 Conclusions:
We have shown that we can extract all of the information from a POV valve CT trace
necessary in determining its functional state in a noninirusive way. Typical deviations inthe four extracted features from nominal values tend to be smaller than the deviations that
caused them by from 20-85%. The conclusion we draw from this is that differences in
valves themselves due to manufacturing process may preclude an set of absolute nominal
feature values. In looking at data from several good valves we have seen deviations of the
order of those produced by 5% variations in the valve parameters that we have varied to
access sensitivity to various failure modes. However, these failure mode variations are
well defined and do offer a diagnostic handle. We can envision two different scenarios in
which this information might serve as the basis of an on line diagnostic. First, each valve
could be tested as par of its commissioning procedure and its nominal feature valves
recorded. Later variations could be established with respect to the specific nominal values
of that particular valve. A failure analysis could have been performed using statistics
based on deviations relative to valve specific norms. Second, if we can improve the
x_/(,tf) of our model fit, we could use the variations inx2/(,if) between fits made of model
parameters initially, at commissioning, and those made as an on-line diagnostic.
Acknowledgments: Thanks to Dave Aibel(Sanders), Debra Hurdelbrink (Houston),
Dal Van Orman (LSOC) for providing the data and useful discussions and information.
And to Bill Studack and Mat Stevens at White Sands for discussion of the Hall sensor
techniques and discussions of their failure mode results.
References:
1) Health Monitoring of Solenoid Operated Valves Progress Report, E.D.Blake
man, R.C.Kryter, Instrumentation and Controls Division, ORNL. May 23, 1994.
Solenoid Fuel Valve Study Decen_r 23, 1994 12
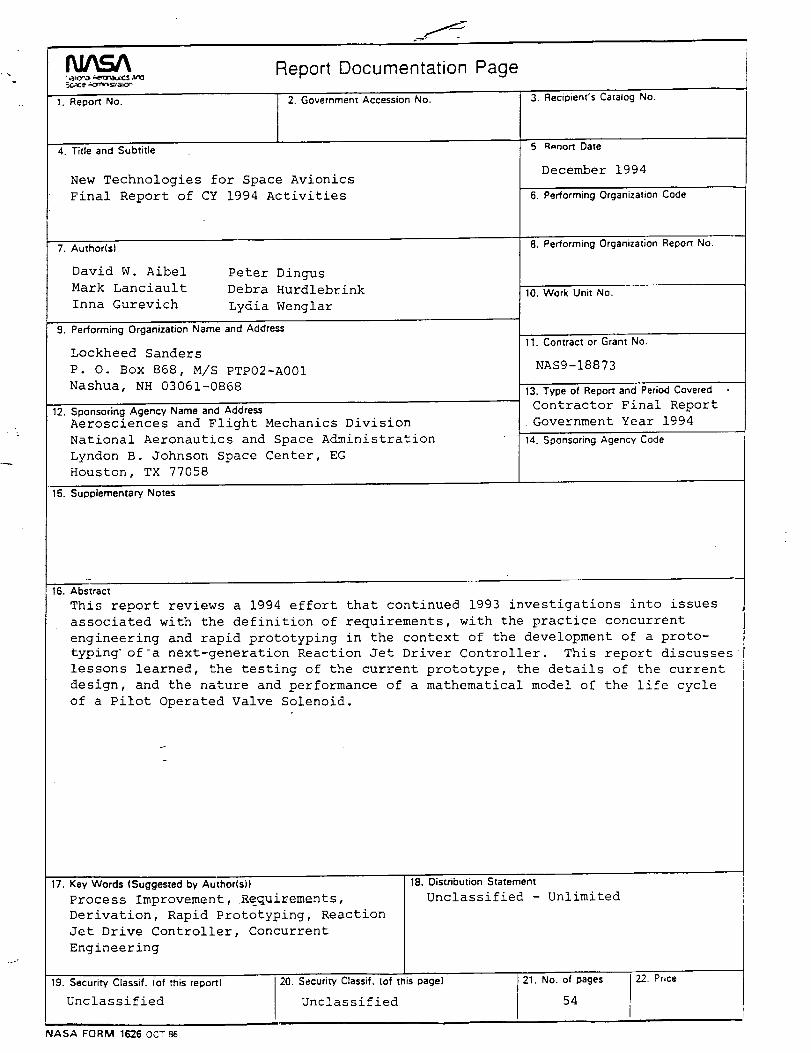
NASA5C,_C .a _tah07
Report Documentation Page
1. Report No.
4. Title and Subtitle
2. Government Accession No,
New Technologies for Space Avionics
Final Report of CY 1994 Activities
7. Author(s)
David W. Aibel
Mark Lanciault
Inna Gurevich
Peter Dingus
Debra Hurdlebrink
Lydia Wenglar
9. Performing OrganizaUonNameandAddre_
Lockheed Sanders
P. O. Box 868, M/S PTP02-A001
Nashua, NH 03061-0868
12. Sponsoring Agency Nameand Addm_Aerosciences and Flight Mechanics Division
National Aeronautics and Space Administration
Lyndon B. Johnson Space Center, EG
Houston, TX 77058
3. Recipient's Catalog No.
5 R_nort Date
December 1994
6. Performing Organization Code
8. Performing Organization Report No.
10. Work Unit No,
11. Contract or Grant No.
NAS9-18873
13. TypeofReportand PeriodCovered
Contractor Final Report
Government Year 1994
14. Sponsoring Agency Code
15. Supplementary Notes
16. Abstract
This report reviews a 1994 effort that continued 1993 investigations into issues
associated with the definition of requirements, with the practice concurrent
engineering and rapid prototyping in the context of the development of a proto-
typing'of-a next-generation Reaction Jet Driver Controller. This report discusses
lessons learned, the testing of the current prototype, the details of the current
design, and the nature and performance of a mathematical model of the life cycle