31
www.clientsuccess.org.nz National Construction Industry Performance Benchmarking
| Date post: | 04-Apr-2018 |
| Category: |
Documents |
| Upload: | hoangkhanh |
| View: | 242 times |
| Download: | 3 times |
www.clientsuccess.org.nz
National Construction IndustryPerformance Benchmarking
www.clientsuccess.org.nz
Agenda
CCG National Benchmarking Programme
Progress Briefing
Outcomes Reporting
Developing the KPIs

www.clientsuccess.org.nz
Our Vision
Vision
For the New Zealand construction industry to realise maximum value to all clients, end users and stakeholders and exceed their expectations through the consistent delivery of world-class products and services for the benefit of all New Zealanders.
www.clientsuccess.org.nz
Our Mission
Our Mission
The Construction Clients’ Group aims to deliver
improved industry performance resulting in a measurably better built environment.
www.clientsuccess.org.nz
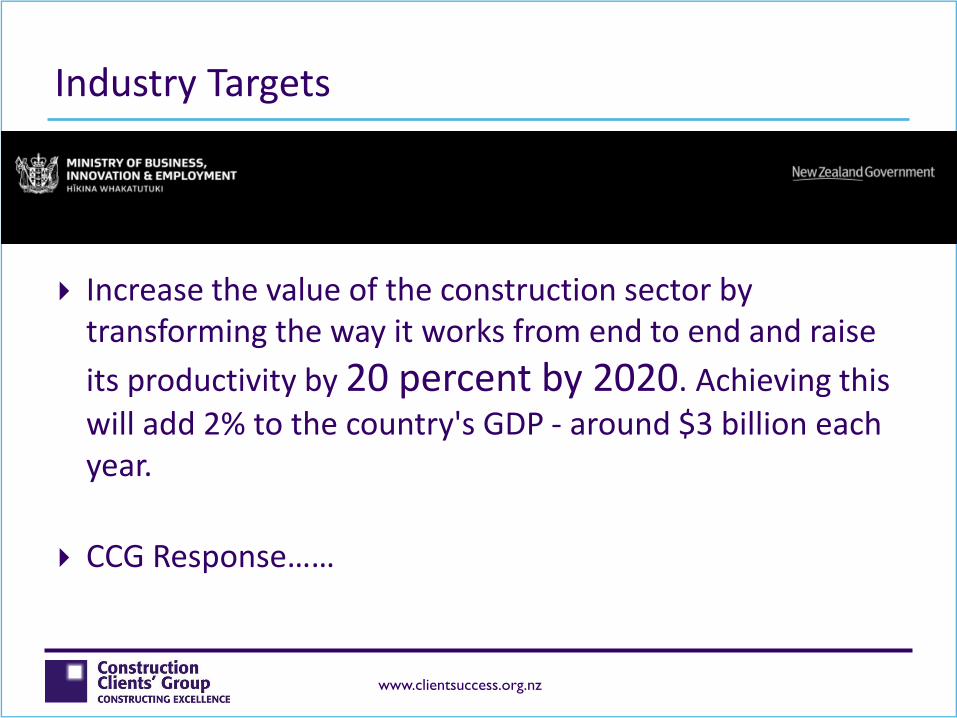
Industry Targets
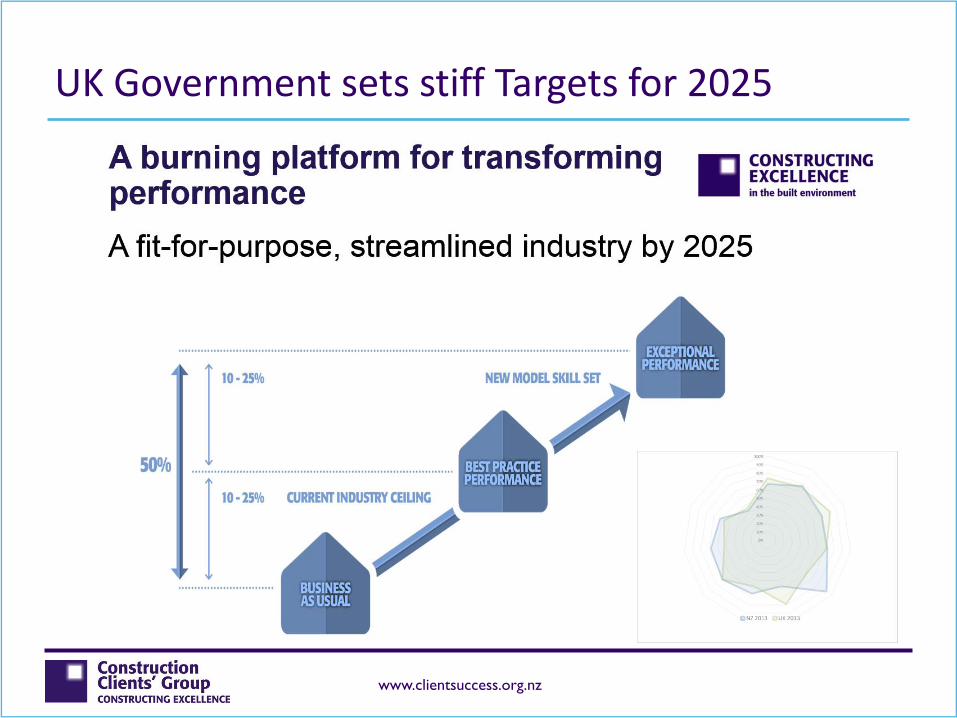
Increase the value of the construction sector by transforming the way it works from end to end and raise
its productivity by 20 percent by 2020. Achieving this
will add 2% to the country's GDP - around $3 billion each year.
CCG Response……
www.clientsuccess.org.nz
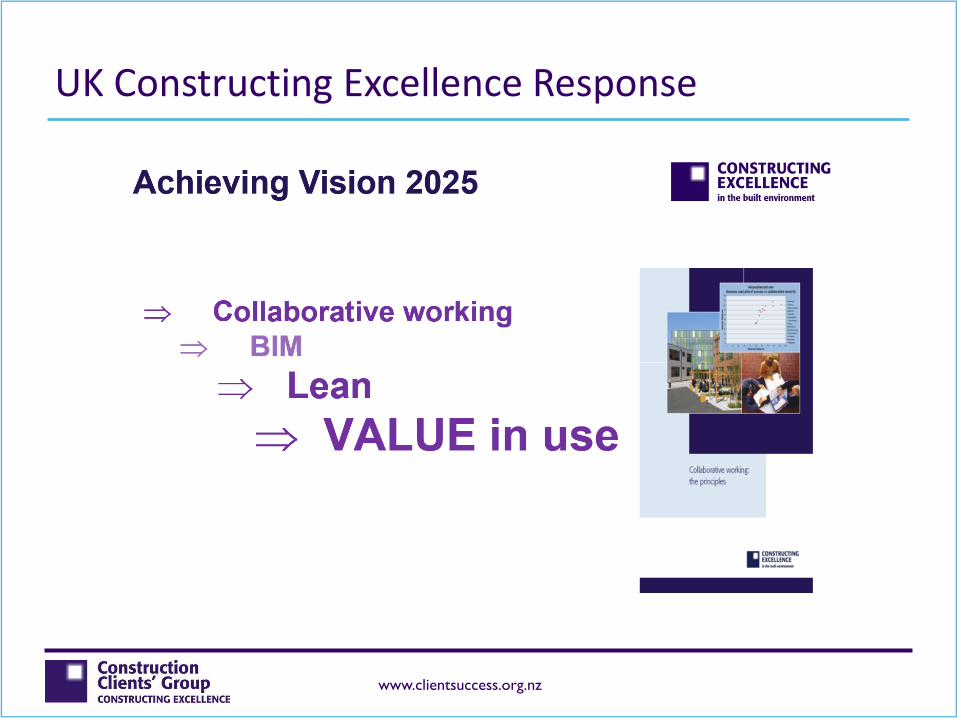
UK Government sets stiff Targets for 2025
www.clientsuccess.org.nz
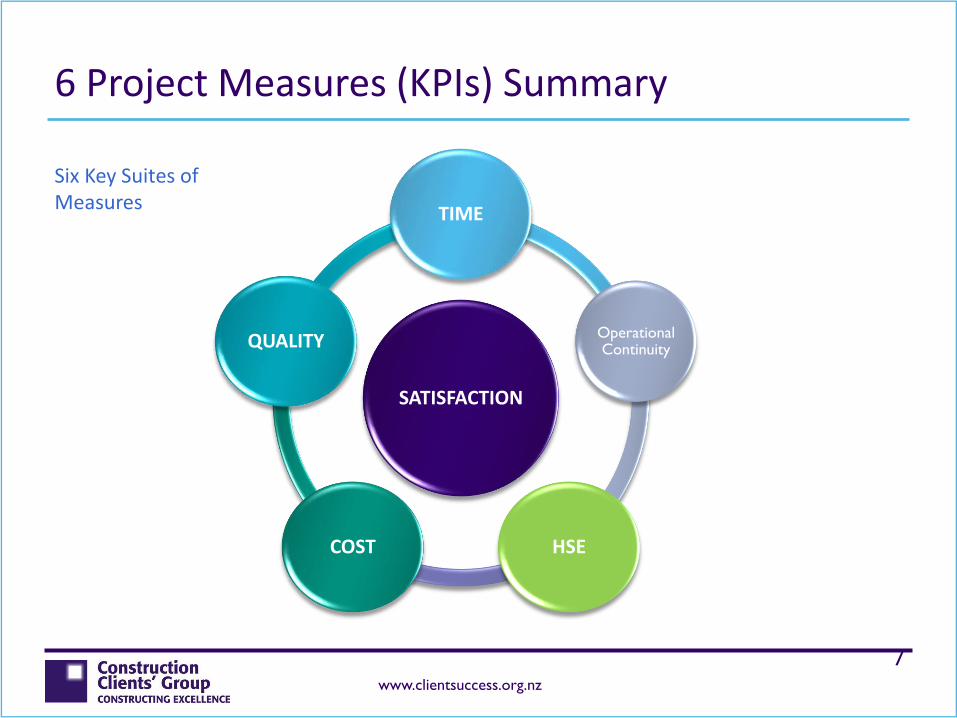
6 Project Measures (KPIs) Summary
SATISFACTION
TIME
Operational Continuity
HSECOST
QUALITY
7
Six Key Suites of Measures
www.clientsuccess.org.nz
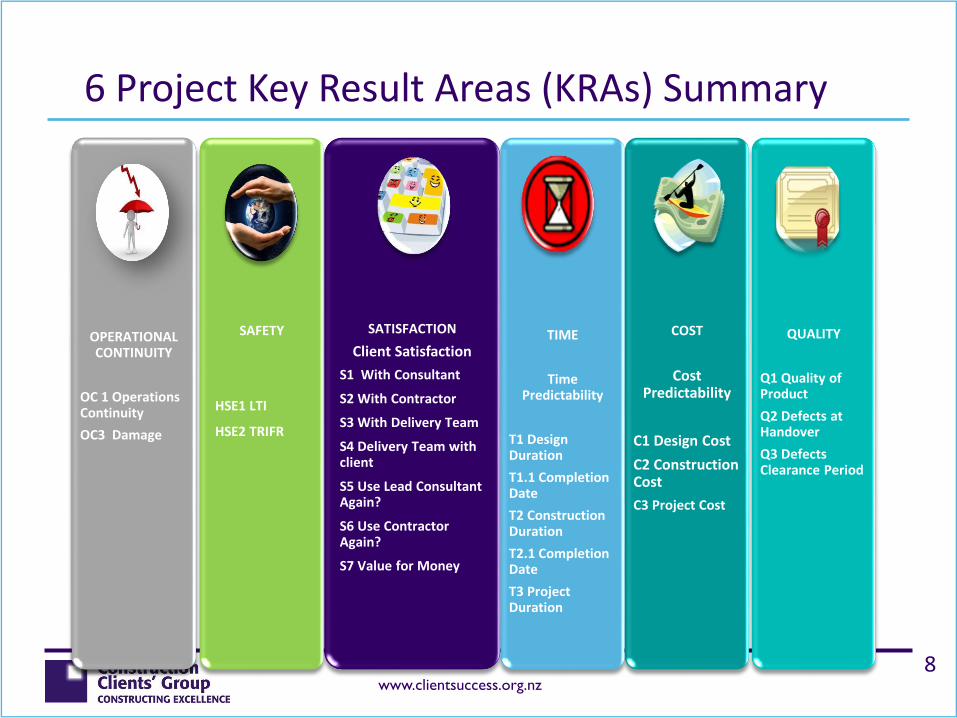
6 Project Key Result Areas (KRAs) Summary
SAFETY
HSE1 LTI
HSE2 TRIFR
COST
Cost Predictability
C1 Design Cost
C2 Construction Cost
C3 Project Cost
SATISFACTION
Client Satisfaction
S1 With Consultant
S2 With Contractor
S3 With Delivery Team
S4 Delivery Team with client
S5 Use Lead Consultant Again?
S6 Use Contractor Again?
S7 Value for Money
OPERATIONAL CONTINUITY
OC 1 Operations Continuity
OC3 Damage
TIME
Time Predictability
T1 Design Duration
T1.1 Completion Date
T2 Construction Duration
T2.1 Completion Date
T3 Project Duration
QUALITY
Q1 Quality of Product
Q2 Defects at Handover
Q3 Defects Clearance Period
8
www.clientsuccess.org.nz
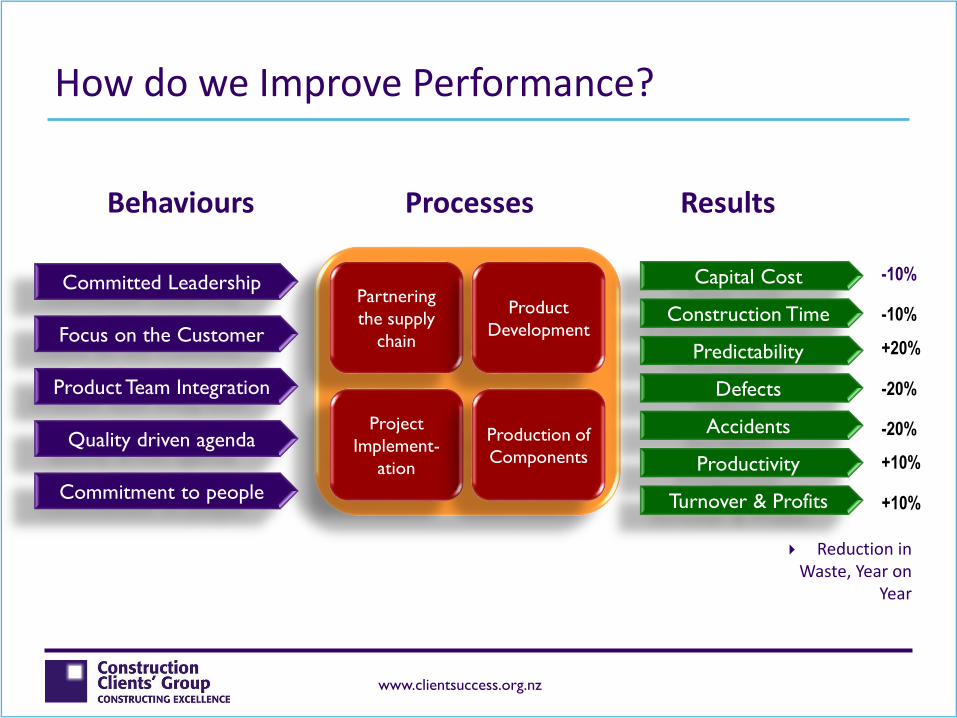
How do we Improve Performance?
Reduction in Waste, Year on
Year
-10%
-10%
+20%
-20%
-20%
+10%
+10%
Behaviours Processes Results
Committed Leadership
Focus on the Customer
Product Team Integration
Quality driven agenda
Commitment to people
Partnering
the supply
chain
Product
Development
Project
Implement-
ation
Production of
Components
Capital Cost
Construction Time
Predictability
Defects
Accidents
Productivity
Turnover & Profits
www.clientsuccess.org.nz
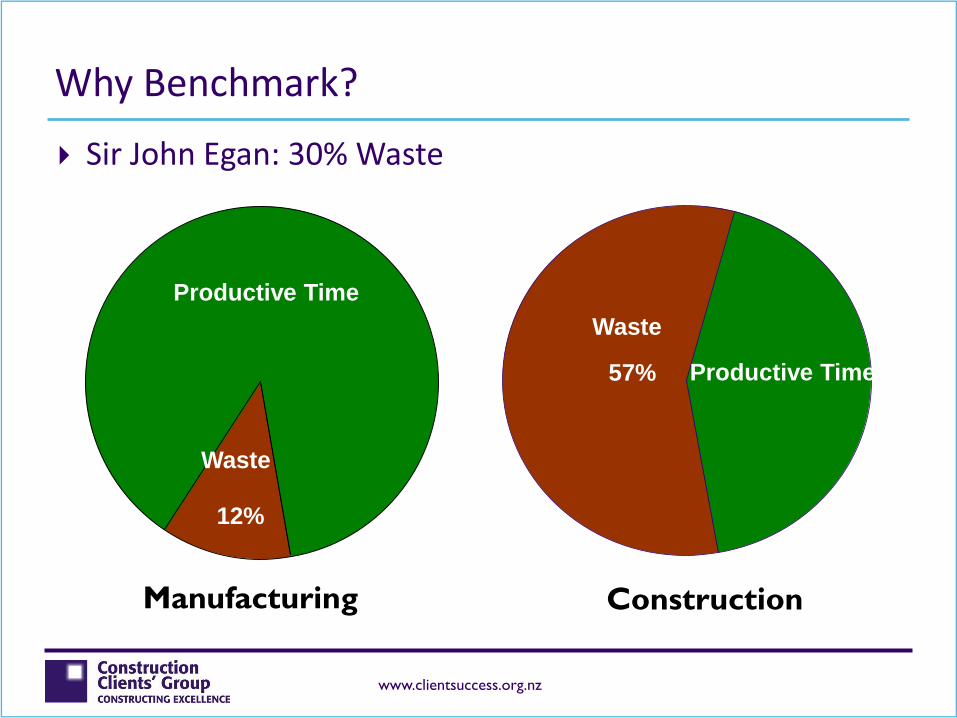
Why Benchmark?
Sir John Egan: 30% Waste
Manufacturing Construction
Productive Time
Waste
57%
Productive Time
Waste
12%
www.clientsuccess.org.nz
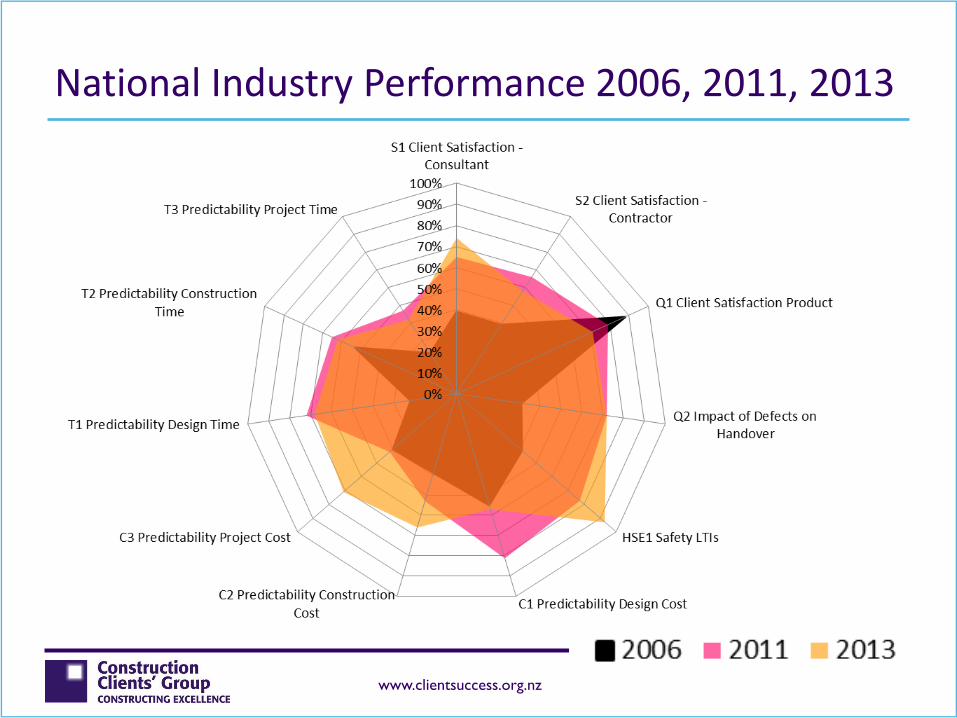
National Industry Performance 2006, 2011, 2013
www.clientsuccess.org.nz
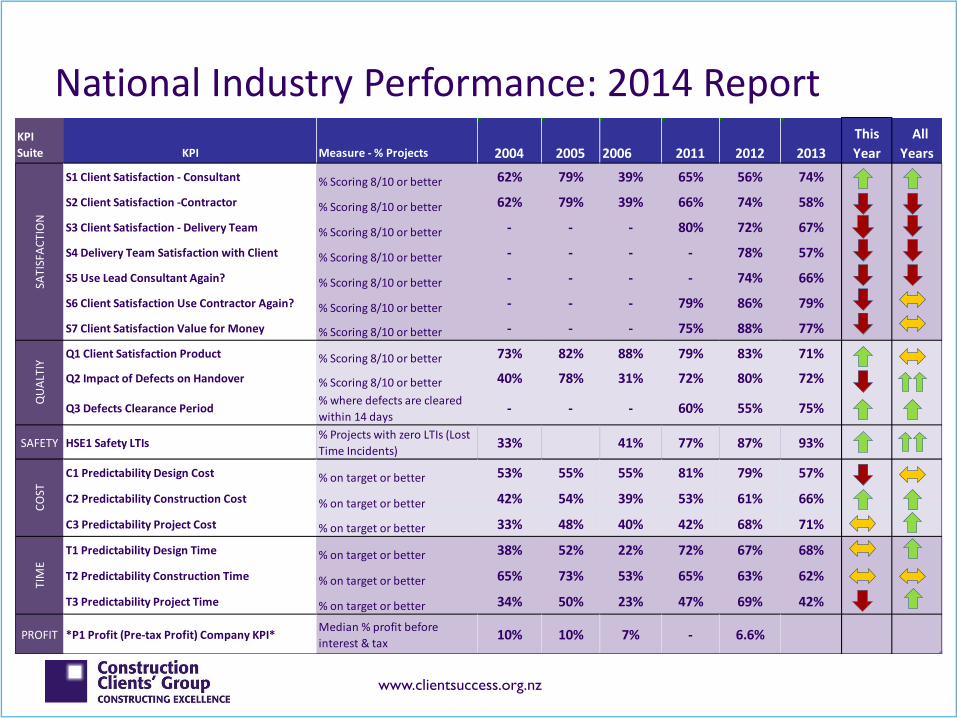
National Industry Performance: 2014 ReportKPI
Suite KPI Measure - % Projects 2004 2005 2006 2011 2012 2013
This
Year
All
Years
S1 Client Satisfaction - Consultant % Scoring 8/10 or better 62% 79% 39% 65% 56% 74%
S2 Client Satisfaction -Contractor % Scoring 8/10 or better 62% 79% 39% 66% 74% 58%
S3 Client Satisfaction - Delivery Team % Scoring 8/10 or better - - - 80% 72% 67%
S4 Delivery Team Satisfaction with Client % Scoring 8/10 or better - - - - 78% 57%
S5 Use Lead Consultant Again? % Scoring 8/10 or better - - - - 74% 66%
S6 Client Satisfaction Use Contractor Again? % Scoring 8/10 or better - - - 79% 86% 79%
S7 Client Satisfaction Value for Money % Scoring 8/10 or better - - - 75% 88% 77%
Q1 Client Satisfaction Product % Scoring 8/10 or better 73% 82% 88% 79% 83% 71%
Q2 Impact of Defects on Handover % Scoring 8/10 or better 40% 78% 31% 72% 80% 72%
Q3 Defects Clearance Period% where defects are cleared
within 14 days- - - 60% 55% 75%
SAFETY HSE1 Safety LTIs% Projects with zero LTIs (Lost
Time Incidents)33% 41% 77% 87% 93%
C1 Predictability Design Cost % on target or better 53% 55% 55% 81% 79% 57%
C2 Predictability Construction Cost % on target or better 42% 54% 39% 53% 61% 66%
C3 Predictability Project Cost % on target or better 33% 48% 40% 42% 68% 71%
T1 Predictability Design Time % on target or better 38% 52% 22% 72% 67% 68%
T2 Predictability Construction Time % on target or better 65% 73% 53% 65% 63% 62%
T3 Predictability Project Time % on target or better 34% 50% 23% 47% 69% 42%
PROFIT *P1 Profit (Pre-tax Profit) Company KPI*Median % profit before
interest & tax10% 10% 7% - 6.6%
SAT
ISFA
CT
ION
QU
ALT
IYC
OST
TIM
E
www.clientsuccess.org.nz
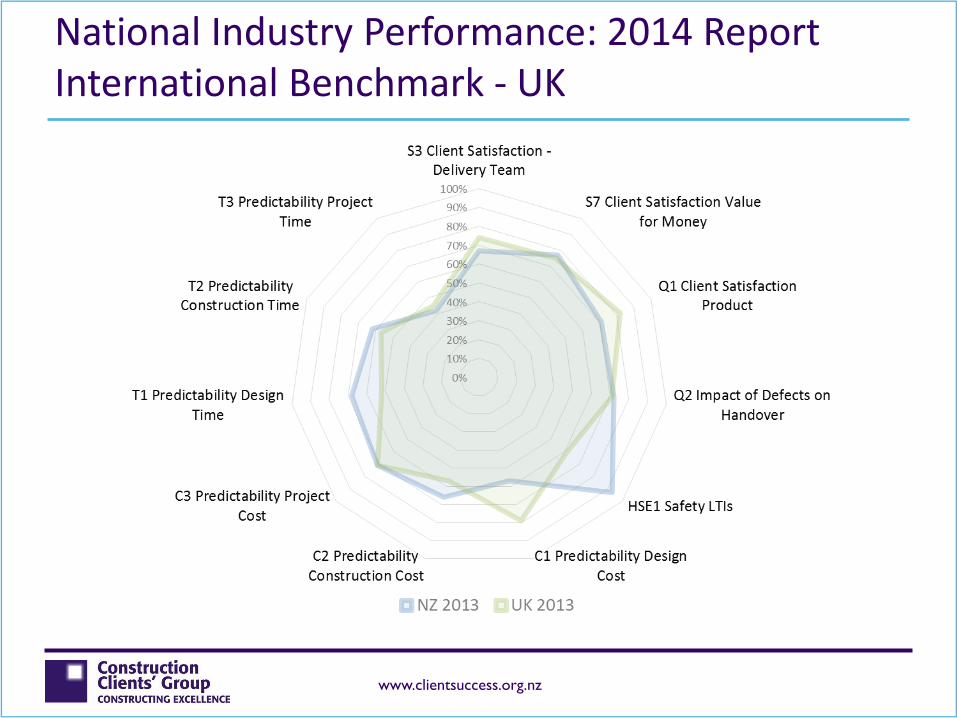
National Industry Performance: 2014 Report International Benchmark - UK
www.clientsuccess.org.nz
Why would you benchmark your performance?
Which one are you?
Do you know?
What’s your evidence?
www.clientsuccess.org.nz
Current Drivers
High Performance Client
Client of choice
Best tender prices
Demonstrate Value for Money
Ability to run Alternative Procurement
Best Value Supplier
Supplier of choice
Demonstrate Value for Money
Repeat business
Ability to negotiate on Alternative Procurement
www.clientsuccess.org.nz
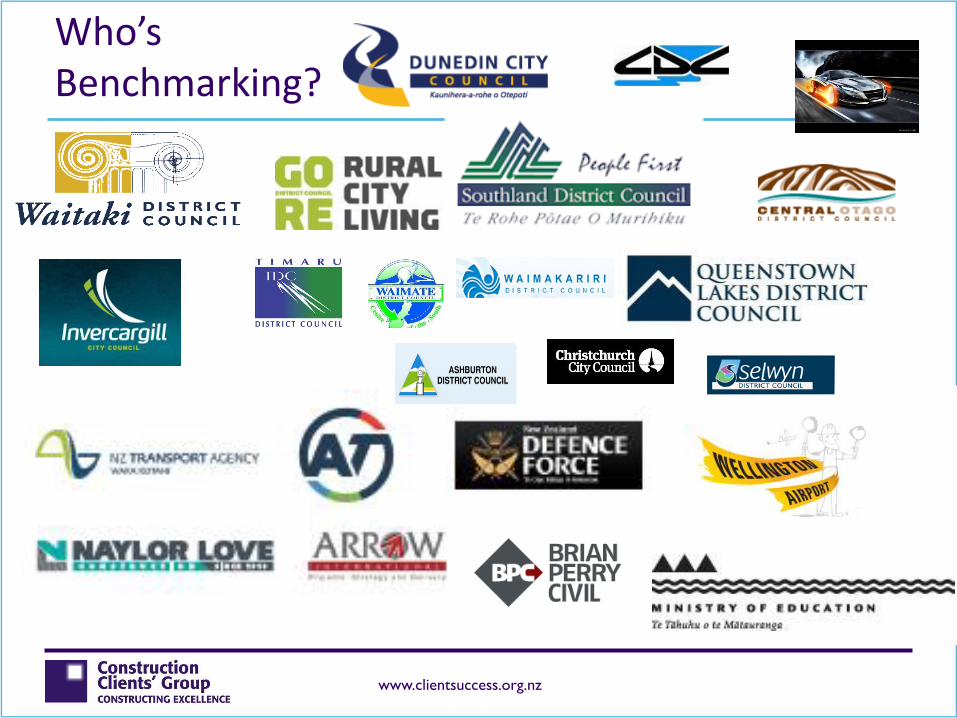
Who’s Benchmarking?
www.clientsuccess.org.nz
Call to Action
Provide project data
Projects completed in 2014
Join the CCG National Benchmarking Board
Launch 2016
Register interest now
Sponsor the programme
Start measuring your performance
www.clientsuccess.org.nz
UK Constructing Excellence Response
Benchmarking Industry Outcomes
Construction Clients’ Group, Wellington, September 2015
www.clientsuccess.org.nz
What are we all trying to achieve in the Built Environment?
www.clientsuccess.org.nz
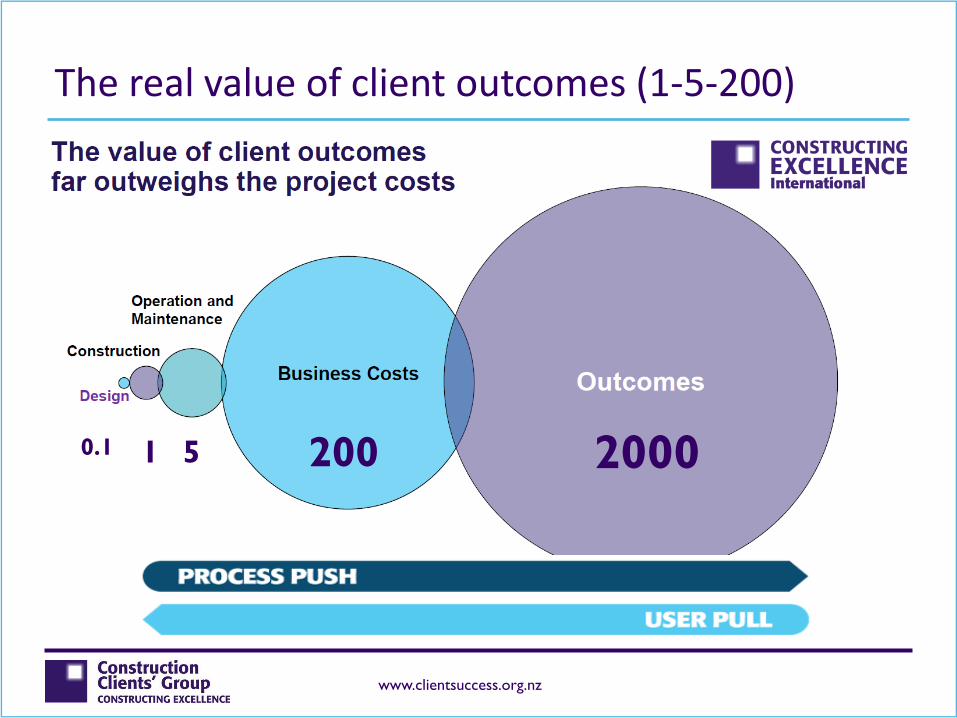
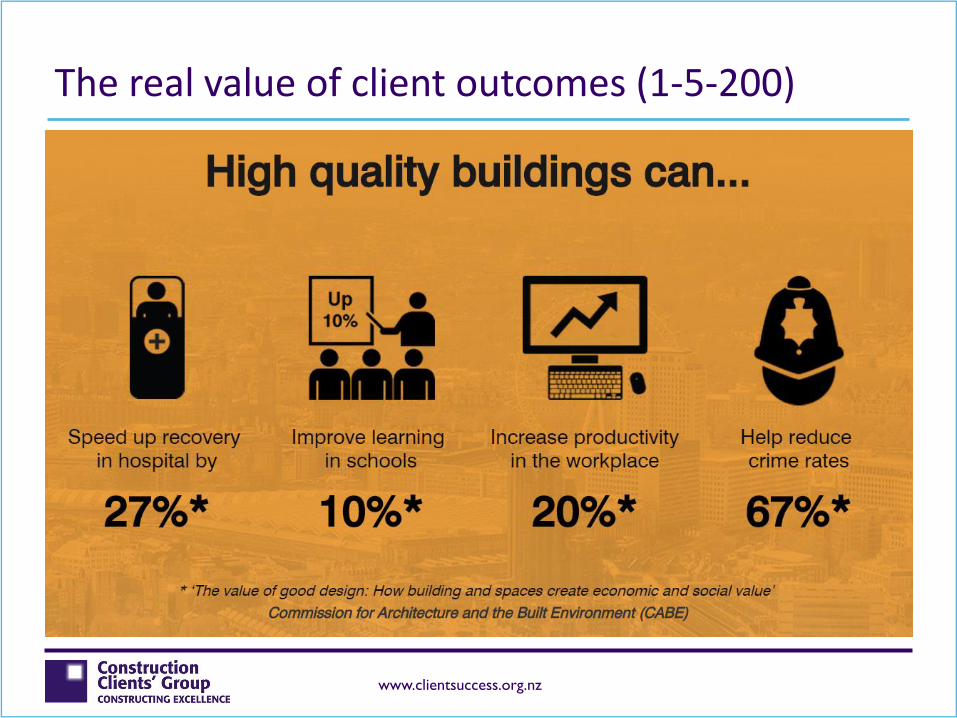
The real value of client outcomes (1-5-200)
1 5 200 20000.1
www.clientsuccess.org.nz
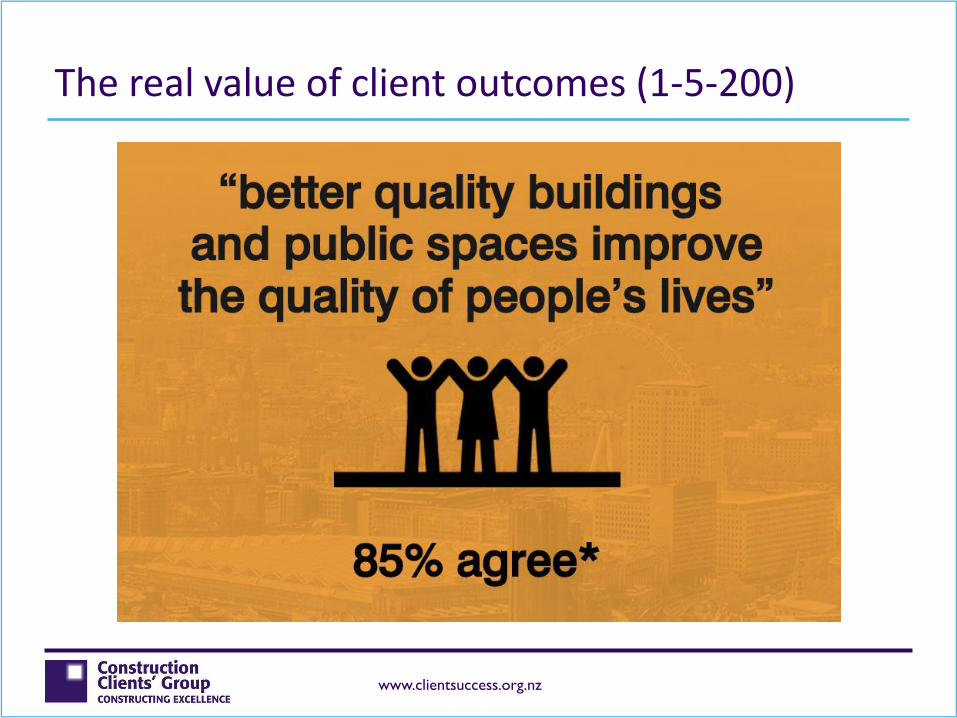
The real value of client outcomes (1-5-200)
www.clientsuccess.org.nz
The real value of client outcomes (1-5-200)
www.clientsuccess.org.nz
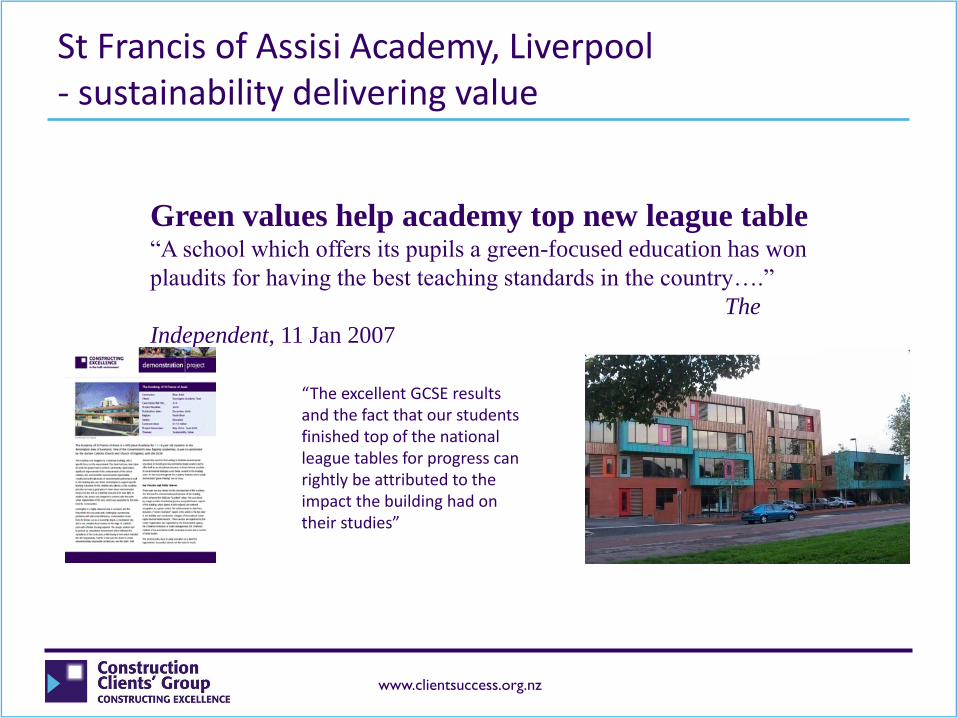
St Francis of Assisi Academy, Liverpool- sustainability delivering value
“The excellent GCSE results and the fact that our students finished top of the national league tables for progress can rightly be attributed to the impact the building had on their studies”
Green values help academy top new league table“A school which offers its pupils a green-focused education has won
plaudits for having the best teaching standards in the country….”
The
Independent, 11 Jan 2007
www.clientsuccess.org.nz
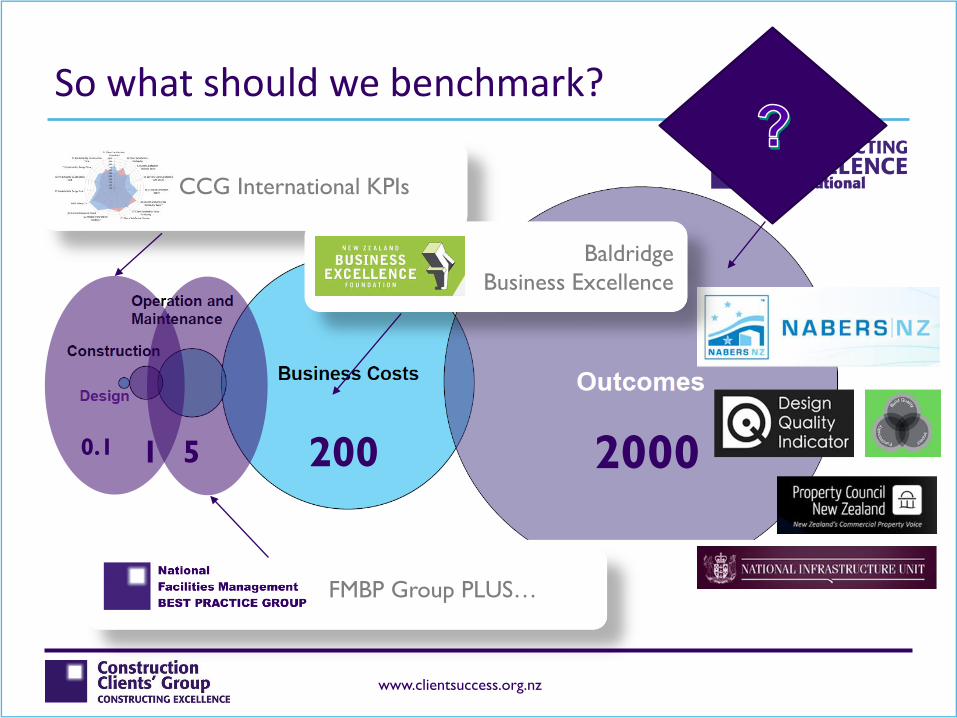
So what should we benchmark?
1 5 200 20000.1
CCG International KPIs
FMBP Group PLUS…
Baldridge
Business Excellence
www.clientsuccess.org.nz
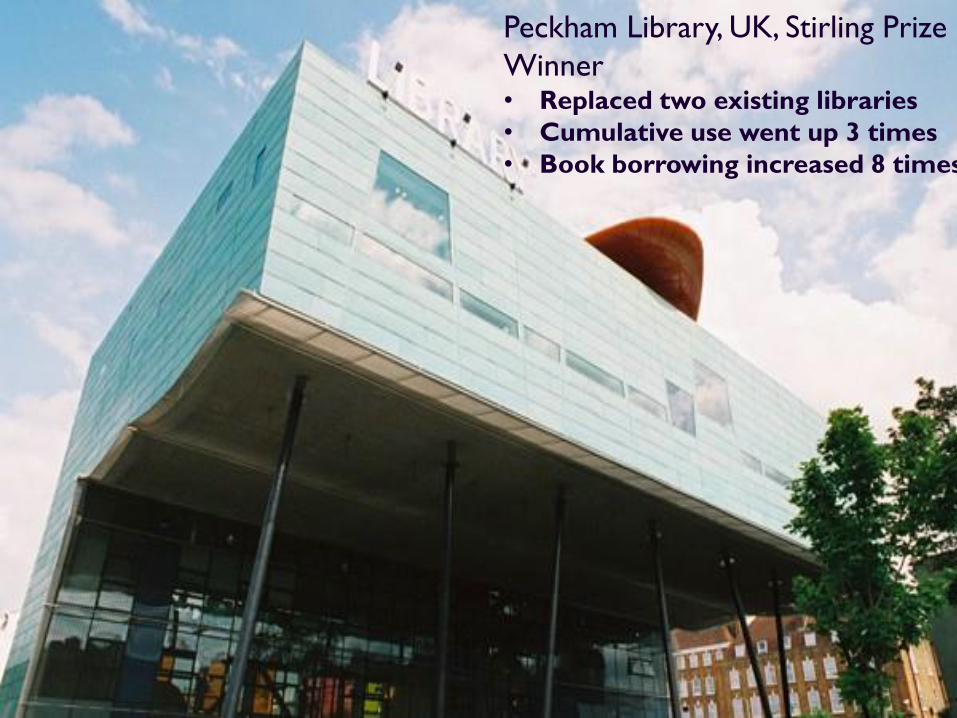
Peckham Library, UK, Stirling Prize
Winner • Replaced two existing libraries
• Cumulative use went up 3 times
• Book borrowing increased 8 times.
www.clientsuccess.org.nz
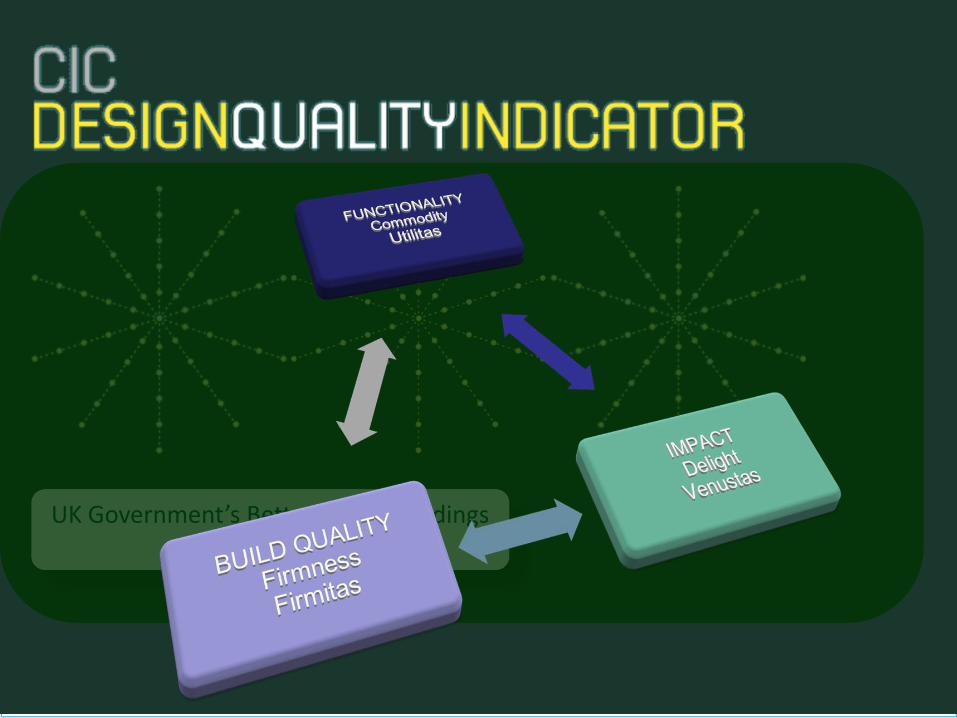
UK Government’s Better Public Buildings initiative
www.clientsuccess.org.nz
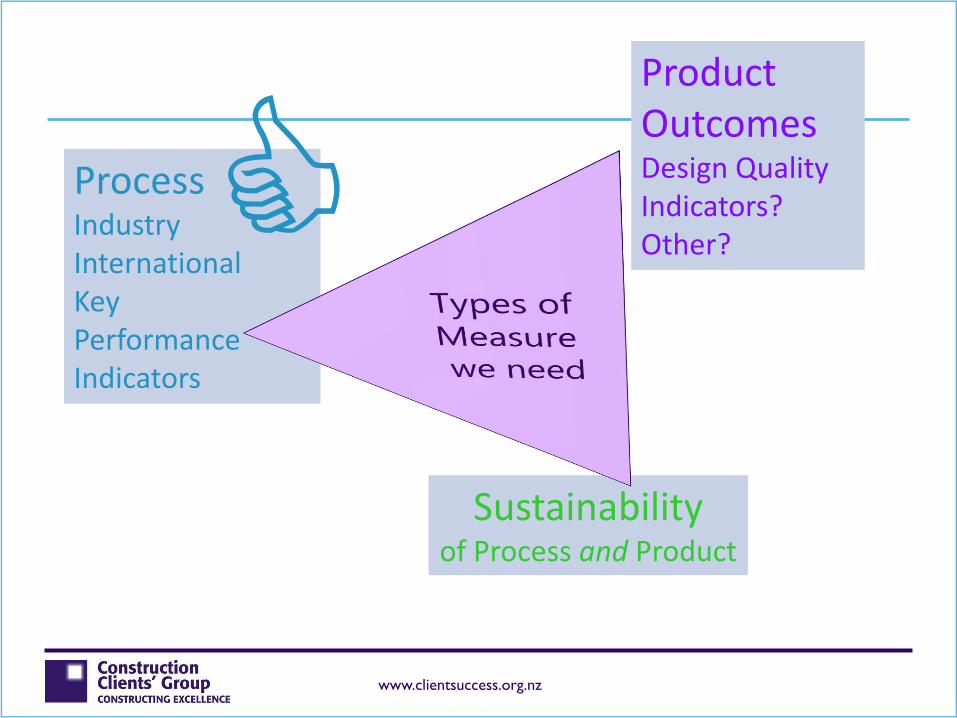
ProcessIndustry InternationalKeyPerformanceIndicators
Sustainabilityof Process and Product
Product OutcomesDesign QualityIndicators?Other?
www.clientsuccess.org.nz
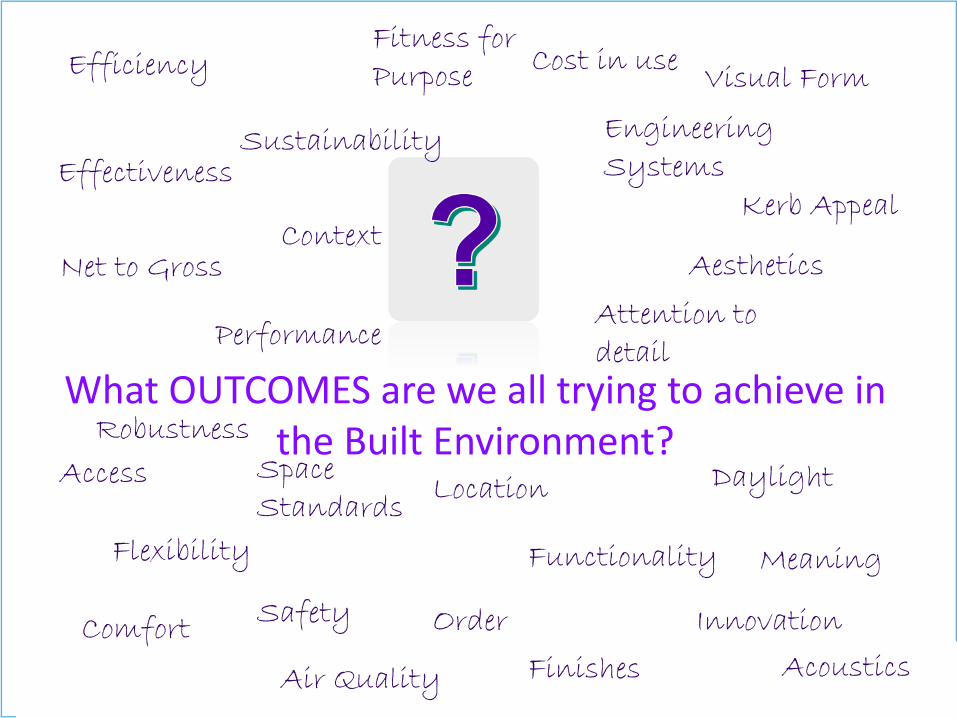
What OUTCOMES are we all trying to achieve in the Built Environment?
www.clientsuccess.org.nz
What OUTCOMES are we all trying to achieve in the Built Environment?
Efficiency
Effectiveness
Performance
Sustainability
Cost in use
Location
Engineering Systems
Functionality
Aesthetics
Kerb Appeal
Comfort
Flexibility
Safety
Access Space Standards
Daylight
Visual Form
Innovation
Fitness for Purpose
Context
Air Quality Acoustics
Order
Attention to detail
Finishes
Robustness
Net to Gross
Meaning
Thank You


