National Electric Rate Study Ranking of typical residential, commercial and industrial electric bills 2017 Study 1040 O Street, P.O. Box 80869 Lincoln, NE 68501-0869 p: 402.475.4211 www.les.com Lincoln Electric System
Transcript
National Electric Rate Study
Ranking of typical residential, commercial and industrial electric bills
2017 Study
1040 O Street, P.O. Box 80869 Lincoln, NE 68501-0869
The Lincoln Electric System National Rate Study is a comprehensive report of electric rates across the country. The purpose of the study is to provide a typical bill comparison for both LES and our customers, monitor and benchmark the affordability of electric bills, and serves as a complement to the Regional Electric Utility Bill Comparison.
In 2017, Lincoln ranked 16th nationally overall, decreasing three spots from 13th.
A large part of this change can be attributed to short-term rate decreases in the commercial and industrial sectors due to low natural gas prices, driven in large part by the mild 2016 – 2017 winter. A number of utilities employ fuel-related charges and riders that can change quarterly or annually based on the cost of fuel. These riders serve as pass-through charges that go directly to the customer’s bill. LES employs a rate stabilization fund to manage these short-term fuel price fluctuations rather than using an adjustable fuel rider.
In the residential sector, Lincoln’s rank improved three spots from 13th to 10th
lowest.
Fact Summary:
• The National Electric Rate Study ranks residential, commercial and industrial electric rates of 100 cities across the nation. (1= Lowest Bill, 100 = Highest Bill)
• Rates used are those
approved to be in effect January 1, 2017, including seasonal differences.
• Lincoln Electric System (LES) bills are calculated with rates that went into effect
January 1, 2017 and include surcharges and other non-sales tax charges (if known).
• Bills for investor-owned utilities were collected from Edison Electric Institute’s
2017 Typical Winter Bills report. Bills for municipal/public power utilities were calculated using each respective utility’s published rate tariffs. Average bills are calculated using rates from a 12-month period to include seasonal rates. All bill data applies to one month of service.
LES
2017 National Rate Study Summary
2017 National Rate Study Summary
• Lincoln ranks 16th overall, 10th in residential and 17th in commercial and industrial combined. LES ranks in the top ten in 6 of 12 categories. Lincoln was 13th overall last year.
• Overall, there are more electric rate increases (52 percent) than decreases
(44 percent). Of the public power utilities, 63 percent reported increases, and 17 percent reported decreases. Of the investor-owned utilities, 49 percent reported increases, and 51 percent reported decreases.
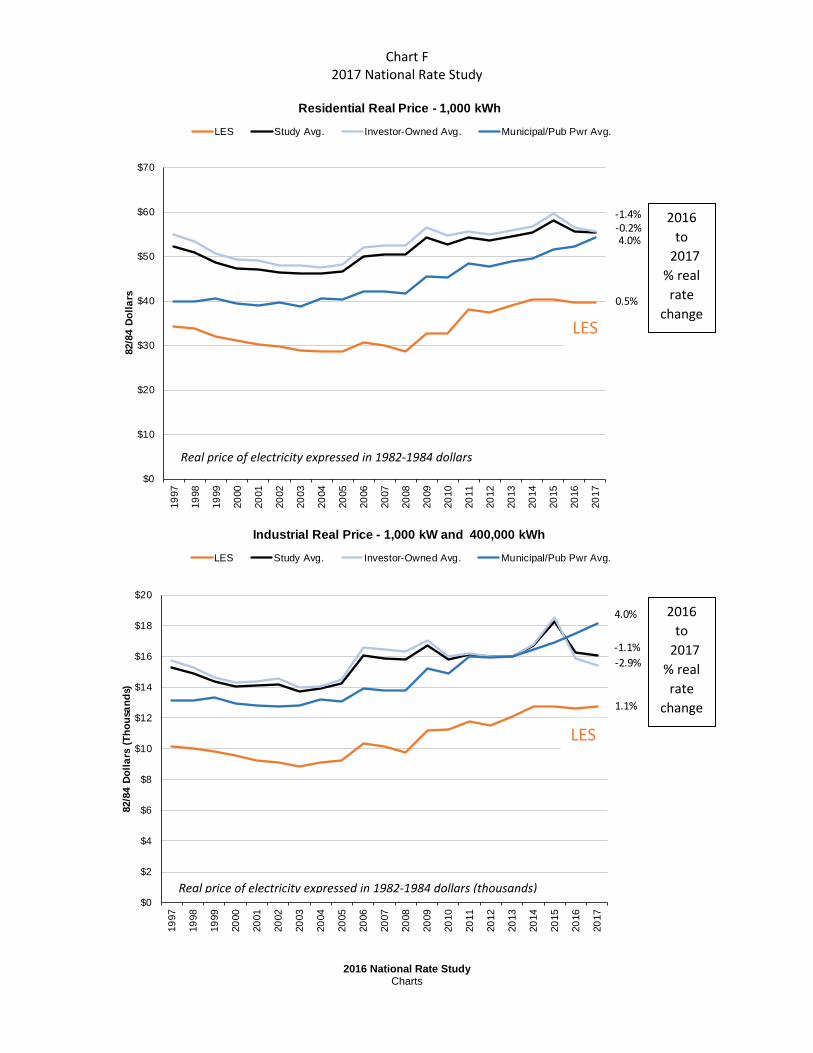
• Looking at the real price of electricity (rates after adjustment for inflation),
Lincoln’s real price decreased by -0.7 percent.
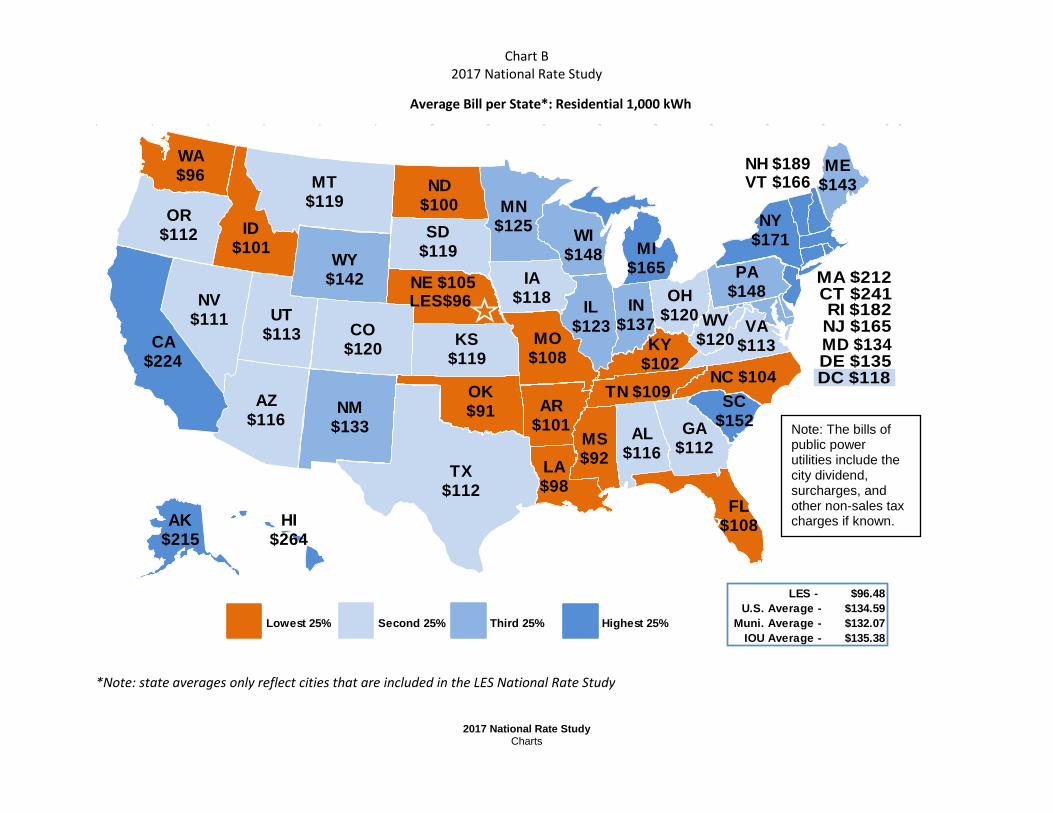
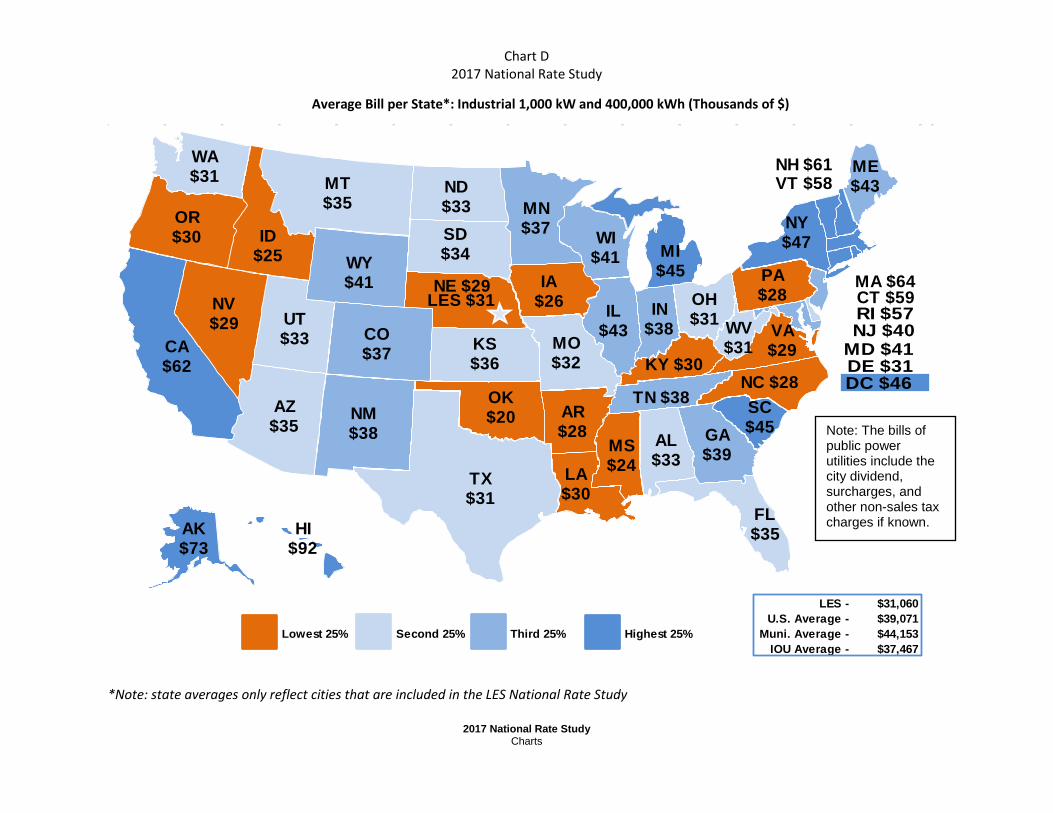
• LES residential customers using 1,000 kWh pay $96.48, which is 28 percent less than the study average of $134.59, while LES industrial customers using 1,000 kW and 400,000 kWh pay $31,060, 21 percent less than the study average of $39,071.
• Regionally, LES’ annual bills are the second lowest. Only Des Moines, ranked
6th lowest nationally, has a lower regional ranking than Lincoln. The region includes the following eight cities:
• Colorado Springs, Colorado • Des Moines, Iowa • Kansas City, Kansas • Wichita, Kansas • Minneapolis, Minnesota • Kansas City, Missouri • Lincoln, Nebraska • Omaha, Nebraska
2017 National Rate Study Contents
2017 National Rate Study Contents
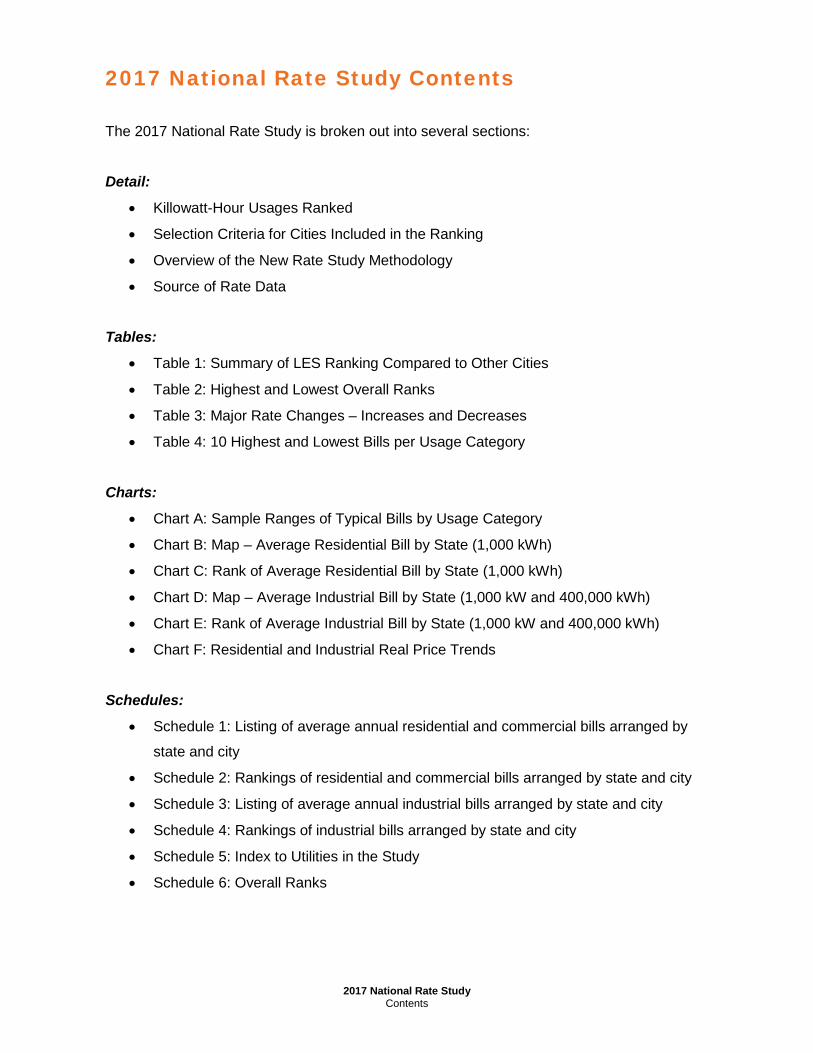
The 2017 National Rate Study is broken out into several sections:
Detail:
• Killowatt-Hour Usages Ranked
• Selection Criteria for Cities Included in the Ranking
• Overview of the New Rate Study Methodology
• Source of Rate Data
Tables:
• Table 1: Summary of LES Ranking Compared to Other Cities
• Table 2: Highest and Lowest Overall Ranks
• Table 3: Major Rate Changes – Increases and Decreases
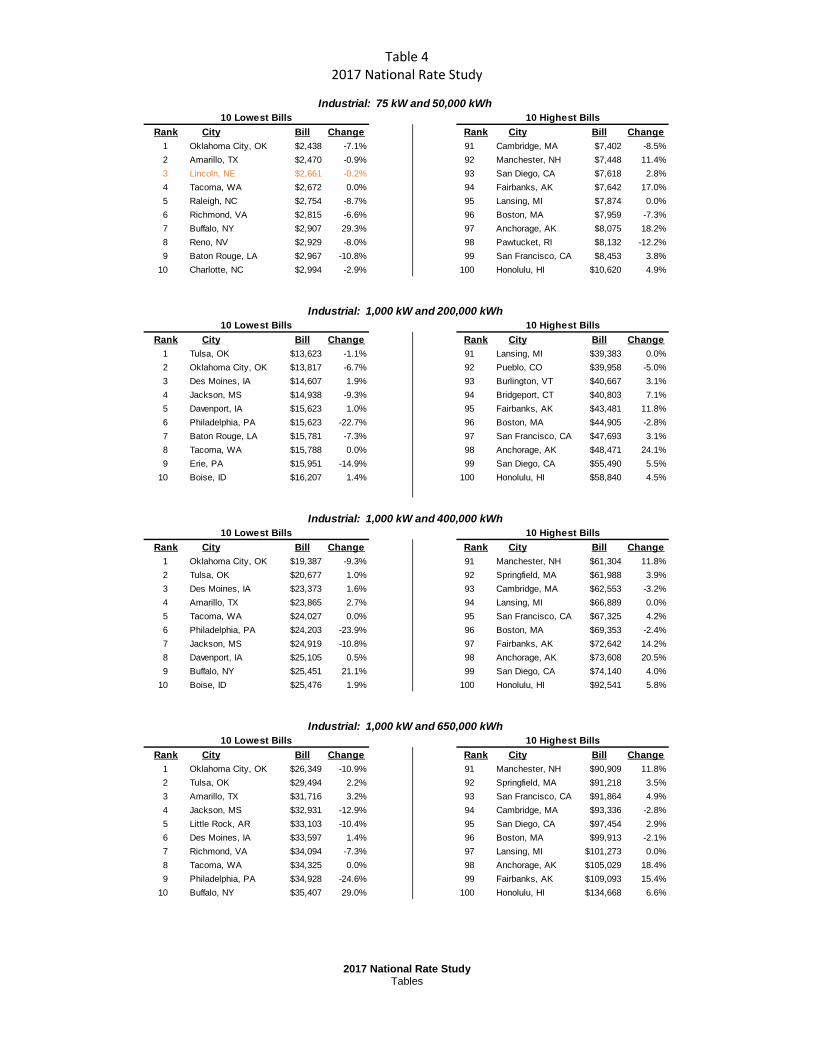
• Table 4: 10 Highest and Lowest Bills per Usage Category
Charts:
• Chart A: Sample Ranges of Typical Bills by Usage Category
• Chart B: Map – Average Residential Bill by State (1,000 kWh)
• Chart C: Rank of Average Residential Bill by State (1,000 kWh)
• Chart D: Map – Average Industrial Bill by State (1,000 kW and 400,000 kWh)
• Chart E: Rank of Average Industrial Bill by State (1,000 kW and 400,000 kWh)
• Chart F: Residential and Industrial Real Price Trends
Schedules:
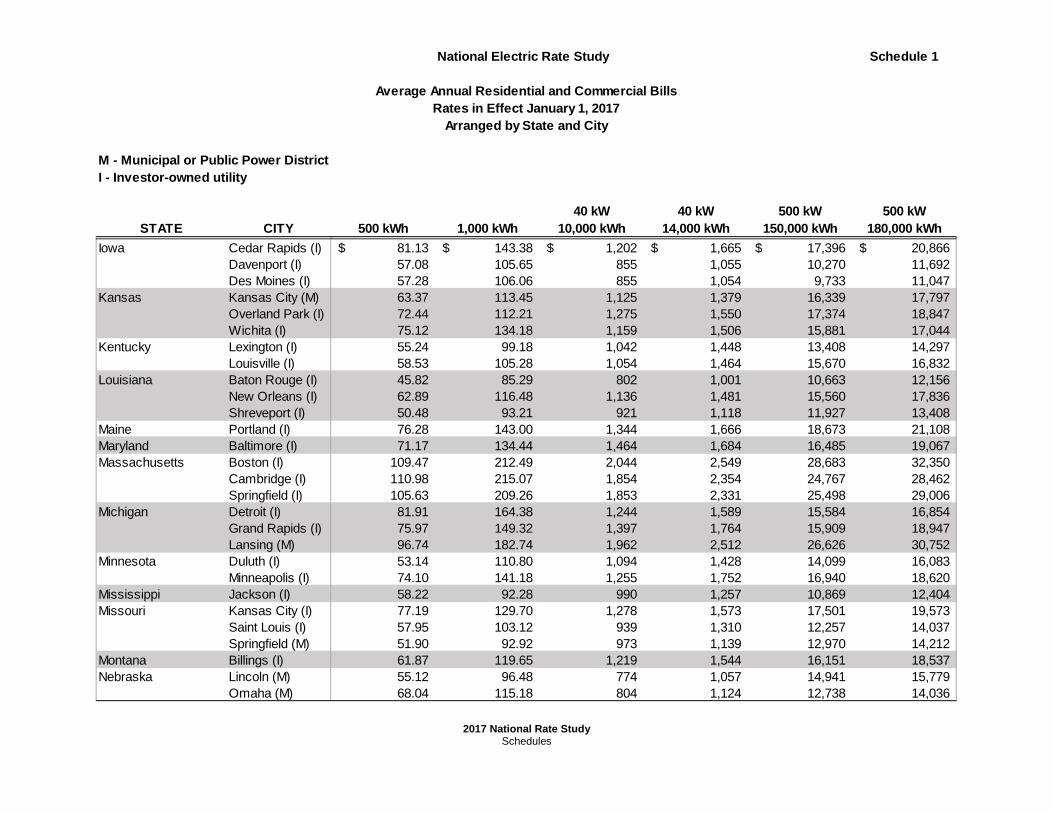
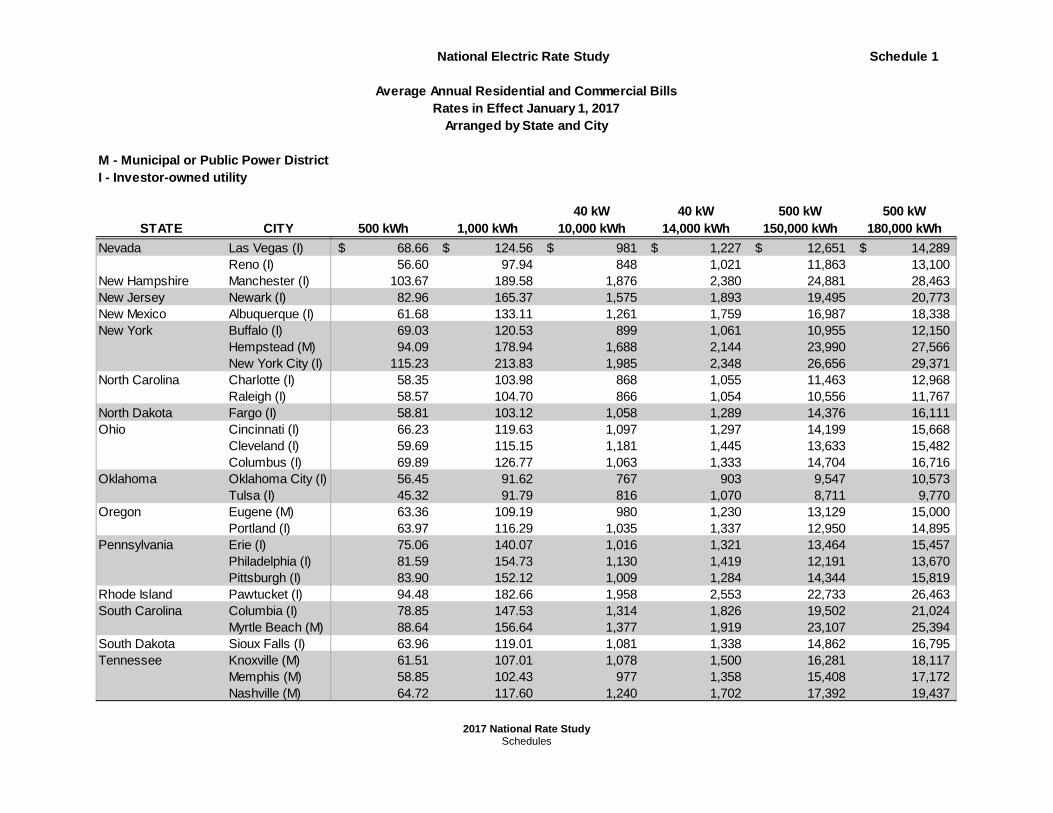
• Schedule 1: Listing of average annual residential and commercial bills arranged by
state and city
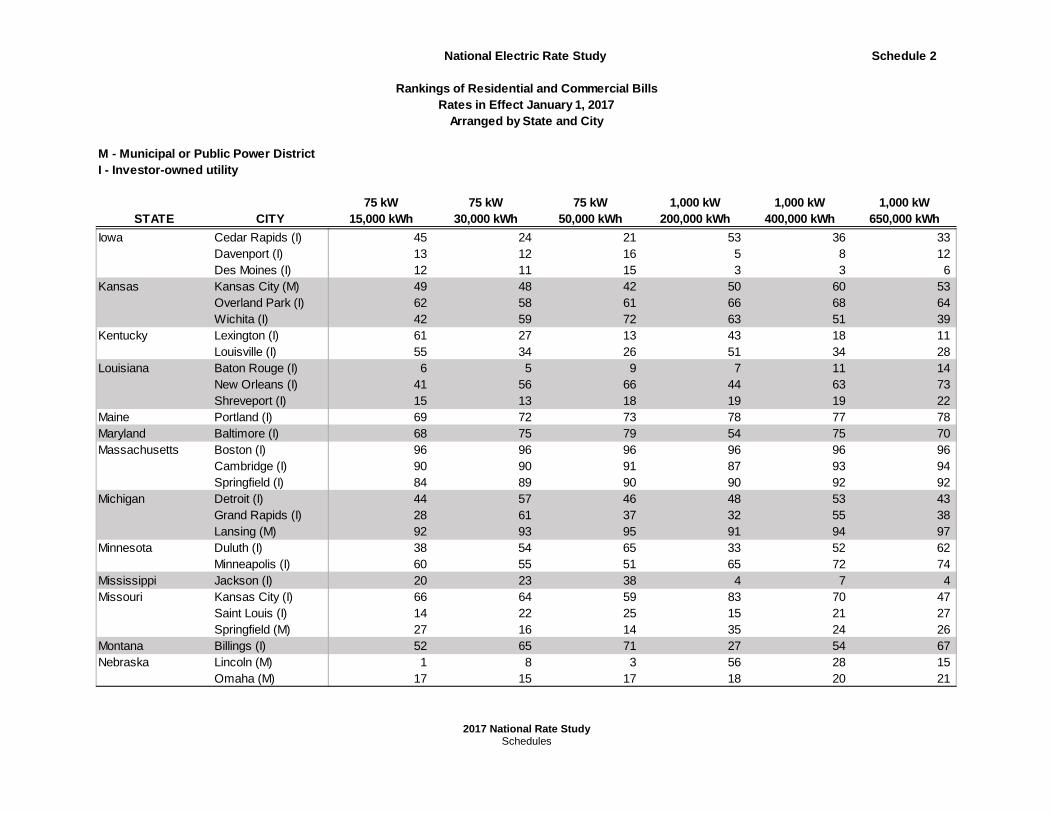
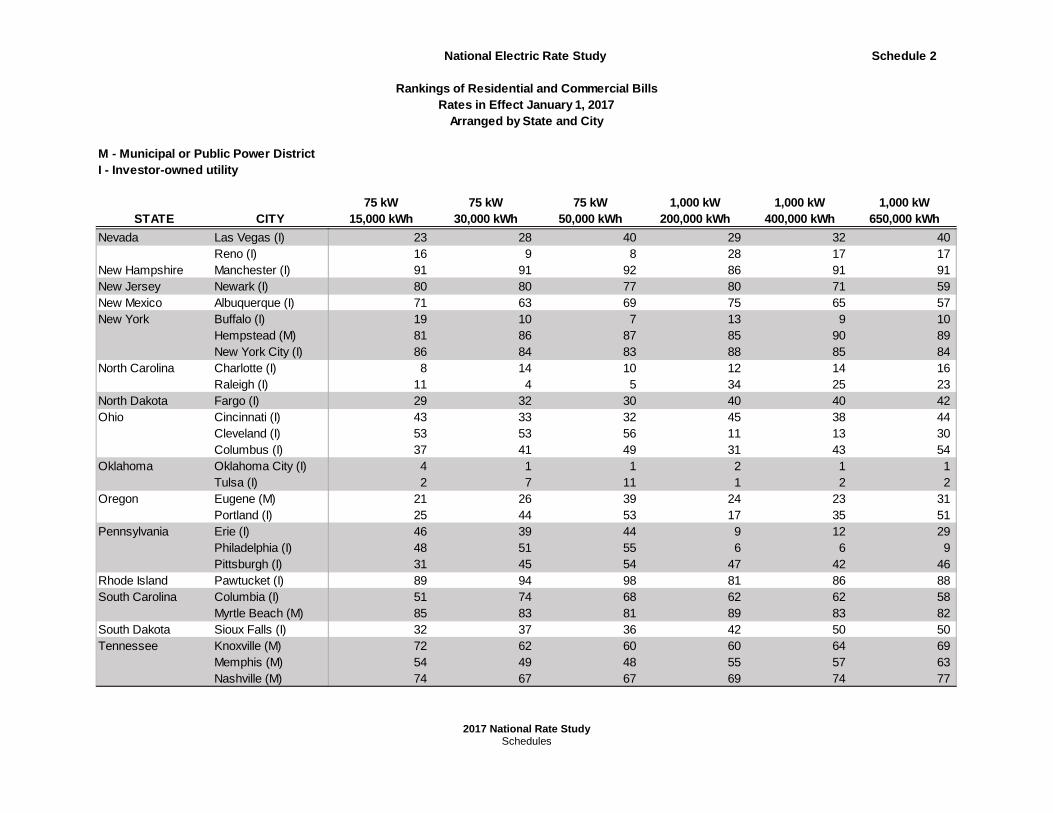
• Schedule 2: Rankings of residential and commercial bills arranged by state and city
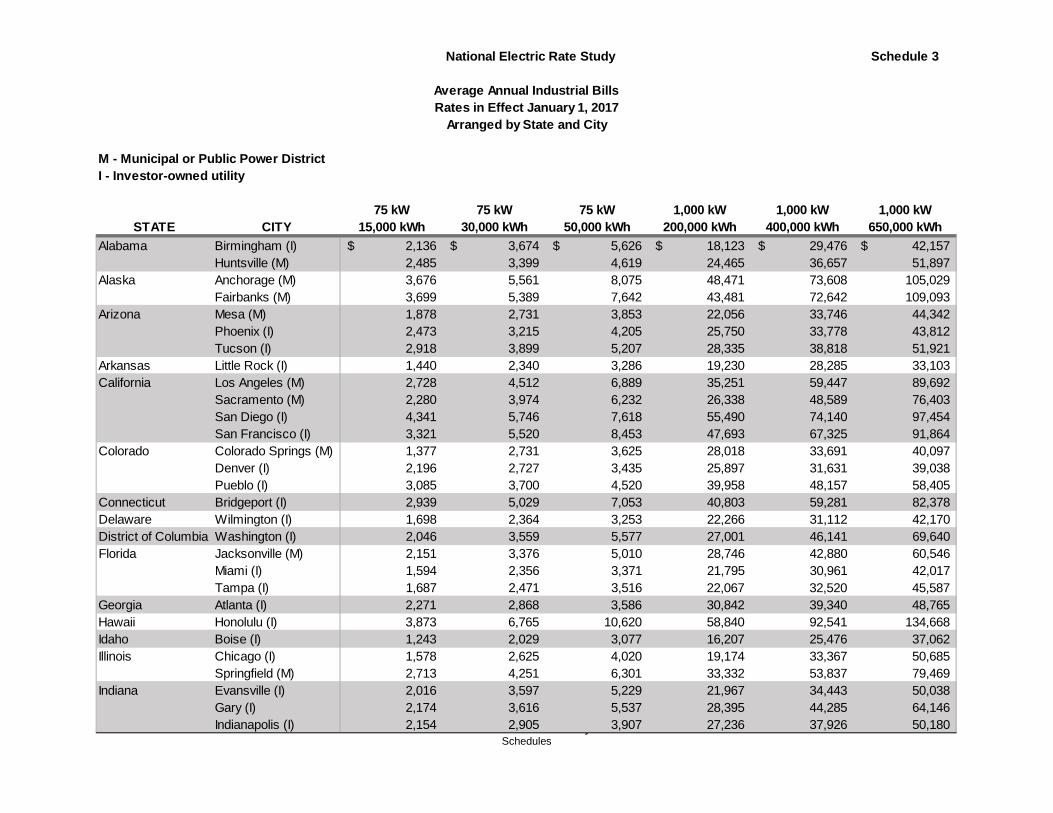
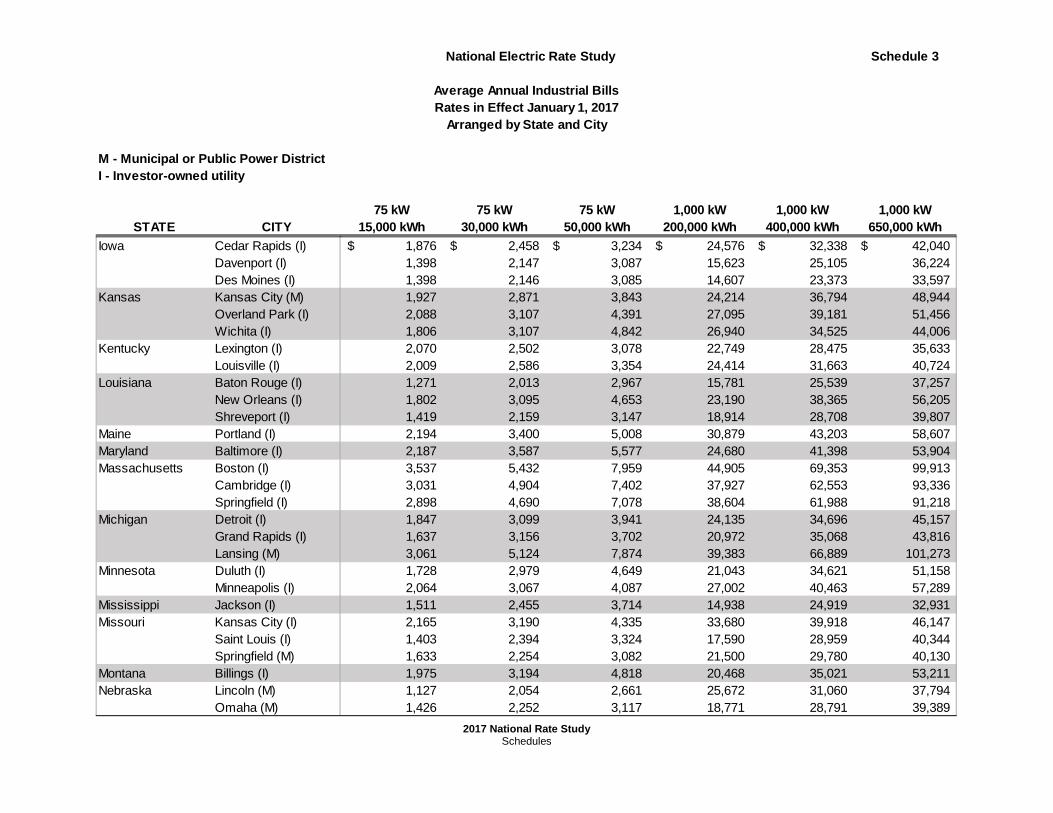
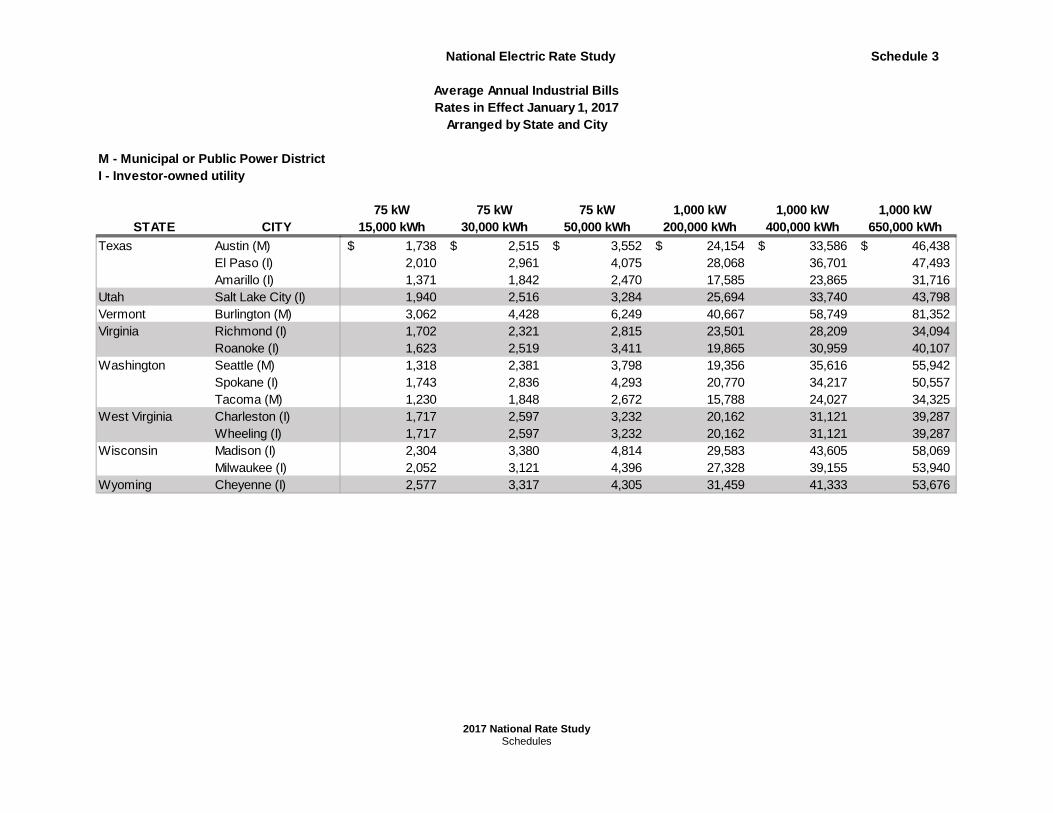
• Schedule 3: Listing of average annual industrial bills arranged by state and city
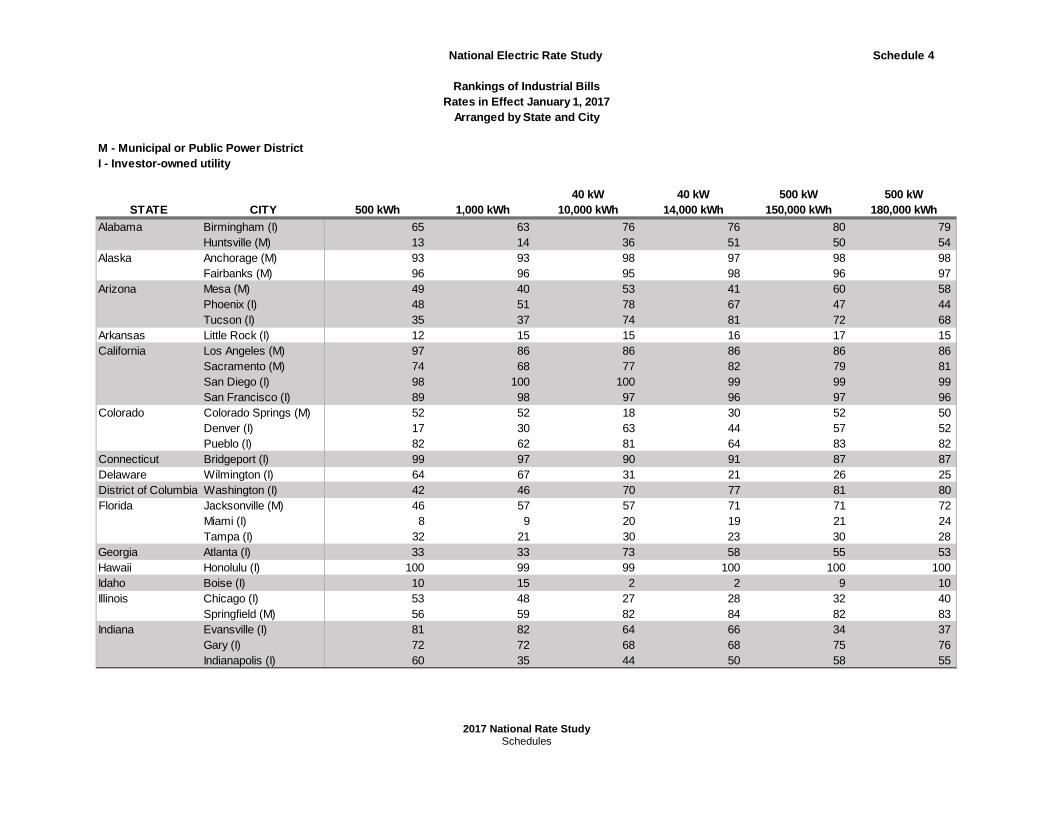
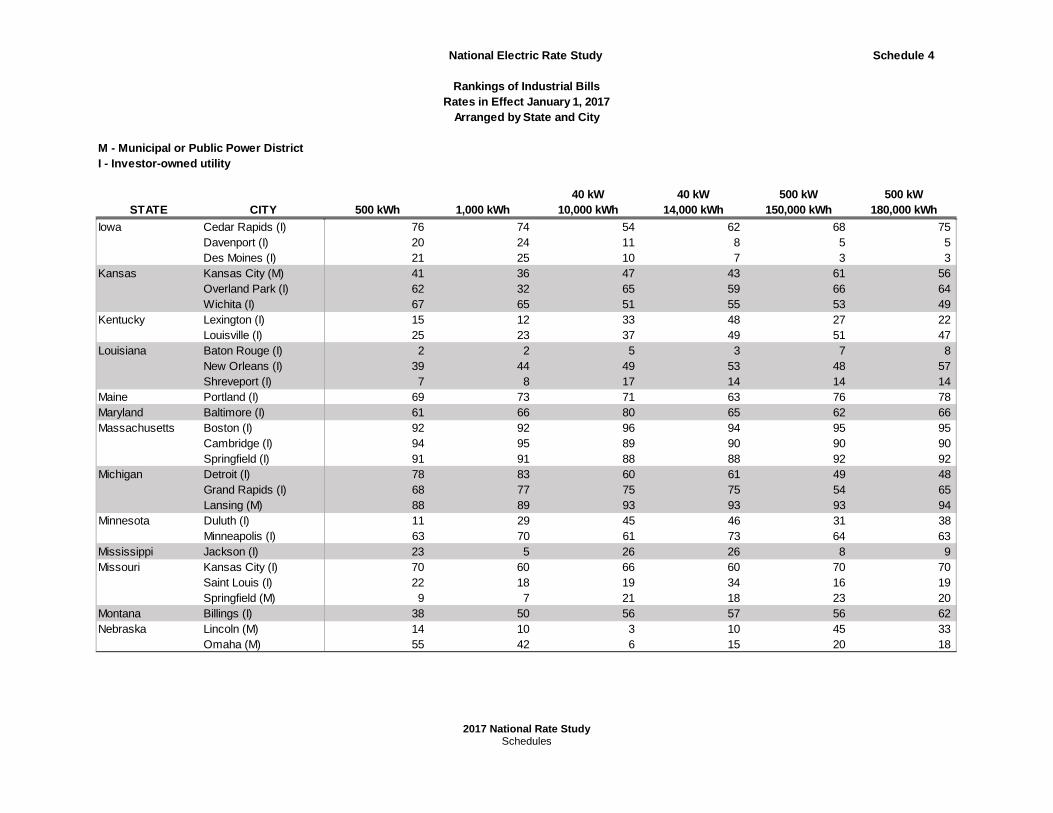
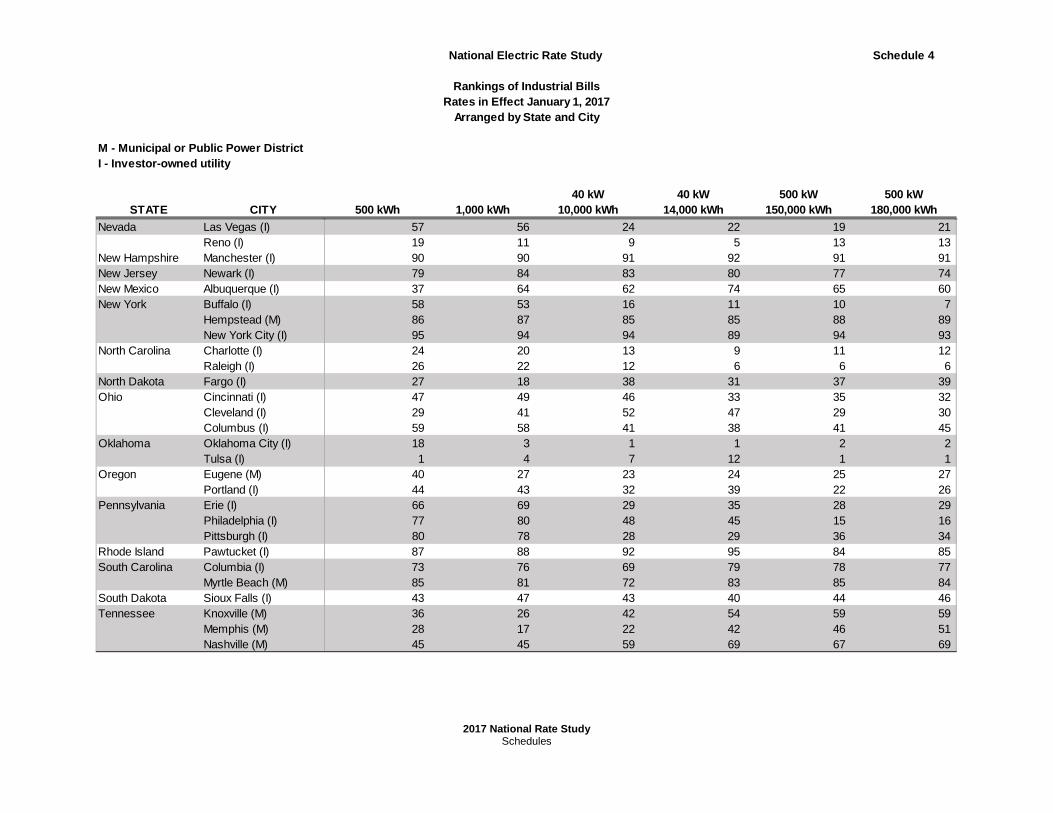
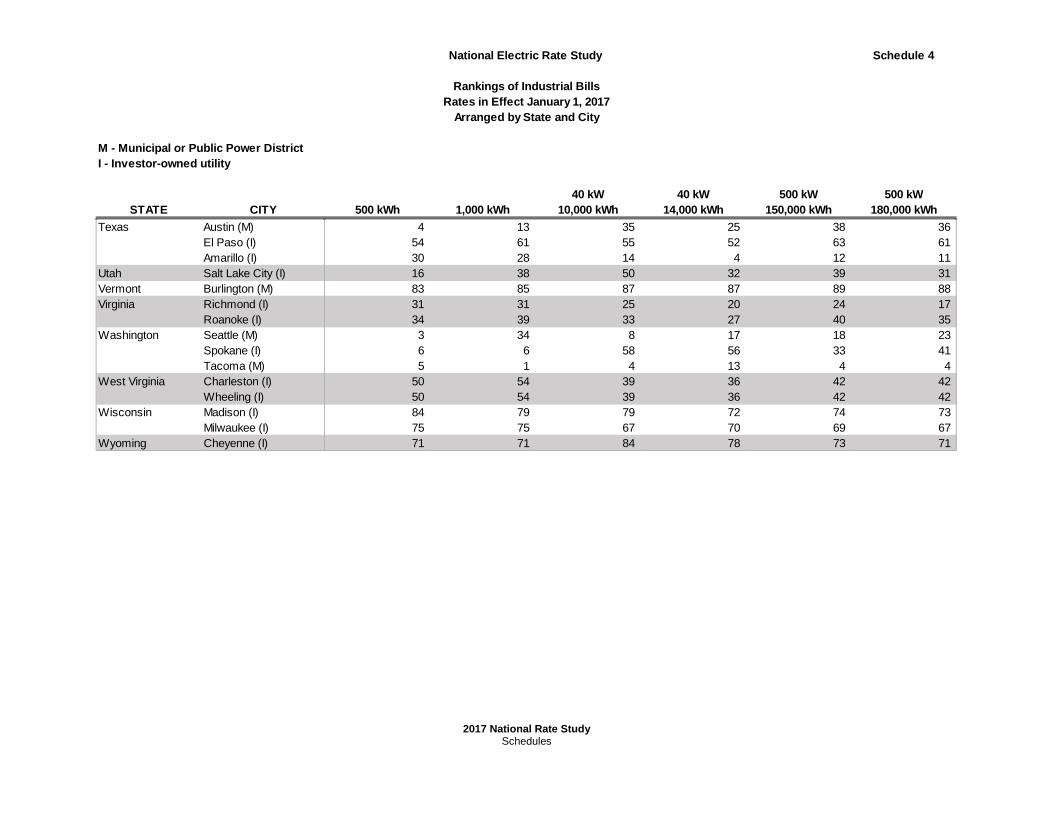
• Schedule 4: Rankings of industrial bills arranged by state and city
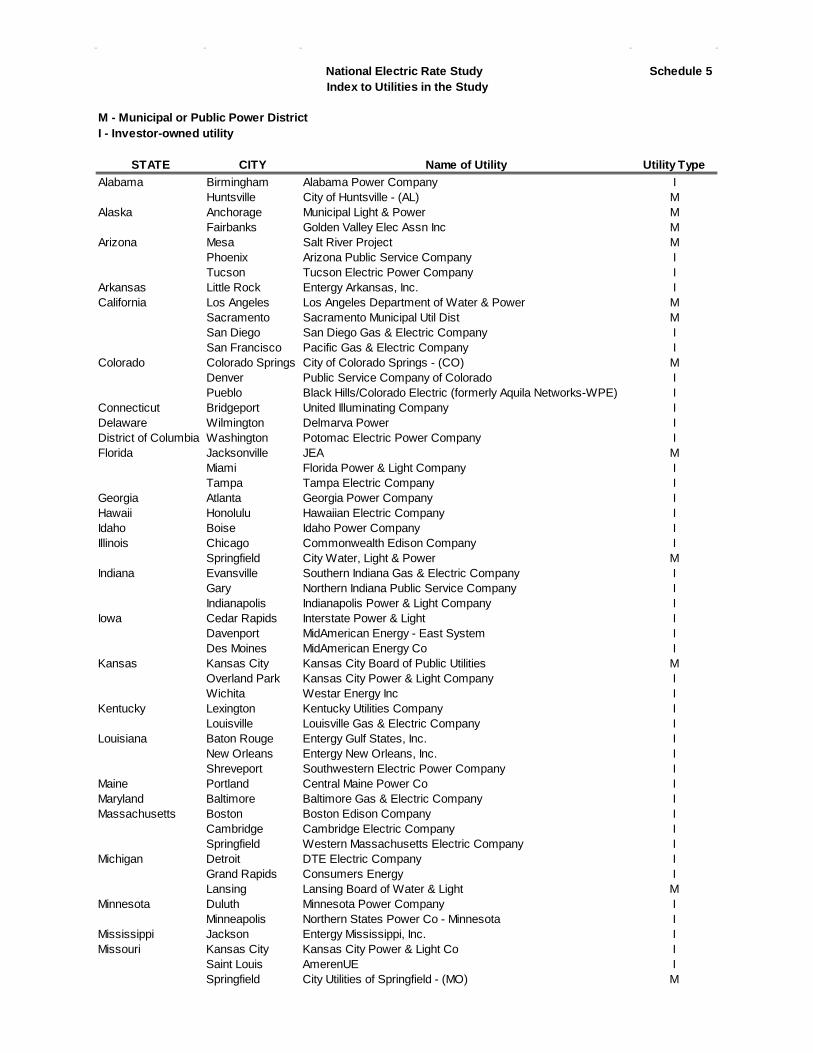
• Schedule 5: Index to Utilities in the Study
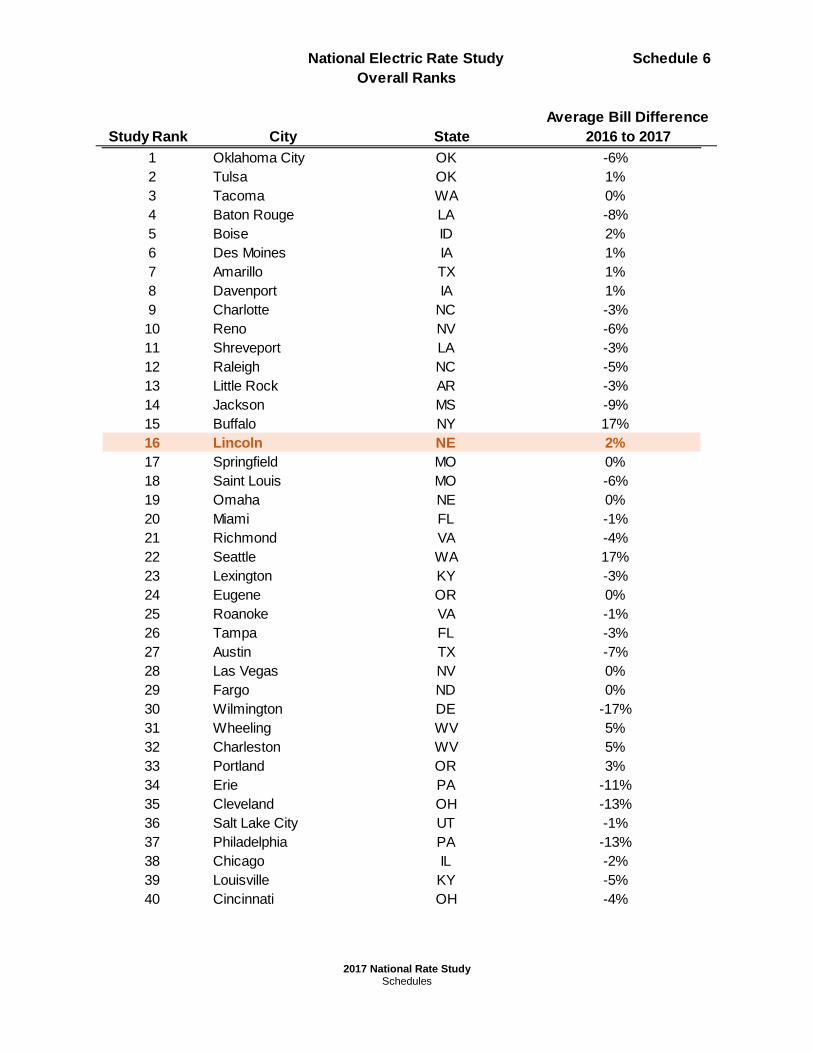
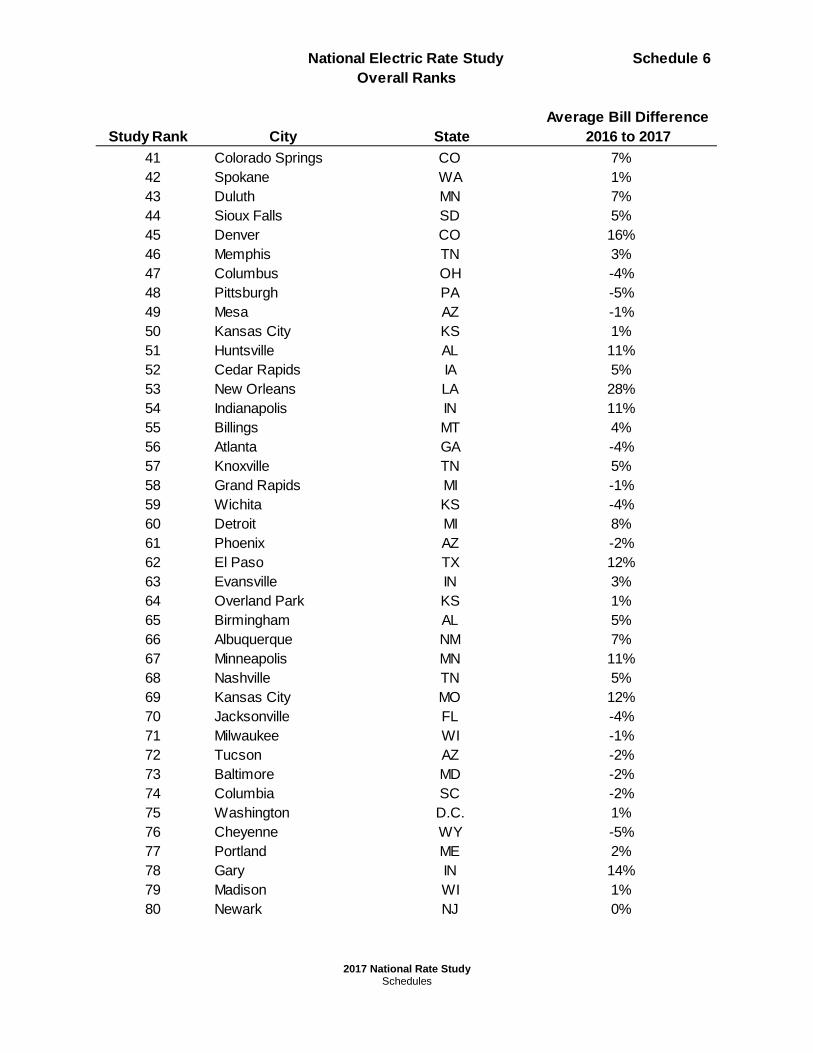
• Schedule 6: Overall Ranks
2017 National Rate Study Detail
2017 National Rate Study Detail
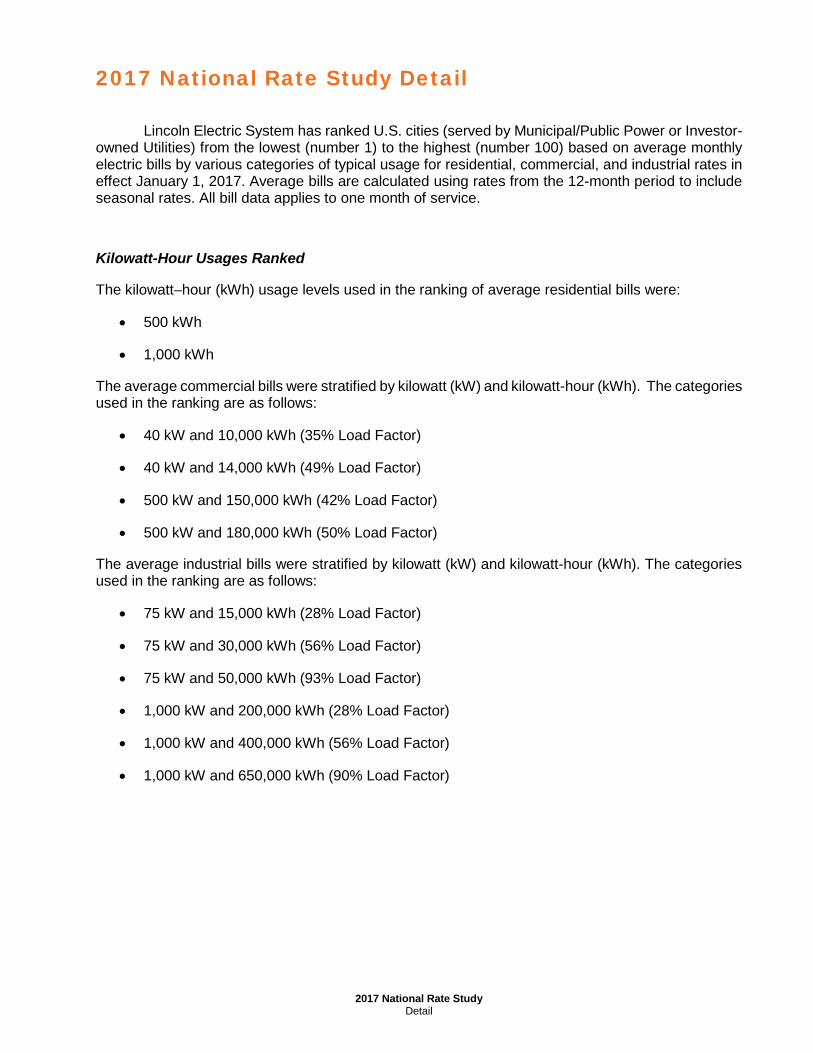
Lincoln Electric System has ranked U.S. cities (served by Municipal/Public Power or Investor-owned Utilities) from the lowest (number 1) to the highest (number 100) based on average monthly electric bills by various categories of typical usage for residential, commercial, and industrial rates in effect January 1, 2017. Average bills are calculated using rates from the 12-month period to include seasonal rates. All bill data applies to one month of service.
Kilowatt-Hour Usages Ranked
The kilowatt–hour (kWh) usage levels used in the ranking of average residential bills were:
• 500 kWh
• 1,000 kWh
The average commercial bills were stratified by kilowatt (kW) and kilowatt-hour (kWh). The categories used in the ranking are as follows:
• 40 kW and 10,000 kWh (35% Load Factor)
• 40 kW and 14,000 kWh (49% Load Factor)
• 500 kW and 150,000 kWh (42% Load Factor)
• 500 kW and 180,000 kWh (50% Load Factor)
The average industrial bills were stratified by kilowatt (kW) and kilowatt-hour (kWh). The categories used in the ranking are as follows:
• 75 kW and 15,000 kWh (28% Load Factor)
• 75 kW and 30,000 kWh (56% Load Factor)
• 75 kW and 50,000 kWh (93% Load Factor)
• 1,000 kW and 200,000 kWh (28% Load Factor)
• 1,000 kW and 400,000 kWh (56% Load Factor)
• 1,000 kW and 650,000 kWh (90% Load Factor)
2017 National Rate Study Detail
2017 National Rate Study Detail
The following list of utilities were added or removed in 2016. This was both to replace some of the utilities removed from the sample due to utility consolidation and to update the report for a better balance of cities.
Cities Added to Rate Study in 2016
Cities Removed From Rate Study in 2016 Amarillo, TX Mobile, AL
Charleston, WV New Haven, CT
Sacramento, CA Waterbury, CT
Myrtle Beach, SC Columbus, GA
Fairbanks, AK Savannah, GA
Rockford, IL
Saint Paul, MN
Greensboro, NC
Paterson, NJ
Dallas, TX
Norfolk, VA
Source of Rate Data
LES obtained the majority of the data for investor-owned utilities from the Rate Regulation Department of the Edison Electric Institute (EEI) publication, Typical Bills and Average Rates Report, Winter 2017, bills as of January 1, 2017. The data for municipal/public power utilities and investor-owned utilities not included in the EEI publication was obtained by modeling each utility’s typical bills from their published rate schedules. We performed no additional procedures to verify either the data obtained from the municipal/public power utilities survey or the EEI publication.
Detailed results of the rankings and utilities included can be found in the Schedules section of the report.
Notes:- Ranks are from 1 (lowest rank) to 100 (highest rank)- Positive change indicates an improvement in rank
Survey Rank
LES Rankingas compared to surveyed cities
Table 2 2017 National Rate Study
2017 National Rate Study Tables
Overall Survey Rank City (2016 Rank)
Average Bill Difference from
2016
1 Oklahoma City, OK (3) -6%2 Tulsa, OK (1) 1%3 Tacoma, WA (2) 0%4 Baton Rouge, LA (10) -8%5 Boise, ID (4) 2%6 Des Moines, IA (5) 1%7 Amarillo, TX (6) 1%8 Davenport, IA (7) 1%9 Charlotte, NC (11) -3%10 Reno, NV (18) -6%
Overall Survey Rank City (2016 Rank)
Average Bill Difference from
2016
91 Manchester, NH (86) 11%92 Bridgeport, CT (91) 1%93 Cambridge, MA (96) -5%94 Lansing, MI (93) 0%95 Boston, MA (98) -4%96 San Francisco, CA (95) 4%97 Fairbanks, AK (92) 13%98 Anchorage, AK (89) 21%99 San Diego, CA (99) 4%
100 Honolulu, HI (100) 5%
Highest and Lowest Overall Ranks
Table 3 2017 National Rate Study
2017 National Rate Study Tables
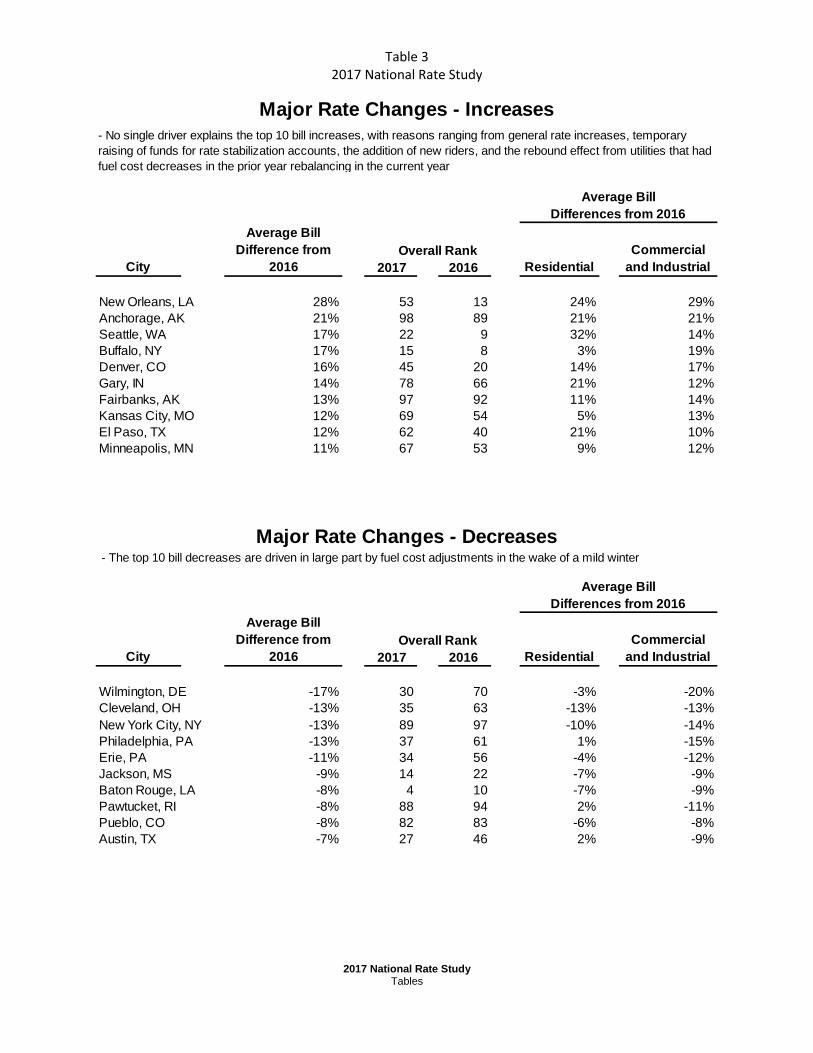
City
Average Bill Difference from
2016 ResidentialCommercial
and Industrial
New Orleans, LA 28% 53 13 24% 29%Anchorage, AK 21% 98 89 21% 21%Seattle, WA 17% 22 9 32% 14%Buffalo, NY 17% 15 8 3% 19%Denver, CO 16% 45 20 14% 17%Gary, IN 14% 78 66 21% 12%Fairbanks, AK 13% 97 92 11% 14%Kansas City, MO 12% 69 54 5% 13%El Paso, TX 12% 62 40 21% 10%Minneapolis, MN 11% 67 53 9% 12%
City
Average Bill Difference from
2016 ResidentialCommercial
and Industrial
Wilmington, DE -17% 30 70 -3% -20%Cleveland, OH -13% 35 63 -13% -13%New York City, NY -13% 89 97 -10% -14%Philadelphia, PA -13% 37 61 1% -15%Erie, PA -11% 34 56 -4% -12%Jackson, MS -9% 14 22 -7% -9%Baton Rouge, LA -8% 4 10 -7% -9%Pawtucket, RI -8% 88 94 2% -11%Pueblo, CO -8% 82 83 -6% -8%Austin, TX -7% 27 46 2% -9%
Overall Rank 2017 2016
Overall Rank 2017 2016
Average Bill Differences from 2016
Major Rate Changes - Increases
Major Rate Changes - Decreases
Average Bill Differences from 2016
- The top 10 bill decreases are driven in large part by fuel cost adjustments in the wake of a mild winter
- No single driver explains the top 10 bill increases, with reasons ranging from general rate increases, temporary raising of funds for rate stabilization accounts, the addition of new riders, and the rebound effect from utilities that had fuel cost decreases in the prior year rebalancing in the current year
Table 4 2017 National Rate Study
2017 National Rate Study Tables
Rank City Bill Change Rank City Bill Change1 Tulsa, OK $45.32 1.2% 91 Springfield, MA $105.63 -4.7%2 Baton Rouge, LA $45.82 -6.2% 92 Boston, MA $109.47 0.1%3 Seattle, WA $47.07 35.8% 93 Anchorage, AK $109.94 20.5%4 Austin, TX $47.33 4.6% 94 Cambridge, MA $110.98 -1.8%5 Tacoma, WA $47.57 0.0% 95 New York City, NY $115.23 -9.4%6 Spokane, WA $48.13 7.3% 96 Fairbanks, AK $117.28 10.7%7 Shreveport, LA $50.48 -2.5% 97 Los Angeles, CA $117.48 5.5%8 Miami, FL $51.77 0.4% 98 San Diego, CA $121.46 5.3%9 Springfield, MO $51.90 0.0% 99 Bridgeport, CT $125.73 3.9%
10 Boise, ID $52.04 3.1% 100 Honolulu, HI $135.39 4.7%
Rank City Bill Change Rank City Bill Change1 Tacoma, WA $84.65 0.0% 91 Springfield, MA $209.26 -4.7%2 Baton Rouge, LA $85.29 -6.8% 92 Boston, MA $212.49 0.1%3 Oklahoma City, OK $91.62 -3.1% 93 Anchorage, AK $213.33 21.3%4 Tulsa, OK $91.79 2.7% 94 New York City, NY $213.83 -10.1%5 Jackson, MS $92.28 -7.6% 95 Cambridge, MA $215.07 -1.8%6 Spokane, WA $92.59 10.7% 96 Fairbanks, AK $217.06 11.7%7 Springfield, MO $92.92 0.0% 97 Bridgeport, CT $241.79 7.6%8 Shreveport, LA $93.21 -2.7% 98 San Francisco, CA $257.36 2.6%9 Miami, FL $95.43 0.1% 99 Honolulu, HI $264.54 4.8%
10 Lincoln, NE $96.48 3.1% 100 San Diego, CA $324.18 4.0%
Rank City Bill Change Rank City Bill Change1 Oklahoma City, OK $767 -4.7% 91 Manchester, NH $1,876 10.5%2 Boise, ID $768 1.9% 92 Pawtucket, RI $1,958 -9.5%3 Lincoln, NE $774 0.2% 93 Lansing, MI $1,962 0.0%4 Tacoma, WA $790 0.0% 94 New York City, NY $1,985 -12.8%5 Baton Rouge, LA $802 -7.4% 95 Fairbanks, AK $2,005 12.8%6 Omaha, NE $804 -7.7% 96 Boston, MA $2,044 -6.5%7 Tulsa, OK $816 1.5% 97 San Francisco, CA $2,129 3.6%8 Seattle, WA $845 18.0% 98 Anchorage, AK $2,233 22.3%9 Reno, NV $848 -5.7% 99 Honolulu, HI $2,501 4.1%
10 Des Moines, IA $855 1.0% 100 San Diego, CA $2,557 4.9%
Rank City Bill Change Rank City Bill Change1 Oklahoma City, OK $903 -5.5% 91 Bridgeport, CT $2,360 -1.1%2 Boise, ID $977 2.1% 92 Manchester, NH $2,380 10.8%3 Baton Rouge, LA $1,001 -8.6% 93 Lansing, MI $2,512 0.0%4 Amarillo, TX $1,012 -1.2% 94 Boston, MA $2,549 -6.8%5 Reno, NV $1,021 -6.5% 95 Pawtucket, RI $2,553 -10.6%6 Raleigh, NC $1,054 -5.5% 96 San Francisco, CA $2,715 3.6%7 Des Moines, IA $1,054 0.7% 97 Anchorage, AK $2,735 20.7%8 Davenport, IA $1,055 0.7% 98 Fairbanks, AK $2,799 12.8%9 Charlotte, NC $1,055 -3.4% 99 San Diego, CA $2,931 4.2%
10 Lincoln, NE $1,057 -0.1% 100 Honolulu, HI $3,272 4.4%
Rank City Bill Change Rank City Bill Change1 Tulsa, OK $8,711 0.0% 91 Manchester, NH $24,881 11.7%2 Oklahoma City, OK $9,547 -5.7% 92 Springfield, MA $25,498 4.2%3 Des Moines, IA $9,733 1.6% 93 Lansing, MI $26,626 0.0%4 Tacoma, WA $9,979 0.0% 94 New York City, NY $26,656 -13.1%5 Davenport, IA $10,270 0.7% 95 Boston, MA $28,683 -2.6%6 Raleigh, NC $10,556 -6.8% 96 Fairbanks, AK $29,046 13.3%7 Baton Rouge, LA $10,663 -8.7% 97 San Francisco, CA $29,957 3.6%8 Jackson, MS $10,869 -9.4% 98 Anchorage, AK $30,542 21.9%9 Boise, ID $10,869 2.0% 99 San Diego, CA $32,426 4.6%
10 Buffalo, NY $10,955 15.9% 100 Honolulu, HI $38,244 5.2%
Rank City Bill Change Rank City Bill Change1 Tulsa, OK $9,770 0.5% 91 Manchester, NH $28,463 11.7%2 Oklahoma City, OK $10,573 -6.1% 92 Springfield, MA $29,006 4.0%3 Des Moines, IA $11,047 1.6% 93 New York City, NY $29,371 -13.2%4 Tacoma, WA $11,215 0.0% 94 Lansing, MI $30,752 0.0%5 Davenport, IA $11,692 0.5% 95 Boston, MA $32,350 -2.4%6 Raleigh, NC $11,767 -7.5% 96 San Francisco, CA $33,063 3.9%7 Buffalo, NY $12,150 18.9% 97 Fairbanks, AK $33,420 13.9%8 Baton Rouge, LA $12,156 -9.3% 98 Anchorage, AK $34,312 20.9%9 Jackson, MS $12,404 -9.8% 99 San Diego, CA $35,224 4.2%
10 Boise, ID $12,438 2.1% 100 Honolulu, HI $43,299 5.5%
Rank City Bill Change Rank City Bill Change1 Lincoln, NE $1,127 -0.1% 91 Manchester, NH $3,035 10.4%2 Tulsa, OK $1,210 1.6% 92 Lansing, MI $3,061 0.0%3 Tacoma, WA $1,230 0.0% 93 Burlington, VT $3,062 3.4%4 Oklahoma City, OK $1,241 -4.6% 94 Pueblo, CO $3,085 -4.8%5 Boise, ID $1,243 1.5% 95 San Francisco, CA $3,321 3.6%6 Baton Rouge, LA $1,271 -6.8% 96 Boston, MA $3,537 -6.2%7 Seattle, WA $1,318 11.1% 97 Anchorage, AK $3,676 23.8%8 Charlotte, NC $1,363 -1.9% 98 Fairbanks, AK $3,699 10.3%9 Amarillo, TX $1,371 -5.1% 99 Honolulu, HI $3,873 4.0%
10 Colorado Springs, CO $1,377 10.6% 100 San Diego, CA $4,341 5.4%
Rank City Bill Change Rank City Bill Change1 Oklahoma City, OK $1,754 -6.1% 91 Manchester, NH $4,926 11.0%2 Amarillo, TX $1,842 -2.7% 92 Bridgeport, CT $5,029 -1.0%3 Tacoma, WA $1,848 0.0% 93 Lansing, MI $5,124 0.0%4 Raleigh, NC $1,993 -6.5% 94 Pawtucket, RI $5,184 -11.1%5 Baton Rouge, LA $2,013 -9.3% 95 Fairbanks, AK $5,389 14.3%6 Boise, ID $2,029 1.8% 96 Boston, MA $5,432 -6.9%7 Tulsa, OK $2,041 1.6% 97 San Francisco, CA $5,520 3.8%8 Lincoln, NE $2,054 -0.2% 98 Anchorage, AK $5,561 20.3%9 Reno, NV $2,066 -6.9% 99 San Diego, CA $5,746 3.9%
10 Buffalo, NY $2,095 22.2% 100 Honolulu, HI $6,765 4.6%
Rank City Bill Change Rank City Bill Change1 Oklahoma City, OK $2,438 -7.1% 91 Cambridge, MA $7,402 -8.5%2 Amarillo, TX $2,470 -0.9% 92 Manchester, NH $7,448 11.4%3 Lincoln, NE $2,661 -0.2% 93 San Diego, CA $7,618 2.8%4 Tacoma, WA $2,672 0.0% 94 Fairbanks, AK $7,642 17.0%5 Raleigh, NC $2,754 -8.7% 95 Lansing, MI $7,874 0.0%6 Richmond, VA $2,815 -6.6% 96 Boston, MA $7,959 -7.3%7 Buffalo, NY $2,907 29.3% 97 Anchorage, AK $8,075 18.2%8 Reno, NV $2,929 -8.0% 98 Pawtucket, RI $8,132 -12.2%9 Baton Rouge, LA $2,967 -10.8% 99 San Francisco, CA $8,453 3.8%
10 Charlotte, NC $2,994 -2.9% 100 Honolulu, HI $10,620 4.9%
Rank City Bill Change Rank City Bill Change1 Tulsa, OK $13,623 -1.1% 91 Lansing, MI $39,383 0.0%2 Oklahoma City, OK $13,817 -6.7% 92 Pueblo, CO $39,958 -5.0%3 Des Moines, IA $14,607 1.9% 93 Burlington, VT $40,667 3.1%4 Jackson, MS $14,938 -9.3% 94 Bridgeport, CT $40,803 7.1%5 Davenport, IA $15,623 1.0% 95 Fairbanks, AK $43,481 11.8%6 Philadelphia, PA $15,623 -22.7% 96 Boston, MA $44,905 -2.8%7 Baton Rouge, LA $15,781 -7.3% 97 San Francisco, CA $47,693 3.1%8 Tacoma, WA $15,788 0.0% 98 Anchorage, AK $48,471 24.1%9 Erie, PA $15,951 -14.9% 99 San Diego, CA $55,490 5.5%
10 Boise, ID $16,207 1.4% 100 Honolulu, HI $58,840 4.5%
Rank City Bill Change Rank City Bill Change1 Oklahoma City, OK $19,387 -9.3% 91 Manchester, NH $61,304 11.8%2 Tulsa, OK $20,677 1.0% 92 Springfield, MA $61,988 3.9%3 Des Moines, IA $23,373 1.6% 93 Cambridge, MA $62,553 -3.2%4 Amarillo, TX $23,865 2.7% 94 Lansing, MI $66,889 0.0%5 Tacoma, WA $24,027 0.0% 95 San Francisco, CA $67,325 4.2%6 Philadelphia, PA $24,203 -23.9% 96 Boston, MA $69,353 -2.4%7 Jackson, MS $24,919 -10.8% 97 Fairbanks, AK $72,642 14.2%8 Davenport, IA $25,105 0.5% 98 Anchorage, AK $73,608 20.5%9 Buffalo, NY $25,451 21.1% 99 San Diego, CA $74,140 4.0%
10 Boise, ID $25,476 1.9% 100 Honolulu, HI $92,541 5.8%
Rank City Bill Change Rank City Bill Change1 Oklahoma City, OK $26,349 -10.9% 91 Manchester, NH $90,909 11.8%2 Tulsa, OK $29,494 2.2% 92 Springfield, MA $91,218 3.5%3 Amarillo, TX $31,716 3.2% 93 San Francisco, CA $91,864 4.9%4 Jackson, MS $32,931 -12.9% 94 Cambridge, MA $93,336 -2.8%5 Little Rock, AR $33,103 -10.4% 95 San Diego, CA $97,454 2.9%6 Des Moines, IA $33,597 1.4% 96 Boston, MA $99,913 -2.1%7 Richmond, VA $34,094 -7.3% 97 Lansing, MI $101,273 0.0%8 Tacoma, WA $34,325 0.0% 98 Anchorage, AK $105,029 18.4%9 Philadelphia, PA $34,928 -24.6% 99 Fairbanks, AK $109,093 15.4%
10 Buffalo, NY $35,407 29.0% 100 Honolulu, HI $134,668 6.6%
M - Municipal or Public Power DistrictI - Investor-owned utility
STATE CITY Name of Utility Utility Type
National Electric Rate Study Schedule 5 Index to Utilities in the Study
Alabama Birmingham Alabama Power Company IHuntsville City of Huntsville - (AL) M
Alaska Anchorage Municipal Light & Power MFairbanks Golden Valley Elec Assn Inc M
Arizona Mesa Salt River Project MPhoenix Arizona Public Service Company ITucson Tucson Electric Power Company I
Arkansas Little Rock Entergy Arkansas, Inc. ICalifornia Los Angeles Los Angeles Department of Water & Power M
Sacramento Sacramento Municipal Util Dist MSan Diego San Diego Gas & Electric Company ISan Francisco Pacific Gas & Electric Company I
Colorado Colorado Springs City of Colorado Springs - (CO) MDenver Public Service Company of Colorado IPueblo Black Hills/Colorado Electric (formerly Aquila Networks-WPE) I
Connecticut Bridgeport United Illuminating Company IDelaware Wilmington Delmarva Power IDistrict of Columbia Washington Potomac Electric Power Company IFlorida Jacksonville JEA M
Miami Florida Power & Light Company ITampa Tampa Electric Company I
Georgia Atlanta Georgia Power Company IHawaii Honolulu Hawaiian Electric Company IIdaho Boise Idaho Power Company IIllinois Chicago Commonwealth Edison Company I
Springfield City Water, Light & Power MIndiana Evansville Southern Indiana Gas & Electric Company I
Gary Northern Indiana Public Service Company IIndianapolis Indianapolis Power & Light Company I
Iowa Cedar Rapids Interstate Power & Light IDavenport MidAmerican Energy - East System IDes Moines MidAmerican Energy Co I
Kansas Kansas City Kansas City Board of Public Utilities MOverland Park Kansas City Power & Light Company IWichita Westar Energy Inc I
Kentucky Lexington Kentucky Utilities Company ILouisville Louisville Gas & Electric Company I
Louisiana Baton Rouge Entergy Gulf States, Inc. INew Orleans Entergy New Orleans, Inc. IShreveport Southwestern Electric Power Company I
Maine Portland Central Maine Power Co IMaryland Baltimore Baltimore Gas & Electric Company IMassachusetts Boston Boston Edison Company I
Cambridge Cambridge Electric Company ISpringfield Western Massachusetts Electric Company I
Michigan Detroit DTE Electric Company IGrand Rapids Consumers Energy ILansing Lansing Board of Water & Light M
Minnesota Duluth Minnesota Power Company IMinneapolis Northern States Power Co - Minnesota I
Mississippi Jackson Entergy Mississippi, Inc. IMissouri Kansas City Kansas City Power & Light Co I
Saint Louis AmerenUE ISpringfield City Utilities of Springfield - (MO) M
2017 National Rate Study Schedules
M - Municipal or Public Power DistrictI - Investor-owned utility
STATE CITY Name of Utility Utility Type
National Electric Rate Study Schedule 5 Index to Utilities in the Study
Montana Billings NorthWestern Energy (formerly Montana Power) INebraska Lincoln Lincoln Electric System M
Omaha Omaha Public Power District MNevada Las Vegas Nevada Power Company - NV Energy I
Reno Sierra Pacific Power Company - NV Energy INew Hampshire Manchester Public Service Company of New Hampshire INew Jersey Newark Public Service Electric & Gas Company INew Mexico Albuquerque Public Service Company of New Mexico INew York Buffalo National Grid (Niagara Mohawk Power Corporation) I
Hempstead PSEG Long Island MNew York City Consolidated Edison Company of New York I
North Carolina Charlotte Duke Energy Carolinas IRaleigh Duke Energy Progress, Inc. I
North Dakota Fargo Northern States Power Company (MN) IOhio Cincinnati Duke Energy Ohio I
Cleveland Cleveland Electric Illuminating Company IColumbus AEP (Columbus Southern Power Rate Area) I
Oklahoma Oklahoma City OG&E Electric Services ITulsa Public Service Company of Oklahoma I
Oregon Eugene Eugene Water & Electric Board MPortland Portland General Electric Company I
Pennsylvania Erie Pennsylvania Electric Company IPhiladelphia PECO Energy IPittsburgh Duquesne Light Company I
Rhode Island Pawtucket Narragansett Electric Company ISouth Carolina Columbia South Carolina Electric & Gas Company I
Myrtle Beach Santee Cooper MSouth Dakota Sioux Falls Northern States Power Company (MN) ITennessee Knoxville Knoxville Utilities Board M
Memphis Memphis Light, Gas and Water MNashville Nashville Electric Service M
Texas Austin Austin Energy MEl Paso El Paso Electric Company IAmarillo Southwestern Public Service I
Utah Salt Lake City PacifiCorp IVermont Burlington City of Burlington Electric - (VT) MVirginia Richmond Dominion Virginia Power I
Roanoke AEP (Appalachian Power Rate Area), Virginia IWashington Seattle City of Seattle - (WA) M
Spokane Avista Corp. ITacoma Tacoma Public Utilities M
West Virginia Charleston AEP (Appalachian Power Rate Area) IWheeling AEP (Wheeling Power Rate Area) I
Wisconsin Madison Madison Gas & Electric Company IMilwaukee We Energies (formerly Wisconsin Electric) I
Wyoming Cheyenne Cheyenne Light, Fuel & Power Company I
2017 National Rate Study Schedules
Study Rank City StateAverage Bill Difference
2016 to 2017
National Electric Rate Study Schedule 6 Overall Ranks
1 Oklahoma City OK -6%2 Tulsa OK 1%3 Tacoma WA 0%4 Baton Rouge LA -8%5 Boise ID 2%6 Des Moines IA 1%7 Amarillo TX 1%8 Davenport IA 1%9 Charlotte NC -3%10 Reno NV -6%11 Shreveport LA -3%12 Raleigh NC -5%13 Little Rock AR -3%14 Jackson MS -9%15 Buffalo NY 17%16 Lincoln NE 2%17 Springfield MO 0%18 Saint Louis MO -6%19 Omaha NE 0%20 Miami FL -1%21 Richmond VA -4%22 Seattle WA 17%23 Lexington KY -3%24 Eugene OR 0%25 Roanoke VA -1%26 Tampa FL -3%27 Austin TX -7%28 Las Vegas NV 0%29 Fargo ND 0%30 Wilmington DE -17%31 Wheeling WV 5%32 Charleston WV 5%33 Portland OR 3%34 Erie PA -11%35 Cleveland OH -13%36 Salt Lake City UT -1%37 Philadelphia PA -13%38 Chicago IL -2%39 Louisville KY -5%40 Cincinnati OH -4%
2017 National Rate Study Schedules
Study Rank City StateAverage Bill Difference
2016 to 2017
National Electric Rate Study Schedule 6 Overall Ranks
41 Colorado Springs CO 7%42 Spokane WA 1%43 Duluth MN 7%44 Sioux Falls SD 5%45 Denver CO 16%46 Memphis TN 3%47 Columbus OH -4%48 Pittsburgh PA -5%49 Mesa AZ -1%50 Kansas City KS 1%51 Huntsville AL 11%52 Cedar Rapids IA 5%53 New Orleans LA 28%54 Indianapolis IN 11%55 Billings MT 4%56 Atlanta GA -4%57 Knoxville TN 5%58 Grand Rapids MI -1%59 Wichita KS -4%60 Detroit MI 8%61 Phoenix AZ -2%62 El Paso TX 12%63 Evansville IN 3%64 Overland Park KS 1%65 Birmingham AL 5%66 Albuquerque NM 7%67 Minneapolis MN 11%68 Nashville TN 5%69 Kansas City MO 12%70 Jacksonville FL -4%71 Milwaukee WI -1%72 Tucson AZ -2%73 Baltimore MD -2%74 Columbia SC -2%75 Washington D.C. 1%76 Cheyenne WY -5%77 Portland ME 2%78 Gary IN 14%79 Madison WI 1%80 Newark NJ 0%
2017 National Rate Study Schedules
Study Rank City StateAverage Bill Difference
2016 to 2017
National Electric Rate Study Schedule 6 Overall Ranks
81 Sacramento CA 3%82 Pueblo CO -8%83 Springfield IL 6%84 Myrtle Beach SC 0%85 Hempstead NY 2%86 Los Angeles CA 8%87 Burlington VT 3%88 Pawtucket RI -8%89 New York City NY -13%90 Springfield MA 2%91 Manchester NH 11%92 Bridgeport CT 1%93 Cambridge MA -5%94 Lansing MI 0%95 Boston MA -4%96 San Francisco CA 4%97 Fairbanks AK 13%98 Anchorage AK 21%99 San Diego CA 4%100 Honolulu HI 5%


![2016 Electric Rate Schedules[3]](https://static.documents.pub/doc/80x56/577ca6841a28abea748be7b8/2016-electric-rate-schedules3.jpg)


