Number 35 n March 25, 2011 Mean Systolic and Diastolic Blood Pressure in Adults Aged 18 and Over in the United States, 2001–2008 by Jacqueline D. Wright, Dr.P.H.; Jeffery P. Hughes, M.P.H.; Yechiam Ostchega, Ph.D., R.N.; Sung Sug Yoon, Ph.D.; and Tatiana Nwankwo, M.S., Division of Health and Nutrition Examination Surveys, National Center for Health Statistics Abstract Objective—This report presents estimates for the period 2001–2008 of means and selected percentiles of systolic and diastolic blood pressure by sex, race or ethnicity, age, and hypertension status in adults aged 18 and over. Methods—Demographic characteristics were collected during a personal interview, and blood pressures were measured during a physician examination. All estimates were calculated using the mean of up to three measurements. The final analytic sample consisted of 19,921 adults aged 18 and over with complete data. Examined sample weights and sample design variables were used to calculate nationally representative estimates and standard error estimates that account for the complex design, using SAS and SUDAAN statistical software. Results—Mean systolic blood pressure was 122 mm Hg for all adults aged 18 and over; it was 116 mm Hg for normotensive adults, 130 mm Hg for treated hypertensive adults, and 146 mm Hg for untreated hypertensive adults. Mean diastolic blood pressure was 71 mm Hg for all adults 18 and over; it was 69 mm Hg for normotensive adults, 75 mm Hg for treated hypertensive adults, and 85 mm Hg for untreated hypertensive adults. There was a trend of increasing systolic blood pressure with increasing age. A more curvilinear trend was seen in diastolic blood pressure, with increasing then decreasing means with age in both men and women. Men had higher mean systolic and diastolic pressures than women. There were some differences in mean blood pressure by race or ethnicity, with non-Hispanic black adults having higher mean systolic and diastolic blood pressures than non-Hispanic white and Mexican-American adults, but these differences were not consistent after stratification by hypertension status and sex. Conclusions—These estimates of the distribution of blood pressure may be useful for policy makers who are considering ways to achieve a downward shift in the population distribution of blood pressure with the goal of reducing morbidity and mortality related to hypertension. Keywords: cross-sectional studies • ethnic groups • hypertension • National Health and Nutrition Examination Survey (NHANES) Introduction Although mortality due to heart disease has declined over the past 15 years, it remains the leading cause of death in the United States (1). The most recent report on hypertension (2), which used data from the National Health and Nutrition Examination Survey (NHANES), estimated that 30% of adults aged 18 and over had hypertension. No significant change was observed between 1999–2000 and 2007–2008. The Seventh Report of the Joint National Committee on Prevention, Detection, Evaluation, and Treatment of High Blood Pressure (JNC 7) (3) reaffirmed that the relationship between blood pressure and cardiovascular disease is continuous, with increased blood pressure associated with higher risk of heart attack, heart failure, stroke, and kidney disease. In recognition of the continuous risk associated with higher blood pressure, the objective of this report was to estimate the mean and distribution of systolic and diastolic blood pressure for adults 18 and over using data from NHANES 2001–2008. Estimated means and selected percentiles of systolic and diastolic blood pressure are presented by sex, race or ethnicity, age, and hypertension status. U.S. DEPARTMENT OF HEALTH AND HUMAN SERVICES Centers for Disease Control and Prevention National Center for Health Statistics
Transcript
Number 35 n March 25, 2011
Mean Systolic and Diastolic Blood Pressure in Adults Aged 18 and Over in the United States, 2001–2008
by Jacqueline D. Wright, Dr.P.H.; Jeffery P. Hughes, M.P.H.; Yechiam Ostchega, Ph.D., R.N.; Sung Sug Yoon, Ph.D.; and Tatiana Nwankwo, M.S., Division of Health and Nutrition Examination Surveys,
National Center for Health Statistics
Abstract Objective—This report presents estimates for the period 2001–2008 of
means and selected percentiles of systolic and diastolic blood pressure by sex, race or ethnicity, age, and hypertension status in adults aged 18 and over.
Methods—Demographic characteristics were collected during a personal interview, and blood pressures were measured during a physician examination. All estimates were calculated using the mean of up to three measurements. The final analytic sample consisted of 19,921 adults aged 18 and over with complete data. Examined sample weights and sample design variables were used to calculate nationally representative estimates and standard error estimates that account for the complex design, using SAS and SUDAAN statistical software.
Results—Mean systolic blood pressure was 122 mm Hg for all adults aged 18 and over; it was 116 mm Hg for normotensive adults, 130 mm Hg for treated hypertensive adults, and 146 mm Hg for untreated hypertensive adults. Mean diastolic blood pressure was 71 mm Hg for all adults 18 and over; it was 69 mm Hg for normotensive adults, 75 mm Hg for treated hypertensive adults, and 85 mm Hg for untreated hypertensive adults. There was a trend of increasing systolic blood pressure with increasing age. A more curvilinear trend was seen in diastolic blood pressure, with increasing then decreasing means with age in both men and women. Men had higher mean systolic and diastolic pressures than women. There were some differences in mean blood pressure by race or ethnicity, with non-Hispanic black adults having higher mean systolic and diastolic blood pressures than non-Hispanic white and Mexican-American adults, but these differences were not consistent after stratification by hypertension status and sex.
Conclusions—These estimates of the distribution of blood pressure may be useful for policy makers who are considering ways to achieve a downward shift in the population distribution of blood pressure with the goal of reducing morbidity and mortality related to hypertension.
Keywords: cross-sectional studies • ethnic groups • hypertension • National Health and Nutrition Examination Survey (NHANES)
U.S. DEPARTMENT OF HEALTH AND HUMAN SERCenters for Disease Control and Preventi
National Center for Health Statistics
Introduction Although mortality due to heart
disease has declined over the past 15 years, it remains the leading cause of death in the United States (1). The most recent report on hypertension (2), which used data from the National Health and Nutrition Examination Survey (NHANES), estimated that 30% of adults aged 18 and over had hypertension. No significant change was observed between 1999–2000 and 2007–2008. The Seventh Report of the Joint National Committee on Prevention, Detection, Evaluation, and Treatment of High Blood Pressure (JNC 7) (3) reaffirmed that the relationship between blood pressure and cardiovascular disease is continuous, with increased blood pressure associated with higher risk of heart attack, heart failure, stroke, and kidney disease. In recognition of the continuous risk associated with higher blood pressure, the objective of this report was to estimate the mean and distribution of systolic and diastolic blood pressure for adults 18 and over using data from NHANES 2001–2008. Estimated means and selected percentiles of systolic and diastolic blood pressure are presented by sex, race or ethnicity, age, and hypertension status.
VICES on
Page 2 National Health Statistics Reports n Number 35 n March 25, 2011
Methods
Data source NHANES is conducted on a
continuous basis to monitor the health and nutritional status of the U.S. population. The survey sampled the civilian noninstitutionalized U.S. population residing in the 50 states and the District of Columbia. During 2001–2006, the NHANES sample design included an oversampling of the following groups: low-income persons, adolescents aged 12–19, persons aged 60 and over, and African-American and Mexican-American persons. In 2007– 2008, the subdomains that were oversampled were changed to include low-income persons, African-American and all Hispanic (not just Mexican-American) persons, and persons aged 60 and over. The survey consisted of a personal interview in the household, followed by an examination in a mobile examination center (MEC). The MEC allows greater standardization of examination procedures and measurements and has been a key design element of the survey for 50 years. A description of the survey design and data collection procedures has been published for each of the 2-year survey cycles examined here: 2001–2002, 2003–2004, 2005–2006, and 2007–2008 (4–7).
Interview and examination methods
Information on demographic characteristics was collected during the personal interview, and blood pressures were measured during the physician examination. Detailed descriptions of the blood pressure measurement procedures and an evaluation study of the effect of training procedures for blood pressure measurement for 1999–2000 have been published elsewhere (8–12). Blood pressure was measured in accordance with the current recommendations of the American Heart Association (13). For the present report, all estimates were calculated using the mean of up to three measurements. Three hypertension status categories were used: normal or
normotensive was defined as reporting no use of antihypertensive medication, with a mean systolic blood pressure of less than 140 mm Hg and mean diastolic blood pressure less than 90 mm Hg; treated hypertensive was defined as reporting use of antihypertensive medication regardless of the level of measured blood pressure (i.e., including both controlled and uncontrolled hypertension); and untreated hypertensive was defined as reporting no use of antihypertensive medication with a mean systolic blood pressure of 140 mm Hg or higher or mean diastolic blood pressure of 90 mm Hg or higher.
Statistical methods The eligible sample for all four
survey periods consisted of 51,722 persons of all ages, and the examined sample consisted of 39,832, giving an examined response rate of 77%. Of 22,224 examined adults aged 18 and over, the final analytic sample with complete data was 19,921 after exclusion of 916 persons with missing data for all measured systolic or diastolic blood pressure, 397 persons who had all diastolic blood pressure measurements recorded as zero, and 990 women who were pregnant at the time of the exam. Sample sizes for all analyses are provided in the Table in ‘‘Technical Notes.’’
Analyses were conducted using SAS (version 9.2; SAS Institute, Cary, NC) and SUDAAN (version 10.0; Research Triangle Institute, Research Triangle Park, NC) with examined sample weights and sample design variables to produce nationally representative estimates and standard error estimates that account for the clustered design (14). All means presented were adjusted for age except for age-specific means. Age adjustment was performed by the direct method using the 2000 U.S. population with the following three age groups: 18–39 years, 40–59 years, and 60 years and over (15). To graphically display distributions of mean blood pressure, two smoothing algorithms were used. For Figures 1 and 2 showing mean blood pressure by age, the LOESS method was used with the
SAS procedure SGPLOT (16). For Figures 5–8, in order to display the distributions of blood pressure by sex, age, and hypertension status, systolic and diastolic blood pressures were smoothed using a nonparametric kernel density estimate with the SAS procedure SGPANEL (16). Differences in the distribution of hypertension status and demographic factors were tested using chi-square statistics with an alpha level of 0.05. Differences between group means were tested using t tests with an alpha level of 0.05 and adjustment for multiple comparisons using the Bonferroni method (17). Trends in age were tested using Satterthwaite-adjusted F statistics from linear regressions and orthogonal quadratic contrasts with an alpha level of 0.05. All differences reported here were statistically significant at the 0.05 alpha level.
Results
Demographic characteristics The distribution of hypertension
status among adults aged 18 and over for the study period from 2001 through 2008 is shown in Table 1 by sex, race or ethnicity, and age. Among men, 71.6% were classified as normotensive, 17.5% as treated hypertensive, and 10.9% as untreated hypertensive. Among women the percentages were 69.7%, 21.5%, and 8.9%, respectively. The distribution of hypertension status was statistically different across sex, race or ethnicity, and age groups. For example, adults aged 18–39 were more likely to be classified as normotensive than those in the two older age groups. Mexican-American adults were more likely to be classified as normotensive than non-Hispanic white or non-Hispanic black adults. Men were more likely to be classified as normotensive than women. With controlled hypertension being defined in this study as reporting use of antihypertensive medication and having measured systolic blood pressure below 140 mm Hg and measured diastolic blood pressure below 90 mm Hg, 11.7% of men and 13.0% of women had controlled hypertension. The low percentage of treated hypertensive adults
National Health Statistics Reports n Number 35 n March 25, 2011 Page 3
SOURCE: CDC/NCHS, National Health and Nutrition Examination Survey, 2001–2008.
0
65
80
95
110
125
140
155
170
8378736863585348433833282318
Normal
Treated hypertensive
Untreated hypertensive
Age (years)
Blo
od p
ress
ure
(mm
Hg)
Systolic
Diastolic
Untreated hypertensive
Treated hypertensive
Normal
Figure 1. Mean systolic and diagstolic blood pressure for men aged 18 years and over, by age and hypertension status
SOURCE: CDC/NCHS, National Health and Nutrition Examination Survey, 2001–2008.
0
65
80
95
110
125
140
155
170
8378736863585348433833282318
Blo
od p
ress
ure
(mm
Hg)
Age (years)
Normal
Treated hypertensive
Untreated hypertensive
Normal
Treated hypertensive
Untreated hypertensive
Systolic
Diastolic
Figure 2. Mean systolic and diastolic blood pressure for women aged 18 years and over, by age and hypertension status
180 Men Women Non-Hispanic white Non-Hispanic black Mexican American
0 Total Normal Treated hypertension Untreated hypertension
1Significantly different from women. 2Significantly different from non-Hispanic black adults. 3Significantly different from non-Hispanic white adults. 4Significantly different from Mexican-American adults. SOURCE: CDC/NCHS, National Health and Nutrition Examination Survey, 2001–2008.
Blo
od p
ress
ure
(mm
Hg)
Page 4 National Health Statistics Reports n Number 35 n March 25, 2011
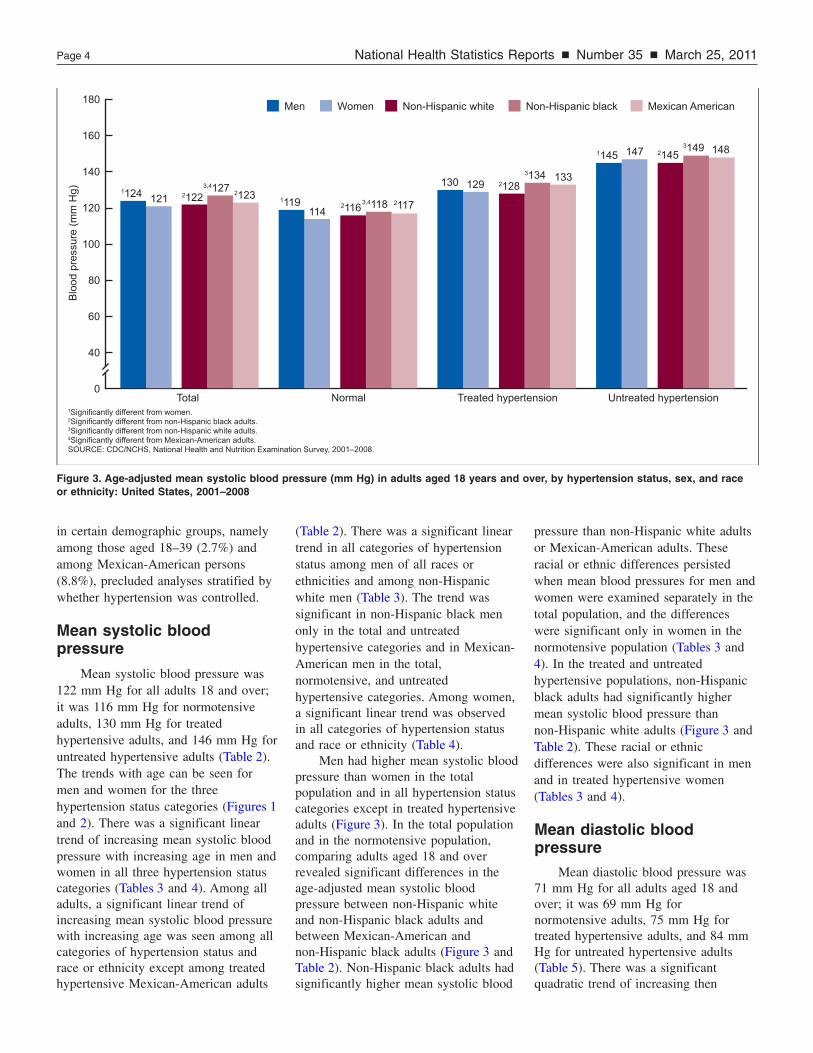
Figure 3. Age-adjusted mean systolic blood pressure (mm Hg) in adults aged 18 years and over, by hypertension status, sex, and race or ethnicity: United States, 2001–2008
in certain demographic groups, namely among those aged 18–39 (2.7%) and among Mexican-American persons (8.8%), precluded analyses stratified by whether hypertension was controlled.
Mean systolic blood pressure
Mean systolic blood pressure was 122 mm Hg for all adults 18 and over; it was 116 mm Hg for normotensive adults, 130 mm Hg for treated hypertensive adults, and 146 mm Hg for untreated hypertensive adults (Table 2). The trends with age can be seen for men and women for the three hypertension status categories (Figures 1 and 2). There was a significant linear trend of increasing mean systolic blood pressure with increasing age in men and women in all three hypertension status categories (Tables 3 and 4). Among all adults, a significant linear trend of increasing mean systolic blood pressure with increasing age was seen among all categories of hypertension status and race or ethnicity except among treated hypertensive Mexican-American adults
(Table 2). There was a significant linear trend in all categories of hypertension status among men of all races or ethnicities and among non-Hispanic white men (Table 3). The trend was significant in non-Hispanic black men only in the total and untreated hypertensive categories and in Mexican-American men in the total, normotensive, and untreated hypertensive categories. Among women, a significant linear trend was observed in all categories of hypertension status and race or ethnicity (Table 4).
Men had higher mean systolic blood pressure than women in the total population and in all hypertension status categories except in treated hypertensive adults (Figure 3). In the total population and in the normotensive population, comparing adults aged 18 and over revealed significant differences in the age-adjusted mean systolic blood pressure between non-Hispanic white and non-Hispanic black adults and between Mexican-American and non-Hispanic black adults (Figure 3 and Table 2). Non-Hispanic black adults had significantly higher mean systolic blood
pressure than non-Hispanic white adults or Mexican-American adults. These racial or ethnic differences persisted when mean blood pressures for men and women were examined separately in the total population, and the differences were significant only in women in the normotensive population (Tables 3 and 4). In the treated and untreated hypertensive populations, non-Hispanic black adults had significantly higher mean systolic blood pressure than non-Hispanic white adults (Figure 3 and Table 2). These racial or ethnic differences were also significant in men and in treated hypertensive women (Tables 3 and 4).
Mean diastolic blood pressure
Mean diastolic blood pressure was 71 mm Hg for all adults aged 18 and over; it was 69 mm Hg for normotensive adults, 75 mm Hg for treated hypertensive adults, and 84 mm Hg for untreated hypertensive adults (Table 5). There was a significant quadratic trend of increasing then
National Health Statistics Reports n Number 35 n March 25, 2011 Page 5
100
80
60
40
20
0 1Significantly different from women. 2Significantly different from non-Hispanic black adults. 3Significantly different from non-Hispanic white adults. 4Significantly different from Mexican-American adults. SOURCE: CDC/NCHS, National Health and Nutrition Examination Survey, 2001–2008.
Women Men Non-Hispanic black Mexican AmericanNon-Hispanic white
Figure 4. Age-adjusted mean diastolic blood pressure (mm Hg) in adults aged 18 years and over, by hypertension status, sex, and race or ethnicity: United States, 2001–2008
decreasing mean diastolic blood pressure with increasing age among men and women in all three hypertension status categories (Figures 1 and 2 and Tables 6 and 7). After stratification by race or ethnicity, the significant quadratic trend persisted in all racial or ethnic groups in the three hypertension status categories except in treated hypertensive non-Hispanic black and Mexican-American men (Table 6). In some instances, the curvilinear trend was flat in the two younger age groups and decreased in the older age group, as seen in treated hypertensive non-Hispanic white men. Among women, the significant quadratic trend of increasing then decreasing mean diastolic blood pressure with increasing age persisted after stratification by race or ethnicity in the total population and in normotensive women but was significant only in non-Hispanic white women in the treated and untreated hypertensive populations (Table 7).
In the total and normotensive populations, men had significantly higher mean diastolic blood pressure than women (Figure 4). Examination of
the total population without regard to hypertension status showed significant racial or ethnic differences in mean diastolic blood pressure (Table 5). Non-Hispanic white and Mexican-American adults had significantly lower mean diastolic blood pressure than non-Hispanic black adults (Figure 4 and Table 5). This was also true when mean diastolic blood pressure was examined for men and women separately (Tables 6 and 7). After stratification by hypertension status, significant racial or ethnic differences were seen only in the treated hypertensive population. Non-Hispanic black adults had higher mean diastolic blood pressure than non-Hispanic white adults (Figure 4 and Table 5). The difference was significant in women but not in men (Tables 6 and 7).
Distribution of systolic and diastolic blood pressure
Tables 8–13 present estimated percentiles of systolic and diastolic blood pressure for sex, race or ethnicity, age, and hypertension status categories.
For treated hypertensive persons, the 75th percentile estimates were above the hypertension cutpoint of 140 mm Hg systolic blood pressure for non-Hispanic white adults aged 60 and over and for non-Hispanic black and Mexican-American adults aged 40–59 and aged 60 and over. Similar patterns were seen in the systolic blood pressure distributions after stratification by sex. In the untreated hypertensive adults, the 25th or 50th percentile estimates were above the systolic blood pressure cutpoint of 140 mm Hg.
As expected based on the definitions used in this report, the distribution of systolic blood pressure was below the hypertension cutpoint of 140 mm Hg for the normotensive population (Figures 5 and 6). The distribution of systolic blood pressure for treated hypertensive adults extends on both sides of the cutpoint. The distribution of systolic blood pressure in the untreated hypertensive population appears somewhat skewed to the right in two age groups, 40–59 years and 60 years and over. The distribution of diastolic blood pressure for treated and
NOTE: Vertical dashed rule is the systolic hypertension cutpoint. SOURCE: CDC/NCHS, National Health and Nutrition Examination Survey, 2001–2008.
Figure 5. Mean systolic blood pressure for men aged 18 years and over, by age and hypertension status
Figure 6. Mean systolic blood pressure for women aged 18 years and over, by age and hypertension status
untreated hypertensive men and women indicates that the distributions are centered below the hypertension cutpoint of 90 mm Hg (Figures 7 and
ConclusionsIn the U.S. population in 2001–
8). This is supported by the estimated medians for these groups: 74 mm Hg for treated men and 87 mm Hg for untreated men; 71 mm Hg for treated women and 80 mm Hg for untreated women.
2008, differences were seen in the mean blood pressures of adults in the demographic subgroups examined. The patterns of these differences varied by hypertension status. As might be expected, mean blood pressures were lowest for normotensive adults, followed by treated hypertensive adults, with untreated hypertensive adults having the highest mean blood pressures. There was a trend of increasing systolic blood pressure with increasing age, whereas mean diastolic blood pressure increased then decreased with age in men and women. The results showed a higher mean blood pressure in non-Hispanic black than non-Hispanic white adults; this was true for systolic blood pressure in all three hypertension status categories but for diastolic blood pressure only in treated hypertensive adults.
Some of the differences observed in blood pressure are similar to results published using earlier NHANES data. The trends in blood pressure with age can vary between populations (18). The rise in systolic blood pressure with age in the U.S. population was documented using NHANES III, 1988–1994 data (19). The authors also documented a rise in mean diastolic blood pressure from early adulthood until about age 60, with a decline in mean diastolic blood pressure from about age 60 and over.
JNC 7 noted the importance of achieving a downward shift in the population distribution of blood pressure, to reduce morbidity and
18–39 years 40–59 years 60 years and over 0.05 0.04 0.03 0.02 0.01 0.00 0.05 0.04 0.03 0.02 0.01 0.00 0.05 0.04 0.03 0.02 0.01 0.00
NOTE: Vertical dashed rule is the diastolic hypertension cutpoint. SOURCE: CDC/NCHS, National Health and Nutrition Examination Survey, 2001–2008.
Figure 7. Mean diastolic blood pressure for men aged 18 years and over, by age and hpertension status
Figure 8. Mean diastolic blood pressure for women aged 18 years and over, by age and hypertension status
mortality related to hypertension (3). The present results provide detailed reference data from a nationally representative survey, which can be used for comparison with other studies. These estimates of the distribution of blood pressure for population subgroups may be useful for policy makers considering ways to achieve this goal.
References 1. National Center for Health Statistics.
Health, United States, 2009: With special feature on medical technology. Hyattsville, MD. 2010. Available from: http://www.cdc.gov/ nchs/hus.htm.
2. Yoon SS, Ostchega Y, Louis T. Recent trends in the prevalence of high blood pressure and its treatment and control, 1999–2008. NCHS Data Brief, no 48. Hyattsville, MD: National Center for Health Statistics. 2010. Available from: http:// www.cdc.gov/nchs/data/databriefs/ db48.pdf.
3. Chobanian AV, Bakris GL, Black HR, Cushman WC, Green LA, Izzo JL Jr, et al. Seventh report of the Joint National Committee on Prevention, Detection, Evaluation, and Treatment of High Blood Pressure. Hypertension 42(6):1206– 52. 2003.
4. National Center for Health Statistics. NHANES 2001–2002 public data general release file documentation. Hyattsville, MD. 2004. Available from: http://www.cdc.gov/nchs/data/ nhanes/nhanes_01_02/general_ data_release_doc.pdf.
5. National Center for Health Statistics. NHANES 2003–2004 public data general release file documentation. Hyattsville, MD. 2005. Available from: http://www.cdc.gov/nchs/data/ nhanes/nhanes_03_04/general_data_ release_doc_03-04.pdf.
6. National Center for Health Statistics. NHANES 2005–2006 public data general release file documentation. Hyattsville, MD. 2005. Available from: http://www.cdc.gov/nchs/data/ nhanes/nhanes_05_06/general_data_ release_doc_05_06.pdf.
Page 8 National Health Statistics Reports n Number 35 n March 25, 2011
7. National Center for Health Statistics. NHANES 2007–2008 public data general release file documentation. Hyattsville, MD. 2009. Available from: http://www.cdc.gov/nchs/ nhanes/nhanes2007-2008/ generaldoc_e.htm.
8. National Center for Health Statistics. NHANES 2001–2002: Physician examination procedures manual. Hyattsville, MD. 2000. Available from: http://www.cdc.gov/nchs/data/ nhanes/nhanes_01_02/ physician_year_3.pdf.
9. National Center for Health Statistics. NHANES 2003–2004: Physician examination procedures manual. Hyattsville, MD. 2003. Available from: http://www.cdc.gov/nchs/data/ nhanes/nhanes_03_04/PE.pdf.
10. National Center for Health Statistics. NHANES 2005–2006: Physician examination procedures manual. Hyattsville, MD. 2004. Available from: http://www.cdc.gov/nchs/data/ nhanes/nhanes_05_06/PE.pdf.
11. National Center for Health Statistics. NHANES 2007–2008: Physician examination procedures manual. Hyattsville, MD. 2007. Available from: http://www.cdc.gov/nchs/data/ nhanes/nhanes_07_08/manual_pe.pdf.
12. Ostchega Y, Prineas RJ, Paulose-Ram R, Grim CM, Willard G, Collins D. National Health and Nutrition Examination Survey 1999–2000: Effect of observer training and protocol standardization on reducing blood pressure measurement error. J Clin Epidemiol 56(8):768–74. 2003.
13. Pickering TG, Hall JE, Appel LJ, Falkner BE, Graves J, Hill MN, et al. Recommendations for blood pressure measurement in humans and experimental animals. Part 1: Blood pressure measurement in humans—A statement for professionals from the Subcommittee of Professional and Public Education of the American Heart Association Council on High Blood Pressure Research. Circulation 111(5):697–716. 2005.
14. National Center for Health Statistics. Analytic and reporting guidelines: The National Health and Nutrition Examination Survey (NHANES). Hyattsville, MD. 2006. Available from: http://www.cdc.gov/nchs/data/ nhanes/nhanes_03_04/nhanes_ analytic_guidelines_dec_2005.pdf.
15. Klein RJ, Schoenborn CA. Age adjustment using the 2000 projected
U.S. population. Healthy People Statistical Notes, no 20. Hyattsville, MD: National Center for Health Statistics. 2001. Available from: http://www.cdc.gov/nchs/data/statnt/ statnt20.pdf.
16. SAS Institute, Inc. SAS/GRAPH 9.2 Statistical graphics procedures guide. 2nd ed. Cary, NC: SAS Institute, Inc. 2010. Available from: http://support. sas.com/documentation/cdl/en/ grstatproc/62603/PDF/default/ grstatproc.pdf.
18. Labarthe DR. Epidemiology and prevention of cardiovascular diseases: A global challenge. Gaithersburg, MD: Aspen Publishers. 1998.
19. Burt VL, Whelton P, Roccella EJ, Brown C, Cutler JA, Higgins M, et al. Prevalence of hypertension in the U.S. adult population: Results from the Third National Health and Nutrition Examination Survey, 1988–1991. Hypertension 25(3):305– 13. 1995.
National Health Statistics Reports n Number 35 n March 25, 2011 Page 9
Table 1. Hypertension status among adults aged 18 and over, by sex, race or ethnicity, and age: United States, National Health and Nutrition Examination Survey, 2001–2008
Hypertension status
Normal Treated Untreated
Total sample Sample Standard Sample Standard Sample Standard
1p < 0.05 for a chi square test of the distribution of hypertension categories across the demographic trait.
Table 2. Mean systolic blood pressure (mm Hg) and standard error of the mean among adults aged 18 and over, by hypertension status, race or ethnicity, and age: United States, National Health and Nutrition Examination Survey, 2001–2008
Hypertension status
Total Normal Treated Untreated
Standard Standard Standard Standard Characteristic Mean error Mean error Mean error Mean error
1p < 0.05 for a test of linear trend across age groups. 2p < 0.05 for a test of difference from non-Hispanic black adults (adjusted for multiple comparisons). 3p < 0.05 for a test of difference from non-Hispanic white adults (adjusted for multiple comparisons). 4p < 0.05 for a test of difference from Mexican-American adults (adjusted for multiple comparisons).
Page 10 National Health Statistics Reports n Number 35 n March 25, 2011
Table 3. Mean systolic blood pressure (mm Hg) and standard error of the mean among men aged 18 and over, by hypertension status, race or ethnicity, and age: United States, National Health and Nutrition Examination Survey, 2001–2008
Hypertension status
Total Normal Treated Untreated
Standard Standard Standard Standard Characteristic Mean error Mean error Mean error Mean error
1p < 0.05 for a test of linear trend across age groups. 2p < 0.05 for a test of difference from non-Hispanic black adults (adjusted for multiple comparisons). 3p < 0.05 for a test of difference from non-Hispanic white adults (adjusted for multiple comparisons). 4p < 0.05 for a test of difference from Mexican-American adults (adjusted for multiple comparisons).
National Health Statistics Reports n Number 35 n March 25, 2011 Page 11
Table 4. Mean systolic blood pressure (mm Hg) and standard error of the mean among women aged 18 and over, by hypertension status, race or ethnicity, and age: United States, National Health and Nutrition Examination Survey, 2001–2008
Hypertension status
Total Normal Treated Untreated
Standard Standard Standard Standard Characteristic Mean error Mean error Mean error Mean error
1p < 0.05 for a test of linear trend across age groups. 2p < 0.05 for a test of difference from non-Hispanic black adults (adjusted for multiple comparisons). 3p < 0.05 for a test of difference from non-Hispanic white adults (adjusted for multiple comparisons). 4p < 0.05 for a test of difference from Mexican-American adults (adjusted for multiple comparisons).
Page 12 National Health Statistics Reports n Number 35 n March 25, 2011
Table 5. Mean diastolic blood pressure (mm Hg) and standard error of the mean among adults aged 18 and over, by hypertension status, race or ethnicity, and age: United States, National Health and Nutrition Examination Survey, 2001–2008
Hypertension status
Total Normal Treated Untreated
Standard Standard Standard Standard Characteristic Mean error Mean error Mean error Mean error
1p < 0.05 for a test of linear trend across age groups. 2p < 0.05 for a test of difference from non-Hispanic black adults (adjusted for multiple comparisons). 3p < 0.05 for a test of difference from non-Hispanic white adults (adjusted for multiple comparisons). 4p < 0.05 for a test of difference from Mexican-American adults (adjusted for multiple comparisons).
National Health Statistics Reports n Number 35 n March 25, 2011 Page 13
Table 6. Mean diastolic blood pressure (mm Hg) and standard error of the mean among men aged 18 and over, by hypertension status, race or ethnicity, and age: United States, National Health and Nutrition Examination Survey, 2001–2008
Hypertension status
Total Normal Treated Untreated
Standard Standard Standard Standard Characteristic Mean error Mean error Mean error Mean error
1p < 0.05 for a test of linear trend across age groups. 2p < 0.05 for a test of difference from non-Hispanic black adults (adjusted for multiple comparisons). 3p < 0.05 for a test of difference from non-Hispanic white adults (adjusted for multiple comparisons). 4p < 0.05 for a test of difference from Mexican-American adults (adjusted for multiple comparisons).
Page 14 National Health Statistics Reports n Number 35 n March 25, 2011
Table 7. Mean diastolic blood pressure (mm Hg) and standard error of the mean among women aged 18 and over, by hypertension status, race or ethnicity, and age: United States, National Health and Nutrition Examination Survey, 2001–2008
Hypertension status
Total Normal Treated Untreated
Standard Standard Standard Standard Characteristic Mean error Mean error Mean error Mean error
1p < 0.05 for a test of linear trend across age groups. 2p < 0.05 for a test of difference from non-Hispanic black adults (adjusted for multiple comparisons). 3p < 0.05 for a test of difference from non-Hispanic white adults (adjusted for multiple comparisons). 4p < 0.05 for a test of difference from Mexican-American adults (adjusted for multiple comparisons).
National H
ealth Statistics R
eports n N
umber 35
n March 25, 2011
Page 15
Table 8. Selected percentiles of systolic blood pressure (mm Hg) for adults aged 18 and over, by hypertension status, race or ethnicity, and age: United States, National Health and Nutrition Examination Survey, 2001–2008
Hypertension status
Total percentile Normal percentile Treated percentile Untreated percentile
* Statistic was deemed unreliable based on sample size criteria.
Page 16
National H
ealth Statistics R
eports n N
umber 35
n March 25, 2011
Table 9. Selected percentiles of systolic blood pressure (mm Hg) for men aged 18 and over, by hypertension status, race or ethnicity, and age: United States, National Health and Nutrition Examination Survey, 2001–2008
Hypertension status
Total percentile Normal percentile Treated percentile Untreated percentile
* Statistic was deemed unreliable based on sample size criteria.
National H
ealth Statistics R
eports n N
umber 35
n March 25, 2011
Page 17
Table 10. Selected percentiles of systolic blood pressure (mm Hg) for women aged 18 and over, by hypertension status, race or ethnicity, and age: United States, National Health and Nutrition Examination Survey, 2001–2008
Hypertension status
Total percentile Normal percentile Treated percentile Untreated percentile
* Statistic was deemed unreliable based on sample size criteria.
Page 18
National H
ealth Statistics R
eports n N
umber 35
n March 25, 2011
Table 11. Selected percentiles of diastolic blood pressure (mm Hg) for adults aged 18 and over, by hypertension status, race or ethnicity, and age: United States, National Health and Nutrition Examination Survey, 2001–2008
Hypertension status
Total percentile Normal percentile Treated percentile Untreated percentile
* Statistic was deemed unreliable based on sample size criteria.
National H
ealth Statistics R
eports n N
umber 35
n March 25, 2011
Page 19
Table 12. Selected percentiles of diastolic blood pressure (mm Hg) for men aged 18 and over, by hypertension status, race or ethnicity, and age: United States, National Health and Nutrition Examination Survey, 2001–2008
Hypertension status
Total percentile Normal percentile Treated percentile Untreated percentile
* Statistic was deemed unreliable based on sample size criteria.
Page 20
National H
ealth Statistics R
eports n N
umber 35
n March 25, 2011
Table 13. Selected percentiles of diastolic blood pressure (mm Hg) for women aged 18 and over, by hypertension status, race or ethnicity, and age: United States, National Health and Nutrition Examination Survey, 2001–2008
Hypertension status
Total percentile Normal percentile Treated percentile Untreated percentile
* Statistic was deemed unreliable based on sample size criteria.
National Health Statistics Reports n Number 35 n March 25, 2011 Page 21
Technical Notes
Table. Sample sizes for adults aged 18 and over, by hypertension status, race or ethnicity, and age: United States, National Health and Nutrition Examination Survey, 2001–2008
Page 22 National Health Statistics Reports n Number 35 n March 25, 2011
Table. Sample sizes for adults aged 18 and over, by hypertension status, race or ethnicity, and age: United States, National Health and Nutrition Examination Survey, 2001–2008—Con.
Page 24 National Health Statistics Reports n Number 35 n March 25, 2011
Affiliation Note Dr. Wright is currently affiliated with the Epidemiology Branch, Division of Cardiovascular Sciences, National Heart, Lung, and Blood Institute, National Institutes of Health, Bethesda, Maryland.
Suggested citation
Wright JD, Hughes JP, Ostchega Y, et al. Mean systolic and diastolic blood pressure in adults aged 18 and over in the United States, 2001–2008. National health statistics reports; no 35. Hyattsville, MD: National Center for Health Statistics. 2011.
Copyright information
All material appearing in this report is in the public domain and may be reproduced or copied without permission; citation as to source, however, is appreciated.
National Center for Health Statistics
Edward J. Sondik, Ph.D., Director Jennifer H. Madans, Ph.D., Associate Director
for Science
Division of Health and Nutrition Examination Surveys
Clifford L. Johnson, M.S.P.H., Director
U.S. DEPARTMENT OF HEALTH & HUMAN SERVICES
Centers for Disease Control and Prevention National Center for Health Statistics 3311 Toledo Road Hyattsville, MD 20782
FIRST CLASS POSTAGE & FEES PAID
CDC/NCHS PERMIT NO. G-284
OFFICIAL BUSINESS PENALTY FOR PRIVATE USE, $300
To receive this publication regularly, contact the National Center for Health Statistics by calling 1–800–232–4636 E-mail: [email protected] Internet: http://www.cdc.gov/nchs