122
National Parks & Technology by Kaitlin Tripi Justin Polcari Rui Hou Thien Nguyen Thomas Graham Charles Pottow

National Parks & Technology
by Kaitlin Tripi
Justin Polcari Rui Hou
Thien Nguyen Thomas Graham Charles Pottow

National Parks & Technology
An Interactive Qualifying Project
submitted to the Faculty of
WORCESTER POLYTECHNIC INSTITUTE
in partial fulfilment of the requirements for the
degree of Bachelor of Science
by
Kaitlin Tripi
Justin Polcari
Rui Hou
Thien Nguyen
Thomas Graham
Charles Pottow
Date:
August 2020
Report Submitted to:
Professor Frederick Bianchi
Worcester Polytechnic Institute
This report represents work of WPI undergraduate students submitted to the faculty as evidence of a
degree requirement. WPI routinely publishes these reports on its web site without editorial or peer
review. For more information about the projects program at WPI, see
http://www.wpi.edu/Academics/Projects.
i
ABSTRACT
National Parks are facing many challenges in the present day and will face additional
challenges in the future. The goal of this project was to explore the feasibility of using future
advancements in technology to realize a Smart Park Grid, similar to the Smart City Grids
currently in use. This was achieved by investigating the future of data acquisition, sensing and
image capture technologies, data transmission and communication technologies, and analysis
and computational methods that apply to National Park problems. The result of this project was
a recommendation for the structure of a proposed Smart Park Grid for the National Parks.

ii
ACKNOWLEDGEMENTS
Our team would like to thank our advisor, Professor Frederick Bianchi, from Worcester
Polytechnic Institute (WPI) for his guidance and direction as we completed this project virtually
in unprecedented times.
We would also like to acknowledge the numerous previous WPI Interactive Qualifying
Projects (IQPs) that have been done on the topic of National Parks and technology including,
but not limited to, Intelligent Transportation in Acadia National Park (07/2017), Preparing
Acadia National Park for Modern Tourist Congestion (07/2017), Cellular Connectivity in Acadia
National Park (08/2018), Implementation and Design of Webcam Systems for Traffic Monitoring
in Acadia National Park (08/2019), and Integrating Technology Into Glacier National Park's
Common Loon Citizen Science Project (10/2019).

iii
AUTHORSHIP PAGE
Kaitlin Tripi, Justin Polcari, Rui Hou, Thien Nguyen, Thomas Graham, and Charles Pottow
all contributed to the research and writing of this report. The following is a breakdown of how
the report was written for this project.
Kaitlin Tripi contributed to this report by writing the Abstract, the Executive Summary,
the majority of the Introduction Chapter, sections of the Background Chapter, sections of the
Methodology Chapter, half of the Analysis Chapter, half of the Conclusion and
Recommendations Chapter, and all of the References. Additionally, Ms. Tripi performed a
thorough review of the paper, comprehensively edited the paper for grammar, content, and
flow, and formatted the entire paper into a single cohesive document.
Justin Polcari contributed to this report by writing sections of the Introduction Chapter,
sections of the Background Chapter, sections of the Methodology Chapter, half of the Analysis
Chapter, and half of the Conclusion and Recommendations Chapter. Additionally, Mr. Polcari
performed a review of the paper and edited the paper for grammar, content, and flow.
Rui Hou contributed to this report by writing sections of the Background Chapter and sections
of the Methodology Chapter.
Thien Nguyen contributed to this report by writing a section of the Background Chapter
and sections of the Methodology Chapter.
Thomas Graham contributed to this report by writing a section of the Background
Chapter and a couple sections of the Methodology Chapter.
Charles Pottow contributed to this report by writing the invasive species case study in
the Analysis Chapter.

iv
EXECUTIVE SUMMARY
The National Parks of the United States are presently facing many challenges which
stem from funding, visitors, upkeep, and wildlife living on park lands. It is also anticipated that
the National Parks will face additional challenges in the next 25 years that deal with the
deteriorating connection between younger audiences and the outdoors, the need to
accommodate a growing diversity among park goers, and other environmental issues
(Repanshek, 2011). In particular, the National Parks must meet these challenges while facing
problems with efficiently managing their assets, resources, and services.
A previous approach that has been taken to solve these issues is to begin the process of
turning National Parks into “Smart Parks” through the use of advanced technologies. There are
examples of National Parks that have started this transition, and have demonstrated some
degree of technological transformation, but there are still other parks that have not even
begun.
Although these particular methods may be beneficial to National Parks, they do not
address all the problems that National Parks face nor do they provide the parks with the highest
quality results possible. Different approaches that are based on future advancements in
cameras, image processing, sensing, and satellite technologies may be available to parks in the
upcoming years to better satisfy National Park needs and address more issues.
The goal of this project was to explore the feasibility of using future advancements in
technology to realize a Smart Park Grid, similar to the Smart City Grids currently in use. The
objectives of this research were threefold:
1) to explore the future of data acquisition, sensing, and image capture technology
relevant to National Park problems.
2) to explore the future of data transmission and communication technology for a
National Park Smart Grid.
3) to explore the future of analysis and computational methods to transform large sets
of data acquired from the sensors into valuable insights that the National Parks
could use to make the most advantageous decisions regarding the challenges they
face.
These objectives were realized through utilizing the Smart City model method to result
in a recommendation for the structure of a proposed Smart Park Grid for the National Parks.

v
FINAL RECOMMENDATIONS
Based on our findings from reliable sources such as peer-reviewed papers, government
sources including the National Park Service, and information published by well-known park
related organizations and companies such as SpaceX, we recommend the following three layer
structure and its components for the future Smart Park Grid:
Perception Layer
• We recommend that the perception layer of the future Smart Park Grid be composed of
future AI-enabled cameras that use edge computing. To acquire all the necessary data
to be applied to National Park issues, these cameras can perform remote sensing from
on the ground, in the air on unmanned aerial vehicles (UAVs), such as drones and
robotic insects, and in space on satellites.
Network Layer
• We recommend that the network layer of the future Smart Park Grid be composed of a
future satellite network, such as Starlink. This network transmits the collected data to
the next layer of the grid, the application layer.
Application Layer
• We recommend that the application layer of the future Smart Park Grid use the future
Cloud to transform the acquired data into valuable insights for National Parks to use by
performing future big data analysis, cloud processing, and predictive analysis methods.
The future Cloud will also store all of the necessary software and the collected data for
the grid.

vi
TABLE OF CONTENTS
ABSTRACT ......................................................................................................................................... i ACKNOWLEDGEMENTS ....................................................................................................................ii AUTHORSHIP PAGE ......................................................................................................................... iii EXECUTIVE SUMMARY .................................................................................................................... iv
FINAL RECOMMENDATIONS ........................................................................................................ v
TABLE OF CONTENTS....................................................................................................................... vi TABLE OF FIGURES ........................................................................................................................ viii TABLE OF TABLES .......................................................................................................................... viii CHAPTER 1: INTRODUCTION ........................................................................................................... 1
CHAPTER 2: BACKGROUND ............................................................................................................. 4
2.1: History of the National Parks ............................................................................................... 4
2.2: Overview of National Park Problems ................................................................................... 5
2.2.1: Climate Change .............................................................................................................. 5
2.2.2: Sea Level Rise................................................................................................................. 6
2.2.3: Air Pollution ................................................................................................................... 7
2.2.4: Light Pollution .............................................................................................................. 10
2.2.5: Water Pollution ........................................................................................................... 10
2.2.6: Waste Management .................................................................................................... 11
2.2.7: Repair and Maintenance ............................................................................................. 11
2.2.8: Invasive Species ........................................................................................................... 12
2.2.9: Lack of Diversity ........................................................................................................... 13
2.2.10: Visitor Experience ...................................................................................................... 14
2.3: Smart City Model Approach ............................................................................................... 16
2.3.1: Discussed Terms and Definitions ................................................................................. 16
2.3.2: How the Smart City Model Can Be Applied to National Parks .................................... 20
2.3.3: Smart Grids .................................................................................................................. 21
2.3.3.1: Trends of Sensor Technology ................................................................................ 21
2.4: Points of Consensus and Debate Pertaining to National Parks ......................................... 22
2.4.1: Smart Parks Agreed Upon as a Methodology to Solve National Park Issues .............. 22
2.4.2: The Debate of Technology in National Parks .............................................................. 23
2.4.3: The Debate of Data Security ........................................................................................ 23
2.5: Previous Findings and Defining Success for National Park Efforts .................................... 24
CHAPTER 3: METHODLOGY ........................................................................................................... 25
3.1: A Future Smart Grid for National Parks ............................................................................. 25
3.1.1: Smart Park Grid Structure ........................................................................................... 25
3.1.2: Future Park Data Acquisition Methods ....................................................................... 27
3.1.2.1: Future of AI for Cameras....................................................................................... 27
3.1.2.2: Remote Sensing From Satellites ........................................................................... 28

vii
3.1.2.3: Remote Sensing From on the Ground .................................................................. 31
3.1.2.4: Advancements in AI-Enabled Cameras ................................................................. 33
3.1.2.5: How Devices Can Be Applied to National Park Issues .......................................... 34
3.1.3: Future of Data Transmission for Parks ........................................................................ 42
3.1.3.1: 5G and High-Speed Mobile Networks .................................................................. 42
3.1.3.2: The Future of Cell Towers ..................................................................................... 43
3.1.3.3: Future Satellite Networks Overview ..................................................................... 43
3.1.3.4: Starlink vs. 5G ....................................................................................................... 48
3.1.4: Future of Big Data Analysis .......................................................................................... 49
3.1.4.1: The Cloud and Cloud Computing .......................................................................... 49
3.1.4.2: Edge Computing .................................................................................................... 51
3.1.4.3: Big Data Analysis and Predictive Analysis ............................................................. 51
3.2: How Future Technologies Will Be Powered ....................................................................... 52
CHAPTER 4: ANALYSIS ................................................................................................................... 56
4.1: Why Future Technologies Are Heading in This Direction .................................................. 56
4.1.1: Moore’s Law and Neven’s Law .................................................................................... 56
4.2: Future Costs for National Parks ......................................................................................... 58
4.2.1: What Future Sensors Will Potentially Cost ................................................................. 58
4.2.2: What Will the Starlink Network Cost for Parks to Use ................................................ 58
4.3: Problems, Challenges, Limitations, and Flaws of This Research ........................................ 59
4.4: Further Debates Pertaining to Technology in National Parks ............................................ 60
4.4.1: The Impact of Satellites ............................................................................................... 60
4.5: Invasive Species: A Case Study ........................................................................................... 63
CHAPTER 5: CONCLUSIONS AND RECOMMENDATIONS ............................................................. 102
Final Recommendations .......................................................................................................... 102
Concluding Remarks ................................................................................................................ 103
CHAPTER 6: REFERENCES ............................................................................................................ 104

viii
TABLE OF FIGURES
Figure 1: Satellite Laser Altimeter ................................................................................................................. 7
Figure 2: Electrochemical Sensor .................................................................................................................. 8
Figure 3: Photoionization Sensor .................................................................................................................. 9
Figure 4: Air Quality Graph of National Parks ............................................................................................... 9
Figure 5: Difference in the Numbers of Visitors Off Trails in Level 2 vs. Level 5 ........................................ 15
Figure 6: Diagram of a Smart City ............................................................................................................... 17
Figure 7: Another Diagram of a Smart City ................................................................................................. 18
Figure 8: Smart Grid Overview .................................................................................................................... 19
Figure 9: Smart Grid Components .............................................................................................................. 20
Figure 10: Smart Park Grid Structure .......................................................................................................... 26
Figure 11: AI-Enabled Image Sensor ........................................................................................................... 28
Figure 12: Remote Sensing Satellites .......................................................................................................... 29
Figure 13: Previous Satellite Image Resolution of One Meter .................................................................... 30
Figure 14: 25-Centimeter Resolution Satellite Image ................................................................................. 30
Figure 15: Autonomous Drone Insect Technology ..................................................................................... 32
Figure 16: Example Screenshots of the Algorithm Spotting a Human (left), an Elephant (center), and a
Vehicle (right) .............................................................................................................................................. 34
Figure 17: A FLIR Camera ............................................................................................................................ 35
Figure 18: Two Experiments Detecting Floating Debris (a) and Salient Waters (b) in a Pond .................... 37
Figure 19: How a SWIR Camera Multispectral System Works .................................................................... 39
Figure 20: The Vehicle's Appearance and the Process of This Research .................................................... 40
Figure 21: AI-Enabled Cameras Potential Usages for Retail Facilities ........................................................ 41
Figure 22: Two Starlink Satellites in LEO ..................................................................................................... 44
Figure 23: Stimulation of a Potential Satellite Constellation for Starlink ................................................... 45
Figure 24: Starlink Satellites in LEO Compared to Other Satellite Orbits ................................................... 46
Figure 25: 60 Starlink Satellites Packed into a Falcon 9 Nose Cone ........................................................... 47
Figure 26: The Exterior of a Falcon 9 Nose Cone ........................................................................................ 47
Figure 27: SpaceX Spacecraft with a Falcon 9 Nose Cone on Top .............................................................. 48
Figure 28: AI, Machine Learning, and Big Data on a Venn Diagram ........................................................... 50
TABLE OF TABLES
Table 1: Major Characteristics of Different Types of Batteries ................................................................... 53

1
CHAPTER 1: INTRODUCTION
The National Parks of the United States may appear issue free from the perspective of
the general population; however, they are actually facing many challenges. Currently, the
National Parks are dealing with challenges which stem from funding, visitors, upkeep, and
wildlife living on park lands. Moreover, it is anticipated that the National Parks will face
additional challenges in the next 25 years that deal with the deteriorating connection between
younger audiences and the outdoors, the need to accommodate a growing diversity among
park goers, and other environmental issues (Repanshek, 2011). In particular, National Parks
must meet these challenges while facing problems with efficiently managing their assets,
resources, and services.
A method to solve these issues is to use advanced technologies in the National Parks to
turn them into “Smart Parks.” There are examples of National Parks that have started this
transition, and have demonstrated some degree of technological transformation, but there are
still other parks that have not even begun. Here are a few examples of the many established
approaches that use advanced technologies in National Parks:
Bio Tracking
• One established approach for bio tracking in the parks is the use of directional antennas
that pick up radio signals from traditional VHF devices attached to various animals.
Although this method works, it is inefficient, and rangers still spend many hours tracking
these animals. This also poses a threat to the animals by risking disturbing their natural
behavior (Hodgkinson et al., 2016).
Sensors and Satellites
• With the help of a project called Instant Detect, sensors are used to monitor and protect
wildlife in remote locations, such as in Tsavo West National Park, Kenya. The sensors of
this project connect to satellites, which has allowed for near real-time alerts to be sent
to a central Base Station to analyze wildlife behavior and to rangers in the instance of
poaching threats (Seccombe, 2019).

2
Sensor Technology
• Sensor technology is being used in Khao Yai, Thailand's third largest National Park, which
was turned into a “Smart National Park 4.0” by Thai engineering students in a five-day
hackathon called Top Gun Rally. These students used accelerometers and temperature
sensors attached to trees to detect big animals to prevent wildlife traffic accidents,
rapidly increasing temperatures to prevent forest fires, and major vibrations and/or
shocks to alert park staff of illegal logging for them to intervene (Smart National Park
4.0, 2018).
Long Range Radio (LoRa)
• Another instance is the Smart Park organization using a telecommunication network,
called LoRa, that collects data from sensors around a National Park, such as Akagera
National Park in Rwanda, to apply to wildlife protection, park management, and tourist
safety efforts (Smart Parks, n.d.a).
Although these particular methods may be beneficial to National Parks, they do not address
all the problems that National Parks face, nor do they provide the parks with the highest quality
results possible. Different approaches that are based on future advanced camera, image
processing, sensing, and satellite technologies may be available to parks in the upcoming years
to better satisfy National Park needs and address more issues.
The goal of this project was to explore the feasibility of using future advancements in
technology to realize a Smart Park Grid, similar to the Smart City Grids currently in use. The
objectives of this research were threefold:
1) to explore the future of data acquisition, sensing, and image capture technology
relevant to National Park problems.
2) to explore the future of data transmission and communication technology for a
National Park Smart Grid.
3) to explore the future of analysis and computational methods to transform large sets
of data acquired from the sensors into valuable insights that the National Parks
could use to make the most advantageous decisions regarding the challenges they
face.

3
The development of a National Park Smart Grid could increase the efficiency and
effectiveness of management assets, resources, and services, all of which could maximize the
positive impacts on the National Parks. The possible impacts could include improvements to
wildlife and habitat health, sustainability, and more controlled and expanded public use and
enjoyment of these national assets.

4
CHAPTER 2: BACKGROUND
This chapter contains a brief overview and background of National Parks and the general
problems they face. We then proceed to introduce the sources of these problems, prior
approaches to solving them, and synthesize potential approaches utilizing advanced
technologies and the Smart City model method. Next, we describe consensus and debates
pertaining to what the National Parks should, or should not, be doing regarding handling their
issues. This chapter then concludes with a discussion of previous research and an evaluation of
the National Parks’ efforts to address these issues.
2.1: History of the National Parks
The National Parks are one of the most important parts of American culture and other
cultures around the globe. They have had a significant influence on American history ever since
1872 when the first National Park, Yellowstone, was established by Congress. During the
following years, several more National Parks and monuments were established as a result of
wilderness preservation movements throughout the American West. In 1916, the National Park
Service (NPS) was founded in an effort to consolidate the management of federal parklands
under one agency, and that agency has continued to manage all the U.S. National Parks ever
since. The NPS oversaw 417 parks and monuments as of 2017, which contributed about $35
million annually to the U.S. economy (History.com Editors, 2018).
The National Parks also provide a valuable source of education and entertainment for
the public and are of significant importance to the United States (U.S.) natural environment. As
modernization and technological advances become increasingly fundamental to our life, the
National Parks are presented with new opportunities for future technology applications, as well
as many challenges such as pollution and climate change.
Connectivity is a crucial part of the National Parks’ infrastructure as it allows for public
safety during emergencies and more efficient internal communications within the parks’
management operations. As of 2017, the National Park Service has achieved significant
progress on both cellular coverage and Wi-Fi access. To achieve this, private companies and
partners were encouraged to install cellular equipment, cell towers, and new technologies
within the National Parks. Parks, such as Mount Rainier National Park and Acadia National Park,
have built cell signal boosters in visitor centers and camping grounds, which improved cellular
coverage for both visitors and employees. Over 130 sites provide more Wi-Fi access points in

5
many specific areas, and approximately 50 parks have installed live webcams capable of
broadcasting incredible images of animals and places (McDowall, 2017).
Along with the many benefits of modern technologies, the National Parks are also under
growing pressure from population booms and increasing visitor numbers, which put a greater
strain on the natural environment. In search of possible solutions, innovations such as smart
technologies and the Internet of Things (IoT) could be the key to better protect the
environment and keep pace with future visitor expectations. Through the concept of Smart
Cities and use of advanced technologies, this project hoped to tackle many of the National
Parks’ problems. The idea of a “Smart Park” enhanced by the use of devices with built-in
intelligence could present a new range of options to consider for the future of National Parks
(Lancaster University, 2018).
2.2: Overview of National Park Problems
According to National Geographic, the National Parks are facing many different types of
problems, ranging from climate change to park maintenance (National Geographic, 2010). This
section contains a brief overview of some of the many current and future issues that the
National Parks face, along with their causes and previous approaches that have been taken to
address them.
2.2.1: Climate Change
Climate change and the carbon footprint are two of the biggest issues facing the
National Parks presently, and in years to come. Climate change is the change of regional
climates that is caused mainly by increases in carbon dioxide emissions. The carbon footprint is
a measurement of everything that contributes to the production of carbon dioxide. National
Parks, along with the rest of the planet, will be greatly impacted by climate change. Glaciers,
such as those in Glacier National Park, will melt. Fire seasons will grow both in length and
severity, and native species within the parks will relocate to new areas that have the attributes
of the parks’ previous climate and environment. Changes in temperature and precipitation can
push species out of their previous ranges towards softer temperatures, either upwards in
elevation or northward (National Park Service, n.d.).
Additionally, climate change is a threat to many prominent landscapes within the parks.
For example, Glacier, Grand Teton, and Glacier Bay National Parks could lose their glaciers.

6
Moreover, Death Valley could more than live up to its name—since America’s National Parks
could see temperature increases of 3 to 9 degrees Fahrenheit over the next 80 years (Haiken,
2018).
The issue of climate change has previously been approached through the education of
park goers. For example, “Climate Friendly Parks” workshops are conducted to evaluate the
energy usage within the parks and improve the National Parks’ operations. Current strategies
consist of reducing emissions of carbon dioxide and switching to sustainable energy like wind
and solar. The National Parks have also teamed up with researchers to specifically address the
impacts of climate change on the parks and are training park rangers to assist visitors in
understanding the effects of climate change on the environment. Additionally, independent
research groups have physically ventured out to various National Parks to gather data on
carbon dioxide levels using Nondispersive Infrared (NDIR) carbon dioxide sensors. However,
these approaches only monitor the levels of carbon dioxide and educate park goers of the
implications of climate change (National Park Service, n.d.).
Besides using sensors to detect carbon dioxide, prior studies have used other sensors
such as rain gauges, also known as udometers, which measure the amount of precipitation
falling at a given location and time (Merriam-Webster, n.d.). In one such study right before the
turn of the 20th century, rainfall data from 417 National Park units was collected and analyzed.
The study found that rainfall in the collective National Park area decreased by 12 percent
compared to 3 percent across the rest of the United States (Haiken, 2018). Due to climate
change, a decrease in rainfall could lead to more forest fires and less water flow within the
National Parks.
2.2.2: Sea Level Rise
Sea level rise can be defined by how the water level rises and changes the physical
structure of parks and habitats of species. Sea level rise is an issue that coastal National Parks
have been dealing with, and one that will be even more prominent in the future. With a rise in
sea levels, several National Parks are in danger of being submerged underwater. For example,
Everglades National Park could be submerged in the next 50 years. The National Park Service
released its first-ever report on the impact of sea level rise in 2018, which noted that more than
a quarter of the property managed by the agency along coasts would face serious flooding
(Ebbs, 2018).
For the most part, sea level rise has been measured using tide stations (where radar
measuring tools using microwaves measure the rise and fall of sea levels over time) and

7
satellite laser altimeters, as shown in Figure 1 (Dusto, 2014; National Oceanic and Atmospheric
Administration, 2019). Then the gathered data is used to determine the rate at which sea level
rise is occurring, as well to make predictions for future sea level rise. For National Parks, efforts
have been previously made to monitor sea level rise effects on their lands. Two instance of
these efforts are in Biscayne National Park, Florida, and on the Buck Island Reef National
Monument, in the Virgin Islands, where park scientists are collaborating with non-profit
organizations and university researchers to monitor and assess the populations of threatened
beach-nesting animals by physically going out into the parks and collecting data themselves
(National Park Service, 2019b).
Figure 1: Satellite Laser Altimeter Image source: GLAS Science Team. (2003, Jan). ICESat/GLAS. https://www.csr.utexas.edu/glas/
2.2.3: Air Pollution
More than 96 percent of National Parks assessed in a recent report are “plagued by
significant air pollution problems,” and some of California's most iconic parks are among the
most troubled, according to one of the nation's largest nonprofit conservation associations
(Mcgough, 2019). Power plants and industrial facilities, among other sources, emit
hydrocarbons into the air which are then carried by air currents to other areas, such as the

8
parks, resulting in negative effects. In National Parks, the smog affects nature itself as well as its
visitors. Smog poisons plant life, which in turn affects the region’s entire food chain through a
combination of bioaccumulation and biomagnification, and also hinders and prevents visitors
from viewing nature (National Geographic, 2010). Typically, pollution becomes worse during
the summer, which is when most visitors attend the parks. Reports show unhealthy air
conditions as a result of greater carbon dioxide emissions from the increase in vehicle usage
during this timeframe (National Park Service, 2020a).
Many approaches have been formulated to research and collect data on air pollution;
however, these approaches only show that the issue exists, but do not go about fixing it.
Meteorology parameters have been measured using a variety of sensors and devices depending
on location of interest including: electrochemical sensors to measure NO₂, SO₂, O₃, NO, and CO
(as shown in Figure 2), metal oxide sensors to measure NO₂, O₃, and CO, photoionization
detectors to measure volatile organic compounds (VOCs) (as shown in Figure 3), optical sensors
to sensors to measure CO and CO₂, and optical particle counters to measure particulate matter
(PM) (Gerboles et al., 2017). The collected data is then combined in the form of a graph to
determine the air quality of a specific area, as depicted in Figure 4 (National Park Service, 2002).
Figure 2: Electrochemical Sensor Image source: Membrapor. (n.d.). Electrochemical Gas Sensors
https://www.membrapor.ch/electrochemical-gas-sensors/

9
Figure 3: Photoionization Sensor Image source: EQUIPCO. (n.d.). Introduction to Photoionization.
https://www.equipcoservices.com/support/tutorials/introduction-to-photoionization/
Figure 4: Air Quality Graph of National Parks Image source: National Park Service. (2002, Sept). Air Quality in the National Parks, Second Edition.
http://npshistory.com/publications/air-quality/aqnps-2002.pdf
10
2.2.4: Light Pollution
Light pollution has also contributed to the overall pollution issues facing National Parks.
Light pollution is the inappropriate or excessive use of artificial light which can have serious
environmental consequences for wildlife and the climate of the National Parks. Components of
light pollution include: glare—excessive brightness that causes visual discomfort, skyglow—
brightening of the night sky over inhabited areas, light trespass—light falling where it is not
needed, and clutter—bright and excessive grouping of light sources. Light pollution is especially
notable in Acadia National Park, which is polluted by nearby towns that cause excessive
brightness on the park lands. The International Dark-Sky Association (IDA) has been successful
in limiting the amount of light pollution within the parks. As of 2020, twenty-seven National
Parks have been deemed dark sky parks to preserve the night skies for park goers and for the
parks’ own well beings (International Dark-Sky Association, n.d.).
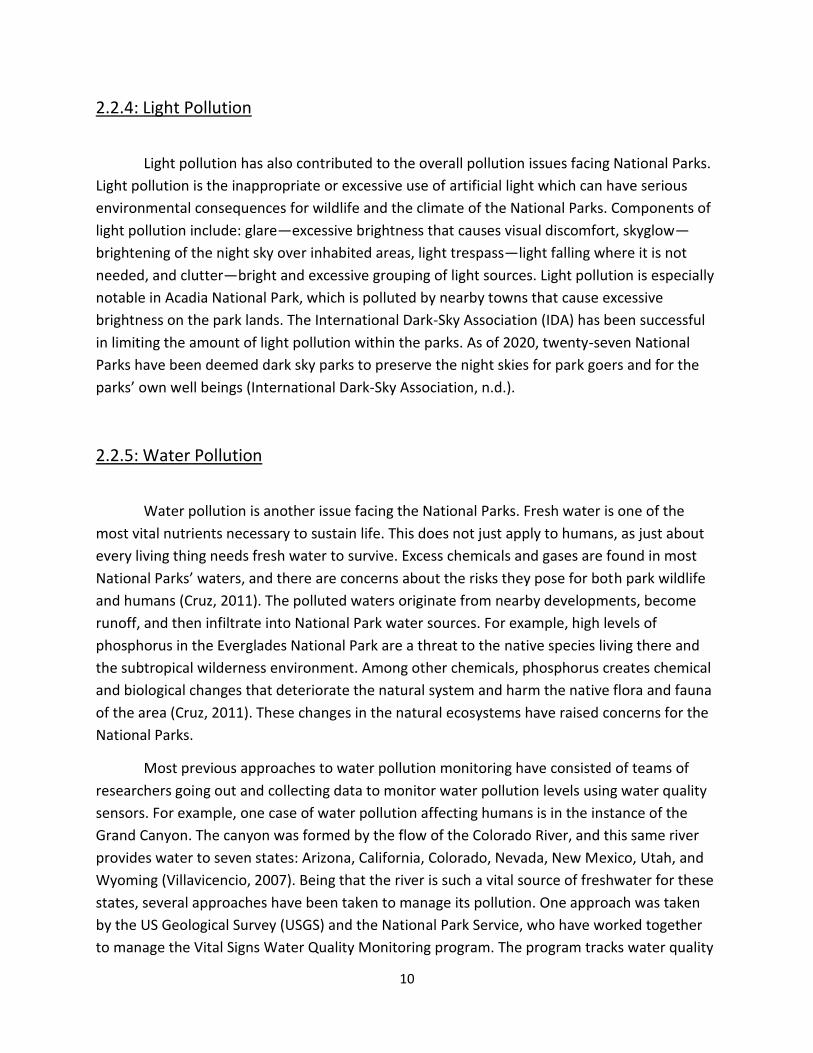
2.2.5: Water Pollution
Water pollution is another issue facing the National Parks. Fresh water is one of the
most vital nutrients necessary to sustain life. This does not just apply to humans, as just about
every living thing needs fresh water to survive. Excess chemicals and gases are found in most
National Parks’ waters, and there are concerns about the risks they pose for both park wildlife
and humans (Cruz, 2011). The polluted waters originate from nearby developments, become
runoff, and then infiltrate into National Park water sources. For example, high levels of
phosphorus in the Everglades National Park are a threat to the native species living there and
the subtropical wilderness environment. Among other chemicals, phosphorus creates chemical
and biological changes that deteriorate the natural system and harm the native flora and fauna
of the area (Cruz, 2011). These changes in the natural ecosystems have raised concerns for the
National Parks.
Most previous approaches to water pollution monitoring have consisted of teams of
researchers going out and collecting data to monitor water pollution levels using water quality
sensors. For example, one case of water pollution affecting humans is in the instance of the
Grand Canyon. The canyon was formed by the flow of the Colorado River, and this same river
provides water to seven states: Arizona, California, Colorado, Nevada, New Mexico, Utah, and
Wyoming (Villavicencio, 2007). Being that the river is such a vital source of freshwater for these
states, several approaches have been taken to manage its pollution. One approach was taken
by the US Geological Survey (USGS) and the National Park Service, who have worked together
to manage the Vital Signs Water Quality Monitoring program. The program tracks water quality

11
and improves impaired water. The National Park Service is integrating the monitoring
component of the program, which has people venture out into the park to collect samples with
sensors. The sensors are being used to monitor mountainous watersheds, amount of water
discharge, water levels, quality, composition, pH levels, and toxins within the water. The
collected data is then used to predict and understand the variability and status of National Park
water resources (National Park Service, 2019c).
2.2.6: Waste Management
Waste management is another issue facing the National Parks. Waste management
consists of the management of trash, recycling material, and other waste that visitors and other
people within the park generate on a daily basis. According to the National Parks Conservation
Association (NPCA), a study conducted by Subaru and the NPCA itself found that many
Americans are unaware of the waste issues facing our National Parks (Murrell, 2016). As more
people continue to visit the parks, an uptick in the amount of trash within the parks can be
certain. Even so, this issue has lacked previous approaches that attempt to fix the issue within
the National Parks, beyond the standard trash and recycling removal that many parks are
participating in currently.
2.2.7: Repair and Maintenance
Repair and maintenance are other serious problems for National Parks. Many National
Parks preserve the landmarks that are from early in our history, and because of some factors,
such as the weather or pollution, the landmarks are getting worn down and need to be
repaired. Not only do the landmarks need repair, but other forms of construction, including
roads, bridges, trails, and campgrounds in the parks need to be repaired as well in order to
keep their workers, visitors, and wildlife safe. The reason why these need to be repaired is that
more than 300 million visitors visit the National Parks each year and use these structures, and
this large amount of use speeds up their aging. In particular, the large number of visitors has
caused park roads to become worn down and damaged with the increase of vehicle usage.
Nowadays, there are more than 5,000 miles of bridges, tunnels, and paved roads in the
National Parks, most of which are being affected in this way. Most park infrastructures have
been used for numerous years, which means they may need to be fixed; however, because of
insufficient funds, many of these infrastructures are not able to get repaired. According to the

12
NPS, a total of $12 billion of needed infrastructure maintenance has been deferred (Argust,
2020).
Park repair and maintenance has always been approached in a slow manner. Previous
methods lacked efficiency and the ability to detect the need for repair in real time. Due to the
budget problems, the NPS needs to be able to decide what should be repaired first (Kaplan,
2019).
2.2.8: Invasive Species
The National Parks are also facing problems caused by invasive species. Invasive species
are species that go from their native lands to different areas, which can be of a similar
ecosystem to that of their native land, or of a different ecosystem where the species is
nonnative. Primarily, invasive species are spread by human activities. During travel, humans
may transport species unintentionally. When invasive species arrive in other lands, they pose a
risk of affecting human health and the new area’s ecosystem. In particular, invasive species
threaten wildlife in National Parks, sometimes even to the point of extinction. Since some
invasive species are carried from one type of ecosystem to a different type of ecosystem, they
may not have any natural predators to control them in the new ecosystem, which means their
populations can grow very quickly there. These species may occupy the natural resources of
native organisms and otherwise harm natural species in addition to spreading foreign diseases.
According to data from the National Parks Service, invasive plants have already spread to cover
roughly 1.4 million acres of National Park lands and water. Additionally, from the USGS
nonindigenous aquatic species database, a survey shows that in 129 parks, 361 aquatic invasive
species have been identified in total (National Park Service, 2019a).
Previous methods of fixing the issue of invasive species have consisted of researchers
manually surveying and collecting data about seen invasive species. These approaches are
highly inefficient, labor intensive, and infrequent since they require human involvement.
Camera traps have also been used to monitor species, but their observational range is limited
to small areas, and most National Parks are large and need more than small areas monitored
(Hodgkinson et al., 2016).

13
2.2.9: Lack of Diversity
Lack of diversity is another problem for the National Parks. CNN’s news segment
"Morgan Spurlock Inside Man,” reported that National Parks have a problem attracting young
people, although the number of visitors was 292.8 million in 2014. The segment also reported
that even with the large number of visitors in total, the number of visitors under age 15 has
decreased in the past 10 years (Outside, 2015).
In 2015, there were 307.2 million recorded visits to the U.S. National Parks, and, in
2016, the number of visitors increased to roughly 331 million. In both cases, the majority of the
visitors were white. The most recent survey commissioned by the NPS was about the
relationship between the parks and visitor population groups. Based on this survey, white and
non-Hispanic visitors accounted for 78 percent of National Park visitors. Although minority
groups made up approximately 36.3 percent of the population of the U.S. in the survey, only 22
percent of National Park visitors were from minority groups. Because National Parks are
dependent on public money and political support for funding, the lack of visitors from these
minority groups may pose a significant concern. Therefore, connecting the public as a whole,
not just their normal demographic of visitors and especially minority groups and the millennial
generations, to the National Parks is essential to the National Park Service’s ability to allow the
parks to thrive in the future (Rott, 2016).
According to a member of the NRPA’s survey, because young people are less willing to
go outside, they rely more on the Internet. Nearly half of parks and recreation agencies use
technology, such as apps, to attract young people (Barss, 2018). One app to solve this problem
is ‘Find Your Park,’ which is a website initiated by National Parks to attract people. On this
website, people can choose the activities they are interested in and the state they live in to find
parks that best fit their personal needs and interests. Also, this website works like social
media. People can upload the photos and/or videos of the park they went to, and the uploads
could potentially be used to attract people. Additionally, Hitrecord, a company of Joseph
Gordon-Levitt’s production company, was hired by the National Park Foundation (NPF) to
record some cool videos about National Parks to attract young people (Caston, 2015). Another
solution is called the Junior Ranger Program. The process of this program is to invite the
youngest visitors to explore their parks and then inspire them to become members of the
National Park Service in the future. This program provides a great opportunity for kids to
explore and become well informed about National Parks. After finishing the program, kids are
honored as Junior Rangers and receive a special certification and Junior Ranger badge (National
Park Foundation, n.d.).

14
2.2.10: Visitor Experience
Visitor experience also poses problems for National Parks. Primarily due to
overcrowding problems, the experience of visiting a park may not be enjoyable. As discussed
earlier, there are more than 300 million visitors that come to the National Parks each year, and
as that number increases, it applies additional pressures on the parks (National Park Service,
2020b). For example, Zion National Park is not very big. The park is less than 150,000 acres and
only has six miles of main road; however, it has more than 4.3 million visitors a year, which is
almost the same number of visitors to the much larger Yellowstone National Park. The
overcrowding problem may overwhelm the infrastructure facilities, affecting the visitor’s
experience (Robbins, 2017). Robert Manning, a member of the Northeastern States Research
Cooperative (NSRC) and a researcher who specializes in parks, did a project about park visitor
experience (Northeastern States Research Cooperative, n.d.b). This project is called Indicators
of Quality for Recreation and Tourism on Mountain Summits. He used photos which display
different numbers of visitors, ecological conditions, and management on the summits, and the
team asked visitors to rate the photos with different indicators of quality, as shown in Figure 5.
According to the research, generally, visitors are more likely to prefer low levels of resource
impact, a smaller number of visitors and low management (Northeastern States Research
Cooperative, n.d.a). The response and study data could formulate indicators and standards of
the quality of National Parks and help parks to improve visitors' experience.

15
Figure 5: Difference in the Numbers of Visitors Off Trails in Level 2 vs. Level 5 Image source: Northeastern States Research Cooperative. (n.d.a). Indicators of Quality for Recreation
and Tourism on Mountain Summits. https://nsrcforest.org/project/indicators-quality-recreation-and-
tourism-mountain-summits
Visitors often find themselves feeling congested within the parks. This is usually due to
the lack of mobility on trails and passageways from overcrowding. This lack of mobility has led
to decreased and unsatisfactory visitor experiences. People visiting the National Parks want an
enjoyable experience, free from the congestion of urban life. Additionally, more people visiting
means more vehicles, which may cause traffic jams, and, in turn, may decrease the satisfaction
of the experience.

16
2.3: Smart City Model Approach
The employing of cameras, sensors, and other devices falls under the Smart City model
approach. Through the framework detailed by the model, Smart Grids and the various
advanced technologies may be used to transform National Parks into Smart Parks, enabling
them to collect data, analyze it, and gain insights to solve and manage National Park issues.
2.3.1: Discussed Terms and Definitions
The following is a list of terms and their associated definitions that are discussed throughout
this section:
The Internet of Things:
• The Internet of Things (IoT) is where everyday objects contain computing devices which
interconnect them all through the Internet, which enables the objects to send and
receive data (Internet of Things, n.d.a; Internet of Things, n.d.b).
Smart Cities:
• Smart Cities is a concept that has yet to be explicitly defined, but cities have been going
in this direction for years. Some cities have individually formulated their own definitions
and then have applied particularities to their respective city. This has resulted in
numerous definitions with different nomenclatures, contexts, and meanings, many of
which are inconsistent with each other. One way to simplistically conceptualize the
phrase is that a Smart City is a city that is both sustainable and livable (Chourabi et al.,
2012). The aspects of current Smart Cities that this paper focuses on are the use of
sensor-equipped devices which pertain to resolving National Park issues and a
communication network (the Smart Grid).
• There are many examples of Smart Cities in real life, and the following are just a few
well known instances. One is Singapore, in southeast Asia, where its government is using
digital advancements to raise productivity in the economy. The National Research
Foundation is developing a dynamic 3D city model and collaborative data platform
called Virtual Singapore for planning purposes, and homes and public areas are
implementing smart technologies. Dubai, in the United Arab Emirates, has plans to have

17
all government services fully digitalized by 2021, has implemented traffic monitoring
systems which have decreased traffic accidents caused by fatigued bus drivers, has
automated police stations to remove the need for extra workers, and hosts numerous
projects that use advanced technologies such as constructing buildings in the Dubai-Abu
Dhabi hyperloop project with 3D printers. Also, the Norwegian capital has made efforts
to cut its emissions by using sensors to control lighting, heating, and cooling in buildings,
by offering incentives for people to own eclectic vehicles, and by utilizing renewable
energy sources (Kosowatz, 2020). Shown in Figure 6 and Figure 7 are a variety of the
technologies used by these Smart Cities, and others, such as smart buildings, smart trash
cans and street lights, bike shares, smart energy, and e-mobility options (Cudden, 2018;
Vanderbilt University School of Engineering, 2019).
Figure 6: Diagram of a Smart City Image source: Vanderbilt University School of Engineering. (2019, Nov 12). Understanding Smart Cities
and Cyber-Physical Systems. https://engineeringonline.vanderbilt.edu/resources/smart-cities-and-
cyberphysical-systems/

18
Figure 7: Another Diagram of a Smart City Image source: Cudden, J. (2018, Feb 1). How smart city technology are supporting Dublin’s
competitiveness. http://www.dublineconomy.ie/2018/02/01/dublin-smart-city/
Smart Grid:
• A Smart Grid (SG) is a grid that uses digital communications technology to detect and
react to local use or demand changes (Smart Grid, n.d.a.; Smart Grid, n.d.b). An
overview of how Smart Grids are powered, how power and information is transmitted,
and what uses its services is shown in Figure 8 (IEEE, n.d.). Figure 9 then depicts a more
detailed diagram of Smart Grids’ generation, transmission and distribution, commercial
and industrial, and residential components (Elprocus, n.d.).

19
Figure 8: Smart Grid Overview Image source: IEEE. (n.d.). The Smart Grid Could Hold the Keys to Electric Vehicles.
https://innovationatwork.ieee.org/the-smart-grid-could-hold-the-keys-to-electric-vehicles/

20
Figure 9: Smart Grid Components Image source: Elprocus. (n.d.). Overview of Smart Grid Technology And Its Operation and Application
(For Existing Power System). https://www.elprocus.com/overview-smart-grid-technology-operation-
application-existing-power-system/
Smart Parks:
• Smart Parks are defined as technology-enhanced parks according to a company called
Soofa, which has been involved in innovating parks since 2014 (Krafcik, 2016).
Essentially, Smart Parks are the Smart City version of a National Park.
2.3.2: How the Smart City Model Can Be Applied to National Parks
The Smart City model approach can be taken to address National Park problems. Smart
Cities use Smart Grids as their data communication networks, and Smart Grids use IoT sensors
that collect data and then analyze the collected data on the grid to gain insights. The analysis
involves applying threshold points, minimum and maximum bounds, and ranges to the data,
and detecting trends to trigger appropriate decision making and/or predetermined actions.
National Parks need that same kind of process: a way to collect data and a way to gain insights
from that data to use to timely manage assets, resources, and services efficiently. By adapting

21
Smart City methodology to suit the needs of the parks, the parks can transform into Smart
Parks.
2.3.3: Smart Grids
There are numerous versions of Smart Grids, but one Smart Grid IoT architecture
consists of three layers. The first layer is the perception layer, which is where data acquisition
occurs. Here, advanced devices perform the various forms of data acquisition for the grid, and
being that it is where the devices reside, this layer is interchangeably called the device layer.
The next level above that is the network layer, which is where data transmission occurs. This
layer is composed of the grid’s communication network, which transmits the data collected in
the perception layer to the next layer: the application layer. The application layer processes the
information received from the network layer to monitor the devices in the perception layer in
real time (Ghasempour, 2019).
2.3.3.1: Trends of Sensor Technology
The field of sensing and data capturing technologies has come a long way in the past
couple years. Sensors have become more efficient, and with the growing market, these
technologies are more available today than ever before. Right now, there are sensors on the
market that serve individual functions, while few sensors have multi-sensor integration. Several
trends have been noted as of recently that elaborate on where sensor technology is heading.
The first key trend is miniaturization; sensors are proliferating across countless applications as
we move to an increasingly connected world. These newer sensor technologies can be small in
size with very low power requirements. The second trend is digitization. As the IoT space
becomes more prevalent, digitization of sensors is vital to keeping up with these new trends.
This means that sensors must be intelligent to not only capture the data, but to interpret the
data for various applications as well. The third and final trend is sensor fusion. Multi-sensor
integration is related directly to IoT proliferation with the idea that everything can and will be
connected. The need to capture multiple types of measurement in extremely small packages is
pushing the development of multi-sensing elements (TE Connectivity, 2020). Currently, several
multi-sensor technologies are on the market right now, with the future of sensor technology on
the forefront of everyone’s minds.

22
2.4: Points of Consensus and Debate Pertaining to National Parks
With these various problems comes consensus and debates pertaining to what the
National Parks should or should not be doing. A general consensus is that National Parks could
use Smart Parks or related technologies as their methodology to solve their issues. The
technology aspect of Smart Parks also leads to debates on whether technology should even be
permitted in the parks, including concerns about data privacy being jeopardized by its use.
2.4.1: Smart Parks Agreed Upon as a Methodology to Solve National Park Issues
The National Park Service, various organizations, projects, and even hackathons have
used the methodology of turning National Parks into Smart Parks to solve park issues. Some of
the parks that have transformed into Smart Parks include: Akagera National Park in Rwanda,
which uses sensors to monitor its wildlife; Liwonde National Park in Malawi, which uses
gateways and sensors to improve park management and protection; Mkomazi National Park in
Tanzania, which uses LoRaWAN sensors implanted into critically endangered black rhinos’ horns
to monitor and protect them from poachers; and the Dutch National Park Zuid-Kennemerland
in the Netherlands, which uses sensors to gather information about the behavior of its large
grazers to help with park management and provide the park with a sustainable balance
between the land, wildlife and people (Smart Parks, 2019; Smart Parks n.d.b; Smart Parks n.d.c;
Smart Parks n.d.d). These parks use IoT sensors to collect data, and then analyze that acquired
data, to make ongoing decisions to help to solve and manage park problems over unbounded
time. The numerous instances of National Parks using this methodology have demonstrated a
consensus that by doing so, they can be successful in solving park problems.
Therefore, when implementing technological approaches such as this one, it is
universally agreed upon to not consider a project complete and successful once it is
operational. The components of the project need to be properly maintained, be able to evolve
with the times, and be able to adapt to suit the changing needs of the parks themselves and of
their visitors. It is also agreed upon that the most beneficial results come from parks, and their
associated services, organizations, etc., collaborating with each other when implementing new
technologies, as with any technological execution (Dellner, 2017).

23
2.4.2: The Debate of Technology in National Parks
There are agreements pertaining to what the National Parks should do, but there
remains a debate on whether additional technology, more than just an occasional streetlamp or
bench, should be implemented into parks at all. Although it is a dwindling number of people
compared to what it once was, consisting mostly of the older generations, there still exists a
more traditional cohort of park professionals and park goers alike who are completely against
having additional technology implemented into National Parks. These people consider the parks
to be sanctuaries where people can escape from technology and be completely unplugged and
disconnected from the world while visiting them (Dellner, 2017; Nuwer, 2013). They want to
enjoy these parks’ quiet and tranquil settings, be close to and focus on nature, and let nature
have its healing effect on them (Dellner, 2017; Levin, 2017).
The counterargument is largely from the younger generations, but still includes a
portion of the older generations, who believe that National Parks should provide various new
technological services. The younger generations desire the modern conveniences of having
access to Wi-Fi and cellular coverage wherever they go to be able to use their technological
devices, wishing to constantly be connected to others through social media sharing. Some
portion of the older generations have realized that not making Wi-Fi and cellular coverage
available in the parks means the younger generations will largely be unengaged with the parks,
since they will not be able to use their devices. Realizing this, they have accepted that National
Parks should pursue new advancements in order to draw the younger generations to be
involved with the parks (Dellner, 2017; Nuwer, 2013). The sharing of photos, videos, and
experiences through social media can engage people who do not normally go to the parks to
visit in order to experience for themselves what they have seen posted online.
2.4.3: The Debate of Data Security
Another aspect to the varying opinions on technology being added to National Parks is
over the security, privacy, and ethical breaching concerns pertaining to the countless forms of
data that would be collected from people by sensors and various other data collection methods
(Lohrmann, 2016). People are concerned that, if the systems do not have strong safeguards,
this will threaten their data privacy, and risk that data collected about their actions in the parks
could be traced back to them and be used to infer very personal information about them, even
if the data appears to be innocuous (Begault & Khazrik, 2019).

24
2.5: Previous Findings and Defining Success for National Park Efforts
The majority of these problems are already being investigated by using sensor
technology to monitor their related variables in National Parks around the world. For example,
in Paris, based on Baron Haussmann's public works project, they are using sensors strategically
placed on park benches to detect the number of visitors (Shacklet, 2019). This data is then
examined, and traffic patterns can be studied. This idea can be used in National Parks to
improve visitor experience. By detecting popular times of use of various attractions, park staff
can use this data to try to formulate ways to spread out people in the parks to reduce crowds.
In this field of work, a successful project is a project that is able to gather and analyze
the necessary data that is required to help assist National Parks with solving these problems.
This means proposing a plan that the National Park Service can use to implement a Smart Grid
design into their own parks. This also means laying out a technological blueprint designed to
suit the needs of the parks for the National Parks to follow directly. The future of the National
Parks is unknown, but it can be understood that preparing and devising a potential plan will
benefit both the infrastructure of the parks and the people that visit in days to come.
The application of future advanced technologies and analysis methods to realize a
National Park Smart Grid should define its goals and success in terms of improvements to the
management and/or elimination of the problems identified previously. For example, for the
issue of climate change: relevant threats/trend concerns should be pinpointed; associated
necessary data (either raw sensor data or edge computing data) and the corresponding sensors
for each park should be identified; and where the sensors should be placed to acquire said data
should also be determined. In addition, it is necessary to ascertain what cloud computing, big
data analysis, and predictive analysis methods should infer from the collected data and define
reaction plans and associated trigger points to which parks can enact said plans. This series of
identifications and determinations provides National Parks with a way to make decisions that
are most effective and efficient in managing the issue of climate change, as it is backed by a
data driven, adjustable process. Similar processes would need to be developed for the other
National Park issues of sea level rise, air pollution, light pollution, water pollution, waste
management, repair and maintenance, invasive species, and the visitor experience. All these
factors would then be combined into a single, optimized plan to suit National Park needs and
limited resources. Once implemented and operational, over time, the plan can be further
improved upon as additional data is collected, by assessing the effects of these efforts on
whether and how much they had a positive or a negative impact towards their associated
goal(s). That is the definition of success for National Park efforts.
25
CHAPTER 3: METHODLOGY
The goal of this project was to explore the feasibility of using future advancements in
technology to realize a National Park Smart Park Grid, similar to the Smart City Grids currently
in use. The following is a list of research objectives that we developed in order to achieve this
goal:
1. Explore the future of data acquisition, sensing and image capture technology relevant to
National Park problems.
2. Explore the future of data transmission and communication technology for a National
Park Smart Grid.
3. Explore the future of analysis and computational methods to transform large sets of
data acquired from the sensors into valuable insights that the National Parks could use
to make the most advantageous decisions regarding the challenges they face.
This chapter describes the Smart Park Grid approach that we took to achieve these three
objectives to solve National Park issues in the future, and then uses the information to
recommend the structure of the proposed Smart Park Grid.
3.1: A Future Smart Grid for National Parks
In this section, we begin with a proposal for the structure of the Smart Park Grid. We then
proceed to delve into the future of National Park data acquisition, data transmission, and big
data analysis methods. This section concludes with a discussion on how the future technologies
will be powered in parks.
3.1.1: Smart Park Grid Structure
Originally, Smart Grids did not have IoT architectures integrated with them. This may
have been the case in the past, but multiple different IoT architectures have been proposed
that will be able to integrate into Smart Grids in the future. To suit the needs of National Parks,

26
IoT-aided, enabled, and connected Smart Grids can be established. These Smart Park Grids will
have IoT architectures that consist of three layers: the perception layer (also known as the
device layer), the network layer, and the application layer.
Figure 10 depicts the recommended final configuration for the Smart Park Grid. As
shown in the figure, the first layer is the device layer, where the AI-equipped cameras reside.
These advanced devices perform the various forms of data acquisition for the grid and perform
edge computing on the data they collect. The next level above that is the network layer, which
is composed of the grid’s communication network. The network will be a satellite constellation,
such as Starlink, which transmits the data collected by the devices to the final layer, the
application layer. In the application layer, the Cloud performs big data analysis on the
transmitted data using cloud computing, big data analysis, and predictive analysis methods to
gain insights to efficiently manage assets, resources, and services in the National Parks.
Figure 10: Smart Park Grid Structure

27
3.1.2: Future Park Data Acquisition Methods
In a Smart Grid for National Parks, the perception layer is where data acquisition occurs.
Here, observational devices on the grid collect data, and since that is where the devices reside,
the layer is interchangeably called the device layer (Ghasempour, 2019). The following section
begins with discussing the future of image capturing technologies and proposes the device that
will do the majority of future data collection. We then proceed to put the observational
technologies into context with remote sensing from satellites and on the ground. Next, the
advancements of future AI-enabled cameras are elaborated upon. This section then concludes
with an overview of how these devices can be applied to National Park problems.
3.1.2.1: Future of AI for Cameras
The future of observational devices for the world at large, and for National Parks, lies
with the advancement of camera technologies. These future cameras will be equipped with
intelligent vision sensors, which will provide the cameras with artificial intelligence (AI)
processing functionality. The image sensors consist of a pixel chip, which acquires a signal, and
a logic chip, which performs data reduction on the acquired data, processing it and extracting
out only the necessary data with their high-speed edge AI processing and extraction capabilities
as depicted in Figure 11. This AI performed data reduction has many benefits when using cloud
services. (These services will be discussed with the future of big analysis later on in this
chapter.) One benefit is that it reduces data transmission latency with the decreased volume of
handled information, which, in turn, allows for real-time information processing. Another
benefit is that data reduction addresses privacy concerns, along with reducing power
consumption and communication costs, as the sensors output metadata (semantic information
from image data) instead of image information. This output prevents personally identifiable
data from being stored as well as allows for reduced data transmission. An additional benefit is
that with only the necessary data being extracted, high-performance processors or external
memory are not required. AI is also very versatile with its functionality and internal memory,
allowing the system to be adjusted to suit the various applications, requirements, and location
conditions of National Parks (Sony, 2020).

28
Figure 11: AI-Enabled Image Sensor Image source: Sony. (2020, May 14). Sony to Release World's First Intelligent Vision Sensors with AI
Processing Functionality. [Press release]. https://www.sony.net/SonyInfo/News/Press/202005/20-037E/
3.1.2.2: Remote Sensing From Satellites
Remote sensing satellites are defined as satellites that carry photoelectric devices that
humans use for various observation purposes, as shown in Figure 12. The first remote sensing
satellites were developed in 1960, and, since then, these satellite technologies have become
ever more advanced. Based on predictions made from analyzing trends in past advancements
of observational satellites, they are expected to become highly intelligent, allowing for real-
time data acquisition and environmental analysis, and for the integration of ground observation
sensors in the future (Fu et al., 2020).

29
Figure 12: Remote Sensing Satellites Image source: GIS Geography. (2019, Dec 25). What is Remote Sensing? The Definitive Guide.
https://gisgeography.com/remote-sensing-earth-observation-guide/
Previously in the 2000’s, satellites could only see resolutions on the ground at three
meters apart, resulting in relatively poor resolutions. These resolutions improved as satellite
technology became more advanced with resolutions close to one meter apart as seen in Figure
13. Various satellites are now being used to view the Earth from above, with cameras that can
see resolutions on the ground at 25 centimeter resolution, as shown in Figure 14. A 25-
centimeter resolution means that each pixel represents a 25 cm x 25 cm area on the ground.
Further developments have been discussed that increase these resolutions; however, these
cameras are classified, and resolutions are limited to 25 centimeters by the National Oceanic
Atmospheric Administration (Beam, 2019). Thus, instead of making these resolutions higher,
new sensors are improving the quality of various aspects of the picture itself at 25-centimeter
resolution.

30
Figure 13: Previous Satellite Image Resolution of One Meter Image source: Rodziewicz, D. (2018, Dec 4). Why are satellite images a unique data source? What is
currently available, and what properties do you have to take into account when choosing which images
to use? https://appsilon.com/deep-learning-in-satellite-imagery/
Figure 14: 25-Centimeter Resolution Satellite Image Image source: Rodziewicz, D. (2018, Dec 4). Why are satellite images a unique data source? What is
currently available, and what properties do you have to take into account when choosing which images
to use? https://appsilon.com/deep-learning-in-satellite-imagery/

31
A new generation of multispectral and hyperspectral sensors with improved spatial and
spectral resolutions has begun to be developed in coordination with cameras for satellite
acquisition. These sensors incorporate the spatial resolution which includes the geometric
properties of the ground and the spectra resolution which uses a sensor to define the fine
wavelength intervals over most, if not all, of the visible light spectrum (Royimani et al., 2019).
These specific multispectral and hyperspectral sensors will have the ability to see the
ground through clouds and other weather cover, as well as to be able to view the ground with
significantly better resolution; resolution that is potentially ten times better than the previous
generation of satellites of the 2010’s. These improvements will allow cameras to see better
contrasts of the landscape, and park rangers can use that advanced capability to monitor
flooding in certain areas, as well as see the change of forestation in other areas. Additionally,
these satellites will be able to identify tree species and determine if the tree is healthy or not,
which can be used when tracking the change in forestation, and could be adapted to monitor
other species as well (Mayton, 2014).
Previous cameras did not have the ability to view the ground with these contrasts, or
even at a 25 cm resolution, for that matter. The previous cameras had approximately 1.8-meter
multispectral resolution, meaning that these contrasts were very challenging to view. With the
1.8-meter multispectral resolution, objects could be located, but they could not be identified
with precision. Now, with the new generation of multispectral and hyperspectral sensors,
objects can not only be located and identified, but also be observed and understood at 25-
centimeter resolutions (Beam, 2019).
Cameras on remote sensing satellites are able to collect significant amounts of data;
however, some data is unable to be obtained. For example, data under trees and data blocked
by other large objects, like rocks, cannot be observed from satellite cameras due to the
obstructed view. This leads us to determine that ground collection is also necessary in order to
collect sufficient data.
3.1.2.3: Remote Sensing From on the Ground
With the goal in mind to avoid placing permanent sensors on the ground, which would
disrupt the ecosystems and wildlife, using autonomous drone insect technology is optimal for
the future of remote sensing from on the ground. Two such autonomous drone insects are
shown in Figure 15. These autonomous drone insect technologies do not need to be attached
anywhere on the ground and can be deployed by the operator to remotely monitor various
areas. These “micro air vehicles” are mechanical devices with built-in cameras that have

32
previously been used to survey remote and dangerous areas, such as surveillance for the
military (Capri, 2016). These technologies can be adapted for the National Parks and could
provide surveillance to help solve the issues facing the parks in years to come.
Figure 15: Autonomous Drone Insect Technology Image source: Capri, D. (2016, July 7). That Flying Insect Might Be A Camera.
https://dianecapri.com/2016/07/flying-insect-might-camera/
Previous ‘on the ground’ camera technology for viewing wildlife and the
ecosystem consisted of motion-detection trail cameras that could capture images after being
activated by a subject's movement. These cameras offered the ability to use infrared sensors to
avoid spooking wildlife; however, these trail cameras, like any other camera, are bulky, require
sufficient power, and can only be placed in specific locations. These trail cameras can only see
what is in front of them during the day, and up to only 80 feet in dim lighting. Additionally,
video recording for these trail cameras can typically only last up to 60 seconds. To capture the
necessary footage for data acquisition for the National Parks, hundreds of these trail cameras
would need to be set up to retrieve a suitable amount of data. At several hundred dollars per
trail camera, this is an expensive proposition that would not be efficient or economical for the
National Parks (Stoker, 2020).
The future of cameras within the parks can consist of autonomous drone insect
technologies. These small insect drones, which can be as small as 15 millimeters, will be
equipped with camera and sensor technology that will be adapted to fit the needs of the
National Parks. The camera technology within an autonomous drone insect is currently being

33
further developed, but future estimates depict high resolution imaging—better than that of
today’s trail cameras—and cameras small enough to fit onto an insect drone. As of right now,
cameras for insect drone technology have features including: large field-of-view (180 degrees
horizontal and 90 degrees vertical), fast frame rate (minimum 30 Hz), and sufficient resolution
(minimum 75 x 75 pixels) (Sabo et al., 2017). With further research, these insect drone
technologies, especially those that could be used for the National Parks, can be significantly
improved for future use. Insect drones are the future of surveillance and data acquisition
through the use of cameras and sensors (Capri, 2016). These micro air vehicles fitted with
cameras, in the future, can travel throughout the National Parks in groups of 10s, if not 100s,
and not only capture images of the ecosystems to identify potential issues, but also allow park
rangers to gather data for other potential problems. The autonomous drone insects create
mobility of image capturing; that is, the ability to capture images in a variety of areas instead of
one area like trail cameras. Ultimately, this makes insect drones significantly more efficient and
further illustrates that their potential future use in the parks will be superior to that of previous
technologies.
3.1.2.4: Advancements in AI-Enabled Cameras
AI-enabled cameras are significantly more advanced than and can do many things that
can’t be done by older cameras. One example of advanced AI cameras improving upon older
cameras to solve problems more effectively is in Serengeti National Park, Tanzania. The park’s
biggest problem is poachers, and, due to the park’s limited number of park rangers (only 150)
and how much land the park encompasses, it is hard for the rangers to protect all the park’s
wildlife. RESOLVE, a non-profit organization, has already created remote cameras for the park;
however, there is still a problem with these early devices. Since this camera sends images every
time it is triggered (every instance where the camera detects motion), it causes many false
positives. For example, if a bird flies over the camera, the camera will detect the bird’s motion
and send an image to the park ranger, even though it is not a poacher. In order to decrease the
number of false positives, RESOLVE proposed a new solution, which is an AI-equipped camera
(Vincent, 2019). The new device is called TrailGuard AI and can detect and identify animals and
humans by using Intel-powered artificial intelligence technology. This camera can process
images, run network algorithms to detect objects, and classify the images by using the
technology called Intel Movidius Vision Processing Units (VPUs). Compared to the old device,
the biggest benefit from the AI-enabled camera is it can detect objects and classify what is
present in the captured images all within the camera itself, which can’t be done by the early
cameras (News Byte, 2019). Figure 16 shows what the new image classification looks like when

34
the camera detects a poacher, versus an elephant, versus a truck. The camera then sends an
alert to park rangers when a poacher is detected (Vincent, 2019).
Figure 16: Example Screenshots of the Algorithm Spotting a Human (left), an Elephant (center), and a Vehicle (right)
Image source: Vincent, J. (2019, Jan 3). AI-equipped cameras will help spot wildlife poachers before they
can kill. https://www.theverge.com/2019/1/3/18166769/ai-cameras-conservation-africa-resolve-intel-
elephants-serengeti
AI-enabled cameras could also help researchers track some endangered animals. For
example, the World Wildlife Fund works with Intel to protect Siberian tigers in China by using
AI-enabled cameras (Xu, 2019). The solution has a visual device at the front-end and an analysis
and recognition platform at the back end, which means it allows the cameras to identify the
species from the image captured (Synced, 2019). The cameras will be applied in the tigers’
habitats to take pictures or record video when they detect motion and, with the help of AI, to
identify if the tigers are the ones making the movements. These images could then be sent
immediately to the monitoring center to help researchers get near-real time information on the
tigers (World Wildlife Fund, 2018). These advanced devices will help researchers to track the
tigers, as well as other endangered wildlife, to formulate solutions to increase their population
counts.
3.1.2.5: How Devices Can Be Applied to National Park Issues
The AI-enabled cameras can be used to solve the many issues facing the National Parks
now, and in the future. The following section elaborates on the future approaches of using
these observational devices’ versatility to solve those issues, including the topics of: climate
change; sea level rise; air, light, and water pollution; waste management; repair and
maintenance; invasive species; visitor experience; and the rise in park visitation.

35
AI-enabled cameras offer many possibilities for National Parks. One use is for the
cameras to monitor climate change and air pollution in the parks. The cameras can be changed
to FLIR Systems cameras, as shown in Figure 17, which can be used to detect and monitor
greenhouse gases (such as methane and ethane) and volatile organic compounds (VOCs)
(Kessel & Tabuchi, 2019). Here, AI will be used to distinguish between the different gases, to
send only the data of gases that are of interest. Cameras that have ultraviolet, near infrared,
and shortwave infrared (SWIR) imaging sensors with similarly programmed AI can also be used
to monitor and track gasses such as ozone, carbon monoxide, and nitrogen dioxide (Hezewyk,
2019). Wherever these cameras are located in the parks, they can detect where gases in their
fields of vision are coming from and how much of the gasses are being emitted all the time, to
track and monitor the effects of climate change and global warming over time in the parks
(Hezewyk, 2019; Smith, 2017). Similar can be done for detecting and monitoring light pollution
in the parks.
Figure 17: A FLIR Camera Image source: FLIR. (n.d.). Flir Store. https://www.transcat.com/brand/flir-store
National Parks near coastlines that are affected by sea level rise can use video cameras
which collect snapshots and videos. The color intensity information of the pixels in the imagery
can be analyzed by AI to detect changes in coastlines and alert parks to oncoming hazards

36
(Brown & Long, n.d.). For monitoring water pollution within the parks, cameras with optical
sensors can be used. These cameras estimate water quality parameters, such as turbidity,
dissolved oxygen, electrical conductivity, and pH. AI assistance can then be used to determine
what contaminants and toxins are present, how much of them are in the park waters, and
changes in water pollution over time (Goddijn et al., 2006; Wang et al., 2018). An example using
the cameras without AI is a survey that was taken in Galaway Bay, Ireland, where the cameras
were used to determine the optical properties of the water, particularly of colored dissolved
organic material and chlorophyll, to determine their relationships to each other, and in turn,
water quality parameters of the bay (Goddijn et al., 2006). With making the cameras AI-
enabled, the cameras themselves can determine the water quality parameters instead of
requiring people to make the correlations of the optional properties.
Video tracking cameras that perform object tracking on their acquired images can also
detect floating debris, other surface garbage, the accumulation of algae, and salient regions in
park waters by using AI to distinguish between different objects and regions. Wang et al.
performed field research and laboratory experiments using a vision-based aquatic sensor node
for a camera without AI. The recorded floating debris and salient regions demonstrated that
they can be detected using sensors with high accuracy, as depicted in Figure 18 (Wang et al.,
2018). Enabling these cameras with AI could do real time processing of the recorded images to
avoid unnecessary data being sent from the cameras.

37
Figure 18: Two Experiments Detecting Floating Debris (a) and Salient Waters (b) in a Pond Image source: Wang, Y., Wang, Y., Zhang, X., Zhang, X., Chen, J., Chen, J., . . . Wang, D. (2018, Nov 27).
Camera sensor-based contamination detection for water environment monitoring. Environmental
Science and Pollution Research, 26(3), 2722-2733. https://doi.org/10.1007/s11356-018-3645-z

38
Additional video tracking cameras can be used to improve waste management for the
National Parks. These cameras can reduce the cost of recycling, as well as make the process
more efficient for parks, by helping sort garbage into recyclable plastic and ceramic glass with
the help of AI (Hezewyk, 2019). Hyperspectral imaging or multispectral cameras can then be
used with AI to identify distinctions between the chemical compositions of different kinds of
paper, cardboard, and plastics to further sort them (Miller, 2016; Hezewyk, 2019). For recycling
plastic, a multispectral system consisting of SWIR cameras and linear arrays can be used, which
would distinguish between different polymers in plastics and then sort them into the proper
recycling bins, as shown in Figure 19 (Miller, 2016). In turn, this improved recycling
management in the parks can additionally lower their input of greenhouse gases and toxins into
Earth’s atmosphere (Hezewyk, 2019).

39
Figure 19: How a SWIR Camera Multispectral System Works Image source: Miller, G. (2016, Sept 27). Sorting it Out: How imaging systems are improving the way we
recycle. https://possibility.teledyneimaging.com/sorting-it-out-how-imaging-systems-are-improving-the-
way-we-recycle/
Video tracking cameras can be applied to repair and maintenance efforts as well.
Utilizing AI, they can monitor structures, such as bridges and roadways, for changes to ensure
the structures remain in good condition and are safe for visitors to use. When wear or damage
becomes evident, park rangers can be notified that the structures need maintenance so they
can be repaired in a timely manner.

40
With AI, these cameras can also monitor and track invasive species within the parks and
alert park staff to where they are and what they are doing at any given point. Due to the
harmful effects of invasive species, a new system is being developed by the scientists from the
UK Centre for Ecology and Hydrology (UKCEH) and the Birmingham based company Keen AI.
This new system uses a high-speed camera on the top of a vehicle to take photos of locations
that need to be searched for invasive species. Figure 20 below shows a visual representation of
how the vehicle system works. After teaching the system to identify invasive species correctly,
these vehicles could subsequently be used to continuously survey for invasive species. Since the
pictures have their own associated GPS locations, when invasive species are found by the
vehicle system, both the photo and location pairs can be uploaded to an online platform in
order to let ecologists identify the plants (UK News, 2020). This information can then be used to
strategize on how to prevent those plants from negatively impacting the parks.
Figure 20: The Vehicle's Appearance and the Process of This Research Image source: UK News. (2020, Jun 16). AI trial to help track damaging invasive plant species
https://www.expressandstar.com/news/uk-news/2020/06/16/ai-trial-to-help-track-damaging-invasive-
plant-species/

41
Object tracking through AI can be used to track native animals as well. This allows the
park rangers to be informed of the locations of the wildlife in order to protect the animals
themselves, but to also keep them away from visitors to ensure the visitors’ safety too. These
cameras could be used to track potentially dangerous animals, such as bears, to prevent them
from accidentally attacking people. AI cameras could track the location of animals and send
alerts to park rangers in order to let park rangers find the animals and prevent the attack from
happening. In turn, both people and wildlife could benefit from the cameras being
implemented.
As shown in Figure 21, cameras such as the ones being produced by Sony offer options
that suit retail facility needs, but these same cameras can be used for similar purposes in the
National Parks. The cameras can be altered to be video tracking cameras or to be thermal
cameras (which perform heat mapping) to improve visitor experience and to address
diversifying park visitation. Using AI to distinguish between humans and things in the
background, these two types of cameras can be used to count, forecast, and track the number
of visitors entering, exiting, and in the parks at any given time; measure and analyze visitors’
behaviors, including routes taken and time spent in various locations; as well as detect and
analyze congestion throughout the parks (Sony 2020). FLIR cameras with AI can be used to
detect weather elements, such as clouds, dust, and hail, and all this acquired information can
be provided to visitors for them to determine how they want to plan their activities in the parks
and, in turn, improve their park experience (Hezewyk, 2019).
Figure 21: AI-Enabled Cameras Potential Usages for Retail Facilities Image source: Sony. (2020, May 14). Sony to Release World's First Intelligent Vision Sensors with AI
Processing Functionality. [Press release]. https://www.sony.net/SonyInfo/News/Press/202005/20-037E/

42
The cameras could additionally record live videos of viewpoints throughout the parks to
display online, as well as provide virtual tours using 360-degree videos and virtual reality (VR)
technologies for people to view the parks wherever and whenever they wish. Particularly, this
would improve the park experience for when people cannot physically go to the parks but still
want to visit them. It would also provide educational opportunities for children to encourage
them to experience the parks for themselves.
3.1.3: Future of Data Transmission for Parks
The network layer of National Park Smart Grids is where data transmission will occur.
This layer will use a wireless communication network composed of satellites that map the data
collected in the perception layer to the next layer: the application layer (Ghasempour, 2019).
This section discusses the future of satellite networks and proposes the satellite network for
National Parks.
3.1.3.1: 5G and High-Speed Mobile Networks
The currently offered high-speed mobile network is called 4G-LTE. LTE stands for long-
term evolution and is from the UMTS/HSPA and GSM/EDGE technologies. LTE was invented to
make use of the digital signal processing technologies. This network is much faster than the
previous architecture, allowing up to 300 Mbit/s download and around 75 Mbit/s upload. This
standard for wireless communication allows video content streaming without lag and also
provides high download speeds.
In March of 2020, phones became available that offer a 5G service (Fowler, 2020). The
most notable are the Galaxy S20 phones, which come with 5G service as a standard. A major
difference from 5G to 4G-LTE is that 5G is developed with many more considerations in mind,
such as IoT, AR/VR, and even self-driving cars. Also, 5G offers many new application abilities like
eMBB, MTC, and Critical MTC. eMBB is the transmission of large 4k video; MTC is massive
machine-type communication, which is transmission from IoT devices across their vast
networks of architecture; and Critical MTC is machine to machine communication that cannot
tolerate lag and requires reliable transmission of data, an example being self-driving cars
(Shankaranarayanan, 2017).

43
3.1.3.2: The Future of Cell Towers
Cell towers are cellular sites equipped with antennas which allow electronic waves to
communicate (Whatsag, n.d.). When people use mobile phones to communicate, the phones
emit electromagnetic radio waves, which are radio frequency (RF) signals. The closest cell tower
will receive these RF signals and transmit them (Bushan, 2019). The development of 5G wireless
service provides a high-speed network, which means the existing infrastructure may need to be
improved or replaced to utilize 5G. In the short term, traditional cell towers may not be
replaced, because they can be upgraded for 5G signal or still transmit 4G signal for some areas
without 5G service. Since 5G will require upgraded infrastructure, even if it is still on cell
towers, 5G services will not be available worldwide immediately. If companies want to launch
5G services, urban areas would be the first choice for them to test this service. Additionally,
traditional cell towers may not be replaced immediately because they are still used in rural
areas to connect people to the world.
There is still a possibility that cell towers will eventually be obsolete one day. A new
technology called direct device-to-device mobile is under development by a company called
Qualcomm. This new technology does not use cell towers but rather allows mobile phones to
connect and communicate with each other within a 500-meter range (Chandran, 2015).
Another advancement in network technology that may replace cell towers is satellite networks,
as discussed below.
3.1.3.3: Future Satellite Networks Overview
The future communication network for the Smart Park Grid is a network of satellites,
called a satellite constellation. A satellite constellation is a group of similar satellites designed
for the same purpose that reside in similar orbits and are all controlled by the same entity
(Wood, 2003). Previously, these constellations have been used for navigation, geodesy, satellite
telephony, and earth observation, but, in more recent times, companies are creating much
larger scaled satellite constellations with the intention of providing internet globally. Some of
these future satellite constellations include the Iridium satellite constellation, the OneWeb
satellite constellation, Globalstar, Amazon’s Project Kuiper, and Facebook’s Athena
(International Astronomical Union, 2020a).
Another potential future option for parks is being created through a project called
Starlink. Starlink is a constellation of satellites that has been launched into the Low Earth Orbit
(LEO) by the U.S. company SpaceX, which is run by Elon Musk, a South African entrepreneur

44
(O'Callaghan, 2020). Two of these satellites in space are shown in Figure 22, and Figure 23
shows a simulation of what this satellite constellation can potentially look like in the future
(Boyle, 2019; Henry, 2020). The intention of these satellites is to deliver cheap, high speed
broadband internet to the entire world, which includes all the locations that have not been able
to use or afford internet before (Starlink, n.d.). This is made possible with the nature of LEO
satellite networks, as they do not offer inter-satellite links, which allows for a wide range of
coverage and does not require a substantial amount of power to operate (Sohraby et al., 2017;
Qu et al., 2017). Compared to other satellites which are 1000 kilometers above Earth’s surface,
Starlink satellites are at the altitude of 550 kilometers in LEO, as depicted in Figure 24 (Starlink,
n.d.). Currently, 360 of the planned 12,000 satellites have already been launched into orbit, and
about two batches of 60 satellites each are launched every month using Falcon 9 nose cones,
such as the one shown in Figure 25 (Musk, 2019; O'Callaghan, 2020). These Falcon 9 nose cones
(whose exteriors are shown in Figure 26) are placed on the tops of spacecrafts, such as the one
in Figure 27, and are launched into space (SpaceX, 2020a; SpaceX, 2020b). The number of
satellites in orbit can potentially even increase to 42,000, if SpaceX’s proposal for an additional
30,000 satellites is accepted by the International Telecommunication Union (O'Callaghan,
2019).
Figure 22: Two Starlink Satellites in LEO Image source: Henry, C. (2020, Apr 21). SpaceX seeks FCC permission for operating all first-gen Starlink
in lower orbit. https://spacenews.com/spacex-seeks-fcc-permission-for-operating-all-first-gen-starlink-
in-lower-orbit/

45
Figure 23: Stimulation of a Potential Satellite Constellation for Starlink Image source: Boyle, A. (2019, Feb 8). SpaceX seeks FCC approval for up to 1M Starlink satellite earth
stations. https://www.geekwire.com/2019/spacex-fcc-starlink-million-earth-stations/

46
Figure 24: Starlink Satellites in LEO Compared to Other Satellite Orbits Image source: Starlink. (n.d.). Starlink. https://www.starlink.com/

47
Figure 25: 60 Starlink Satellites Packed into a Falcon 9 Nose Cone Image source: Musk, E. [@elonmusk]. (2019, May 11). First 60 @SpaceX Starlink satellites loaded into
Falcon fairing. Tight fit. [Tweet; https://twitter.com/elonmusk/status/1127388838362378241/photo/1].
Twitter. https://twitter.com/elonmusk/status/1127388838362378241
Figure 26: The Exterior of a Falcon 9 Nose Cone Image source: SpaceX. (2020b). SpaceX. https://www.spacex.com/launches/

48
Figure 27: SpaceX Spacecraft with a Falcon 9 Nose Cone on Top Image source: SpaceX [@SpaceX]. (2020a, June 29). Falcon 9 and GPS III Space Vehicle 03 vertical on
SLC-40 ahead of tomorrow’s launch for the @SpaceForceDoD. [Tweet;
https://twitter.com/SpaceX/status/1277809612478050304/photo/1]. Twitter.
https://twitter.com/SpaceX/status/1277809612478050304
3.1.3.4: Starlink vs. 5G
There are two different technologies that could provide a network for National Parks:
one being 5G, and the other being a satellite network such as Starlink. Generally, 5G provides a
network from the ground through the use of cell towers, and Starlink provides its network using
satellites in space. Due to this, there are many further differences between them.
The first difference is with their service speeds. Theoretically, the speed of 5G could
possibly be 20 times faster than the speed of 4G. For example, if the download speed of 4G is 9
megabits per second, the download speed of 5G will be 180 megabits per second, which means
people may just need a few seconds to download a movie that is 1 gigabyte or larger. According
to SpaceX, the speed of the network provided by Starlink could reach 1 billion bits per second.
Compared to 5G, this speed is still less, even though the speed of Starlink is 10 times faster than
that of 4G (Borkar, 2020). Thus, from this information, it can be concluded that 5G is much
faster than Starlink.

49
A second difference is how large of an area that the service could span and provide
internet to. For 5G, some areas are difficult to build cell towers to provide the internet. But
Starlink could provide a network for these areas, such as National Parks, since the infrastructure
resides in space and does not use cell towers (Global Conservation, 2019).
Building cell towers in National Parks could potentially cause the parks some problems.
For example, because building cell towers takes up some space, it may affect the habitats of
animals living in the National Parks. The towers’ construction and their continued maintenance
by humans can also interfere in the efforts to preserve the wildlife’s’ natural habitats. Thus,
with these risks and other further risks, having Starlink as the network for the Smart Park Grids
may be the more ideal choice for National Parks to use.
3.1.4: Future of Big Data Analysis
The application layer processes the information received from the network layer to
monitor perception layer devices in real time. Here, on the Cloud, the collected data is
transformed into valuable insights for National Parks to utilize through cloud computing, big
data analysis, and predictive analysis methods.
3.1.4.1: The Cloud and Cloud Computing
Cloud computing (the delivery of computational services over the Internet, in this case,
the Cloud) will be the information processing system that will analyze the data collected from
AI-equipped cameras and spacecraft earth observation sensors for the Smart Park Grid
(Microsoft, n.d.). On the cloud system, AI is used to perform machine learning, which allows
computers to learn for themselves by recognizing patterns in big data sets and improve their
future decisions all without being explicitly programmed by humans (Expert System Team,
2020). In the Cloud, AI will be able to process the various forms of collected data from around
the parks and formulate insights, which can then be used by the parks to efficiently and
effectively manage their assets, resources, and services. Figure 28 shows how AI performs
machine learning on big data to formulate insights in the form of a Venn diagram (GilPress,
2016).

50
Figure 28: AI, Machine Learning, and Big Data on a Venn Diagram Image source: GilPress. (2016, Oct 17). Visually Linking AI, Machine Learning, Deep Learning, Big Data
and Data Science. https://whatsthebigdata.com/2016/10/17/visually-linking-ai-machine-learning-deep-
learning-big-data-and-data-science/
There are many benefits of using cloud computing for National Parks. One being that it
does not require on-site data centers, as its computational services themselves include the
servers, storage, databases, networking, software, analytics, and intelligence, such as AI. This
lowers expenses for parks, as they do not need to purchase hardware and software, the
electricity to power such a system, or employ IT experts to maintain and manage the
infrastructure. It also will provide the parks with easily accessible, secure, reliable, and efficient
self-service with the latest technologies whenever they need it without expending unnecessary
resources, which also decreases costs (Microsoft, n.d.). Cloud computing will also provide
metering infrastructure for the parks, allowing them to monitor their expenditure, as well as
pay just for their consumed resources and nothing extra unnecessarily (Smart Grid Working
Group, 2018).

51
3.1.4.2: Edge Computing
The use of cloud computing is good for devices that can tolerate lag. However, there are
benefits to performing some preprocessing at the level of the sensors to reduce the amount of
data being transported by the components of the network layer to the application layer. The
data reduction preprocessing at the sensor level is called edge computing. Instead of
forwarding all raw data to a centralized location in the Cloud to be stored and processed, there
are many smaller network nodes at the sensors which work independently and/or in
conjunction with each other to do at least some of the data processing at that level (Hsu, 2017).
The only downside to edge computing is that it requires a lot of the computation to be done on
the devices themselves. This has not been feasible until recent rapid hardware advances, which
are sure to continue to improve quickly in the coming years.
3.1.4.3: Big Data Analysis and Predictive Analysis
The collected Smart Grid data can be classified as big data if it comes in massive
amounts that are beyond people’s capacity to find meaning in it and if it is challenging to store
and computationally process efficiently. Data analytics (the discovery of meaningful patterns
and information from large data sources) is needed in these circumstances. Data analytics,
especially big data analytics, is extremely important for Smart Grids’ structure, as the results
can be used to understand system patterns and behaviors, improve system resilience, enhance
security and monitoring, and optimize available resources for future planning. There are four
types of analytics that are commonly used today for big data processing: descriptive analytics,
diagnostic analytics, predictive analytics, and prescriptive analytics (Smart Grid Working Group,
2018).
Predictive analytics is the use of statistics and modeling to determine future
performance based on current and historical data. The data collected from relevant sources will
be prepared through data mining processes into one primary place for analysis. Next, predictive
analytics software goes through the collected data and extracts proactive insights. These
insights can help users visualize and interpret the results. Predictive analytics allow businesses
to adjust where they use their resources to take advantage of possible future events, thus
gaining competitive edge and meeting consumers’ expectations (Calvello, 2020). This can be
adjusted to suit National Parks needs in a similar fashion.
In the future, the amount of generated data will be expected to grow exponentially. By
2025, the volume of data will be nearly 175 zettabytes, which is massive in comparison to the

52
4.4 zettabytes of data recorded in 2013. These sheer volumes of data could be managed by
open-source networks, such as Hadoop and NoSQL. In search for solutions, many have started
to migrate big data to cloud computing platforms such as Amazon Web Services (AWS),
Microsoft Azure, and Google Cloud Platform. With these pay-and-go services, National Parks
could use them whenever they need to run intensive analysis without having to build their own
data hubs. There will also be more options such as hybrid environments, which would allow
National Parks to keep sensitive information on premises and the rest in the Cloud, and multi-
Cloud environments, which addresses the need to choose to store data using a combination of
Clouds, both public and private (Khvoynitskaya, 2020).
Playing a huge role in big data analytics, AI and machine learning are also pioneering
technologies expected to become more mainstream. Advanced machine learning and artificial
intelligence methods can be used to create systems that can operate and adapt autonomously.
Predictive analytics will also move forward in conjunction with machine learning, as machine
learning systems provide the tools for predictive analytics software (Harvey, 2018).
Furthermore, big data analytics could see the rise of quantum computing—powerful computers
that operate based on quantum mechanics principles, which would transform the limit of digital
computing and perform analytics of unthinkable proportions for certain kinds of processing
(Shaikh & Ali, 2016).
With regards to the National Parks, their Smart Grids would benefit from both the
applications of edge computing and cloud technology. In edge computing, crucial data is
relocated to the edge of the network and big data analysis occurs very close to the devices and
sensors instead of in a data center or the Cloud. This way, edge computing allows Smart Grids
to store and analyze streaming data near the sources with real-time speed; resolving issues
related to bandwidth space, network latency, and operational costs. By combining the data-
gathering potential of edge computing with the storage capacity of the Cloud, data analytics
applications (such as predictive analytics and machine learning algorithms) will be running in
the Cloud, and the subsequent data will be moved to edge device sensors. Thus, Smart Grids
can keep their devices running fast and efficient without sacrificing valuable computational and
response time (Gyramathy, 2019).
3.2: How Future Technologies Will Be Powered
Within the National Parks, power is fundamental to make sure that all of the devices
and grids function properly. Most modern power grid systems rely on nonrenewable resources
(fossil fuel reserves and nuclear energy plants); however, they come with adverse side-effects,
such as pollution and other damage to the natural environment. One of the key features of the

53
Smart Grid is to integrate and support renewable energy sources in order to deliver sustainable,
cost-effective, and secure energy supplies in a two-way flow of power and communication. The
main advantages of using renewable resources are that they are replenished by nature and
they have low or no carbon emissions, which make them more environmentally friendly than
old resources like fossil fuels. As of right now, the desired approach is to gradually infuse
renewable energy resources into existing grids and transform the systems over time (Campbell,
2018).
The leading renewable energy resource in the near future is solar energy. As it is a non-
dispatchable resource, a grid-scale energy storage system is required to store the generated
energy and save it for later use. Balancing the supply-demand of energy generation,
distribution, and usage is an essential process in the Smart Grids. There are many ways of
storing energy, such as pumped hydro, compressed air, thermal energy, battery technologies,
flywheel, etc. Battery energy storage systems are the desirable energy storage devices for
Smart Grids due to their flexible installation and short construction cycles (Fan et al., 2020).
Today, many different batteries have been developed with varying application
properties, such as energy density, specific capacity, discharge performance, power output,
response time, cycle life, safety, and cost; as shown in Table 1 below (Fan et al., 2020).
Table 1: Major Characteristics of Different Types of Batteries Image source: Fan, X., Liu, B., Liu, J., Ding, J., Han, X., Deng, Y., . . . Zhong, C. (2020, Jan 8). Battery
Technologies for Grid-Level Large-Scale Electrical Energy Storage. Transactions of Tianjin University,
26(2), 92-103. doi:10.1007/s12209-019-00231-w

54
The two best battery options for Smart Grids’ power are Lithium-ion (Li-ion) and Flow
batteries (Vanadium redox). Lithium-ion batteries are by far the most popular battery storage
option and control a large percentage of the global battery storage market. Li-ion batteries
have a long cycle life; however, they have a relatively short usage life, are expensive, and have
issues, such as being dangerous when overcharged and rapid heat generation, which causes
poor high temperature performance. They are mainly used in portable electronic devices;
therefore, they will prove to be extremely important for the National Parks’ Smart Grids.
Lithium-ion batteries would be used to power sensors and meters within AI-enabled cameras
and autonomous drone insects in the perception layer, as these batteries provide lightweight
and high energy density power sources which will be sufficient for the aforementioned small-
scale devices. Secondary non-aqueous lithium batteries could provide reliable backup power to
these devices in the Smart Grids’ network (Fan et al., 2020). In addition, connecting many
lithium-ion batteries in parallel circuits is also an option to possibly power larger devices, such
as electric vehicles.
Flow battery is also another power option that should be considered along with Lithium-
ion batteries. The vanadium redox batteries, a type of flow battery, are one of the latest battery
technologies. The key features of vanadium redox are their long lifetime (12000–14000 cycles),
high safety, low operating cost, and easy maintenance; therefore, they are suitable for
supplying continuous power and storing energy in long durations. The only drawback to these
battery types are their relatively low energy density of 10–50 Wh/kg, and, due to this, they
require large installation spaces (Fan et al., 2020). The vanadium redox battery would be the
main battery option for grid-scale energy storage. For instance, the Avista Utilities plant in
Washington state is using flow batteries for grid storage. These batteries will be connected to
the grids to store excess power from traditional power generation methods, as well as energy
from renewable resources, which can then be released during peak demand periods (Zablocki,
2019).
As for the power generation process in the Smart Grids, new technologies such as
computer-based energy generators could be possible. These generators have multiple benefits,
including having the ability to transmit energy more efficiently than other methods, as well as
being able to restore power after weather-related disturbances or outages. The generators
could be integrated in Smart Parks Grids to support personal power generation systems, as well
as large-scale renewable energy systems (Electric News, 2017).
With regard to renewable resources, solar energy will be an important part of the Smart
Grids’ structures. The main form of solar energy is from Photovoltaic (PV) systems, which use
the Photovoltaic effect to directly translate solar energy into electricity (DC). These systems will
be implemented to the future satellites in the network layer and to the future AI-enabled
cameras in the perception layer. Additionally, PV systems could be configured to almost any

55
size from a few kilowatts to several megawatts and even integrated into homes, community
facilities, and commercial buildings (such as for roofing shingles or car park shading), as well as
be used for other park purposes. This also brings up the possibility of Solar-Grid integration,
which is a technology that allows large-scale solar PV systems to be integrated into the existing
power grid. The use of solar energy and PV systems in the Smart Grids is one way to ensure
more secure and reliable energy transmission with decreased risk of outages (Nwaigwe et al.,
2019).

56
CHAPTER 4: ANALYSIS
In this chapter, we begin by delving into why and how the technologies that have been
discussed previously will evolve in the future. We then proceed to discuss what these future
technologies will cost. Next, we acknowledge and discuss problems, challenges, limitations, and
flaws in our study. This chapter then concludes with an overview of further debates pertaining
to the future of technologies in National Parks.
4.1: Why Future Technologies Are Heading in This Direction
The following section discusses Moore’s Law and Neven’s Law. These concepts have
been the foundations of our project, for Moore’s Law has been used to foretell the technology
of today, and Neven’s Law shows indications about where technological advancements are
heading in the future.
4.1.1: Moore’s Law and Neven’s Law
The future of technology has been consistently forecasted with Moore’s Law. This law,
created in the 1960’s by Gordon Moore, states that the number of transistors per silicon chip
doubles every year. Although revised in 1975 to the time frame of doubling every two years,
Moore’s Law has been a reference to the worldwide semiconductor industry, an industry which
drives advancements in technology. With the creation of silicon chips that include larger
numbers of transistors, these chips become more efficient with stronger capabilities of
processing power. Moore’s Law has been a foundation for the predictable developments over
the past 50 years. The dimensions of a typical transistor used to be measured in millimeters. In
the 1980’s, a transistor the size of a micrometer (one-millionth of a meter) was developed
(Waldrop, 2016). Fast forward to the 2010’s, transistors the size of nanometers (one-billionth of
a meter) were created. This reduction factor of the size of transistors meant that silicon chips
could be made smaller and more efficient than their predecessors (The Editors of Encyclopedia
Britannica, 2019).
Moore’s Law has been a pivotal principle in understanding the rate of technology
improvement throughout the decades. It is generally understood that in addition to the number
of transistors per silicon chip doubling every two years, so does the chips’ performance (The
Editors of Encyclopedia Britannica, 2019). This exponential improvement has been seen from
57
the development of home computers during the 1970’s, to the late 1990’s, to the early 2000’s,
when high-speed internet began. Further improvements during the 2010’s and beyond have
given us blistering fast smartphones and televisions thinner than an inch (Waldrop, 2016).
Thanks to the technological advancements in chip technology during the last 50 years, the
developments of today can be put into motion.
The advancements of chip technology, especially the small size and immense
performance of these chips, have allowed for future technology to be created. If a significant
amount of these chips are placed on board satellites in space and work in a cohesive effort,
they have the processing power and the ability to put high-speed internet everywhere on the
globe. These chips have been improved upon for the last 50 years, resulting in the cost of
manufacturing them to be much lower than in the past, which enables this idea to be feasibly
implemented, although it still is an expensive endeavor when it is first initiated. With
consideration of Moore’s Law, satellites, like the ones of Elon Musk’s Starlink, will make
communication cheaper. From Moore’s Law, each time new technology is developed every two
years, the technology also improves. This law can be adapted to fit the model that satellites will
make communication cheaper. Within the upcoming years, communication will soon become
cheaper as more widespread improvements, including the use of satellites, are developed.
These advancements in technology keep pushing the boundaries of Moore’s Law, and by 2025
Moore’s Law is estimated to become obsolete when the size of transistors approach atomic
scale and further size reduction is no longer possible (Green, 2015; Waldrop, 2016).
Additional developments are said to be carried out with a new law, Neven’s Law, taking
Moore’s Law’s place. Named after Hartmut Neven, who is the director of Google’s Quantum
Artificial Intelligence Lab, Neven’s Law states that new quantum processors are currently
growing and will continue to grow in the future at a doubly exponential rate (Yoshida, 2019).
This law means it will be feasible to solve computational problems that were never possible
before. Neven’s Law can be applied to Elon Musk’s Starlink, which indicates that within less
than 10 years, through the use of satellites, communication will be cheaper. From this model,
satellite technology and quantum computing, as outlined by Neven’s Law, will be further
developed and advanced. This means that Elon Musk’s satellites will be able to communicate
faster than ever before, and the technology associated with the satellites will be significantly
better than any satellite predecessors. From these factors, communication will be faster, more
efficient, and more widespread, resulting in a less expensive network that is available to all.

58
4.2: Future Costs for National Parks
The following section discusses the future costs of the proposed Smart Park Grid
technology for National Parks. The costs of these future technologies that the National Parks
will utilize are described for sensors and the Starlink network.
4.2.1: What Future Sensors Will Potentially Cost
Sensors have become cheaper as the market for them has increased over the past few decades.
Future sensors are predicted to be smaller, more efficient, and less expensive. By 2025, the
sensor market is estimated to grow by 34%, and it is projected that the market will increase by
$35.2 billion dollars (Wood, 2019). This prevalence of sensors in coordination with the IoT has
led to further developments that can be attributed to advancements in technology.
Furthermore, between 2004 and 2014, the average cost of IoT sensors dropped by more than
half, from $1.30 to $0.60. Sensor prices have shrunk as predicted by 37 percent to $0.38 in
2020 (Dukes, 2018). This technology is not only more advanced than ever before, but is
moreover significantly less expensive than ever before. With this technology being inexpensive,
sensors can be applied to the National Parks at relatively low costs. The advancements of
sensor technology has clearly followed Moore’s Law, and it is estimated that these sensor
technologies will be affiliated with Neven’s Law in the upcoming years, resulting in sensors that
are cheaper and far more advanced than the sensors of today.
4.2.2: What Will the Starlink Network Cost for Parks to Use
The Starlink satellite internet service is expected to cost around $80 a month based on
the most recent estimates. Current prices for high speed internet range from $100-$150 per
household. With these current price ranges being more expensive for slower speeds, it is
anticipated that Starlink will be the future of high-speed internet throughout the globe. Starlink
will be available at low costs with widespread connectivity, and startup costs are estimated to
be cheap at $100-$300 for each terminal (McNally, 2020). The Starlink high speed internet is
anticipated to be globally available, meaning that the National Parks can utilize several
terminals for park rangers and other workers at key locations like park centers. Additionally,
through Starlink, park goers will have connectivity through the majority, if not the entirety, of
the National Parks, which enables them to use personal technological devices within the parks.

59
Furthermore, Starlink high speed internet can be used in coordination with the sensors and
cameras that will have been applied to the network, resulting in more efficient data acquisition
and data transmission. Through Starlink, the National Parks will not have to spend inordinate
amounts of money to have high speed internet.
4.3: Problems, Challenges, Limitations, and Flaws of This Research
There were several problems and challenges that our team faced when trying to gather
and analyze information for this research, which posed limitations and flaws for this work. The
following section analyzes and discusses the problems, challenges, limitations, and flaws in this
study.
The major challenge of this study pertains to the nature of the information we were
trying to acquire. The findings within this paper are based on predictions that are speculations
on what will happen in the future. Because they are speculations, it is not completely
guaranteed that any of them will come to fruition as time progresses over the years. The
limitations of these findings could, therefore, influence the ability of National Parks to
implement Smart Park Grids in the future, as this concept is based on the presumption that
these technologies will indeed exist in the future and meet their speculated expectations. Some
aspects of these findings could potentially become a reality, and, therefore, be implemented
within National Parks, while others may not exist in actuality, or be different than anticipated,
and possibly would not be viable options to utilize anymore. These aspects are subject to
change and are limited to how quickly technologies can advance in the upcoming years and
farther into the future. If technologies do not progress and incorporate characteristics that will
make them suitable for National Parks’ needs, then Smart Park Grids may not be developed
altogether.
There is another limitation that stems from the fair amount of speculation being done
with this research. Since the ideas of all these future technologies are just speculation, not as
much information is available about the topics compared to technologies that are already in
existence and are being used. In some cases, the technologies do not exist yet, and in others,
the concepts are in the beginning stages of development. These technologies include the many
variations of AI-enabled cameras and Starlink’s plans to provide high speed internet services
universally.
Another challenge was ensuring that the researched technologies were advanced
enough to be suitable for National Park constraints and needs. These advanced technologies

60
were required to satisfy monetary and environmental factors, as well as have the capabilities to
be seamlessly implemented into the parks in the future without issue.
Throughout our research, we sought to use the most reliable sources, which consisted
of peer-reviewed papers, government sources (such as the National Park Service), conference
papers and proceedings, newspapers, magazines, and information published by well-known
organizations and companies (for instance, various park related organizations and companies
such as SpaceX).
4.4: Further Debates Pertaining to Technology in National Parks
In addition to the debates about whether or not technology should be implemented
into National Parks and on the subject of data security, there are also debates surrounding the
impacts that the satellite constellations will have in the future. This section gives an overview of
both sides of the argument including concerns about astrological exploration being affected,
the creation of more orbital debris and its associated risks, and the benefits of having satellites
in space.
4.4.1: The Impact of Satellites
There are major scientific concerns surrounding the topic of satellite constellations. A
main concern is that astrological exploration can be detrimentally affected by their existence.
Since the surfaces of the satellites are made of highly reflective metal in order to mitigate solar
heating effects, they reflect light from the Sun in the hours after sunset and before sunrise; that
brightness affects astrological observations. Many ground-based astronomical telescopes
contain sensitive instruments that can be put at risk when exposed to the bright reflections off
of satellites, which results in the telescopes no longer being reliable, and, therefore, unusable
for research purposes. Besides posing threats for the astrological instruments themselves, the
reflected lights block portions of the sky from being visible from the ground, and appear as
diagonal light trails in telescope images, preventing the photos from being analyzed properly
(International Astronomical Union, 2020a). In order to achieve the best results, most
astrological observations are performed at an elevation of more than 30 degrees over the
horizon (as that is where the sky is clear from obstructions) and at night. With the number of
satellites already in that range, and the many more that will be added, astrological observations
will no longer have access to a pristine night sky with the satellites’ brightness (International
Astronomical Union, 2020b). Although attempts have been made to reduce the brightness of

61
their surfaces with special coatings, it has not been done to all satellites. With the sheer
number of satellites already in space, and with tens of thousands more on the way in the
coming decades, it will be difficult to mitigate the problem. Another main concern is with the
radio signals that the satellite constellations emit. Although there have been efforts to prevent
the satellites’ radio wavelengths from interfering with radio astronomy frequencies, the
satellites still emit signals and pose a threat to radio astronomy and the ability to produce
images for scientific exploration (International Astronomical Union, 2020a).
Additionally, with the plans to drastically increase the number of satellites in Earth’s
lower orbit over the coming years, the growing constellations present concerns about space
debris. Space debris is all the leftover junk from human activities in space, such as leftover
rockets and dead satellites, but also debris created by satellite collisions. As Earth’s lower orbit
becomes more crowded with all the additional satellites, the amount of risk that satellites will
collide increases as well (Harris, 2019). When satellites collide, more space debris is created. In
turn, this becomes a cascade effect since more fragments in space means a higher risk of
satellite collisions with the debris and collisions between satellites themselves as they
maneuver to avoid such collisions, and the cycle repeats (Hattenbach, 2019). Due to the sheer
number of collision alerts satellite operators will receive from tracking technologies every day,
they will be faced with hard decisions on how to maneuver the satellites. They will be able to
choose either to make hundreds of smaller satellite maneuvers every day to air on the side of
caution, or to not make these maneuvers, and risk the small chance of a collision occurring.
Collision alerts are not even entirely reliable, since the radars which send them are not
completely accurate with their predictions, but even neglecting to take action on a single alert
could be catastrophic. Besides the space debris posing collision risks in space, fragments in
lower altitudes can be dragged down into Earth’s atmosphere and become dangerous for
humans too (Harris, 2019). A final concern with debris is that we may trap ourselves from
further space endeavors if we allow too much debris to accumulate around the Earth (Torbet,
2019).
The alternative side to the argument of whether or not satellite constellations should
exist is that it would be beneficial for them to continue to grow in numbers if we assume as fact
that communications is a most significant factor benefiting mankind in every way. With
satellites already serving a multitude of different functions, many things have become reliant
on their existence, and their importance will only increase in the future. As previously
discussed, in the near future, satellite constellations will provide internet access to the whole
world, and at a much lower cost than previous satellite services, making communications more
affordable to all. They will enable areas that once did not have access to the internet to have
access, due to the lower cost and the further connectivity reach, as well as improve accessibility
and speed for all the places that already had the internet at their disposal (Starlink, n.d.).

62
Another benefit to having satellites is that they are mostly self-sustaining, providing themselves
their own energy through the use of solar panels, and requiring minimal ground infrastructure
to perform their functions. The simple ground equipment is easy to maintain and can also be
quickly altered or repurposed when desired. They are, therefore, relatively low-cost
infrastructures to operate and maintain. Additionally, with the satellites being in space rather
than on the ground, they are resilient to earth events, such as dangerous weather conditions,
man-made disasters, and social or political strife, and are unaffected by these occurrences. This
makes them reliable for emergency service communications, as well as serving as a backup for
cases where terrestrial infrastructure can no longer provide communication services (Acker et
al., 2011).

63
4.5: Invasive Species: A Case Study
Table of Contents
Table of Contents .......................................................................................................................... 63
Table of Figures ............................................................................................................................. 64
1: Introduction .............................................................................................................................. 65
2: Management in Specific National Parks ................................................................................... 66
2.1: Management of Cheatgrass ............................................................................................... 67
2.1.1: Zion National Park ....................................................................................................... 68
2.1.2: Rocky Mountain National Park .................................................................................... 70
2.1.3: Arches National Park ................................................................................................... 71
2.1.4:Yosemite Park ............................................................................................................... 71
2.2: Yellow Starthistle ............................................................................................................... 72
2.2.1: Pinnacles National Park ............................................................................................... 72
2.2.2: Yosemite National Park ............................................................................................... 73
2.3: Russian Knapweed ............................................................................................................. 74
2.3.1: Grand Canyon National Park ....................................................................................... 74
2.3.2: Arches National Park ................................................................................................... 75
2.3.3: Canyon Lands National Park ........................................................................................ 75
3: Invasive Plant Monitoring ......................................................................................................... 76
4: Data Collection .......................................................................................................................... 78
4.1: Satellites ............................................................................................................................. 78
4.2: Wearables .......................................................................................................................... 91
4.3: Implantables ....................................................................................................................... 95
References .................................................................................................................................... 97

64
Table of Figures
Figure 1: Prioritization Matrix for Invasive Plants ....................................................................................... 66
Figure 2: Drawing of Cheatgrass ................................................................................................................. 67
Figure 3: View of Zion Canyon .................................................................................................................... 68
Figure 4: A and B Coverage Ripgut Broom .................................................................................................. 69
Figure 5: Border of cheatgrass treatment with Cheatgrass on the left and native perennials right .......... 69
Figure 6: Map of Rocky Mountain National Park ........................................................................................ 70
Figure 7: Picture of Yellow Starthistle ......................................................................................................... 72
Figure 8: Picture of Russian Knapweed ....................................................................................................... 74
Figure 9: Graphic of Collector for ArcGIS in Action ..................................................................................... 76
Figure 10: Graphic of Collector for ArcGIS in Action ................................................................................... 77
Figure 11: Stack of 60 Starlink Satellites Just Before Launch ...................................................................... 78
Figure 12: SpaceX Falcon 9 Rocket at Launch ............................................................................................. 79
Figure 13: Illustration of Starlink’s Coverage with 12,000 satellites........................................................... 80
Figure 14: Multispectral Bands of Landsat 8 ............................................................................................... 81
Figure 15: Red Blue and Green Bands of Landsat 8 .................................................................................... 81
Figure 16: WorldView-4 Before Launch ...................................................................................................... 82
Figure 17: Artist RE Landsat 8 ..................................................................................................................... 83
Figure 18: Image of Singur Lake from Lansat 8 OLI imager ........................................................................ 84
Figure 19: Comparison of Multispectral and Hyperspectral Imaging ......................................................... 86
Figure 20: Nasa’s Helios Project .................................................................................................................. 88
Figure 21: Piccard’s Solar Impulse .............................................................................................................. 88
Figure 22: A Zephyr S Launch ...................................................................................................................... 89
Figure 23: Close up of a Loon Balloon ......................................................................................................... 90
Figure 24: Stratobus Mid Flight ................................................................................................................... 91

65
1: Introduction
Not all non-native species are invasive. To be deemed an invasive species, the species
must be both non-native and detrimental to the ecosystem in which it has taken root. To gain a
full understanding of the National Parks’ current invasive plant management program, three
invasive plants that each affect several National Parks were investigated; these plants are
Cheatgrass, Yellow Starthistle, and Russian Knapweed.
The management strategy that each national park takes is dependent on not only the
plant but also the conditions of that particular park. A plant that is a formidable challenge in
one park may only be a mild nuisance in another. Although a general management ideology
may be practiced system-wide, specifics are dependent on the park and plant. Monitoring, on
the other hand, is practically identical; as a result, techniques developed for one park can be
applied to almost any park. This case study will focus on monitoring techniques as best-in-class
practices can be used everywhere. The primary goal of this study is to understand the
technologies currently used in monitoring invasive plants, current technologies that could be
implemented, and technologies that could assist upon future advancements.

66
2: Management in Specific National Parks
Throughout the National Park system, individual parks categorize invasive plants by
priority levels. These priority levels determine the level of treatment a species receives. The
priority level of plants is determined by what is obtainable to manage and risk level of the weed
as seen in the prioritization matrix below.
Figure 1: Prioritization Matrix for Invasive Plants Image source: Prioritization Matrix for Invasive Plants, By C. Decker, 2019, (personal communication).
Public Domain.

67
2.1: Management of Cheatgrass
Figure 2: Drawing of Cheatgrass Image source: Drawing of Cheatgrass, Reprinted from File:Illuatration Bromus tectorumo, Prof. Dr. Otto
Wilhelm Thome, 1885, https://commons.wikimedia.org/wiki/File:Illustration_Bromus_tectorum0.jpg.
Public Domain.
Cheatgrass, one of the most invasive plants is not only detrimental to native plants but
hazardous to people as well. In addition to overshadowing native grasses, Cheatgrass
germinates earlier in the season, drying up by summer and making perfect fire fuel. The
primary locations that deal with Cheatgrass are Zion National Park, Rocky Mountain National
Park, Arches National Park, and Yosemite National Park.

68
2.1.1: Zion National Park
In Zion National Park, cheatgrass coverage reaches 70% of the box canyon floor,
Figure 3: View of Zion Canyon Image source: View of Zion Canyon, By C. Decker, 2005, (personal communication). Public Domain.
and with the foot traffic surpassing four million people annually, it is easy to see the fire threat
posed by the plant (D. Cheryl, personal communication, June 3, 2020).

69
Figure 4: A and B Coverage Ripgut Broom Image source: A and B Coverage Ripgut Broom, By C. Decker, 2005, (personal communication). Public
Domain.
As a result of the increased danger to guests, Zion has adopted a very aggressive three-tiered
management strategy of first burning the Cheatgrass to remove biomass, followed by the
application of the herbicide PLATEAU, and finishing by planting vigorous perennials to compete
with the Cheatgrass (McDaniel, 2008).
Figure 5: Border of cheatgrass treatment with Cheatgrass on the left and native perennials right Image source: Border of cheatgrass treatment with Cheatgrass on the left and native perennials right, By
C. Decker, 2005, (personal communication). Public Domain.

70
2.1.2: Rocky Mountain National Park
Figure 6: Map of Rocky Mountain National Park Image source: Map of Rocky Mountain National Park, Reprinted from File:NPS rocky-mountain-map.jpg,
By M Holly of U.S. National Park Service, 2013, https://commons.wikimedia.org/wiki/File:NPS_rocky-
mountain-map.jpg. Public Domain.
Because Cheatgrass is so widespread in Rocky Mountain National Park, it is not “actively
managed.” Though parkwide management and containment of the grass is currently unrealistic,
a management plan specific to some areas of the park is in place. Areas targeted for treatment
are those with high biodiversity or where essential wildlife habitats are being threatened (J.
Bromberg, personal communication, June 19, 2020). The 2018 invasive plant management plan
can be referenced for more information.

71
2.1.3: Arches National Park
In Arches National Park, the protocol for managing Cheatgrass comprises three
strategies: hand-pulling, applying herbicide and mowing the grass (before it has gone to seed).
Much like in Rocky Mountain National Park, Cheatgrass is widespread. Similarly, its
management is heavily targeted with a goal of spread prevention as opposed to eradication.
Areas prioritized are trailheads, seeding, and transfer locations for native plants that must be
maintained (L. A. Ballenger, personal communication, June 3, 2020). Of course, aesthetics are
also a priority, such as an area in front of the visitor center and trailheads.
2.1.4: Yosemite Park
Similar to many of the national parks, Cheatgrass in Yosemite National Park is treated
not with the goal of total eradication but rather to mitigate the need for treatment. In the
locations where Yellow Starthistle is treated, generally at higher elevations, the herbicide is
often used in the spring after it emerges. It is treated with glyphosate, and before it emerges in
the fall, the dry herbicide Rimsulfron is used. Along with Yellowstarthistle, Cheatgrass is among
the most problematic plants in Yosemite National Park (Dickman, 2018, 2020; G. J. Dickman,
personal communication, June 2, 2020).

72
2.2: Yellow Starthistle
Figure 7: Picture of Yellow Starthistle Image source: Picture of Yellow Starthistle, Reprinted from File:Centaurea solstitialis-2.jpg, By E Zelenko,
2009, https://commons.wikimedia.org/wiki/File:Centaurea_solstitialis-2.jpg. Copyright 2009 by Eugene
Zelenko. Reprinted with Permission.
Yellow Starthistle, with its 1-3-centimeter spines, is inedible to most wildlife with a
notable exception being goats; also, it can inflict pain upon park visitors. Yellow Starthistle’s
ability to produce an extraordinary volume of seeds and grow into the hot summer months
with the use of its taproot are the plant’s most problematic characteristics (Dickman, 2019).
2.2.1: Pinnacles National Park
In Pinnacles National Park, management of Yellow Starthistle is accomplished through a
variety of methods. When the target area is small, hand-pulling is an effective mitigation
strategy. However, with larger-scale infestations, hand-pulling quickly loses feasibility, so
herbicides and burns are used. In the bottoms land area, a prescribed burn is used, followed by
boom spraying of herbicide. In the event the herbicide application window is missed, brush
cutters are used to control the weed.

73
Interestingly, goats were tested as a biological control but were found to be not nearly
as effective as spot treating with herbicide. Mowing is another aspect of Yellow Starthistle
management. In the more mountainous areas of the park, a combination of brush cutting and
spot application of herbicide is utilized, taking special care to start uphill to prevent reseeding
of already treated areas (C. Gentzler, personal communication, June 5, 2020).
2.2.2: Yosemite National Park
In Yosemite National Park, Yellow Starthistle is targeted for annual treatment as it is one
of the most significant threats to Yosemite’s biodiversity. Although eradication is unrealistic,
the population has been reduced by 95% over the past ten years. The goal of treatment is to
“reduce populations to the point where minimal treatment” is necessary (G. J. Dickman,
personal communication, June 2, 2020). Grid surveys of Yellow Star-Thistle occur on an annual
basis in El Portal. Once the plant is identified, it is treated primarily with herbicides, and much
like Cheatgrass, the herbicide used is dependent on the time of year in the spring.
Aminopyralid, a thistle specific herbicide is applied after that Glyphosphate is spot sprayed
(Dickman, 2018, 2020).

74
2.3: Russian Knapweed
Figure 8: Picture of Russian Knapweed Image source: Picture of Russian Knapweed, Reprinted from File:Centaurea maculosa Bozeman.jpg, By
M Lavin, 2009, https://commons.wikimedia.org/wiki/File:Centaurea_maculosa_Bozeman.jpg. Public
Domain.
2.3.1: Grand Canyon National Park
In Grand Canyon, national park Russian Knapweed is treated by cutting the plant and
applying herbicide directly to the stump of the plant.

75
2.3.2: Arches National Park
Because Russian Knapweed is not as “ubiquitous” as Cheatgrass in Arches National Park,
there is a better chance to limit and contain the species. The primary control method is a
herbicide called Miles Stone that is Knapweed specific, so it does not profoundly affect other
plants in the area. In areas where the population is too large to treat with herbicides, biological
controls have to be used. Biological controls for the Russian Knapweed consist of the Russian
Knapweed Galls Wasp and Russian Knapweed Galls Midge, which forms bulbs on the Knapweed
that draw nutrients, preventing it from flowering and seeding as it usually would (L. A.
Ballenger, personal communication, June 3, 2020).
2.3.3: Canyon Lands National Park
Canyon Lands national park is managed in much the same way as in Arches with
primarily biocontrols of Galls Midge and Wasp.

76
3: Invasive Plant Monitoring
Currently, invasive plants in national parks are cataloged and assessed by hand. The two
main ways invasive plants are cataloged include hired employees and volunteers. The primary
system for using volunteers is through citizen science. The main issue with using volunteers is
training; many volunteers are not familiar with plant identification skills. Volunteers from
citizen science groups do not have the scientific know-how to identify invasive flora species
consistently; however, more professional groups such as those that are college-based can be
helpful in this area. For parks that have the budget, hiring dedicated employees for invasive
plant management allows for more intensive training as well as the use of more complex tools
such as Collector for Arc Gis (C. Gentzler, personal communication, June 5, 2020). This tool will
enable one to collect information on a target species on location and mark that location on an
interactive map.
Figure 9: Graphic of Collector for ArcGIS in Action Image source: Graphic of Collector for ArcGIS in Action, Reprinted from ArcGIS Collector By ArcGIS,
accessed 2020, https://www.esri.com/en-us/arcgis/products/arcgis-collector/overview. Copyright Esri
n.d. Reprinted with permission.
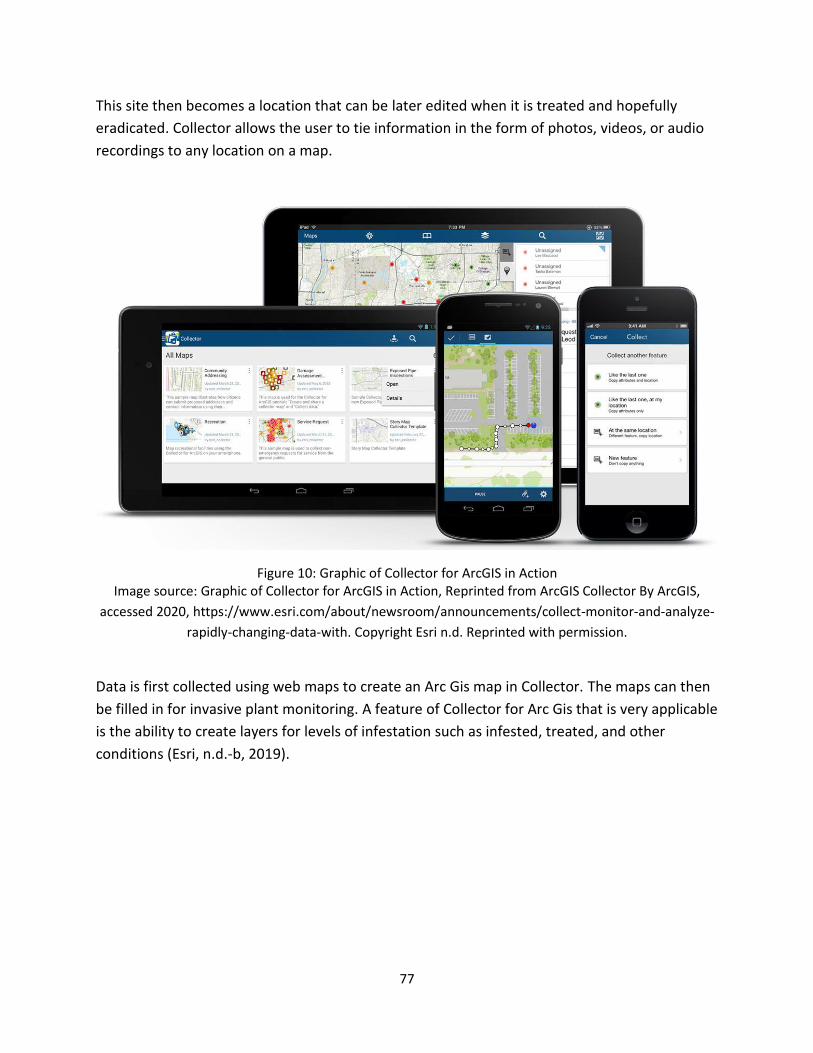
77
This site then becomes a location that can be later edited when it is treated and hopefully
eradicated. Collector allows the user to tie information in the form of photos, videos, or audio
recordings to any location on a map.
Figure 10: Graphic of Collector for ArcGIS in Action Image source: Graphic of Collector for ArcGIS in Action, Reprinted from ArcGIS Collector By ArcGIS,
accessed 2020, https://www.esri.com/about/newsroom/announcements/collect-monitor-and-analyze-
rapidly-changing-data-with. Copyright Esri n.d. Reprinted with permission.
Data is first collected using web maps to create an Arc Gis map in Collector. The maps can then
be filled in for invasive plant monitoring. A feature of Collector for Arc Gis that is very applicable
is the ability to create layers for levels of infestation such as infested, treated, and other
conditions (Esri, n.d.-b, 2019).

78
4: Data Collection
When any invasive plant is surveyed within the national park, several data points must
be collected. The first piece of information is the corresponding location that is traditionally
collected using a handheld GPS or smartphone. In addition, the size of the infected area needs
to be collected as well as information on how the invasive plants are distributed within the total
area infested (C. Gentzler, personal communication, June 5, 2020; R. Key, personal
communication, June 30, 2020).
4.1: Satellites
Satellites can provide more excellent, unobtrusive coverage than most observation
methods. Unlike drones, satellites are capable of observing Earth from high above. An example
of an advanced satellite system is the Starlink constellation by SpaceX which could provide WiFi
to a park, thus acting as the connective framework for a smart park. The end goal of the Starlink
system is a constellation comprised of 42,000 satellites. As of 2020, there are 540 satellites
launched and a planned 12,000 within the next five years. The satellites are launched in batches
of sixty with each satellite weighing 260 kg.
Figure 11: Stack of 60 Starlink Satellites Just Before Launch Image source: Stack of 60 Starlink Satellites Just Before Launch, Reprinted from SpaceX Starlink
Broadband Satellite Deployment over Earth, By S Jurvetson, 2019,
https://www.flickr.com/photos/jurvetson/47926209216. Public Domain.

79
Figure 12: SpaceX Falcon 9 Rocket at Launch Image source: SpaceX Falcon 9 Rocket at Launch, Reprinted from File:Launch of Falcon 9 Using
carrying CRS-6 Dragon (171706244642).jpg, By SpaceX, 2015,
https://commons.wikimedia.org/wiki/File:Launch_of_Falcon_9_carrying_CRS-
6_Dragon_(17170624642).jpg. Public Domain.
Using SpaceX’s Falcon 9 rocket, the satellites are launched into a low orbit of 550 km. At
550 km, they will navigate using the first krypton ion propulsion system, all powered by a single
solar array for the duration of their 1-5 year lifespan. Upon reentry, nearly all components will
burn up. Starlink is designed to provide WiFi to people worldwide, eliminating the dead zones
that can limit connectivity based projects.
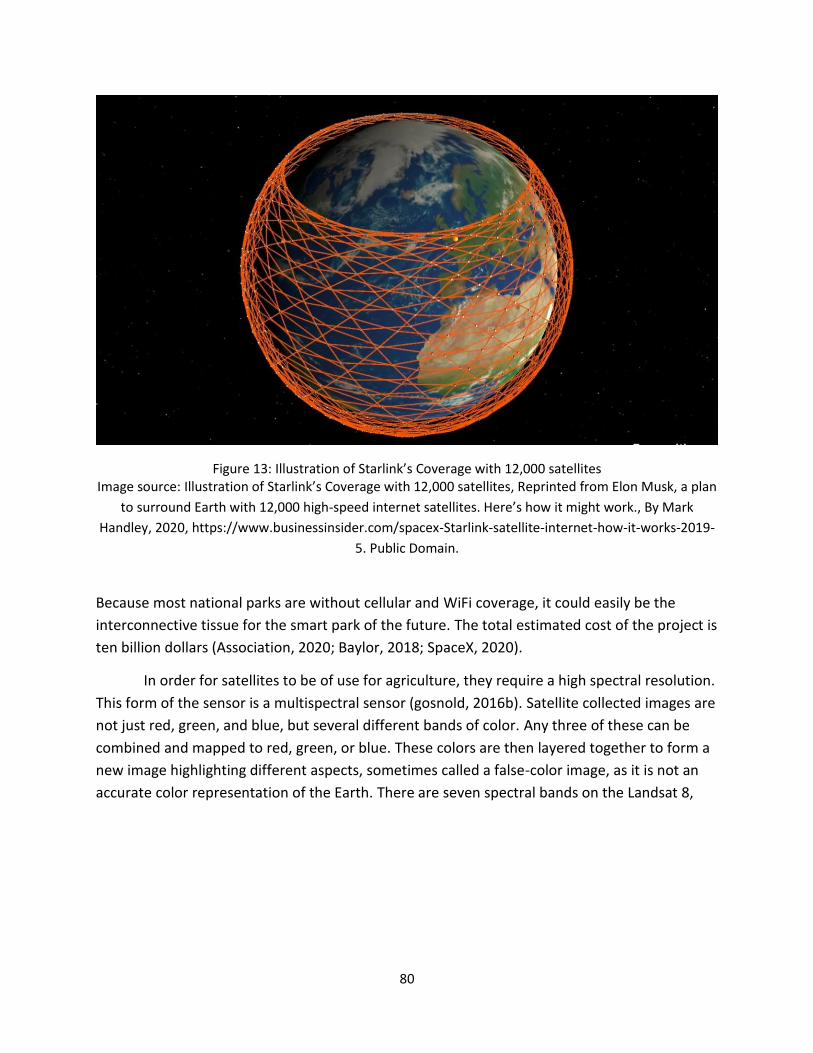
80
Figure 13: Illustration of Starlink’s Coverage with 12,000 satellites Image source: Illustration of Starlink’s Coverage with 12,000 satellites, Reprinted from Elon Musk, a plan
to surround Earth with 12,000 high-speed internet satellites. Here’s how it might work., By Mark
Handley, 2020, https://www.businessinsider.com/spacex-Starlink-satellite-internet-how-it-works-2019-
5. Public Domain.
Because most national parks are without cellular and WiFi coverage, it could easily be the
interconnective tissue for the smart park of the future. The total estimated cost of the project is
ten billion dollars (Association, 2020; Baylor, 2018; SpaceX, 2020).
In order for satellites to be of use for agriculture, they require a high spectral resolution.
This form of the sensor is a multispectral sensor (gosnold, 2016b). Satellite collected images are
not just red, green, and blue, but several different bands of color. Any three of these can be
combined and mapped to red, green, or blue. These colors are then layered together to form a
new image highlighting different aspects, sometimes called a false-color image, as it is not an
accurate color representation of the Earth. There are seven spectral bands on the Landsat 8,

81
Figure 14: Multispectral Bands of Landsat 8 Image source: Multispectral Bands of Landsat 8, Reprinted from Florida Everglades LDCM Band Remix,
By A Kekesi of NASA, 2013, https://svs.gsfc.nasa.gov/4040. Public Domain.
Figure 15: Red Blue and Green Bands of Landsat 8 Image source: Red Blue and Green Bands of Landsat 8, Reprinted from Florida Everglades LDCM Band
Remix, By A Kekesi of NASA, 2013, https://svs.gsfc.nas\a.gov/4040. Public Domain.

82
a standard multispectral sensor: Costal/ Aerosol, Blue, Green, Red, Near Infrared, Shortwave
infrared one, short wave infrared 2, and Cirrus (NASA Scientific Visualization Studio, 2016; USGS
EROS, 2013). These are the OLI multispectral bands 1-7 and 9. Band 8, called the panchromatic
band, collecting images in black and white at a higher resolution of 15 meters. Band 10 and 11
the Thermal Infrared (TIRS) 1 and 2 have a resolution of 100 but are resampled back down to 30
meters, so they are compatible with the other OLI bands (USGS EROS, 2013).
Regarding earth observation monitoring, the most useful earth observation satellite for
plant observation was WorldView-4, which launched on November 11th, 2016, which,
unfortunately, was deemed unrecoverable due to gyroscope failure on January 7th, 2019
(Kramer, n.d.).
Figure 16: WorldView-4 Before Launch Image source: WorldView-4 Before Launch, Reprinted from WorldView-4, By Lockheed Martin, 2016,
https://www.flickr.com/photos/lockheedmartin/27689777664/in/photolist-JYAhwi-2jf8Vrp-2jgm9Fn-
K3uNx3-KEMXwQ-K3uQYq-MeANTw-2jcmxkc-JbRmcJ-2jgm9Cg-P4cP7W-NW8ngo-2jgqkdF-55W6-
NYCKkn-. Cropyright Lockhead Martin, Reprinted With Permission.

83
The WorldView-4, formerly the GeoEye-2, costing $835 million, had a nadir color
resolution of 1.24 m (Digital Globe, 2015; How Much Did the World View 4 Cost - Google Search,
n.d.). The resolution is the size of the pixel, and nadir means the satellite is directly above the
point it is imaging. Compare this 1.24-meter resolution to the 30-meter resolution for the color
of the Landsat 8 launched on February 11th, 2013.
Figure 17: Artist RE Landsat 8
Image source: Artist RE Landsat 8, Reprinted from Landsat Celebrates 40 Years of Observing Earth, By
NASA Goddard Space Center, 2011, https://www.flickr.com/photos/gsfc/7630269434. Public Domain.

84
Figure 18: Image of Singur Lake from Lansat 8 OLI imager Image source: Image of Singur Lake from Lansat 8 OLI imager, File:Singur Landsat 8 OLI 20171102
cc431.png, By P. Passy, 2019,
https://commons.wikimedia.org/wiki/File:Singur_Landsat_8_OLI_20171102_cc431.png. Public Domain.
This satellite cost $855 million, and it can be seen that the WorldView-4 sensor has a
superior spatial resolution for invasive plant monitoring purposes (Leon, 2014; USGS EROS,
2013). While the Landsat 8 is the current state of the art when it comes to spectral resolution
the WorldView 3, which is still in orbit, has the same multispectral spatial resolution as the
WorldView 4 at nadir of 1.24 m. The WorldView 3 was launched on August 13th, 2014, with a
mission duration of 7.25 years and an estimated life expectancy of 10 to 12 years. The
multispectral bands of the WorldView-3 are red, red edge, coastal, blue, green, yellow, near-
IR1, and near-IR2. While not the same as Landsat 8 they work in the same way. The satellite
also boasts an 8 Short Wave Infrared (SWIR) bands from 1195 nm – 2365 nm and 12 CAVIS
bands mapping clouds and other water features spanning 405 nm – 2245 nm (Satellite Imaging

85
Corporation, 2001). Using the images collected from these satellites is much more affordable
and accessible than hyperspectral datasets talked about later.
One area to look into for invasive plant monitoring is the military and what satellites
they use for imaging; these would be spy satellites. Keyhole-class (K.H.) goes by the code name
Kennan and has monitored Earth for 30 years. The KH-12 satellite cost $1 billion and looks
similar to the Hubble Space Telescope, the significant difference being that instead of imaging
space, it images to Earth. The Lacrosse-class radar-imaging satellites weight 15 tons and help to
fill in the gaps in the KH-12’s coverage. The specifics of these satellites are classified; however,
it is believed that at least one is overhead at any given time. These satellites are the cutting
edge in spatial resolution with a panchromatic resolution of 5-6 inches, meaning anything 5
inches or larger is identifiable (What Is a Keyhole Satellite and What Can It Really Spy On?,
2000). The primary issue with using keyhole satellites for invasive plant monitoring is their lack
of spectral resolution relying entirely on spatial resolution.
Observation satellites can increase their resolution by using low orbit or by using large
optics, and both have their drawbacks. With low orbit satellites, high resolution can be reached
with less expensive individual satellites. However, in order to get the same level of coverage as
geosynchronous orbit satellites, constellations, such as Starlink, must be used. Several
observation constellations are functioning similarly to SpaceX’s Starlink. There is the Black Sky
constellation, Skybox, UrtheCast, the SEEME project, and the Scout constellation from the
digital globe (gosnold, 2017). More astronomical mirrors are needed to get higher resolution in
a higher standard orbit. Satellite optics are traditionally made with glass mirrors, but the future
points to membrane optics as these are more substantial, lighter, and much cheaper (gosnold,
2016a, 2016b, 2016c, 2017).
With replicated diffractive optics of the MOIRE, contracted by DARPA in 2010, apertures
20 meters in diameter and larger still are made possible while the largest classed based
telescope (the James Web Telescope) is 6.5 meters dwindles in comparison. This 20-meter
diameter is needed to get a resolution of 1-m in geosynchronous orbit (Ball Aerospace, n.d.).
Through the use of membrane technology, mass reduction of seven times and more
importantly, cost reduction of ten times from that of a rigid mirror bases system is obtainable
(gosnold, 2016c).
Alien Invasive Plants (AIPs) thrive when their competition, the native flora, is recovering,
often from wildfire leading to many studies on invasive plant recovery after a wildfire. Robust
image classification algorithms are needed to compensate for the low resolution of satellite
sensors. AIPs can be identified by either their color signature or their spectral reflectance.
Multiple images from different times of year are essential to encapsulate the vegetation as it
progresses through its life cycle. A high spectral resolution like Landsat 8 or high spatial

86
resolution like World-View 4 is needed for proper identification. Even with multispectral
sensors, medium to high spatial resolution is essential (L. Royimani et al., 2019).
Figure 19: Comparison of Multispectral and Hyperspectral Imaging Image source: Comparison of Multispectral and Hyperspectral Imaging, Reprinted from
File:MultispectralComparedToHyperspectral.jpg, By NASA, 2007.
https://commons.wikimedia.org/wiki/File:MultispectralComparedToHyperspectral.jpg. Public Domain.
Hyperspectral datasets allow higher spectral resolution and can lead to better
identification, but the size of such a dataset can be overwhelming, not to mention
hyperspectral data is costly. Using LiDAR in combination with satellite sensing data increased
the identification accuracy of remote sensors from 68%, 63%, and 64% for AISA, WorldView-2,
and LiDAR to 78% for AISA with LiDAR using a hyperspectral Sensor and 74% for WorldView-2
with LiDAR. The fusion of data requires a lot of computing power, and the Bidirectional
Reflectance Distribution Function (BRDF) needs to be taken into account as the varying angles
from multiple data sources can lead to false positives. The most significant advantage that non-
parametric image classifiers have over parametric image classifiers is their ability to identify
multiple classifications within the same pixel. Parametric classifiers suffer from the mixed pixel
problem. Vegetation indices document all wavelengths of light that any plant emits, including
the light reflected by not just the leaves but the stem and branches as well. There are several

87
vegetation indices-- the Normalized Difference Vegetation Index (NDVI), Principal Component
Analysis (PCA), and Enhanced Principal Component Analysis (EPCA)--that catalog the entire
range of light reflected by all parts of the plant. When these vegetation indices are used in
conjunction with remote sensors, detection accuracy is increased. The most significant
advantage that non-parametric image classifiers have over parametric image classifiers is their
ability to identify multiple classifications within the same pixel. Non-parametric image classifiers
outclass parametric ones that suffer from the mixed pixel problem. When using either class of
algorithm, the swath width is more crucial than resolution.
Although the maximum likelihood performed well (76.93%), the Mahalanobis Distance
performed badly with an overall accuracy of 66.04%. On the other hand, both the non-
parametric classifiers were successful (76.25% and 76.95% for ANN and SVM, respectively) in
spectral separation between different vegetation classes.
There is a tradeoff that occurs between the resolution and the cost of the data that is
used. Future research should explore the use of freely available medium resolution datasets in
conjunction with “Advanced and Robust” machine learning algorithms for image detection.
Work must be continued on the effectiveness of using these classification algorithms with the
newly multispectrectral datasets with an improved spectral and spatial resolution (L. Royimani
et al., 2019).
An alternative to using satellites is using high altitude pseudo satellites or HAPs. HAPs
are stationary or semi-stationary crafts that operate at an altitude of 20 km or 65,000 ft. HAPs
come in 2 primary forms: solar planes and balloons. As far as solar planes go, there are a few
examples such as NASA’s Helios project, Piccard’s Solar Impulse, Zephyr S, and Zepher T.

88
Figure 20: Nasa’s Helios Project Image source: Nasa’s Helios Project, Reprinted from Past Projects: Helios Prototype Solar-Powered
Aircraft, By NASA 2009, https://www.nasa.gov/centers/dryden/history/pastprojects/Helios/index.html.
Public Domain.
Figure 21: Piccard’s Solar Impulse Image source: Piccard’s Solar Impulse, Reprinted from Solar Impulse in fluffy clouds, by P. Thoeny, 2016,
https://www.flickr.com/photos/peterthoeny/26515846422/in/photolist-Gp7DkU-JefPi7-qE1ykh-
K5PSDP-HsaohX-GNZH6x-GXbhue-Gr7uDy-GSAQjJ-vogZBL-GAWwAa-nRQi2a-auizCw-vTZdVH-nxygLw-
KVz7vH-JjzoNN-GUsyKm-nQ3Rsn-HqGjYJ-G6WVwK-SdNQb-GFX3A2-Ymqg8k-GPBdTV-G2EPwq-qmS6Y7-
Ykx93F-LAWSxF-GQEcKL-NmEDvs-9DRg7W-JiHfVC-etLrBo-etHhfM-JXmyvs-GuTZ5N-9L9Yv8-oAvFuk-
GUjB57-G2V3Mp-tz8oaG-JZBqwt-p4guCR-GBQKpo-K4p62r-HWb63o-GvrrJw-G85tX3-HqGwuQ. Public
Domain.

89
Figure 22: A Zephyr S Launch Image source: A Zephyr S Launch, Reprinted from QinetiQ Zephyr Launch, By QinetiQ Group, 2005,
https://www.flickr.com/photos/qinetiq/4638654874/in/photolist-8eTd4v-84Ujub-ecUXeM-cLXXvb-
cLXPxW-ecUXee-ed1Bhw-cLXPsy-cLXPBh-g4meme-g4kFiE-ed1BgW-ed1Bj5-g4kFNh-ecUXgt-ed1Bj9-
ed1Bhd-cLXPn3-cLXPbU-cHdhto-cHdhqu-cHdhmG-cDGJpC-cdhnLh-cLXPuQ-cLXPpG-cLXPjW-cLXPho-
cDGAkf-bVV2eV-cdhnQ3-282DXTZ. Public Domain.
The Zepher S is the most complete of all these projects with the Zephyr T its larger
evolvement. Looking at balloons, there are two very different examples: Loon and Stratobus
(gosnold, 2019). The Loon project, by Google, is not for observation but rather for
communication.

90
Figure 23: Close up of a Loon Balloon Image source: Close up of a Loon Balloon, Reprinted from File: Google Loon – Launch Event.jpg, By
Flicker User: iLighter, 2013, https://commons.wikimedia.org/wiki/File:Google_Loon_-
_Launch_Event.jpg. Public Domain.
Powered by a solar panel, similar to satellites, and by pumping air in and out of the inner
chamber, the loon balloons rise and fall using air currents to maneuver as they provide cellular
coverage to areas without it. (personal communication, owner of Loon). The Stratobus,

91
Figure 24: Stratobus Mid Flight Image source: Stratobus Mid Flight, Reprinted from File:Stratobus artiste.jpg, By Thales Alenia Space –
Photo presented by Jean-Philippe Chessel during a conference talk on 2016-03-01, 2016,
https://commons.wikimedia.org/wiki/File:Stratobus_artiste.jpg. Public Domain.
unlike the Loon Balloon, carries both communication and surveillance equipment like the solar
planes in its packages and is stabilized by propellers powered by solar panels that actively fight
the wind, guaranteeing it a stationary position for an entire year. The Stratobus can survey the
ground several hundred kilometers away (Thales Alenia Space, 2018). A significant advantage of
the HAPs is the ability to interchange the package, unlike satellites, the resolution can be
changed, and one HAP can provide not only surveillance but communication as well. HAPs also
have the benefit of not being restricted to a fixed orbit.
4.2: Wearables
Satellites can offer an observation of invasive plants from above, but lack resolution. In
order to adequately monitor invasive plants, wearable technology can be used to monitor from
the ground. Wearables are any technologies that can be worn, whether that be integrated into
garments or dedicated devices.

92
There was a time were appliances lasted a lifetime; the top-loading washing machine
comes to mind as a relic and layover from the industrial era. These devices were able to last as
long as they did because they were entirely mechanical with significant components. As devices
with advanced components became smaller and more computerization took hold, the devices
began breaking sooner. With modernization also came the replacement culture of getting an
upgrade every couple of years. With entirely computerized devices such as wearables, it has
been incredibly tricky building them to last. However, one future direction is the permanence of
technology, which is a necessity for devices such as implants and smart clothing. The durability
and lifespan of technology must increase. In the future, the wearables of the medical industry
will need rigorous testing (English, 2020).
As power sources get smaller, so do wearables. With wearables, the Internet of Things
can transition into the internet of bodies (IoB) or the Internet of Medical things (IoMT). This
sector bleeds together wearables and implantables with swallowable pills already in use; these
allow for scans and release medicine at the command of the doctor. Wearables are an essential
part of this structure as they allow for persistent health surveillance relaying information to
one’s medical professionals in real-time. Wearable technology could be used to detect the
often missed cardiac arrhythmias. Wearables can be used to monitor fetal health and bladder
levels through skin sensors placed on the abdomen (Maxwell, 2019).
One form of wearables is those that are audio-based; these are called “hearables” by
some. An interesting example of “hearables” is the Bose Frames, which are sunglasses with
built-in speakers that direct sound at the user’s ear so that only the user can hear without
obstructing their hearing. What is more intriguing is that these glasses can provide the wearer
with augmented audio reality with front-facing sensors. The Frames detect what the user is
looking at and can provide audio-based information. The initiative named “Bose AR” is different
then most augmented realities as it does not obstruct one’s vision providing input only through
sound (Bullard, 2019). Another set of smart glasses made by Intel takes a different approach to
augmented reality; the Vaunt uses a low powered laser paired with a mirror projects a
monochromatic image onto the retina of the wearer, one has to look down slightly to see the
image making it less intrusive (Bohn, 2018).
The future will see wearables disappear into an ensemble in the form of fabrics or
sensors integrated throughout articles of clothing. Innovative energy sources can supplement
or even replace standard battery power for wearables. These energy sources include solar
panels, leveraging body heat, and kinetic based solutions. As society becomes more statistic
oriented than in the past, people will demand the same confidence from their wearables. As
wearables become more and more a part of people’s lives, boundaries and restrictions will
need to be easily enactable by users, allowing them to have control over who and what
notifications they receive. People will also have some level of daily control over the data their
93
devices generate. The very thing that makes people, people, might make wearables, wearables
in the future. Like A.I., they may gain sentience and the ability to learn from their mistakes.
Wearables allow for not one but a plethora of sensors providing data from different parts of the
body working together to build an image of a full person. Wearables will integrate entirely with
another smart tech such as the smart homes. One will not need to think about unlocking their
door or changing the temperature of their house (Rithmio, 2015).
Concerning the National Parks, an example of wearables for monitoring external
circumstances would be wearables for gas detection. Nanotubes (CNTs) are one promising
technology for wearable gas sensors. Standard CNTs can detect NO2 at a concentration of 0.25
ppm at room temperature. Infusing CNTs with rhodium (Rh) or platinum (Pt) allows benzene to
be detected in concentrations that are less than 50 ppb. Silver (Ag) nanocrystals can be utilized
in the production of CNTs that effectively detect NH3. These sensors are fast and selective. The
process is improved by using Ag NC and multi-walled CNTs to make Ag-NCs-MWCNT. The
biggest hurdle with carbon nanotube technology is integrating it into wearables. One solution
was to use bundles of CNTs on cloth and paper. These had detection levels of 250 ppb for NO2
and 500 ppb for Cl2. Another technique utilized a sprayable compound that could be applied to
electrospun fiber (Wang et al., 2017). These wearables do not directly monitor plants, but they
could monitor air pollution within the parks monitoring circumstances external of the wearer.
While some wearables are used for lifestyle needs, others are designed for the
healthcare field. With hospital costs ever-increasing, it stands to reason that people will do
everything they can to minimize the time they spend in health care facilities. In some cases, this
means going home sick, at which point individuals need accessible monitoring devices with
quality equitable with that offered in the hospitable. As increasing life spans are coupled with
increasing independence, assisted living facilities may become less necessary. This need to live
at home sometimes without assistance increases the need for at-home monitoring. Monitoring
devices have been able to miniaturize at comparable rates to their power sources. With nearly
every person carrying a miniaturized computer known as a smartphone on their person,
computing power need not be self-contained within any given monitoring device, but rather it
can be performed partially or entirely by one’s cellular device. Some people with heart issues
have issues with their heart rhythm, which is referred to as an Arrhythmia. In order to
understand the irregular rhythm, a patient’s heart must be monitored for an extended period,
often between 24 and 48 hours. The two standards for monitoring are a Holter monitor, which
monitors for 24 hours, allowing the physician to view reading after returning and intermittent
recorders sending bursts. The issue is that both of these methods could miss the Arrhythmias
(EMBS, n.d.).
On the other hand, the CardioNet Mobile Cardiac Outpatient Telemetry (MCOT) device
monitors a patient’s heart for a continuous 21 days relaying information first to the CardioNet

94
Center and then to one’s physician. For some 21 days is not a significant duration of monitoring,
but Medtronic’s Insertable Cardiac Monitor, this device records in a loop overwriting everything
past a few minutes, so when an incident occurs, one can use the activator and the minutes
before the incident, will be saved. Smart tattoos are a groundbreaking way to monitor electrical
signals within the body. A product of the combined work of the University of Illinois and its
Singaporean colleagues, temporary tattoos, contain electrical sensors that are flexible and
stretchable (EMBS, n.d.).
Heart arrhythmias, sleep disorders, and the heart activity of premature babies can all be
monitored with these devices. The device communicates via a wireless transmitter that
provides power supplemented by solar cells. Input can be recorded from one’s vocal cords,
even using it as a human to computer interface. Interpreting chemical information from the
tattoos is one hope of the developers. At Texas A&M University, researchers are working on
inks that can be injected into the dermis layer of the skin. These microparticles will then change
color in correspondence to variations on blood chemistry. These color changes would not
disturb the patient, however, as they are only visible under a special light. Devices to monitor
these microparticles could come in many forms, such as wearables requiring active input or
implantable versions (EMBS, n.d.). Wearables focused on here are for internal monitoring
rather than external monitoring; they could provide the national parks with information on
their visitors. Also, the trends in wearable development will hold for external monitoring
wearables.
All of the technologies previously discussed except for the CNT based gas monitor were
for internal monitoring. In other words, the majority of wearable technologies are for
monitoring a person’s circumstances and not their surroundings, which is not very helpful for
invasive plant monitoring. One wearable technology that would be useful for invasive plant
monitoring is wearable cameras, and they come in many forms. Undeniably the most popular
wearable cameras are the GoPro series, and these are already pretty mainstream within the
thrill-seeker community. However, GoPros are not a device likely to be worn around 24/7 or
even most of the time by thrill-seekers, let alone the everyday person. The devices that would
be applicable for invasive plant monitoring would be those that can integrate into one’s daily
life. A wearable camera that is very interesting and would be applicable for this purpose is the
OPIKIXONE cameras with a charging egg giving it a similar appearance to Apple’s air pods. This
pair of hands-free cameras can connect to a variety of mounts for necklaces, a ring, or even the
side of glasses, and only weighing 11 grams will hardly be noticeable; the current price is $295.
Another interesting concept that is a little less versatile are glasses with built-in cameras such
as the spectacles 2 (Carte, 2019; Imperiale, 2019; Johnson, 2020). Wearable cameras and any
camera on the ground allow for invasive plants obstructed by a canopy in wooded areas. They
can also allow for higher resolution coverage than current satellites.

95
4.3: Implantables
Jim Hunter, the chief scientist at Greenwave Systems, described implantables as
“technology that is installed into body tissue to measure surrounding tissue, controlling
biological function, or dispersing drugs.” IUDs and pacemakers are examples of implantable
technologies that have been around for decades, the former being a device to prevent
pregnancy and the latter being a device to promote a regular heart rhythm through electrical
pulses. However, the future of implantables might be a lot less believable. One future use-case
would be to lessen symptoms of Parkinson’s and Alzheimer’s through the use of a brain
implant. Implantables could see insulin pumps for people with diabetes go extinct as “artificial
pancreas[es]” that could release insulin directly into the bloodstream after being implanted into
the abdomen come to market. The blind could regain their sight through the use of retinal
implants. Smart pills that connect to BlueTooth could be implanted to tell one’s physician the
medications they have taken. Smart tattoos could monitor vital signs. Although they are not
commonplace, these products are in testing and will hopefully hit the market soon (Felicetti,
2020).
Implantable technology is the next logical step after wearable technology. The first
implantable cellphone and chip tech should be available by 2050 but maybe available as early
as 2023. Implementing implantable technology would transition the internet of things into the
internet of people (Zhortech, 2019). One study predicts that the U.S. military will have cyborg
soldiers by 2050, which would be the ultimate integration of person and machine (Emanuel et
al., 2019; Rempfer, 2019). With implantables comes the “Second Machine Age” as Erik
Brynjolfsson, director of MIT said instead of machines supplementing muscle power, they
would supplement mental fortitude.
The World Economic Forum’s global agenda council on the Future of Software and
Society met in 2015 and predicted 21 tipping points at which innovative technologies become
mainstream; one of these tipping points was on implantable technologies. The prediction is that
the first implantable phone will be on the market by 2023, and by 2025 85% of participants
expect the tipping point to have happened. Additionally, the study spoke of digital tattoos
capable of tracking bodily processes as well as unlocking cars and smartphones. “Smart dust” is
the name used to describe microcomputers used to perform various tasks within one’s body.
The final technology mentioned was a smart pill that will tell patient’s physicians how they are
reacting to medications (World Economic Forum, 2015).
A trend that comes to implantable technologies is turning people’s disabilities into
abilities. An example of this would be 25-year old James Young, whose prosthetic arm has a
built-in flashlight and personal drone. One futurist (Pearson), who is successful with 85 percent
96
of his predictions, believes that seamless integration between man and machine will be the
result of prosthetic progression. Voluntary implants will become available to increase strength
(Maxwell, 2019).
NFC and RFID chips are a very common avenue of implantable technology along with
implantable magnets. The two main RFID tags are xEM and xNT. The former is most often used
to unlock doors, and the latter is readable by the RFID scanner on the majority of smartphones.
The previously mentioned bio magnets are used to sense magnetic fields or even lift an object
that is small enough. The new cryptobiotic implantable the Vivokey Spark contains an ISO15693
and NFC Type 5, which operates at 13.56 MHz, meaning the reader of any cellphone will be
compatible. The Vivokey is used for identity authentication using OAuth2 + OpenID Connect; it
can be used to verify multiple purchases as well. One prevalent member of the body
augmentation community, Amanda Plimpton, believes that aesthetic implantables are the next
step and the firefly is the first light up implant using tritium. Something to consider with
implantables is that all the current chips are “passive” powered by the devices that scan them
and lacking dedicated batteries, this can be a real issue, but also alleviates the fear that their
implants could track people. Active implants with batteries for humans like those for livestock
that monitor vital signs and fertility will change the world of implantables. Active implants could
include communicating with one’s phone or BlueTooth headphones (Wilkins, 2019). In addition
to the only chips rated for human implantation currently being passive, there are no GPS
trackers that can fit in a human implantable. Active implantable trackers do exist for cattle, as
previously mentioned, and these will eventually be available for humans.
Implantable cameras face many issues today as these would require partial implantation, which
has an extremely high rate of infection. In the future, cameras might augment the eyes
capturing everything a person sees. With the quickly expanding field of neuroscience, the
future might see commercially available brain augmentations. An implantable tracker could be
used in tandem with a wearable camera to tie footage that is collected in the park to geological
locations within the park. With implantables being the extension of wearables, it makes sense
that many of the promising wearable technologies will eventually become implantable
technologies. This includes the wearable CNT based gas sensors and maybe sound sensors that
could be implanted in the ear to enhance and record the way people hear the world.
97
References
Association, P. (2020, March 31). Starlink: Everything you need to know about the network of satellites. Evening Express. https://www.eveningexpress.co.uk/news/Starlink-everything-you-need-to-know-about-the-network-of-satellites/
Ball Aerospace. (n.d.). Ball Aerospace—MOIRE. Retrieved June 23, 2020, from https://www.ball.com/aerospace/programs/moire
Ballenger, L. A. (2020, June 3). Invasive plants in the National Parks [Personal communication]. Baylor, M. (2018, May 17). With Block 5, SpaceX to increase launch cadence and lower prices.
NASASpaceFlight.Com. https://www.nasaspaceflight.com/2018/05/block-5-spacex-increase-launch-cadence-lower-prices/
Bohn, D. (2018, February 5). Intel is making smart glasses that actually look good. The Verge. https://www.theverge.com/2018/2/5/16966530/intel-vaunt-smart-glasses-announced-ar-video
Bromberg, J. (2020, June 19). RE: Invasives Assessment and Management [Personal communication].
Bullard, G. (2019, April 4). Now Hear This: Augmented Reality Comes to Audio. Nieman Reports. https://niemanreports.org/articles/now-hear-this-augmented-reality-comes-to-audio/
Carte, B. (2019, May 14). These Wearable Cameras Bring A Whole New Perspective to Your Videos. Best Products. https://www.bestproducts.com/tech/gadgets/g3110/best-wearable-video-cameras/
Center, N. G. S. F. (2011). Landsat Celebrates 40 Years of Observing Earth [Photo]. https://www.flickr.com/photos/gsfc/7630269434/
Cheryl, D. (2020, June 3). [EXT] invasive plant info [Personal communication]. Dickman, G. J. (2018). NPS_Yosemite_2018_IPM_Work_Plan.pdf. https://www.cal-ipc.org/wp-
content/uploads/2019/04/NPS_Yosemite_2018_IPM_Work_Plan.pdf Dickman, G. J. (2019, July 19). Invasive Plants—Pinnacles National Park (U.S. National Park
Service). https://www.nps.gov/pinn/learn/nature/invasiveplants.htm Dickman, G. J. (2020). Invasive Plant Management Program 2020 Work Plan. 34. Dickman, G. J. (2020, June 2). [EXT] Invasive plant treatments in Yosemite [Personal
communication]. Digital Globe. (2015). WorldView-4 Data Sheet.
https://content.satimagingcorp.com.s3.amazonaws.com/static/satellite-sensor-specification/WorldView-4-Satellite-Specifications
Emanuel, P., Walper, S., DiEuliis, D., Klein, N., Petro, J. B., & Giordano, J. (2019, October). CCDC CBC-TR-1599, Cyborg Soldier 2050: Human/Machine Fusion and the Implications for the Future of the DOD. APAN Community. https://community.apan.org/wg/tradoc-g2/mad-scientist/m/articles-of-interest/300458
EMBS. (n.d.). Wearable & Implantable Technologies – EMBS. IEEE Advancing Technology for Humanity EMB. Retrieved July 4, 2020, from https://www.embs.org/about-biomedical-engineering/our-areas-of-research/wearable-implantable-technologies/

98
English, T. (2020, February 23). A Growing Industry: Future of Wearables in the Technology Sector. https://interestingengineering.com/a-growing-industry-future-of-wearables-in-the-technology-sector
Esri. (n.d.-a). ArcGIS Collector | Capture Field Data—Data Collection App. Retrieved July 18, 2020, from https://www.esri.com/en-us/arcgis/products/arcgis-collector/overview
Esri. (n.d.-b). Data Collection App | Collector for ArcGIS - Capture Field Data. Retrieved June 25, 2020, from https://www.esri.com/en-us/arcgis/products/collector-for-arcgis/overview
Esri. (2013, November 12). Collect, Monitor, and Analyze Rapidly Changing Data with Enhanced Esri Apps. Esri. https://www.esri.com/about/newsroom/announcements/collect-monitor-and-analyze-rapidly-changing-data-with-enhanced-esri-apps/
Esri. (2019, August 1). (222) Collector for ArcGIS: An Introduction—YouTube. https://www.youtube.com/watch?v=RJHHaEHdHBE
Felicetti, K. (2020). Forget wearables—Implantables could be the future of tech jobs. Monster Career Advice. https://www.monster.com/career-advice/article/implantables-replace-wearables-work-1116
Gentzler, C. (2020, June 5). Interview on invasive plants in the National Parks [Phone call]. Gibbs, Y. (2017, May 10). Helios Prototype Solar-Powered Aircraft. NASA; Brian Dunbar.
http://www.nasa.gov/centers/dryden/history/pastprojects/Helios/index.html gosnold. (2016a, May 24). The Future of Optical Earth Observation. SatelliteObservation.Net.
https://satelliteobservation.net/2016/05/24/the-future-of-optical-earth-observation/ gosnold. (2016b, July 10). What do users really want, anyway? SatelliteObservation.Net.
https://satelliteobservation.net/2016/07/10/the-future-of-earth-observation-ii/ gosnold. (2016c, October 17). Persistent Surveillance. SatelliteObservation.Net.
https://satelliteobservation.net/2016/10/17/persistent-surveillance/ gosnold. (2017, February 11). Smallsat constellations. SatelliteObservation.Net.
https://satelliteobservation.net/2017/02/11/smallsat-constellations/ gosnold. (2019, May 28). High-altitude Pseudosatellites, the future of Earth observation?
SatelliteObservation.Net. https://satelliteobservation.net/2019/05/28/high-altitude-pseudosatellites-the-future-of-earth-observation/
Group, Q. (2005). QinetiQ Zephyr launch [Photo]. https://www.flickr.com/photos/qinetiq/4638654874/
Holly, U. S. N. P. S., restoration/cleanup by Matt. (2013). (Begin of language: English) English: This is map of Rocky Mountain National Park from the official brochure, given at the park entrance. (End of language: English). U.S. National Park Service (http://npmaps.com/wp-content/uploads/rocky-mountain-map.jpg). https://commons.wikimedia.org/wiki/File:NPS_rocky-mountain-map.jpg
how much did the world view 4 cost—Google Search. (n.d.). Retrieved July 13, 2020, from https://www.google.com/search?client=firefox-b-1-d&q=how+much+did+the+world+view+4+cost
Imperiale, D. (2019, November 28). Top 8 Wearable Cameras of 2019 | Video Review. https://wiki.ezvid.com/best-wearable-cameras
Johnson, A. (2020, April 28). Wearable Cameras Capture Incredible Hiking Footage. Wide Open Spaces. https://www.wideopenspaces.com/wearable-cameras/

99
Jurvetson, S. (2019). SpaceX Starlink Broadband Satellite Deployment over Earth [Photo]. https://www.flickr.com/photos/jurvetson/47926209216/
Kekesi, A., Shirah, G., Kreutzinger, R., Radcliff, M. R., Riebeek, H., & Irons, J. R. (n.d.). SVS: Florida Everglades LDCM Band Remix. Retrieved July 15, 2020, from https://svs.gsfc.nasa.gov/4040
Key, R. (2020, June 30). Invasive plants in national parks [Phone call]. Kramer, H. J. (n.d.). WorldView-4—Satellite Missions—EoPortal Directory. Retrieved July 13,
2020, from https://directory.eoportal.org/web/eoportal/satellite-missions/v-w-x-y-z/worldview-4
L. Royimani, O. Mutanga, J. Odindi, T. Dube, & T.N. Matongera. (2019). Advancements in satellite remote sensing for mapping and monitoring of alien invasive plant species (AIPs). Physics and Chemistry of the Earth, 112, 237–245. Scopus. https://doi.org/10.1016/j.pce.2018.12.004
Lavin, M. (n.d.). File:Centaurea maculosa Bozeman.jpg—Wikimedia Commons. Retrieved July 20, 2020, from https://commons.wikimedia.org/wiki/File:Centaurea_maculosa_Bozeman.jpg
Leon, D. (2014, June 9). NASA Official: A Landsat 8 Clone Would Cost More Than $650 Million. SpaceNews.Com. https://spacenews.com/40841nasa-official-a-landsat-8-clone-would-cost-more-than-650-million/
Martin, L. (2016). WorldView-4 [Photo]. https://www.flickr.com/photos/lockheedmartin/28207397421/
Maxwell, A. (2019, July 21). The Future of Wearable Technology. Now. Powered by Northrop Grumman. https://now.northropgrumman.com/the-future-of-wearable-technology/
McDaniel, J. (2008). Battling Cheatgrass at Zion National Park. 2008, 4. Mosher, D. (n.d.). Elon Musk just revealed new details about Starlink, a plan to surround Earth
with 12,000 high-speed internet satellites. Here’s how it might work. Business Insider. Retrieved July 17, 2020, from https://www.businessinsider.com/spacex-Starlink-satellite-internet-how-it-works-2019-5
NASA Scientific Visualization Studio. (2016, December 16). (395) Landsat 8: Band by Band—YouTube. https://www.youtube.com/watch?v=A6WzAc1FTeA on 2016-03-01, T. A. S.-P. presented by J.-P. C. during a conference talk. (2016). (Begin of language: French) (Title: Français) Français : Stratobus (End of language: French). http://aaafctedazur.blogspot.fr/2016/02/stratobus-entre-le-drone-et-le-satellite.html, uploaded by (Title: Category:Photos by Guy Lebègue) Guy Lebègue. https://commons.wikimedia.org/wiki/File:Stratobus_artiste.jpg
Passy, P. (2019). (Begin of language: English) English: This is a Landsat 8 OLI color composite of the Singur lake located in Telangana, India. The Landsat image was taken the 02/11/2017. The color composite combines the band 4 as Red, the band 3 as Green and the band 1 as Blue. Original data from NASA. (End of language: English). (Begin of language: English) Own work (End of language: English). https://commons.wikimedia.org/wiki/File:Singur_Landsat_8_OLI_20171102_cc431.png
Prof. Dr. Otto Wilhelm Thome. (1885). File:Illustration Bromus tectorum0.jpg—Wikimedia Commons. https://commons.wikimedia.org/wiki/File:Illustration_Bromus_tectorum0.jpg

100
Rempfer, K. (2019, November 27). Cyborg warriors could be here by 2050, DoD study group says. Army Times. https://www.armytimes.com/news/your-army/2019/11/27/cyborg-warriors-could-be-here-by-2050-dod-study-group-says/
Rithmio, J. Q. (2015, February 13). The Future of Wearable Tech. Wired. https://www.wired.com/insights/2015/02/the-future-of-wearable-tech/
Satellite Imaging Corporation. (2001). WorldView-3 Satellite Sensor | Satellite Imaging Corp. https://www.satimagingcorp.com/satellite-sensors/worldview-3/
SpaceX. (2015). (Begin of language: English) English: Launch of the Falcon 9 rocket carrying the SpaceX CRS-6 Dragon spacecraft bound for the International Space Station. (End of language: English). https://www.flickr.com/photos/spacexphotos/17170624642/. https://commons.wikimedia.org/wiki/File:Launch_of_Falcon_9_carrying_CRS-6_Dragon_(17170624642).jpg
SpaceX. (2020). Starlink. https://www.Starlink.com/ Sr, D. N. M. S. (2007). (Begin of language: English) English: Comparison of Hyperspectral to
Multispectral data. (End of language: English). NASA http://rst.gsfc.nasa.gov/ (Begin of language: English) This file has source information, but it either links directly to the file or is a generic base (Title: w:URL) URL, or is not an Internet source for a file that was likely found on the Internet. Source information should be provided so that the (Title: Category:License tags) copyright status can be verified by others. It is requested that a better source be provided to make determination of the copyright information easier. Please provide a URL to an (Title: w:HTML) HTML page that contains this file. See (Title: Commons:Licensing) Commons:Licensing#License_information for more information. Please remove this template once better source information is provided. Notify the uploader with: {{subst:(Title: Template:Bsr-user) bsr-user}} --~~~~ (End of language:
English) čeština | English | italiano | മലയാളം | русский | +/−. https://commons.wikimedia.org/wiki/File:MultispectralComparedToHyperspectral.jpg
Thales Alenia Space. (2018, May 22). Stratobus: Why this stratospheric airship is already being called a “Swiss knife” in the sky | Thales Group. https://www.thalesgroup.com/en/worldwide/space/magazine/stratobus-why-stratospheric-airship-already-being-called-swiss-knife-sky
Thoeny, P. (2016). Solar Impulse in fluffy clouds [Photo]. https://www.flickr.com/photos/peterthoeny/26515846422/
USA, M. L. from B., Montana. (2009). Centaurea stoebe (Centaurea maculosa) produces a bloom of purplish flowering heads that are each delimited by an array of ornate bracts. Centaurea maculosa. https://commons.wikimedia.org/wiki/File:Centaurea_maculosa_Bozeman.jpg
USGS EROS. (2013, August). Landsat 8 fact sheet. https://pubs.usgs.gov/fs/2013/3060/pdf/fs2013-3060.pdf
Wang, F., Liu, S., Shu, L., & Tao, X.-M. (2017). Low-dimensional carbon based sensors and sensing network for wearable health and environmental monitoring. Carbon, 121, 353–367. https://doi.org/10.1016/j.carbon.2017.06.006
What is a keyhole satellite and what can it really spy on? (2000, December 7). HowStuffWorks. https://science.howstuffworks.com/question529.htm

101
Wilkins, L. (2019, March 27). The future of implantable technology. Medium. https://medium.com/supplyframe-hardware/the-future-of-implantable-technology-1e674fac9c27
World Economic Forum. (2015, November). WEF_GAC15_Deep_Shift_Software_Transform_Society.pdf. http://www3.weforum.org/docs/WEF_GAC15_Deep_Shift_Software_Transform_Society.pdf
Zelenko, E. (2009). English: Yellow starthistle. Own work. https://commons.wikimedia.org/wiki/File:Centaurea_solstitialis-2.jpg
Zhortech. (2019, April 26). Technological forecasts for our world in 2050. Zhortech. https://zhortech.com/technological-forecasts-2050/

102
CHAPTER 5: CONCLUSIONS AND RECOMMENDATIONS
Our project has adapted Smart City methodology and the Smart City model to solve
National Park issues by transforming National Parks into Smart Parks. To explore the feasibility
of using future advancements in technology to realize a Smart Park Grid, similar to the Smart
City Grids currently in use, our team investigated the future of data acquisition, the future of
data transmission, and the future of big data analysis. In this chapter, we use that information
to develop a series of recommendations for the three-layer structure of a proposed Smart Park
Grid with the intention of helping National Parks in their efforts to face their many challenges.
Final Recommendations
Based on our findings from reliable sources such as peer-reviewed papers, government
sources (including the National Park Service), and information published by well-known park
related organizations and companies (such as SpaceX), we recommend the following three layer
structure and its components for the future Smart Park Grid:
Perception Layer
• We recommend that the perception layer of the future Smart Park Grid be composed of
future AI-enabled cameras that use edge computing. To acquire all the necessary data
to be applied to National Park issues, these cameras can perform remote sensing from
on the ground, in the air on unmanned aerial vehicles (UAVs) such as drones and robotic
insects, and in space on satellites.
Network Layer
• We recommend that the network layer of the future Smart Park Grid be composed of a
future satellite network, such as Starlink. This network transmits the collected data to
the next layer of the grid, the application layer.

103
Application Layer
• We recommend that the application layer of the future Smart Park Grid use the future
Cloud to transform the acquired data into valuable insights for National Parks to use by
performing future big data analysis, cloud processing, and predictive analysis methods.
The future Cloud will also store all of the necessary software and the collected data for
the grid.
Concluding Remarks
Our methodology approaches National Park issues through the use of future
technologies. This poses limitations to the method’s feasibility, as these future technologies
must be advanced enough to be applied in the Smart Park Grids that we recommend for
National Parks. However, if these future technologies come to fruition as predicted, our work
presents long-term implications for the National Parks that implement Smart Park Grids. These
implications include the increase in the efficiency and effectiveness of management assets,
resources, and services, all of which maximize the positive impacts on the National Parks. The
possible impacts could include improvements to wildlife and habitat health, sustainability, and
more controlled and expanded public use and enjoyment of these national assets. In addition,
our proposed Smart Park Grid can be adapted to solve other park problems, beyond just being
used to solve the National Parks issues discussed in this paper. Although there is no one correct
answer, our proposed method holds promise to be the most beneficial for National Parks now,
and in the future. In particular, our recommendations may be helpful to the National Park
Service, which works to preserve the National Parks of the United States.
Interesting questions arise from what the future of technology holds. Will the
advancement rate of technology in the future become even more rapid than that of current
improvements? Will Neven’s Law become obsolete in the next 20 years due to a drastic change
in the rate at which future technologies advance? Could these future advanced technologies
offer National Parks even higher quality results? These questions make one ponder about
future technologies and how their implementation could be valuable to the National Parks. As
more information becomes widely available for future technologies, and additional
technologies are potentially even invented, further research can be done to determine what
technologies best suit the needs of National Parks.

104
CHAPTER 6: REFERENCES
Acker, O., Pötscher, F., & Lefort, T. (2011). Why satellites matter. Booz & Company.
https://www.esoa.net/Resources/Why-Satellites-Matter-Full-Report.pdf
Argust, M. (2020, Jan 9). In National Parks Aging Roads Pose Growing Challenge for Managers.
pewtrusts.org/en/research-and-analysis/articles/2020/01/09/in-national-parks-aging-
roads-pose-growing-challenge-for-managers
Barss, K. (2018, Sep 1). Outdoor Exploration Through Technology. Parks & Recreation, 53, 18-
20. https://www.nrpa.org/parks-recreation-magazine/2018/September/outdoor-
exploration-through-technology/
Beam, C. (2019, June 26). Soon, satellites will be able to watch you everywhere all the time.
https://www.technologyreview.com/2019/06/26/102931/satellites-threaten-privacy/
Begault, L., & Khazrik, J. (2019, June 28). Smart cities: dreams capable of becoming nightmares.
https://www.amnesty.org/en/latest/research/2019/06/smart-cities-dreams-capable-of-
becoming-nightmares/
Borkar, A. (2020, April 18). Starlink vs 5G. https://medium.com/@ankushborkar/starlink-vs-5g-
f69b1dcdd8ab
Boyle, A. (2019, Feb 8). SpaceX seeks FCC approval for up to 1M Starlink satellite earth stations.
https://www.geekwire.com/2019/spacex-fcc-starlink-million-earth-stations/
Brown, J., & Long, J. (n.d.). Video Remote Sensing of Coastal Processes.
https://coastal.er.usgs.gov/hurricanes/research/video-remote-sensing.php
Bushan, S. S. (2019, Aug 15). How Does a Cell Tower Actually Work?
https://toweradvantage.com/how-does-a-cell-tower-actually-work/
Calvello, M. (2020, Feb 19). How Predictive Analytics Can Improve Your Bottom Line.
https://learn.g2.com/predictive-analytics
Campbell, J. R. (2018, Apr 10). The Smart Grid: Status and Outlook. Congressional Research
Service.
http://parlinfo.aph.gov.au/parlInfo/search/display/display.w3p;query=library/jrnart/59086
56
Capri, D. (2016, July 7). That Flying Insect Might Be A Camera.
https://dianecapri.com/2016/07/flying-insect-might-camera/
Caston, R. (2015, Aug 19). How to Persuade Millennials to get Off Their iPhones and Into Our
Parks. https://www.theparkcatalog.com/blog/millennials-national-parks/
Chandran, N. (2015, Apr 21). Will cell towers soon become obsolete?
https://www.cnbc.com/2015/04/21/will-cell-towers-soon-become-obsolete.html
Cruz, I. (2011, Dec 10). Water pollution continues to threaten parks. University of Miami: Our
National Parks.

105
http://www.ournationalparks.us/park_issues/water_pollution_continues_to_threaten_par
ks/
Chourabi, H., Taewoo Nam, Walker, S., Gil-Garcia, J. R., Mellouli, S., Nahon, K., . . . Scholl, H. J.
(2012). Understanding Smart Cities: An Integrative Framework. Paper presented at the
2012 45th Hawaii International Conference on System Sciences, 2289-2297.
doi:10.1109/HICSS.2012.615 https://ieeexplore.ieee.org/document/6149291
Cudden, J. (2018, Feb 1). How smart city technology are supporting Dublin’s competitiveness.
http://www.dublineconomy.ie/2018/02/01/dublin-smart-city/
Dellner, T. (2017, May 1). Parks Using Technology to Engage and Inspire. Parks & Recreation,
52, 42. https://www.nrpa.org/parks-recreation-magazine/2017/may/parks-using-
technology-to-engage-and-inspire/
Dukes, E. (2018, Sept 11). The Cost of IoT Sensors Is Dropping Fast.
https://www.iofficecorp.com/blog/cost-of-iot-sensors
Dusto, A. (2014, Aug 4). Reading between the tides: 200 years of measuring global sea level.
https://www.climate.gov/news-features/climate-tech/reading-between-tides-200-years-
measuring-global-sea-level
Ebbs, S. (2018, May 21). National parks could face flooding from sea level rise, storm surge.
https://abcnews.go.com/US/national-parks-face-flooding-sea-level-rise-
storm/story?id=55327169
Electric News. (2017). Smart Grid Technology: How Energy Storage will Change the Future of
the Energy Industry. https://electricityrates.com/smart-grid-technology-will-change-
future-energy-
industry/?sid=gma072019&utm_source=google&utm_medium=cpc&gclid=Cj0KCQjwupD4
BRD4ARIsABJMmZ8Vh7hG70AMEgrbfb4zKxlnlBjP4RhL2VUAXTJzgZKHcmt_CjOk6roaAlYBEA
Lw_wcB
Elprocus. (n.d.). Overview of Smart Grid Technology And Its Operation and Application (For
Existing Power System). https://www.elprocus.com/overview-smart-grid-technology-
operation-application-existing-power-system/
Expert System Team. (2020, May 6). What is Machine Learning? A definition.
https://expertsystem.com/machine-learning-definition/
Fan, X., Liu, B., Liu, J., Ding, J., Han, X., Deng, Y., . . . Zhong, C. (2020, Jan 8). Battery Technologies
for Grid-Level Large-Scale Electrical Energy Storage. Transactions of Tianjin University,
26(2), 92-103. doi:10.1007/s12209-019-00231-w
Fowler, B. (2020, June 21). Is There a 5G Cellular Network Near You? Consumer Reports.
www.consumerreports.org/cell-phone-service-providers/is-there-a-5g-network-near-you/
Fu, W., Ma, J., Chen, P., & Chen, F. (2020). Remote Sensing Satellites for Digital Earth. In: Guo,
H., Goodchild, M., Annoni, A. (eds) Manual of Digital Earth. Springer, Singapore.
https://doi.org/10.1007/978-981-32-9915-3_3

106
Gerboles, M., Spinelle, L., & Borowiak, A. (2017, Jan 1). Measuring air pollution with low-cost
sensors. European Commission.
http://publications.jrc.ec.europa.eu/repository/bitstream/JRC107461/low_cost_sensors_w
eb.pdf
Ghasempour, A. (2019, Mar 13). Internet of Things in Smart Grid: Architecture, Applications,
Services, Key Technologies, and Challenges. Inventions, 4(1), 22.
doi:10.3390/inventions4010022. https://www.mdpi.com/2411-5134/4/1/22
GilPress. (2016, Oct 17). Visually Linking AI, Machine Learning, Deep Learning, Big Data and
Data Science. https://whatsthebigdata.com/2016/10/17/visually-linking-ai-machine-
learning-deep-learning-big-data-and-data-science/
Global Conservation. (2019, Nov 15). Elon Musk SpaceX Starlink To 'Light Up' Dark National
Parks In Developing Countries. https://globalconservation.org/news/elon-musk-spacex-
starlink-light-dark-national-parks-developing-c/
Goddijn, L. M., & White, M. (2006). Using a digital camera for water quality measurements in
galway bay. Estuarine, Coastal and Shelf Science, 66(3), 429-436.
doi:10.1016/j.ecss.2005.10.002
Green, C. (2015, July 17). The End Of Moore’s Law? Why The Theory That Computer Processors
Will Double In Power Every Two Years May Be Becoming Obsolete.
https://www.independent.co.uk/life-style/gadgets-and-tech/news/the-end-of-moores-
law-why-the-theory-that-computer-processors-will-double-in-power-every-two-years-
10394659.html
Gyramathy, K. (2019, Mar 8). Edge Computing vs. Cloud Computing: What You Need to Know.
https://www.vxchnge.com/blog/edge-computing-vs-cloud-computing
Haiken, M. (2018, Nov 27). How Climate Change Could Destroy Our National Parks. Climate &
Energy. https://www.sierraclub.org/sierra/how-climate-change-could-destroy-our-
national-parks
Harris, M. (2019, Mar 29). Why satellite mega-constellations are a threat to the future of space.
https://www.technologyreview.com/2019/03/29/136268/why-satellite-mega-
constellations-are-a-massive-threat-to-safety-in-space/
Harvey, C. (2018, Jan 24). Big Data Trends. https://www.datamation.com/big-data/big-data-
trends.html
Hattenbach, J. (2019, June 3). Does Starlink Pose a Space Debris Threat? An Expert Answers.
https://skyandtelescope.org/astronomy-news/starlink-space-debris/
Henry, C. (2020, Apr 21). SpaceX seeks FCC permission for operating all first-gen Starlink in
lower orbit. https://spacenews.com/spacex-seeks-fcc-permission-for-operating-all-first-
gen-starlink-in-lower-orbit/

107
Hezewyk, V. V. (2019, Apr 22). It’s Earth Day 2019. Climate change is real. Here’s how digital
imaging is helping. https://possibility.teledyneimaging.com/its-earth-day-2019-climate-
change-is-real-heres-how-digital-imaging-is-helping/
History.com Editors. (2018, Mar 27). National Park Service. https://www.history.com/topics/us-
government/national-park-service
Hodgkinson, S., Mauvais, G., & Young, D. (2016). The Internet of Things for Protected Areas: The
Application of Innovative Technologies to Improve Management Effectiveness. IUCN
Papaco. http://people.cs.pitt.edu/~mosse/courses/cs3720/IoTforProtectedAreas.pdf
Hsu, J. (2017, Aug 23). It's Time To Think Beyond Cloud Computing Backchannel.
https://www.wired.com/story/its-time-to-think-beyond-cloud-computing/
IEEE. (n.d.). The Smart Grid Could Hold the Keys to Electric Vehicles.
https://innovationatwork.ieee.org/the-smart-grid-could-hold-the-keys-to-electric-vehicles/
IEEE Smart Grid Big Data Analytics, Machine Learning and Artificial Intelligence in the Smart
Grid Working Group. (2018, Feb 16). Big Data Analytics in the Smart Grids.
https://smartgrid.ieee.org/images/files/pdf/big_data_analytics_white_paper.pdf
International Astronomical Union. (2020a, Feb 12). Satellite Constellations.
https://www.iau.org/public/themes/satellite-constellations/
International Astronomical Union. (2020b, Feb 12). Understanding the Impact of Satellite
Constellations on Astronomy. https://www.iau.org/news/pressreleases/detail/iau2001/
International Dark-Sky Association. (n.d.) Light Pollution. https://www.darksky.org/light-
pollution/
Internet of Things. (n.d.a) In LEXICO Oxford English Dictionary. https://www.oed.com/
Internet of Things. (n.d.b) In LEXICO Oxford US English Dictionary.
https://www.lexico.com/en/definition/internet_of_things
Kaplan, D. (2019). This Smart Technology Makes It Easier For National Parks To Go Green.
https://www.greenmatters.com/technology/2018/05/15/ZylCez/national-parks-tech
Kessel, J. M., & Tabuchi, H. (2019, Dec 12). It's a vast, invisible climate menace. we made it
visible. International New York Times.
https://www.nytimes.com/interactive/2019/12/12/climate/texas-methane-super-
emitters.html
Khvoynitskaya, S. (2020, Jan 30). The future of big data: 5 predictions from experts for 2020-
2025. https://www.itransition.com/blog/the-future-of-big-data
Kosowatz, J. (2020, Feb 3). Top 10 Growing Smart Cities. https://www.asme.org/topics-
resources/content/top-10-growing-smart-cities
Krafcik, E. (2016, May 1). Making Smart Parks. Parks & Recreation, 51, 44.
https://www.nrpa.org/parks-recreation-magazine/2016/may/making-smart-parks/
Lancaster University. (2018, Feb 12). Report calls for national parks to get smart. Ecology.
https://phys.org/news/2018-02-national-smart.html

108
Levin, S. (2017, May 12). ‘Turn it off’: how technology is killing the joy of national parks.
National parks. https://www.theguardian.com/environment/2017/may/12/america-
national-parks-noise-pollution-technology-drones
Lohrmann, D. (2016, July 2). Smart Cities: The Good, the Bad and the Ugly. Lohrmann on
Cybersecurity & Infrastructure. https://www.govtech.com/blogs/lohrmann-on-
cybersecurity/smart-cities-the-good-the-bad-and-the-ugly.html
Mayton, J. (2014, Aug 13). WorldView-3 satellite can grab shots of license plates, identify tree
species. https://www.techtimes.com/articles/12938/20140813/digitalglobe-launching-hi-
res-satellite.htm
McDowall. (2017, Sep 27). National Parks Next Generation. https://www.doi.gov/ocl/national-
parks-next-generation
Mcgough, M. (2019, May 30). Pollution is a 'significant' problem at 401 national parks, report
says. Environment. https://phys.org/news/2019-05-pollution-significant-problem-
national.html
McNally, C. (2020, June 23). SpaceX Starlink Satellite Internet Update 2020.
https://www.reviews.org/internet-service/spacex-starlink-satellite-internet-
review/#:~:text=You%20can%20get%20a%20head,%24300%20for%20the%20user%20ter
minal.
Merriam-Webster. (n.d.). Rain gage. In Merriam-Webster.com dictionary.
https://www.merriam-webster.com/dictionary/rain%20gage
Microsoft. (n.d.). What is cloud computing? https://azure.microsoft.com/en-us/overview/what-
is-cloud-computing/#benefits
Miller, G. (2016, Sept 27). Sorting it Out: How imaging systems are improving the way we
recycle. https://possibility.teledyneimaging.com/sorting-it-out-how-imaging-systems-are-
improving-the-way-we-recycle/
Murrell, O. G. (2016, Aug 23). 10 Problems Our National Parks Are Facing. Lifestyle.
https://www.theodysseyonline.com/10-problems-our-national-parks-are-facing
Musk, E. [@elonmusk]. (2019, May 11). First 60 @SpaceX Starlink satellites loaded into Falcon
fairing. Tight fit. [Tweet]. Twitter.
https://twitter.com/elonmusk/status/1127388838362378241
National Geographic. (2010, May 26). Top 10 Issues Facing National Parks.
https://www.nationalgeographic.com/travel/top-10/national-parks-issues/
National Oceanic and Atmospheric Administration. (2019, Oct 9). Is sea level rising? National
Ocean Service website. https://oceanservice.noaa.gov/facts/sealevel.html
National Park Foundation. (n.d). Junior Ranger. https://www.nationalparks.org/our-
work/programs/junior-ranger
National Park Service. (2002, Sept). Air Quality in the National Parks, Second Edition.
http://npshistory.com/publications/air-quality/aqnps-2002.pdf

109
National Park Service. (n.d.). Climate Change in National Parks.
https://www.nps.gov/chis/planyourvisit/upload/Brochure-
ClimateChangeInNationalParks.pdf
National Park Service. (2020a, Apr 28). How We Measure Meteorology.
https://www.nps.gov/subjects/air/howwemeasure-met.htm
National Park Service. (2019a, April 10). Invasive Species, National Parks, and You.
https://www.nps.gov/articles/invasive-species.htm
National Park Service. (2020b, Feb 27). National Park Visitation Tops 327 Million in 2019.
https://www.nps.gov/orgs/1207/2019-visitation-numbers.htm
National Park Service. (2019b, Oct 21). Sea Level Rise.
https://www.nps.gov/subjects/oceans/sea-level.htm
National Park Service. (2019c, Oct 31). Water Quality. https://www.nps.gov/orgs/1439/water-
quality.htm
News Byte. (2019, Jan 3). Intel AI Protects Animals with National Geographic Society, Leonardo
DiCaprio Foundation. https://newsroom.intel.com/news/intel-ai-tech-stops-
poachers/#gs.9nps7j
Northeastern States Research Cooperative. (n.d.a). Indicators of Quality for Recreation and
Tourism on Mountain Summits. https://nsrcforest.org/project/indicators-quality-
recreation-and-tourism-mountain-summits
Northeastern States Research Cooperative. (n.d.b). Robert Manning.
https://nsrcforest.org/researcher/robert-manning
Nuwer, R. (2013, Feb 13). Should National Parks Offer Wifi and Cellular Coverage? SmartNews.
https://www.smithsonianmag.com/smart-news/should-national-parks-offer-wifi-and-
cellular-coverage-16478541/
Nwaigwe, N. K., Mutabilwa, P., & Dintwa, E. (2019, July 15). An overview of solar power (PV
systems) integration into electricity grids. Materials Science for Energy Technologies, 2(3),
629-633. https://doi.org/10.1016/j.mset.2019.07.002
O’Callaghan, J. (2019, Oct 16). SpaceX’s Application For 30,000 Extra Starlink Satellites
Highlights Concerns About Regulation.
https://www.forbes.com/sites/jonathanocallaghan/2019/10/16/spacex-accused-of-
evading-rules-with-proposal-for-30000-extra-starlink-satellites/#54e4fc7e54f8
O’Callaghan, J. (2020, Apr 29). What Are Those Strange Moving Lights In The Night Sky? Elon
Musk’s ‘Starlink’ Satellites Explained.
https://www.forbes.com/sites/jonathanocallaghan/2020/04/21/what-are-those-strange-
moving-lights-in-the-night-sky-elon-musks-starlink-satellites-explained/#fef1cda7cbcd
Outside. (2015, Mar 24). National Parks Drawing Fewer Young Visitors.
https://www.outsideonline.com/1962196/national-parks-drawing-fewer-young-visitors

110
Qu, Z., Zhang, G., Cao, H., & Xie, J. (2017, Aug 4). LEO Satellite Constellation for Internet of
Things, in IEEE Access, vol. 5, pp.18391-18401, 2017, doi: 10.1109/ACCESS.2017.2735988
Repanshek, K. (2011, Jan 5). What Are The Top Issues Confronting The National Park System?
https://www.nationalparkstraveler.org/2011/01/what-are-top-issues-confronting-
national-park-system7425
Robbins, J. (2017, Jul 31). How A Surge in Visitors Is Overwhelming America’s National Parks.
https://e360.yale.edu/features/greenlock-a-visitor-crush-is-overwhelming-americas-
national-parks
Rott, N. (2016, Mar 9). Don't Care About National Parks? The Park Service Needs You To.
National Park Service Centennial. https://www.npr.org/2016/03/09/463851006/dont-care-
about-national-parks-the-park-service-needs-you-to
Royimani, L., Mutanga, O., Odindi, J., Dube, T., & Matongera, T. N. (2019, Aug). Advancements
in satellite remote sensing for mapping and monitoring of alien invasive plant species
(AIPs). Physics and Chemistry of the Earth. Parts A/B/C, 112, 237-245.
https://doi.org/10.1016/j.pce.2018.12.004
Sabo, C., Chisholm, R., Petterson, A., & Cope, A. (2017, Sept). A lightweight, inexpensive robotic
system for insect vision. Arthropod Structure & Development, 46(5), 689-702.
doi:10.1016/j.asd.2017.08.001
Seccombe, S. (2019, Sept 3). Instant detect 2.0 emerges.
https://www.wildlabs.net/resources/case-studies/instant-detect-20-emerges
Shacklett, M. (2019, Sept 11). Paris’ beautiful park benches are also smart.
https://www.techrepublic.com/article/paris-beautiful-park-benches-are-also-smart-
thanks-to-iot-devices/
Shaikh, T. A., & Ali, R. (2016, Dec). Quantum Computing in Big Data Analytics: A Survey. Paper
presented at the 2016 IEEE International Conference on Computer and Information
Technology (CIT), 112-115. doi:10.1109/CIT.2016.79
Shankaranarayanan, N. K., & Ghosh, A. (2017). 5g. IEEE Internet Computing, 21(5), 8-10.
doi:10.1109/MIC.2017.3481346
Smart Grid. (n.d.a) In LEXICO Oxford English Dictionary. https://www.oed.com/
Smart Grid. (n.d.b) In LEXICO Oxford US English Dictionary.
https://www.lexico.com/en/definition/smart_grid
Smart National Park 4.0: How Thai students use LoRaWAN to preserve wildlife. (2018, Feb 9).
https://www.actility.com/smart-national-park-4-0-thai-students-preserve-wildlife-using-
lorawan/
Smart Parks. (2019, Feb 27). First Smart Park in Europe.
https://www.smartparks.org/news/first-smart-park-in-europe/
Smart Parks. (n.d.a). Our work. https://www.smartparks.org/work/

111
Smart Parks. (n.d.b). Smart Park Akagera. https://www.smartparks.org/projects/smart-park-
akagera-rwanda/
Smart Parks. (n.d.c). Smart Park Mkomazi. https://www.smartparks.org/projects/smart-park-
mkomazi-tanzania/
Smart Parks. (n.d.d). Smart Park Serengeti. https://www.smartparks.org/projects/smart-park-
liwonde-malawi/
Smith, M. (2017, Mar 9). Camera Can See Global Warming Gases As They Appear. Environment.
https://www.evolving-science.com/environment-pollution/camera-can-see-global-
warming-gases-they-appear-0075
Sohraby, K., Minoli, D., Occhiogrosso, B., & Wang, W. (2017, Oct 27). A Review of Wireless and
Satellite-Based M2M/IoT Services in Support of Smart Grids. Mobile Networks and
Applications, 23(4), 881-895. doi:10.1007/s11036-017-0955-1
Sony. (2020, May 14). Sony to Release World's First Intelligent Vision Sensors with AI Processing
Functionality. [Press release]. https://www.sony.net/SonyInfo/News/Press/202005/20-
037E/
SpaceX [@SpaceX]. (2020a, June 29). Falcon 9 and GPS III Space Vehicle 03 vertical on SLC-40
ahead of tomorrow’s launch for the @SpaceForceDoD. [Tweet]. Twitter.
https://twitter.com/SpaceX/status/1277809612478050304
SpaceX. (2020b). SpaceX. https://www.spacex.com/launches/
Starlink. (n.d.). Starlink. https://www.starlink.com/
Stoker, G. (2020, May 28). The best trail cameras in 2020: for wildlife photography and nature
watching. https://www.digitalcameraworld.com/buying-guides/best-trail-cameras
Synced. (2019, Oct 19). AI In Wildlife Conservation. https://medium.com/syncedreview/ai-in-
wildlife-conservation-39f90782e959
TE Connectivity. (2020). The Future of Sensor Technology. https://www.te.com/usa-
en/industries/sensor-solutions/insights/the-future-of-sensor-technology.html
The Editors of Encyclopedia Britannica. (2019, Dec 26). Moore's law. In Encyclopedia Britannica.
https://www.britannica.com/technology/Moores-law
Torbet, G. (2019, Oct 24). We’re slowly trapping ourselves under an umbrella of space junk.
https://www.digitaltrends.com/cool-tech/kessler-syndrome-space-junk-trap-earth/
UK News. (2020, Jun 16). AI trial to help track damaging invasive plant species.
https://www.expressandstar.com/news/uk-news/2020/06/16/ai-trial-to-help-track-
damaging-invasive-plant-species/
Vanderbilt University School of Engineering. (2019, Nov 12). Understanding Smart Cities and
Cyber-Physical Systems. https://engineeringonline.vanderbilt.edu/resources/smart-cities-
and-cyberphysical-systems/
Villavicencio, D. (2007, May 10). It’s simple: Water essential for parks. University of Miami: Our
National Parks.

112
http://www.ournationalparks.us/park_issues/water_continues_to_be_essential_for_natio
ns_parks/
Vincent, J. (2019, Jan 3). AI-equipped cameras will help spot wildlife poachers before they can
kill. https://www.theverge.com/2019/1/3/18166769/ai-cameras-conservation-africa-
resolve-intel-elephants-serengeti
Waldrop, M. M. (2016, Feb 9). The chips are down for Moore's law. Nature (London),
530(7589), 144-147. https://doi.org/10.1038/530144a
Wang, Y., Wang, Y., Zhang, X., Zhang, X., Chen, J., Chen, J., . . . Wang, D. (2018, Nov 27). Camera
sensor-based contamination detection for water environment monitoring. Environmental
Science and Pollution Research, 26(3), 2722-2733. https://doi.org/10.1007/s11356-018-
3645-z
Whatsag. (n.d.). What Is a Cell Tower? https://whatsag.com/mobile-technology/what-is-a-cell-
tower.php
Wood, L. (2019, Aug 7). IoT Sensors Market Analysis, Trends, and Forecasts, 2025.
https://www.businesswire.com/news/home/20190807005284/en/IoT-Sensors-Market-
Analysis-Trends-Forecasts-2025
Wood, L. (2003, Apr 30). Satellite Constellation Networks. In: Zhang, Y. (eds) Internetworking
and Computing Over Satellite Networks. Springer, Boston, MA.
https://doi.org/10.1007/978-1-4615-0431-3_2
World Wildlife Fund. (2018, Jul 31). Tech for tigers: WWF and Intel test AI technology for
monitoring wild tigers in China. https://medium.com/wwftogetherpossible/tech-for-tigers-
wwf-and-intel-test-ai-technology-for-monitoring-wild-tigers-in-china-
2a5c93ece73c#:~:text=Artificial%20intelligence%20(AI)%20may%20seem,wild%20tigers%2
0and%20their%20habitats.
Xu, J. (2019, Oct 19). AI In Wildlife Conservation. https://syncedreview.com/2019/10/19/ai-in-
wildlife-conservation/
Yoshida, H. (2019, June 24). Moore's Law Is Replaced by Neven's Law for Quantum Computing.
https://community.hitachivantara.com/s/article/moores-law-is-replaced-by-nevens-law-
for-quantum-computing
Zablocki, A. (2019, Feb 22). Fact Sheet: Energy Storage (2019).
https://www.eesi.org/papers/view/energy-storage-2019


