27
National Radio Channels PPM measurement December 2017

National Radio ChannelsPPM measurement December 2017

Background
• This overview describes the development of radio broadcasting at national levels with updated figures from December 2017. The Norwegian Media Authority has composed this overview based on figures received from Kantar Media.
• Kantar Media is the provider of official radio figures at the national level in Norway. The PPM* measurements are conducted electronically using a national representative panel (Media Panel). The Media Panel consists of 1000 people using PPM equipment. These figures are reported weekly: http://www.tns-gallup.no/medier/radio/nasjonale-lyttertall-ppm/ (Source: KantarMedia)
*PPM (Portable People Meter) – Measuring device that measures the exposure or listening to given radio channels.

Definitions
• Coverage: The population share who have listened to a given radio service during an average day.
• Listening time: Daily time spent among listeners on a given radio service during an average day.
• Market share: Share of time spent on different radio channels/radio groups.

Radio channels in the PPM measurements
The Big Five
NRK P1
NRK P2
NRK P3
P4
Radio Norge
Other national
NRK Alltid Nyheter P8 Pop
NRK mP3 NRJ
NRK Sport Others P4 (i.a. P9 and P10)
NRK Klassisk Kiss
NRK P13 Radio Rock
NRK P1+ Norsk Pop
P5 Hits Radio Topp 40
P6 Rock Radio Vinyl
P7 Klem Others Bauer Media(Soft and Pop Up)
NRK P4 Group Bauer Media

Coverage

Coverage: Population share listening to national channels down 4,4 percentage
points from 2016
69,8 68,9 67,663,2
0
10
20
30
40
50
60
70
80
90
100
Development per year from 2014 to 2017 – all national radio channels in percentage
2014 2015 2016 2017
Source: Kantar Media/Norsk Gallup. The official national listening figures from the electronic measurements (PPM). All weekdays. Population 12+

Coverage: 8,9 percentage points listening decrease from December ‘16 to December ‘17
67,8 68,6 67,8 70,3 68,4 68,559,2
66,2 69,2 67,5 69,1 68,3
67,8 66,2 67,4 65,3 64,7 63,756,7
61,1 62,3 61,4 62,259,4
0
10
20
30
40
50
60
70
80
90
100
Jan Feb Mar Apr May Jun Jul Aug Sep Oct Nov Dec
Per month 2016/2017 – all national radio channels in percentage
2016 2017
Source: Kantar Media/Norsk Gallup. The official national listening figures from the electronic measurements (PPM). All weekdays. Population 12+

Coverage: New radio channels almostequals traditional radio channels
65,561,7
52,261,8
62,860,2
54,148,8
42,1
14,321,3
28,420,5
21,326,4 27,5 31,6
36,0
0
10
20
30
40
50
60
70
80
90
100
2014 2015 2016 2017 Jan16
Feb16
Mar16
Apr16
May16
Jun16
Jul16
Aug16
Sep16
Oct16
Nov16
Dec16
Jan17
Feb17
Mar17
Apr17
May17
Jun17
Jul17
Aug17
Sep17
Oct17
Nov17
Dec17
The Big Five and other national in percentage – year 2014-2017 – per month2016/2017
The Big Five (NRK P1, NRK P2, NRK P3, P4 and Radio Norge) Other national (see overview of radio services)
Source: Kantar Media/Norsk Gallup. The official national listening figures from the electronic measurements (PPM). All weekdays. Population 12+
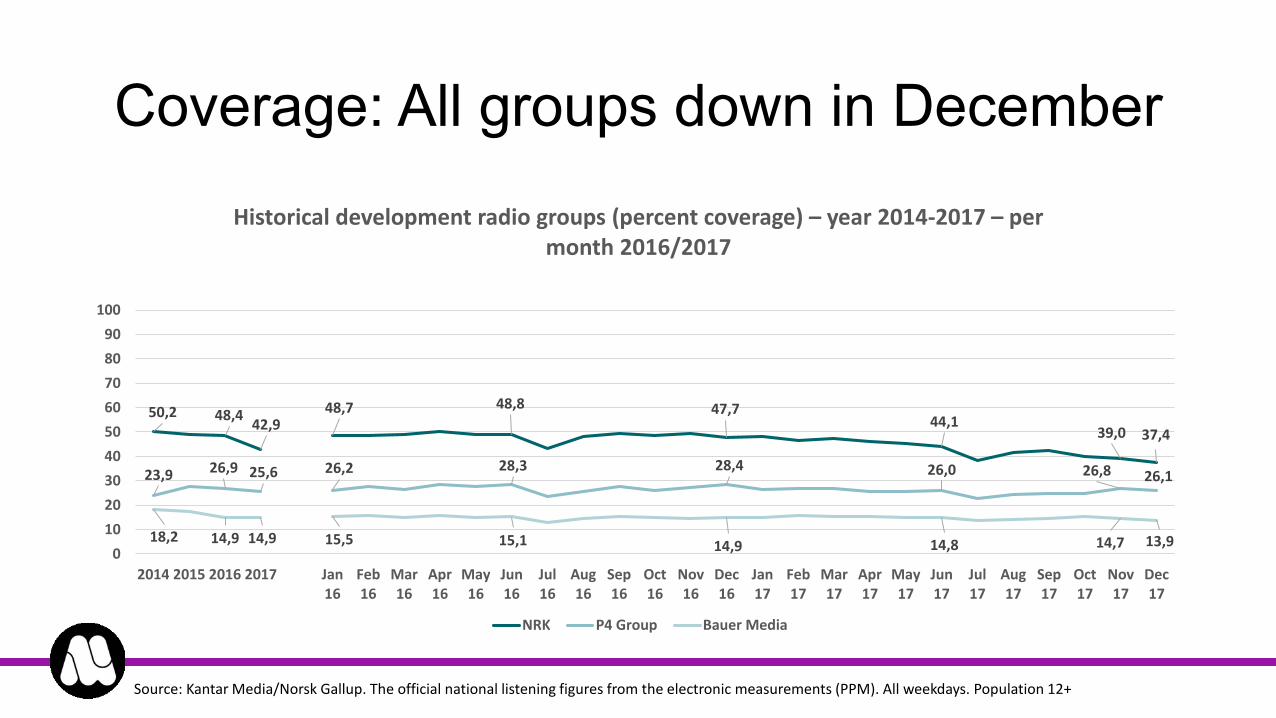
Coverage: All groups down in December
50,2 48,442,9
48,7 48,8 47,744,1
39,0 37,4
23,9 26,9 25,6 26,2 28,3 28,4 26,0 26,8 26,1
18,2 14,9 14,9 15,5 15,1 14,9 14,8 14,7 13,90
10
20
30
40
50
60
70
80
90
100
2014 2015 2016 2017 Jan16
Feb16
Mar16
Apr16
May16
Jun16
Jul16
Aug16
Sep16
Oct16
Nov16
Dec16
Jan17
Feb17
Mar17
Apr17
May17
Jun17
Jul17
Aug17
Sep17
Oct17
Nov17
Dec17
Historical development radio groups (percent coverage) – year 2014-2017 – per month 2016/2017
NRK P4 Group Bauer Media
Source: Kantar Media/Norsk Gallup. The official national listening figures from the electronic measurements (PPM). All weekdays. Population 12+

Coverage: Status December 2017
24,8
11,9
10,3
6,55,0 4,7 4,1 4,1 3,8 3,3
2,4 2,0 1,9 1,8 1,6 1,6 1,5 1,5 1,4 1,2 1,0 0,8 0,8 0,7 0,5
0
5
10
15
20
25
30
National radio channels sorted after size (percentage) – December 2017 NRK P1P4P7 KlemNRK P1+Radio NorgeNRK P3NRK P2Bauer Pop UpP5 HitsNRK mP3NRK P13Radio RockNRJRadio Topp 40P10 CountryNRK NyheterNRK SportP6 RockRadio VinylNRK KlassiskP8 PopNorsk PopKissP9 RetroSoft
Source: Kantar Media/Norsk Gallup. The official national listening figures from the electronic measurements (PPM). All weekdays. Population 12+

Coverage: Top 10 – November vs. December
25,7
16,2
3,9
6,28,0
5,94,5
0,0
4,73,9
24,8
11,910,3
6,55,0 4,7 4,1 4,1 3,8 3,3
0
5
10
15
20
25
30
NRK P1 P4 P7 Klem NRK P1+ Radio Norge NRK P3 NRK P2 Bauer Pop Up P5 Hits NRK mP3
National channels sorted after size (percentage) – November/December 2017
Nov.17 Dec.17
Source: Kantar Media/Norsk Gallup. The official national listening figures from the electronic measurements (PPM). All weekdays. Population 12+

Coverage 2016 versus 2017
33,4
20,8
12,911,6
3,95,9 5,2
3,4
28,7
16,8
9,47,7
5,7 5,3 4,7 4,4
0
5
10
15
20
25
30
35
40
NRK P1 P4 Radio Norge NRK P3 NRK P1+ NRK P2 NRK mP3 P5 Hits
The eight largest radio channels sorted after size (coverage in percentage) – 2016 versus 2017
2016 2017
Source: Kantar Media/Norsk Gallup. The official national listening figures from the electronic measurements (PPM). All weekdays. Population 12+

Listening time

Listening time: Continuous decrease in minutes spent listening to radio channels
90 8985
79
0
10
20
30
40
50
60
70
80
90
100
2014 2015 2016 2017
Year 2014-2017 – all national radio channels in minutes of listening
Source: Kantar Media/Norsk Gallup. The official national listening figures from the electronic measurements (PPM). All weekdays. Population 12+

Listening time: 10 minutes gone since December 2016 – Stable development from
autumn 2016 to autumn 2017
8285 85
88 87 8780
85 87 87 88 84
82 81 84 83 80 82 78 78 76 77 77 74
0
10
20
30
40
50
60
70
80
90
100
Jan Feb Mar Apr May Jun Jul Aug Sep Oct Nov Dec
Per month 2016/2017 – all national radio channels in listening minutes
2016 2017
Source: Kantar Media/Norsk Gallup. The official national listening figures from the electronic measurements (PPM). All weekdays. Population 12+

Listening time: Increase in listening to newradio channels, decrease in listening to
traditional radio channels
79
70
58
6873
6561
52
44
1015
2114 14 19
2124
30
0
10
20
30
40
50
60
70
80
90
100
2014 2015 2016 2017 Jan16
Feb16
Mar16
Apr16
May16
Jun16
Jul16
Aug16
Sep16
Oct16
Nov16
Dec16
Jan17
Feb17
Mar17
Apr17
May17
Jun17
Jul17
Aug17
Sep17
Oct17
Nov17
Dec17
The Big Five and other national in listening minutes for 2014-2017 and per month2016/2017
The Big Five (NRK P1, NRK P2, NRK P3, P4 and Radio Norge) Other national (see overview of radio services)
Source: Kantar Media/Norsk Gallup. The official national listening figures from the electronic measurements (PPM). All weekdays. Population 12+

Listening time: Decrease in listening time continues for NRK – P4 and Bauer stable in
December
60 5852
55 59 55 5547
45
18 19 19 19 20 20 20 20 20
11 8 9 9 8 8 8 9 90
10
20
30
40
50
60
70
80
90
100
2014 2015 2016 2017 Jan16
Feb16
Mar16
Apr16
May16
Jun16
Jul16
Aug16
Sep16
Oct16
Nov16
Dec16
Jan17
Feb17
Mar17
Apr17
May17
Jun17
Jul17
Aug17
Sep17
Oct17
Nov17
Dec17
Historical development radio groups (listening minutes) for 2014-2017 and per month 2016/2017
NRK P4 Group Bauer Media
Source: Kantar Media/Norsk Gallup. The official national listening figures from the electronic measurements (PPM). All weekdays. Population 12+

Listening time: Status December 2017
27
9
7 7
3 32 2
0
5
10
15
20
25
30
The eight largest radio channels sorted after size (listening minutes) – December2017
NRK P1
P4
NRK P1+
P7 Klem
Radio Norge
NRK P2
P5 Hits
NRK P3
Source: Kantar Media/Norsk Gallup. The official national listening figures from the electronic measurements (PPM). All weekdays. Population 12+

Listening time: 2016 versus 2017
38
15
4
76
42
1
32
12
65
4 42 2
0
5
10
15
20
25
30
35
40
NRK P1 P4 NRK P1+ Radio Norge NRK P3 NRK P2 NRK mP3 P5 Hits
The eight largest radio channels sorted after size (listening minutes) –2016 versus 2017
2016 2017
Source: Kantar Media/Norsk Gallup. The official national listening figures from the electronic measurements (PPM). All weekdays. Population 12+

Market share

Market share: Traditional channelsversus new channels
87,482,5
73,3
83,4 83,677,5
74,567,4
59,4
10,917,5
26,7
16,6 16,422,5
25,532,6
40,6
0,0
10,0
20,0
30,0
40,0
50,0
60,0
70,0
80,0
90,0
100,0
2014 2015 2016 2017 Jan16
Feb16
Mar16
Apr16
May16
Jun16
Jul16
Aug16
Sep16
Oct16
Nov16
Dec16
Jan17
Feb17
Mar17
Apr17
May17
Jun17
Jul17
Aug17
Sep17
Oct17
Nov17
Dec17
The Big Five and other national in percentage for 2014-2017 and per month2016/2017
The Big Five (NRK P1, NRK P2, NRK P3, P4 and Radio Norge) Other national (see overview of radio services)
Source: Kantar Media/Norsk Gallup. The official national listening figures from the electronic measurements (PPM). All weekdays. Population 12+

Market share: Radio groups in 2017
65,6
23,5
10,9
Market share radio groups in percentage- national channels 2017
NRK P4 Group Bauer Media
Source: Kantar Media/Norsk Gallup. The official national listening figures from the electronic measurements (PPM). All weekdays. Population 12+

Market share: Radio groups – Historicaldevelopment
66,167,9 65,6 66,7 67,6 65,7 66,6
60,8 60,7
19,9 22,5 23,522,7 23,2 24,4 23,9 26,2 27,3
12,2 9,7 10,9 10,69,2 9,8 9,5 11,6 12,0
0
10
20
30
40
50
60
70
80
90
100
2014 2015 2016 2017 Jan16
Feb16
Mar16
Apr16
May16
Jun16
Jul16
Aug16
Sep16
Oct16
Nov16
Dec16
Jan17
Feb17
Mar17
Apr17
May17
Jun17
Jul17
Aug17
Sep17
Oct17
Nov17
Dec17
Historical development radio groups (percentage) – year 2014-17 – per month2016/2017
NRK P4 Group Bauer Media
Source: Kantar Media/Norsk Gallup. The official national listening figures from the electronic measurements (PPM). All weekdays. Population 12+

Local radio

Background
• Listening figures for local radio stations are found in the Forbruker & Media survey. This survey measures radio listening at regional and local level. The survey is made quarterly by Kantar Media and the method used is CATI*.
• The Forbruker & Media survey represents official listening figures for Norwegian local radios and for national channels locally.
• Listening figures for local radio Q3 2017 were published by Kantar Media in October 2017 (http://www.tns-gallup.no/globalassets/medier/radio/statusrapport-radio-2017-20-10-17-futsater-og-jortveit.pdf). The NMA refers to the Kantar Media survey for listening figures for local radio. In this context the NMA will present some of Kantar Media’s main figures from Q3 in the NMA report. Figures for local radio Q4 2017 will be presented later in January 2018.
*CATI (Computer-Assisted Telephone Interviewing) – Information is gathered through telephone interviews based on a fixed questionnaire.

Coverage: Listener figures in thousands #1
Source: Statusrapport for radiolytting 2017 – 20.10.17 - 3. Kvartal 2017. Knut-Arne Futsæter and Salve Jortveit. Kantar Media.

Coverage: Listener figures in thousands #2
Source: Statusrapport for radiolytting 2017 – 20.10.17 - 3. Kvartal 2017. Knut-Arne Futsæter and Salve Jortveit. Kantar Media.


