Statistician: Dani Evans 0300 025 3753 [email protected]This report is also available in Welsh Enquiries from the press: 0300 025 8099 Public enquiries : 0300 025 5050 Twitter: @statisticswales -2 -1 0 1 2 3 4 5 6 English Welsh Procedural Reasoning Gender Difference Year 2 Year 3 Year 4 Year 5 Year 6 Year 7 Year 8 Year 9 National reading and numeracy test results, 2016 25 August 2016 SFR 102/2016 Gender difference in age-standardised score The difference in the mean age-standardised score for boys and girls shows that: Girls out perform boys in the reading tests in all national curriculum year groups; Boys out perform girls in the procedural numeracy test; The gender difference varies across all national curriculum year groups for the reasoning numeracy test. Local authority differences in age-standardised score Local authority differences in progress measure About this release This Statistical First Release provides information on pupils in National Curriculum Year 2 to 9 at Wales and local authority (LA) level. It displays the standardised scores achieved in the English and Welsh versions of the National Reading and Numeracy Tests. It presents analysis of age-standardised scores and progress measures. The progress measures can be used to compare relative progress made by pupils within year group and across LAs. Further information can be found in the notes section of this release. In this release National Reading Tests p2 National Numeracy Tests p8 Notes p13 Key quality information p17 In both the reading tests, Monmouthshire had the highest average age-standardised score whilst Blaenau Gwent had the lowest. In both the numeracy tests, Vale of Glamorgan had the highest average age-standardised score whilst Blaenau Gwent had the lowest. In the English reading tests, Swansea’s average progress measure has increased the most from 2013 to 2016. Isle of Anglesey has decreased the most. In the procedural tests, Swansea’s average progress measure has increased the most from 2013 to 2016. Isle of Anglesey has decreased the most. In the Welsh reading tests, Newport’s average progress measure has increased the most from 2013 to 2016. Blaenau Gwent has decreased the most. In the reasoning tests, Rhondda Cynon Taf’s average progress measure has increased the most from 2014 to 2016. Isle of Anglesey’s has decreased the most. In both the reading tests, Monmouthshire had the highest average relative progress measure whilst Blaenau Gwent had the lowest. In both the numeracy tests, Vale of Glamorgan had the highest average relative progress measure whilst Blaenau Gwent had the lowest. Positive difference = girls out performing boys Negative difference = boys outperforming girls
Transcript
Statistician: Dani Evans 0300 025 3753 [email protected] This report is also available in Welsh
Enquiries from the press: 0300 025 8099 Public enquiries : 0300 025 5050 Twitter: @statisticswales
-2 -1 0 1 2 3 4 5 6
English
Welsh
Procedural
Reasoning
Gender Difference
Year 2
Year 3
Year 4
Year 5
Year 6
Year 7
Year 8
Year 9
National reading and numeracy test results, 2016
25 August 2016
SFR 102/2016
Gender difference in age-standardised score
The difference in the mean
age-standardised score for
boys and girls shows that:
Girls out perform
boys in the reading
tests in all national
curriculum year
groups;
Boys out perform
girls in the procedural
numeracy test;
The gender difference
varies across all national curriculum year groups for the reasoning
The gender gap is larger in the Welsh reading test than any of the other tests. Get the data
For National Reading Test results for all pupils, by gender, National Curriculum Year Group and result
for 2016 (Table 1 in previous statistical releases) please refer to the accompanying spreadsheet.
Chart 1: Percentage of pupils in all year groups achieving age-standardised scores within the bands shown in the National Reading Test (English), by gender, 2016 (a)(b)
0
10
20
30
40
50
60
70
80
90
100
Less than 85 (a) Between 85 and 115 Greater than 115
Girls Boys All pupils
(a) Includes pupils who were disapplied or absent during the test window. (b) Does not include optional English reading test results for pupils in year 3
studying Welsh first language. (c) Pupils who were disapplied or absent during the test window or received a score of ‘less than 70’ have been treated as a score of 69, those with a score of
‘more than 140’ have been treated as a score of 141.
In the English version of the National Reading Test:
More girls than boys achieved a standardised score greater than 115 across all year groups; the gap between girls and boys for all years stood at 3.9 percentage points.
More boys than girls achieved standardised score less than 85 across all year groups; the gap between boys and girls stood at 5.8 percentage points (a).
The variability of standardised scores is fairly similar for boys and girls with a standard deviation of 15.9 and 15.4 respectively (c).
Chart 2: Percentage of pupils in all year groups achieving age-standardised scores within the bands shown in the National Reading Test (Welsh), by gender, 2016 (a)
0
10
20
30
40
50
60
70
80
90
100
Less than 85 (a) Between 85 and 115 Greater than 115
Girls Boys All pupils
(a) Includes pupils who were disapplied or absent during the test window. (b) Pupils who were disapplied or absent during the test window or received a
score of ‘less than 70’ have been treated as a score of 69, those with a score of ‘more than 140’ have been treated as a score of 141.
In the Welsh version of the National Reading Test:
More girls than boys achieved a standardised score greater than 115 across all year groups. The gap between girls and boys stood at 7.1 percentage points.
More boys than girls achieved standardised score less than 85 across all year groups. The gap between boys and girls stood at 7.7 percentage points (a).
The variability of standardised scores is similar for boys and girls with a standard deviation of 15.3 and 15.2 respectively (b).
Chart 3: Average age-standardised scores shown in the National Reading Test (English), by local authority, 2016 (a)(b)
(a) Does not include optional English reading test results for pupils in year 3 studying Welsh first language.
(b) Pupils who were disapplied or absent during the test window or received a score of ‘less than 70’ have been treated as a score of 69, those with a score of ‘more than 140’ have been treated as a score of 141.
In the English version of the National Reading Test:
The average age-standardised score is highest in Monmouthshire (104.3) and lowest in Blaenau Gwent (97.0) (a) (b).
The highest percentage of pupils achieving a standardised score greater than 115 was seen in Monmouthshire (25.0 per cent). The lowest percentage was seen in Blaenau Gwent (12.0 per cent) (a) (b).
The percentage of pupils achieving a standardised score less than 85 (b) was highest in Blaenau Gwent (22.2 per cent). The lowest percentage was seen in Monmouthshire (11.7 per cent) (a) (b).
Note: Results have been standardised separately for the English and Welsh versions of the National Reading Test and should not be compared to assess the reading ability of pupils. Standardised scores provide a measure of relative performance only. Therefore the data in this release should not be used to compare the relative performance across different cohorts and years.
4
Chart 4: Average age-standardised scores in the National Reading Test (Welsh), by local authority, 2016 (a)
(a) Pupils who were disapplied or absent during the test window or received a score of ‘less than 70’ have been treated as a score of 69, those with a score of ‘more than 140’ have been treated as a score of 141.
In the Welsh version of the National Reading Test:
The average age-standardised score is highest in Monmouthshire (107.4) and lowest in Blaenau
Gwent (89.5) (a).
The highest percentage of pupils achieving a standardised score greater than 115 was seen in
Monmouthshire (31.0 per cent). The lowest percentage was seen in Blaenau Gwent (3.9 per cent)
(a).
The percentage of pupils achieving a standardised score less than 85 was highest in Blaenau
Gwent (39.0 per cent). The lowest percentage was seen in The Vale of Glamorgan (7.3 per cent)
(a). Note: Results have been standardised separately for the English and Welsh versions of the National Reading Test and should not be
compared to assess the reading ability of pupils. Standardised scores provide a measure of relative performance only. Therefore the data in this release should not be used to compare the relative performance across different cohorts and years.
5
Get the data
For National Reading Test results, by LA and result, 2016 (Table 2 in previous statistical releases)
The progress measure shows how well an individual learner has done in a given test relative to all other
learners in the same national curriculum year group taking the same test. The progress measure is
presented to parents as a time series allowing for an individual pupil’s achievement in the tests to be
tracked over time.
National Reading Tests – English: Progress measure
Monmouthshire had the highest percentage of pupils achieving an ‘above average’ progress measure in each year from 2013 to 2016. They also had the lowest percentage of pupils achieving a ‘below average’ progress measure in 2013 to 2015, The Vale of Glamorgan had the lowest in 2016.
Blaenau Gwent had the lowest percentage of pupils achieving an ‘above average’ progress measure in each year from 2013 to 2016. They also had the highest percentage of pupils achieving a ‘below average’ progress measure in each year.
Average by year group
Monmouthshire had the highest mean progress measure for all year groups in 2016. They also had the highest mean progress measure in each individual year group apart from years 3 and 8, where The Vale of Glamorgan had the highest mean progress measure.
Blaenau Gwent had the lowest mean progress measure for all year groups in 2016 and within each year 3 to 6. Gwynedd had the lowest mean progress measure in year 2, Merthyr Tydfil in year 7 to 9.
Change over time
Swansea’s average progress measure has increased the most from 2013 to 2016. Isle of Anglesey
has decreased the most.
National Reading Tests – Welsh: Progress measure
Monmouthshire had the highest percentage of pupils achieving an ‘above average’ progress measure in 2015 and 2016. In 2014 Monmouthshire was joint highest with Cardiff (to 1dp), and Cardiff had the highest in 2013.
Blaenau Gwent had the lowest percentage of pupils achieving an ‘above average’ progress measure in each year from 2013 to 2016.
The Vale of Glamorgan had the lowest percentage of pupils achieving a ‘below average’ progress measure in each year from 2013 to 2016.
Blaenau Gwent had the highest percentage of pupils achieving a ‘below average’ progress measure in each year from 2013 to 2016.
Average by year group
Monmouthshire had the highest mean progress measure for all year groups in 2016; they also had the highest percentage in individual year groups 2, 4 and 6 - they did not have any secondary school pupils taking the Welsh reading tests in years 7 to 9. Powys had the highest mean progress measure in year 3, Cardiff in year 5.
Of the local authorities with pupils taking the Welsh reading tests in years 7 to 9, The Vale of Glamorgan had the highest mean progress measure in all years.
Blaenau Gwent had the lowest mean progress measure for all year groups in 2016 and in each year group from 2 to 6 (they did not have any secondary school pupils taking the Welsh reading tests in years 7 to 9).
Of the local authorities with pupils taking the Welsh reading tests in years 7 to 9, Isle of Anglesey had the lowest in year 7 and 8, Torfaen in year 9.
7
Change over time
Newport’s average progress measure has increased the most from 2013 to 2016. Blaenau Gwent has decreased the most.
Get the data
For National Reading Test progress measures, by LA and result, for all years (Table 3 and 4 in previous
statistical releases) please refer to the accompanying spreadsheet. For average National Reading Test
progress measures, by LA and national curriculum year, for 2016 (Table 5 and 6 in previous statistical
releases) please refer to the accompanying spreadsheet.
For National Numeracy Test results for all pupils, by gender, National Curriculum Year Group and result
for 2016 (Table 7 in previous statistical releases) please refer to the accompanying spreadsheet.
Chart 5: Percentage of pupils in all year groups achieving standardised scores within the bands shown in the National Numeracy Test (procedural) by gender, 2016 (a)
0
10
20
30
40
50
60
70
80
90
100
Less than 85 (a) Between 85 and 115 Greater than 115
Girls Boys All pupils
(a) Includes pupils who were disapplied or absent during the test window.
(b) Pupils who were disapplied or absent during the test window or received a score of ‘less than 70’ have been treated as a score of 69, those with a score of ‘more than 140’ have been treated as a score of 141.
In the National Numeracy Test (Procedural):
More boys than girls achieved a standardised score greater than 115 across all year groups; the gap between boys and girls stood at 4.4 percentage points.
For all year groups apart from year 9 more boys than girls achieved a standardised score less than 85; the overall gap between boys and girls was 1.4 percentage points (a).
The variability of standardised scores is higher for boys and girls with a standard deviation of 16.1 and 14.5 respectively (b).
Chart 6: Percentage of pupils in all year groups achieving standardised scores within the bands shown in the National Numeracy Test (reasoning) by gender, 2016 (a)
0
10
20
30
40
50
60
70
80
90
100
Less than 85 (a) Between 85 and 115 Greater than 115
Girls Boys All pupils
(a) Includes pupils who were disapplied or absent during the test window. (b) Pupils who were disapplied or absent during the test window or received a score of ‘less than 70’ have been treated as a score of 69, those with a score of
‘more than 140’ have been treated as a score of 141.
In the National Numeracy Test (Reasoning):
For all year groups apart from year 5 more boys than girls achieved a standardised score greater than 115; the gap between boys and girls stood at 2.4 percentage points.
For all year groups more boys than girls achieved a standardised score less than 85; the gap between boys and girls stood at 2.7 percentage points (a).
The variability of standardised scores is higher for boys and girls with a standard deviation of 17.0 and 15.6 respectively (b).
Chart 7: Average age-standardised scores in the National Numeracy Test (procedural), by local authority, 2016 (a)
(a) Pupils who were disapplied or absent during the test window or received a score of ‘less than 70’ have been treated as a score of 69, those with a score of ‘more than 140’ have been treated as a score of 141.
The average age-standardised score is highest in The Vale of Glamorgan (103.8) and lowest in Blaenau Gwent (96.0) (a).
The highest percentage of pupils achieving a standardised score greater than 115 was seen in The Vale of Glamorgan (22.7 per cent). The lowest percentage was seen in Blaenau Gwent (9.7 per cent) (a).
The percentage of pupils achieving a standardised score less than 85 was highest in Blaenau Gwent (22.7 per cent). The lowest percentage was seen in The Vale of Glamorgan (10.7 per cent) (a).
10
Chart 8: Average age-standardised scores in the National Numeracy Test (reasoning), by local authority, 2016 (a)
(a) Pupils who were disapplied or absent during the test window or received a score of ‘less than 70’ have been treated as a score of 69, those
with a score of ‘more than 140’ have been treated as a score of 141.
The average age-standardised score is highest in The Vale of Glamorgan (104.0) and lowest in Blaenau Gwent (95.7) (a).
The highest percentage of pupils achieving a standardised score greater than 115 was seen in The Vale of Glamorgan (21.9 per cent). The lowest percentage was seen in Blaenau Gwent (10.3 per cent) (a).
The percentage of pupils achieving a standardised score less than 85 was highest in Blaenau Gwent (23.3 per cent). The lowest percentage was seen in The Vale of Glamorgan (10.2 per cent) (a).
Get the data
For National Numeracy Test results, by LA and result, 2016 (Table 8 in previous statistical releases)
The progress measure shows how well an individual learner has done in a given test relative to all other
learners in the same national curriculum year group taking the same test. The progress measure is
presented to parents as a time series allowing for an individual pupil’s achievement in the tests to be
tracked over time.
National Numeracy Tests – procedural
The Vale of Glamorgan had the highest percentage of pupils achieving an ‘above average’ progress measure in year 2016. The LA with the highest percentage has varied over the last few years.
Blaenau Gwent had the lowest percentage of pupils achieving ‘above average’ progress measure from 2013 to 2016. It also had the highest percentage of pupils achieving a ‘below average’ progress measure from 2013 to 2016.
The Vale of Glamorgan had the lowest percentage of pupils achieving ‘below average’ progress measure in from 2016. The LA with the lowest percentage has varied over the last few years.
Average by year group
The Vale of Glamorgan had the highest mean progress measure when calculated in the ‘All years’ group in 2016. It had the highest mean progress score in the individual year 3, 6 and 8. Ceredigion had the highest in year 2, Swansea in year 4 and 5, and Monmouthshire in year 7 and 9.
Blaenau Gwent had the lowest mean progress measure in the ‘All years’ group and within each individual year groups apart from year 5 where Newport had the lowest mean progress measure.
Change over time
Swansea’s average progress measure has increased the most from 2013 to 2016. Isle of Anglesey
has decreased the most.
National Numeracy Tests – reasoning
The Vale of Glamorgan had the highest percentage of pupils achieving an ‘above average’ progress measure in 2016. The LA with the highest percentage has varied over the last few years.
Blaenau Gwent had the lowest percentage of pupils achieving ‘above average’ progress measure in from 2013 to 2016. It also had the highest percentage of pupils achieving a ‘below average’ progress measure in from 2013 to 2016.
The Vale of Glamorgan had the lowest percentage of pupils achieving a ‘below average’ progress measure in 2016. In 2014 and 2015 it had been Ceredigion.
Average by year group
The Vale of Glamorgan had the highest mean progress measure in the ‘All years’ group in 2016, although they only had the highest mean progress measure in individual years 8 and 9. Ceredigion had the highest for year 2, Powys year 3, 5 and 6, Swansea year 4, Monmouthshire in year 7.
Blaenau Gwent had the lowest mean progress measure in the ‘All years’ group and in each individual year group except for year 2 where Newport had the lowest.
Change over time
Rhondda Cynon Taf’s average progress measure has increased the most from 2014 to 2016. Isle of Anglesey’s has decreased the most.
12
Get the data
For National Numeracy Test progress measures, by LA and result, for all years (Table 9 and 10 in
previous statistical releases) please refer to the accompanying spreadsheet. For average National
Numeracy Test progress measures, by LA and national curriculum year, for 2016 (Table 11 and 12 in
previous statistical releases) please refer to the accompanying spreadsheet.
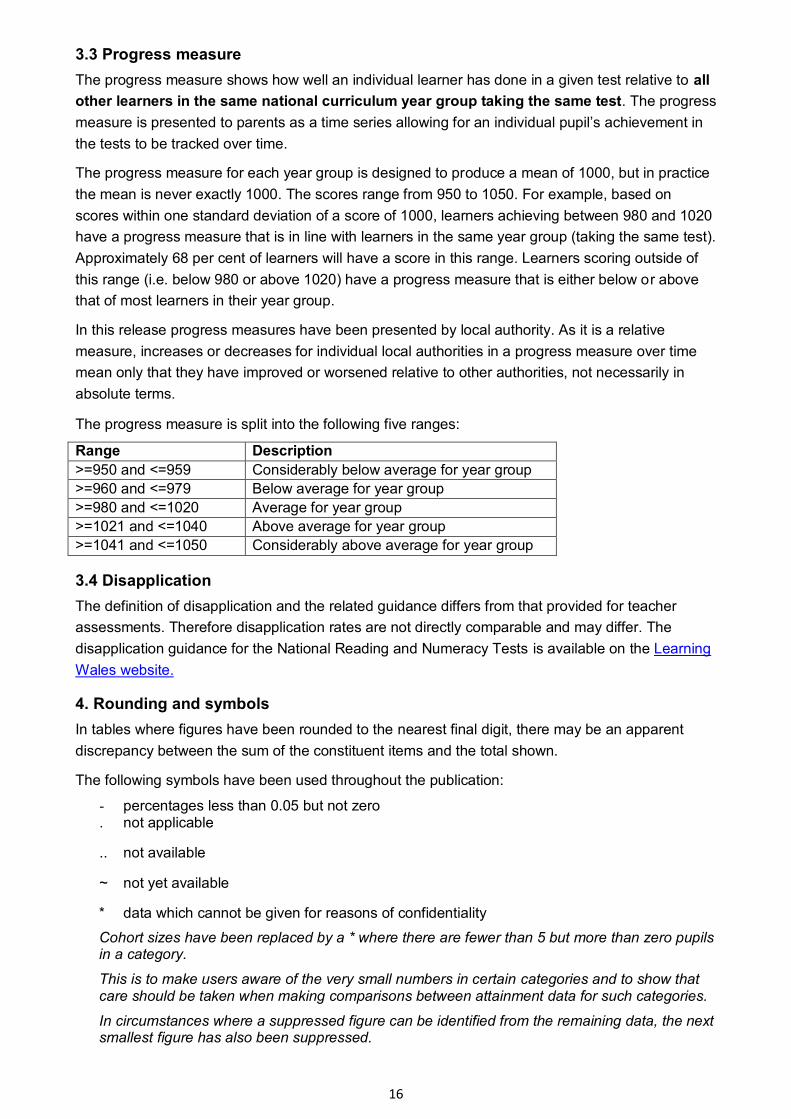
The progress measure shows how well an individual learner has done in a given test relative to all
other learners in the same national curriculum year group taking the same test. The progress
measure is presented to parents as a time series allowing for an individual pupil’s achievement in
the tests to be tracked over time.
The progress measure for each year group is designed to produce a mean of 1000, but in practice
the mean is never exactly 1000. The scores range from 950 to 1050. For example, based on
scores within one standard deviation of a score of 1000, learners achieving between 980 and 1020
have a progress measure that is in line with learners in the same year group (taking the same test).
Approximately 68 per cent of learners will have a score in this range. Learners scoring outside of
this range (i.e. below 980 or above 1020) have a progress measure that is either below or above
that of most learners in their year group.
In this release progress measures have been presented by local authority. As it is a relative
measure, increases or decreases for individual local authorities in a progress measure over time
mean only that they have improved or worsened relative to other authorities, not necessarily in
absolute terms.
The progress measure is split into the following five ranges:
Range Description
>=950 and <=959 Considerably below average for year group
>=960 and <=979 Below average for year group
>=980 and <=1020 Average for year group
>=1021 and <=1040 Above average for year group
>=1041 and <=1050 Considerably above average for year group
3.4 Disapplication
The definition of disapplication and the related guidance differs from that provided for teacher
assessments. Therefore disapplication rates are not directly comparable and may differ. The
disapplication guidance for the National Reading and Numeracy Tests is available on the Learning
Wales website.
4. Rounding and symbols
In tables where figures have been rounded to the nearest final digit, there may be an apparent
discrepancy between the sum of the constituent items and the total shown.
The following symbols have been used throughout the publication:
- percentages less than 0.05 but not zero . not applicable
.. not available
~ not yet available
* data which cannot be given for reasons of confidentiality
Cohort sizes have been replaced by a * where there are fewer than 5 but more than zero pupils in a category.
This is to make users aware of the very small numbers in certain categories and to show that care should be taken when making comparisons between attainment data for such categories.
In circumstances where a suppressed figure can be identified from the remaining data, the next smallest figure has also been suppressed.