This PDF is a selection from an out-of-print volume from the National Bureau of Economic Research Volume Title: National Saving and Economic Performance Volume Author/Editor: B. Douglas Bernheim and John B. Shoven, editors Volume Publisher: University of Chicago Press Volume ISBN: 0-226-04404-1 Volume URL: http://www.nber.org/books/bern91-2 Conference Date: January 6-7, 1989 Publication Date: January 1991 Chapter Title: National Saving and International Investment Chapter Author: Martin Feldstein, Philippe Bacchetta Chapter URL: http://www.nber.org/chapters/c5992 Chapter pages in book: (p. 201 - 226)
Transcript
This PDF is a selection from an out-of-print volume from the National Bureauof Economic Research
Volume Title: National Saving and Economic Performance
Volume Author/Editor: B. Douglas Bernheim and John B. Shoven, editors
Volume Publisher: University of Chicago Press
Volume ISBN: 0-226-04404-1
Volume URL: http://www.nber.org/books/bern91-2
Conference Date: January 6-7, 1989
Publication Date: January 1991
Chapter Title: National Saving and International Investment
Chapter Author: Martin Feldstein, Philippe Bacchetta
Chapter URL: http://www.nber.org/chapters/c5992
Chapter pages in book: (p. 201 - 226)
7 National Saving and International Investment Martin Feldstein and Philippe Bacchetta
7.1 Introduction
Do tax policies that stimulate a nation’s private saving rate increase its do- mestic capital stock or do the extra savings flow abroad? Does an increase in the corporate tax rate cause an outflow of capital that shifts the burden of that tax increase to labor and land?
These were the two key questions that motivated the 1980 Feldstein- Horioka (FH) study of the relation between domestic saving rates and domes- tic investment. FH reasoned that, if domestic saving were added to a world saving pool and domestic investment competed for funds in that same world saving pool, there would be no correlation between a nation’s saving rate and its rate of investment. The statistical evidence showed that, on the contrary, the long-term saving and investment rates of the individual industrialized countries in the OECD are highly correlated. The data were consistent with the view that a sustained one-percentage-point increase in the saving rate in- duced nearly a one-percentage-point increase in the investment rate.
Much has happened in the international capital markets during the decade since the Feldstein-Horioka study was done. The 1980s saw an unprecedented increase in the international flow of capital to the United States. Capital mar- ket barriers in Japan and Europe have been lowered or eliminated. This expe- rience raises the question of whether the empirical regularity observed for the 1960s and 1970s continued through the 1980s. Even those studies that fol- lowed Feldstein-Horioka were limited to data for the 1970s or the early 1980s.’ One purpose of the present study is to examine the experience for the
Martin Feldstein is professor of economics at Hanard University and president of the National Bureau of Economic Research, Cambridge, Massachusetts. Philippe Bacchetta is assistant profes- sor of economics at the Escuela Superior de Administraci6n y Duecci6n de Empresas, Barcelona, Spain, and this research was conducted while he was an assistant professor at Brandeis University. The authors are grateful to Rudiger Dornbusch, Jeffrey Frankel, and Maurice Obstfeld.
201
202 Martin Feldstein and Philippe Bacchetta
period 1980 through 1986 and to compare the results with the analysis for earlier years.
7.1.1
The initial FH paper created confusion about the interpretation of the results by discussing them as evidence about international capital mobility. Econo- mists who believe that the evidence on interest arbitrage implies that there is perfect capital mobility were therefore inclined to reject the FH findings. For- tunately, Jeffrey Frankel (1986) clarified the issue by reminding everyone that perfect capital mobility does not imply the international equalization of real interest rates. *
More specifically, as Frankel pointed out, the interest arbitrage condition of integrated capital markets refers to nominal interest rates only. Perfect capital mobility implies equal ex ante real interest rates only for time periods for which the expected change in the exchange rate equals the difference in the expected inflation rates. As Frankel stresses, since ex ante purchasing power parity may not hold even for periods as long as a decade, the existence of perfect capital markets (in the sense that the interest differential between two countries is equal to the expected change in the nominal exchange rate) does not imply a continuing equality of expected real interest rates. An increase in saving in one country that gives rise to an equal increase in its investment need not violate the nominal interest arbitrage condition even though it causes a decline in the real interest rate.
Purchasing power parity does not appear to hold, even in the long run that is relevant for the tax policy questions that motivated this research. But even if it did, in that very long run the difference between the nominal interest rates in each pair of countries may no longer equal the expected change in the ex- change rate because of investor risk aversion. An investor looking ahead for 10 years or more must be concerned about risks of changes in tax rules on foreign source income or even in political institutions that can affect the value of his international investments. Opportunities to hedge the interest rate or exchange rate risk on long-term positions are far more limited than for short- term positions, or at least have been until quite recently. For such long hori- zons, investor risk aversion may induce portfolio investors to prefer invest- ments in their own currency. As a result, expected real interest rates may also differ internationally in the long run.
In a riskless world, long-term nominal interest rate arbitrage could be achieved even though international investors only took net positions in the short-term market if domestic investors arbitraged short-term and long-term domestic interest rates. Once risk is introduced, however, arbitrage by hedged international short-term investors and the equilibrium of risk-averse domestic investors who hold both long-term and short-term securities is not enough to provide international equality of long-term rates.
As an example, a mean-variance investor will allocate his wealth among
International Capital Mobility and Risk Aversion
203 National Saving and International Investment
assets in proportions that vary positively with yield and inversely with risk. An investor who has a high degree of risk aversion or who attributes a large subjective variance to long-term investments in foreign assets may want to invest a large share of his portfolio in domestic assets (depending on asset yield covariances) even when a substantial expected yield difference exists in favor of the foreign assets. Since the mean-variance investor’s optimal propor- tional allocation of the assets is independent of the total value, an increase in saving that raises the total pool of funds will be invested primarily in the domestic economy.
In short, there is no presumption that real long-term yields would be equal- ized even if all investors were completely free to invest wherever in the world they want. Moreover, broad classes of financial institutions (and, in some countries, nonfinancial corporations as well) are in fact not permitted by reg- ulatory authorities to take net positions in foreign curriences. Many nonfinan- cia1 corporations also choose to avoid net foreign exchange exposure as a matter of policy rather than to evaluate the opportunities available at each point in time. The absence of these substantial pools of funds from the poten- tial pool of arbitrage funds would not be important if other investors were risk neutral. However, if the remaining investors are risk averse, the limited size of the mobile pool of unhedged funds increases the potential importance of risk aversion and, therefore, the scope for expected real rates of return to re- main unequal.
7.1.2 Government Policies and the Current Account
Although the lack of ex ante purchasing power parity and the risk aversion of international investors are sufficient to permit domestic saving rates to in- fluence substantially the rate of domestic investment, the observed link be- tween saving and investment may also reflect explicit government policy de- cisions.
It is easy to understand why governments would want to restrict the size of trade imbalances in general and of changes in trade imbalances in particular. Since an increase in the merchandise trade deficit means a loss of exports and the substitution of imports for domestic production, the affected domestic in- dustries are likely to seek government actions to shrink the trade deficit. A decrease in the merchandise trade deficit caused by a spontaneous increase in the demand for the country’s exports may be welcome if there is excess capac- ity in the economy but would be resisted by the government as a source of inflation if there is not excess capacity. Since a rise in exports in a fully em- ployed economy also means a fall in the production of other goods and ser- vices, the industries producing for the domestic market are likely to seek pol- icies to reverse the rise in exports.
These arguments refer to changes in the trade balance rather than to its level. Why should a government resist a long-run current account deficit or surplus? One answer is that an economy that starts in trade balance will not
204 Martin Feldstein and Philippe Bacchetta
want to shift to a long-run imbalance because of its reluctance to accept the dislocations involved in changing the pattern of production from trade balance to trade imbalance. But there are also reasons why a government would resist a long-term trade and current account imbalance in addition to the problems of transition.
Because of capital income taxes, a persistent capital outflow diverts domes- tic savings to investment abroad that has a lower return to the originating nation. Each government therefore has an incentive to seek a capital inflow and to resist the outflow of its own capital.
A country with a trade surplus and a capital outflow also has the opportu- nity to trade a reduction in the trade surplus for a higher level of real income (through an improvement in the terms of trade) and a temporarily lower level of inflation (through the favorable “supply shock” of an increase in the level of the currency).
There are a variety of policies that governments can use to shift the econ- omy toward trade and current account balance. In the short run, monetary policy can be used to influence the exchange rate and the level of economic activity. Summers (1988) has suggested that governments may tailor the size of the budget deficit to offset differences between private saving and invest- ment. Other possibilities include the use of targeted tax policies designed to increase or decrease the level of investment or private saving: the investment tax credit, the schedule of depreciation allowances, the availability of special tax preferred savings accounts, a difference in the tax rates on capital and labor income. and so on.
7.1.3 Implication for the Effects of Fiscal Policies
The reason that saving and investment are closely correlated is important for answering the questions that motivated the original study.
Consider the Summers (1988) hypothesis that the close correlation between investment and saving reflects the response of government deficit policy to shifts in private investment and saving. If a tax change that encourages private saving is offset by an increase in the government budget deficit, there is no rise in capital formation. If however the close correlation between saving and investment reflects either the reluctance of private risk-averse investors to move capital abroad (so that private investment rises automatically) or a gov- ernment tax policy to stimulate private investment until it absorbs all of the increase in domestic saving (rather than permit a capital outflow or a contrac- tion of national income), the tax-induced rise in saving does get converted into greater domestic capital formation.
The reason for the observed saving-investment correlation is also important for assessing whether a tax on investment income causes a capital outflow that permits the incidence of the tax to be shifted to labor. If the observed saving- investment correlation reflects the unwillingness of risk-averse domestic
205 National Saving and International Investment
investors to shift capital abroad, the increase in the capital tax causes a fall in the net of tax rate of return and thus no shifting of the tax burden. In contrast, if the saving-investment equality occurs because of a government decision to increase the budget deficit to absorb the capital that would otherwise go abroad, leaving just enough domestic saving to finance a level of investment at which the after-tax return is equal to the after-tax return abroad, the tax is fully shifted.
In support of the “endogenous deficit policy” hypothesis, Summers (1988) presents a regression for a cross-section of industrialized countries of the av- erage deficit-GNP ratio for the period of 1973-80 on the average private saving-investment gap (the difference between net private saving and net pri- vate investment) for those same years. He finds a coefficient of 0.72 and con- cludes that it implies that 72 percent of the net savings gap may be offset by an explicit budget deficit policy.
There is however a quite different interpretation of the Summers deficit re- gression. If the long-run level of the budget deficit is thought of as exogenous (reflecting political considerations in the county rather than an attempt to off- set the saving-investment gap), then the regression may only reflect the impact of the budget deficit on the level of investment. This would be the traditional crowding out of private investment by government deficits. Summers presents no evidence or reason to think that his regression should be interpreted as a policy response function rather than as a description of the crowding out of private investment by government deficits. We return to this in section 7.5 below.
7.1.4 Statistical Estimates
First, however we will turn to the evidence on the link between saving and investment in the most recently available data. We also take this opportunity to consider whether the correlation between saving and investment is equally strong for different subsets of countries within the OECD, including separate analyses for the European Economic Community (EEC) and non-EEC coun- tries.
Previous comments on the FH regressions raised the issue of the possible endogeneity of national saving rates. This was actually discussed in the origi- nal FH paper and estimates using instrumental variables provided as a check on the possible bias from this source. The instrumental variables were demo- graphic and social security variables. The resulting coefficient confirmed the ordinary least squares results. Since this issue has been explored rather thor- oughly in the earlier paper, we will not present such instrumental variable estimates in the current analysis.
We will however examine two other issues in some detail. The first is the suggestion by Obstfeld (1986) that the observed correlation may reflect the common influence of economic growth on both saving and investment. We
206 Martin Feldstein and Philippe Bacchetta
replicate the Obstfeld analysis in section 7.3 and show that, although it can in theory explain the observed saving-investment correlation, the actual data are not consistent with the Obstfeld hypothesis.
The second is an analysis of the dynamic adjustment process by which sav- ing and investment adjust to changes in the saving-investment gap. We show in section 7.6 that the process can be described as an adjustment of investment to close the gap and not an adjustment of saving. We also present some evi- dence that suggests that the desired gap is not zero in all countries but that countries adjust investment to close the difference between the actual saving- investment gap and a preferred gap.
7.2 Is Capital Market Integration Increasing?
The reduction in government barriers to international capital flows, the cre- ation of extensive new hedging markets, and the growing sophistication of financial institutions around the world have increased the likelihood of net capital flows. The sharp fall in the U.S. national saving rate in the 1980s (due to both the increased budget deficit and the decline in private saving) also provided a major incentive for the shift of capital to the United States.
The evidence in this section indicates that there has in fact been a substan- tial decline in the correlation between the rates of gross domestic saving and gross domestic investment. However, the effect of additional domestic saving on domestic investment remains quite substantial. Even in the 1980s, each dollar of additional saving is associated with an increase in investment of more than 50 cents.
The analysis is based on the regression equation
I , /Y, = a, + a, S,/Y, ,
where I , is gross investment (as defined by the OECD and including inventory investment), Y , is gross domestic product, and S, is gross saving. The esti- mates use data for 23 OECD countries (excluding Luxembourg). The unit of observation is a single country and the data for that country has been averaged over a group of years. The coefficient a, that indicates the proportion of the incremental savings that is invested domestically will be referred to as the “savings retention coefficient .”
Consider first the estimates for gross investment presented in column 1 of table 7.1. In the decade of the 1960s, each extra dollar of domestic saving increased domestic investment 91.4 cents with a standard error of 6.3 cents. For the next decade this had declined to 80.5 cents with a standard error of 12.1 cents. The decline of 10.9 cents is, however, less than the 13.6 cent standard error of the difference. The seven available years of the 1980s shows a further decline to 60.7 cents with a standard error of 12.6 cents. Although the 19.8 cents decline from the 1970s is only slightly larger than the asso- ciated standard error of 17.5 cents, the pattern of continuing decline from the
207 National Saving and International Investment
Table 7.1 The Changing Impact of Domestic Savings on Domestic Investment
8 Non-EEC 14 Non-EEC 17 OECD OECD
23 OECD 9 EEC OECD European European Countries Countries Countries Countries Countries
Gross Net Gross Net Gross Net Gross Net Gross Net Period (1) (2) (3) (4) ( 5 ) (6) (7) (8) (9) (10)
1960-69 ,848 (.063)
1970-79 ,671 (.121)
1980-86 ,863 (.126)
1960-73 ,718 (.066)
1974-86 ,868 (. 145)
1960-86 ,833 (.094)
.914 (.081) ,805
(.122) ,607
(.136) ,911
(.077) .669
(.154) ,791
(.111)
,913 (. 10% ,864
(. 302) ,792
(.342) ,894
(.152) .878
(.383) .865
(.243)
,742 (.173) ,652
(.282) ,356
(.461) .I25
(.211) ,462
(.431) ,524
(.318)
,884 (.072) ,956
(.141) ,509
(.134) ,961
(.071) ,804
(.161) ,830
(.098)
,962 (.091) ,810
(. 140) ,578
(.145) ,951
(.076) ,628
(.172) ,816
( . I l l )
.940 (.082) ,831
,807 (.156) 378
(.105) .868
( ,202) ,867
(. 140)
(.204)
.835 ( . I l l ) ,770
(.173) ,581
(.180) .832
(.114) ,641
(.221) ,717
(.158)
,877 ,870 (.166) (.146) ,810 ,636
(.399) (.239) ,792 ,555
(.203) (.224) ,837 .906
(.232) (.105) .874 ,521
(.303) ( ,308) .847 ,668
(.218) (.185)
1960s implies a more significant relation. From the 1960s to the 1980s the decline of 30.7 cents is more than twice the standard error associated with this difference.
Another way of comparing the earlier and later parts of the 27-year sample period is to contrast the earlier fixed exchange rate years (1960-73) with the later floating rate years (1974-86). During the earlier 14 years the savings retention coefficient was 0.91 1 (standard error 0.066), barely different from the result for the decade of the 1960s. The coefficient for the later 13 years was, however, 0.669, much more similar to the coefficient for the 1980s. The difference of 0.242 is approximately 1.5 times it standard error.
The final row of column 1 in table 7.1 shows that, for the 27-year period as a whole, the savings retention coefficient was 0.791 with a standard error of 0.094. A potentially interesting line of analysis that we have not pursued would be to test whether the investment-savings relation has changed at a constant rate during this period or has had significant step changes after the beginning of the floating rate period or in the decade of the 1980s.
The net saving and investment relations (shown in col. 2 of table 7.1) do not indicate a fall over time similar to the corresponding gross saving- investment coefficients. The key savings retention coefficient only declines from 0.913 in the 1960s to 0.864 in the 1970s and 0.792 in 1980-86; none of the difference, including the difference between the 1960s and the 1980s, is as large as its standard error.
This difference between the gross and net saving-investment relations masks a more complex difference between the changes over time in the coun-
208 Martin Feldstein and Philippe Bacchetta
tries and among the non-EEC industrial countries of the OECD. The differ- ences in experience among different groups of countries is the subject of the next section of this paper.
7.3 Capital Flows and the EEC
Although capital might in principle flow with equal ease among all coun- tries or at least all industrial countries, the availability of market information, the existence of institutional relationships, and the perception of risk might make capital flows greater among some pairs of countries than among others. More specifically, in the current context, each extra dollar of saving in one country may be divided between the home capital market (which gets the larg- est share) and other individual national capital markets in a way that depends on a variety of institutional and other country-specific factors.
We have explored this possibility by looking separately at the investment- saving equation for nine of the EEC countries (excluding the new entrants, Spain and Portugal, as well as Luxembourg) and the investment-saving equa- tion for the remaining 14 OECD countries. It should be emphasized that the EEC savings retention coefficient does not reflect the extent of the capital flow among the EEC countries but rather the extent to which individual EEC coun- tries retain their national savings within the saving country.
Consider first the behavior of the investment-saving relation in the nine EEC countries shown in columns 3 and 4 of table 7.1. The gross savings retention coefficients, shown in column 3, are lower among the EEC countries than for the entire OECD group and decline much more rapidly between the 1970s and the 1980s. The decline from 0.742 in the 1960s to 0.652 in the 1970s was not large, but this was followed by a sharp decline to only 0.356 in the 1980-86 period. By comparison, the coefficients of the 14 non-EEC members of the OECD was 0.962 in the 1960s, 0.810 in the 1970s, and 0.578 in the 1980s.
We should caution, however, that the standard errors of the coefficients for the EEC countries are quite large since each is based on only nine observa- tions. Thus the sharp decline from 0.652 in the 1970s to 0.356 in the 1980s is only two-thirds as large as its standard error of 0.456. We cannot reject the hypothesis that there was no change. Even the fall from 0.742 in the 1960s to 0.356 in the 1980s is only slightly greater than its standard error of 0.359; the hypothesis of no change cannot be formally rejected with this small sample. The test, however, is of low power because of the small sample size, and we would emphasize the large decline rather than its statistical “insignificance.”
When we shift from gross to net saving and investment, the pattern of the savings retention coefficients differs even more sharply between the EEC and non-EEC countries. As already noted, among the OECD as a whole, the net saving-investment relation shows virtually no change between the early and
209 National Saving and International Investment
later periods (see col. 2). In contrast, column 4 shows that the net saving- investment coefficients declined sharply within the EEC between the 1970s and 1980s. This contrast is seen most clearly when the EEC coefficients of column 4 are compared with the non-EEC coefficients of column 6.
Although the small sample of EEC countries makes it difficult to draw any firm conclusions, these data appear to indicate that there have been greater capital flows out of the individual EEC countries (i.e., a smaller share of in- cremental savings is retained with the saving country) than among the non- EEC countries and that the extent of this capital mobility increased in the 1980s.
We have also examined the saving-investment behavior in the wider group of all 17 European OECD countries (col. 7 and 8 of table 7.1) and in the non- EEC European OECD countries (col. 9 and 10). The results shows that the non-EEC European countries behaved more like the EEC countries than like the non-European members of the OECD.
These results are not only interesting in themselves as an indication of the increasing integration of the European capital markets but also suggest that the reason why the savings retention coefficients are generally much greater than zero reflects the extent of informational and institutional links among the capital markets. The coefficient is lower for the EEC countries despite formal barriers on capital exports in some countries because of the strength of insti- tutional links. Even when capital is completely mobile in principle, actual capital flows are retarded by ignorance and risk aversion.
7.4 The “Missing” Growth Variable
The surprising strength of the savings retention coefficient in the original FH study led subsequent researchers to postulate that the strength of the coef- ficient may reflect the impact of some missing variables that influence invest- ment and are correlated with savings. Obstfeld (1986) has developed the idea that the missing variable may be the growth rate of GDP or a combination of the GDP growth rate and of labor’s share of national income.
Life-cycle theory implies that these two variables determine the long-term behavior of a country’s saving rate. Obstfeld posits a model in which the rate of output growth is also an important determinant of the country’s rate of investment; although demand-determined variations in output growth may have an important influence on the timing of investment, in the current context of comparing long-term differences in national investment rates we would be more inclined to regard output growth as the result of previous capital invest- ment than to look upon output growth as an exogenous determination of in- vestment. Obstfeld (1986) used data on GDP growth and on the ratio of em- ployee compensation to national income in individual OECD countries to simulate the saving-GDP ratios and investment-GDP ratios for those countries
210 Martin Feldstein and Philippe Bacchetta
that would result in a simple theoretical model. He then used these simulated investment and saving ratios to estimate statistically the basic investment- saving ratio.
The Obstfeld model assumes complete world capital mobility; that is, the only link between saving and investment in each country is that they depend on common variables. Nevertheless, a regression of the simulated investment- GDP ratio on the simulated saving-GDP ratio produces coefficients that are approximately equal to one, with the precise coefficient depending on the group of countries selected.
Although we regard this as an ingenious demonstration of how the observed investment-saving relation might in principle be just a spurious reflection of the missing growth and income distribution variables, we do not find it con- vincing. The real test of whether the savings variables is just a proxy for the growth and distribution variables is whether the inclusion of growth and dis- tribution causes a significant change in the savings retention coefficient in a regression using the actual saving and investment variables instead of the sim- ulated ones.
To test this in a way that makes it strictly comparable to Obstfeld’s analysis, we began by following his procedure to create synthetic saving and invest- ment variables. We used observations for the same countries and years as Obstfeld. Despite the usual OECD data revisions, we found that we were able to reproduce his results quite closely. For example, with a sample of 17 coun- tries for the period 1970-79, Obstfeld found a savings retention coefficient of 0.86 (with a standard error of 0.81) and we found a coefficient of 1.01 with a standard error of 0.78. Adding the product of the growth and income distri- bution variables to the Obstfeld synthetic equation caused the savings absorp- tion coefficient to become - 0.75 with a standard error of 0.10 while the other variable “explained” the variation in the synthetic investment series.
However, when we replaced the synthetic variables with the actual saving and investment variables, the estimated savings retention coefficient was little affected by adding the growth and distribution variables to the equation. More specifically, with the same Obstfeld sample of countries and years, but using the actual saving and investment data rather than the synthetic ones, the esti- mated coefficient of the savings variable was 0.88 (with a standard error of 0.12) in the basic regression. When the growth and distribution variables were added to the equation, the coefficient of the saving variable because 0.87 (with standard error of 0.13).
Similar results were obtained with other combinations of growth rates and income. In no case did the inclusion of the growth and distribution variables substitute for the effect of the savings variable as a determinant of domestic saving.
The implication of this is clear. Although the estimated savings retention coefficient could in theory reflect only the indirect effect of omitted growth and distribution variables. the evidence indicates that this is not so.
211 National Saving and International Investment
7.5 Budget Deficits
As we wrote in section 7.1, Summers (1988) has noted that there is an alternative possible explanation for the observed relation between investment and savings rates. Summers suggests that if governments do not like capital outflows or inflows, they might adjust their budget deficits to offset the gap between investment and private saving.
As evidence of this possibility, Summers presents a regression of the ratio of the budget deficit to GDP on the difference between the private savings ratio (i.e., the ratio of domestic savings plus the budget deficit to GDP) and the investment-GDP ratio:
(2) DEFIY = b, + b, (PS - OIY,
where DEF is the general government budget deficit (i.e, the OECD measure of general government saving with the sign changed), PS is private saving (Let saving as previously defined plus the budget deficit) and I and Y are investment and gross domestic product as previously defined.
For a sample of 14 countries for the period 1973-80, Summers obtained a coefficient of 0.72.3 Taken at face value, this would imply that each dollar of the private saving-investment gap induces governments to increase their bud- get deficit by 72 cents. Since the precise sample used by Summers is not known, we reestimated his equation ([2] above) with data for 13 OECD coun- tries for which data are available for the period 1973 through 1980. The esti- mated coefficient of 0.68 with a standard error of 0.15 is quite close to the original estimate by Summers.
There are, however, serious problems of interpretation of equation (2). Al- though such a model of deficit adjustment may have merit as a description of short-term stabilization policy, we find it very implausible as an explanation of why long-term differences in budget deficit ratios persist among countries. A more likely explanation of the correlation between budget deficits and net saving ratios is that budget deficit ratios are “exogenous” (reflecting political and historical characteristics) and that high deficit ratios crowd out private investment in the traditional way. Similarly, countries with budget surpluses may “crowd in” more private investment.
To assess the plausibility of this alternative specification, we reorder the variables of equation (2) and estimate the equation:
(3) IIY = c, + c , DEFIY + c2 PSIY
This is a natural generalization of the basic equation (1) that divides domestic saving into two components: private saving (PS) and government saving ( - DEF). The original basic model implies that the coefficients c, and c, are equal in absolute value but opposite in sign with private saving having a posi- tive effect and the budget deficit a negative effect.
The results, presented in table 7.2, are generally consistent with this gen-
212 Martin Feldstein and Philippe Bacchetta
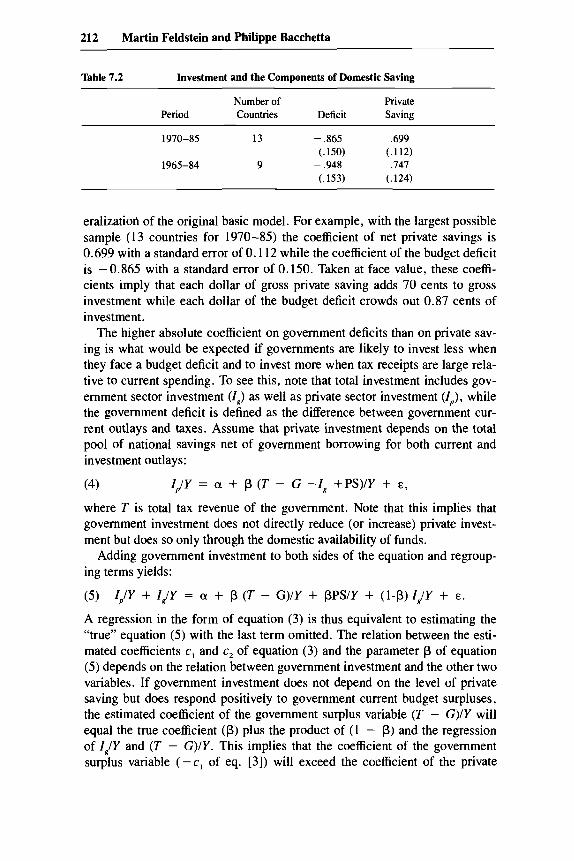
Table 7.2 Investment and the Components of Domestic Saving
Number of Private Period Countries Deficit Saving
1970-85 13 - ,865 ,699 (.150) (.112)
1965-84 9 - ,948 ,747 (.153) (.124)
eralizatiod of the original basic model. For example, with the largest possible sample (13 countries for 1970-85) the coefficient of net private savings is 0.699 with a standard error of 0.112 while the coefficient of the budget deficit is -0.865 with a standard error of 0.150. Taken at face value, these coeffi- cients imply that each dollar of gross private saving adds 70 cents to gross investment while each dollar of the budget deficit crowds out 0.87 cents of investment.
The higher absolute coefficient on government deficits than on private sav- ing is what would be expected if governments are likely to invest less when they face a budget deficit and to invest more when tax receipts are large rela- tive to current spending. To see this, note that total investment includes gov- ernment sector investment (I,) as well as private sector investment (ZJ, while the government deficit is defined as the difference between government cur- rent outlays and taxes. Assume that private investment depends on the total pool of national savings net of government borrowing for both current and investment outlays:
(4) ZJY = (Y + p (T - G -1, + P S ) / Y + E ,
where T is total tax revenue of the government. Note that this implies that government investment does not directly reduce (or increase) private invest- ment but does so only through the domestic availability of funds.
Adding government investment to both sides of the equation and regroup- ing terms yields:
A regression in the form of equation (3) is thus equivalent to estimating the “true” equation (5) with the last term omitted. The relation between the esti- mated coefficients c , and c, of equation (3) and the parameter p of equation (5) depends on the relation between government investment and the other two variables. If government investment does not depend on the level of private saving but does respond positively to government current budget surpluses, the estimated coefficient of the government surplus variable (T - G)/Y will equal the true coefficient (p) plus the product of (1 - p) and the regression of I J Y and (T - G)/Y. This implies that the coefficient of the government surplus variable ( - c, of eq. [3]) will exceed the coefficient of the private
213 National Saving and International Investment
saving variable (c, of eq. [3]). The bias is, however, relatively small. If the “true” coefficient p is 0.75 and the long-run propensity of the government to spend current surpluses on government investment is as large as 0.4, the esti- mated value of - c , will be 0.85 instead of 0.75.
In practice, the difference between the estimates of - c, and c, is not statis- tically significant with a sample of only 13 observations. Estimating the con- strained equation for this sample produces a coefficient of 0.76 on domestic saving with a standard error of 0.09. Comparing the sums of squared residuals for the constrained and unconstrained specifications implies an F-statistic of 0.81 with 1 and 10 degrees of freedom. Since the critical value for 5 percent significance is 4.96, we cannot reject the simple original specification.
Note that the estimate of c, is an unbiased estimate of the true parameter p regardless of the size of p and of the government’s propensity to do public investment as a function of the government’s current surplus as long as the government investment is not influenced by the private saving rate.
The problem of distinguishing between the “deficit reaction function ap- proach” of equation (2) and the “components of domestic saving” approach of equation (3) cannot be definitively resolved by these estimates since the statis- tical problem is one of identification and, more fundamentally, of providing the theoretically correct specification. It is helpful in this to look at the under- lying raw data in the context of what we know about the particular economies.
Table 7.3 presents data on the deficit, net private saving, and net investment for the decade of the 1970s and the period 1980-84. Such data are only avail- able for 13 countries.
It is noteworthy that in the 1970s the “deficits” were negative in all of the
Table 7.3 Budget Deficits, Private Saving, and Investments
Germany Austria Switzerland Netherlands Sweden Finland Belgium Spain United Kingdom Australia Canada United States Japan
- .03 - .05 - .04 - .03 - .07 - .07 .oo
- .03 - .01 - .05 - .01
.01 - .04
.10
. I1
.I4
. I 3
.05
.06
.I4
. I2
.07
. l l
. I0
.09
. I 8
. I3
.I7
.I6
.I5
.12
.15
.13
.I6
.I0
.11
.13
.08
.22
- .01 - .02 - .03
.01
.01 - .03
.07
.01
.02
.01
.03
.03 - .03
.08
.09
.I4
. I2
.06
.07
. I 3
.09
.08
.04
.12
.08
.I4
.09
. I2
.14
.09
.07
. l l
.08
.10
.04
.09
. I0
.05
.I7
Nore: All figures are expressed as ratios to gross domestic product. Investment and private saving are net variables.
214 Martin Feldstein and Philippe Bacchetta
countries except the United States and Belgium. The other countries had sur- pluses ranging from 1 percent of GDP to 7 percent of GDP. By the 1980s, most of these countries were experiencing actual deficits. It would be very interesting but beyond our capability to examine the historic reasons for these shifts country by country.
Consider, however, the case of the United States, which went from a deficit of 1 percent of GNP in the 1970s to 3 percent in the first half of the 1980s. For the 1970s, the U.S. deficit was the largest of all 13 countries; indeed, none of the others had a deficit. It is hard to argue, however, that this represented a fiscal policy decision aimed at supporting aggregate demand since inflation was a serious problem during most of this decade and there was a general feeling that national saving was too low. While it might in theory be argued that the shift to a larger deficit in the 1980s was a way of dealing with the large recession in 1980-82, the actual historic record shows that the recession was the unintended consequence of a political inability to obtain sufficient domes- tic spending cuts to pay for the combination of tax cuts, defense spending increases, and higher interest payments on the national debt.
One caveat should be indicated about this analysis. Government deficits reflect payments of interest on the national debt because such interest pay- ments are part of current government outlay. Since inflation differences among the countries influence the interest rates on the government debt, the deficits reflect to differing degrees the inflation erosion of the government debt and are in this sense not “true” deficits. This is likely to be more important in the international context than over time in individual countries.
To examine the sensitivity of our conclusions to the failure to adjust for inflation, we have repeated the analysis using inflation-adjusted government deficits and private savings using data constructed by Muller and Price (1984) (as given by Roubini and Sachs 1989). The inflation-adjusted results are very similar to the unadjusted estimates. Using data for the largest available sample (13 countries for the period 1971 through 1986), the disaggregated savings coefficients are almost exactly equal in absolute value:
where DEF* and PS* are both inflation adjusted. The evidence clearly sup- ports the view that either source of variation in national saving has the same effect on domestic investment.
7.6 Dynamic Adjustment
As Feldstein (1983) and Feldstein-Horioka (1980) emphasized, the close relationship between domestic saving and domestic investment is a long-term characteristic and does not hold from year to year. With time-series data, the savings retention coefficients are much lower than in cross-section analyses.
It is possible however to examine the dynamic adjustment process by which
215 National Saving and International Investment
the close association between domestic investment and domestic saving is maintained. The evidence presented in this section supports the view that it is domestic investment that responds to changes in domestic saving. The evi- dence is not consistent with a view that domestic saving (either private alone or the combination of private and public) responds to shifts in investment.
Consider therefore the simple adjustment process by which the change in the investment ratio from year to year (Z,/Y, - Z, - , /Y , - ,) varies inversely with the previous year’s investment-savings gap (Z, I - S, J Y ,
(7)
If an increase in the gap between investment and saving causes investment to decline, d, is negative. Such a decline could be caused by a rise in interest rates induced by the “shortage” of savings in year t - 1. The evidence pre- sented below shows that d, is in fact negative, supporting the view that invest- ment responds to shifts in saving.
A similar regression shows that the saving rate does not respond to the gap between investment and savings. For this purpose, we estimate the equation
(8) S,/Y, - Sr-,/Yr-l = e, + e, U-, - S , - J / Y , - , .
Although a shortage of savings could raise saving by increasing the interest rate or inducing an increase in the government surplus, the evidence suggest that this does not occur. Of course, this is quite consistent with much previous evidence that investment is more sensitive to interest rates than saving.
The results are presented in table 7.4. Equation (1) presents the results cor-
ZjY, - 1, - , / Y , - , = do + d, ( I , - , - S,- , ) / Y , - ,
Table 7.4 Dynamic Adjustment of Investment and Saving in 23 OECD Countries
~~~~ ~
Coefficient of Lagged Dependent Coefficient
Equation Variable Constrained? Period Investment Saving
Investment
Saving
Investment
Saving
Investment
Saving
Investment
Saving
no
no
no
no
no
196 1-86
196 1-86
1961-86
196 1-86
1961-73
1961-73
1974-86
1974-86
- ,227 (.026)
(.026)
(.028) - .014 (.025) - .344 (.048) ,034
(.039) - ,240 (.037)
(.036)
- ,036
- ,275
- ,025
.227 (.026) ,036
(.026) .198
(.027)
(.024) ,262
( .045) - ,083 (.037) ,140
(.036)
(.033)
- .068
- ,132
216 Martin Feldstein and Philippe Bacchetta
responding to equation (8) for the 23 OECD countries (i.e., all OECD coun- tries except Luxembourg) for the period 1961-86. The coefficient of -0.227 (with a standard error of 0.026) implies that an investment-savings gap of one percentage point of GDP causes the investment-GDP ratio to fall by approxi- mately a quarter of a percentage point in the following year. After three years the adjustment of investment alone would reduce the gap to less than one-half a percent of GDP; after six years, 80 percent of the gap would be eliminated.
The corresponding saving equation is presented as equation 2 of table 7.4. The coefficient of -0.036 is small both absolutely and relative to its standard error of 0.024 and of the wrong sign. The data thus imply no response of the saving rate to the saving-investment gap.
Disaggregating the adjustment coefficient into separate coefficients for lagged investment and lagged saving supports this interpretation of the evi- dence. In the unconstrained investment equation (eq. [3] of table 7.4), the coefficients of the lagged investment ratio is - 0.275 with a standard error of 0.028 while the coefficient of the lagged saving variable is 0.198 with a stan- dard error of 0.027. The coefficients are close enough in magnitude to be equal for practical purposes. But if the point estimates are taken literally, the evidence implies that a rise in the savings ratios induces a slightly smaller rise in subsequent investment than a fall in the investment ratio. This is just what might be expected if the stochastic disturbance contains a serially correlated determinant of investment.
Dividing the sample into the fixed-rate first half (1961-73) and the floating- rate second half (1974-86) shows that the results are similar in both subper- iods, with some indication of a slower response in the second half than in the earlier period. These results are shown in equations (5)-(8) of table 7.4. This confirms the results presented in section 7.2.
The constant terms in equations (7) and (8) in this text imply that the in- vestment and saving ratios would adjust monotonically over time even if there were no investment-savings gap. Since there is no justification for such a trend, we have also estimated the equations of table 7.4 with the constraint that there is no constant term. The results are very similar to the coefficients of table 7.4 and are not presented to save space.
We have also repeated this dynamic analysis for the nine EEC countries alone. The basic results, presented in table 7.5, are very similar to the result for the entire OECD. Investment adjusts to the lagged investment-savings gap while saving does not adjust. The coefficients for the EEC also imply a small savings retention, confirming the results in section 7.3. The other principal difference between the two sets of results is that the unconstrained coefficients suggest that the effect of an increase in saving is smaller than the effect of an increase in investment. This may reflect only the bias referred to above that results if the disturbance is serially correlated.
It would be worthwhile to examine the adjustment process more exten- sively, considerably more general adjustment dynamics and using estimation
217 National Saving and International Investment
Table 7.5 Dynamic Adjustment of Investment and Saving in Nine EEC Countries
Coefficient of Lagged Dependent Coefficient
Equation Variable Constant? Period Investment Saving
Investment
Saving
Investment
Saving
Investment
Saving
Investment
Saving
Yes
yes
no
no
no
no
no
no
196 1-86
1961-86
1961-86
196 1-8 1
1961-73
1961-73
1974-86
1974-86
- ,159 ( . o w - .015 (.037) - ,225 (.045) - ,059
- ,222 (.087) ,064
(.065) - .216 (.055) - ,090 (.051)
,159
,015 (.037) .123
(.042)
- ,055 (.037) ,083
(.078)
(.058) ,071
(.055) -.I15 (.050)
- .I60
Norer The nine EEC countries exclude Spain, Portugal, and Luxemborg.
methods that are consistent in the presence of serial correlation, although that may provide little reassurance with such small samples.
7.6.1 Persistent Current Account Imbalances
The specification of equation (7) implies that each country will adjust its investment to eliminate eventually the entire investment-saving gap. A more general specification would recognize that countries may instead have a “nor- mal” nonzero level of current account surplus or deficit to which they adjust.
We consider therefore the following generalization of equation (7):
(9)
where GAP is the desired or normal investment-saving gap. Equation (9) is only distinguishable from equation (7) when the GAP is permitted to vary among countries.
Equation (9) has therefore been estimated with individual constant terms for each of the 23 OECD countries using data for 1961-86. Separate estimates for the subperiods 1961-73 and 1974-86 have also been calculated. The re- sults are presented in table 7.6.
Equation (1) of table 7.6 corresponds to equation (9) for the entire period 1961-86. Equations (2) and (3) correspond to the two subperiods.
The individual constant terms correspond to substantial positive “normal” or “target” investment-saving gaps in several countries including Australia,
218 Martin Feldstein and Philippe Bacchetta
Table 7.6 Normal Investment-Saving Gaps in OECD Countries
United States United Kingdom Japan Germany France Italy Canada Australia New Zealand Switzerland Spain Portugal Belgium Netherlands Greece Turkey Sweden Denmark Finland Norway Iceland Austria Ireland
New Zealand, Portugal, Greece, Turkey, Denmark, and Ireland. There were fewer countries with negative target investment-saving balances, but these in- cluded Germany, France, Switzerland, the Netherlands and, since 1974, Ja- pan. It is clear that these “normal” or “target” investment-saving balances do correspond generally to the economic situations of the countries with the lower income, countries more likely to seek capital inflows while the high saving and older industrial countries correspond to a target excess of saving over investment.
7.7 Conclusion
The basic conclusion of the present analysis is that an increase in domestic saving has a substantial effect on the level of domestic investment although a smaller effect than would have been observed in the 1960s and 1970s. The
219 National Saving and International Investment
more closely integrated economies of the EEC also appear to have more out- ward capital mobility (i.e, a lower savings retention coefficient) than other OECD countries.
There is no support for the view that the estimated saving-investment rela- tion reflects a spurious impact of an omitted economic growth variable. Al- though budget deficits are inversely related to the difference between private investment and private saving, we reject the view that this reflects an endoge- nous response of fiscal policy in favor of the alternative interpretation that the negative relation is evidence of the crowding out of private investment by budget deficits. This interpretation is supported by the evidence that domestic investment responds equally to private saving and budget deficits.
The dynamic adjustment analysis supports the view that domestic invest- ment adjusts rather quickly when there is an unwanted investment-saving gap while domestic saving shows little tendency to adjust.
The implication of the analysis thus supports the original Feldstein-Horioka conclusions that increases in domestic saving do raise a nation’s capital stock and thereby the productivity of its work force. Similarly, a tax on capital in- come is not likely to be shifted to labor and land by the outflow of enough domestic capital to maintain the real rate of return unchanged.
Notes
1. These include Feldstein (1983), Caprio and Howard (1984), Murphy (1984), Penati and Dooley (1984), Sachs (1983), and Summers (1988). See Dooley, Frankel, and Mathieson (1987) for a summary of these results.
2. For a more complete discussion of these issues, see the essay by Frankel in this volume.
3. The text of Summer’s paper does not specify the sample of countries or years for which his regression was estimated, but elsewhere in his paper he indicates that an equation using the deficit variable as an instrumental variable is limited to this sample of countries and years because of data limitations.
References
Caprio, Gerard, and David Howard. 1984. Domestic saving, current account, and in- ternational capital mobility. International Finance Discussion Papers no. 244. Fed- eral Reserve Board, Washington, D.C.
Dooley, Michael, Jeffrey Frankel, and Donald Mathieson. 1987. International capital mobility: What do saving-investment correlations tell us? International Monetary Fund Staff Papers 34503-30.
Feldstein, Martin. 1983. Domestic saving and international capital movements in the long run and the short run. European Economic Review 2 1 : 129-5 1.
220 Martin Feldstein and Philippe Bacchetta
Feldstein, Martin, and Charles Horioka. 1980. Domestic saving and international cap- ital flows. Economic Journal 90: 314-29.
Frankel, Jeffrey. 1985. The implications of mean-variance analysis for four questions in international macroeconomics. Journal of International Money and Finance.
. 1986. International capital mobility and crowding out in the U.S. economy: Imperfect integration of financial markets or of goods markets? In How Open Is The U S . Economy? ed. R. Hafer. Federal Reserve Bank of St. Louis. Lexington, Mass.: Lexington Book.
Muller, Patrice, and Robert Price. 1984. Structural budget deficits and fiscal stance. OECD Working Paper no. 15.
Murphy, Robert. 1984. Capital mobility and the relationship between saving and in- vestment in OECD countries. Journal of International Money and Finance 3:327- 342.
Obstfeld, Maurice. 1986. Capital mobility in the world economy: Theory and mea- surement. Carnegie-Rochester Conference Series on Public Policy. Amsterdam: North-Holland.
Penati, Alessandro, and Michael Dooley. 1984. Current account imbalances and capi- tal formation in industrial countries, 1949-198 1. International Monetary Fund Sta$ Papers 31:l-24.
Roubini, Nouriel, and Jeffrey Sachs. 1989. Government spending and budget deficits in industrial economies. NBER Working Paper no. 2919.
Sachs, Jeffrey. 1983. Aspects of the current account behavior of OECD economies. In Recent Issues in the Theory of Flexible Exchange Rates: Fifth Paris-Dauphine Con- ference on Money and International Money Problems, ed. E. Claassen and P. Salin. Amsterdam: Elsevier.
Summers, Lawrence. 1988. Tax policy and international competitiveness. In Interna- tional Aspects of Fiscal Policies, ed. Jacob Frenkel. Chicago: University of Chicago Press.
Comment Rudiger Dornbusch
Feldstein's discovery of the tight link between national saving and investment rates continues to baffle the profession. Ample research over the past few years has failed to reject the basic finding: if a country raises the national saving rate by a percentage point, most of the increase in saving is retained in the form of increased investment.' The Feldstein finding runs counter to the spirit of the open economy literature in which, under conditions of perfect capital mobility, changes in national saving rates are primarily reflected in the current account, not in investment.*
Figure 7C. 1 shows the basic evidence: using averages for the 1960-86 pe- riod, saving and investment rates for 23 OECD countries obey a very high positive correlation.
Rudiger Dornbusch is the Ford International Professor of Economics at the Massachusetts In-
1. For a review see esp. Dooley et al. (1987). 2. An earlier theory, popular in the United Kingdom, argued that budget deficits and external
deficits were highly correlated because of a tendency for private investment to match saving. See Godley and Cripps (1983).
stitute of Technology and a research associate of the National Bureau of Economic Research.
221 National Saving and International Investment
0.31 -
0.3 - 0.29 - 0.28 - 0.27 - 0.26 - 0.25 - 0.24 -
0.32 0
0.21 - 0.2 - 0.19 - 0.18
0
"p I I I I I I ( I I 1 I , ,
0
0
0 0
0
0 0 0
O m
Constant S R* ~~~ ~~~
Gross fixed investment 5.89 .75 .74
Construction: 2.51 .49 .53
Residential I .99 .I5 .24
Nonresidential .53 .34 .38
Machinery and equipment 3.31 .26 .23
(2.67) (8.05)
(1.09) (5.07)
(1.54) (2.85)
(3) (3.82)
(1.53) (2.78)
Note: Saving and investment are measured as a fraction of GDP. Each observation is the 1960- 86 period average for a country.
The corresponding regression, using OLS on the cross-section period aver- ages is shown in table 7C. 1 below. This evidence suggests that economies are three-quarters closed of an extra percentage point saving only one quarter will be reflected in an improvement of the external balance while three quar- ters find their way into increased investment. Table 7C. 1 also shows the break- down of investment by component.
Table 7C. 1 shows that the systematic effect of investment on saving extends to the components of investment; for each category of investment the coeffi- cient is statistically significant. Half of an extra percentage point saving goes into construction and a quarter into machinery and equipment.
222 Martin Feldstein and Philippe Bacchetta ~~
Faced with the evidence, the question is what implications to draw. For Feldstein one interesting question is an application to taxation: “Do tax poli- cies that stimulate a nation’s private saving rate increase its domestic capital stock or do the extra savings flow abroad? Does an increase in the corporate tax rate cause an outflow of capital that shifts the burden of the tax increase to labor, and land?” The three-quarters result shown above is used by Feldstein to suggest that policies that promote saving will raise domestic investment, not foreign lending. To judge whether the inference is warranted at the margin we have to ask what gives rise to the high saving-investment correlation.
What Are the Channels?
Much of the literature spawned by the Feldstein result takes issue with the initial finding. By now that discussion has run out of steam; the fact is sturdy and the debate is turning to the interpretation. The Feldstein finding raises the question of why there should be such a strong link in open economies between saving and investment. Four possible explanations suggest themselves:
Constraints on external balances, especially for deficit countries, limit the extent to which investment can get out of line with saving. These con- straints may take the form of limitations on external financing or of a gov- ernment reaction function, as proposed by Summers (1988). In this analysis governments raise public-sector saving in response to incipient external def- icits and thus contain the size of net foreign lending. There is imperfect capital mobility within economies so that many, if not most, firms have to rely on internal financing of investment. As a result investment cannot deviate substantially from saving. While there is capital mobility in respect to public-sector debt and finance of large corporations, the brunt of firms are constrained in that they do not have access to world markets. Murphy’s (1984) evidence on the high saving retention by major corporations suggests that this effect may be operative. Internationally there is imperfect capital mobility because of investors’ risk aversion. Regulatory treatment of financial institutions reinforces the cross- border reluctance of capital flows. The correlation reflects an economic structure that induces simultaneously both high saving and high investment. This contrasts with the Feldstein interpretation that structural factors (demographics, social security arrange- ments, taxation, etc.) determine saving and lead to a crowding in, by chan- nels that remain unidentified, of investment.
Among the competing explanations Feldstein emphasizes imperfect capital mobility: the cross-border obstacles are sufficiently large, especially for longer maturities, that investment is crowded in domestically whenever saving rises. The mechanism for crowding in is not clear, however. If domestic capi- tal markets are open and competitive we should expect systematic relation- ships between the cost of capital across countries. Other things equal, high
223 National Saving and International Investment
saving countries should have a low cost of capital and low saving countries a high cost of capital. The cross-border reluctance of capital would allow these cost of capital differentials to persist. I am not aware of a direct test of the imperfect capital mobility hypothesis in this form.
It might be argued, of course, that crowding in takes place not only via the cost of capital but also and perhaps primarily via relaxation of credit ration- ing. In this view the explicit cost of capital, for moral hazard reasons, does little of the work and less obviously observable variations in credit constraints provide the mechanism. The ready availability of credit thus induces invest- ment to fall in line with saving.
If imperfect international capital mobility is in fact the basis for the ob- served correlations we would expect increasingly organizations to develop means of overcoming the risks that stand in the way of capital flows. It may be risky to borrow for 30 years in dollars in the United States in order to make yen loans in Japan. But multinational corporations who operate in multiple markets are natural agents for diversifying away the risks and thus exploit cost-of-capital differences. Direct foreign investment, which is becoming very sizable, may then be a reflection of the cost of capital differentials arising from cross-border reluctance of portfolio capital flows.
Feldstein is certainly right in emphasizing the international immobility, un- til very recently, of most saving done via financial institutions such as pension funds or life insurance companies. Once again, their increasing perception of a world capital market should work in the direction of reducing the local crowding in tendency observed in the past.
Beyond the perfect capital mobility argument it is certainly the case that there is some correlation between saving and investment as a result of com- mon determinants, For example, if the age structure of the population is such as to favor a high saving rate the same age structure induces an expansion of investment in nontraded goods industries and construction to supply the large “internal market.” Conversely, if the transition to an aging population reduces the national saving rate it is likely that investment in such an economy will also decline, not only because of a reduced availability of domestic financing but also because the opportunities for profitable domestic investment decline with a shrinking of the market. Indeed, the falloff in domestic investment may even precede the decline in the savings rate.
Table 7C.2 shows the projections of aging trends in industrialized coun- tries. The steep increase in Japanese age would suggest, on the above argu- ment, an increasing tendency for Japanese foreign lending in the coming dec- ades.
The view that investment is determined by the available supply of saving is suggestive for high saving countries. In high saving countries an inordinately large share of saving (by comparison with a world of unrestricted capital flows, full information and little risk aversion) is retained nationally. But how does this thinking apply to deficit countries? What is the process by which
224 Martin Feldstein and Philippe Bacchetta
19
18 -
17 -
16 -
15 1
Table 7C.2 Changing Age Structure in OECD Countries (percentage of population age 65 and over)
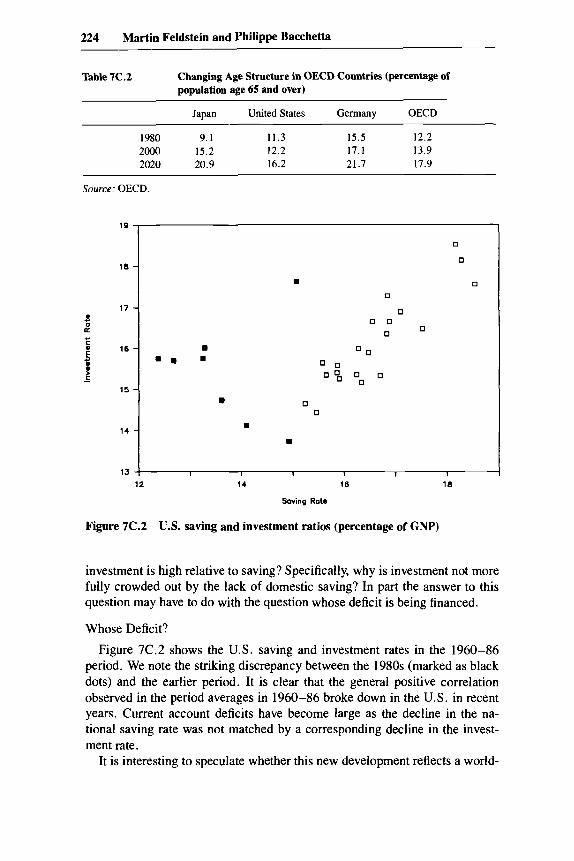
Figure 7C.2 U.S. saving and investment ratios (percentage of GNP)
investment is high relative to saving? Specifically, why is investment not more fully crowded out by the lack of domestic saving? In part the answer to this question may have to do with the question whose deficit is being financed.
Whose Deficit?
Figure 7C.2 shows the U.S. saving and investment rates in the 1960-86 period. We note the striking discrepancy between the 1980s (marked as black dots) and the earlier period. It is clear that the general positive correlation observed in the period averages in 1960-86 broke down in the U.S. in recent years. Current account deficits have become large as the decline in the na- tional saving rate was not matched by a corresponding decline in the invest- ment rate.
It is interesting to speculate whether this new development reflects a world-
225 National Saving and International Investment
wide breaking down of reluctance to cross-border lending or whether it is peculiar to the U.S. case. The latter could be argued if foreign investors care which country they finance. It may make a difference whether the decline in saving occurs in a large country with a developed financial market or in a small country with little scope for uncomplicated cross-border investment. Moreover, it may make an important difference whether the decline in saving arises in the private sector or in the public sector. With a developed market in government debt there may be scope for easy cross-border financing while a decline in private saving may require more complicated intermediation.
To support the argument that government deficits are more “financeable” and hence have more significant foreign lending effects we can look at less- developed countries LDCs. Would Brazil, Mexico or Korea have been able to run very large persistent external deficits if the private sector had been the borrower rather than the government through state enterprises? No doubt, the private sector can borrow some, but it is doubtful that lending would have reached the proportions it did in the 1970s in that case.
Two Disagreements
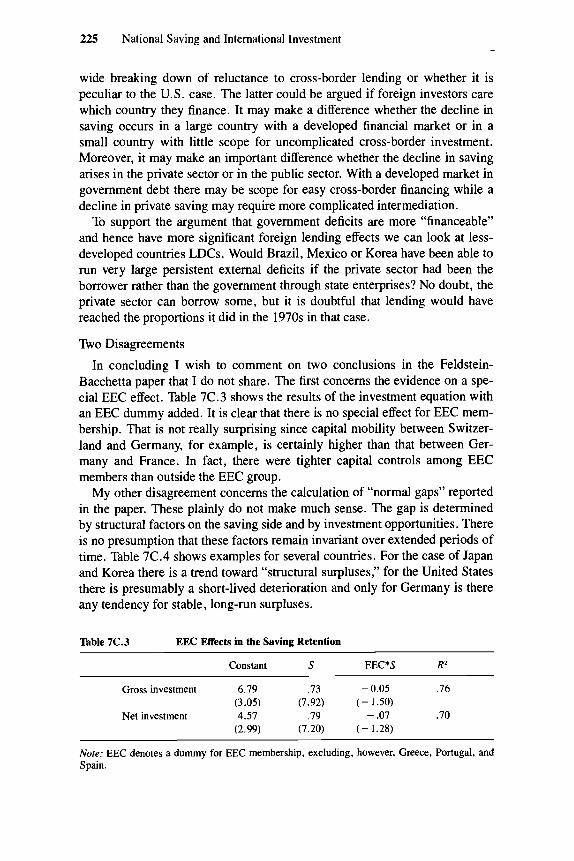
In concluding I wish to comment on two conclusions in the Feldstein- Bacchetta paper that I do not share. The first concerns the evidence on a spe- cial EEC effect. Table 7C.3 shows the results of the investment equation with an EEC dummy added. It is clear that there is no special effect for EEC mem- bership. That is not really surprising since capital mobility between Switzer- land and Germany, for example, is certainly higher than that between Ger- many and France. In fact, there were tighter capital controls among EEC members than outside the EEC group.
My other disagreement concerns the calculation of “normal gaps” reported in the paper. These plainly do not make much sense. The gap is determined by structural factors on the saving side and by investment opportunities. There is no presumption that these factors remain invariant over extended periods of time. Table 7C.4 shows examples for several countries. For the case of Japan and Korea there is a trend toward “structural surpluses,” for the United States there is presumably a short-lived deterioration and only for Germany is there any tendency for stable, long-run surpluses.
Note: EEC denotes a dummy for EEC membership, excluding, however, Greece, Portugal, and Spain.
226 Martin Feldstein and Philippe Bacchetta
Table 7C.4 Net Exports (percentage of GDP, national income account basis)
1960-69 1970-79 1980-86
Japan .2 .8 2.3 Germany 2.1 2.6 2.5 United States .2 - .5 - 1.8 Korea - 10.1 - 5.9 - 1.6
Source: IMF.
Concluding Remarks
The Feldstein thesis of unusually high savings retention is now well- established as a fact; perhaps just as it is established it is also going away as a result of sharply increased international financial intermediation. The reason for the finding remains undiscovered and presumably there need not be a single one. Unless we understand why savings retention is so high, or in what particular situations, we certainly should not use the observed relations to make strong inferences about the investment response to saving policies. The U.S. example in the 1980s offers a strong reminder that much of the change in saving can easily find its way into changed foreign lending rather than changes in investment.
References
Dooley, M., J . Frankel, and D. Mathieson. 1987. International Capital Mobility: What Do Saving-Investment Correlations Tell Us? International Monetary Fund Stu$ Pa- pers 34, no. 3 (September): 503-30.
Godley, W., and F. Cripps. 1983. Macroeconomics. London: Fontana. Murphy, R. 1984. Capital Mobility and the Relationship between Saving and Invest-
ment in OECD Countries. Journal of International Money and Finance 3 (Decem- ber): 327-42.
Summers, L. 1988. Tax Policy and International Competitiveness. In International Aspects of Fiscal Policy, ed. J. Frenkel. Chicago: University of Chicago Press.