17
National Student Design Competition 2013 AMERICAN INSTITUTE OF CHEMICAL ENGINEERS 3 Park Avenue, New York, New York 10016-5991

National Student Design Competition 2013
AMERICAN INSTITUTE OF CHEMICAL ENGINEERS
3 Park Avenue, New York, New York 10016-5991

© Copyright 2012
AMERICAN INSTITUTE OF CHEMICAL ENGINEERS
3 Park Avenue, New York, New York 10016-5991
If there are any questions about the design problem, Student Chapter Advisors and Design
Assignments Instructors are directed to contact:
Dr. W. Roy Penney
Ralph E. Martin Department of Chemical Engineering University of Arkansas Fayetteville, AR 72701
Telephone numbers: Office: 479-575-5681; Cell: 479-530-8989
Fax number: 501-575-7926
E-mail: [email protected]
This problem was prepared by a team of professors from the Ralph E. Martin Department of
Chemical Engineering at the University of Arkansas, Fayetteville, AR; in addition to Professor
W. Roy Penney the professors are
Michael D. Ackerson, Professor
Jamie A. Hestekin, Professor
Please read the rules before, during and after preparing and submitting the solution to
AIChE.
NOTICE: THE PAGE LIMIT FOR THE REPORT IS 125 NUMBERED PAGES!

3
AIChE National Student Design Competition 2013
Comparison of Bio-mass to Bio-oils Reactor Systems: Direct
Conversion vs. Companion Coal Gasification
DEADLINE FOR ELECTRONIC SUBMISSION TO AIChE IS MIDNIGHT, June 3, 2013.
Send a WORD file and a PDF file of each entry to Michelle S. Marsnick [email protected]
* DO NOT mail any paper copies.
RULES OF THE CONTEST
Any significant deviation from the mandated Table of Contents and Individual Section Contents,
included at the end of this Problem Statement, will result in report rejection, resulting in a Rejection Letter
(citing unacceptable documentation) sent to the competitor’s institution.
Solutions will be evaluated using primarily the following grading criteria.
• Suitability of process equipment.
• Correctness of results and accuracy of computations.
• Soundness of conclusions.
• Sound economic analysis, leading to an economic optimum.
• Ingenuity and logic.
• Appropriate presentation, grammatically correct but succinct and to the point.
The statement of the problem contains all the pertinent information except for that available in
handbooks and other literature references. The Web (WWW) will be a valuable resource. The use of
textbooks, handbooks, journal articles, and lecture notes is permitted. Students may use any
available commercial or library computer programs in preparing their solutions. If students use
commercial or library computer programs or other solution aids, they should so state in their reports
and include proper references and documentation.
The 2013 National Student Design Competition is designed to be solved either by an individual
chemical engineering student working entirely alone, or a team of no more than three students.
Solutions will be judged in two categories: individual and team. At the sole discretion of the Judges,
up to 3 winning solutions (i.e., 1st, 2
nd and 3
rd places) will be determined for individual entries and
for team entries.
There are other approaches to using the problem, and it is expected that some Advisors will use
the problem as classroom material and students will not follow contest rules. The following
confidentiality rules therefore apply:
Students submitting solutions:
The problem may not be discussed with anyone (student, faculty, or others, in or out of class)
before or during the period allowed for solutions. Discussion with faculty and students is permitted
only after complete final reports have been submitted to the Chapter Advisor.
Students not submitting solutions:
Discussion with faculty and with other students who are not participating in the contest is
permitted. However, if any individual or team, at the competing college or university, is solving
4
the problem under competition rules, rigorous and foolproof procedures must be established to
prevent any communication between those competing under contest rules and those students using
the problem otherwise.
All students:
The problem may not be discussed with students or faculty from other colleges or universities, or
with individuals in the same institution who are still working on the problem under contest rules,
until after June 3, 2013. This is particularly important in cases where neighboring institutions may be
using different schedules.
RULES FOR SUBMITTING SOLUTIONS
ELIGIBILITY
• ONLY AIChE NATIONAL ENROLLED. UNDERGRADUATE STUDENT MEMBERS MAY
SUBMIT A SOLUTION. Non-member entries will not be considered.
• Entries may be submitted either by individuals or by teams of no more than three students. Each team
member must meet all eligibility requirements.
• Each Faculty Advisor should select the best solution or solutions, not to exceed two from each category
(individual and team), from his or her chapter, for electronic (WORD & PDF) submission to AIChE.
TIMELINE FOR COMPLETING THE SOLUTION
• Students are allowed no more than thirty six (36) days (and 5 weekends) to complete the problem. This
period may be selected at the discretion of the individual advisor, but in order to be eligible for an award
a solution must be submitted electronically to AIChE no later than midnight, June 3, 2013.
• THE FINISHED REPORT MUST BE SUBMITIED TO THE FACULTY ADVISOR WITHIN THE 36-
DAY PERIOD.
REPORT FORMAT
• THE REPORT MUST NOT EXCEED 125, NUMBERED PAGES. ANY REPORT EXCEEDING 125
PAGES AND/OR WITHOUT ALL PAGES NUMBERED IN THE LOWER RIGHTHAND CORNER
WILL BE RETURNED TO THE FACULTY ADVISOR.
• The Supporting calculations and other appendix material may be in pencil or pen; however, they must be
scanned (JPEGs, 96 ppi should suffice) using the lowest resolution which is clearly legible in the report.
• The report should not contain any reference to the student's names or institution identification. Any
report insert which names or otherwise identifies the institution must be avoided.
SENDING THE SOLUTION TO AIChE
• The report(s) must be submitted as (1) a WORD file and (2) a PDF file to Michelle S. Marsnick
([email protected]), by the Faculty Advisor, no later than June 3, 2013.
• Each entry must be accompanied by the enclosed ENTRY FORM giving each contestant's name, AIChE
membership number, college or university, Faculty Advisor name, address, home address, home
telephone number, and student chapter, electronically attached to the report. This form is used by AIChE
for identification. This form must be e-mailed to Michelle S. Marsnick ([email protected]) at AIChE.
• The DEADLINE: Entries must be sent in electronic form before 12:00 midnight June 3, 2012 .
5
2013 AIChE National Student Design Competition:
Comparison of Bio-mass to Bio-oils Reactor Systems: Direct
Conversion vs. Companion Coal Gasification
CONTEST PROBLEM STATEMENT
DATE: November 1, 2012
TO: P. E. Fair, B. E. Peters, S. E. Walas
FROM: P. D. Superior
SUBJECT: Project Assignment – Evaluation of Bio-oils Reactor Systems
Good news: the bio-oils reactor(s) project has just been funded. Paul, Brian and Selena you have been
selected to be the team which executes the project. We must move fast; consequently, you will be given
the background information in this document to allow you to start immediately and rapidly complete the
project definition.
INTRODUCTION
“The United States consumed 18.8 million barrels per day (MMbd) of petroleum products during
2011” (http://www.eia.gov/energy_in_brief/foreign_oil_dependence.cfm); however, the US produces 10.3
MMbd; thus, we import 45% of our petroleum products. All of our US presidents back to Richard Nixon
and other energy experts realized that our dependence on foreign oil places our nation at risk
(http://www.youtube.com/watch?v=kbW7brZ2nds). The DOE has funded a study which states (1 &
http://www.eesi.org/doe-releases-report-us-biomass-supply-potential-11-aug-2011), “….found that the
United States could produce more than a billion bone-dry tons of biomass from agriculture and forestry –
enough to displace 30 percent of U.S. petroleum use.” Our government realizes that coal and biomass
must be used to decrease our dependence on foreign oil. Higman et al. (8) have reviewed all gasification
technology; Bartis et al. (3) has reviewed the technology for converting coal to liquid fuels; Tarka (15) has
reviewed the technology for converting coal/bio-mass to liquid fuels and Ringer et al. (14) have reviewed
the technology for converting cellulosic bio-mass to bio-oils. DOE is proposing to fund projects
(http://www.grants.gov/search/search.do?mode=VIEW&oppId=168173) titled, “Small Scale Coal-
Biomass to Liquids (CBTL) Production and Feasibility Study of a Commercial Scale CBTL Facility”,
FON: DE-FOA-0000703.
The preferred technology (which is closer to commercialization or is actually commercialized) for
converting coal and bio-mass to liquid fuels is pyrolysis followed by purification of intermediates with
subsequent reactions to produce the desired liquid fuels.
There are several Universities and National Laboratories throughout the world that research the
conversion of biomass to commercial products. Information about most of them can be found on the
Pyrolysis Network (http://www.pyne.co.uk/, see in particular “Country reports updates/Reviews of state-
of-the-art”). With this background information the foundation for this 2013 AIChE Contest Problem can
be firmly established.
PROCESS TECHNOLOGY
Coal Pyrolysis to Liquid Fuels
A simplified schematic of the Fischer-Tropsch (FT) Coal to Liquid (CTL) process is shown in Fig. 1.
Bartis (3) states, “The process begins with the gasification of coal, which consists of reacting coal with

6
steam and oxygen at elevated temperatures (1,000 to 1,500 degrees Celsius) and moderate pressures
(~500 pounds per square inch [psi]) to produce a mixture of hydrogen, carbon monoxide, and carbon
dioxide. A gas consisting mainly of the first two of these constituents is called synthesis gas. But as it
leaves the gasifier, the gas is dirty: It contains carbon dioxide and various gaseous molecules that derive
from the impurities found in coal. These impurities would harm the performance of subsequent processing
steps and are therefore removed in sections of the FT CTL plant that are designed to clean and properly
prepare the synthesis gas. Sulfur compounds are reduced to near-zero concentrations. In general, the
captured sulfur would be converted to pure solid sulfur or sulfuric acid, both of which are articles of
commerce as opposed to wastes. It is also during gas cleaning that extensive removal of trace mercury
compounds would occur. A consequence of gas cleaning and preparation is a highly concentrated stream
of carbon dioxide. In the absence of a greenhouse-gas management requirement, this carbon dioxide
would be released into the atmosphere. The next step is to send the cleaned synthesis gas to FT reactors,
where it is catalytically converted to a mixture of hydrocarbons. This mixture generally includes
hydrocarbon gases, such as methane and propane; and hydrocarbons that are typically found in gasoline,
diesel, and jet fuel; and heavier compounds that are categorized as waxes. These various streams are
separated, primarily according to their boiling points, and can be further treated to produce two product
streams: naphtha and middle distillates. At the FT CTL plant, the middle-distillate product can be retail-
ready diesel fuel or a combination of diesel fuel and jet fuel. The naphtha product is basically a very
low–octane (i.e., about 40 octane) gasoline that must be extensively upgraded before it can be used as an
automotive fuel.”
Figure 1. Simplified Schematic of the Fischer-Tropsch (FT) Coal to Liquids (CTL) process (From 3, p. 16)
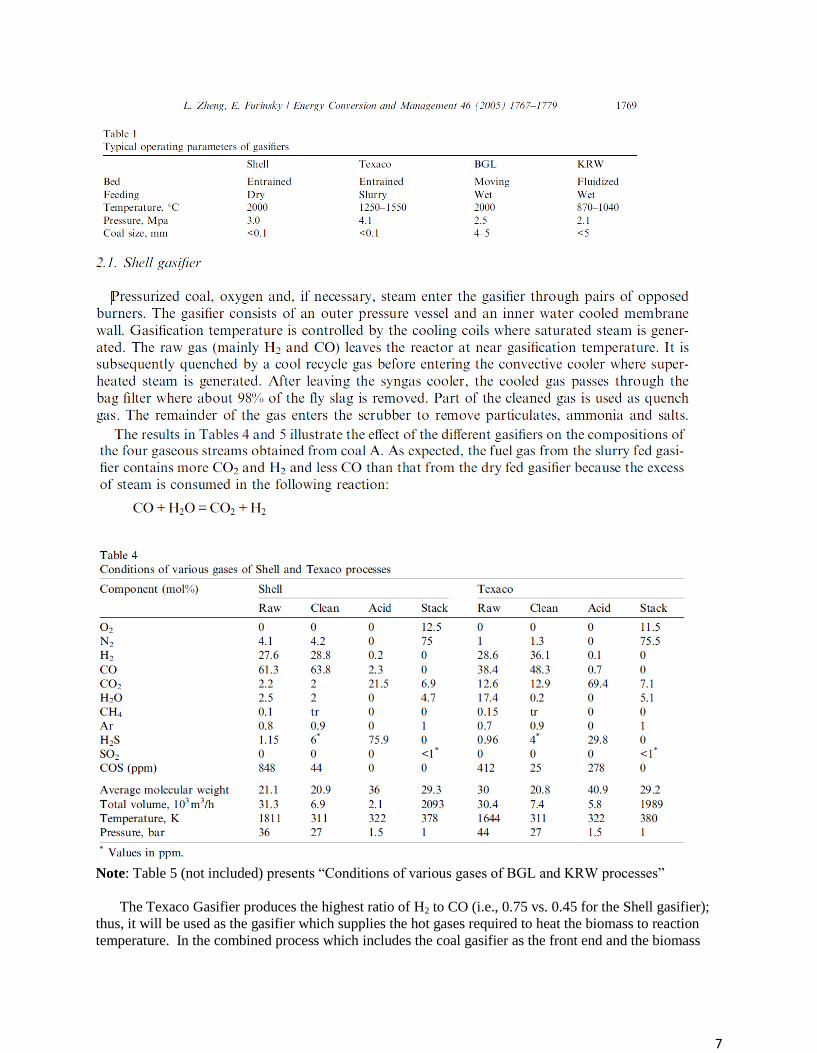
Zheng and Furinsky (17) have done ASPEN simulations of four coal gasifiers and they have the
following to say about the operation of the Shell gasifier and the performance of the Shell and Texaco
gasifiers. They have also studied the British Gas Lurgi (BGL) and the Kellog-Rust-Westinghouse (KRW)
gasifiers.
7
Note: Table 5 (not included) presents “Conditions of various gases of BGL and KRW processes”
The Texaco Gasifier produces the highest ratio of H2 to CO (i.e., 0.75 vs. 0.45 for the Shell gasifier);
thus, it will be used as the gasifier which supplies the hot gases required to heat the biomass to reaction
temperature. In the combined process which includes the coal gasifier as the front end and the biomass
8
reactor as the backend, additional H2 will be required to achieve the approximate 2:1 ratio of H2:CO for
the Fischer-Tropsch reaction. This H2 in the US would logically be supplied by reforming methane from
natural gas.
BIO-MASS PYROLYSIS
Ringer et al. (14) explain the fundamentals of bio-mass pyrolysis, “Three primary products are
obtained from pyrolysis of biomass. They are char, permanent gases, and vapors; that at ambient
temperature condense to a dark brown viscous liquid. While pyrolysis of biomass has been practiced in
some form for thousands of years, it wasn’t until recently that the relationship between heat transfer rates
into the biomass and product distribution yields were well understood. The practice of charcoal
manufacture from biomass is generally referred to as a slow pyrolysis process based on the rate in which
heat is imparted to the biomass. The distribution of products between liquid, char, and gas on a weight
basis for this “slow” pyrolysis is approximately 30%, 35%, and 35% respectively, whereas under “fast
pyrolysis” conditions the product distribution is dramatically altered and shifts the distribution primarily
to a liquid bio-oil product. Under these conditions bio-oil yields of liquid, char, and gas are 75%, 12%,
and 13% respectively [4]. It is generally recognized that two primary processing steps are required to
meet the conditions for fast pyrolysis. They are:
• Very high heat flux to the biomass with a corresponding high heating rate of the biomass particle.
• The heat transfer to the biomass must occur in a very short time period with immediate quenching
following product formation.
The rate of the heat transfer to the particle needs to be between 600-1000 W/cm2
[12]. Some
unpublished work done at SERI (now NREL) in the early 1980s indicated that the heat of pyrolysis (energy
required to thermally break the macro polymer bonds) was relatively low, on the order of 230 KJ/kg. The
reproducibility of the data was not very good so the accuracy of this number is questionable. Other
published data report numbers as high as 1000 KJ/kg.... For comparison, the amount of energy needed to
reform methane to hydrogen is about 750 MJ/kg. Even at the higher value these numbers imply that once
the reaction vessels are brought up to temperature the amount of energy required to actually break apart
the biomass is not significant. The energy needed to carry out this transformation is readily available in
the coproducts of pyrolysis gas and/or char.”
Bridgwater and Peacocke (5) have well covered the experimental and commercial fast pyrolysis
facilities and they discuss the process, the processing conditions and the products; they mention 37
facilities which have operated to study and commercialize fast pyrolysis of biomass. These processes will
not be discussed in detail here as Bridgewater and Peacocke have given adequate coverage.
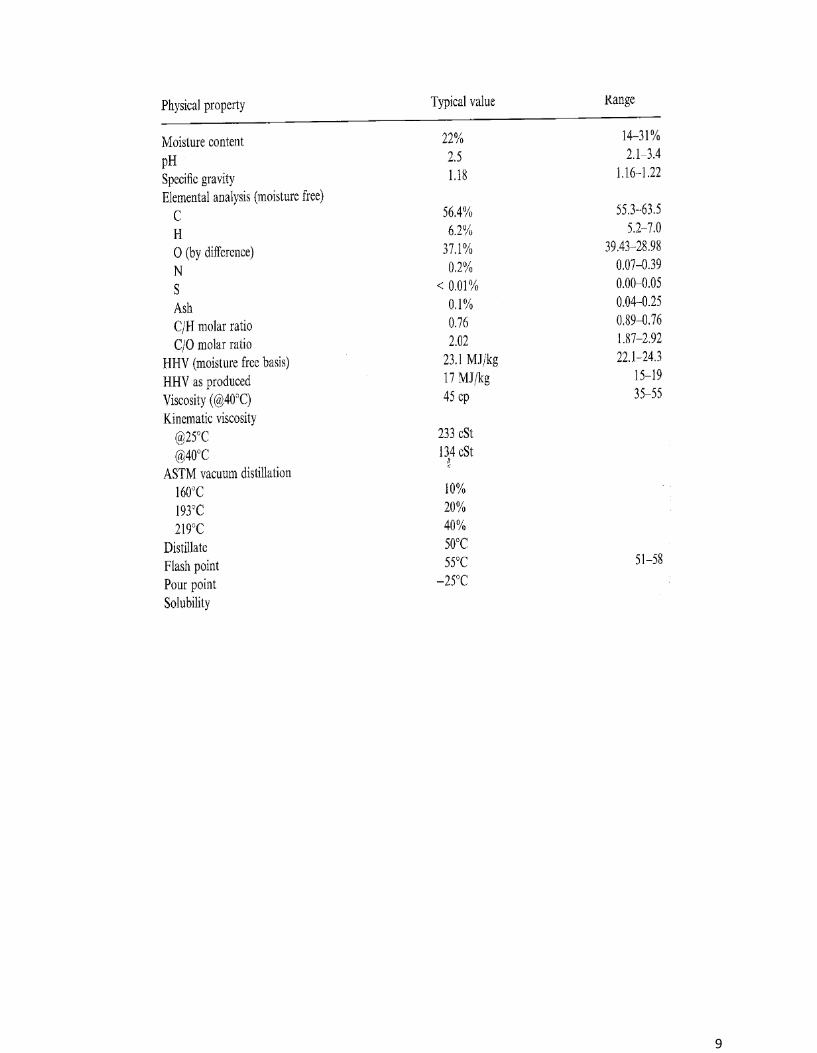
Figure 2 presents a process flow schematic of the Ensyn Rapid Thermal Processing unit; this
illustration was taken from (5, p. 31). The Ensyn WEB site (http://www.ensyn.com) presents more
information about the Ensyn technology and about Fast Pyrolysis of Biomass in general. The Ensyn
technology was selected to highlight here because it is either near or at commercial economical operation.
Bridgwater and Peacocke (4) mention 8 operational units operated by Ensyn and they describe the Ensyn
process, “The heart of the system is a transported bed reactor which contacts hot recirculated sand with
biomass in an upflow reactor. In all systems, biomass is comminuted to – 6 mm and dried to not more
than 10% moisture before feeding to the reactor. The products are passed through two cyclones to
separate solids, then the vapour is rapidly quenched and cooled in a multiple stage system. The total
residence time of the hot vapours can be controlled down to a few hundred milliseconds which ‘freezes’
the thermally unstable liquid intermediates of pyrolysis. These very low residence times are used for
chemical production, while longer residence times are used for liquid fuels in order to completely crack
the lignin. ….From woody biomass feeds, the overall liquid yield is up to 83% by weight on a dry basis
and has typical characteristics as listed in Table 17….”. Note: Table 17 (5, p. 32) is presented below
exactly at it appears in the original reference.
9

10
Figure 2. Ensyn RTP II Process Flow Sheet of the ENEL Bastardo Plant (Figure 11 from ref. 4)
11
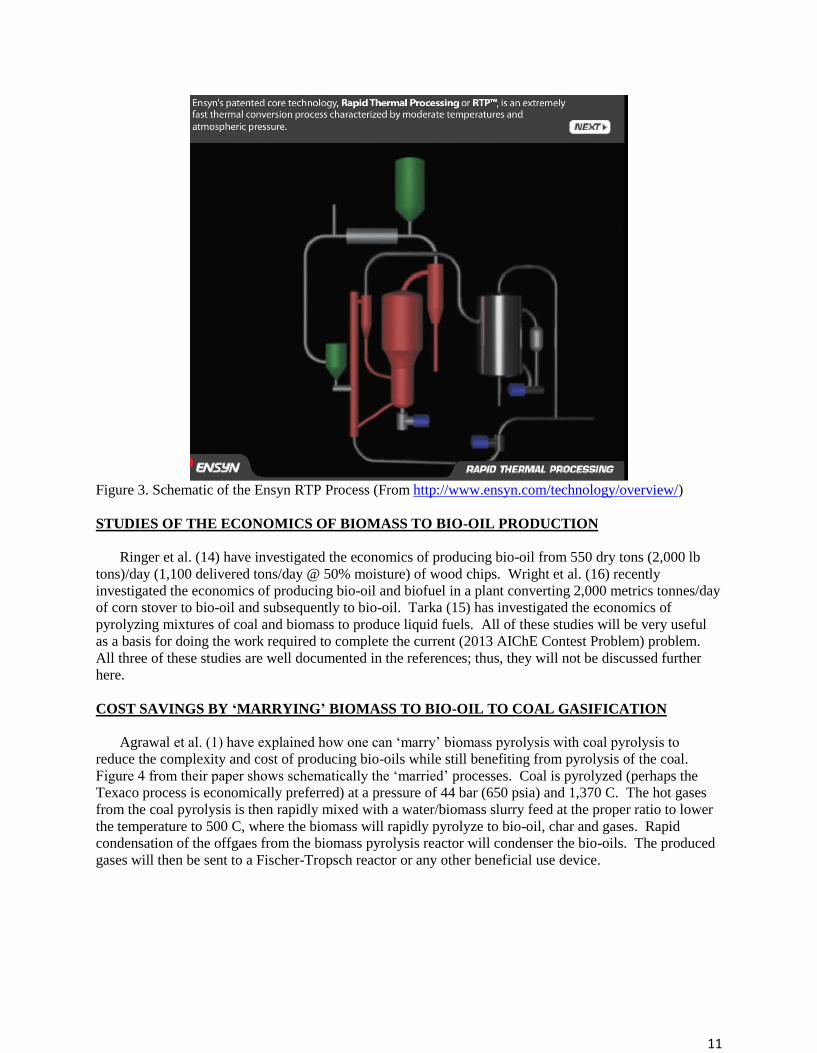
Figure 3. Schematic of the Ensyn RTP Process (From http://www.ensyn.com/technology/overview/)
STUDIES OF THE ECONOMICS OF BIOMASS TO BIO-OIL PRODUCTION
Ringer et al. (14) have investigated the economics of producing bio-oil from 550 dry tons (2,000 lb
tons)/day (1,100 delivered tons/day @ 50% moisture) of wood chips. Wright et al. (16) recently
investigated the economics of producing bio-oil and biofuel in a plant converting 2,000 metrics tonnes/day
of corn stover to bio-oil and subsequently to bio-oil. Tarka (15) has investigated the economics of
pyrolyzing mixtures of coal and biomass to produce liquid fuels. All of these studies will be very useful
as a basis for doing the work required to complete the current (2013 AIChE Contest Problem) problem.
All three of these studies are well documented in the references; thus, they will not be discussed further
here.
COST SAVINGS BY ‘MARRYING’ BIOMASS TO BIO-OIL TO COAL GASIFICATION
Agrawal et al. (1) have explained how one can ‘marry’ biomass pyrolysis with coal pyrolysis to
reduce the complexity and cost of producing bio-oils while still benefiting from pyrolysis of the coal.
Figure 4 from their paper shows schematically the ‘married’ processes. Coal is pyrolyzed (perhaps the
Texaco process is economically preferred) at a pressure of 44 bar (650 psia) and 1,370 C. The hot gases
from the coal pyrolysis is then rapidly mixed with a water/biomass slurry feed at the proper ratio to lower
the temperature to 500 C, where the biomass will rapidly pyrolyze to bio-oil, char and gases. Rapid
condensation of the offgaes from the biomass pyrolysis reactor will condenser the bio-oils. The produced
gases will then be sent to a Fischer-Tropsch reactor or any other beneficial use device.

12
REQUIRED RESULTS FROM THE CURRENT WORK
The economic advantage for using the Coal/Biomass sequential reaction scheme must be determined.
The most pertinent considerations for doing this study are
1. The biomass need not be dried; it can be fed as a biomass/water (perhaps 50:50) slurry.
2. The biomass need not have an intermediate heat carrier; thus, e.g., a circulating or bubbling sand
bed or a hot circulating gas stream are not required.
There could be disadvantages for the ‘married’ process
1. The slag from the coal gasifier may be difficult to separate from the char from the biomass reactor.
2. More water will be in solution with the bio-oils, although there is a limit to the solubility of water
in bio-oils.
3. The excess water presents a disposal or recycle problem.
Bottomline, what is needed is the cost savings ($/lb bio-oil) for using the ‘married’ process rather than
using the direct conversion process for converting biomass to bio-oils.
ECONOMIC PREMISES
For this study a discounted cash flow analysis is probably not required. However, one needs a method
for determining the capital equivalent of a yearly cash flow or the yearly equivalent of a capital
investment. Use a 5 year payout for converting capital investment to equivalent yearly cash flows; i.e., a
$1,000,000 capital investment is the equivalent of $200,000 in yearly expense.
It is, perhaps, reasonable to assume that - for a worst case scenario - the liquid products resulting from
the coal gasification and conversion to biofuels will achieve a minimum IRR (perhaps 10 to 15%) required
to support the capital investment in the coal conversion portion of the combined (i.e., “married”) process.
REFERENCES
1…..Ackerson, M. D., “Novel Methods for Converting Coal and Biomass to Liquid Fuel”, Submitted
Under Funding Opportunity Announcement DE-FOA-00000703, Process Dynamics, Inc.,
Fayetteville, AR (June 7, 2012). Note: Available at
http://www.aiche.org/sites/default/files/docs/award/Final%20Narrative-2013NSDC.pdf
13
2….Agrawal, R. and N.R. Singh, “Synergistic Routes to Liquid Fuel for a Petroleum-Deprived
Future,” AIChE Journal, v. 55, Issue 7, 1898-1905 (2009).
(http://onlinelibrary.wiley.com/doi/10.1002/aic.11785/pdf).
3….Bartis, J. T., et al., “Producing Liquid Fuels from Coal”, The Rand Corporation under Air Force
contract FA7014-06-C-001 (2008).
(http://www.rand.org/pubs/monographs/2008/RAND_MG754.pdf).
4….Bridgewater, A.V., D. Meier, D. Radlein, “An Overview of Fast Pyrolysis of Biomass”, Organic
Geochemistry, v. 30, p. 1479-1493 (1999).
(http://www.sciencedirect.com/science/article/pii/S0146638099001205) and
http://ac.els-cdn.com/S0146638099001205/1-s2.0-S0146638099001205-main.pdf?
_tid=b4a0370b85f98a5ff41a3cd71bf3d245&acdnat=1343228995_96e65bbb3cee3d4fe252c
ba954882aa1, PDF Version).
5....Bridgwater, T.V., Peacocke, G.V.C., “Fast Pyrolysis for Biomass”, Renewable & Sustainable Energy
Reviews, v. 4, Issue 1, p. 1-73 (March 2000).
6….Bridgwater, T.V., “Biomass Pyrolysis”, IEA Bioenergy: T34:2007:01, International Energy Agency
Bioenergy, Rotorua, New Zealand (2007).
(http://www.ieabioenergy.com/MediaItem.aspx?id=5416).
7....Elliott, D.C., et al., “Developments in Direct Thermochemical Liquefication of Biomass: 1983-1990”,
Energy & Fuels, v. 5, 399-410 (1991).
(http://pubs.acs.org/doi/pdf/10.1021/ef00027a008).
8....Higman, C., van der Burgt, M., “Gasification”, 2nd
Ed., Gulf Professional Publishing an imprint of
Elsevier, Boston MA (2008).
(http://www.knovel.com/web/portal/browse/display?_EXT_KNOVEL_DISPLAY_bookid=2322).
9.....Jones, S.B et al., “Production of Gasoline and Diesel from Biomass via Fast Pyrolysis, Hydrotreating
and Hydrocracking: A Design Case”, Pacific Northwest National Laboratory, PNNL-18284 under
contract DE-AC05-76RL01830 (February 2009).
(http://www.pnl.gov/main/publications/external/technical_reports/pnnl-18284.pdf)
10...Oak Ridge National Laboratory, “U.S. Billon-Ton Update: Biomass Supply for a Bioenergy and
Bioproducts Industry”, under contract DE-AC05-00OR22725 (2011).
(http://www1.eere.energy.gov/biomass/pdfs/billion_ton_update.pdf).
11...Piskorz, P, P. Majerski, D. Radlein, “Energy Efficient Liquefaction of Biomaterials by Thermolysis”,
US Patent 5,728,271 (March 17, 1998).
(http://www.google.com/patents?id=wUAaAAAAEBAJ&printsec=abstract&zoom=4#v=onepage&q
&f=false).
12.. Reed, T. B. et al., “Perspectives in Heat Transfer Requirements and Mechanism for Fast Pyrolysis”,
Specialists’ Workshop on Fast Pyrolysis of Biomass Proceedings, Copper Mountain, CO, SERI/CP-
622-1096, p. 7-20 (October 19-22, 1980).
(http://permanent.access.gpo.gov/lps121208/1096.pdf)
13..Reed, T. B. et al., “Heat Flux Requirements for Fast Pyrolysis and a new Method for Generating
Biomass Vapor”, Colorado State University, Paper available on the following WEB site
(http://web.anl.gov/PCS/acsfuel/preprint%20archive/Files/32_2_DENVER_04-87_0068.pdf)
14...Ringer, M. et al., “Large-Scale Pyrolysis Oil Production: A Technology Assessment and Economic
Analysis”, Technical Report NREL/TP-510-3779, contract number DE-AC35-99-GO10337 (2006).
(http://www.nrel.gov/docs/fy07osti/37779.pdf).
15..Tarka, T. J., “Affordable, Low-Carbon Diesel Fuel from Domestic Coal and Biomass”, DOE/NETL-
2009/1349 (2009).
(http://www.netl.doe.gov/energy-analyses/pubs/CBTL%20Final%20Report.pdf).
16..Wright, M.W., et al., “Techno-Economic Analysis of Biomass Fast Pyrolysis to Transportation Fuels”,
National Renewable Energy Laboratory, NREL/TP-6A20-46586, Contract No. DE-AC36-08GO28308
(November 2010).
(http://www.nrel.gov/docs/fy11osti/46586.pdf).

14
17.. Zheng, L., Furinsky, E., “Comparison of Shell, Texaco, BGL and KRW gasifiers as part of IGCC
plant computer simulations”, Energy Conversion and Management, v. 46, 1767-1779 (2005). (http://www.sciencedirect.com/science/article/pii/S0196890404002316).
FINAL REPORT FORMAT AND DOCUMENTATION
NOTES:
1. FOR CONSISTENCY, CLARITY AND UNDERSTANDABILITY, ALL OF THE
REPORT MUST BE DONE IN ENGLISH UNITS!
2. These formatting requirements are mandatory (non-complying reports will not be
considered)
A. Font: 12 point, Times New Roman,
B. Single spaced,
C. Each paragraph indented,
D. No spaces between paragraphs
3. Every page must be numbered in the bottom right-hand corner. Section page numbers
must be included in the Table of Contents.
4. The report must not exceed 125 numbered pages.
Documentation Requirements
NOTE TO STUDENTS AND FACULTY ADVISORS: Great difficulty was experienced while
grading the 2012 NSDC Problem Team Reports. The difficulties arose because of missing, inadequate
and inconsistent documentation. These documentation deficiencies increased grading (i.e., evaluation)
effort and decreased grading accuracy. To improve documentation, the following documentation
instructions are now MANDATORY and are not discretionary and they will be treated as such by the
judges. Any significant deviation from the mandated Table of Contents and Individual Section Contents
will result in report rejection, resulting in a Rejection Letter (citing unacceptable documentation) sent to
the competitor’s institution.
Mandated Table of Contents: NOTE: Every TOC Section must have its starting page # included.
+ Title Page
SECTION Page Number
+ Summary -------------------------------------------------------------------------------------- **
+ Introduction ----------------------------------------------------------------------------------- **
+ Conclusions ----------------------------------------------------------------------------------- **
+ Recommendations --------------------------------------------------------------------------- **
+ Project Premises ------------------------------------------------------------------------------ **
+ Process Flow Diagram(s) --------------------------------------------------------------------- **
+ Stream Attributes Table---------------------------------------------------------------------- **
+ Process Description--------------------------------------------------------------------------- **
+ Safety ------------------------------------------------------------------------------------------- **
+ Environmental -------------------------------------------------------------------------------- **
+ Utility Summary ------------------------------------------------------------------------------ **
+ Operating Cost Summary -------------------------------------------------------------------- **
+ Equipment Information Summary --------------------------------------------------------- **
+ Capital Estimate ------------------------------------------------------------------------------ **
+ Economic Analysis --------------------------------------------------------------------------- **
+ Innovation & Optimization------------------------------------------------------------------ **
+ References ------------------------------------------------------------------------------------- **
15
+ Engineering Calculations -------------------------------------------------------------------- **
+ Computer Programs -------------------------------------------------------------------------- **
+ Computer Process Simulations -------------------------------------------------------------- **
The minimum requirements for the contents of each report section are given below.
Title Page
Title, Authors, Institution, Date, 2013 AIChE Contest Problem
Table of Contents
The report Table of Contents (TOC) must include the Report Sections exactly as listed above. The 1st
page of each TOC section must be included; thus, every report page will be numbered sequentially from
the 1st to the last page.
Summary
One page maximum condensation of the report, including project start & mechanical completion
dates, project description (what was achieved & how was it achieved), environmental (how satisfied,
costs), safety (how handled, costs), economics (Capital & operating costs, manpower, IRR & NPW,
as appropriate), recommendations [i.e., is project implementation recommended? Is project
abandonment recommended?].
Introduction
Orient the reader to the assigned task; it is the ideal place to include pertinent information which does
not fit well into other report sections. E.g., for the 2012 Low Alcohol Beer Problem, Reverse Osmosis
(RO) was the mandated technology; whereas, distillation was the original technology. The reader would
be interested to know why RO replaced Distillation as the most economical technology; this section is the
ideal place to inform the reader of this history. This is the ideal location for any pertinent literature
surveys.
Conclusions
Interpret your results. Itemize your conclusions in decreasing order of significance.
What do you conclude about technical feasibility? What do you conclude about economic
feasibility?
Recommendations
Emphasize business opportunity, including potential process and other economic improvements.
Mention research programs required or desired to demonstrate and/or improve the process
technology.
Project Premises
Itemize all pertinent project, process and economic premises, including (1) start
and mechanical completion dates (2) feed and product specifications, including product quality
considerations (3) costs of waste treatment, raw materials, utilities, operating labor etc., (4) selling
prices of all products, (5) economic parameters: including depreciation schedule, taxes, project life
etc., (6) environmental requirements [e.g., De Minimis emission levels,
http://www.epa.gov/airquality/genconform/deminimis.html] (7) processing limitations,
(9) extra-ordinary costs. NOTE: Historically, this section is the most seriously deficient.
Process Flow Diagram (PFD)
It must include: (1) all process equipment items (2) descriptive names for process equipment
items (3) all process streams (4) numbers assigned to all process streams (5) all utilities indicated at
the location of the process equipment user and (6) the major process control loops required to
control the process. Each loop includes symbols for all 3 elements of a control loop, i.e., the Sensed
Variable [e.g., Temperature, Pressure, Composition, Flow, Level etc.], the Manipulated Variable
[e.g., Valve Position, Pump Speed, Agitator Power, Motor Voltage etc.] and the Controller [e.g.,
Temperature, Pressure, Composition, Flow, Level, Speed etc.]. NOTE: Historically, this section
is the 2nd
most deficient section.
Stream Attributes

16
For each and every numbered process stream on the PFD, include on the PFD or in a separate
table Stream Attributes (SA). SA include Stream Number, Mass Flow of Each Component, Total
Mass Flow, Temperature, Pressure and Stream Volumetric Flow Rates (GPM for liquids and CFM
for gases). Proper SA’s (lb/hr of each component, T, P, etc.) from a Process Simulator will suffice.
Process Description For each process equipment item, explain (1) its purpose (2) how it functions to obtain the process
objective [unless this is obvious, e.g., for a centrifugal pump] (3) size [e.g., 100 gpm, 50’ head, 5 hp
centrifugal pump] and (4) process conditions [e.g., the feed-water preheater heats 1,000 gpm of
atmospheric, 100 °F boiler feed-water to 210 F using 900 gpm of 300 °F, 67 psia boiler condensate, which
is cooled to 180 °F].
The strategy for controlling the process must be described. This portion of the PD can be included as
each item of process equipment is described, or, perhaps preferable, it can be described in a separate
subsection titled, “Process Control Strategy”. NOTE: Historically, this section is the 3rd
most
deficient section.
Safety
Identify and summarize the hazards associated with the chemicals and process and explain how these
hazards are addressed in the design. Also comment on how this might impact capital and operating costs.
Chemical hazards include toxicity, flammability, reactivity, bio-hazards, and others. Process hazards
could include high pressure, temperature and others. Explain how hazards are addressed in the design.
Prepare a summary table for all chemicals, including raw materials, products, intermediates, solvents, etc.;
include WEB Source, NFPA numbers, Toxicity Limits, Flammability Limits, Flash Point Temperatures
and waste disposal strategy [NOTE: This table is almost identical to that required for the ChemE Car
Competition].
A detailed HAZOP of other hazard identification procedure is not expected - that comes later during
detailed design.
NOTE: No material safety data sheet (MSDS), safety data sheet (SDS), or product safety data sheet
(PSDS) is allowed within the report; This information is referenced from WEB sites; e.g., ….the MSDS
for ethanol is available at (http://www.nafaa.org/ethanol.pdf).
Environmental
Note and explain any special considerations. Explain emission limits [e.g., are De Minimis levels
being used? If not, what levels are being used; how much are they above De Minimis?]. Explain and
document how emission limits were achieved. Explain the economic [capital and operating costs] impact
of handling environmental problems.
Utility Summary
In a table, itemize each utility by user. In the table give (1) the user [e.g., Reactor Feed Preheater] (2)
utility unit cost [e.g., 500 psig steam @ $5.00/MM Btu] (3) Utility Usage Rate [e.g., 1,000,000 Btu/hr] and
(4) Yearly cost [e.g., $40,000/yr]. Sum the costs.
Operating Cost Summary
In a table, itemize each cost category; give (1) category identification [e.g., Operators] (2) amount
[e.g., 5/shift, 20 total] (3) unit cost [e.g., $60,000/operator/year] (4) yearly cost [e.g., $1,200,000 MM /yr].
Equipment Information Summary
In a table, itemize pertinent information for each process equipment item. In the table give (1)
the item name from the PFD [e.g., Reactor Feed Preheater] (2) Material of Construction [e.g., Carbon
Steel] (3) Type & Size [e.g., 1,000 ft2 (93 m
2), fixed tubesheet, shell & tube exchanger] (4) process
conditions [e.g., 400 F @ 300 psig] (5) Source for cost [e.g., Turton et al., Fig. A.5, p. 933] and cost
[e.g., $20,500]. Sum all the individual costs.
Capital Estimate
Using the total of the purchased process equipment cost and the purchased cost of other items, use an
accepted method (the Lang Factor method is adequate) for determining the total project capital
requirements. Prepare a small table itemizing the results.
Economic Analysis
17
Discuss economic methods and analysis. Include any appropriate graphical representations such as
Yearly Discounted Cash Flow vs. Time. Any discounted cash flow (DCF) analysis must be presented in
tabular form using the Worksheet given as Table 2, p. 306, 4th Ed., Peters and Timmerhaus. For this 2013
problem a DCF analysis is not required, because an investment equivalent strategy - using a simple 5 year
payout [$ie = 5($/yr)arc and ($/yr)arc = $ie/5] - can be used to equate capital with yearly revenues or costs.
Innovation and Optimization
Explain what was done to drive the process and project towards the economic optimum.
References
Example Format: 1. Turton, R. et al., “Analysis, Synthesis, and Design of Chemical Processes”, 3rd
Ed., Prentice-Hall, Upper Saddle River, New Jersey (2009).
Hand Calculations
All pertinent hand calculations must be included. Sample calculations will not suffice. The
calculations must be succinct and well documented.
Computer Programs
Include Input and Output Files and an explanation of model(s) used, including nomenclature. The
documentation within the programs should be adequate (for one skilled in Chemical Engineering) to
understand everything within the programs.
Computer Process Simulations
Include input and output files and a simulator flow chart for one set of documented process
conditions for any process simulation using standard programs such as ASPEN, ChemCad or PRO/II.
NOTE: THERE MUST BE A ONE-TO-ONE CORRESPONDENCE BETWEEN STREAM
NUMBERS IN THE PROCESS SIMULATION AND STREAM NUMBERS ON THE PROCESS
FLOW DIAGRAM. IF EXTRA STEAM NUMBERS ARE REQUIRED FOR THE COMPUTER
SIMULATION, THEN USE NUMBERS FOR THESE STREAMS NOT USED ON THE PFD; I.E.,
STEAM NUMBERS MAY BE INLCUDED IN THE PROCESS SIMULATION WHICH DO NOT
EXIST ON THE PFD.


