Page 1
National Tracking Poll #2006102June 19-21, 2020
Crosstabulation Results
Methodology:This poll was conducted from June 19-21, 2020, among a national sample of 1988 Registered Voters. Theinterviews were conducted online and the data were weighted to approximate a target sample of RegisteredVoters based on age, race/ethnicity, gender, educational attainment, and region. Results from the full surveyhave a margin of error of plus or minus 2 percentage points.
Page 2
Table Index
1 Table P1: Now, generally speaking, would you say that things in the country are going in the rightdirection, or have they pretty seriously gotten off on the wrong track? . . . . . . . . . . . . . . . . . . 9
2 Table Q172: Do you approve or disapprove of the job Donald Trump is doing as President? . . . . . . 13
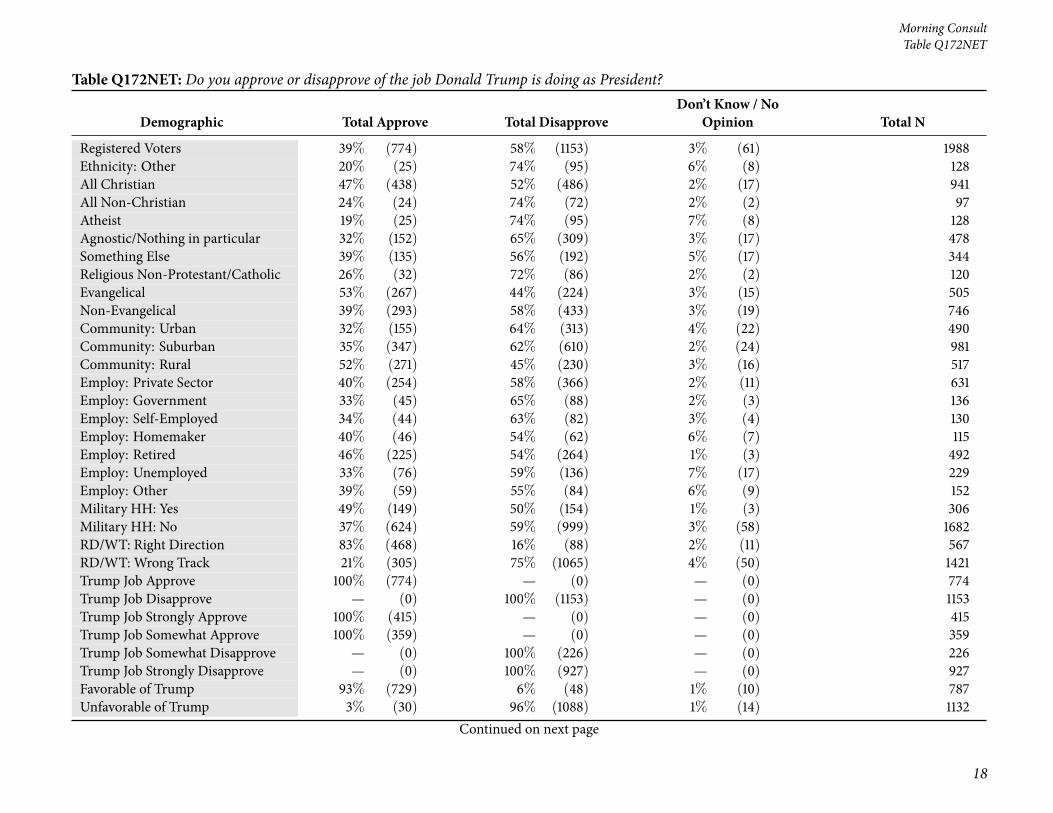
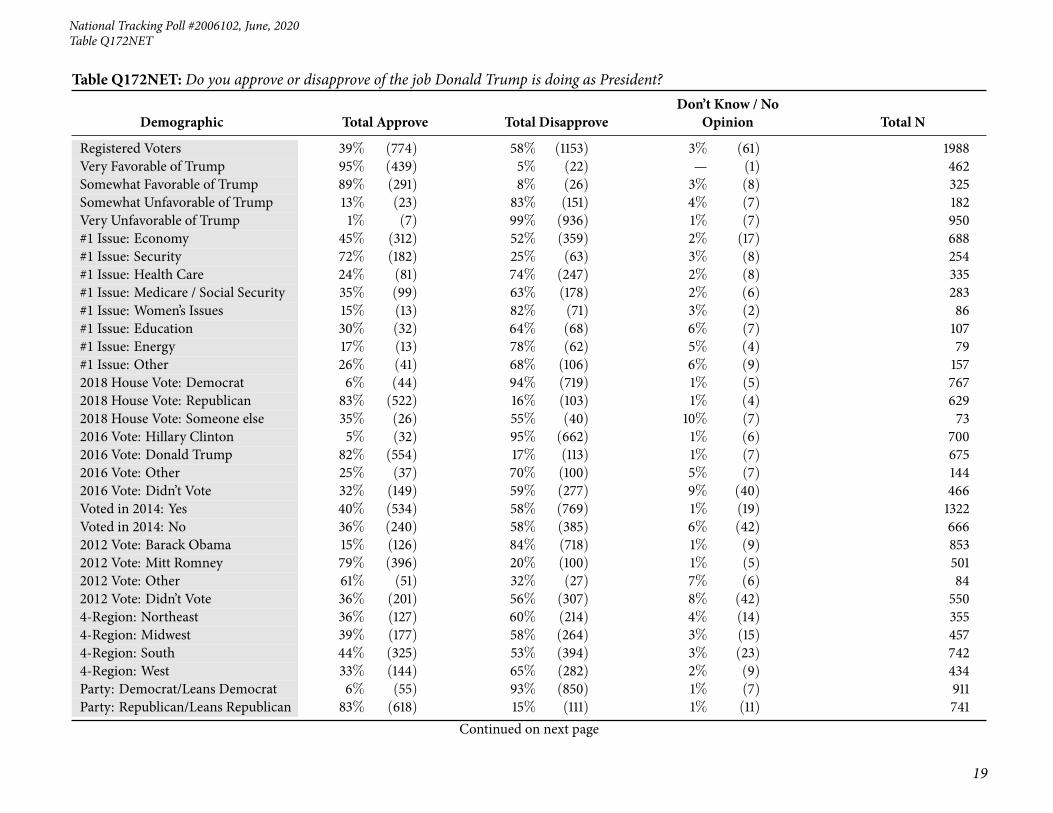
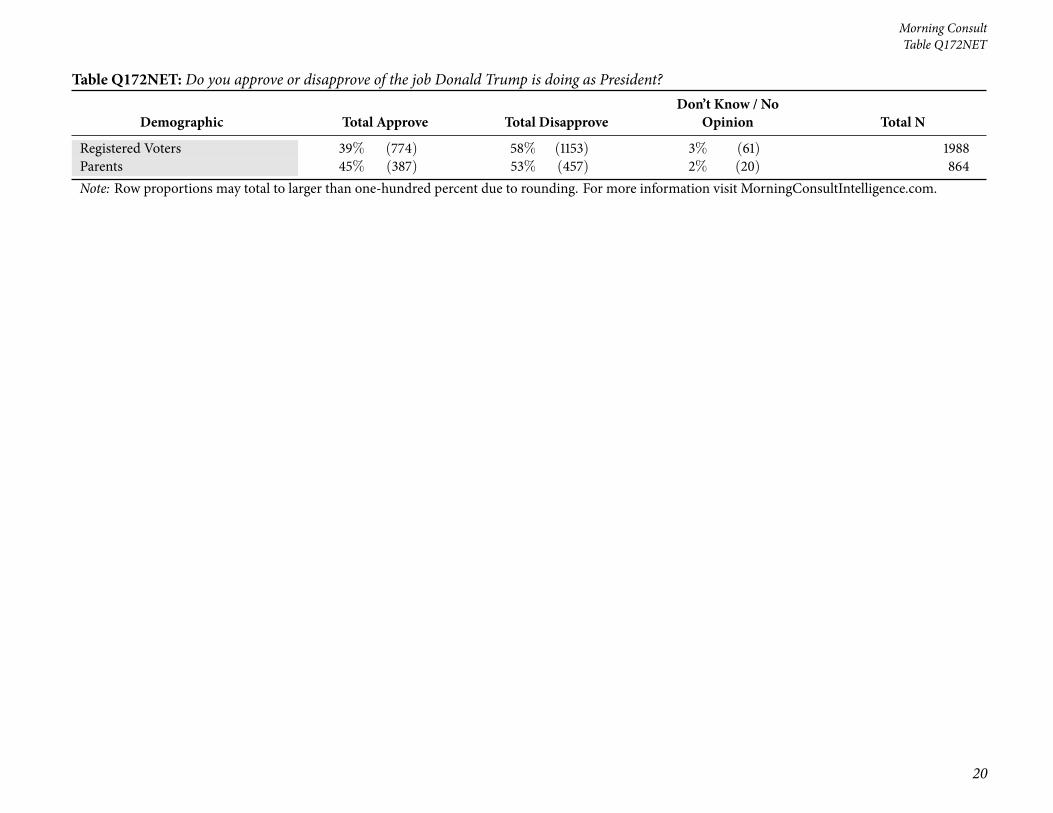
3 Table Q172NET: Do you approve or disapprove of the job Donald Trump is doing as President? . . . . 17
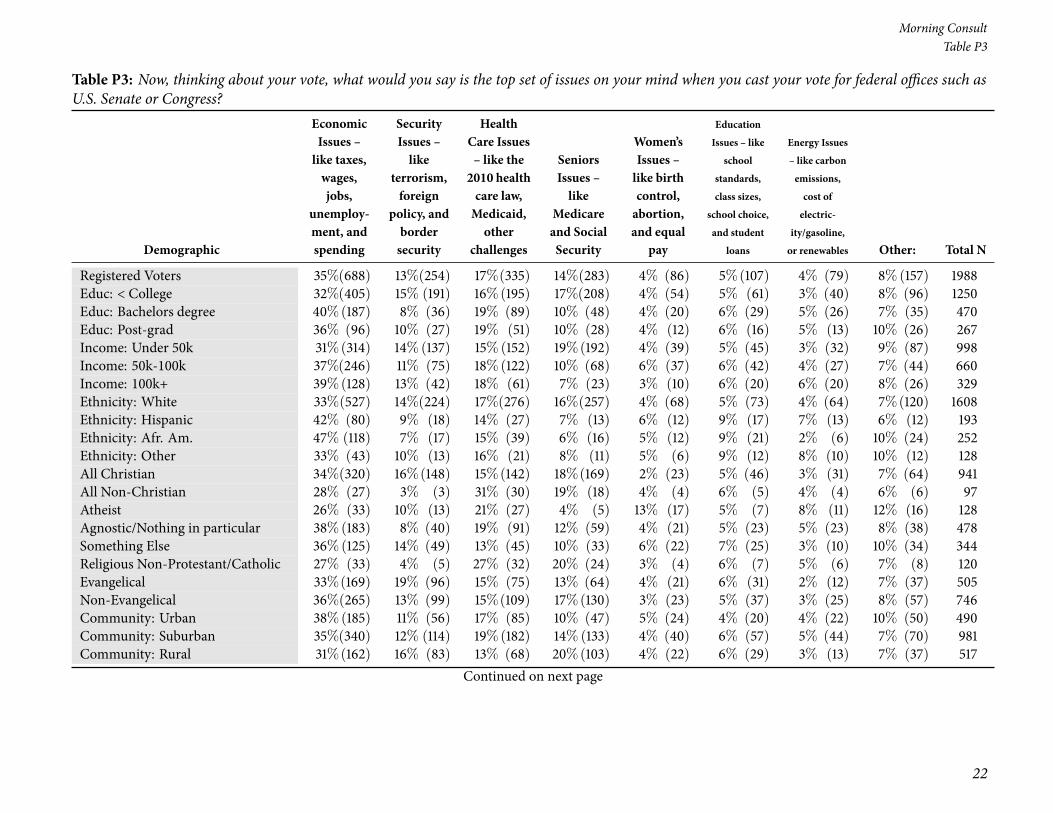
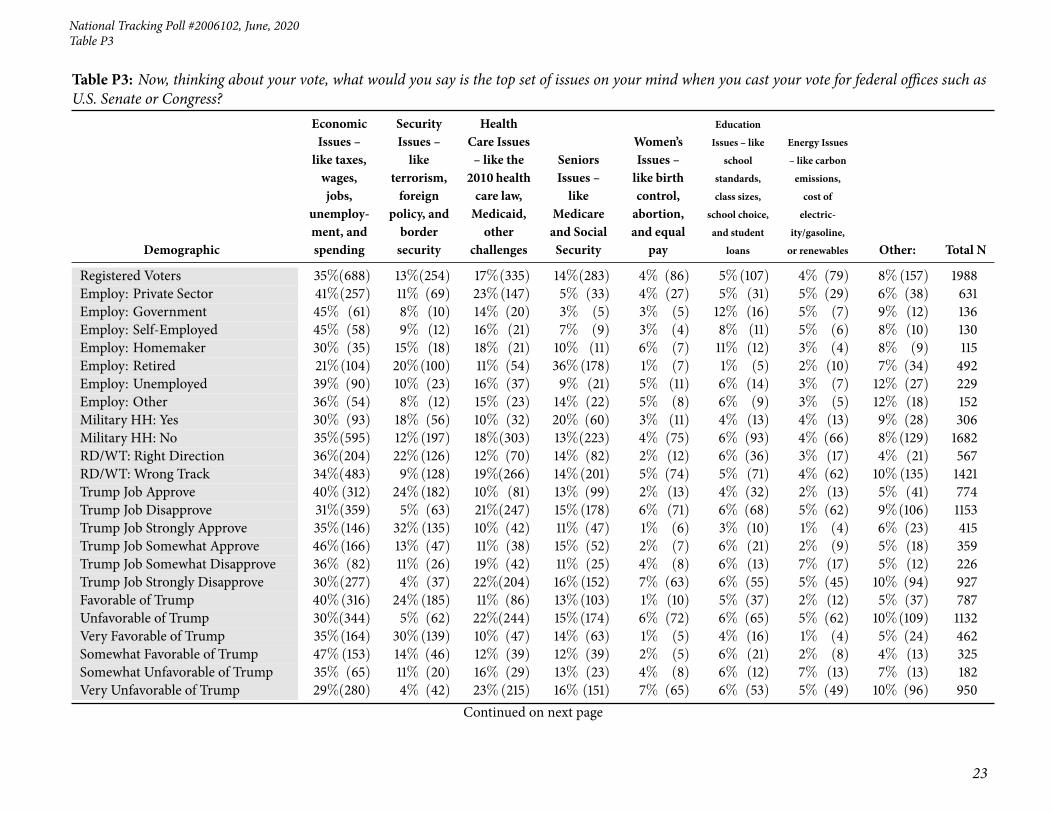
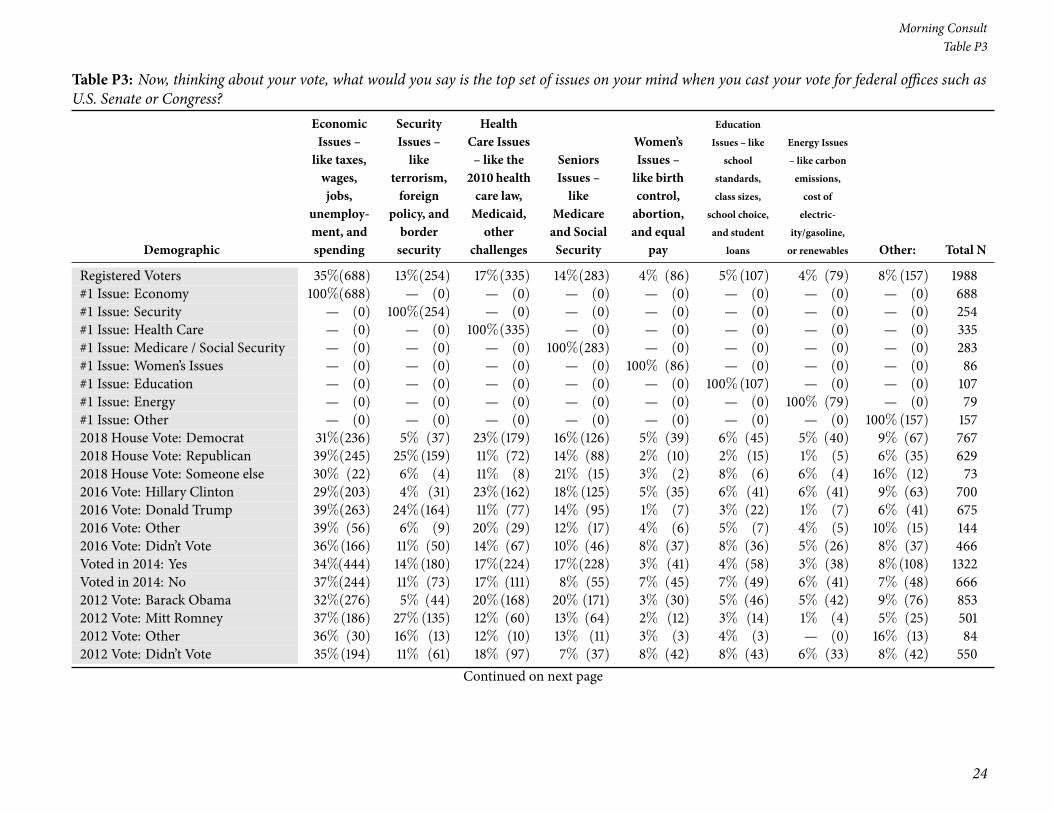
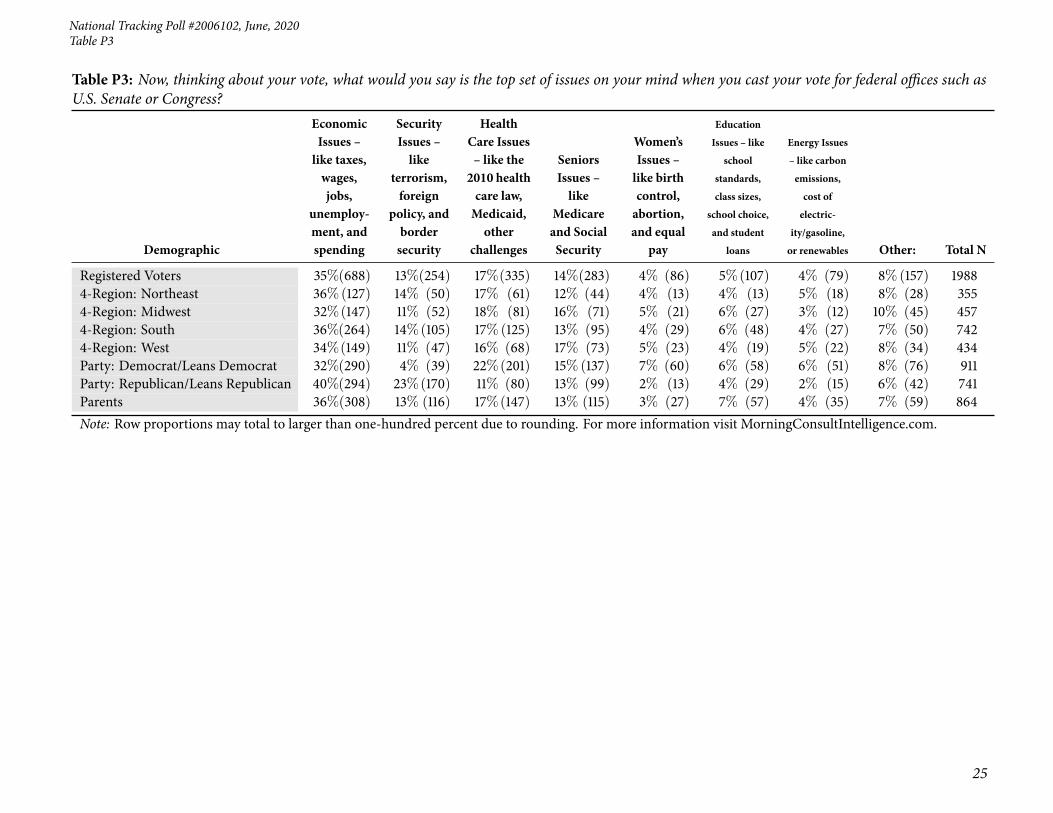
4 Table P3: Now, thinking about your vote, what would you say is the top set of issues on your mind whenyou cast your vote for federal offices such as U.S. Senate or Congress? . . . . . . . . . . . . . . . . . . 21
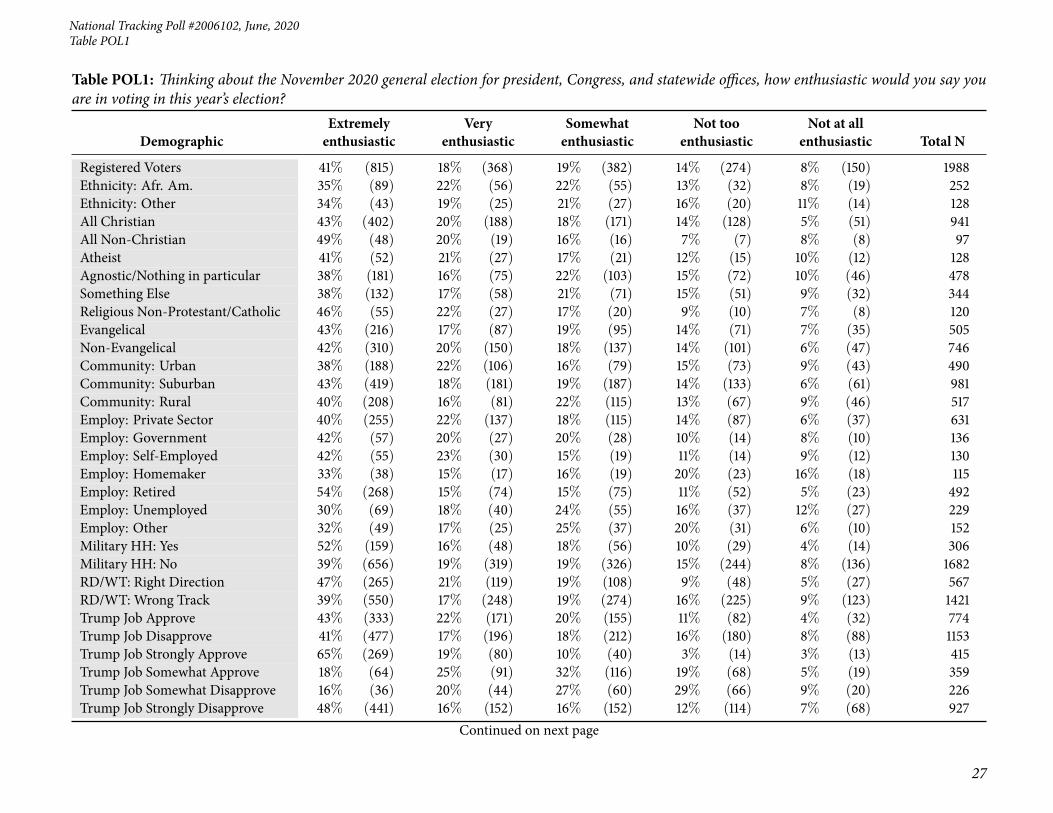
5 Table POL1: Thinking about theNovember 2020 general election for president, Congress, and statewideoffices, how enthusiastic would you say you are in voting in this year’s election? . . . . . . . . . . . . . 26
6 Table POL2: Compared to previous elections, are you more or less enthusiastic about voting than usual? 30
7 Table POL3_1: Who do you trust more to handle each of the following issues? The economy . . . . . . 34
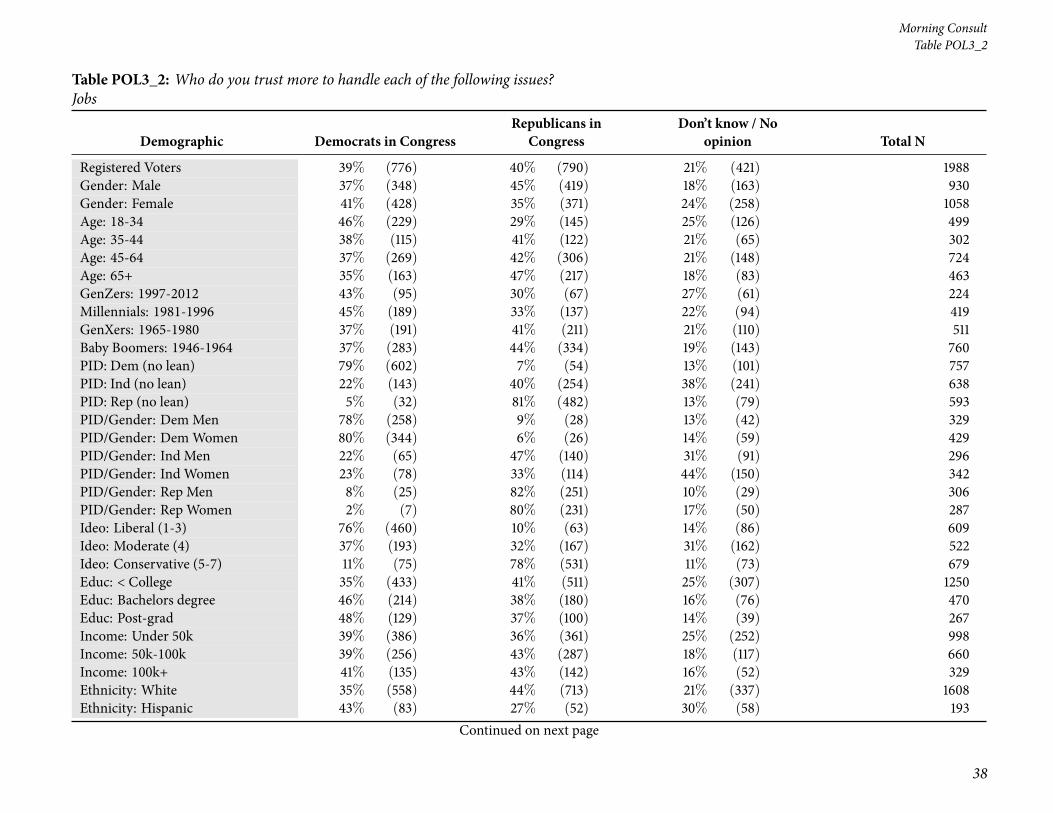
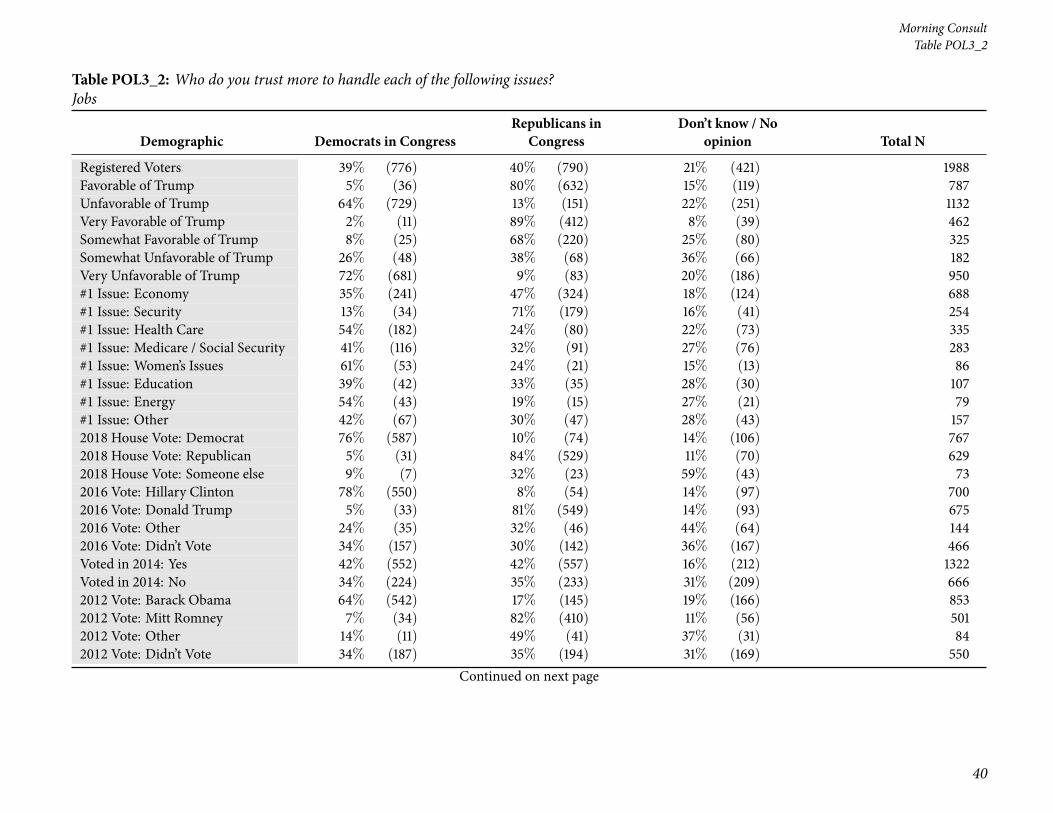
8 Table POL3_2: Who do you trust more to handle each of the following issues? Jobs . . . . . . . . . . . 38
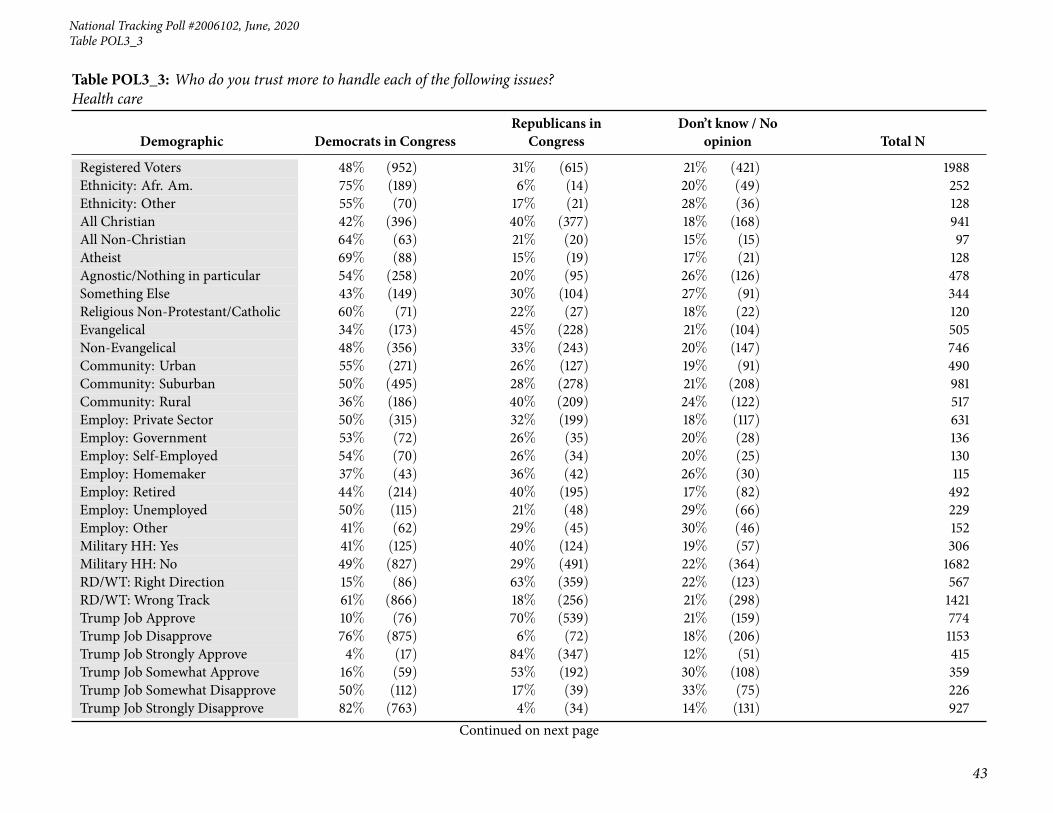
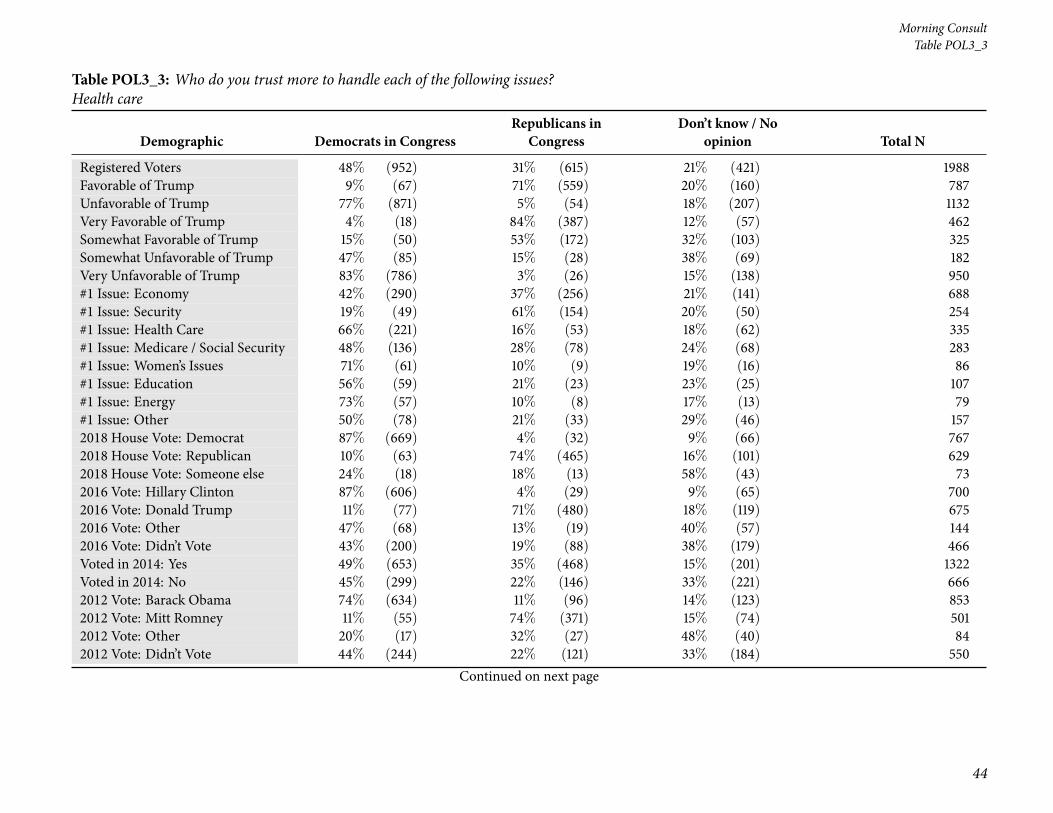
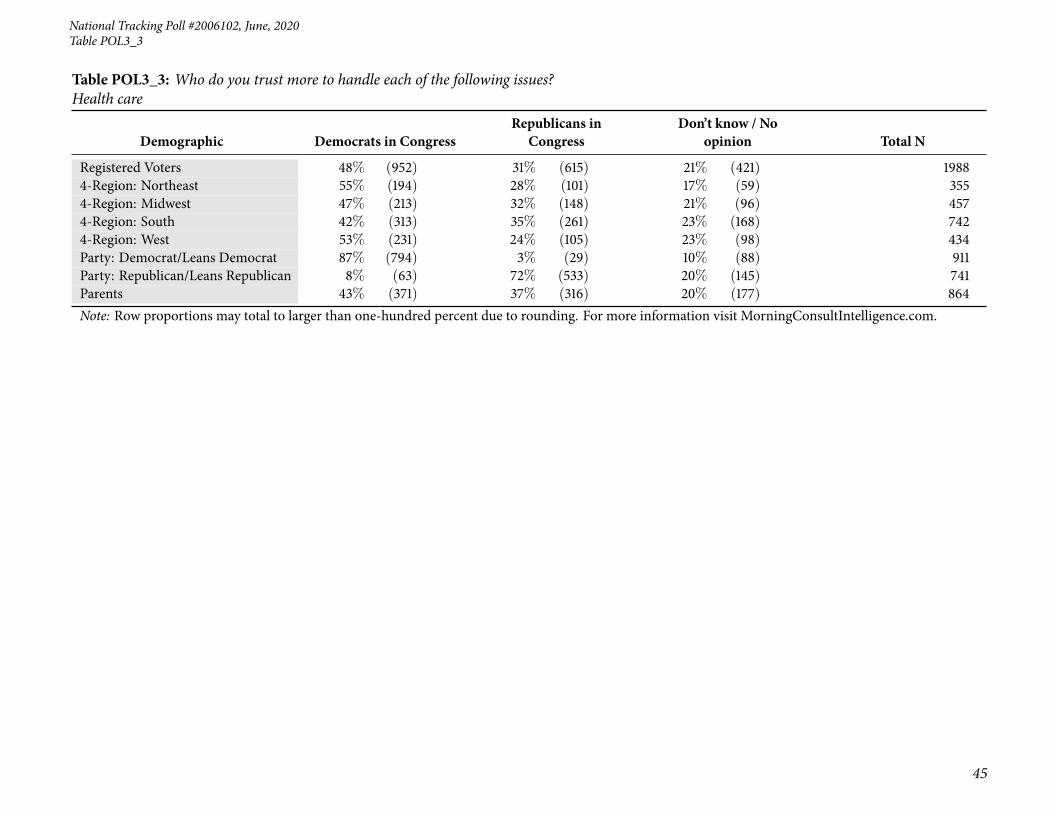
9 Table POL3_3: Who do you trust more to handle each of the following issues? Health care . . . . . . . 42
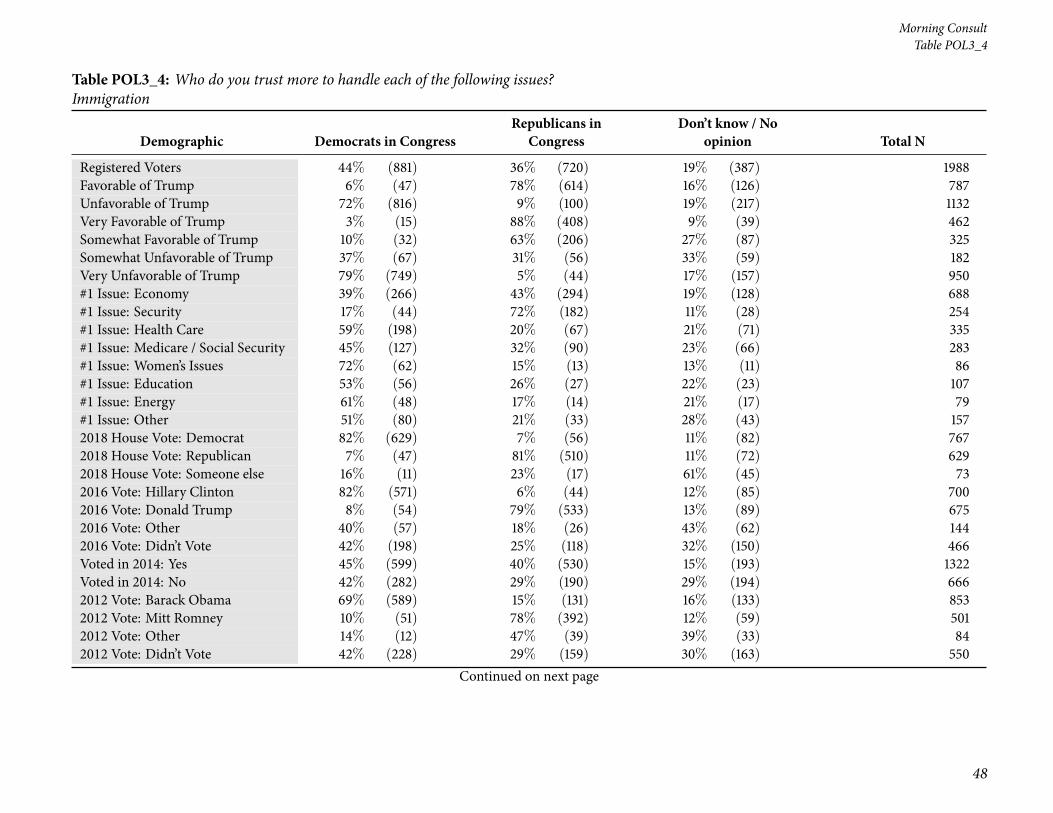
10 Table POL3_4: Who do you trust more to handle each of the following issues? Immigration . . . . . . 46
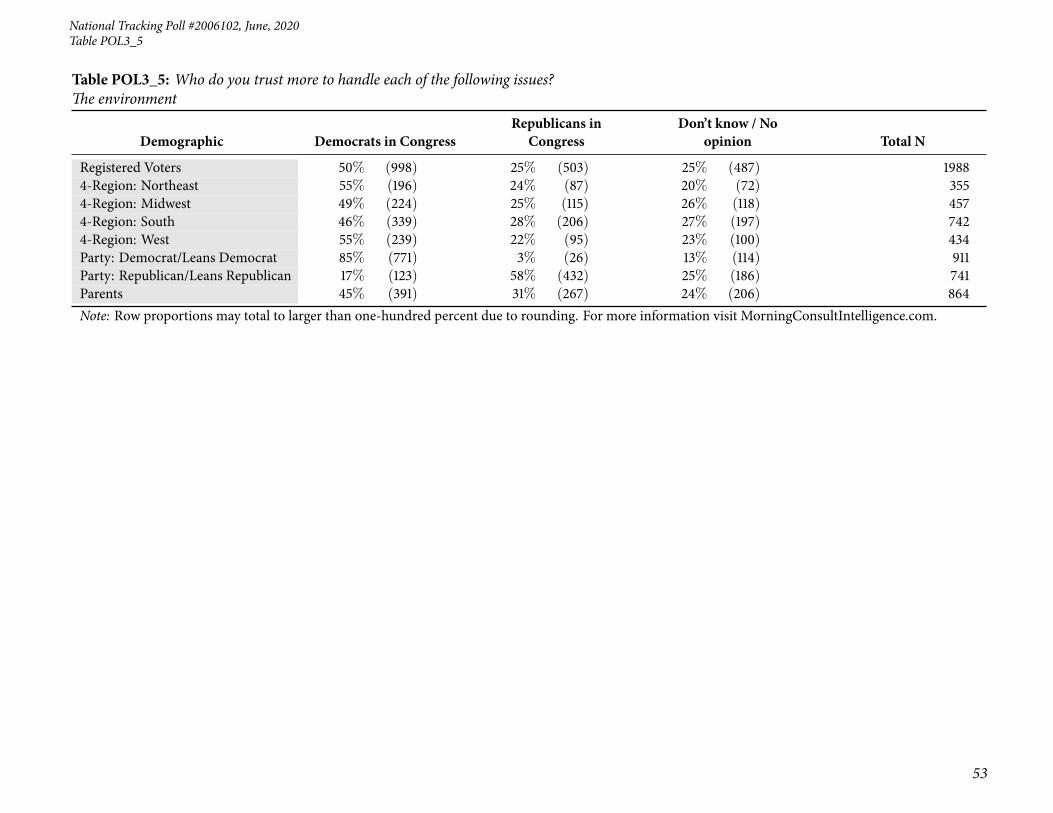
11 Table POL3_5: Who do you trust more to handle each of the following issues? The environment . . . . 50
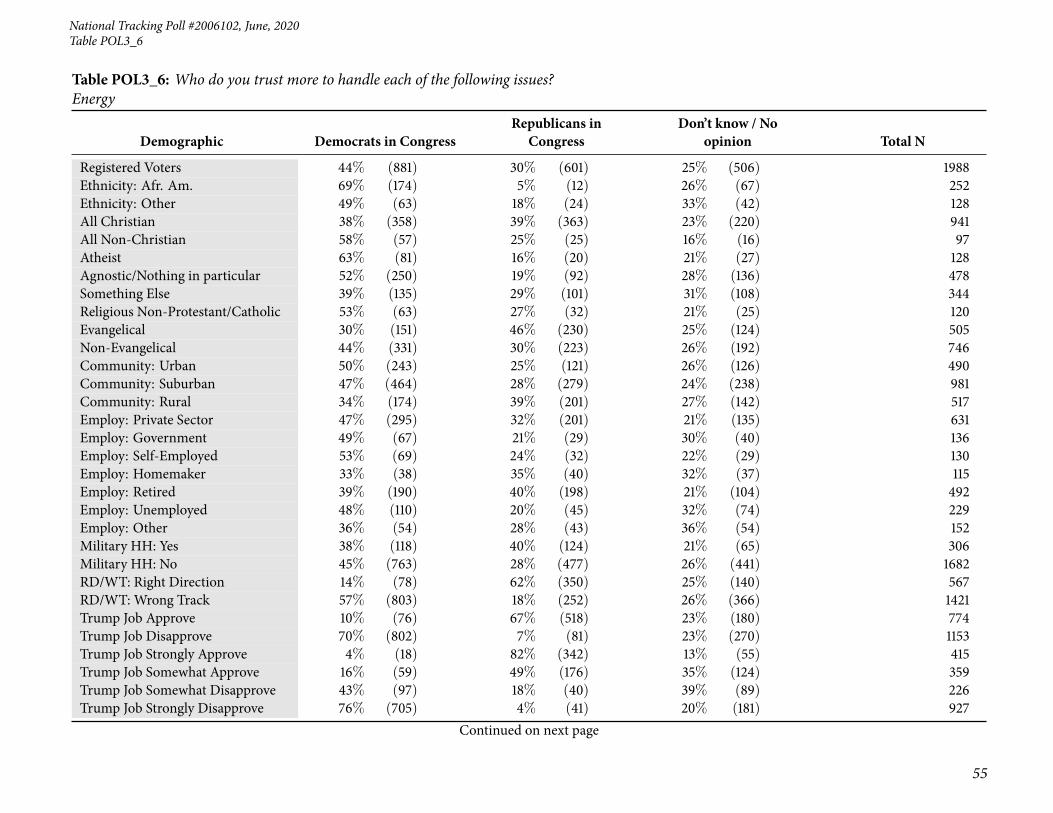
12 Table POL3_6: Who do you trust more to handle each of the following issues? Energy . . . . . . . . . 54
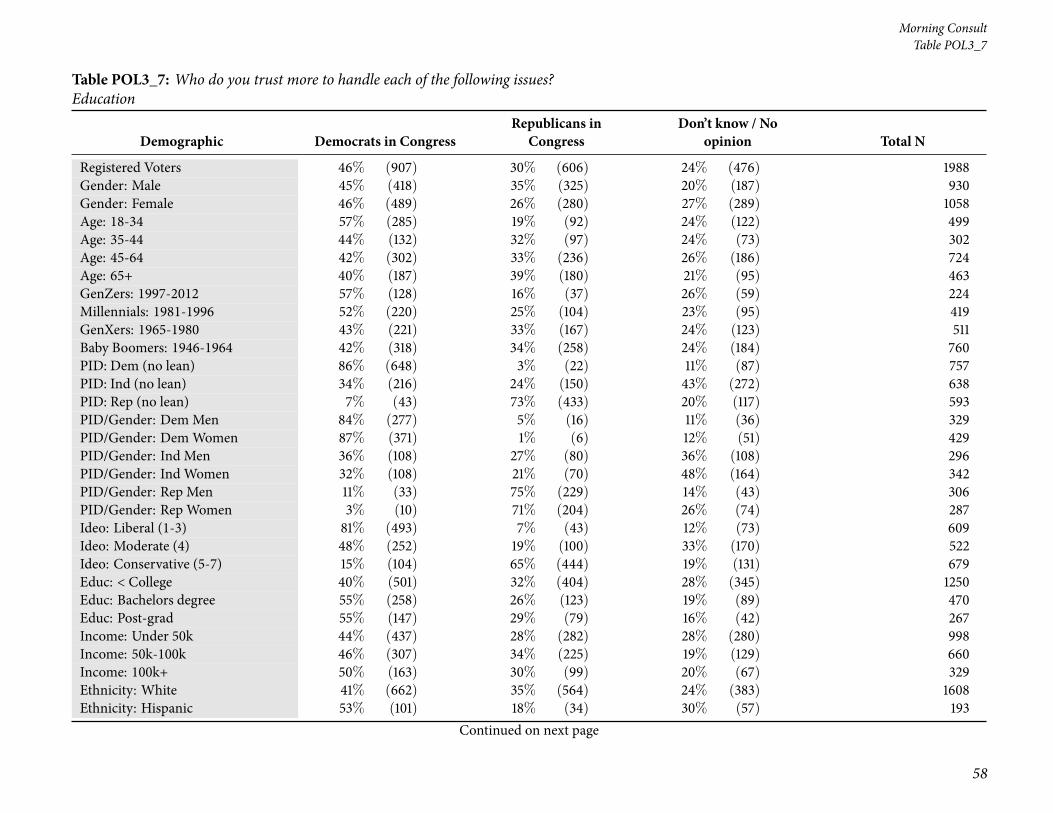
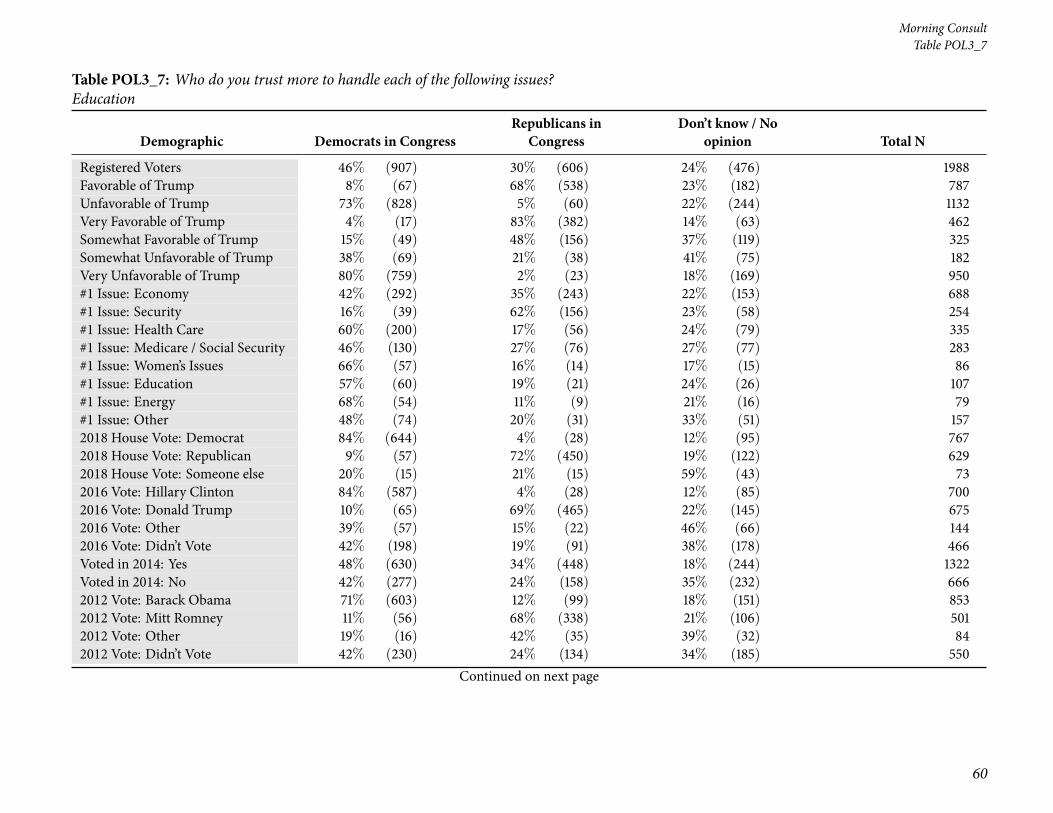
13 Table POL3_7: Who do you trust more to handle each of the following issues? Education . . . . . . . 58
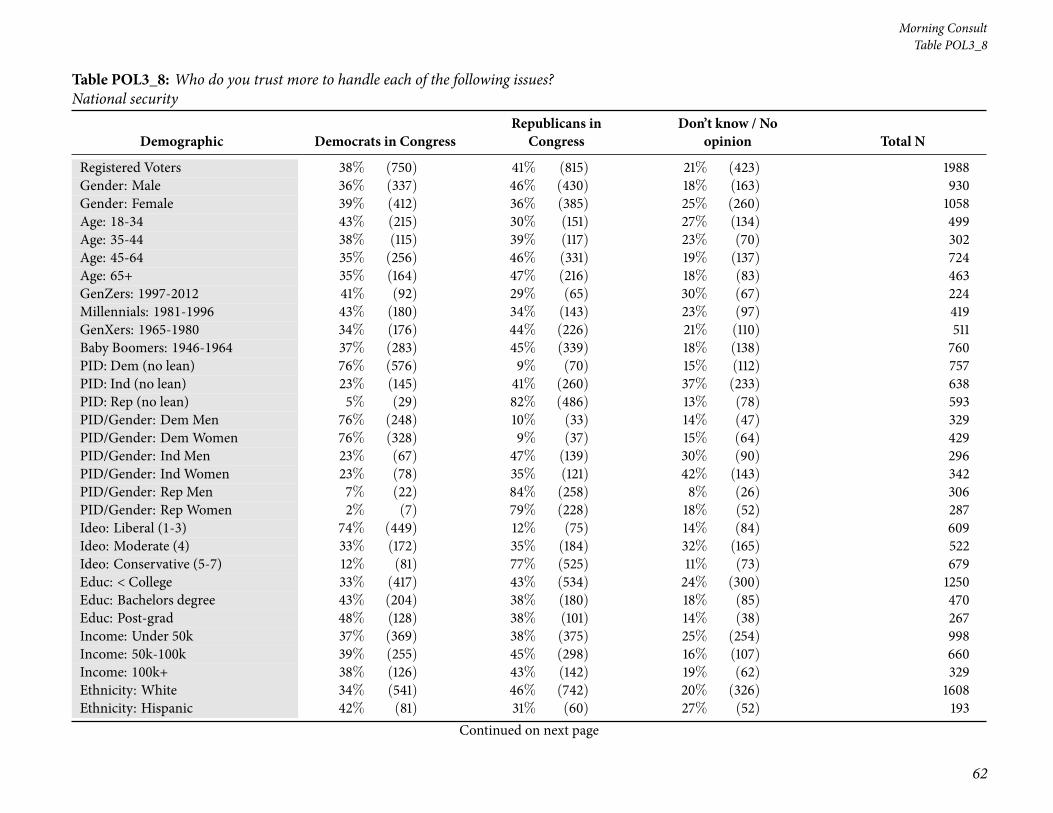
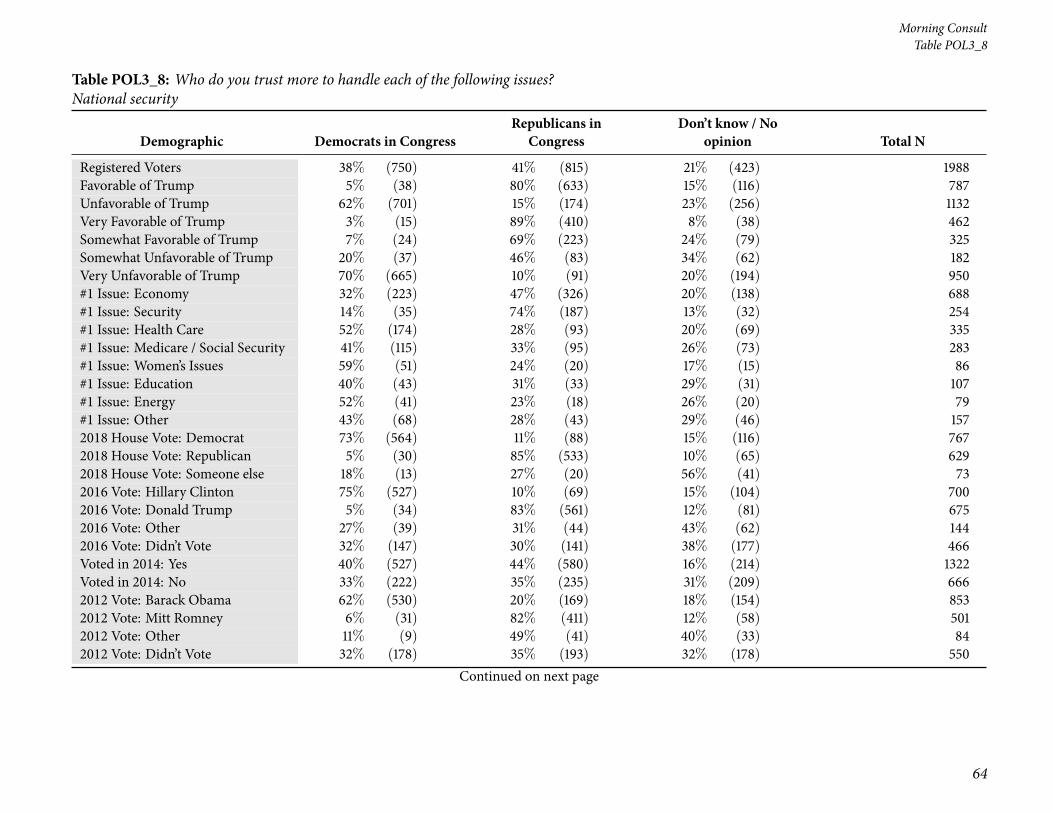
14 Table POL3_8: Who do you trust more to handle each of the following issues? National security . . . . 62
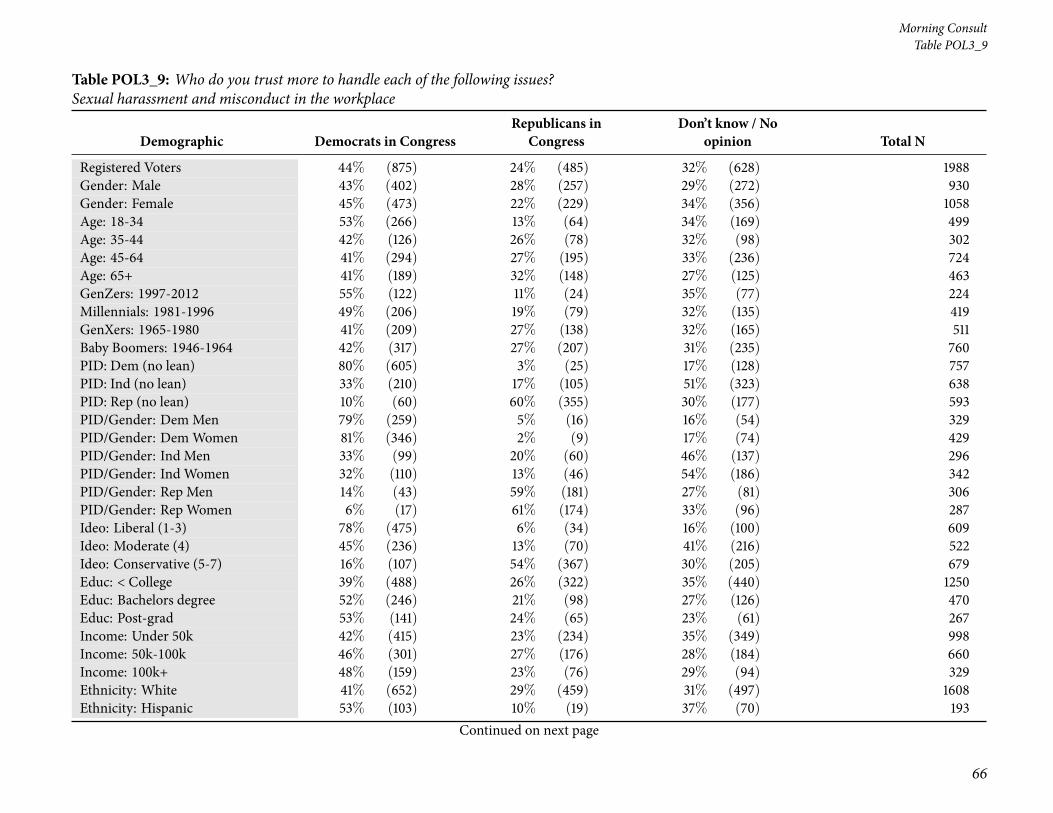
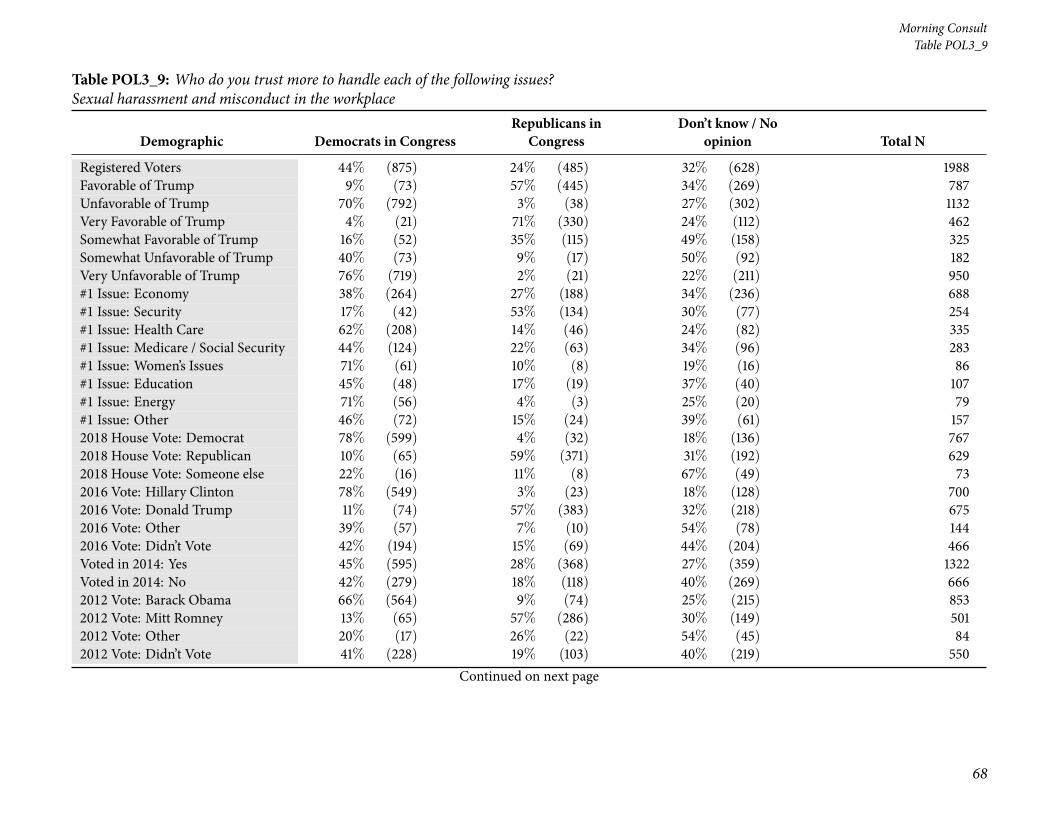
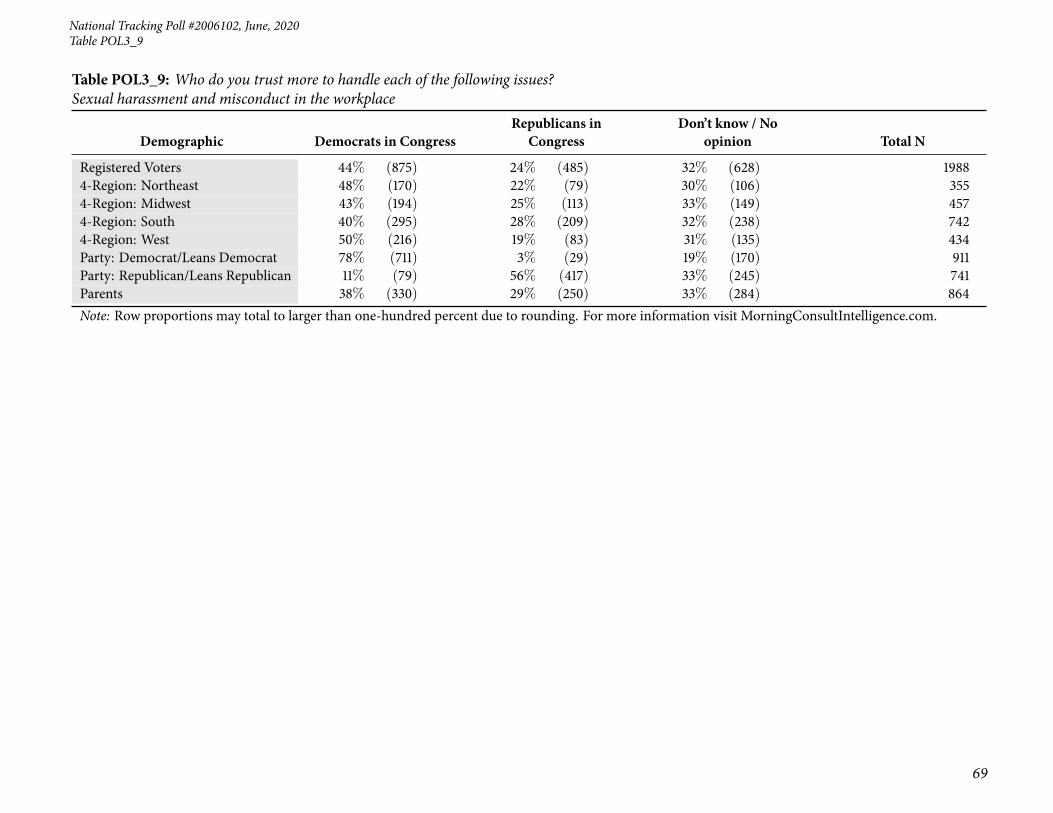
15 Table POL3_9: Who do you trust more to handle each of the following issues? Sexual harassment andmisconduct in the workplace . . . . . . . . . . . . . . . . . . . . . . . . . . . . . . . . . . . . . . . . 66
16 Table POL3_10: Who do you trust more to handle each of the following issues? Gun policy . . . . . . 70
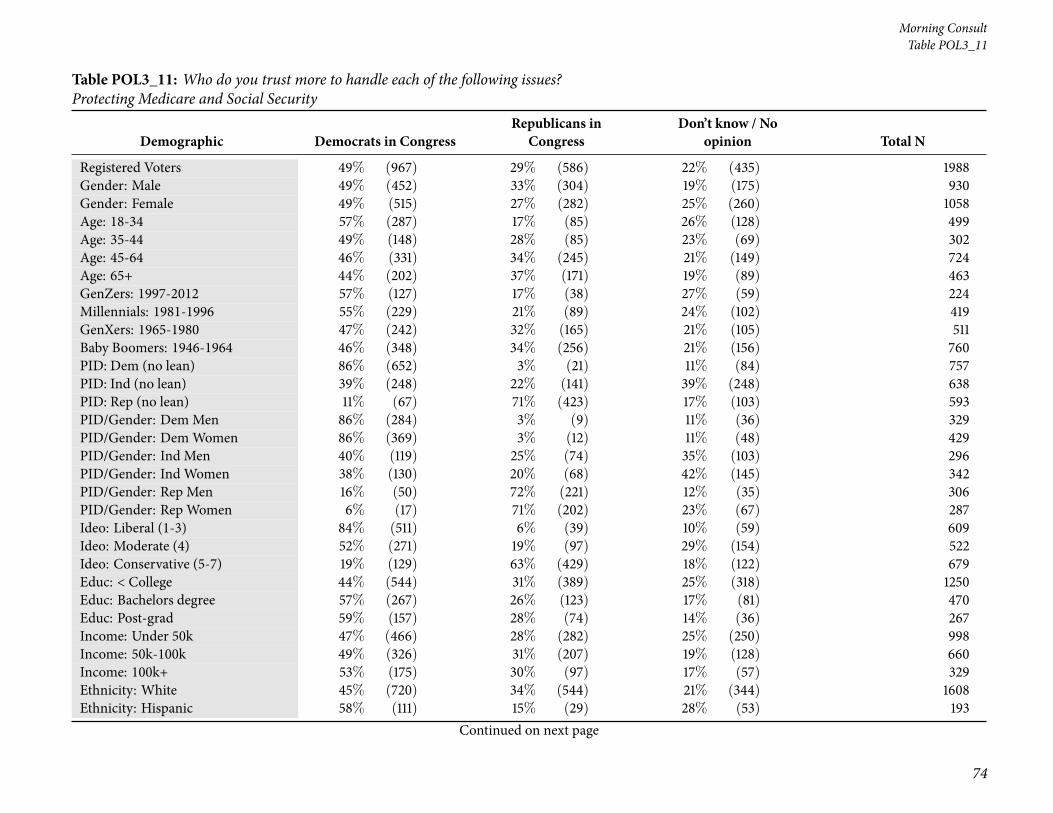
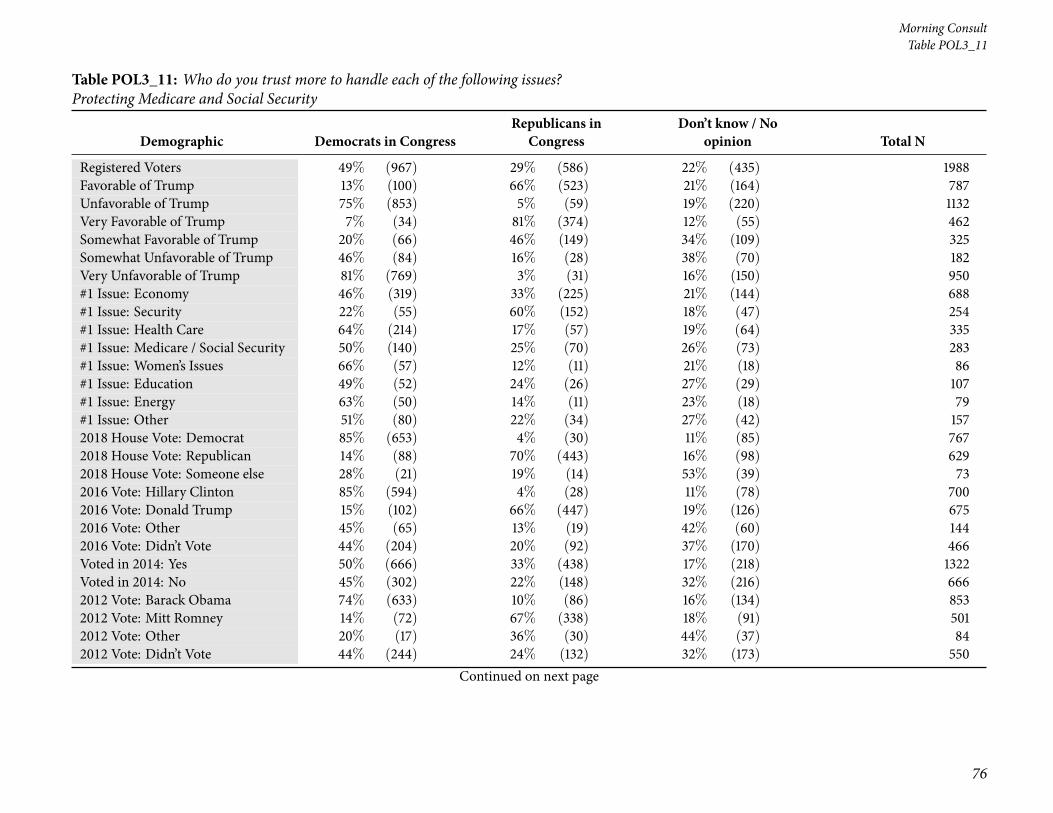
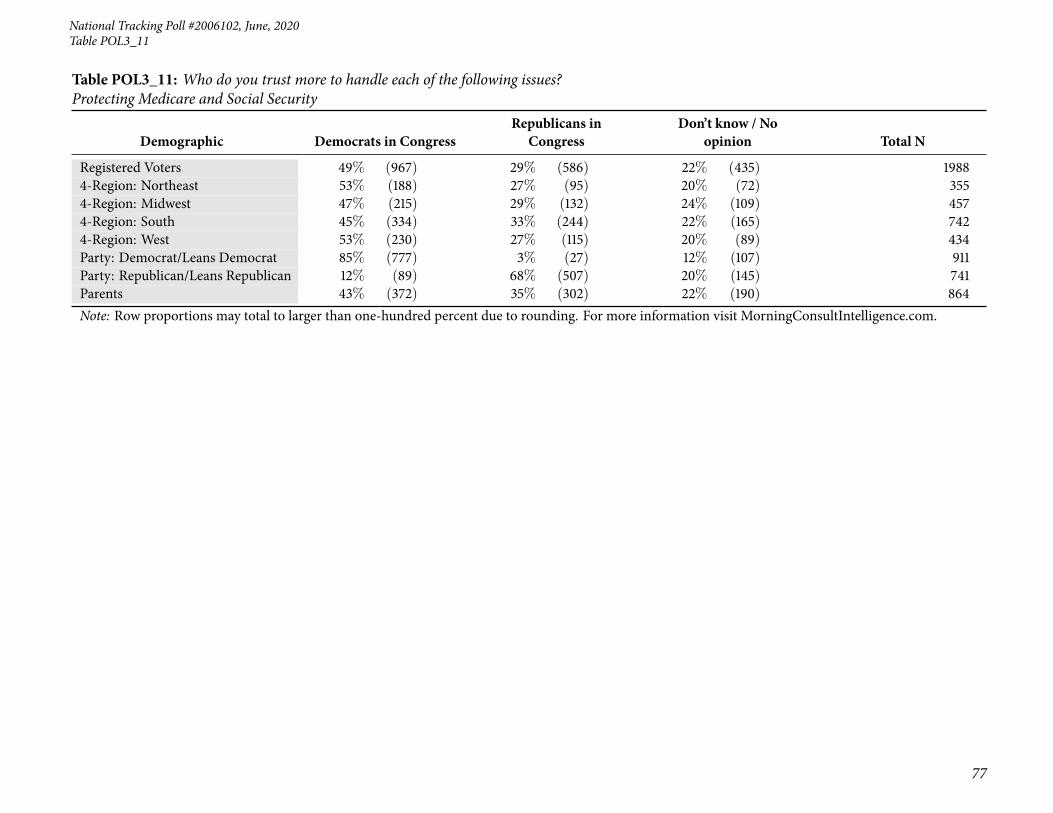
17 Table POL3_11: Who do you trust more to handle each of the following issues? Protecting Medicareand Social Security . . . . . . . . . . . . . . . . . . . . . . . . . . . . . . . . . . . . . . . . . . . . . 74
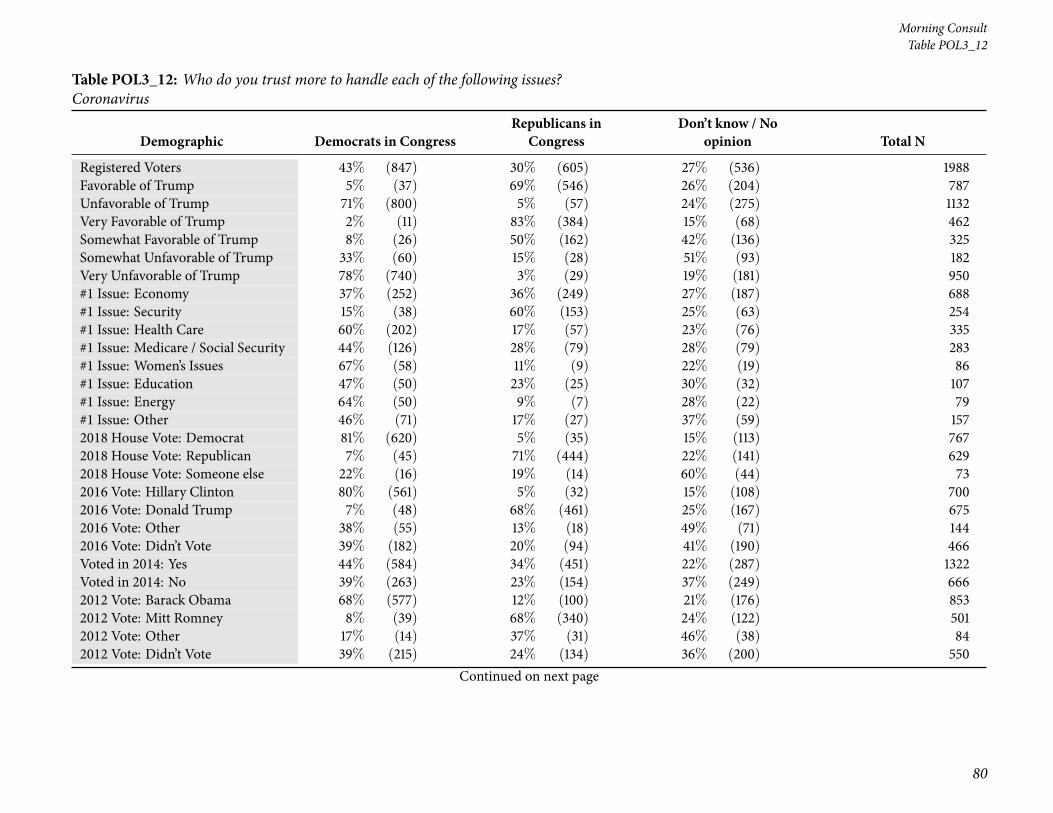
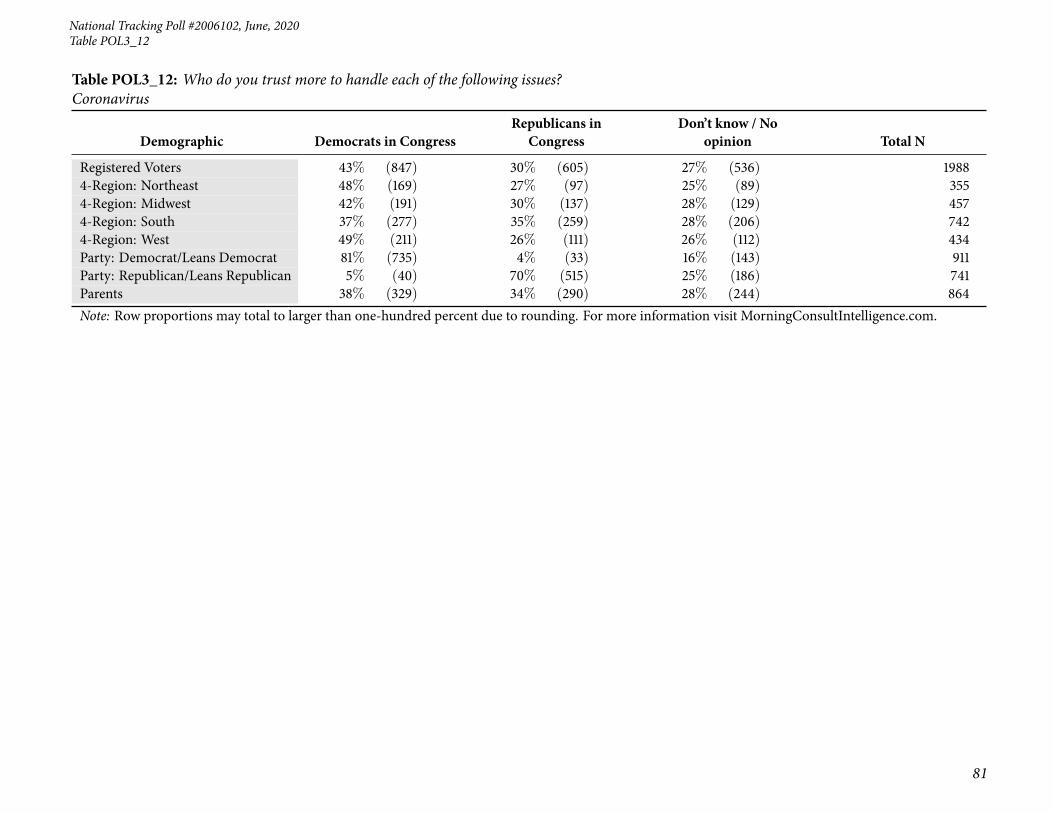
18 Table POL3_12: Who do you trust more to handle each of the following issues? Coronavirus . . . . . 78
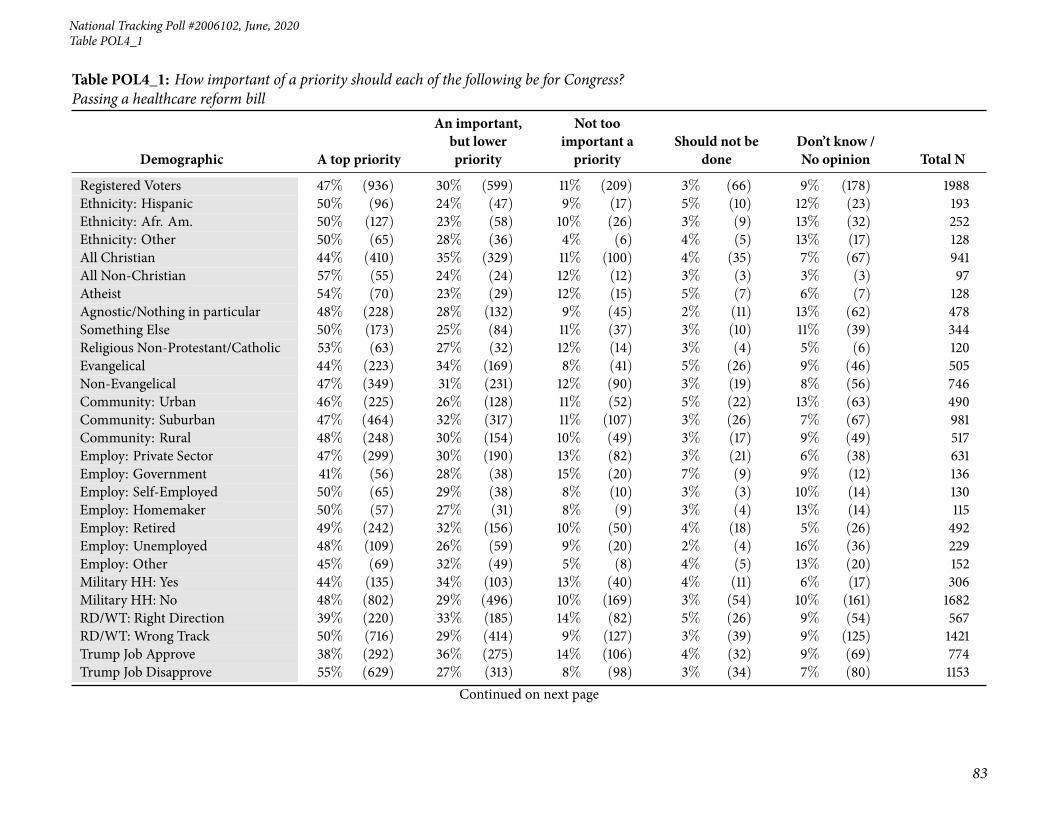
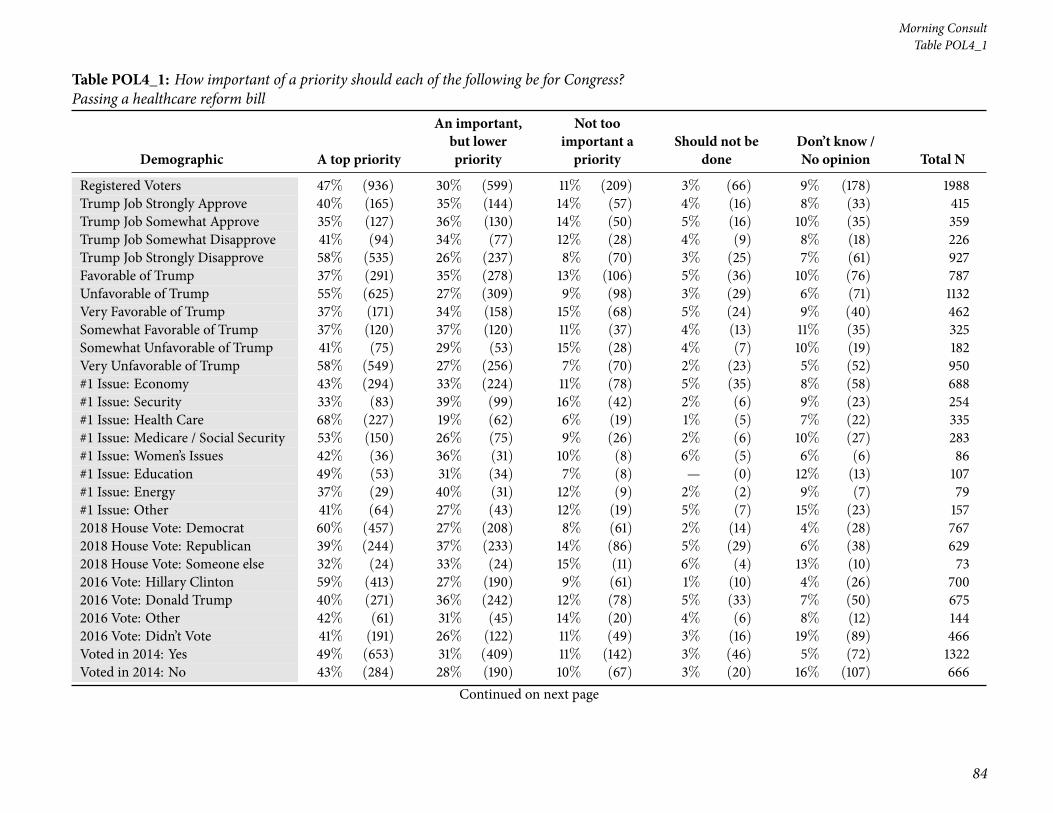
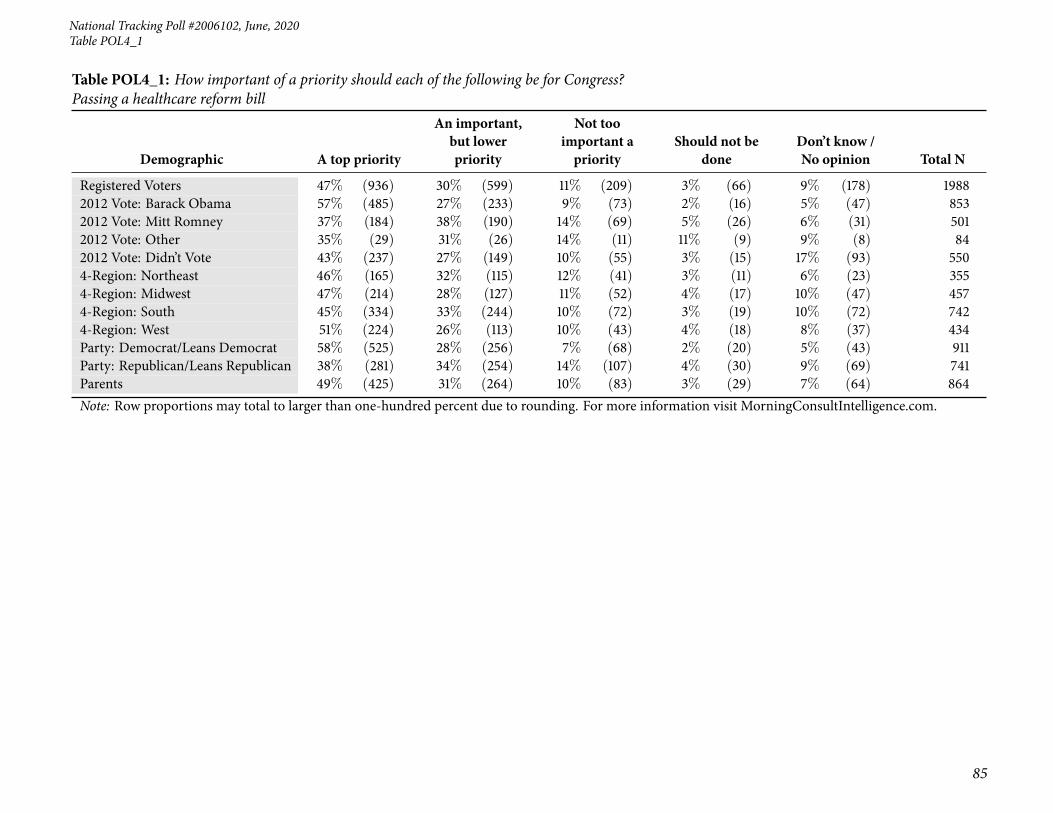
19 Table POL4_1: How important of a priority should each of the following be for Congress? Passing ahealthcare reform bill . . . . . . . . . . . . . . . . . . . . . . . . . . . . . . . . . . . . . . . . . . . 82
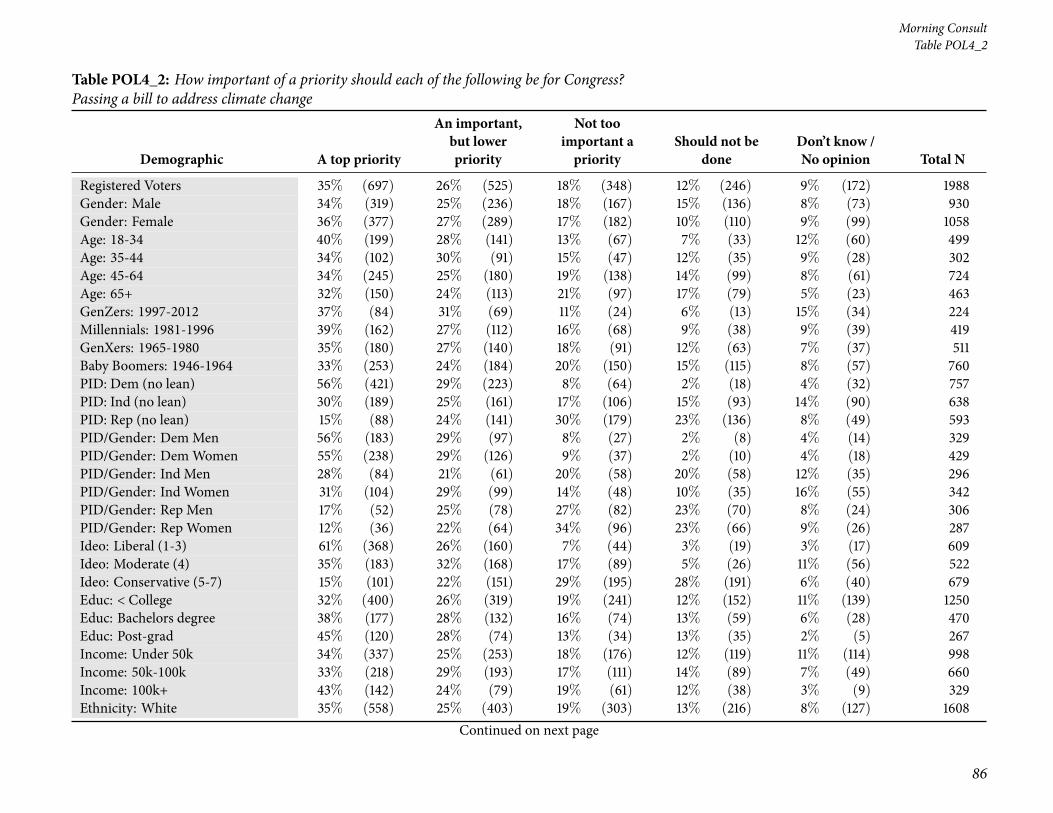
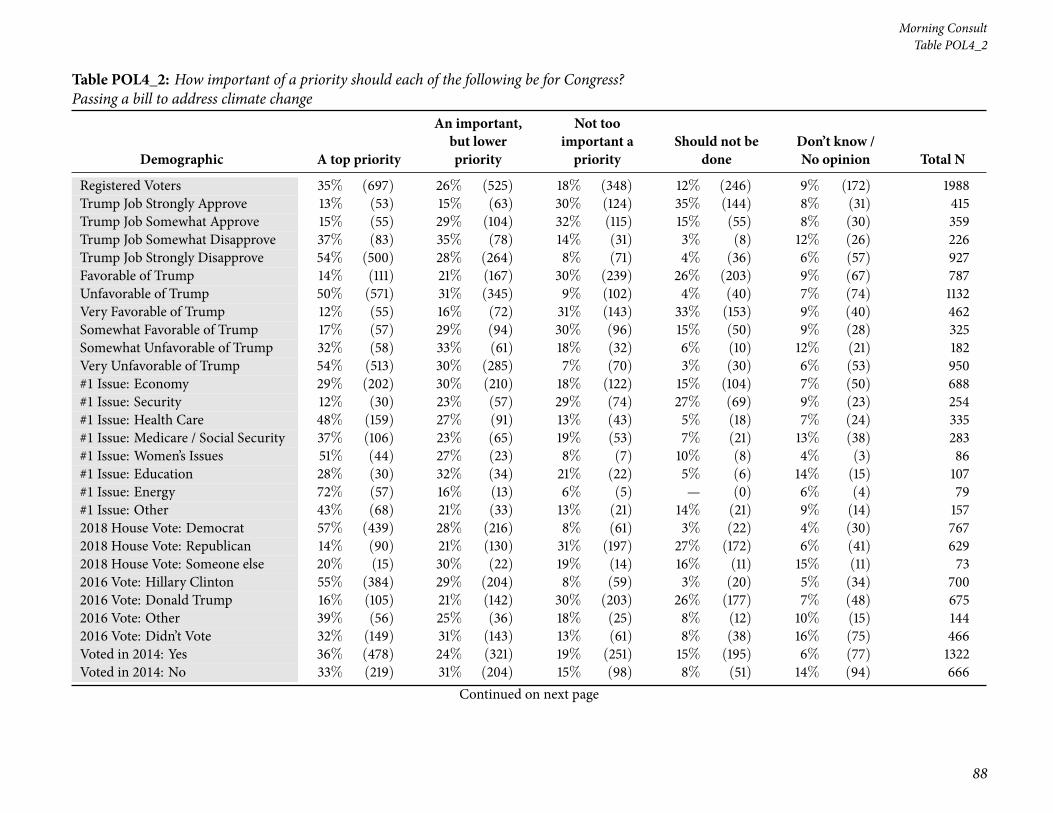
20 Table POL4_2: How important of a priority should each of the following be for Congress? Passing abill to address climate change . . . . . . . . . . . . . . . . . . . . . . . . . . . . . . . . . . . . . . . 86
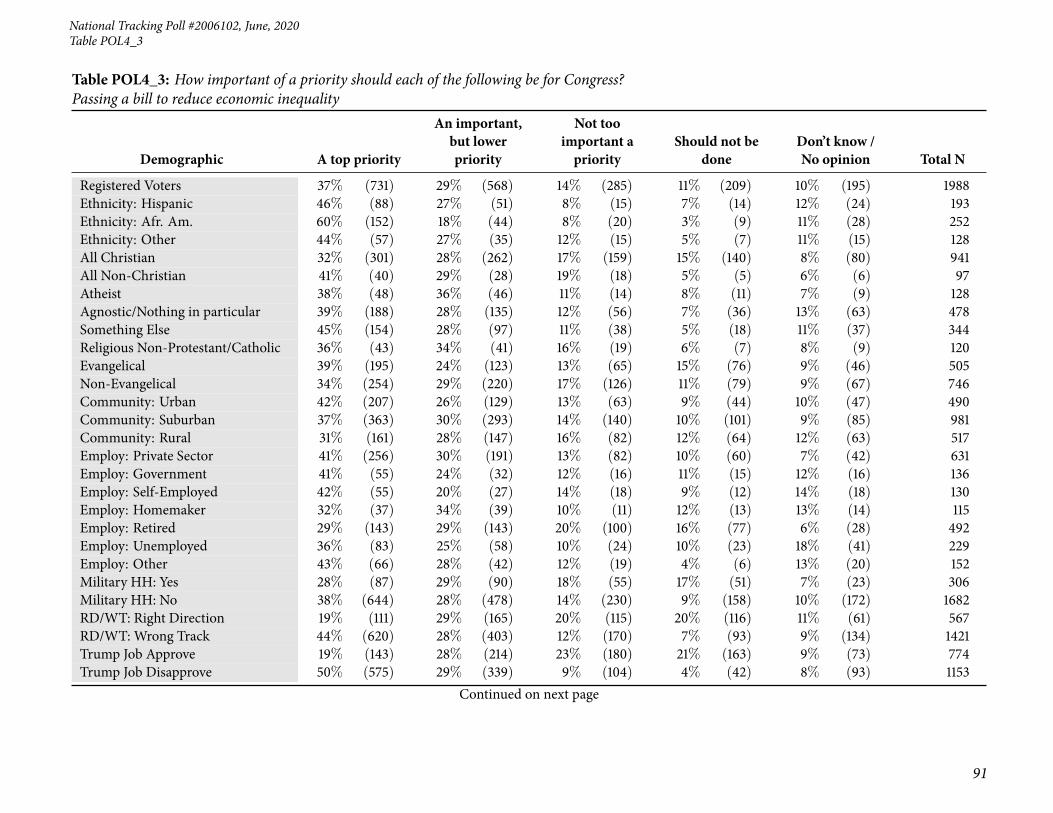
21 Table POL4_3: How important of a priority should each of the following be for Congress? Passing abill to reduce economic inequality . . . . . . . . . . . . . . . . . . . . . . . . . . . . . . . . . . . . . 90
2
Page 3
National Tracking Poll #2006102, June, 2020
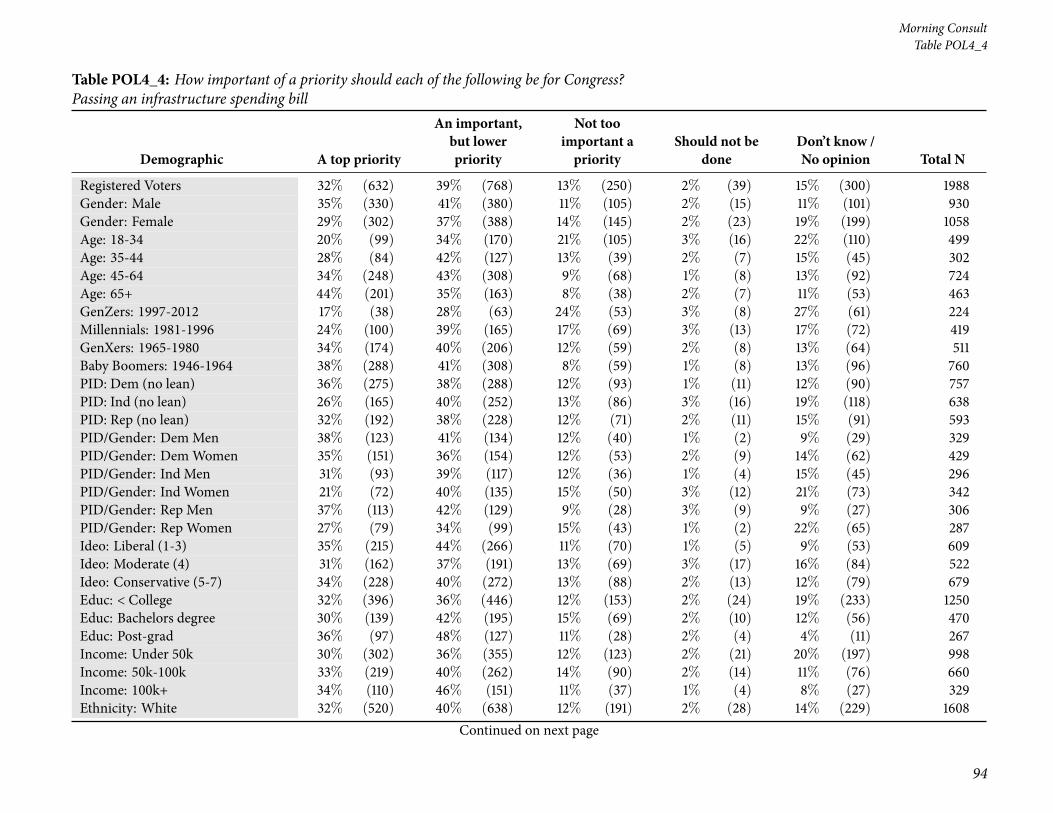
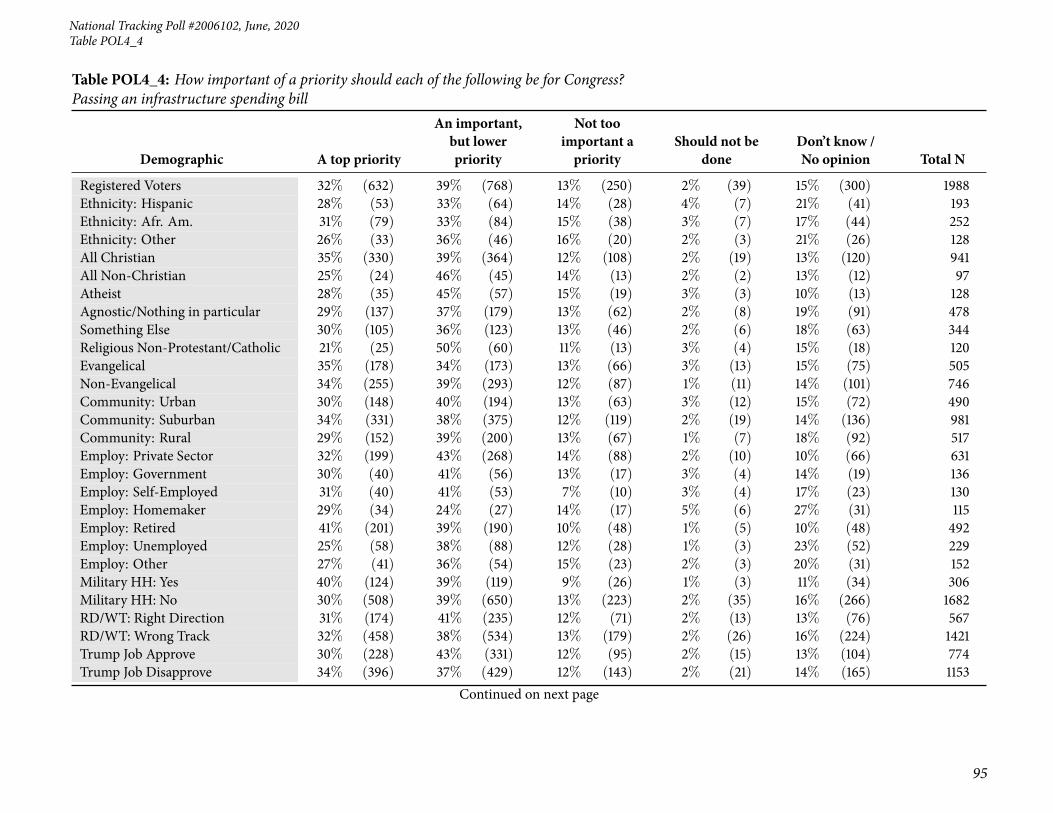
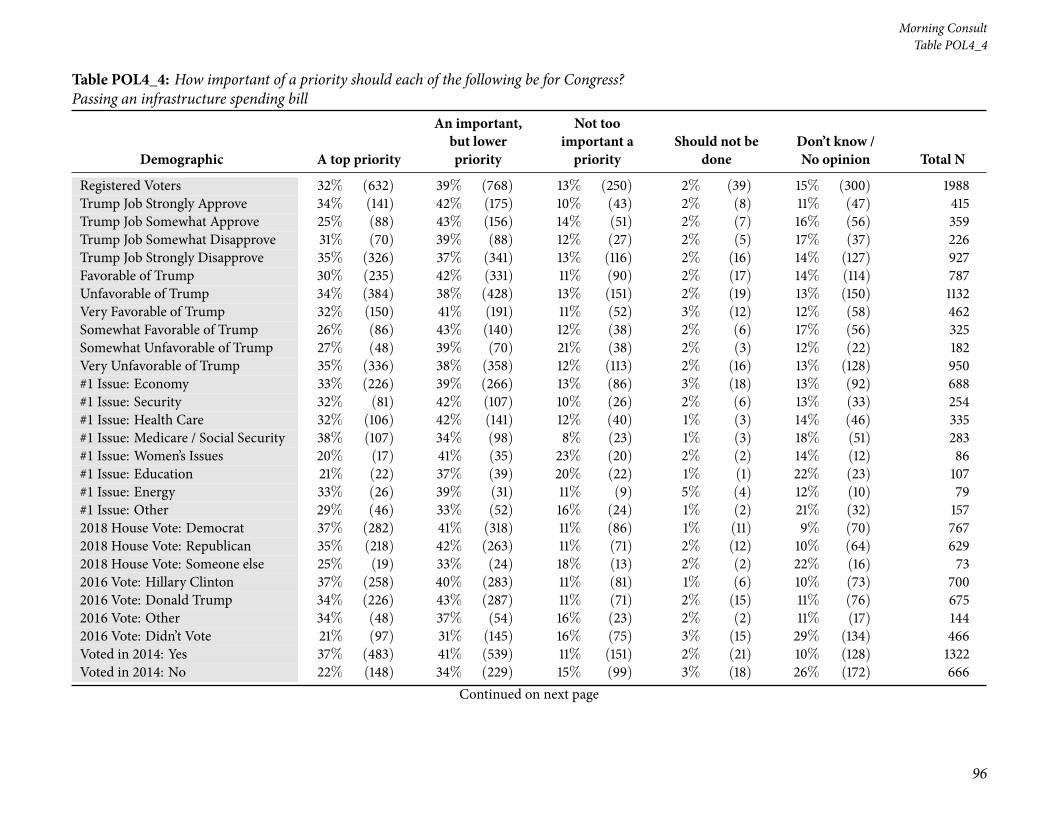
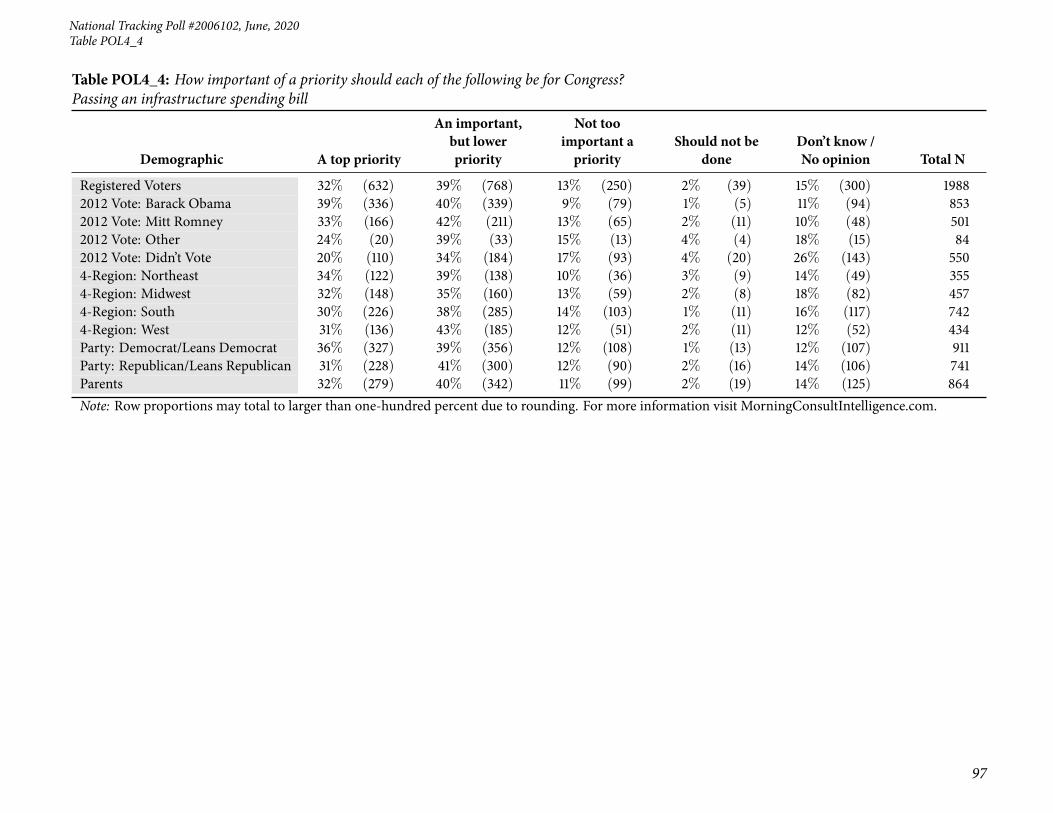
22 Table POL4_4: How important of a priority should each of the following be for Congress? Passing aninfrastructure spending bill . . . . . . . . . . . . . . . . . . . . . . . . . . . . . . . . . . . . . . . . 94
23 Table POL4_5: How important of a priority should each of the following be for Congress? Passing animmigration reform bill . . . . . . . . . . . . . . . . . . . . . . . . . . . . . . . . . . . . . . . . . . 98
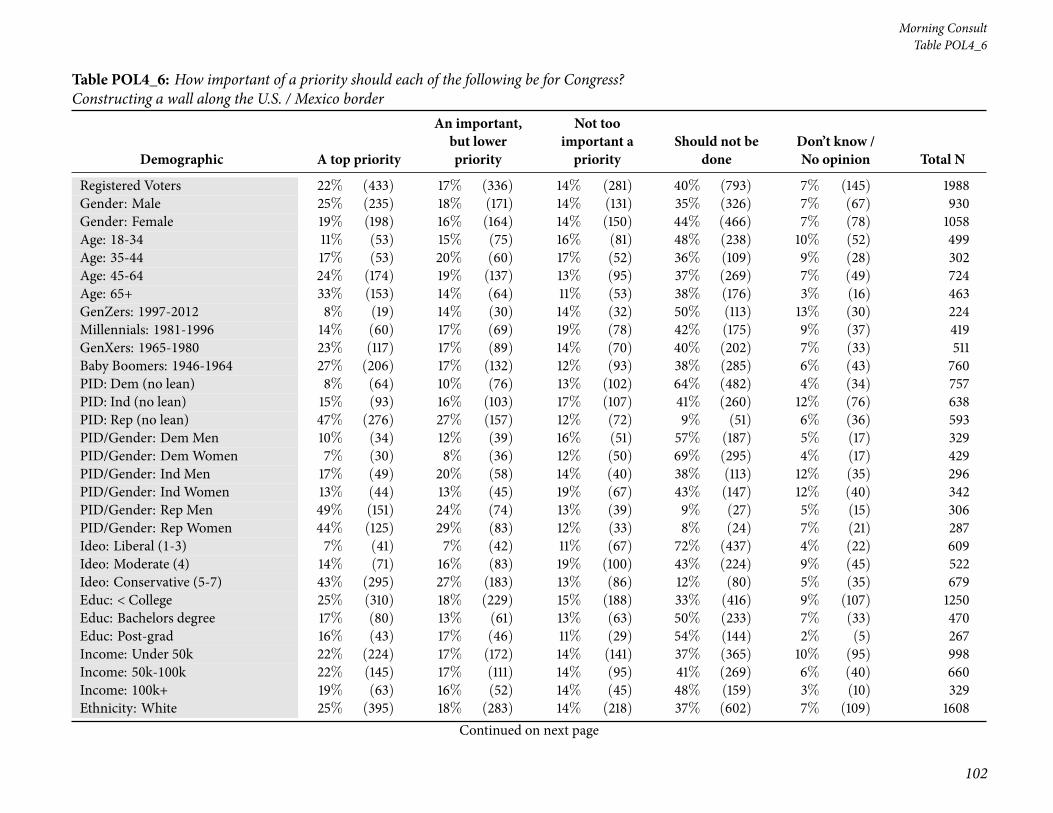
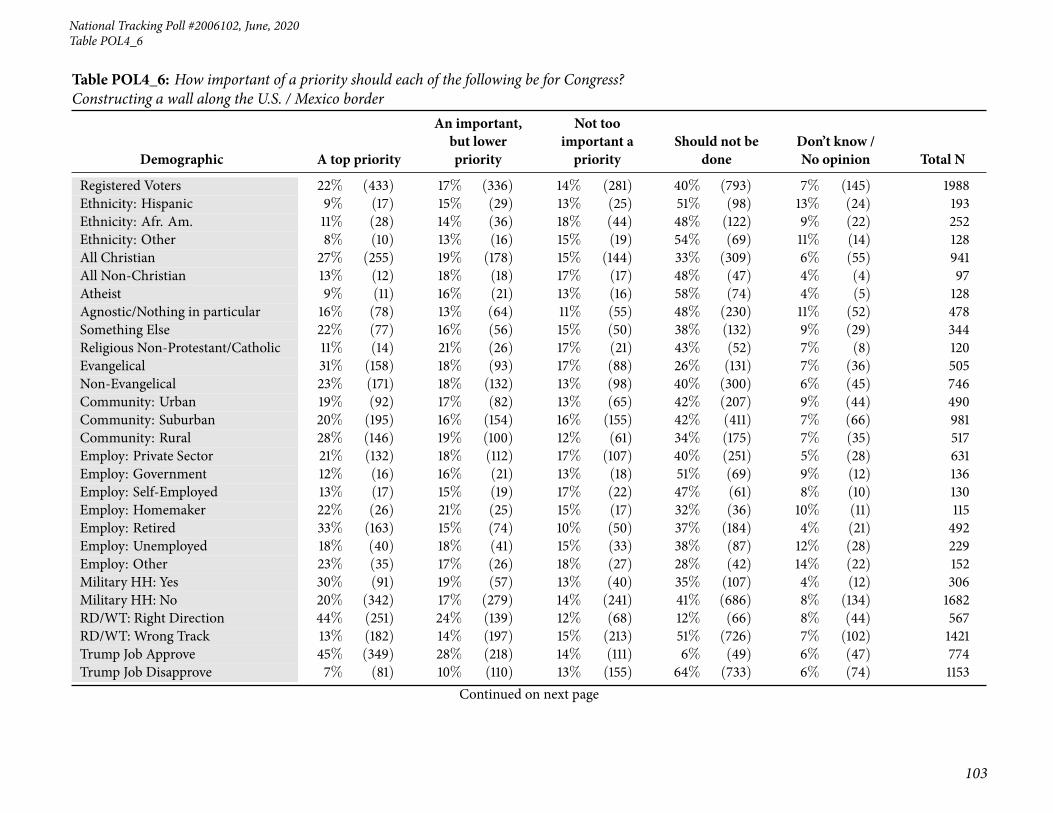
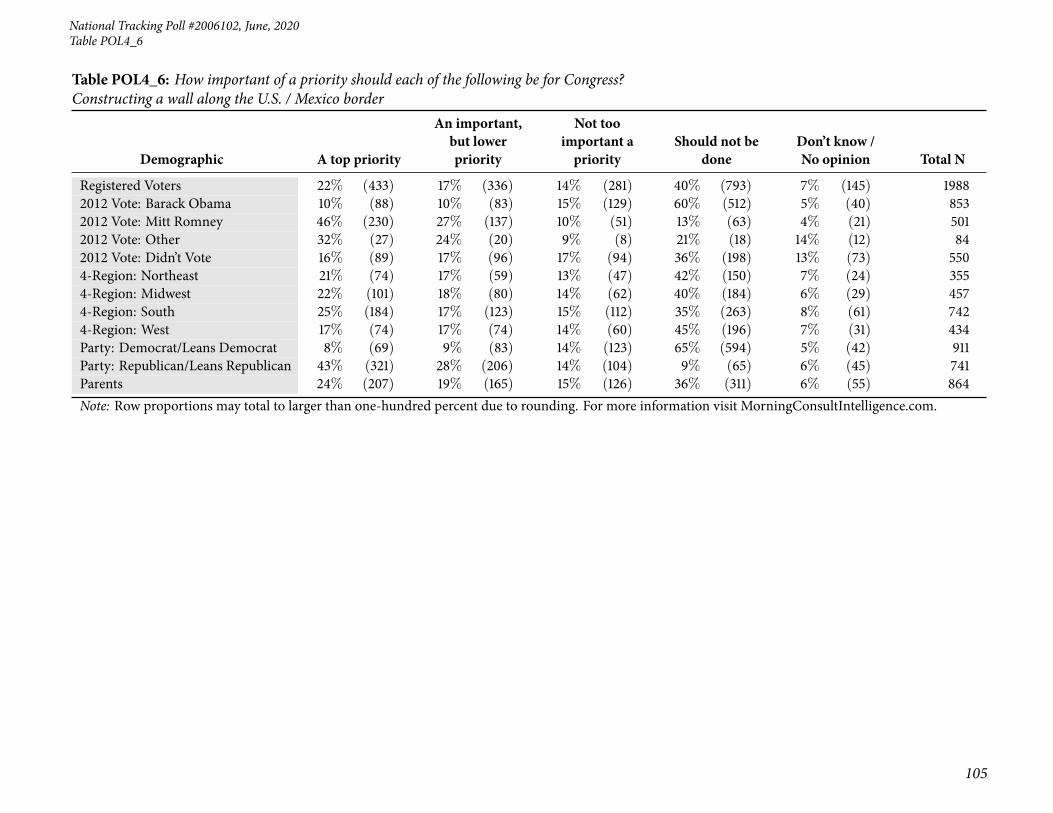
24 Table POL4_6: How important of a priority should each of the following be for Congress? Constructinga wall along the U.S. / Mexico border . . . . . . . . . . . . . . . . . . . . . . . . . . . . . . . . . . . 102
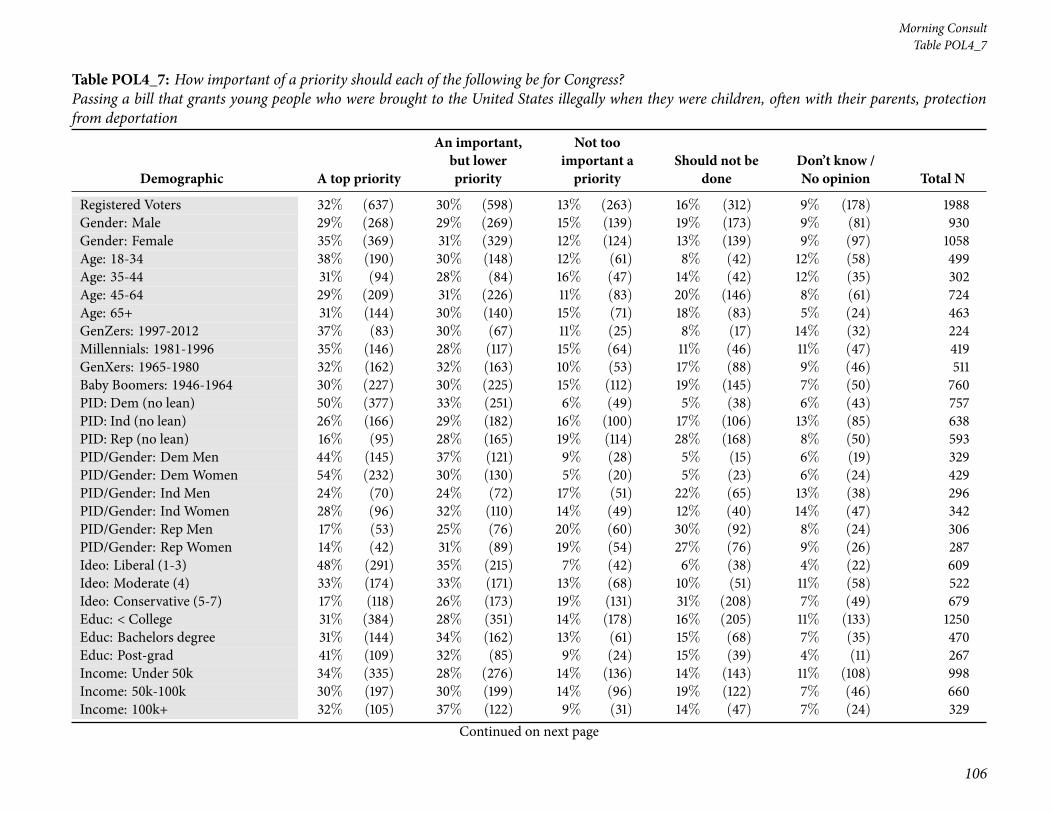
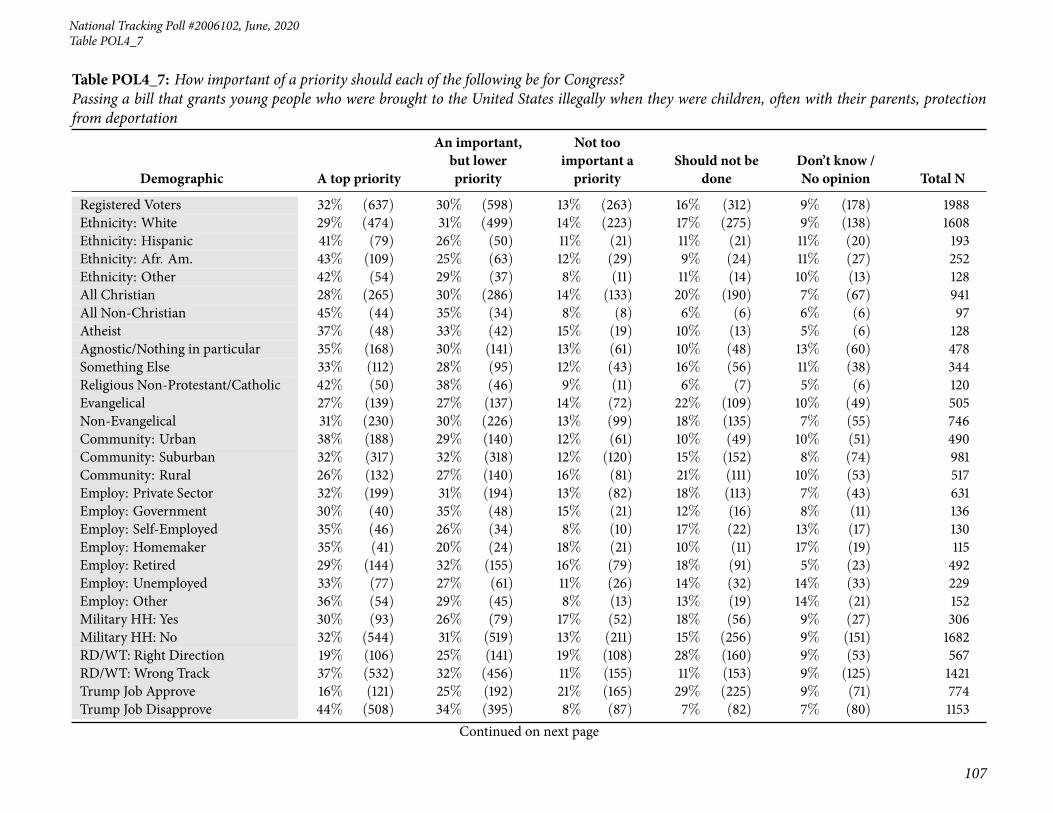
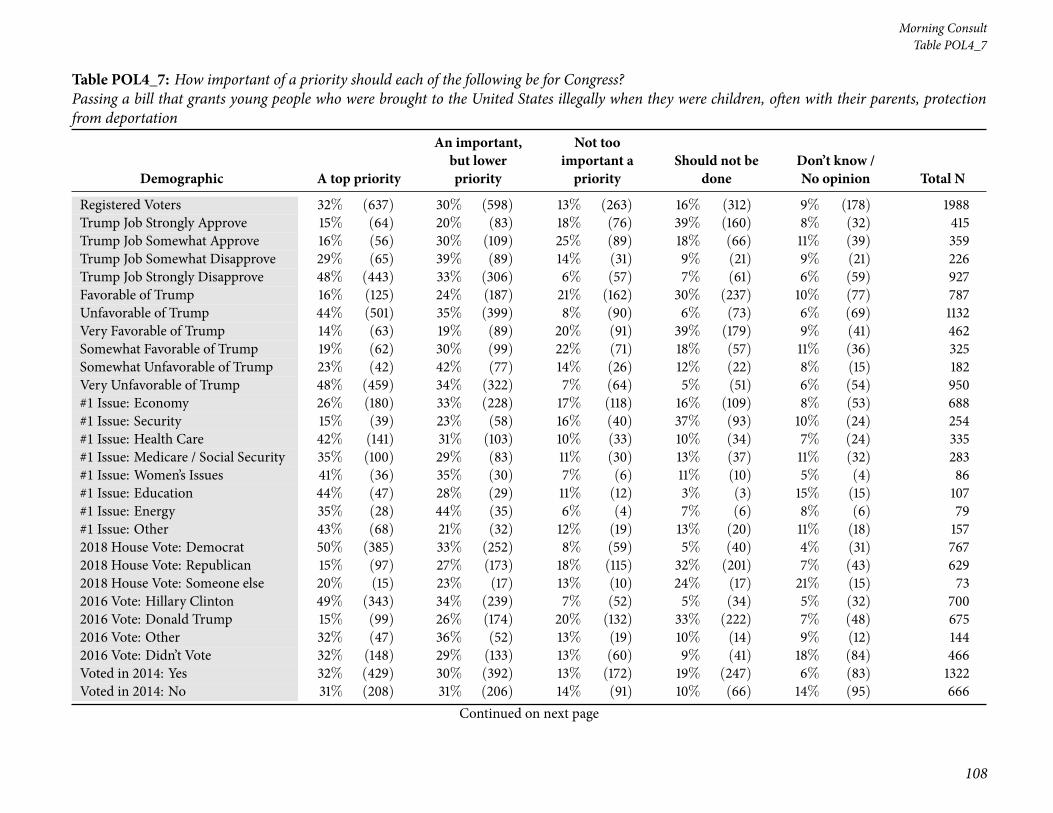
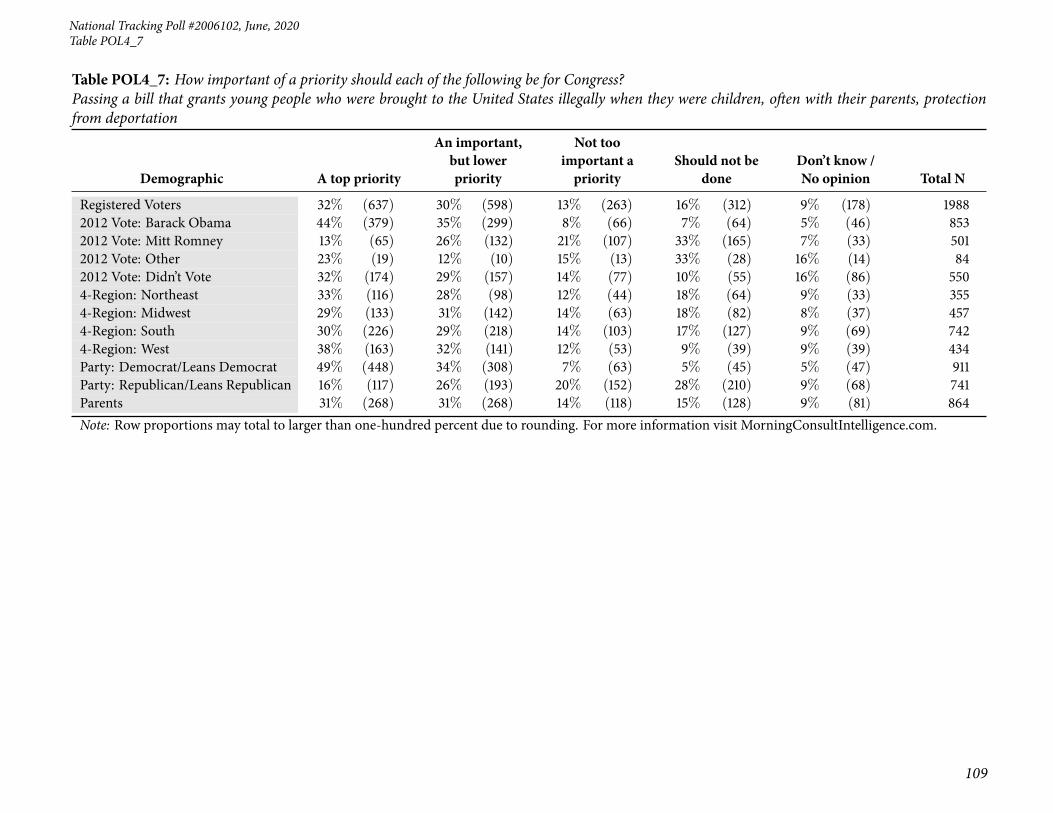
25 Table POL4_7: How important of a priority should each of the following be for Congress? Passing abill that grants young people who were brought to the United States illegally when they were children,often with their parents, protection from deportation . . . . . . . . . . . . . . . . . . . . . . . . . . . 106
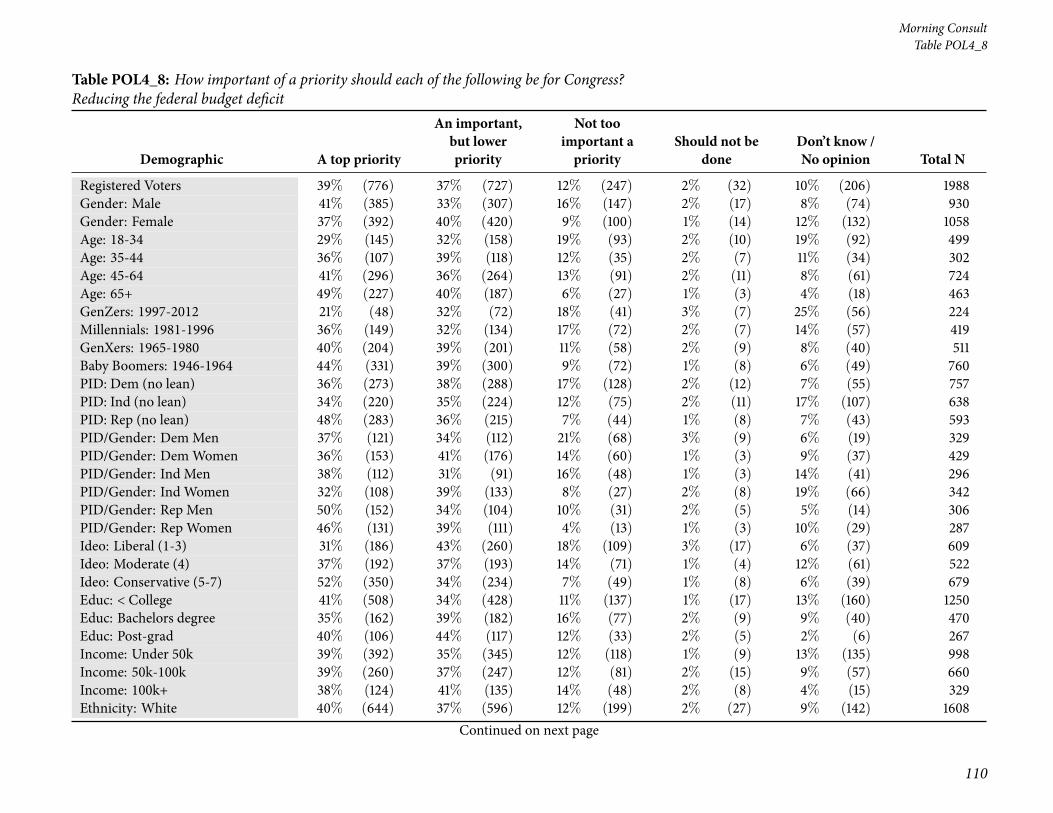
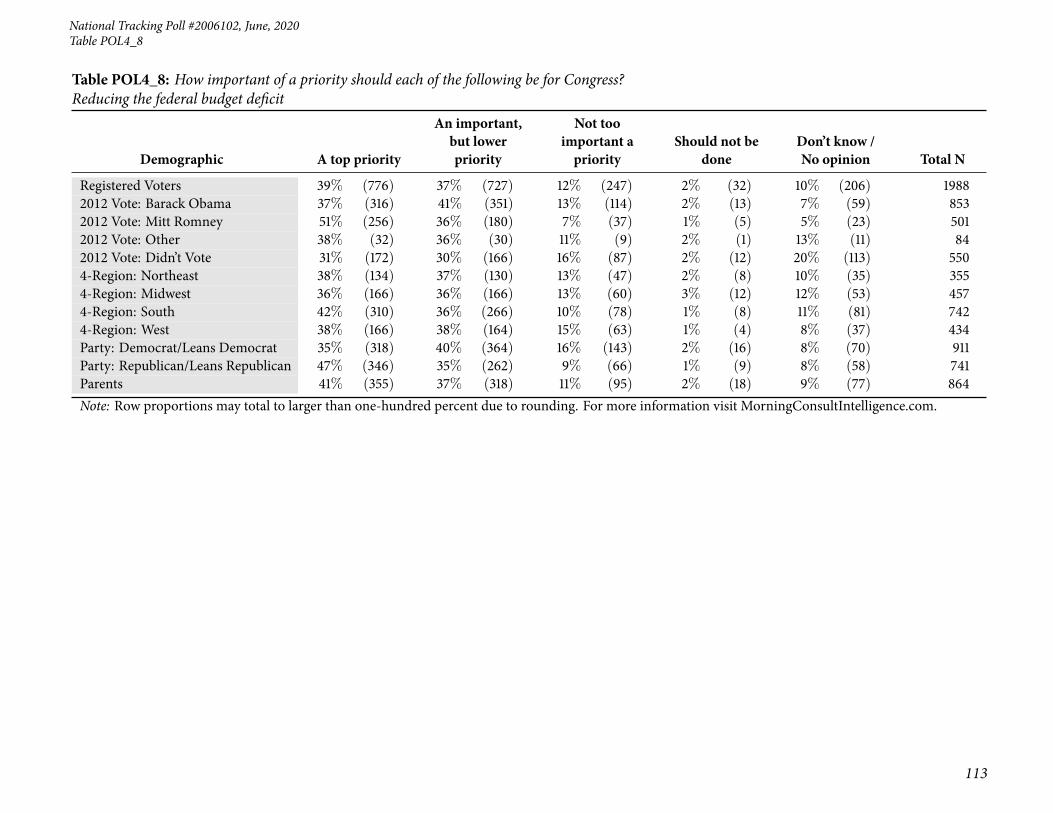
26 Table POL4_8: How important of a priority should each of the following be for Congress? Reducingthe federal budget deficit . . . . . . . . . . . . . . . . . . . . . . . . . . . . . . . . . . . . . . . . . . 110
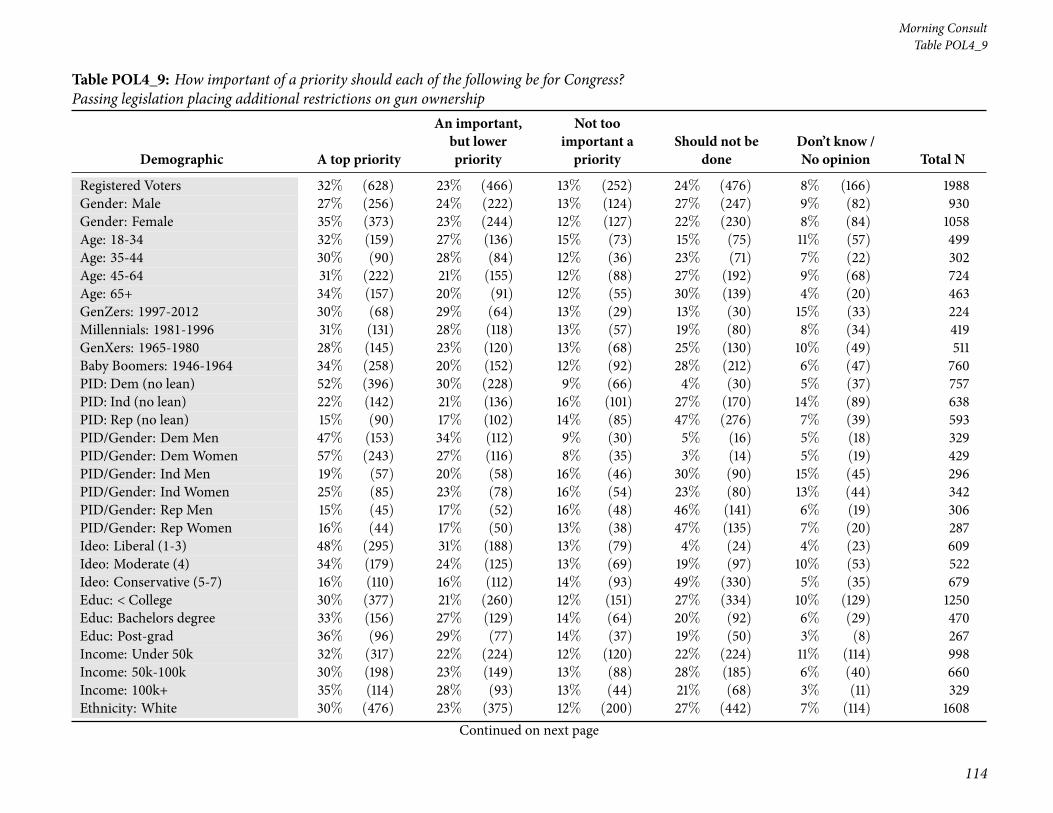
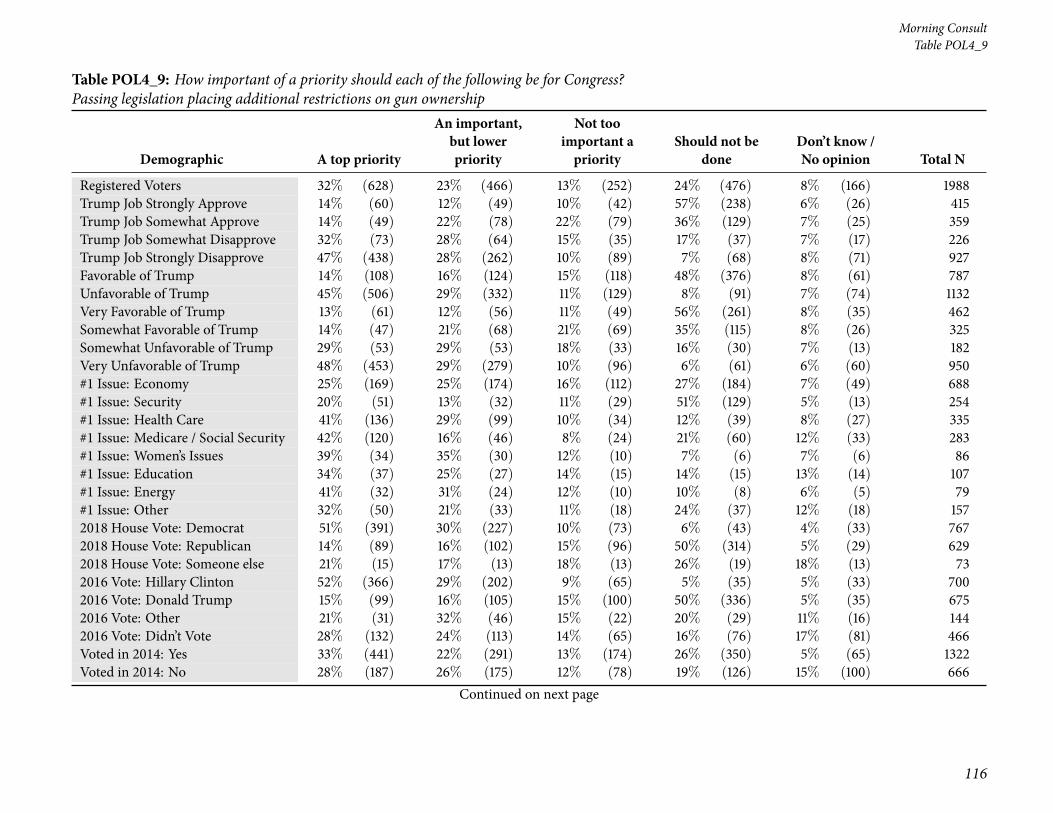
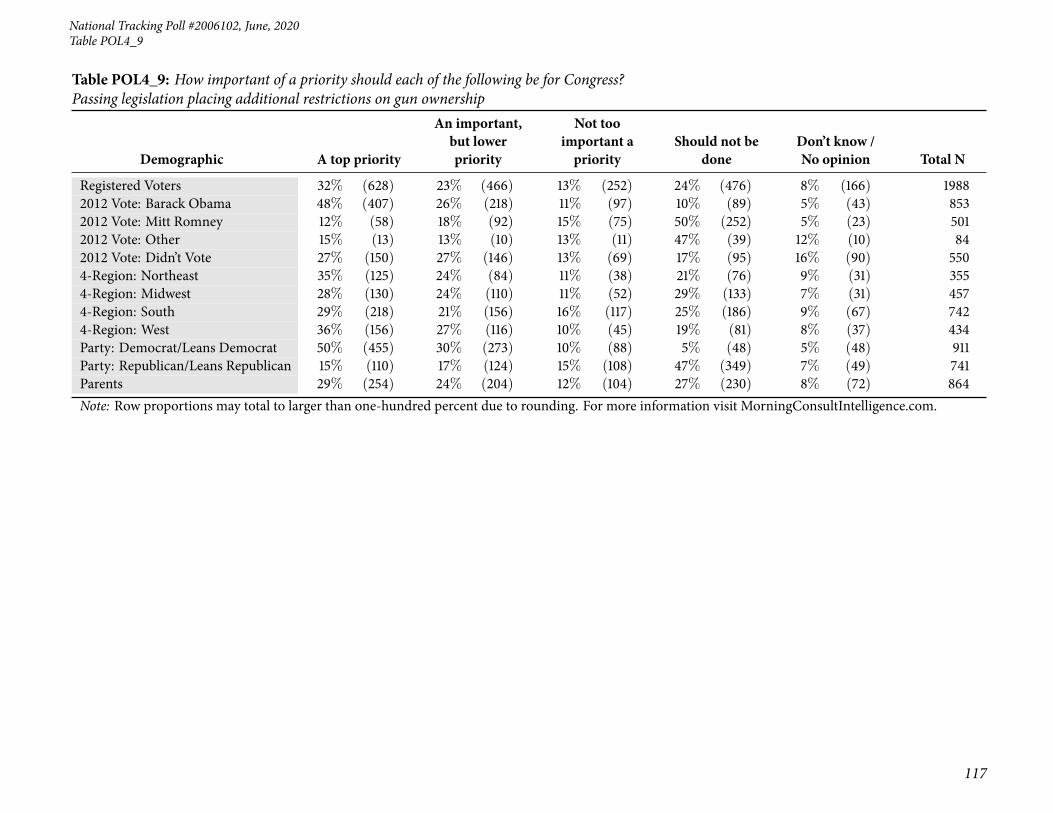
27 Table POL4_9: How important of a priority should each of the following be for Congress? Passinglegislation placing additional restrictions on gun ownership . . . . . . . . . . . . . . . . . . . . . . . 114
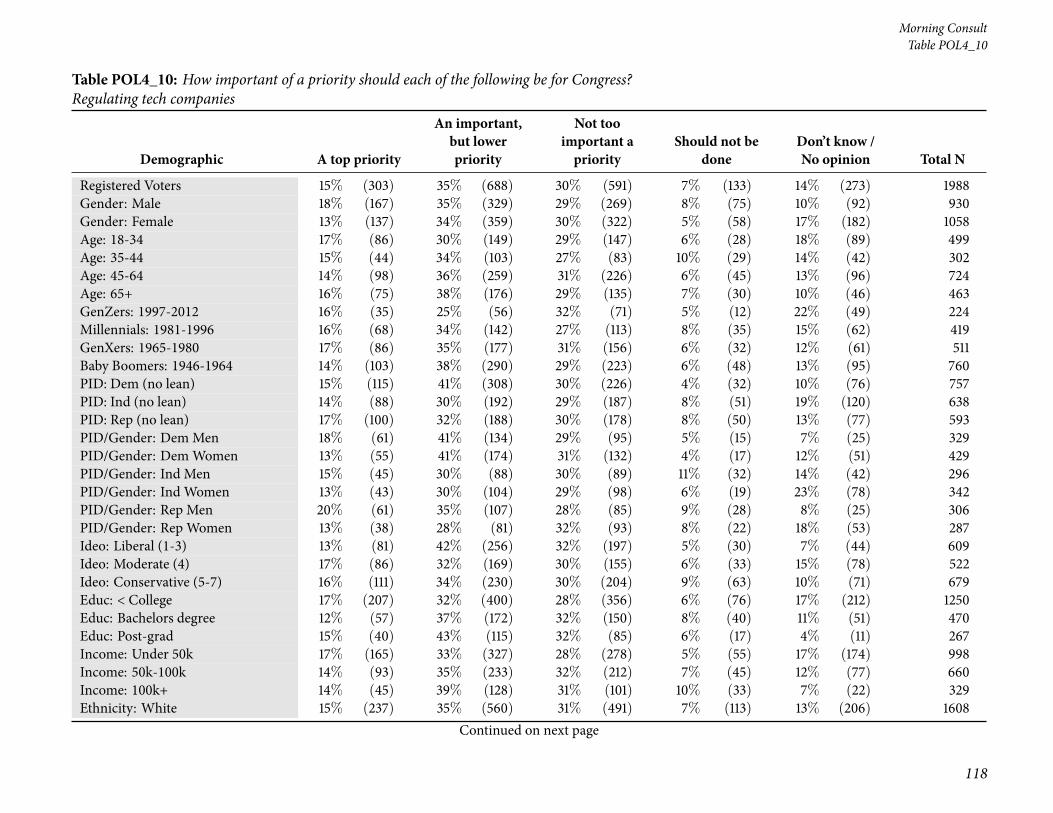
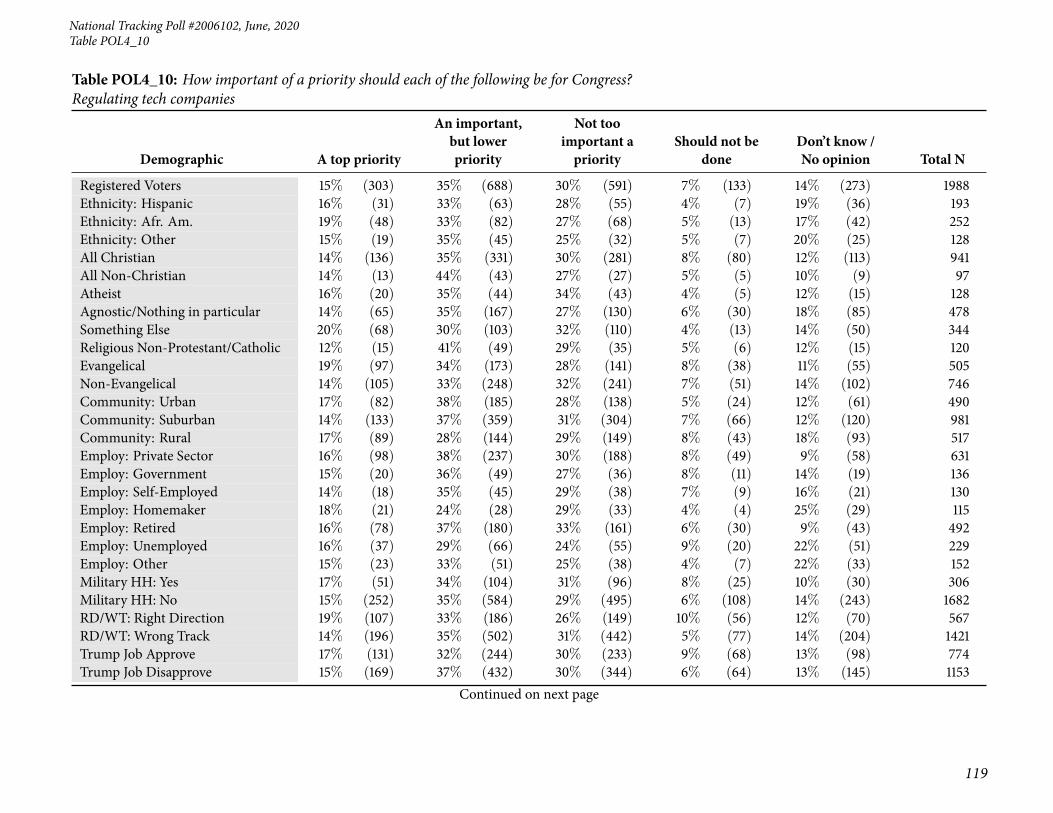
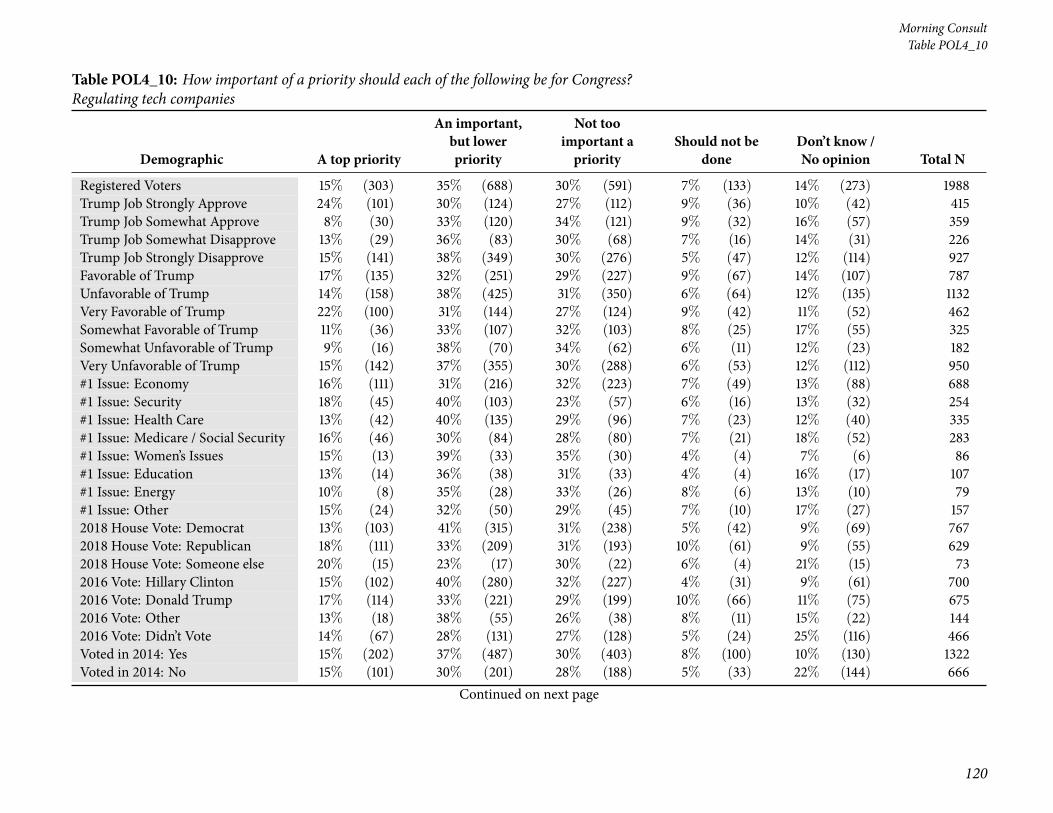
28 Table POL4_10: How important of a priority should each of the following be for Congress? Regulatingtech companies . . . . . . . . . . . . . . . . . . . . . . . . . . . . . . . . . . . . . . . . . . . . . . . 118
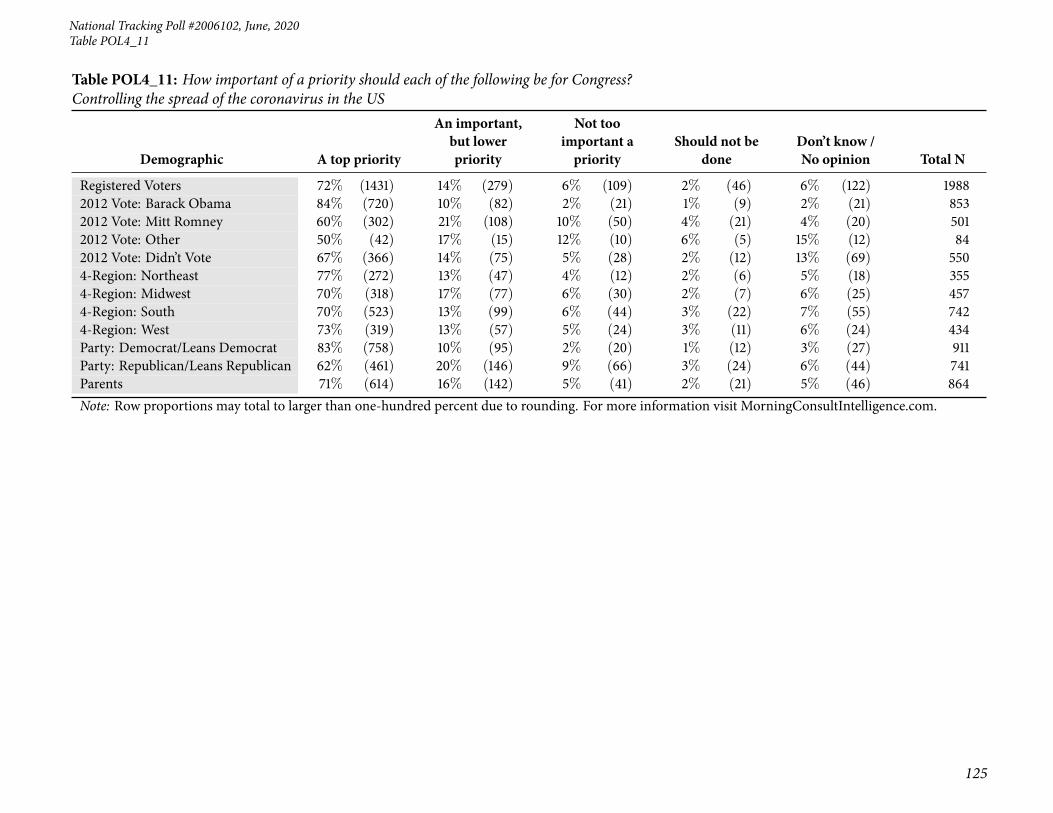
29 Table POL4_11: How important of a priority should each of the following be for Congress? Controllingthe spread of the coronavirus in the US . . . . . . . . . . . . . . . . . . . . . . . . . . . . . . . . . . 122
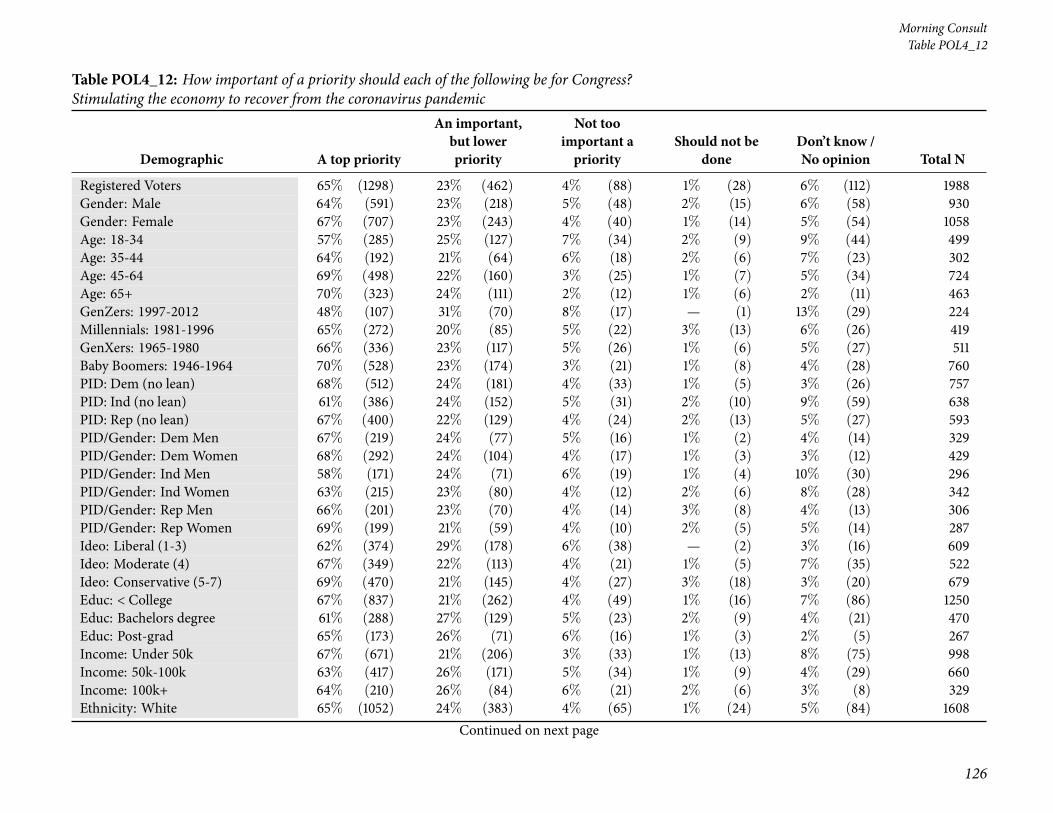
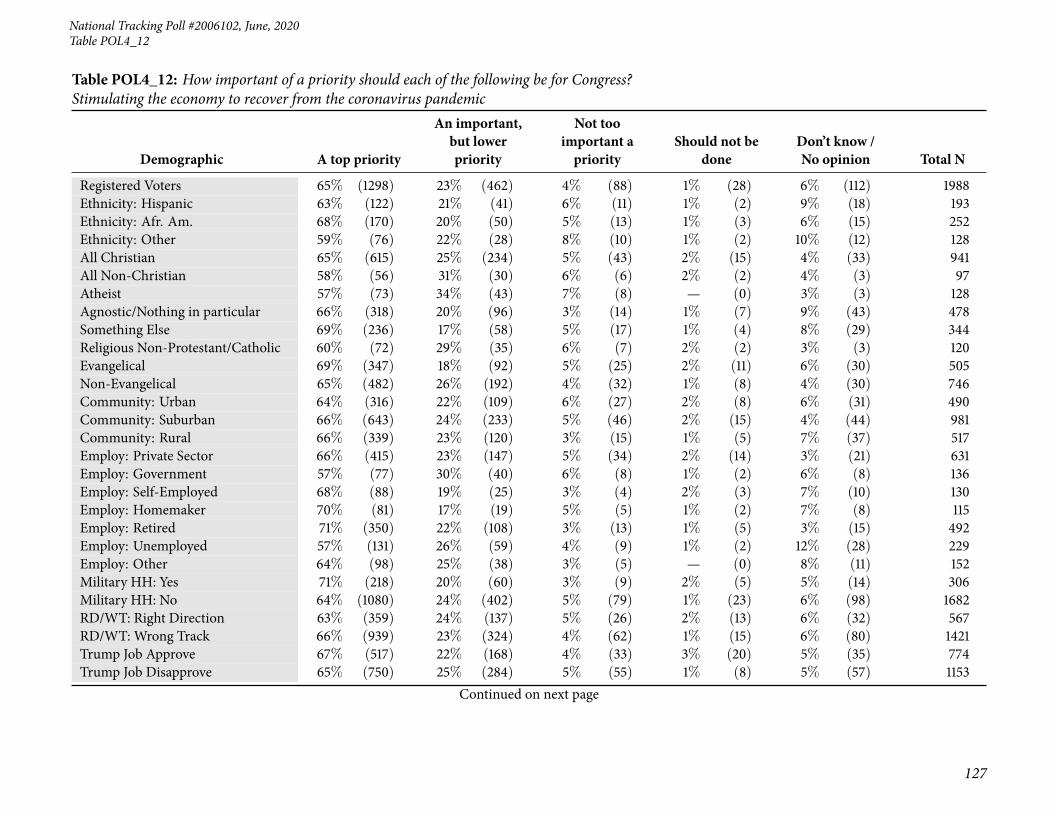
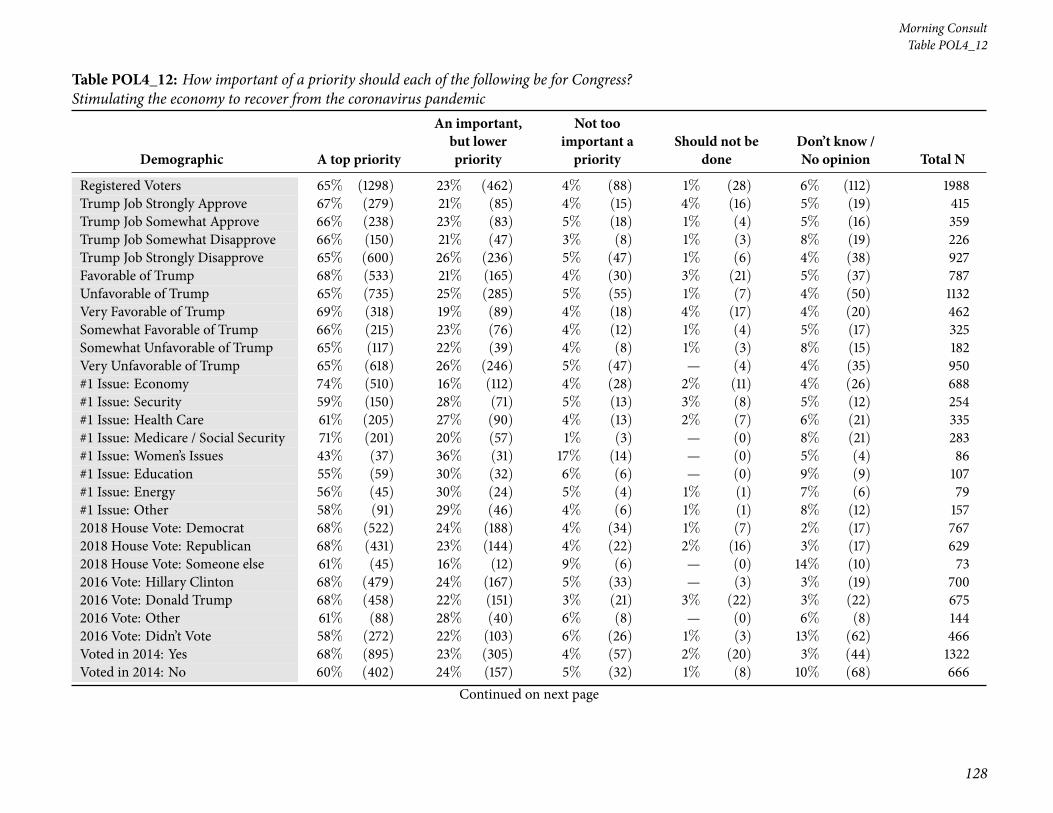
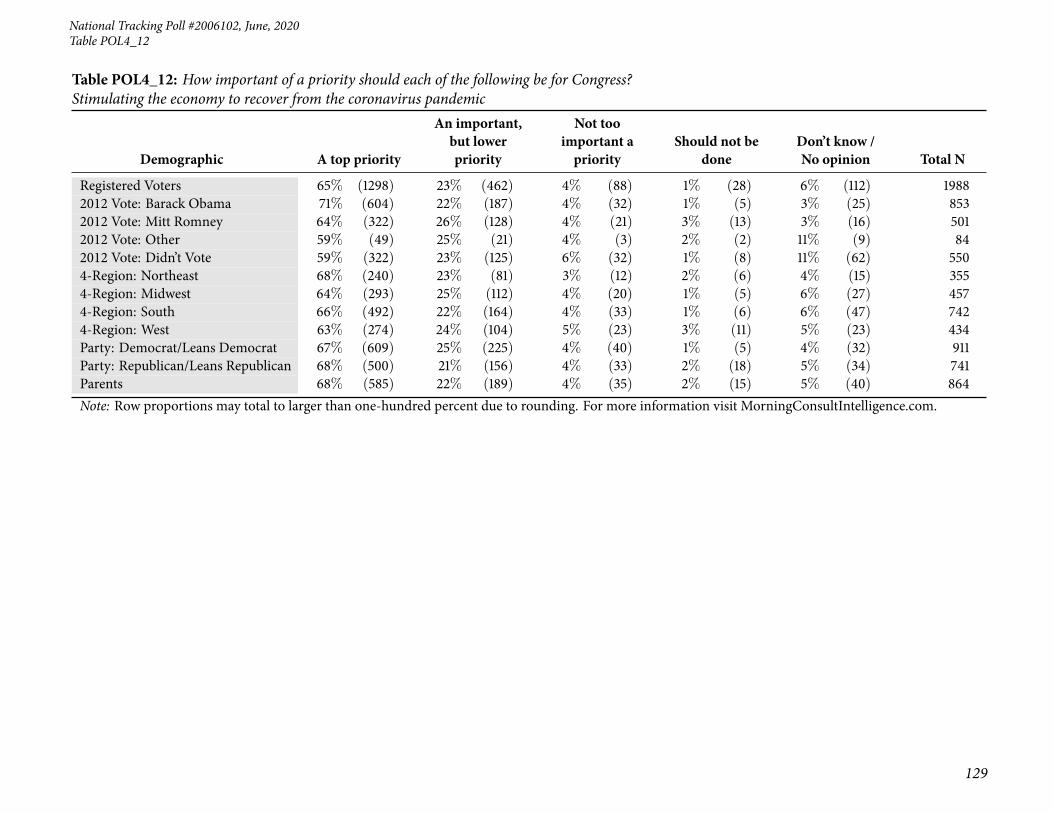
30 Table POL4_12: How important of a priority should each of the following be for Congress? Stimulatingthe economy to recover from the coronavirus pandemic . . . . . . . . . . . . . . . . . . . . . . . . . . 126
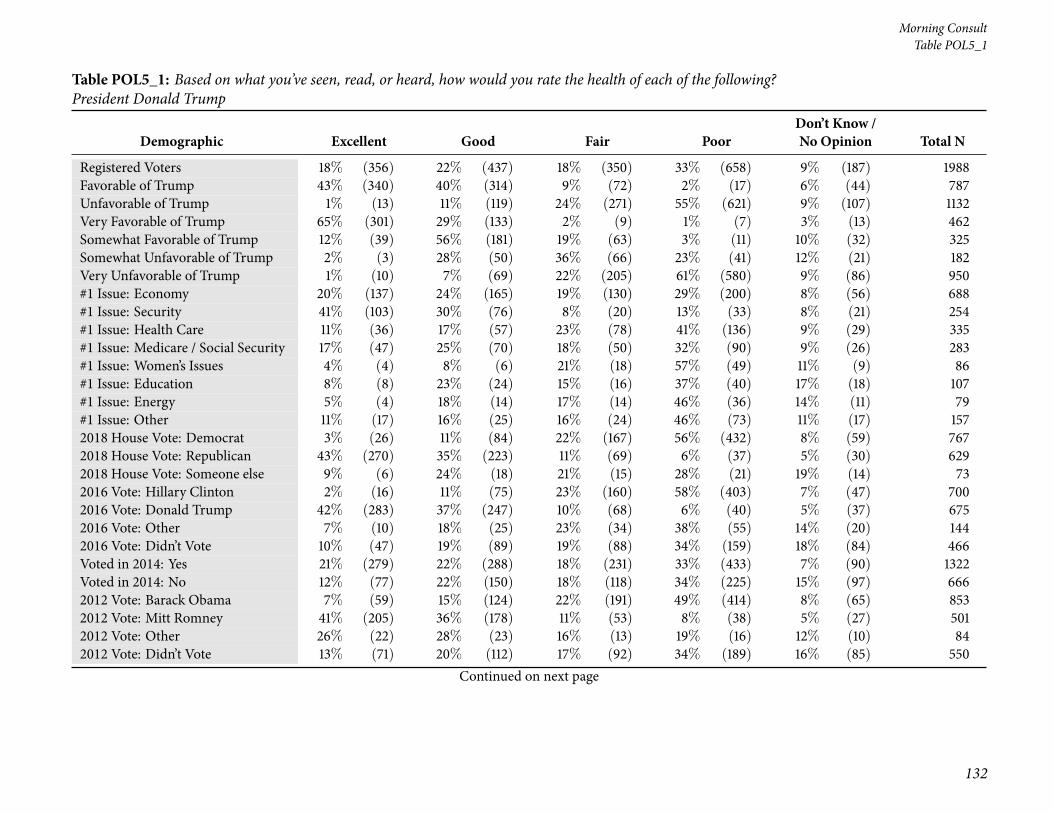
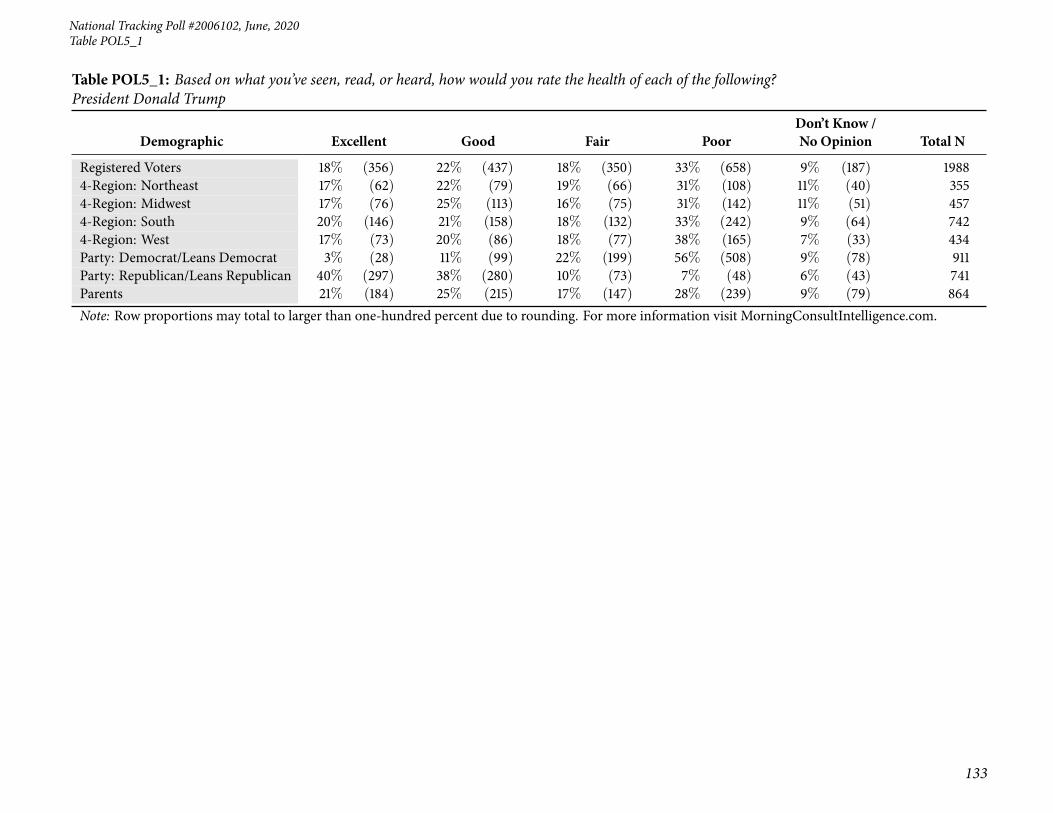
31 Table POL5_1: Based on what you’ve seen, read, or heard, how would you rate the health of each ofthe following? President Donald Trump . . . . . . . . . . . . . . . . . . . . . . . . . . . . . . . . . . 130
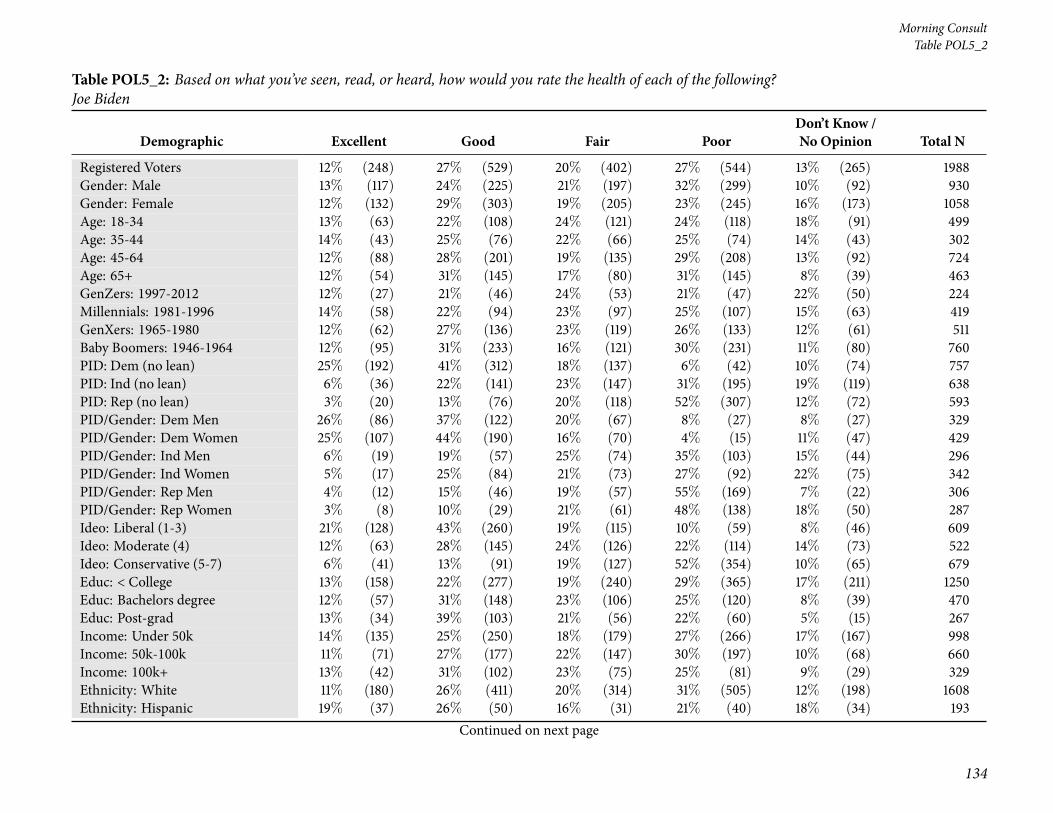
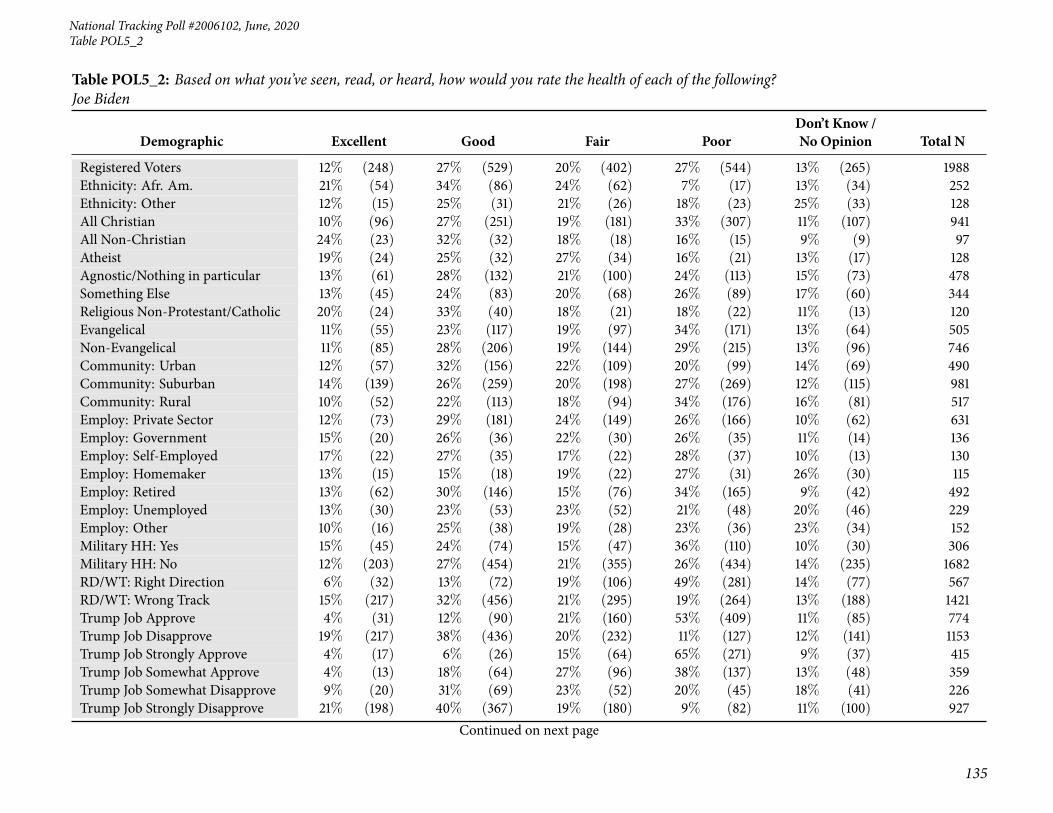
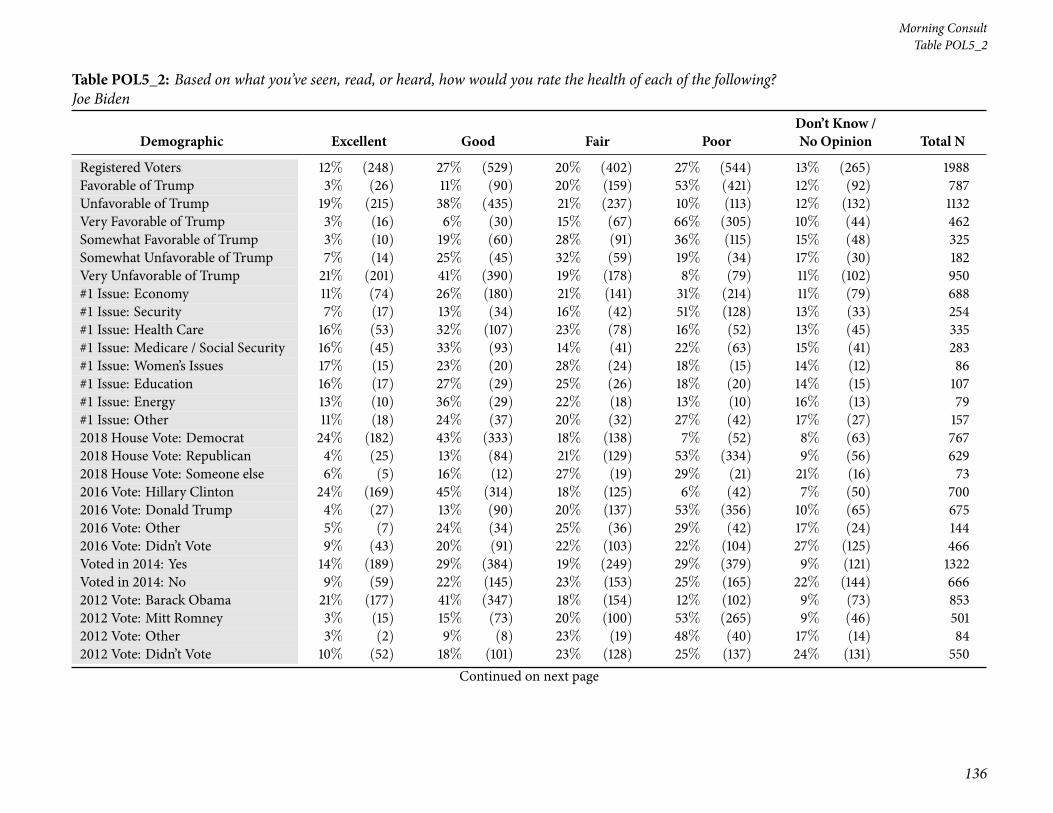
32 Table POL5_2: Based on what you’ve seen, read, or heard, how would you rate the health of each ofthe following? Joe Biden . . . . . . . . . . . . . . . . . . . . . . . . . . . . . . . . . . . . . . . . . . 134
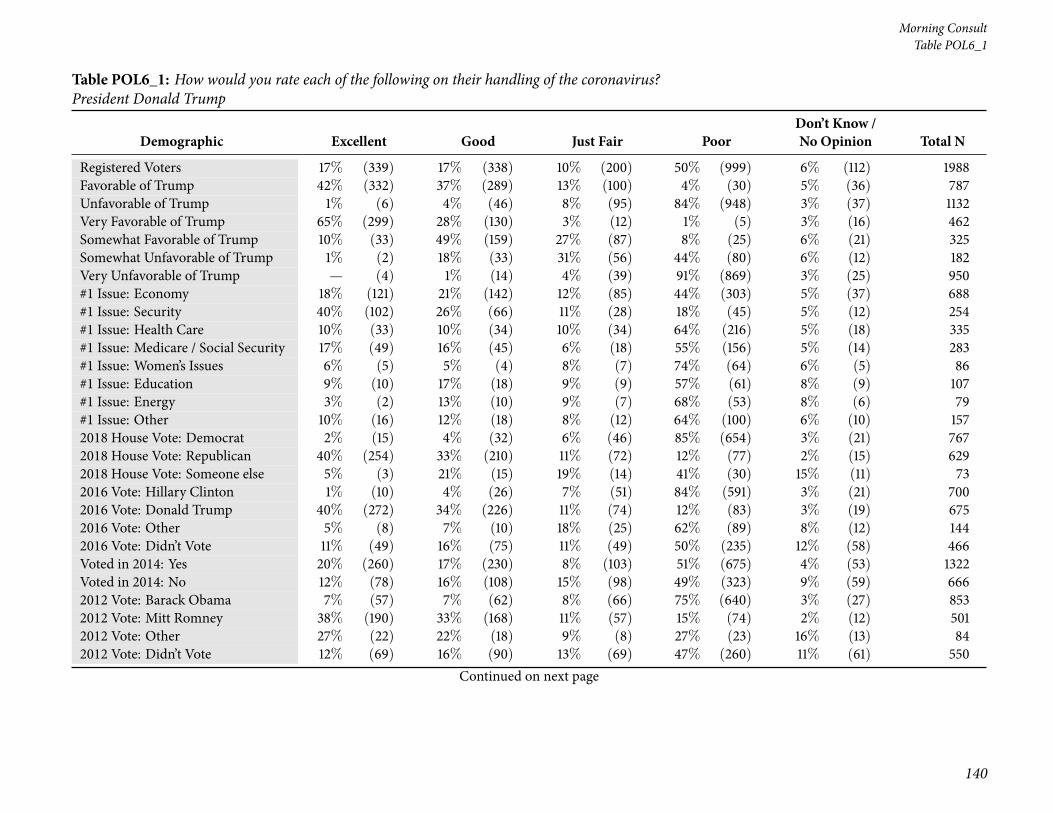
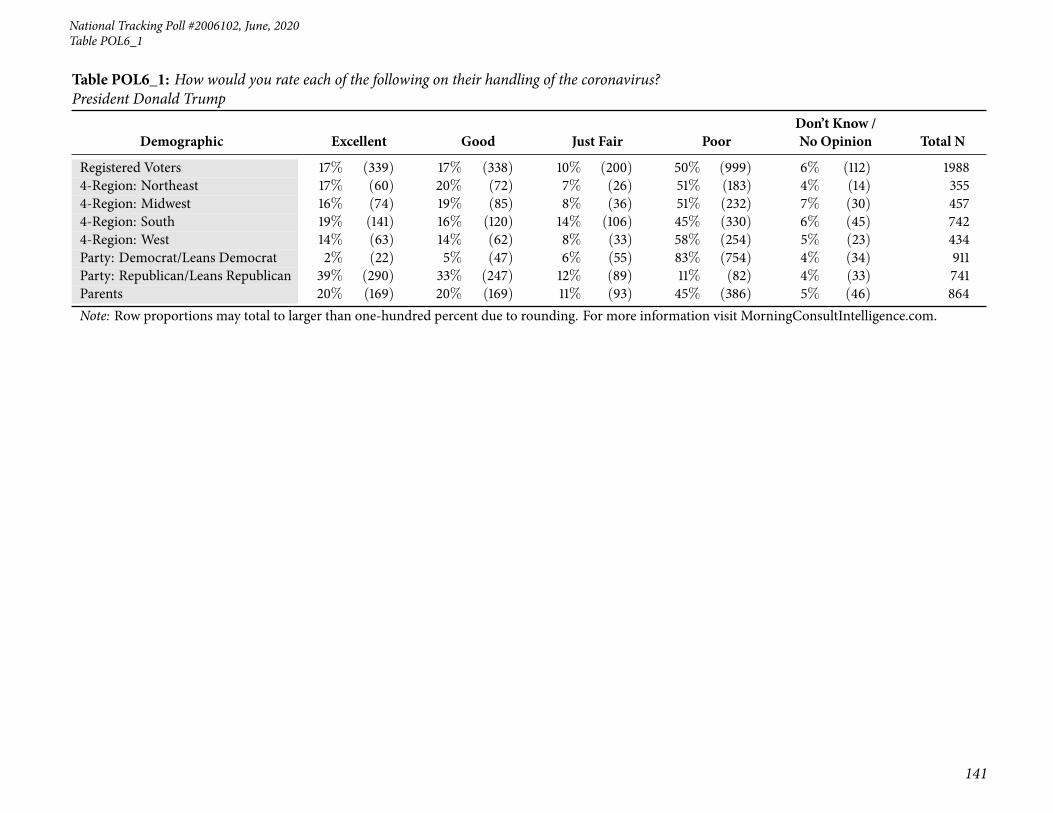
33 Table POL6_1: How would you rate each of the following on their handling of the coronavirus? Presi-dent Donald Trump . . . . . . . . . . . . . . . . . . . . . . . . . . . . . . . . . . . . . . . . . . . . 138
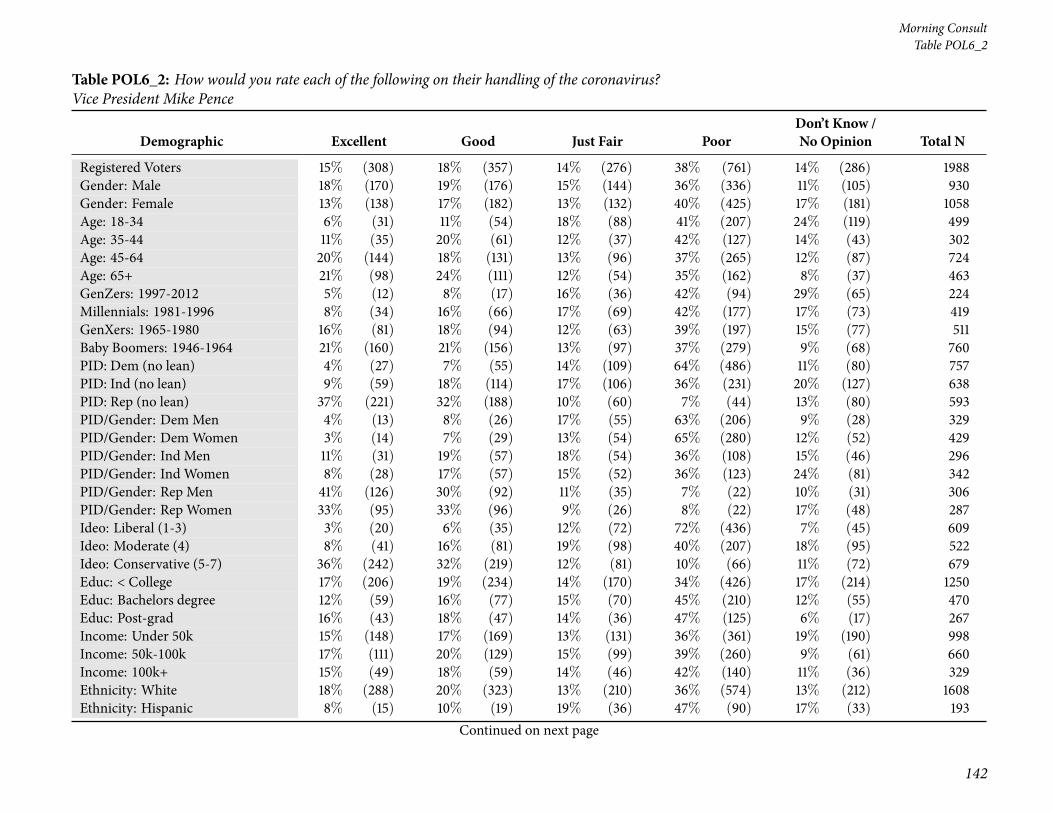
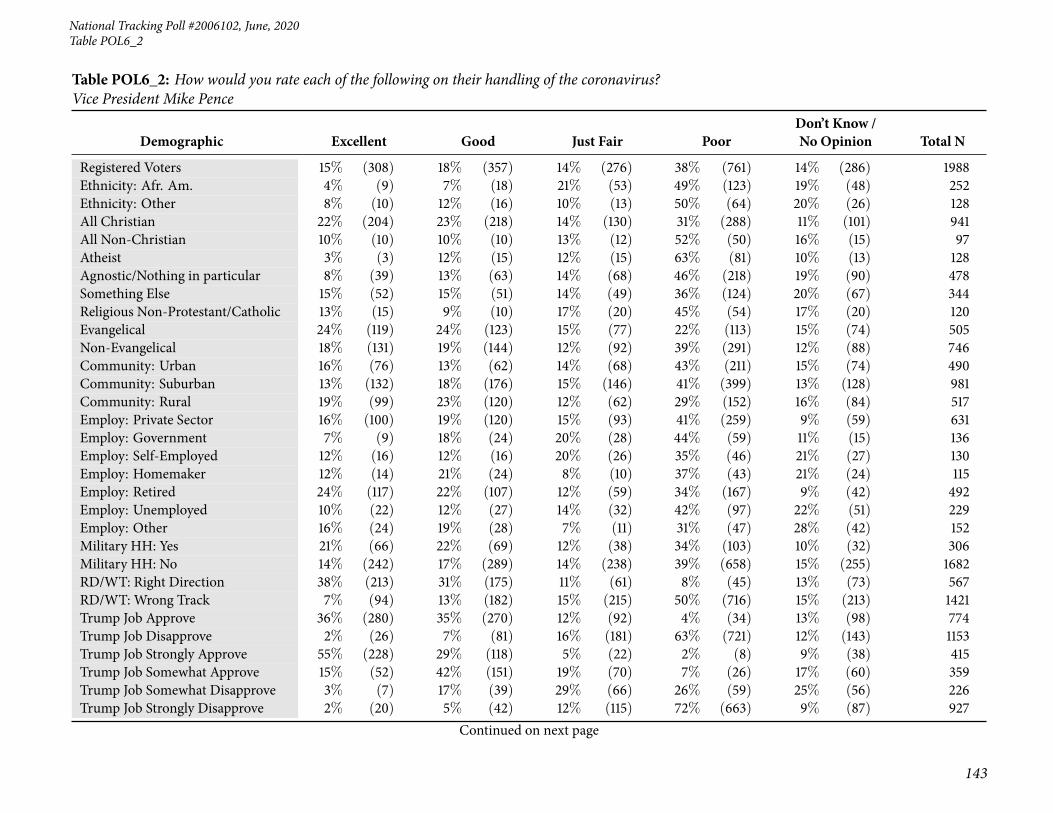
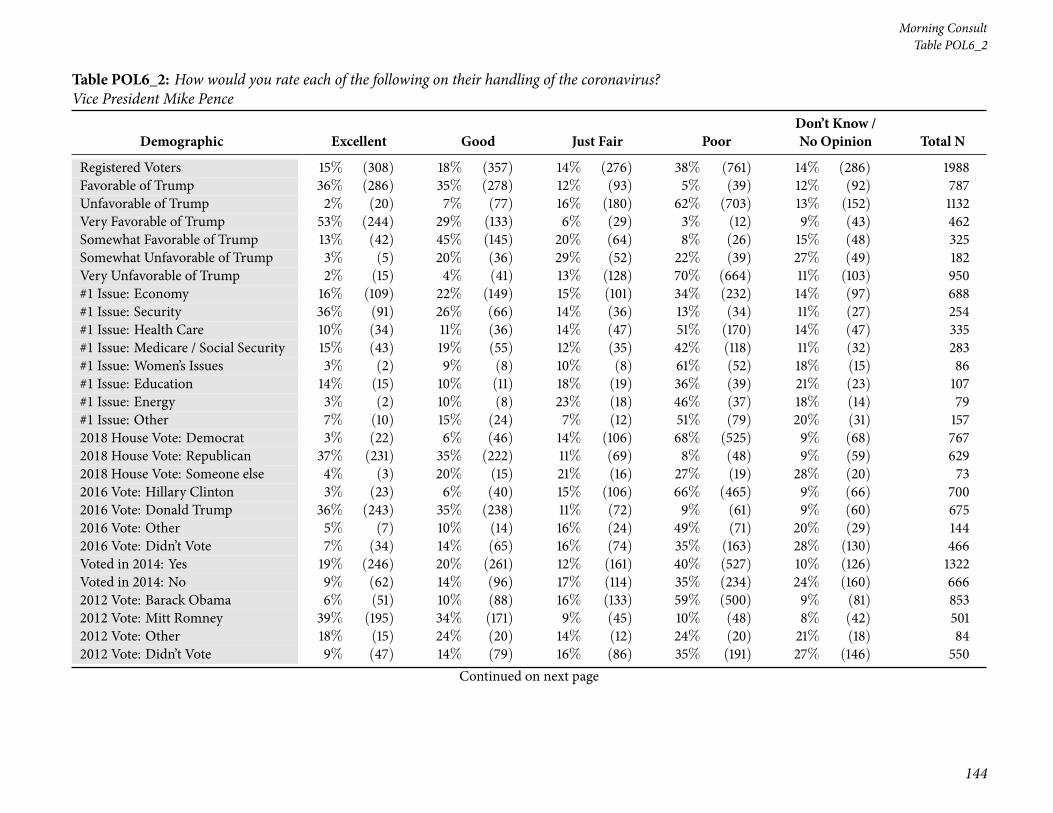
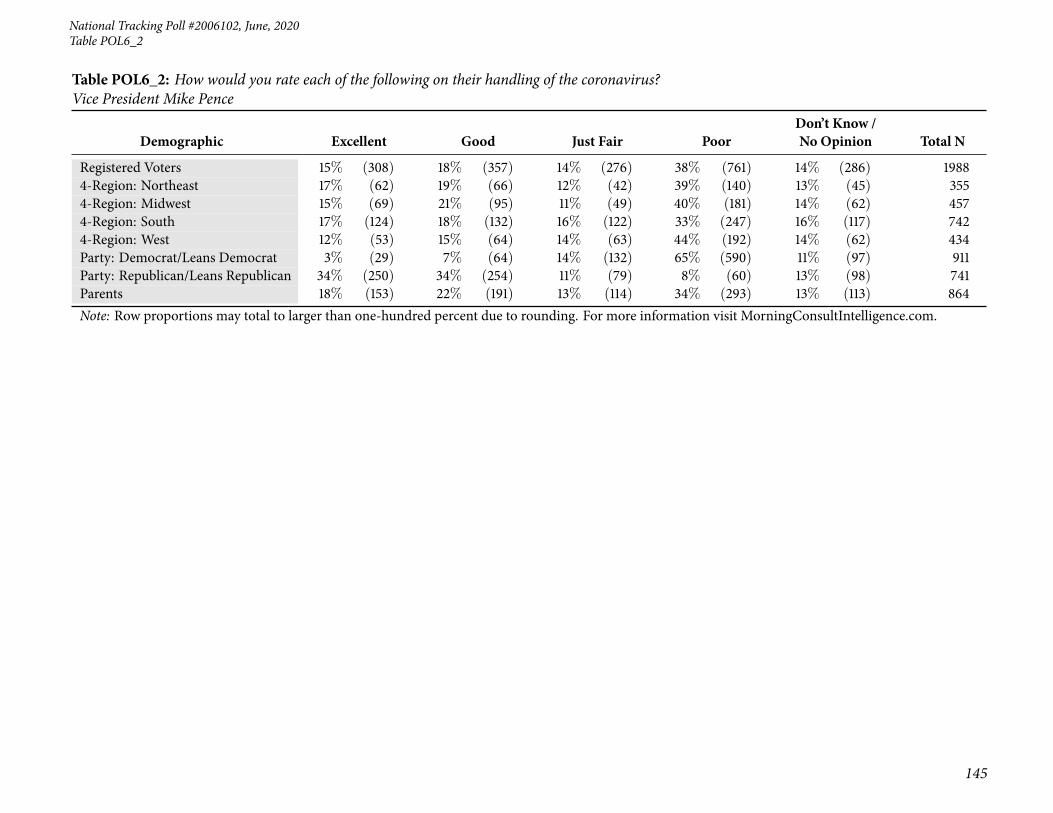
34 Table POL6_2: How would you rate each of the following on their handling of the coronavirus? VicePresident Mike Pence . . . . . . . . . . . . . . . . . . . . . . . . . . . . . . . . . . . . . . . . . . . 142
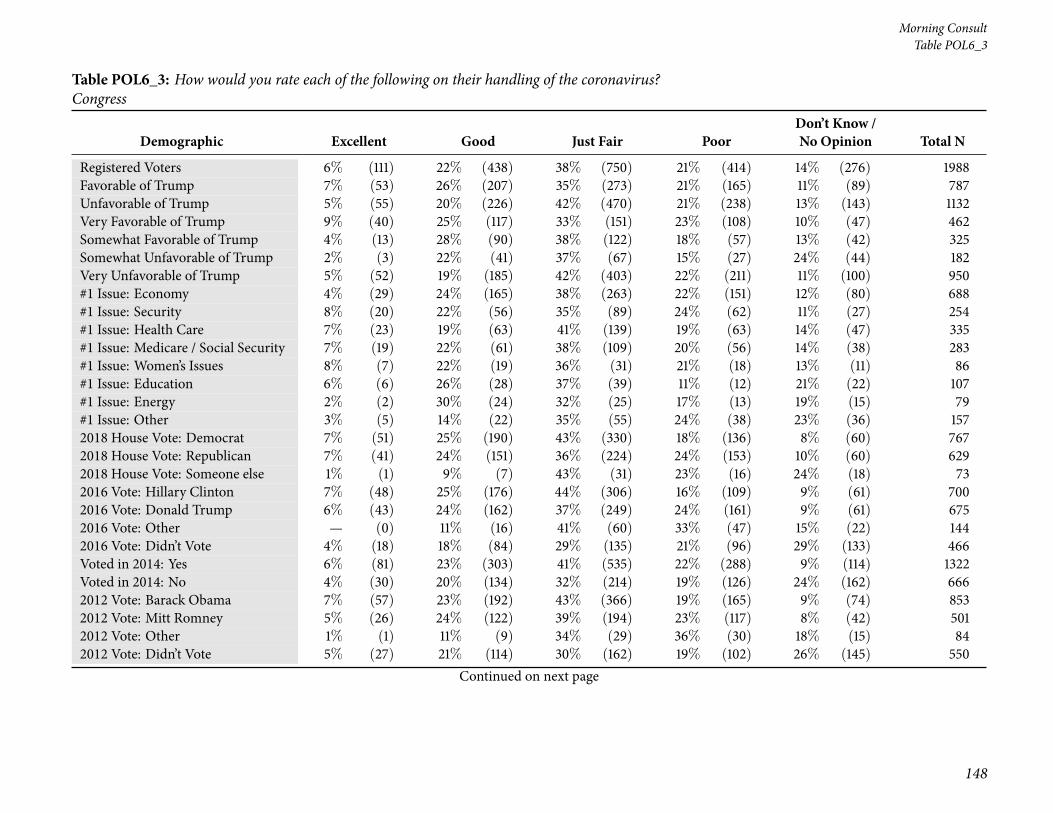
35 Table POL6_3: How would you rate each of the following on their handling of the coronavirus? Congress146
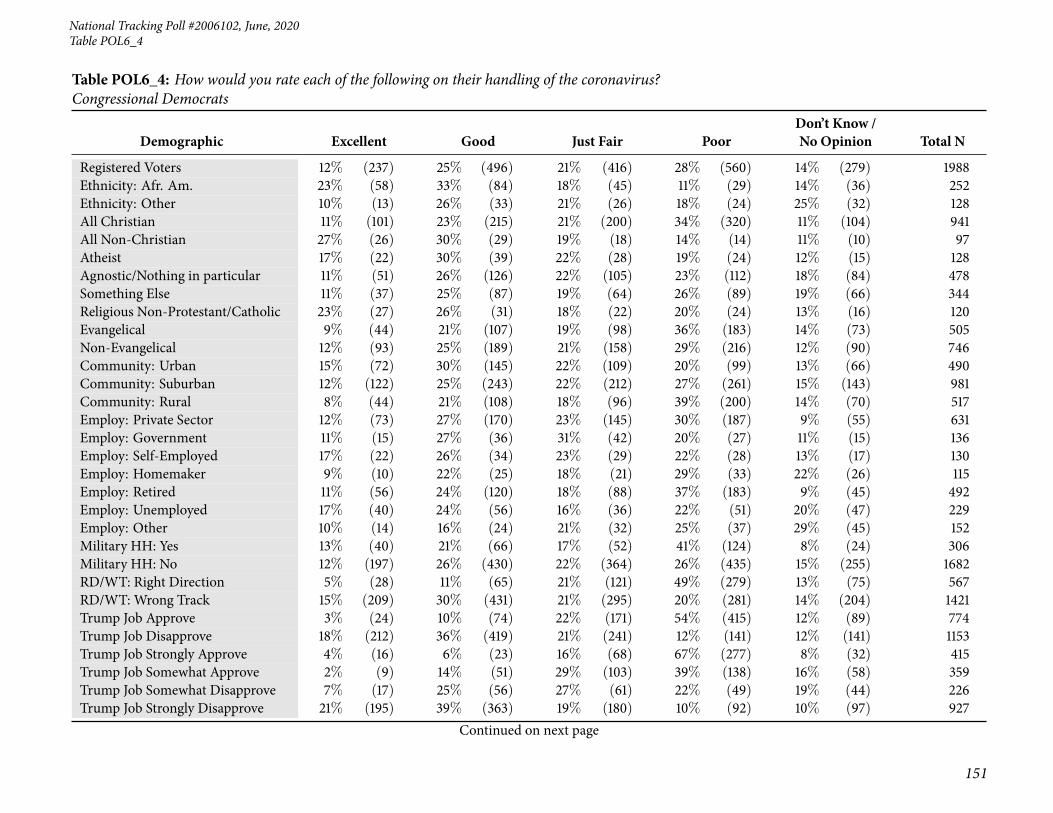
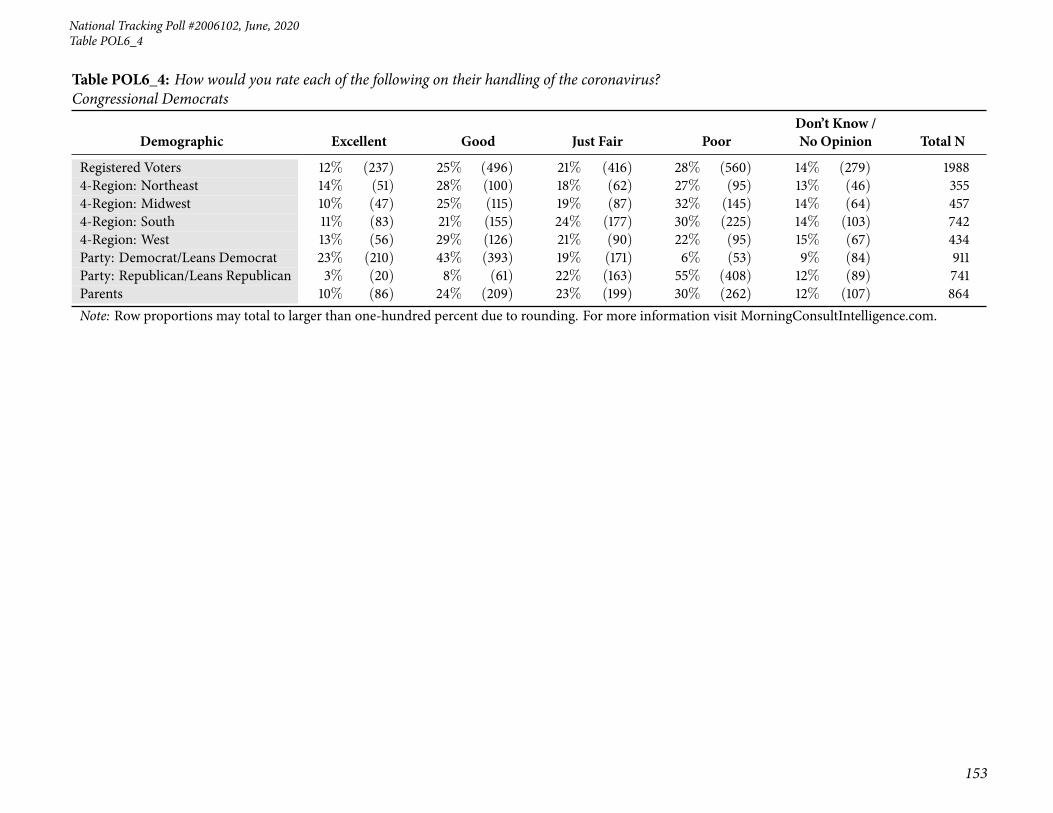
36 Table POL6_4: How would you rate each of the following on their handling of the coronavirus? Con-gressional Democrats . . . . . . . . . . . . . . . . . . . . . . . . . . . . . . . . . . . . . . . . . . . 150
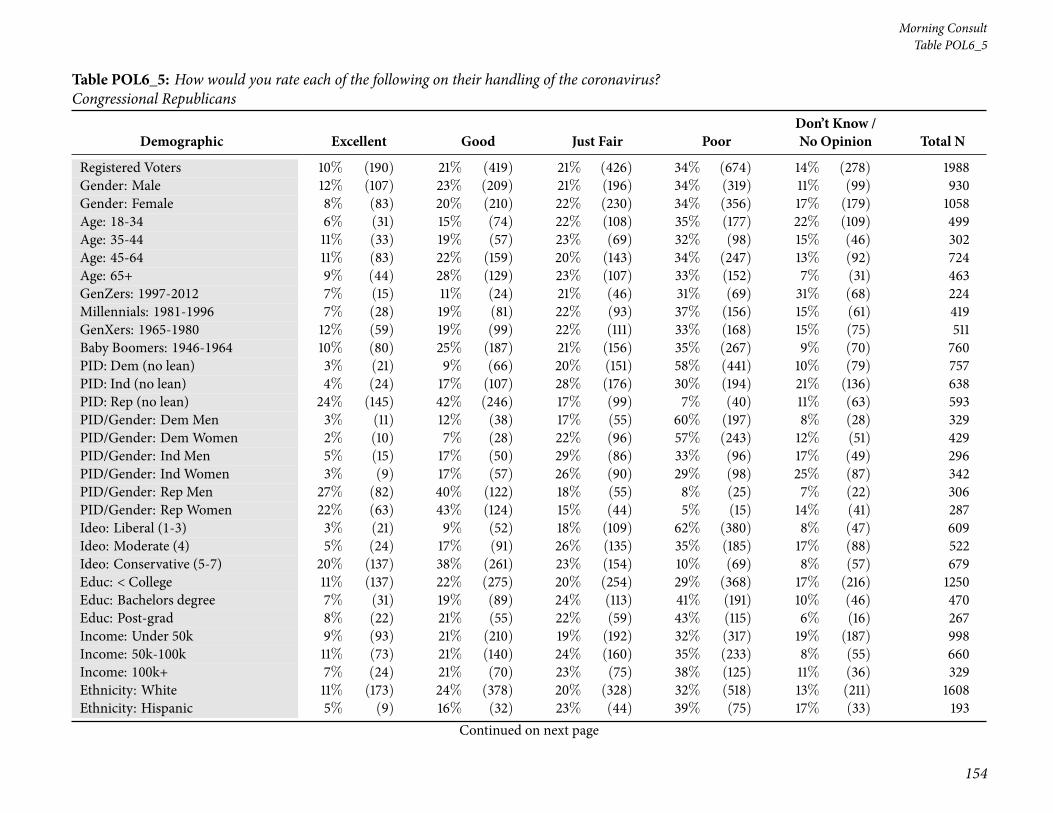
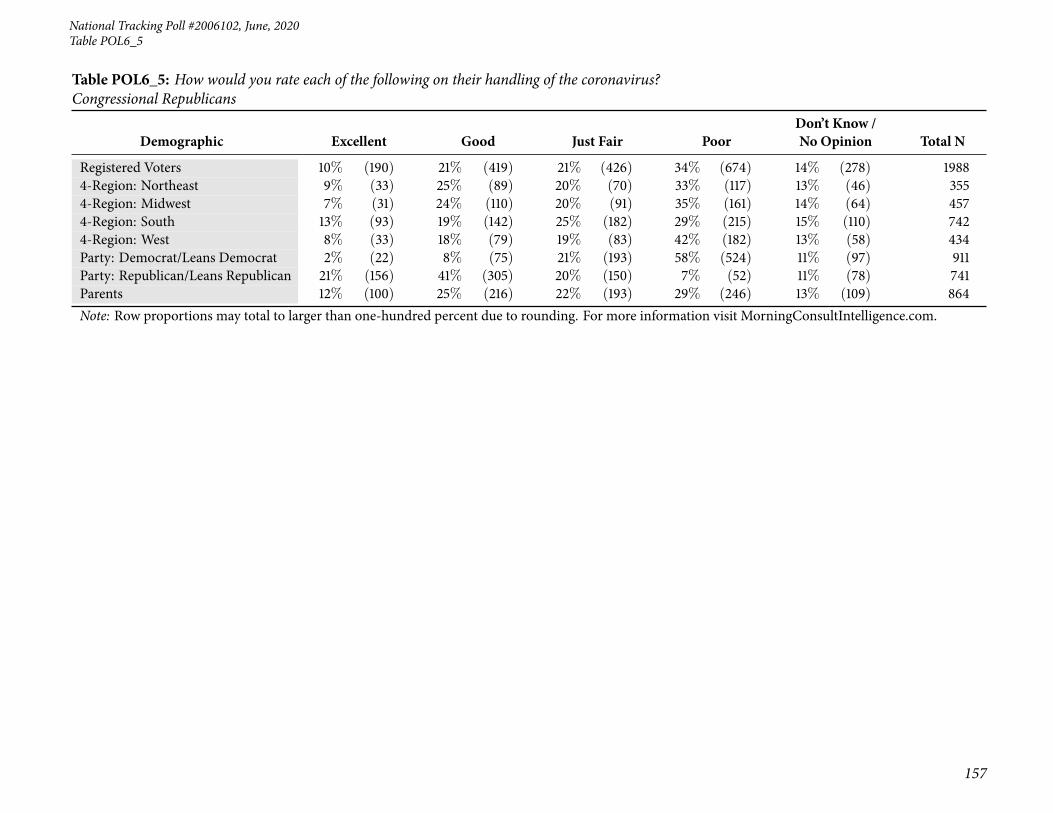
37 Table POL6_5: How would you rate each of the following on their handling of the coronavirus? Con-gressional Republicans . . . . . . . . . . . . . . . . . . . . . . . . . . . . . . . . . . . . . . . . . . . 154
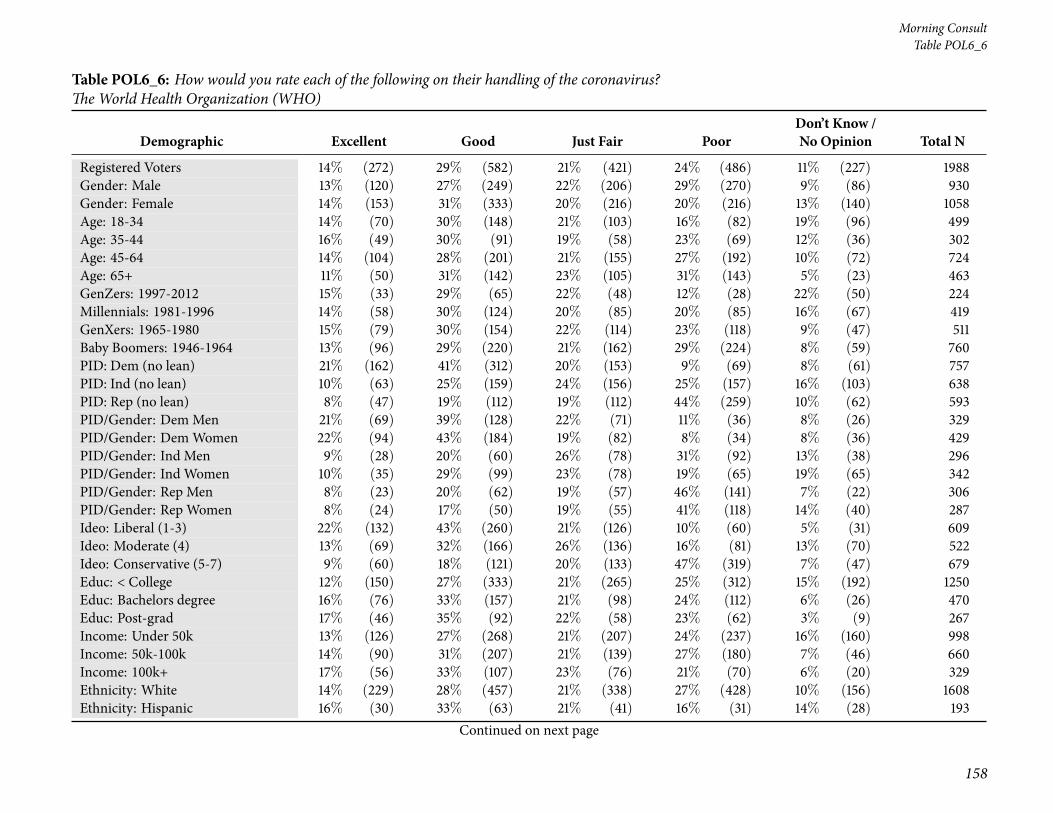
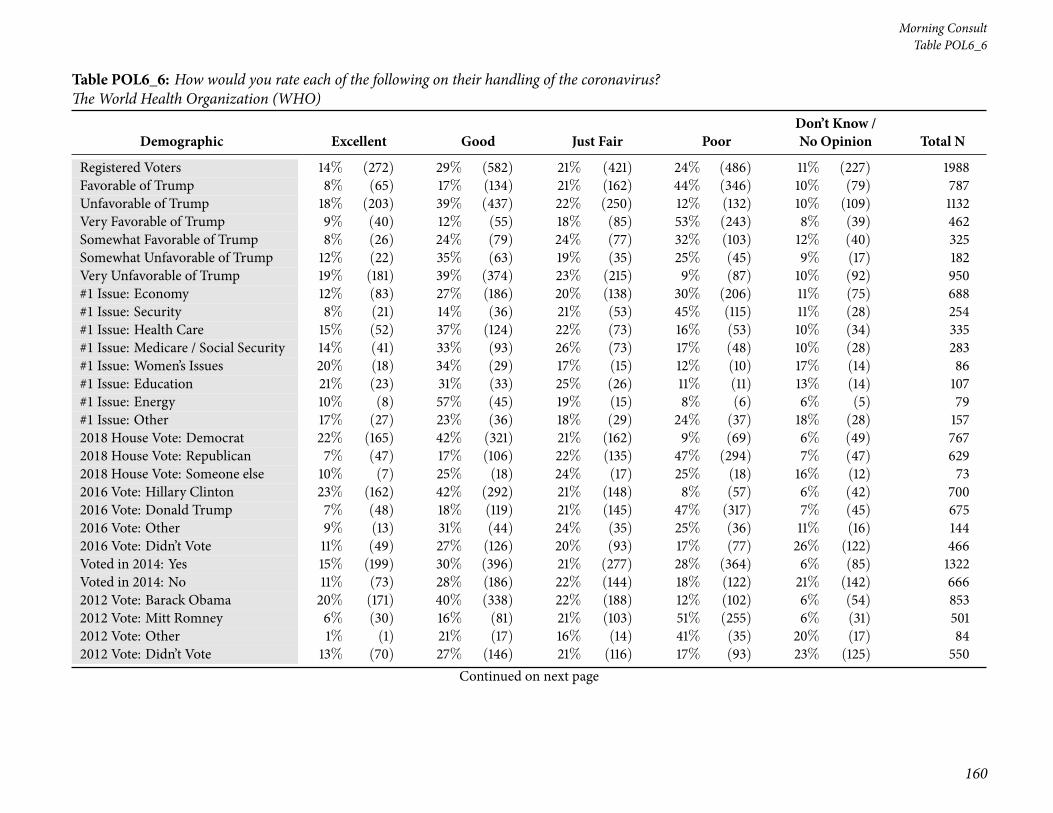
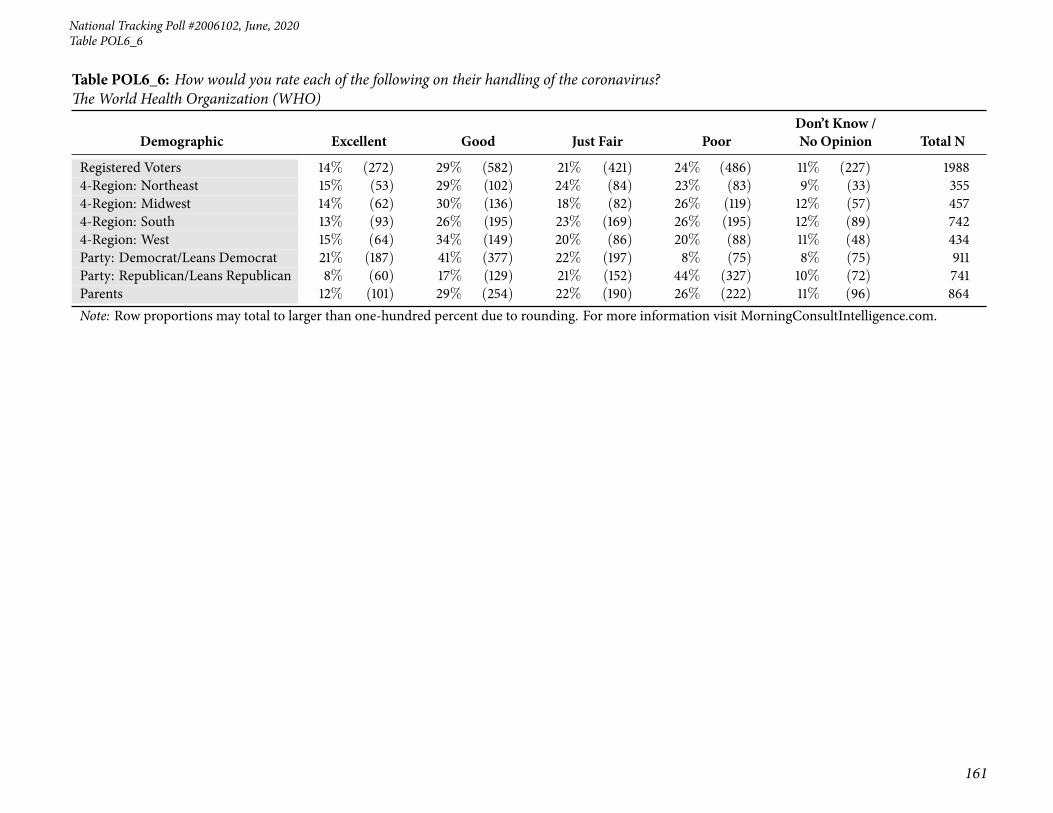
38 Table POL6_6: How would you rate each of the following on their handling of the coronavirus? TheWorld Health Organization (WHO) . . . . . . . . . . . . . . . . . . . . . . . . . . . . . . . . . . . . 158
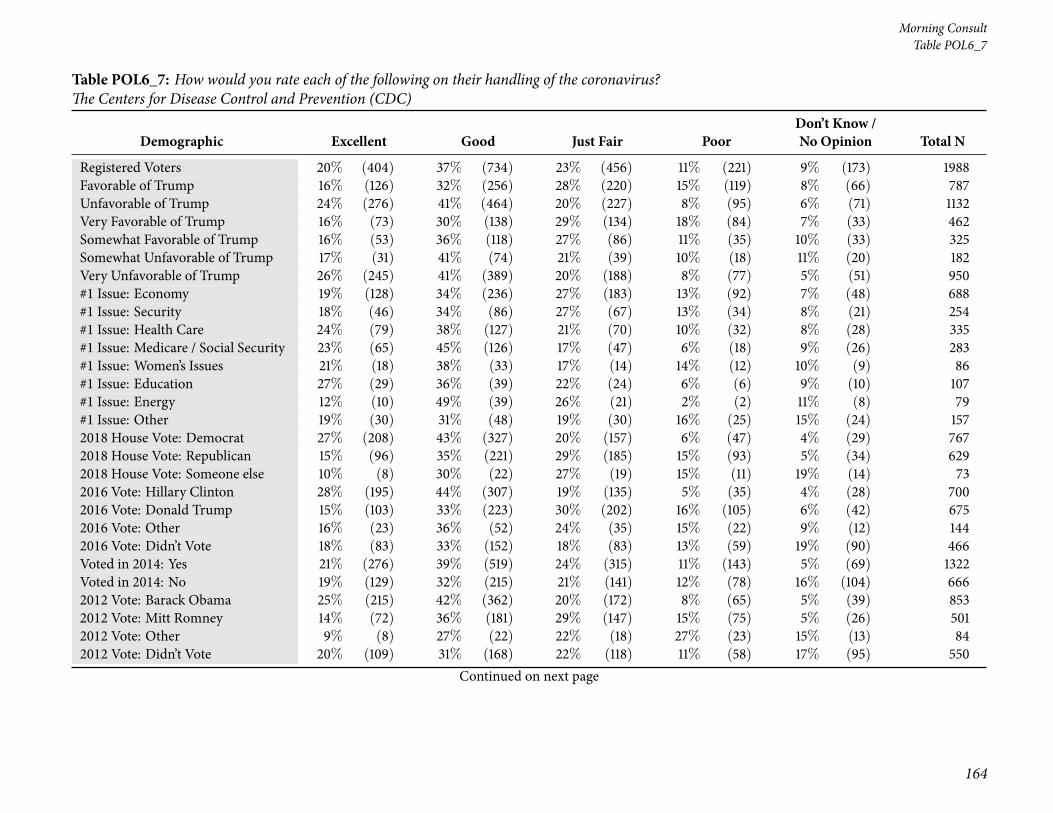
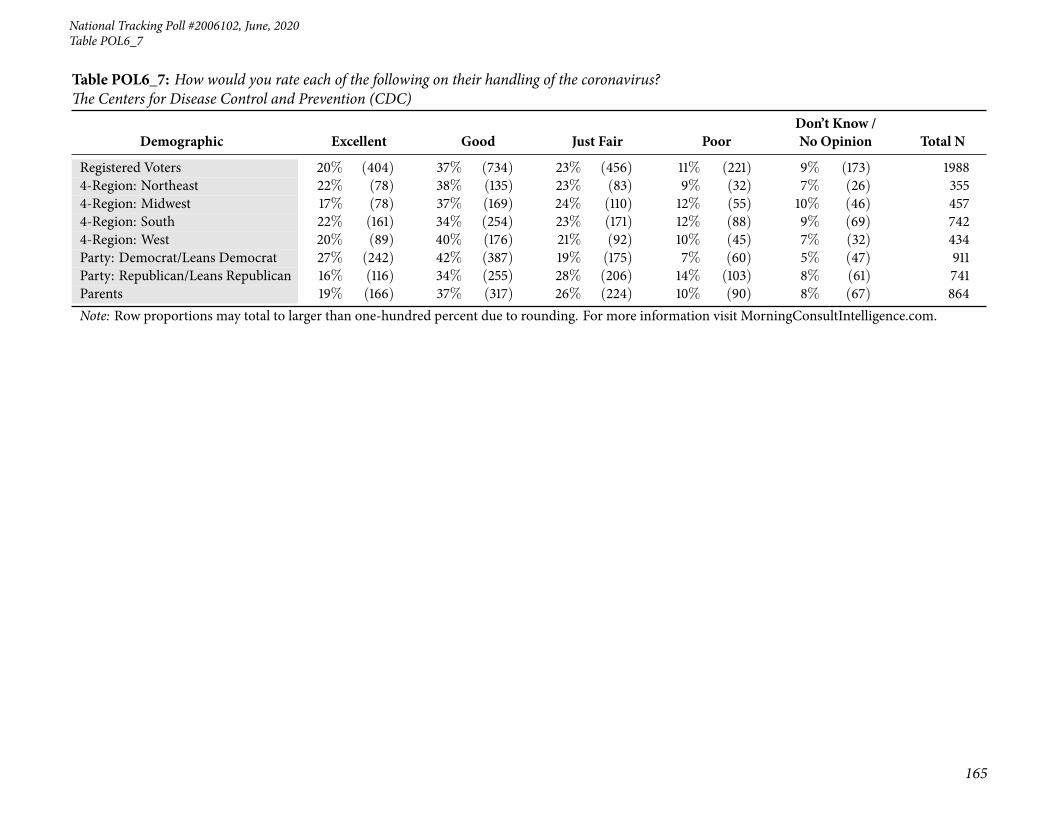
39 Table POL6_7: How would you rate each of the following on their handling of the coronavirus? TheCenters for Disease Control and Prevention (CDC) . . . . . . . . . . . . . . . . . . . . . . . . . . . . 162
3
Page 4
Morning Consult
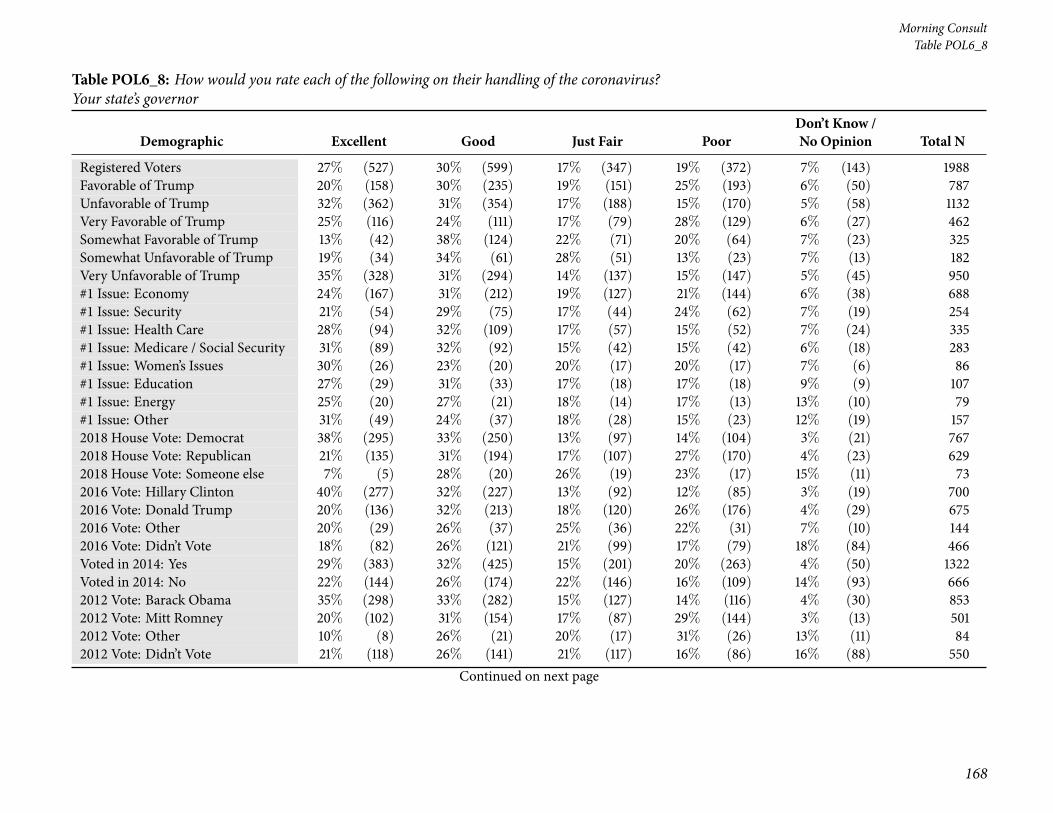
40 Table POL6_8: How would you rate each of the following on their handling of the coronavirus? Yourstate’s governor . . . . . . . . . . . . . . . . . . . . . . . . . . . . . . . . . . . . . . . . . . . . . . . 166
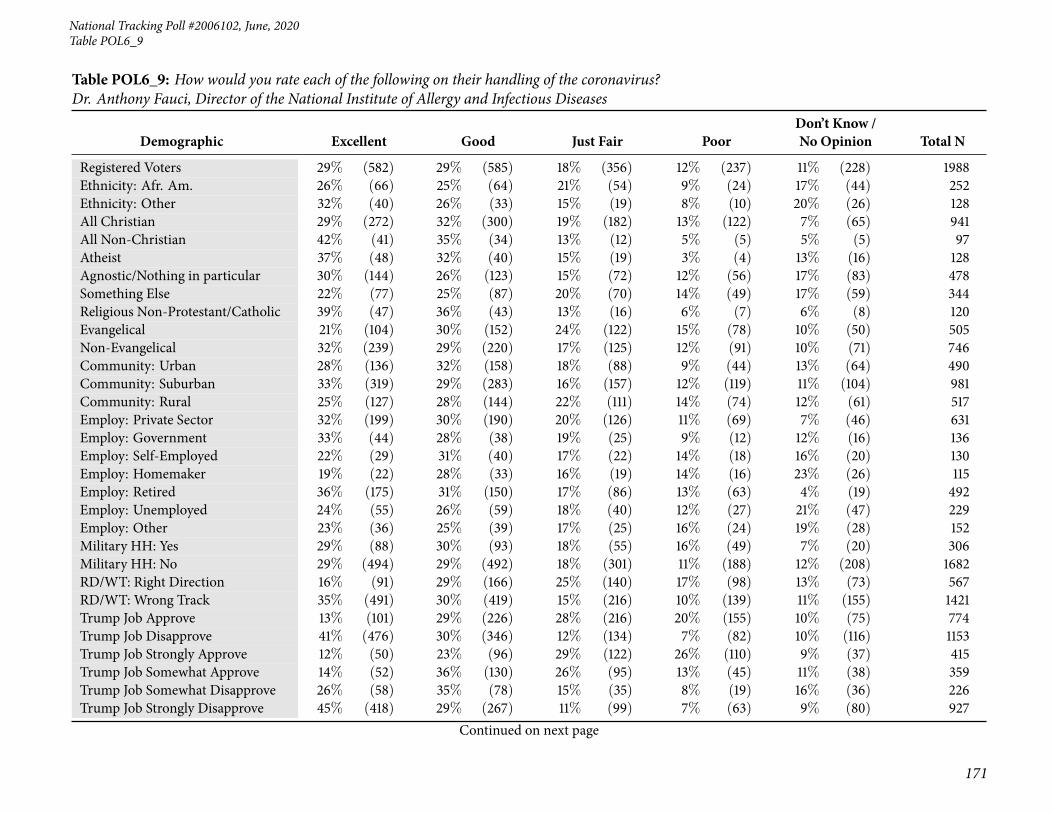
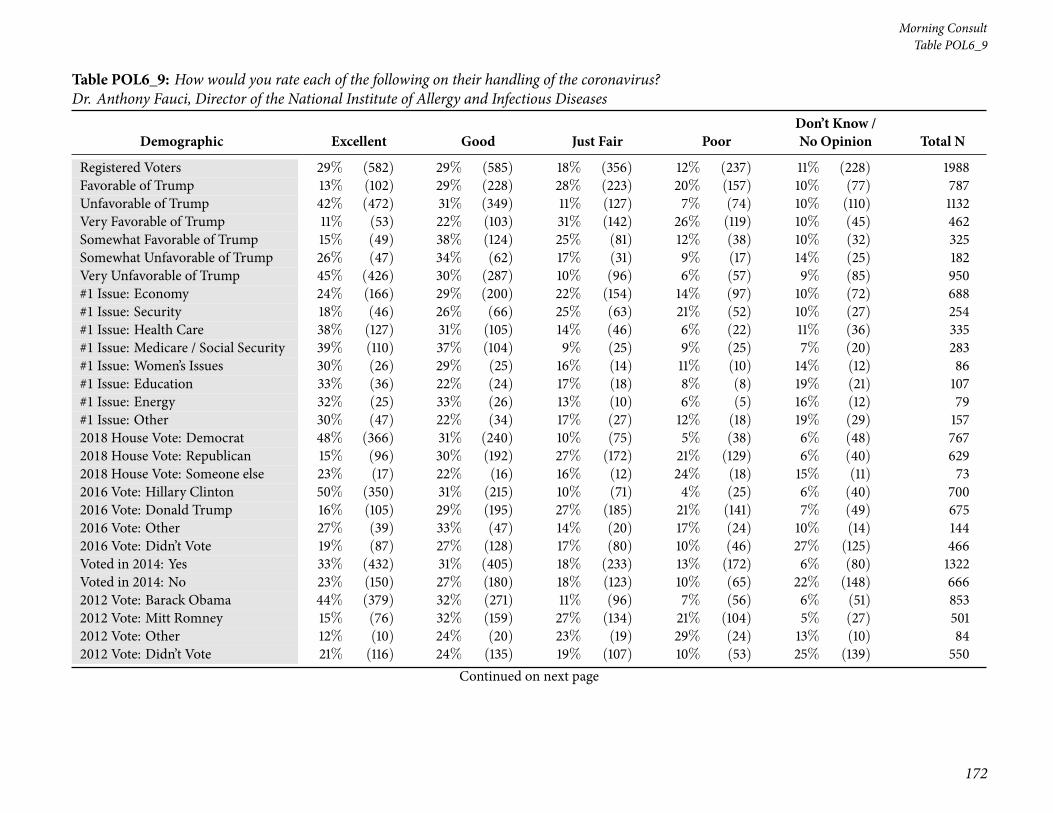
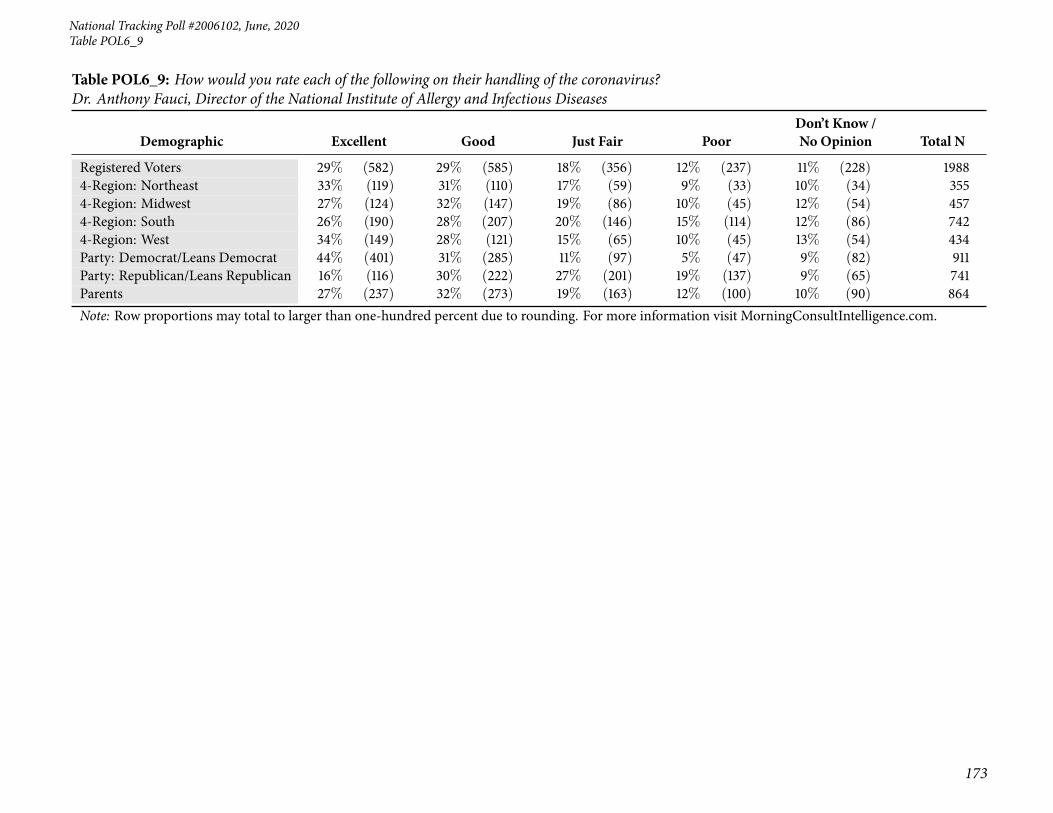
41 Table POL6_9: How would you rate each of the following on their handling of the coronavirus? Dr.Anthony Fauci, Director of the National Institute of Allergy and Infectious Diseases . . . . . . . . . . . 170
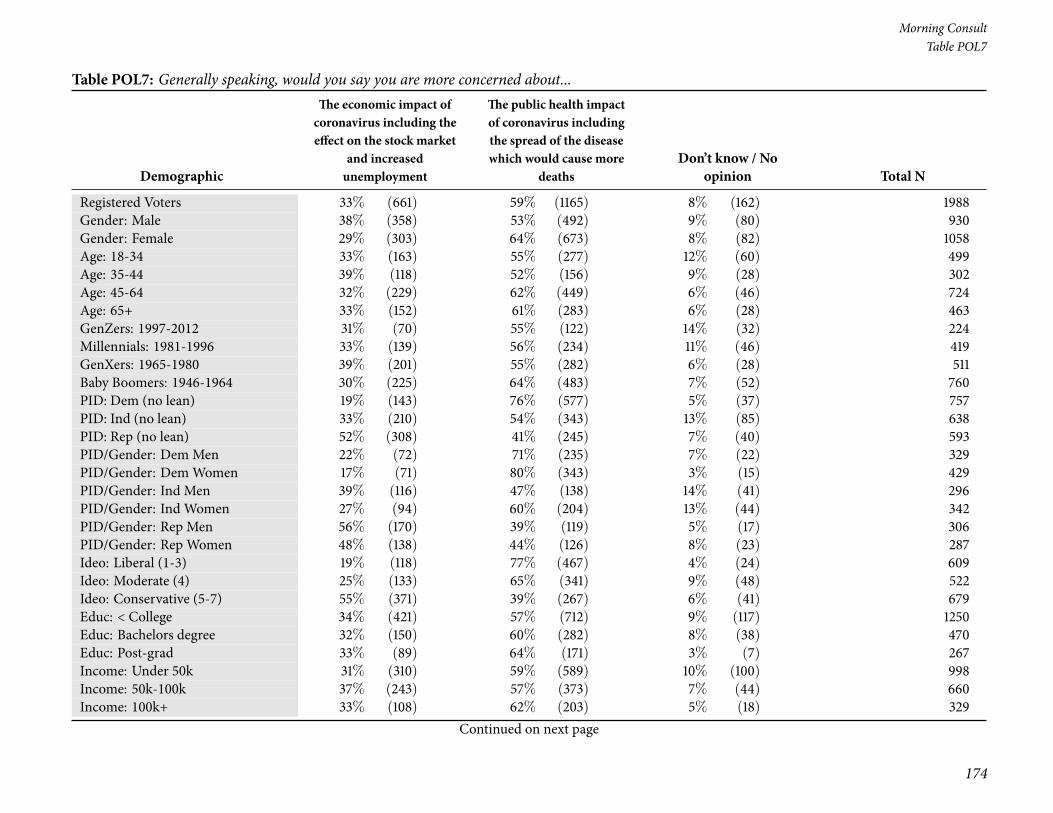
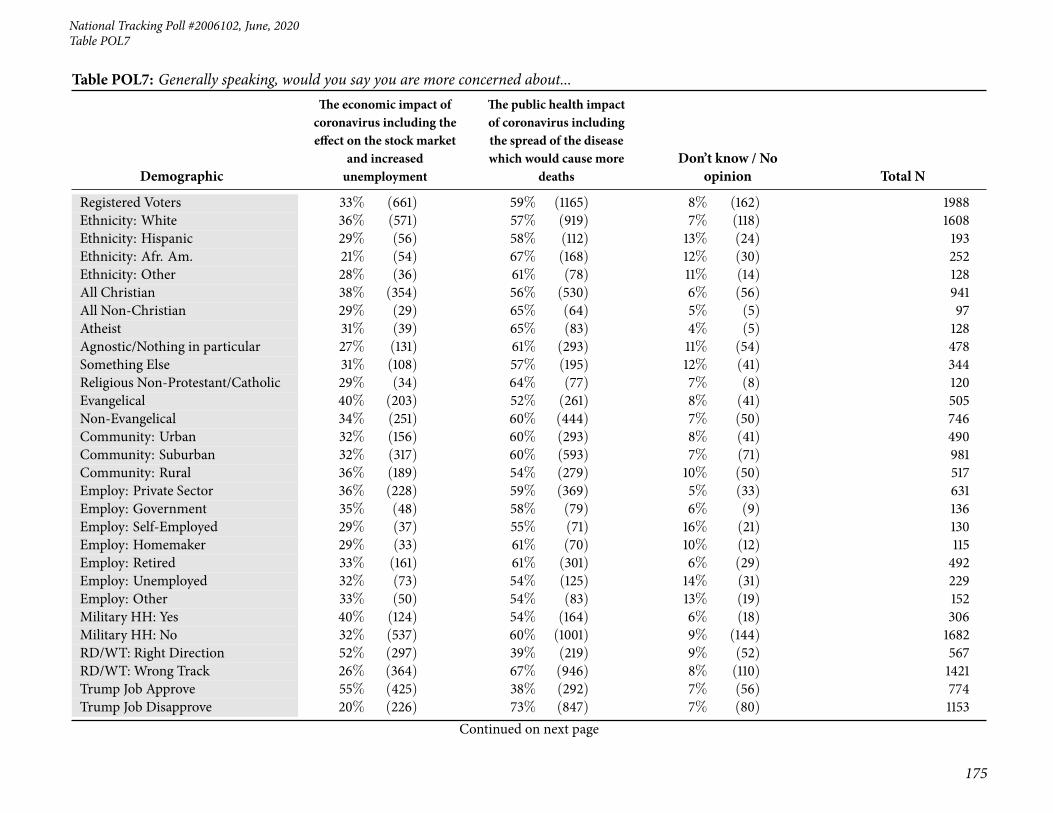
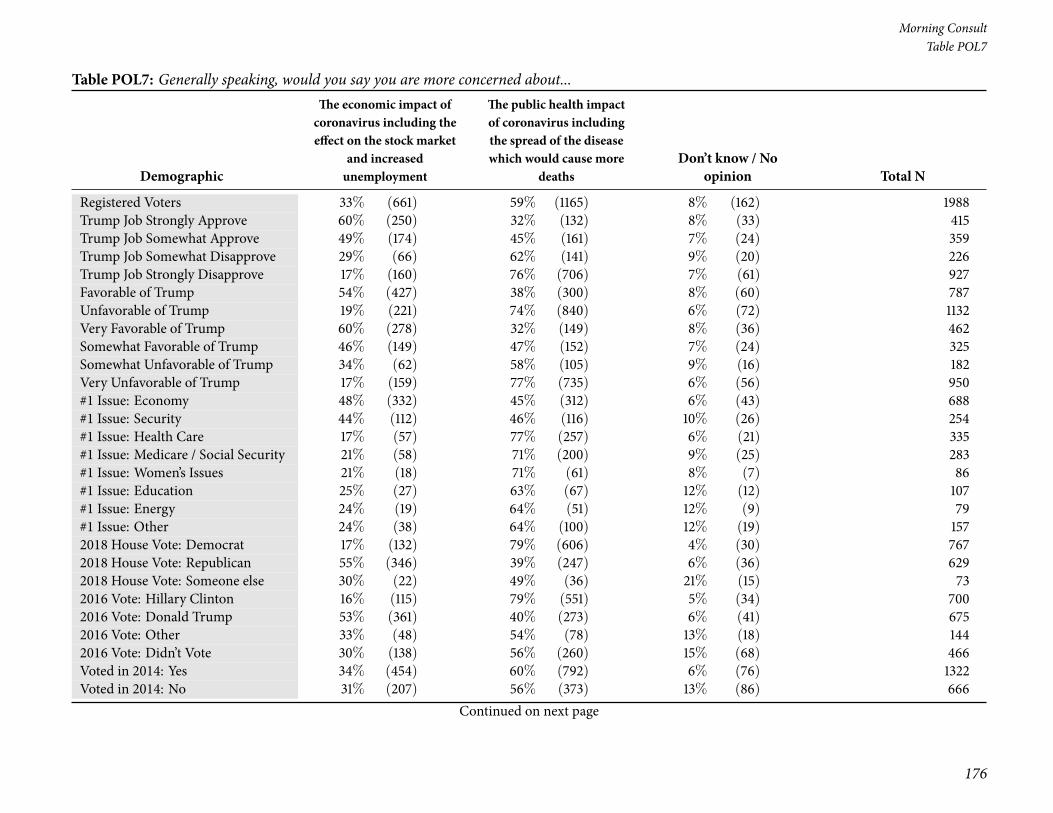
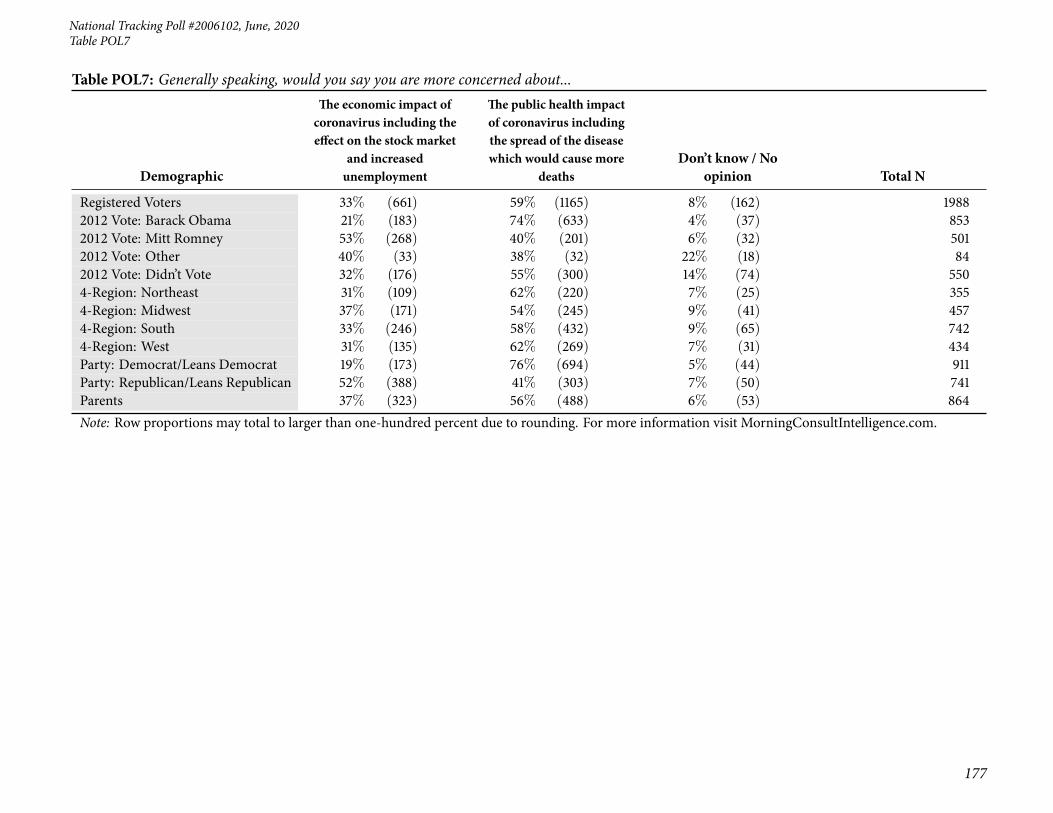
42 Table POL7: Generally speaking, would you say you are more concerned about... . . . . . . . . . . . . 174
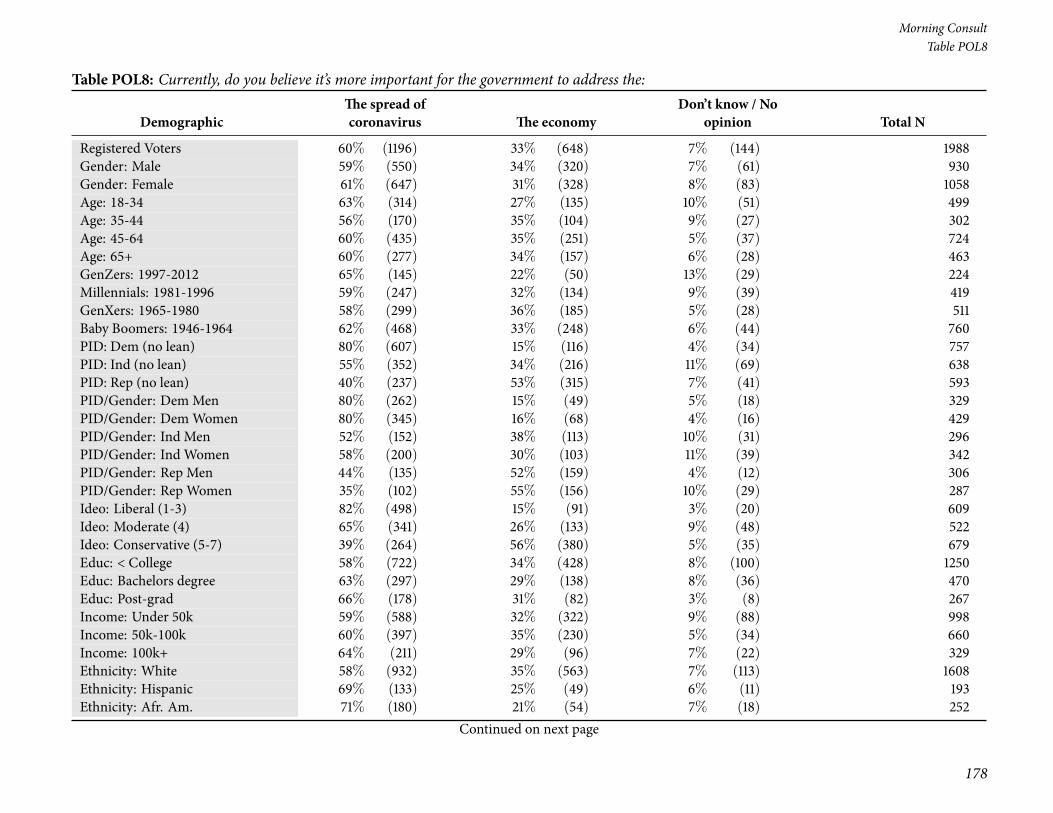
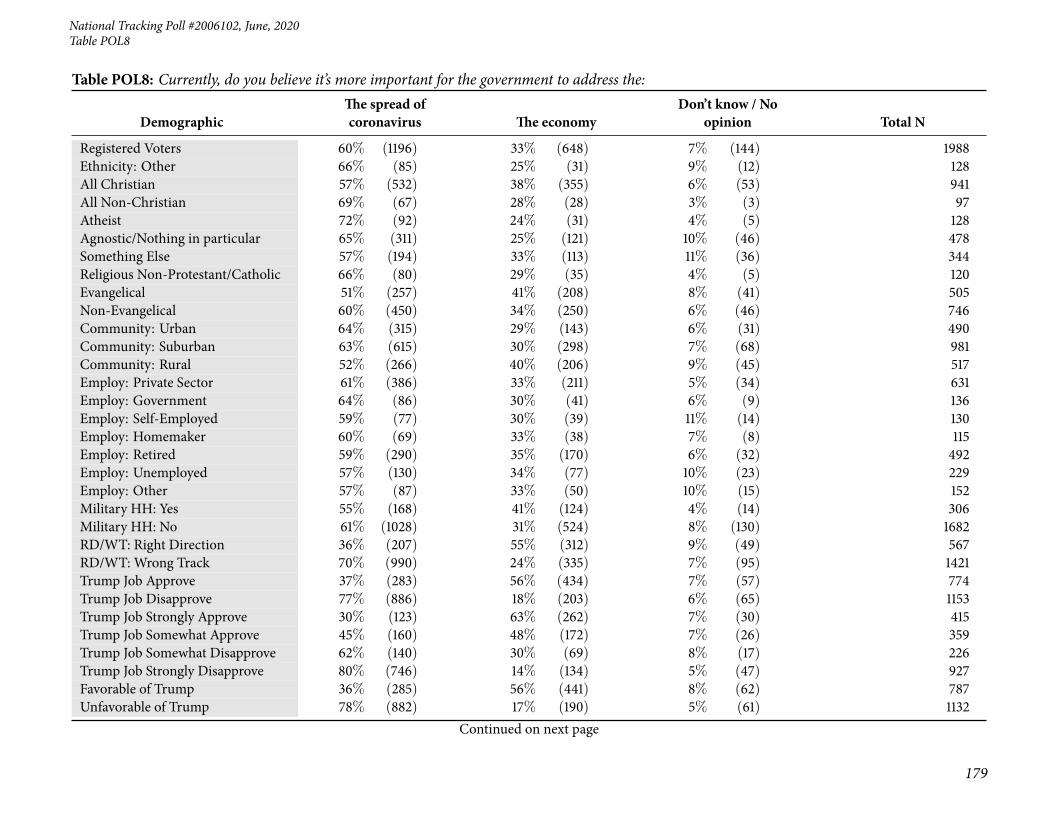
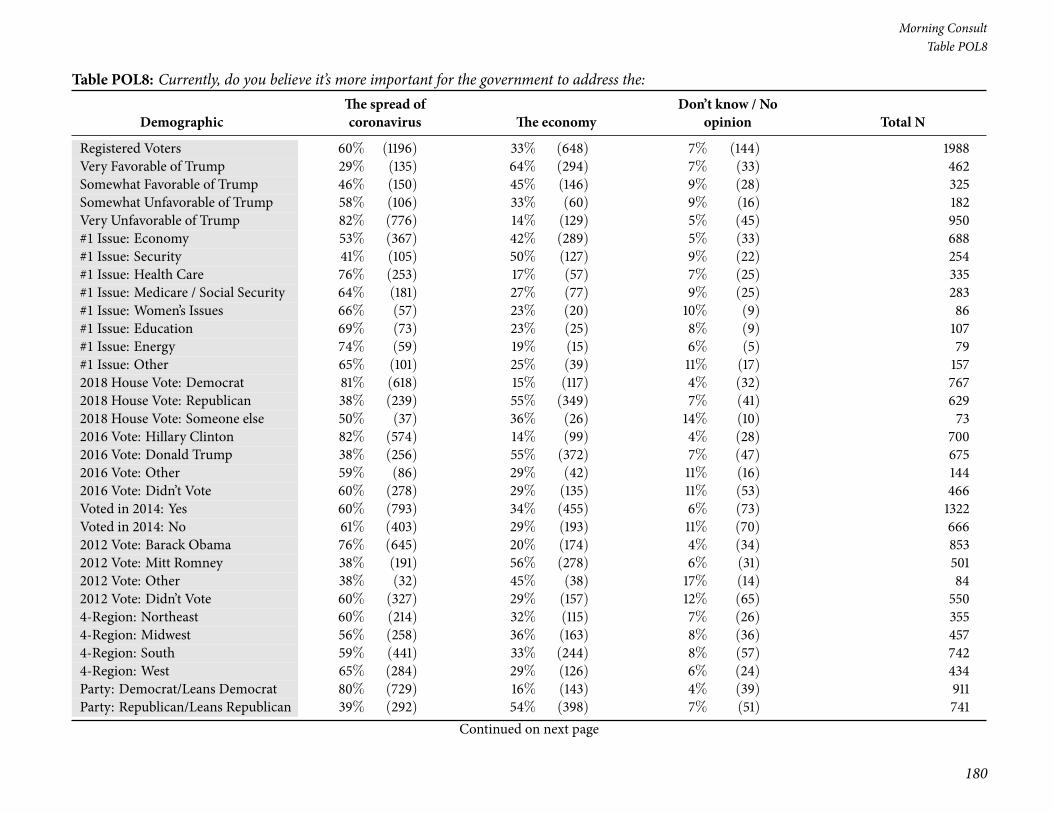
43 Table POL8: Currently, do you believe it’s more important for the government to address the: . . . . . 178
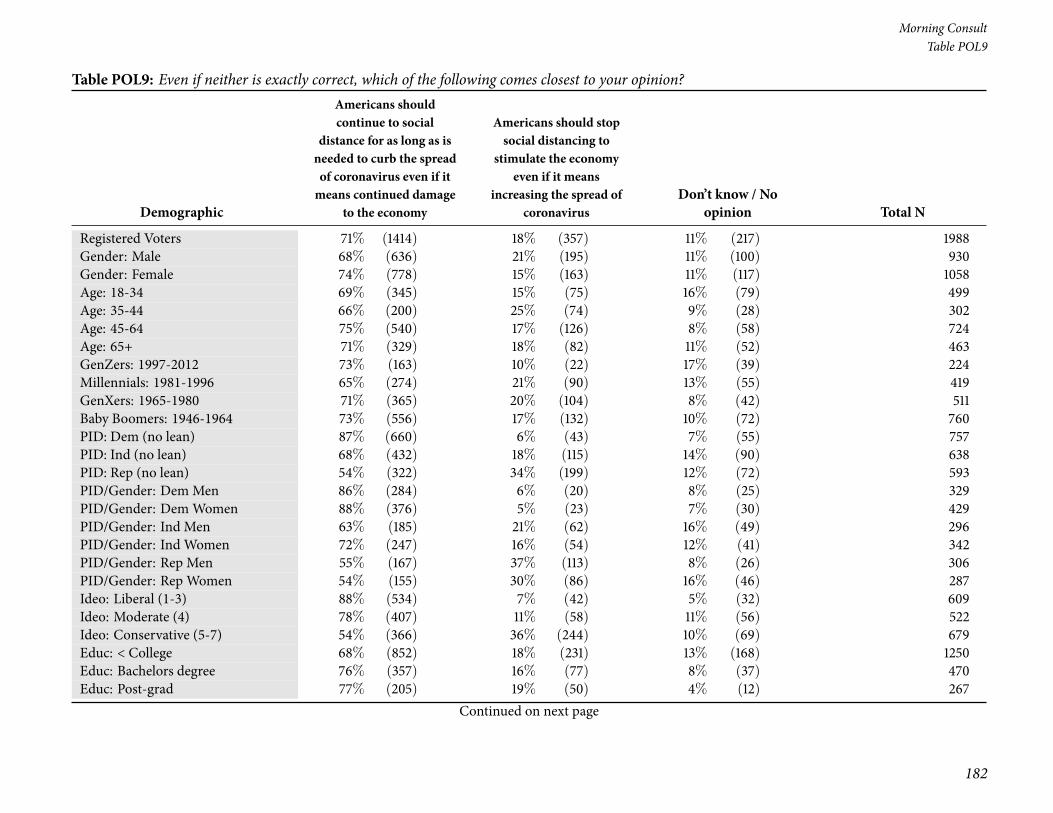
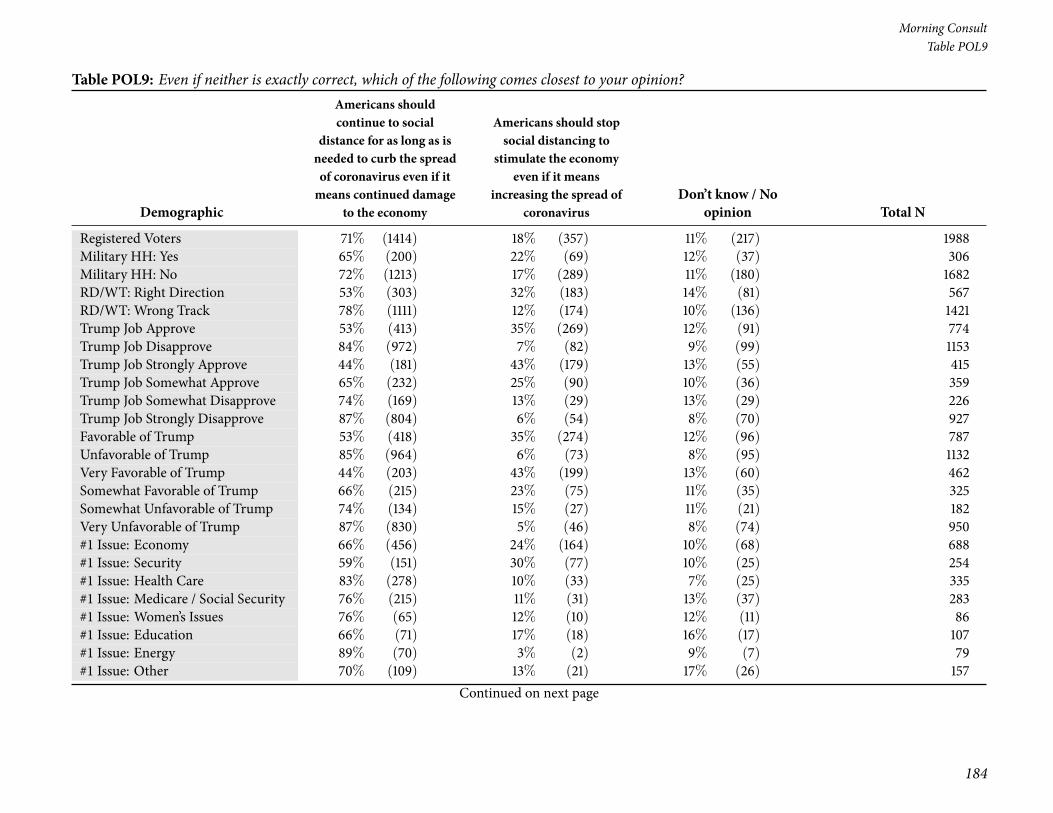
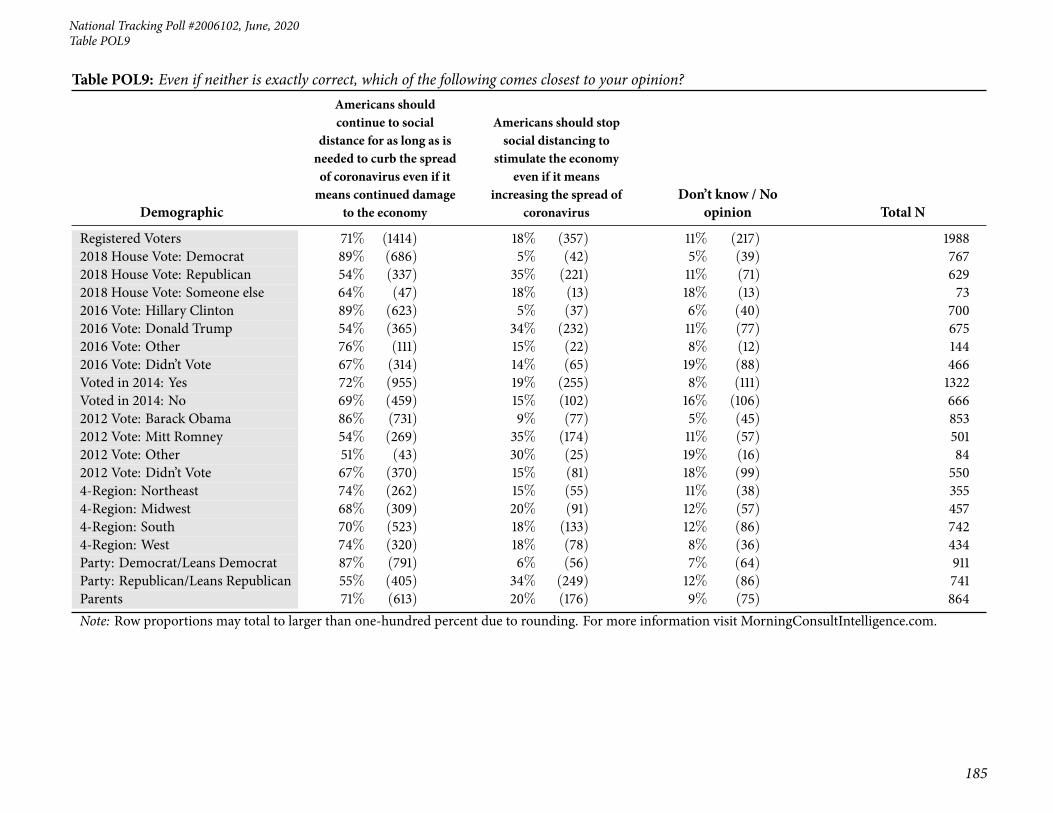
44 Table POL9: Even if neither is exactly correct, which of the following comes closest to your opinion? . . 182
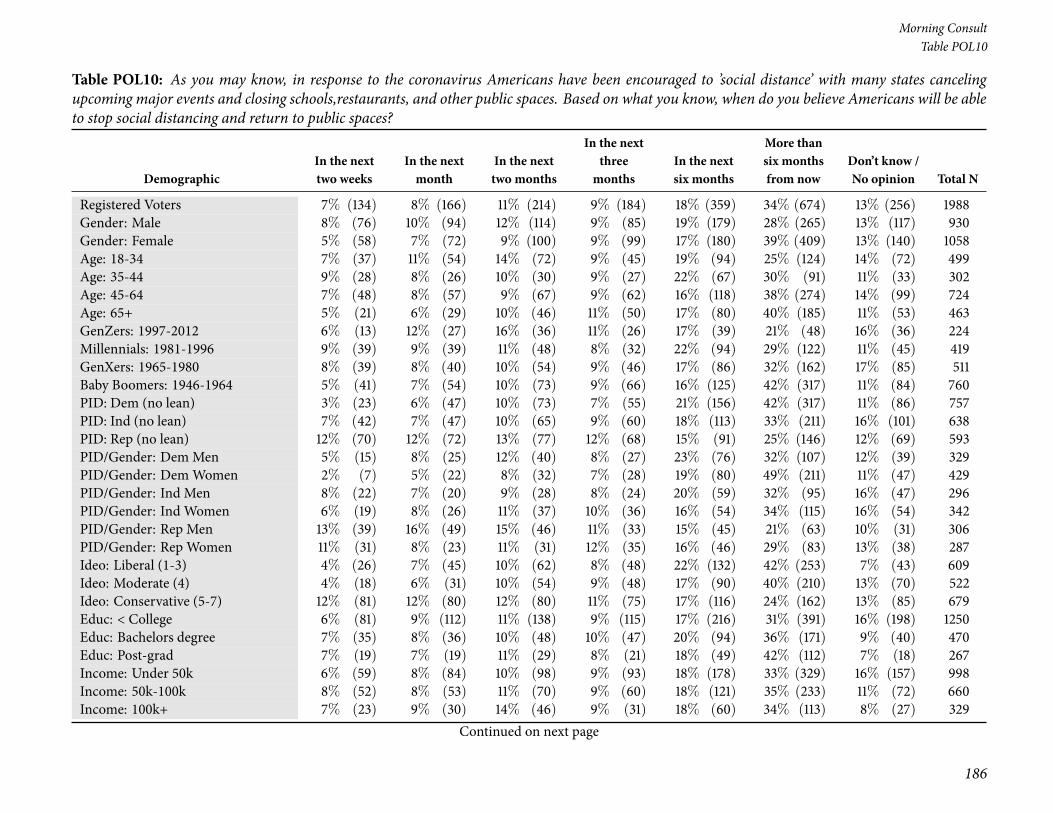
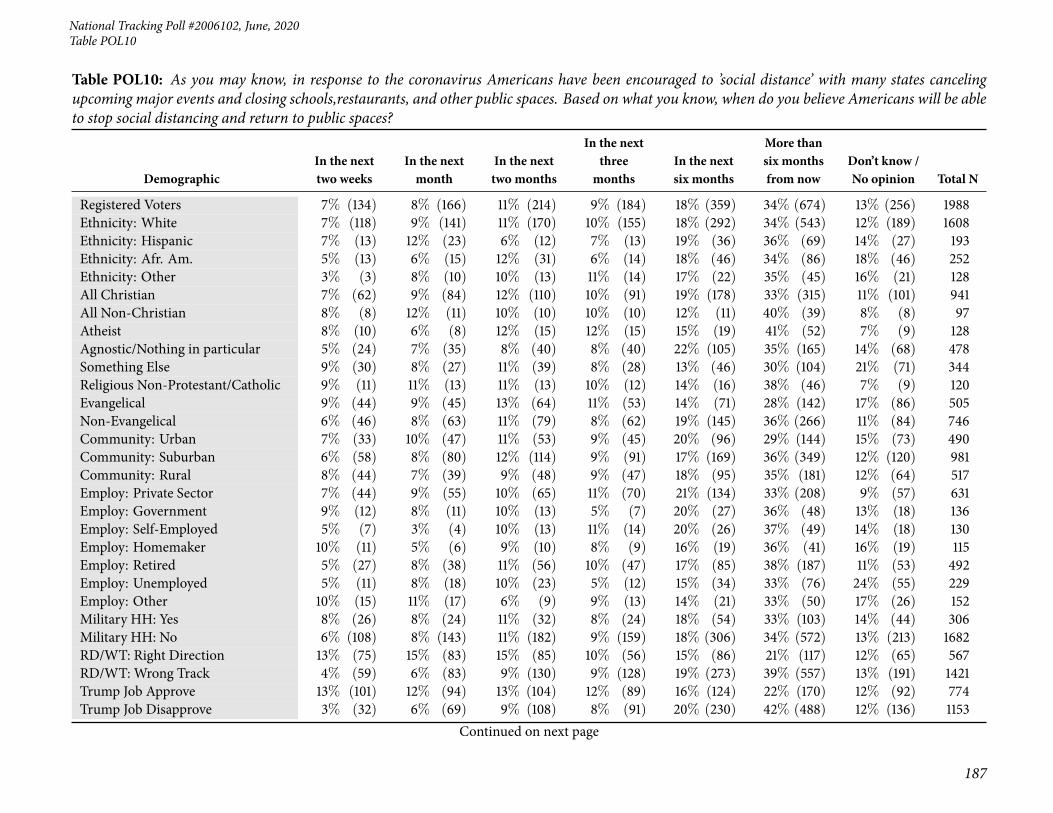
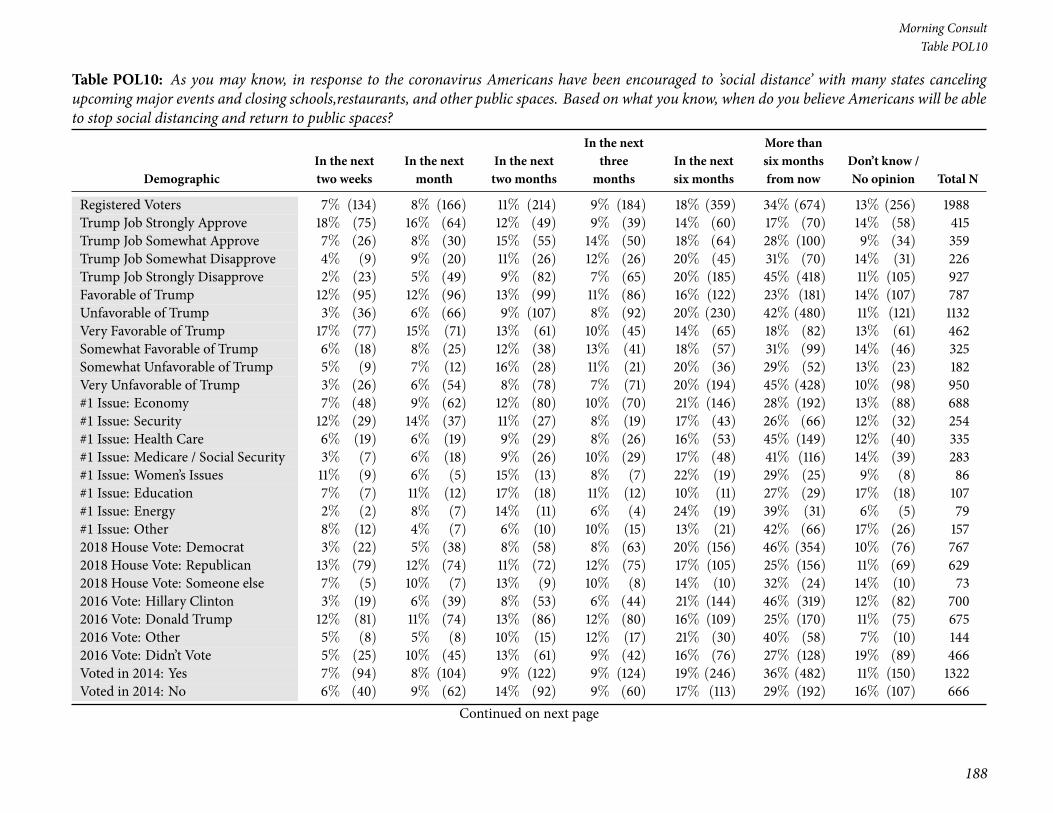
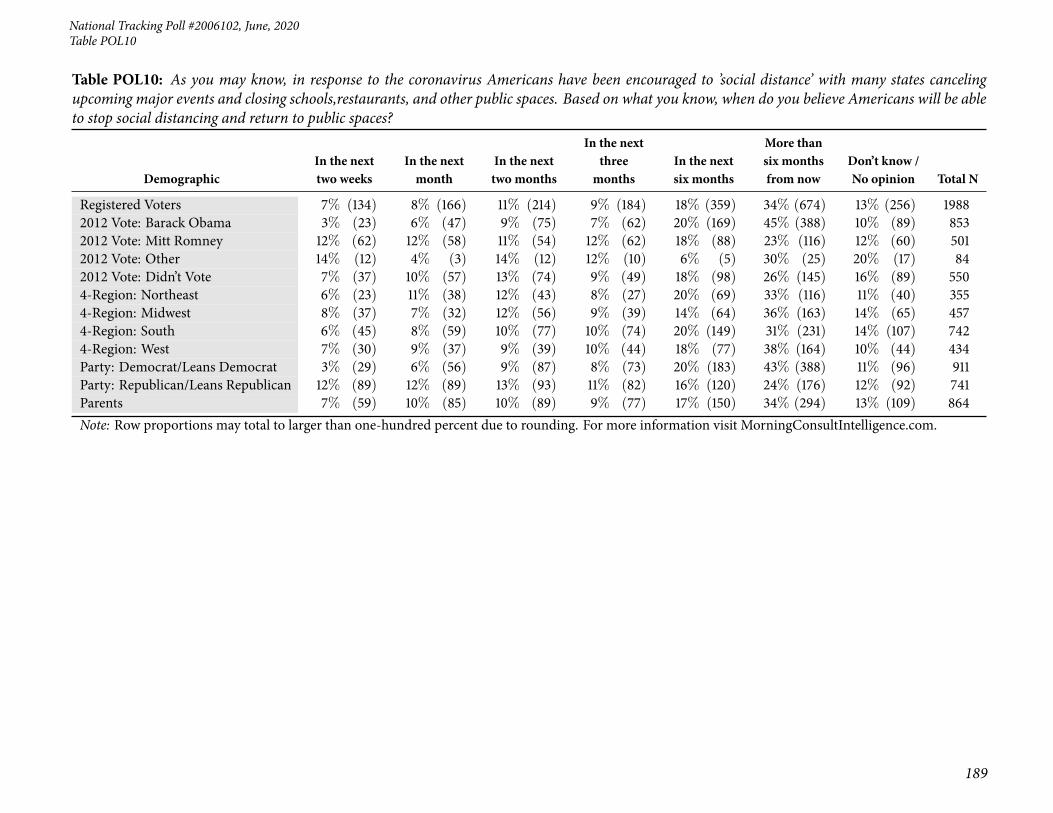
45 Table POL10: As you may know, in response to the coronavirus Americans have been encouraged to’social distance’ with many states canceling upcoming major events and closing schools,restaurants, andother public spaces. Based on what you know, when do you believe Americans will be able to stop socialdistancing and return to public spaces? . . . . . . . . . . . . . . . . . . . . . . . . . . . . . . . . . . 186
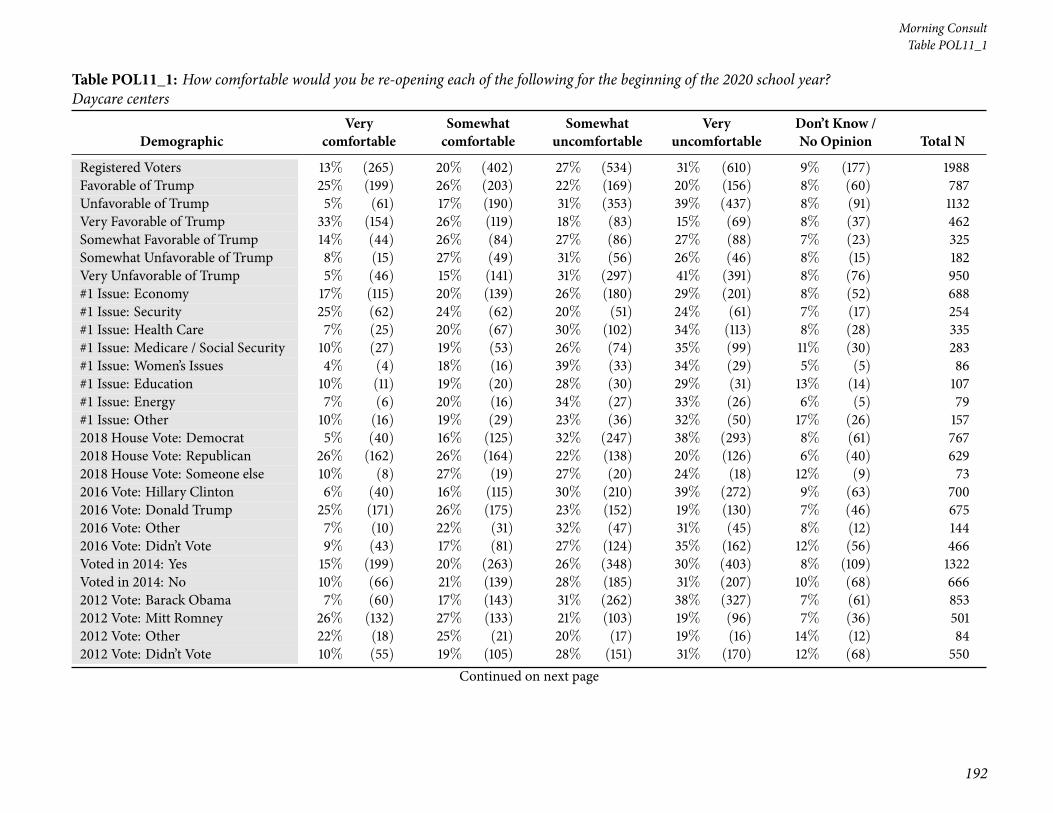
46 Table POL11_1: How comfortable would you be re-opening each of the following for the beginning ofthe 2020 school year? Daycare centers . . . . . . . . . . . . . . . . . . . . . . . . . . . . . . . . . . . 190
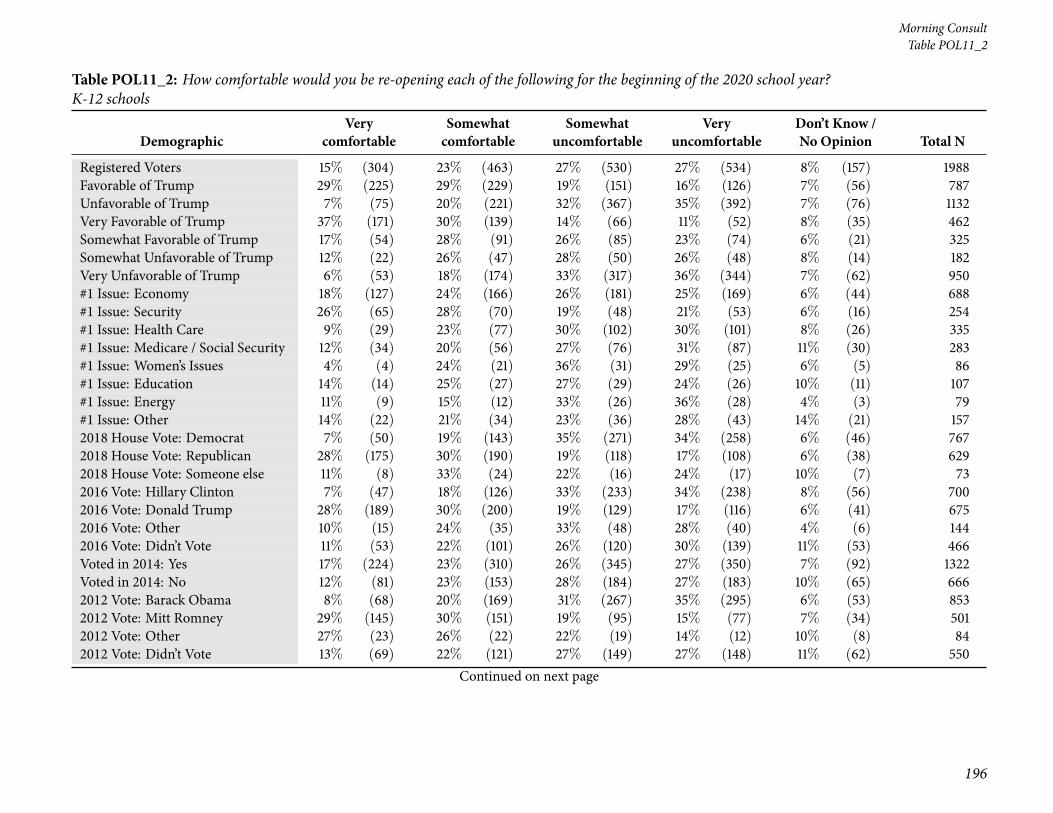
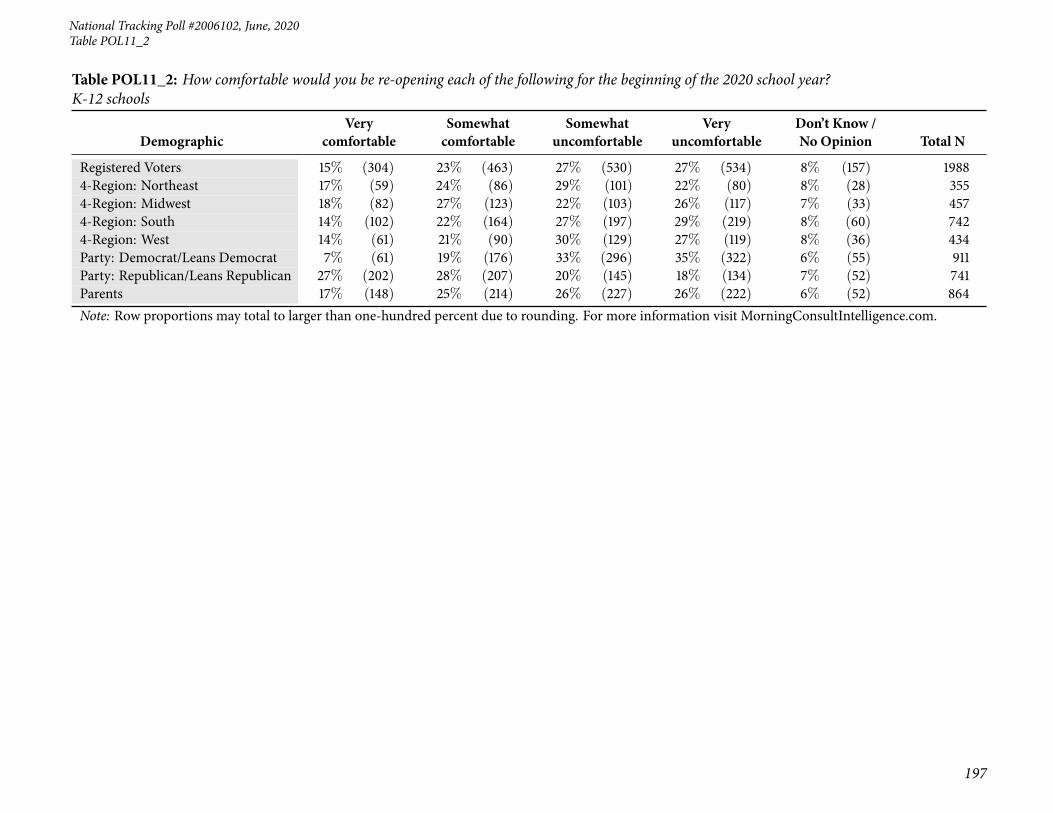
47 Table POL11_2: How comfortable would you be re-opening each of the following for the beginning ofthe 2020 school year? K-12 schools . . . . . . . . . . . . . . . . . . . . . . . . . . . . . . . . . . . . 194
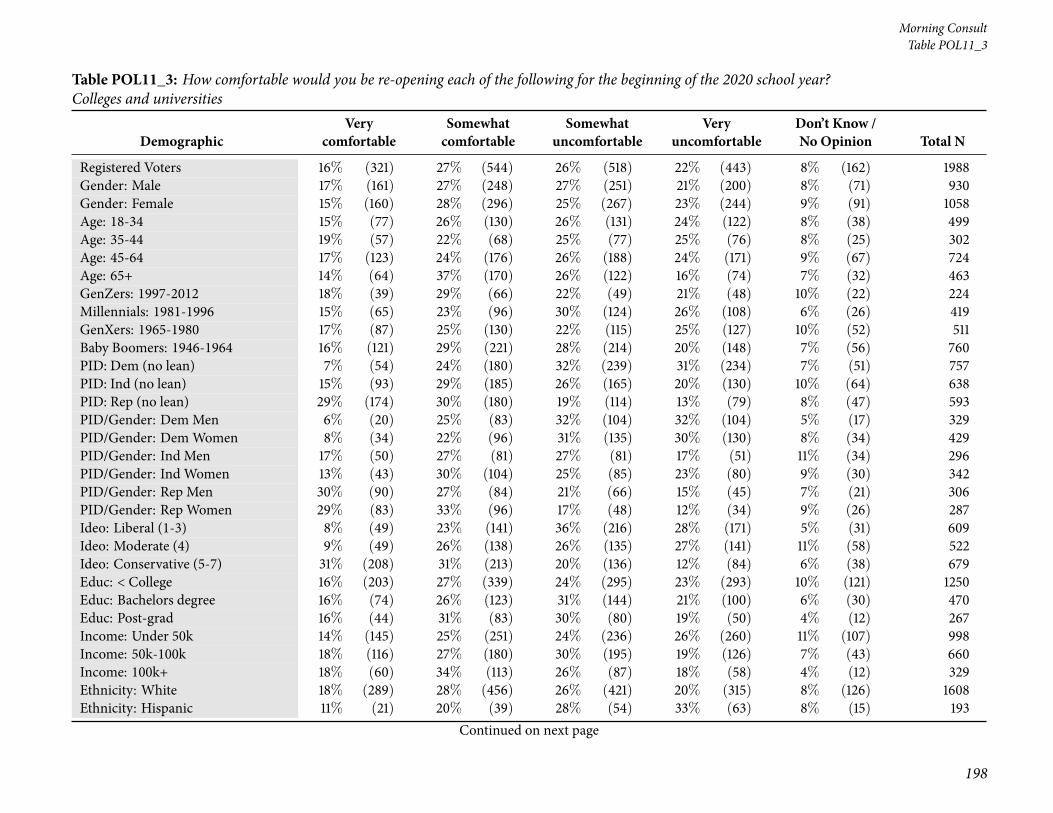
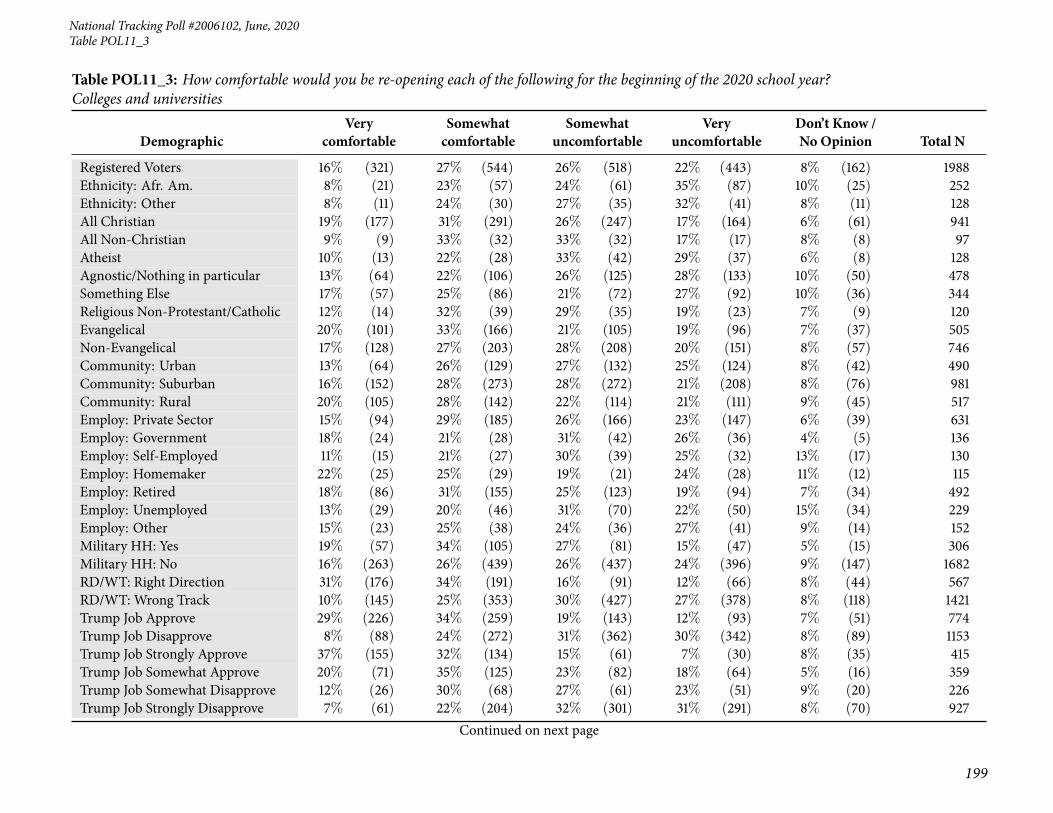
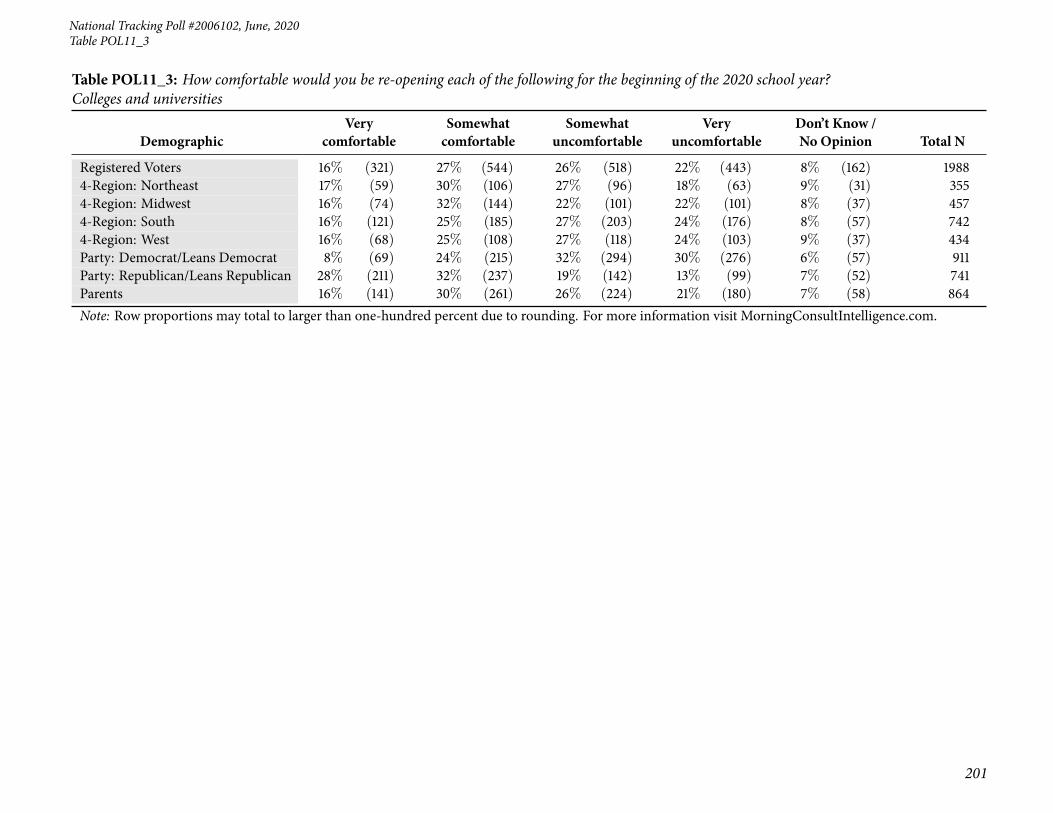
48 Table POL11_3: How comfortable would you be re-opening each of the following for the beginning ofthe 2020 school year? Colleges and universities . . . . . . . . . . . . . . . . . . . . . . . . . . . . . . 198
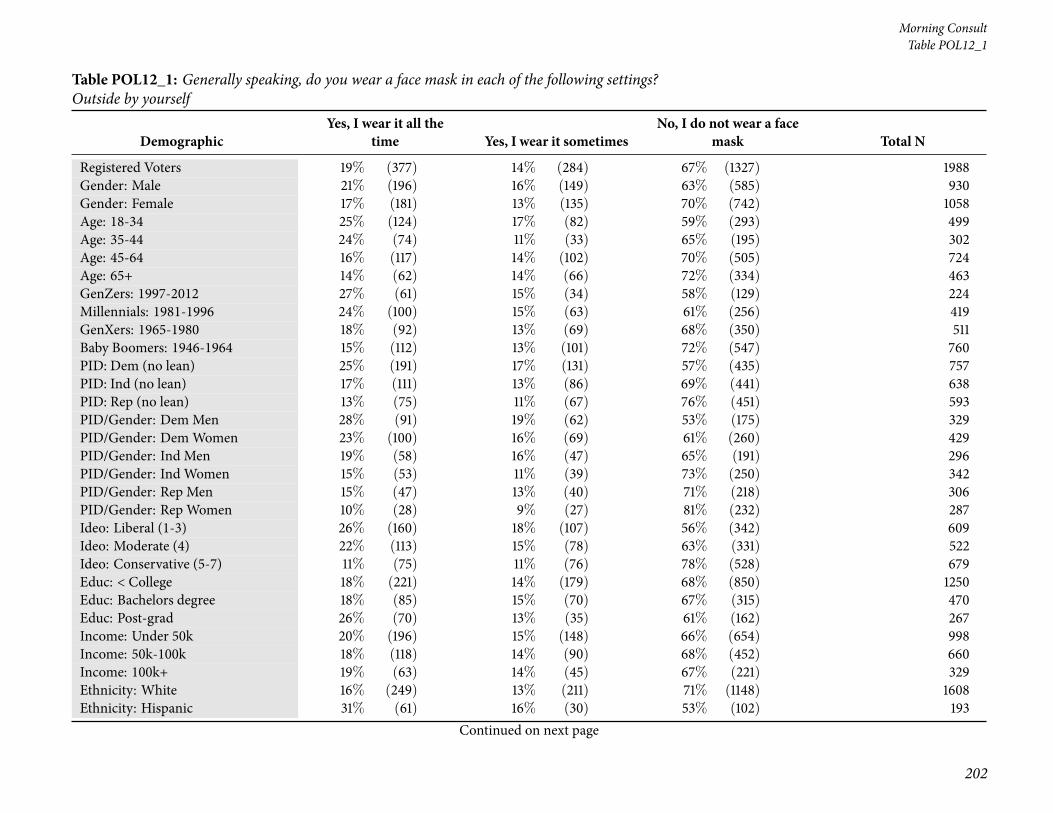
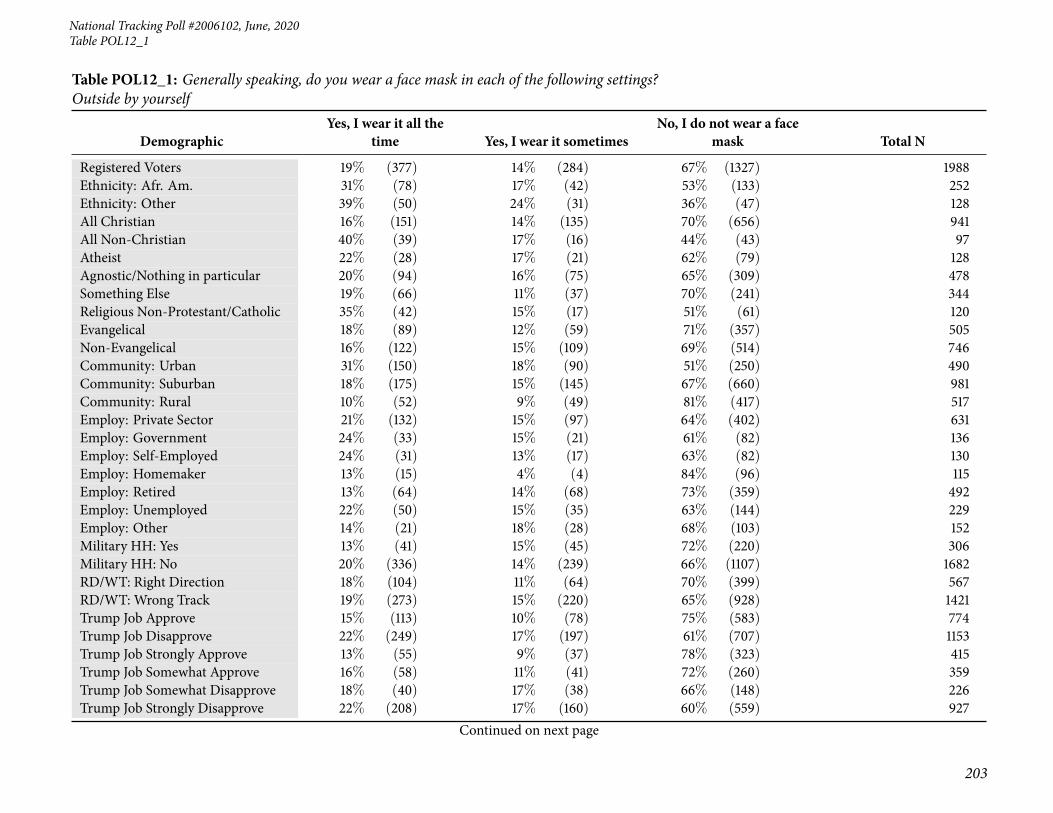
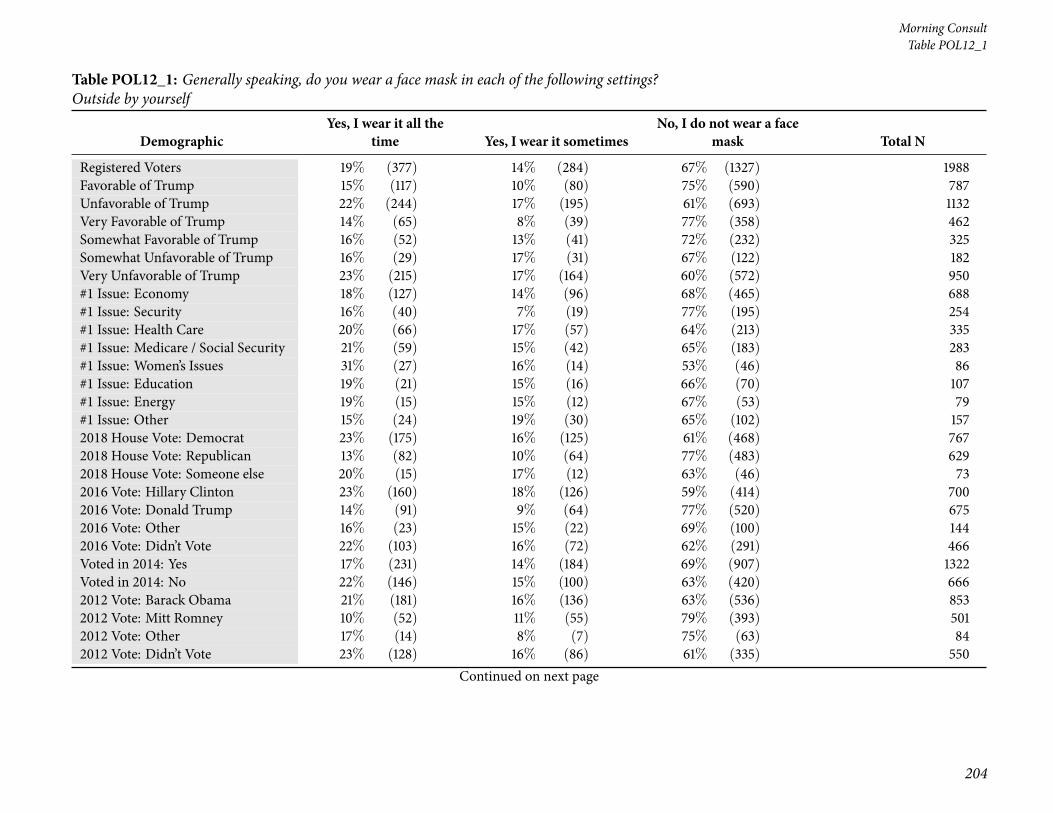
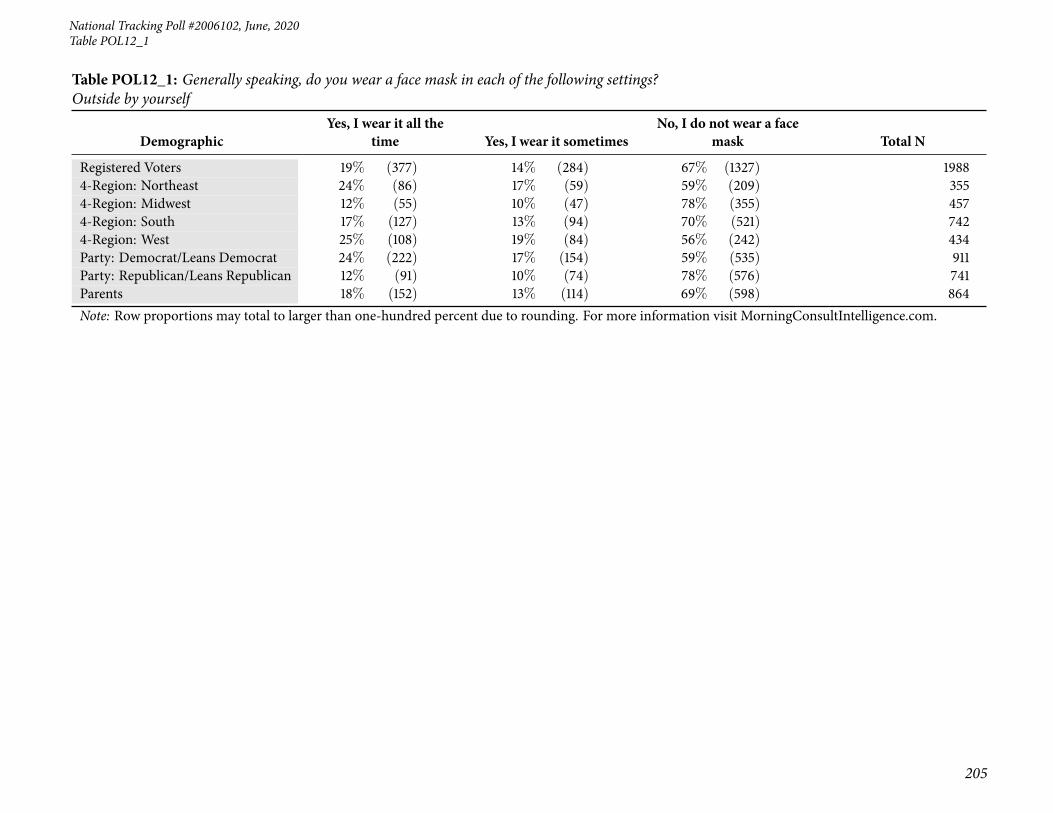
49 Table POL12_1: Generally speaking, do you wear a facemask in each of the following settings? Outsideby yourself . . . . . . . . . . . . . . . . . . . . . . . . . . . . . . . . . . . . . . . . . . . . . . . . . 202
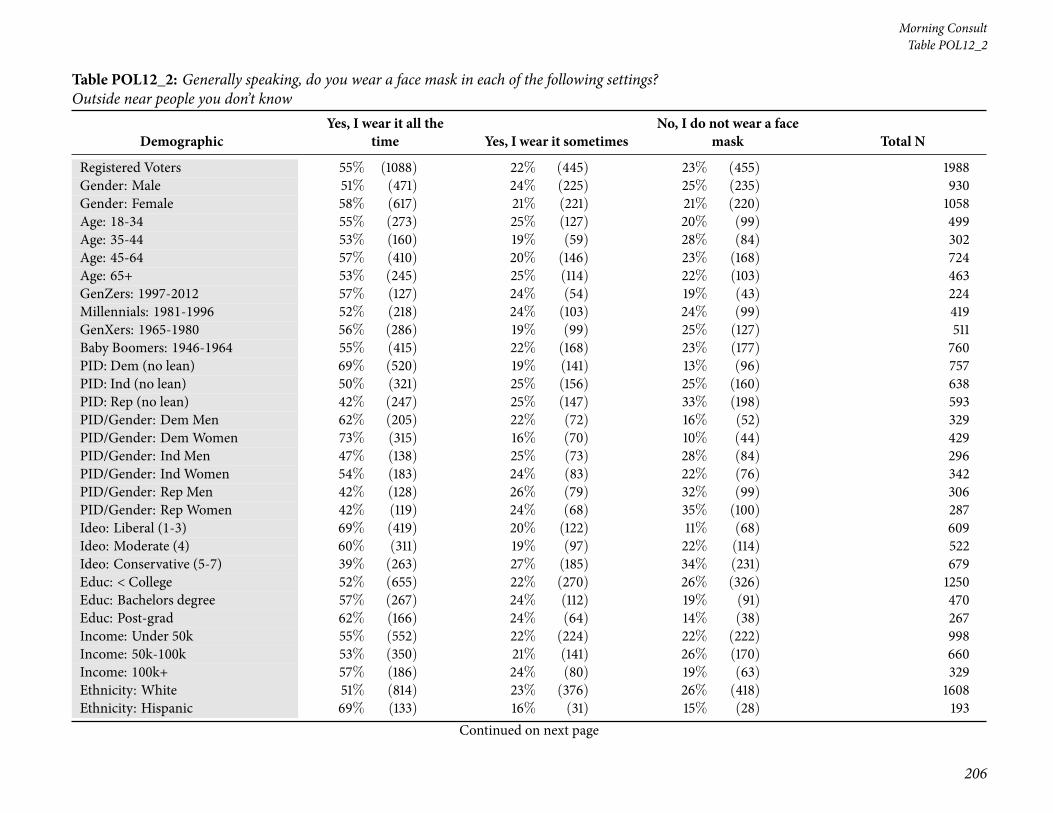
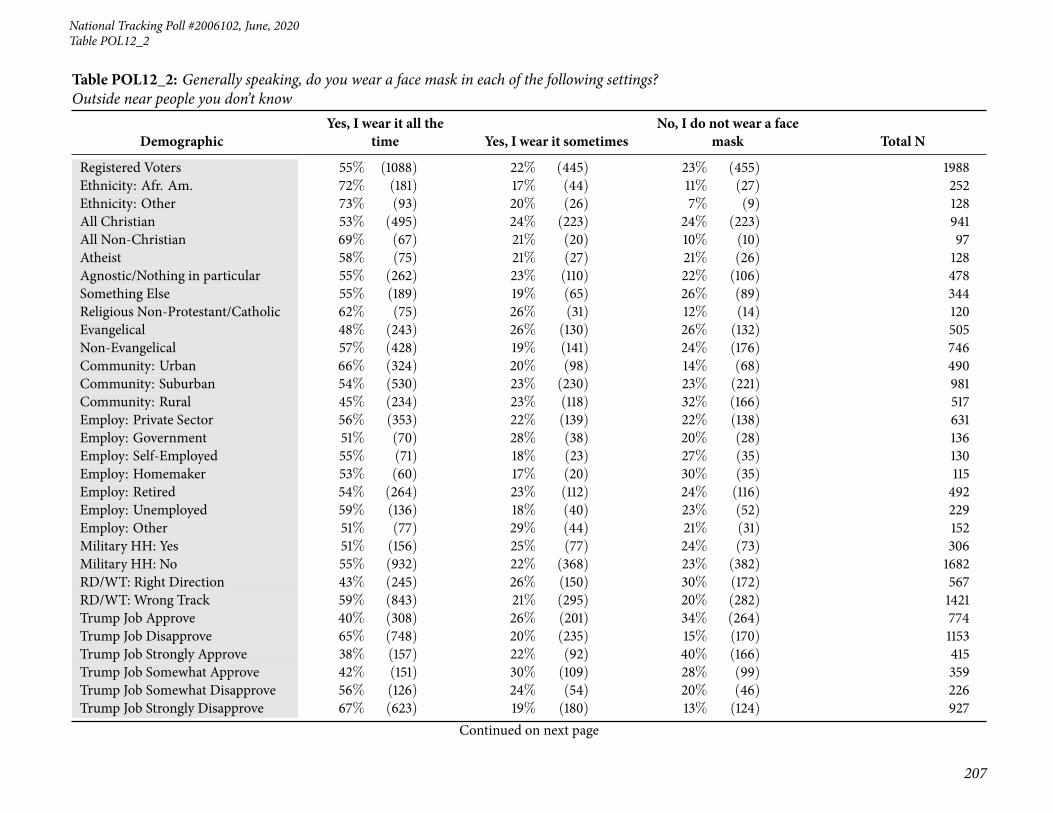
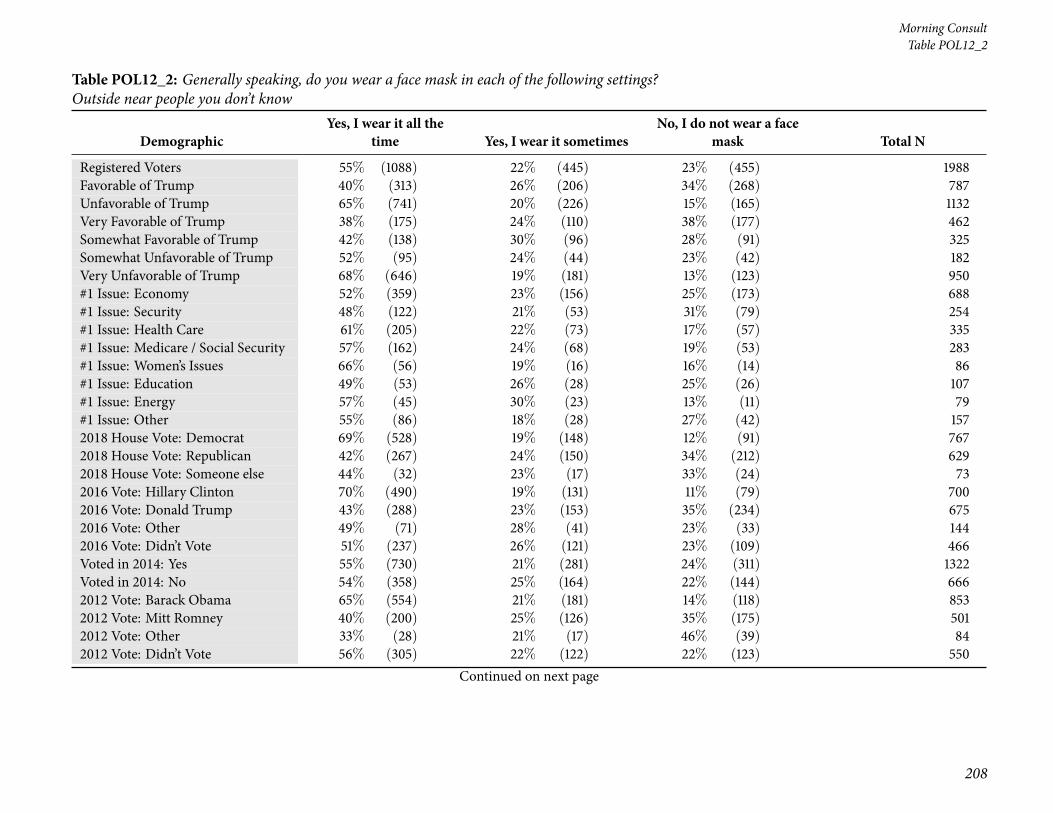
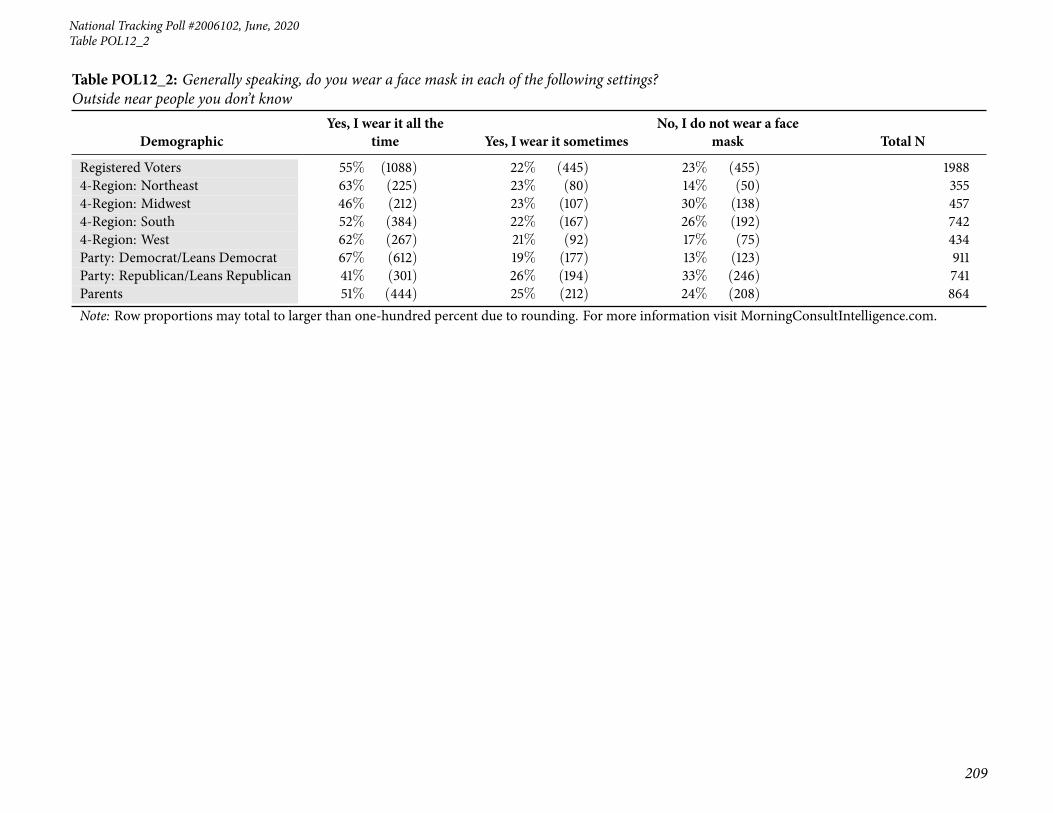
50 Table POL12_2: Generally speaking, do you wear a facemask in each of the following settings? Outsidenear people you don’t know . . . . . . . . . . . . . . . . . . . . . . . . . . . . . . . . . . . . . . . . 206
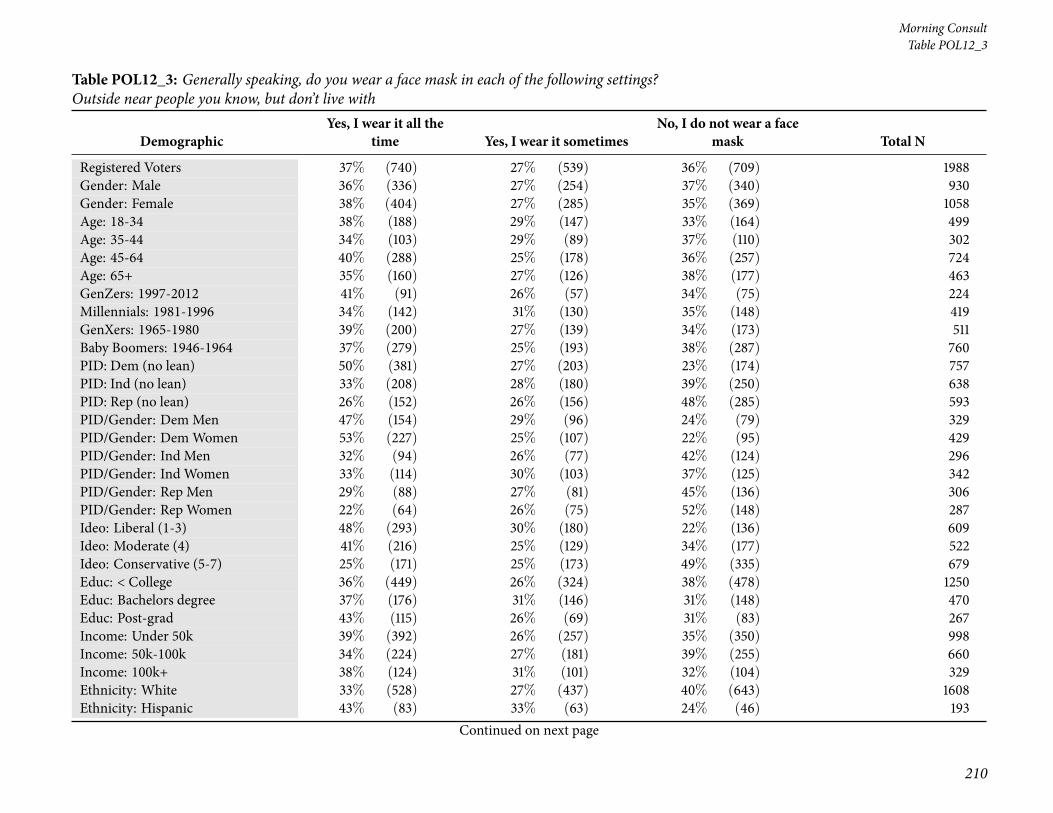
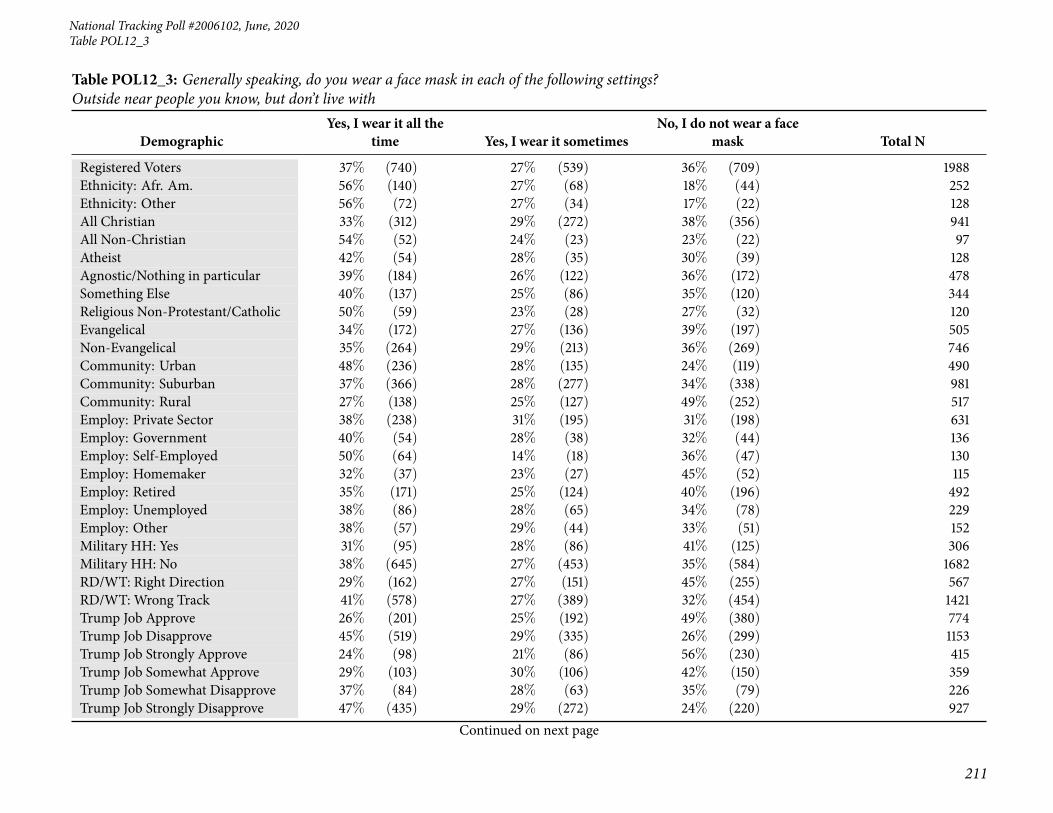
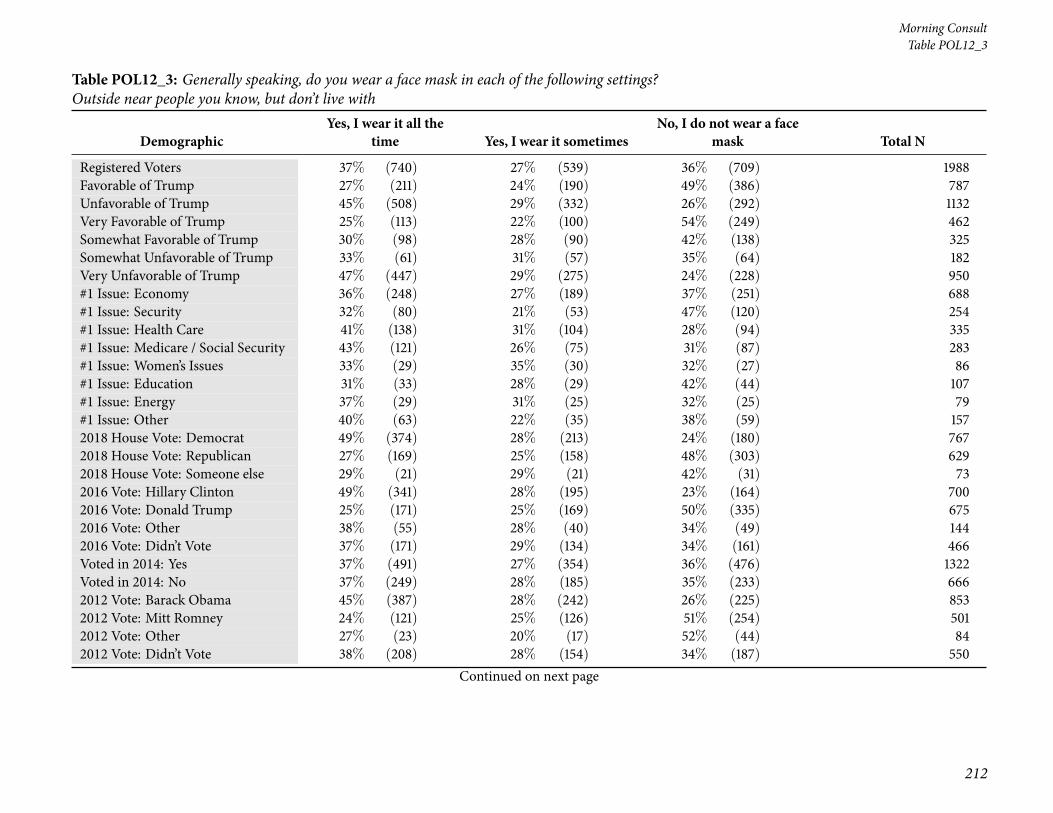
51 Table POL12_3: Generally speaking, do you wear a facemask in each of the following settings? Outsidenear people you know, but don’t live with . . . . . . . . . . . . . . . . . . . . . . . . . . . . . . . . . 210
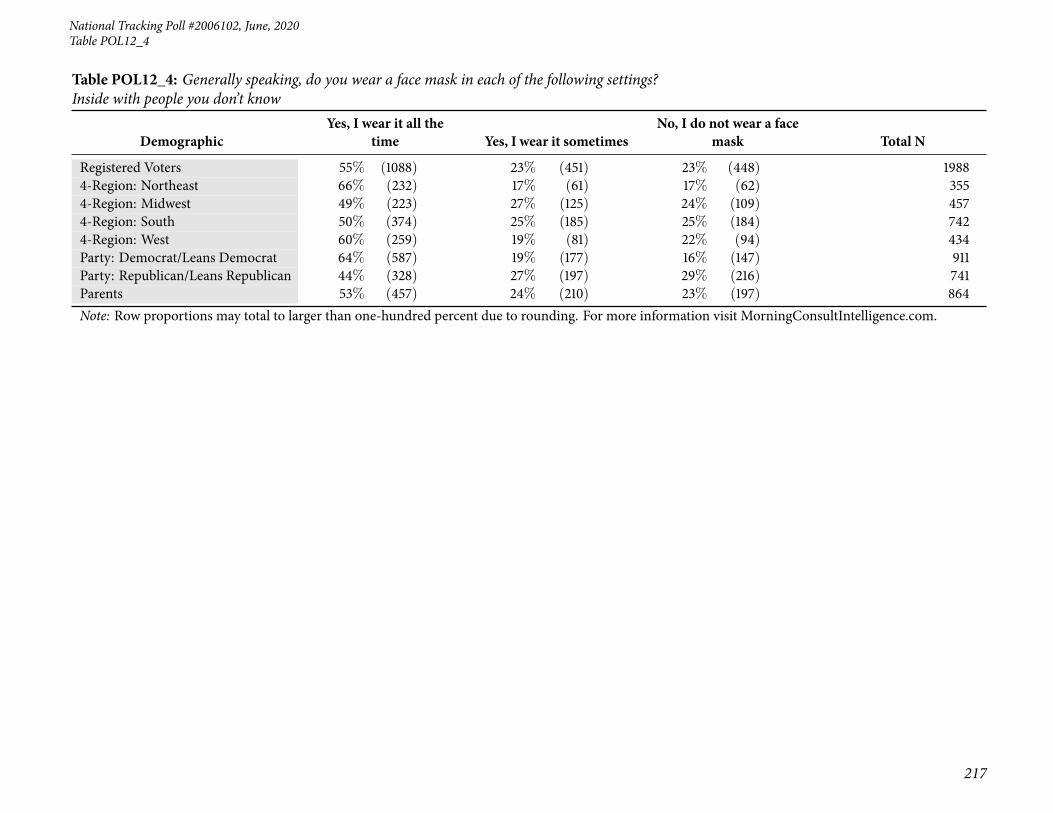
52 Table POL12_4: Generally speaking, do you wear a face mask in each of the following settings? Insidewith people you don’t know . . . . . . . . . . . . . . . . . . . . . . . . . . . . . . . . . . . . . . . . 214
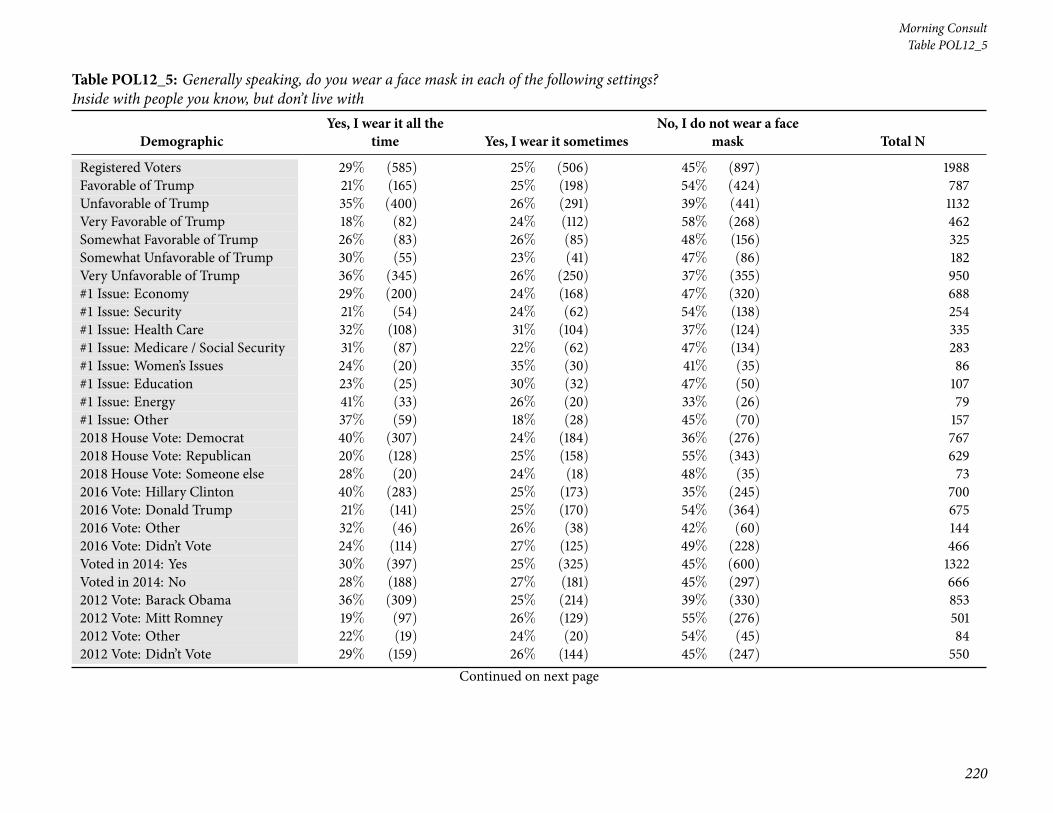
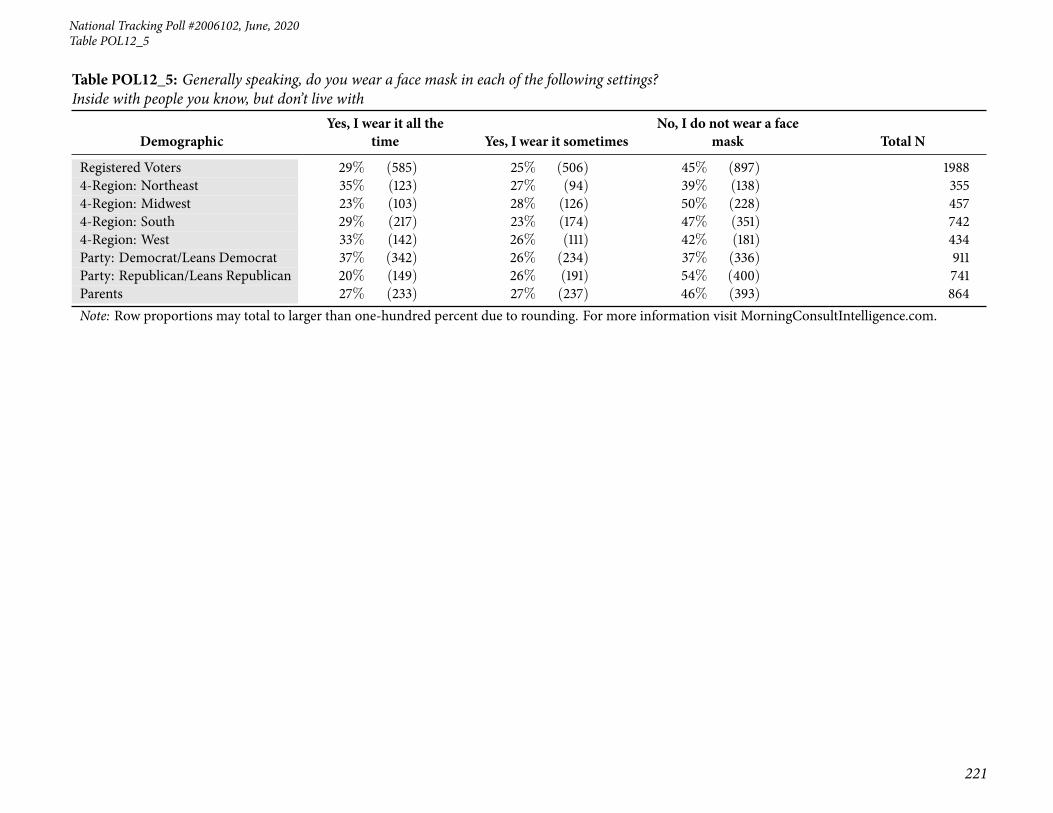
53 Table POL12_5: Generally speaking, do you wear a face mask in each of the following settings? Insidewith people you know, but don’t live with . . . . . . . . . . . . . . . . . . . . . . . . . . . . . . . . . 218
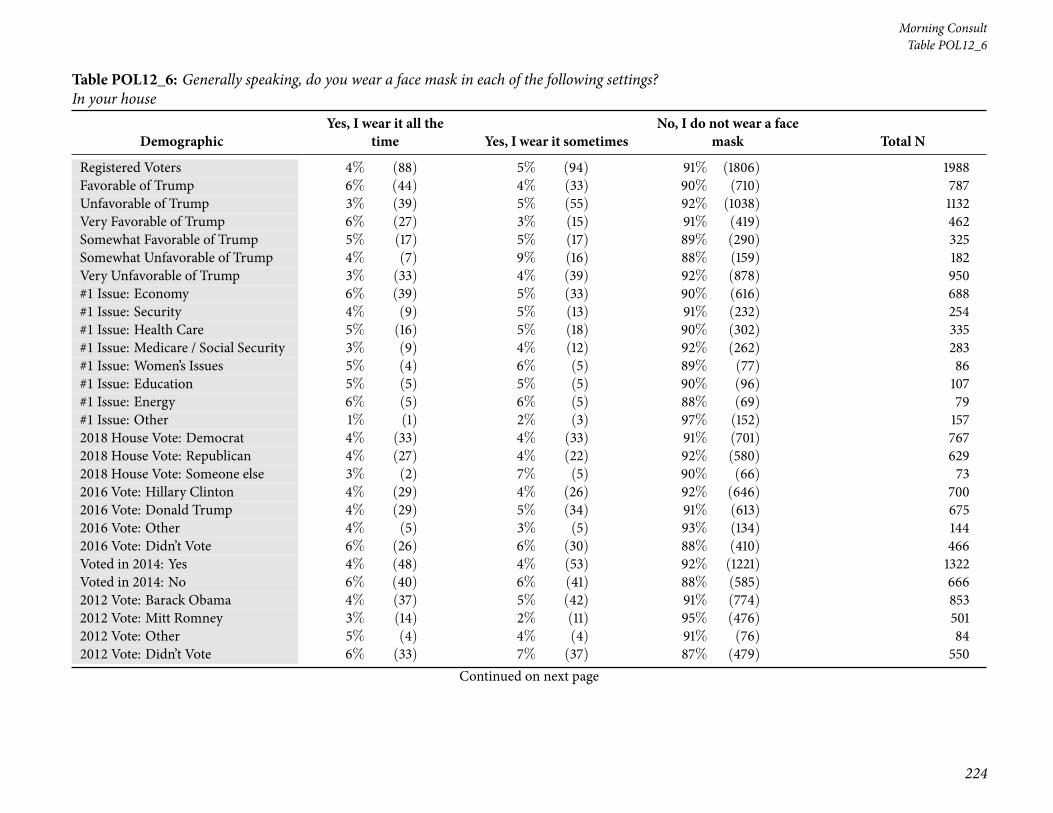
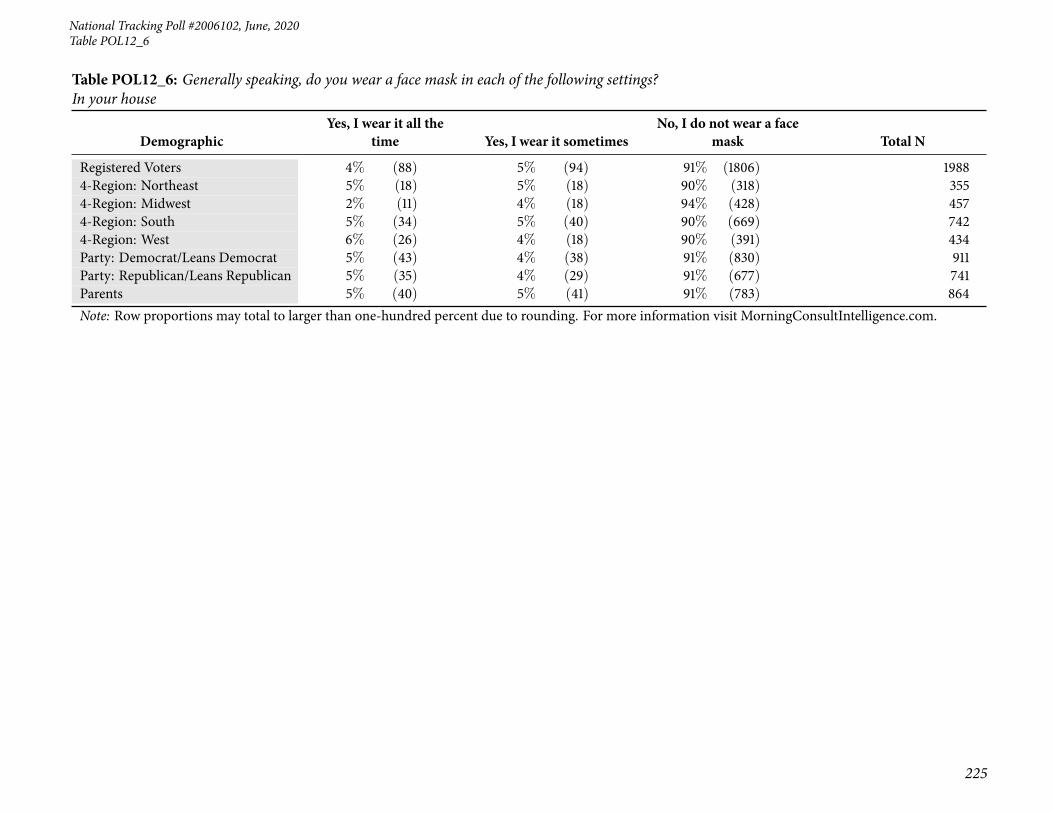
54 Table POL12_6: Generally speaking, do you wear a face mask in each of the following settings? In yourhouse . . . . . . . . . . . . . . . . . . . . . . . . . . . . . . . . . . . . . . . . . . . . . . . . . . . . 222
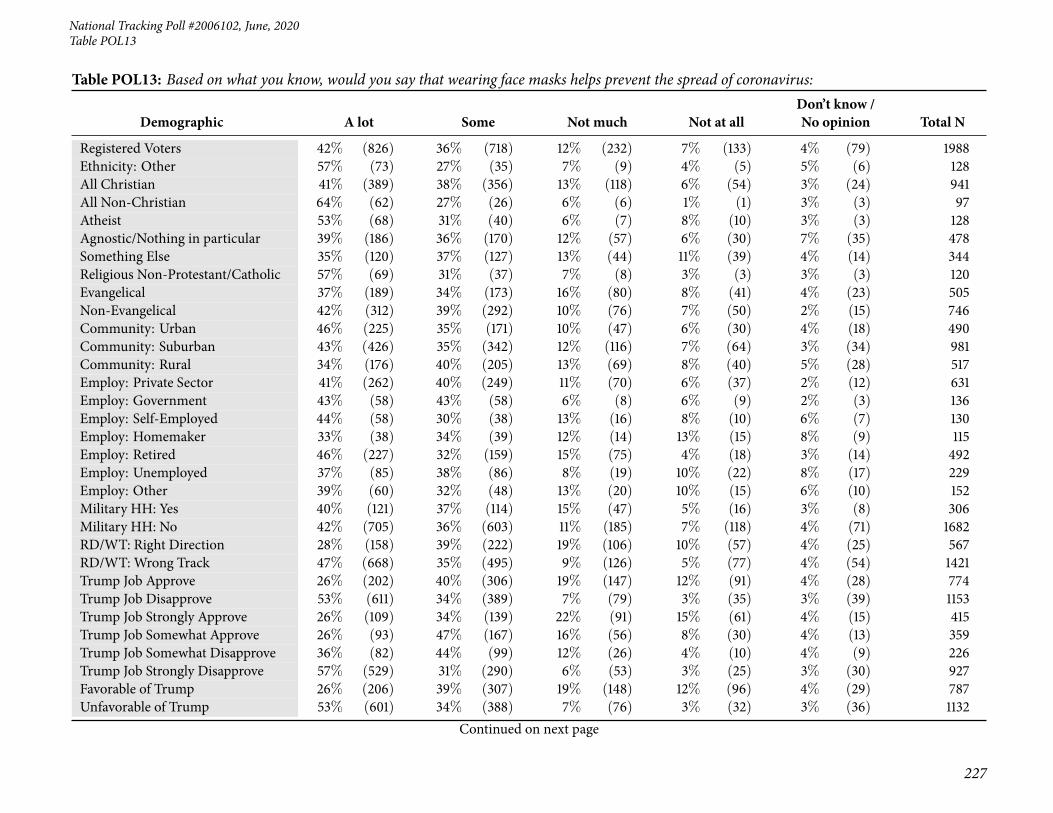
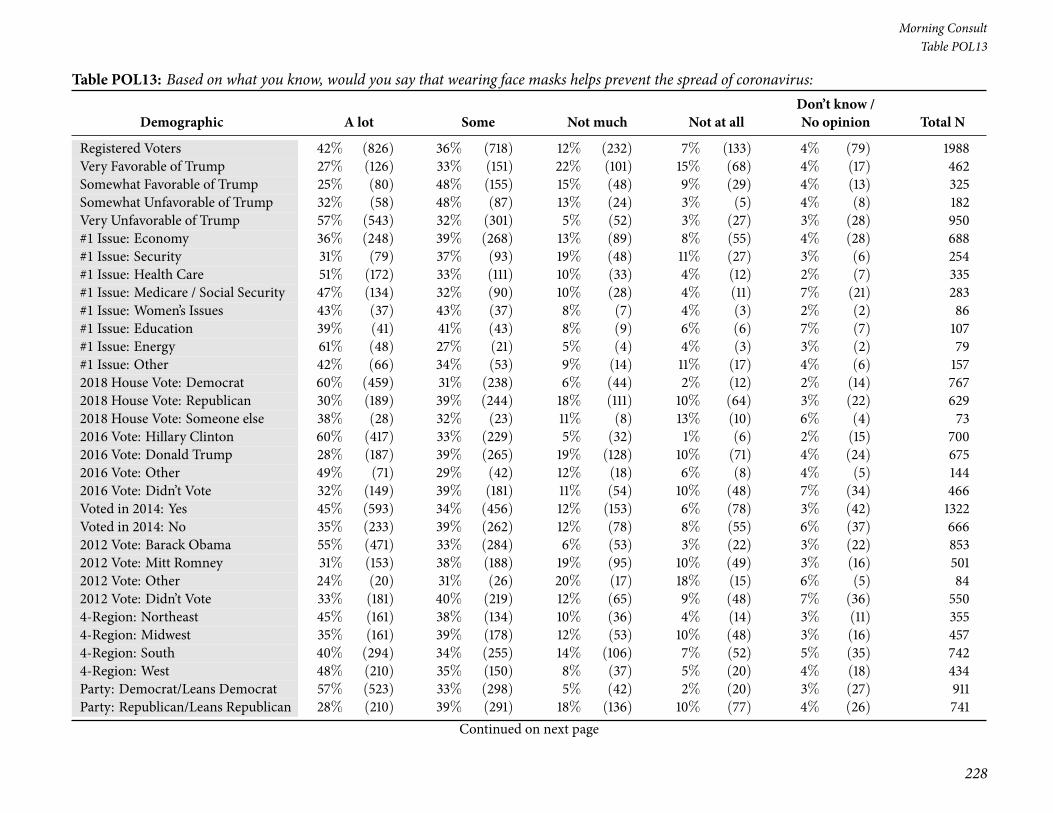
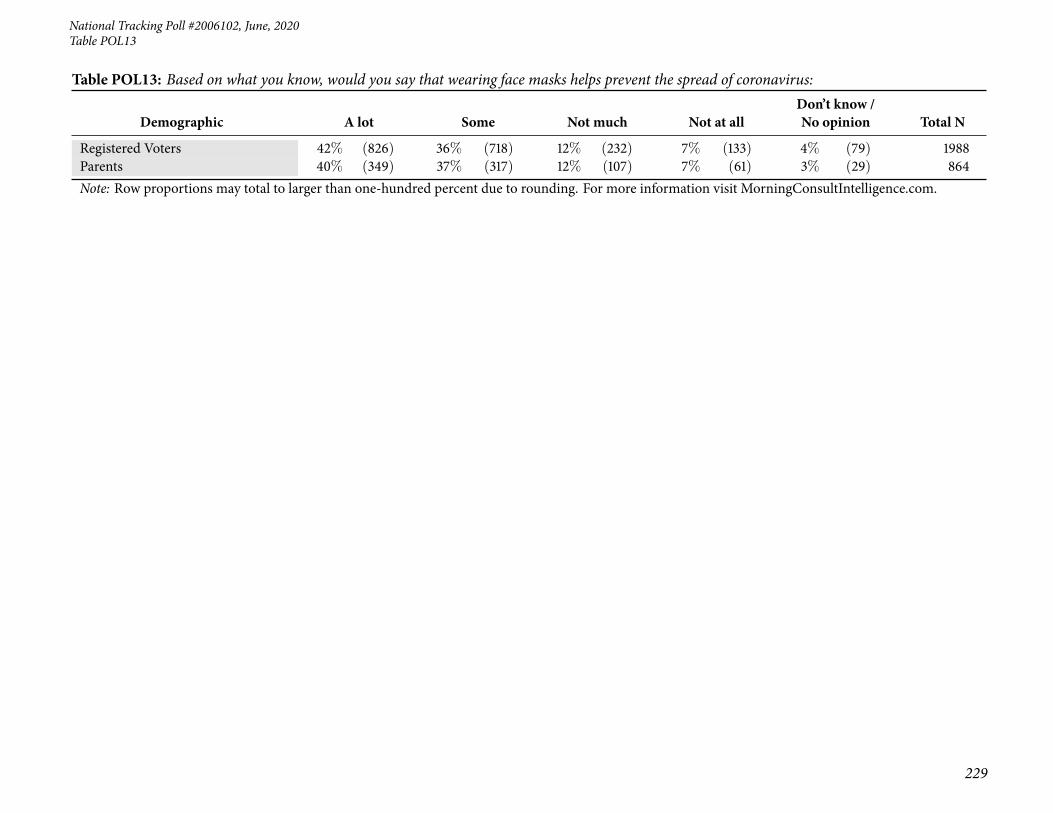
55 Table POL13: Based on what you know, would you say that wearing face masks helps prevent thespread of coronavirus: . . . . . . . . . . . . . . . . . . . . . . . . . . . . . . . . . . . . . . . . . . . 226
56 Table POL14_1: As you may know, the federal government’s CARES Act provides about $2 trillion tohelp workers and businesses cope with the coronavirus pandemic (including the Paycheck ProtectionProgram, which provides funds to businesses with fewer than 500 employees to keep workers on theirpayroll). In your view, to what degree has the CARES Act helped the following? Small businesses . . . . 230
4
Page 5
National Tracking Poll #2006102, June, 2020
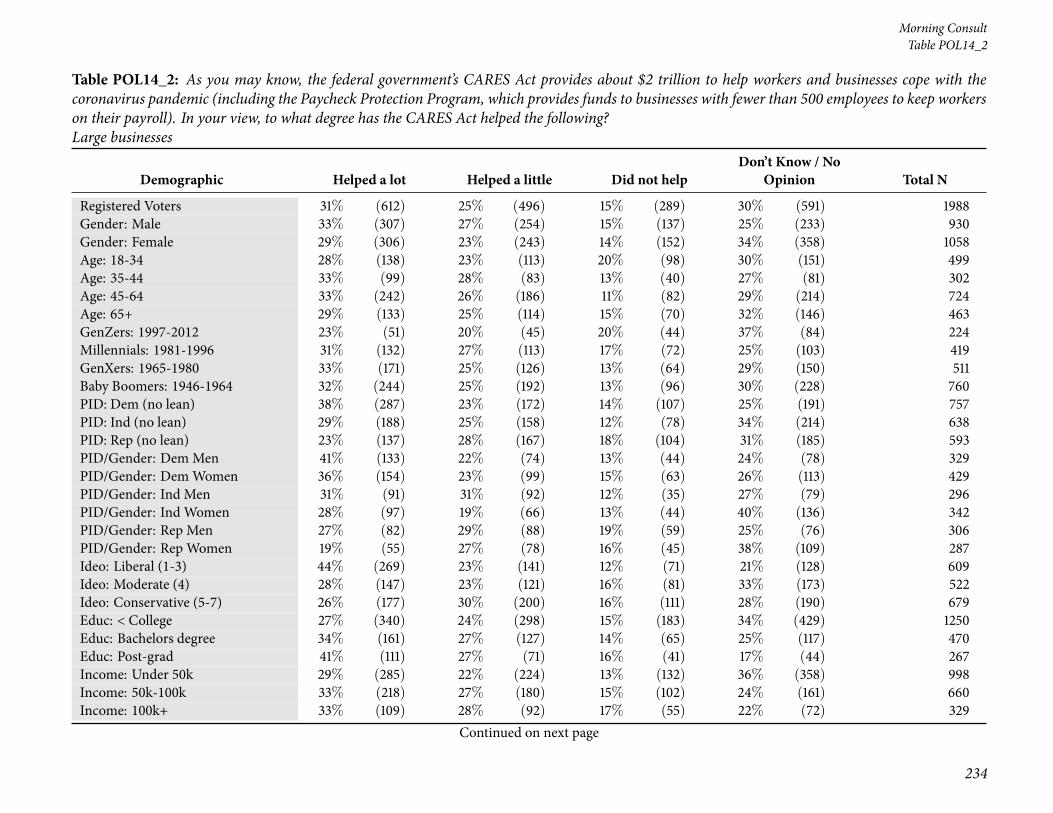
57 Table POL14_2: As you may know, the federal government’s CARES Act provides about $2 trillion tohelp workers and businesses cope with the coronavirus pandemic (including the Paycheck ProtectionProgram, which provides funds to businesses with fewer than 500 employees to keep workers on theirpayroll). In your view, to what degree has the CARES Act helped the following? Large businesses . . . . 234
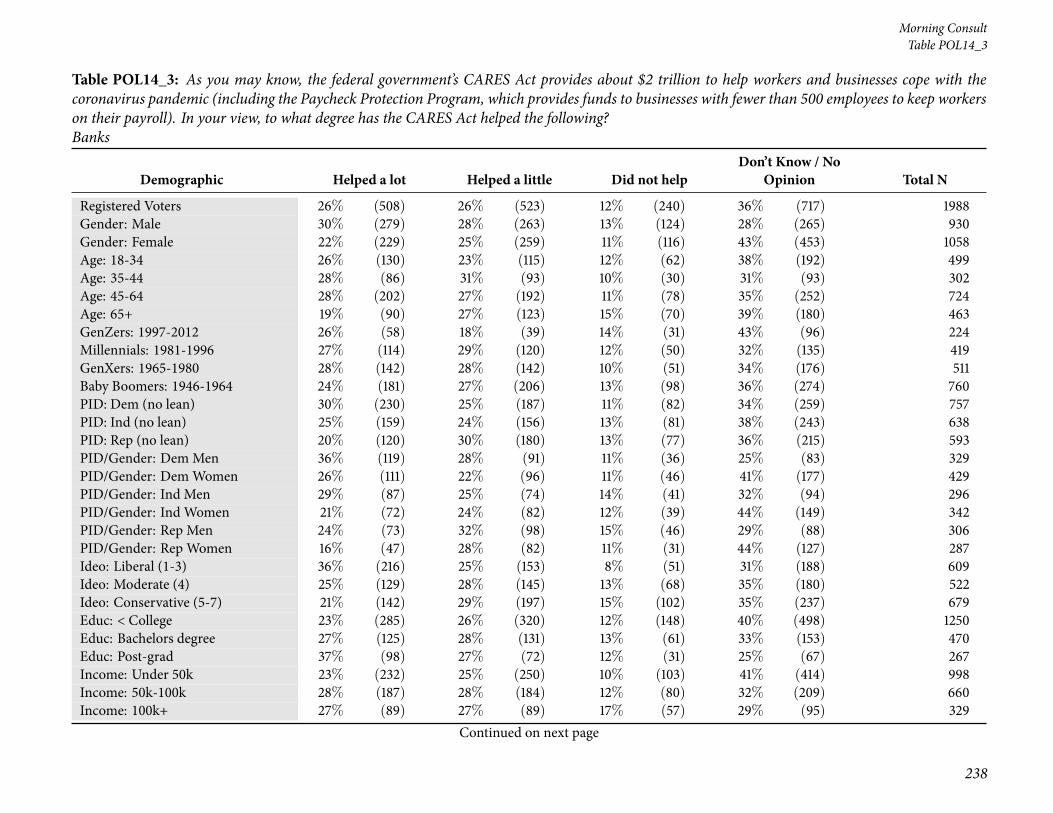
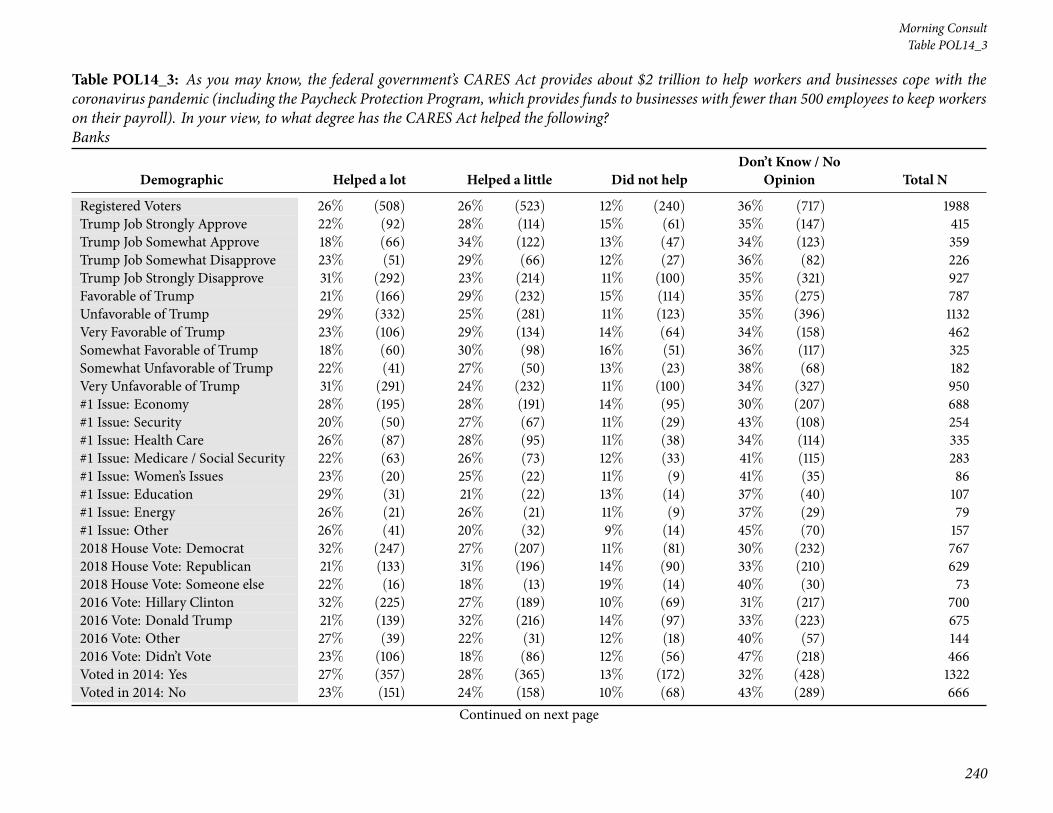
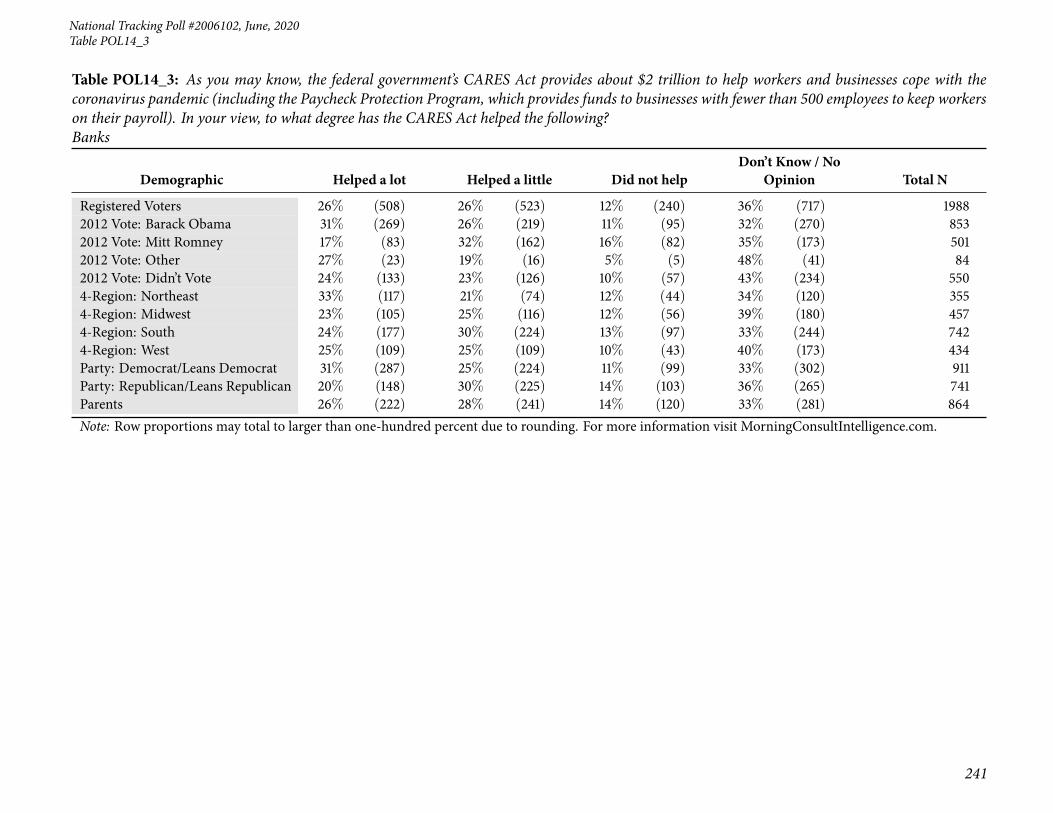
58 Table POL14_3: As you may know, the federal government’s CARES Act provides about $2 trillion tohelp workers and businesses cope with the coronavirus pandemic (including the Paycheck ProtectionProgram, which provides funds to businesses with fewer than 500 employees to keep workers on theirpayroll). In your view, to what degree has the CARES Act helped the following? Banks . . . . . . . . . 238
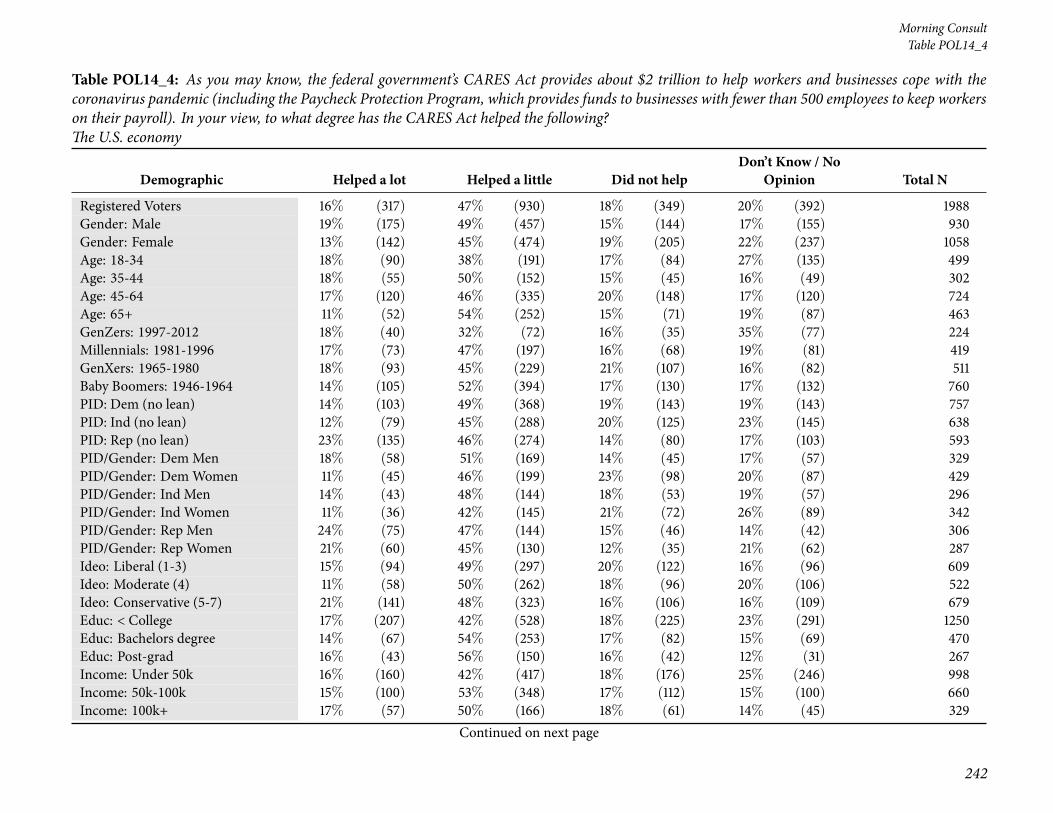
59 Table POL14_4: As you may know, the federal government’s CARES Act provides about $2 trillion tohelp workers and businesses cope with the coronavirus pandemic (including the Paycheck ProtectionProgram, which provides funds to businesses with fewer than 500 employees to keep workers on theirpayroll). In your view, to what degree has the CARES Act helped the following? The U.S. economy . . . 242
60 Table POL14_5: As you may know, the federal government’s CARES Act provides about $2 trillion tohelp workers and businesses cope with the coronavirus pandemic (including the Paycheck ProtectionProgram, which provides funds to businesses with fewer than 500 employees to keep workers on theirpayroll). In your view, to what degree has the CARES Act helped the following? Low-income Americans 246
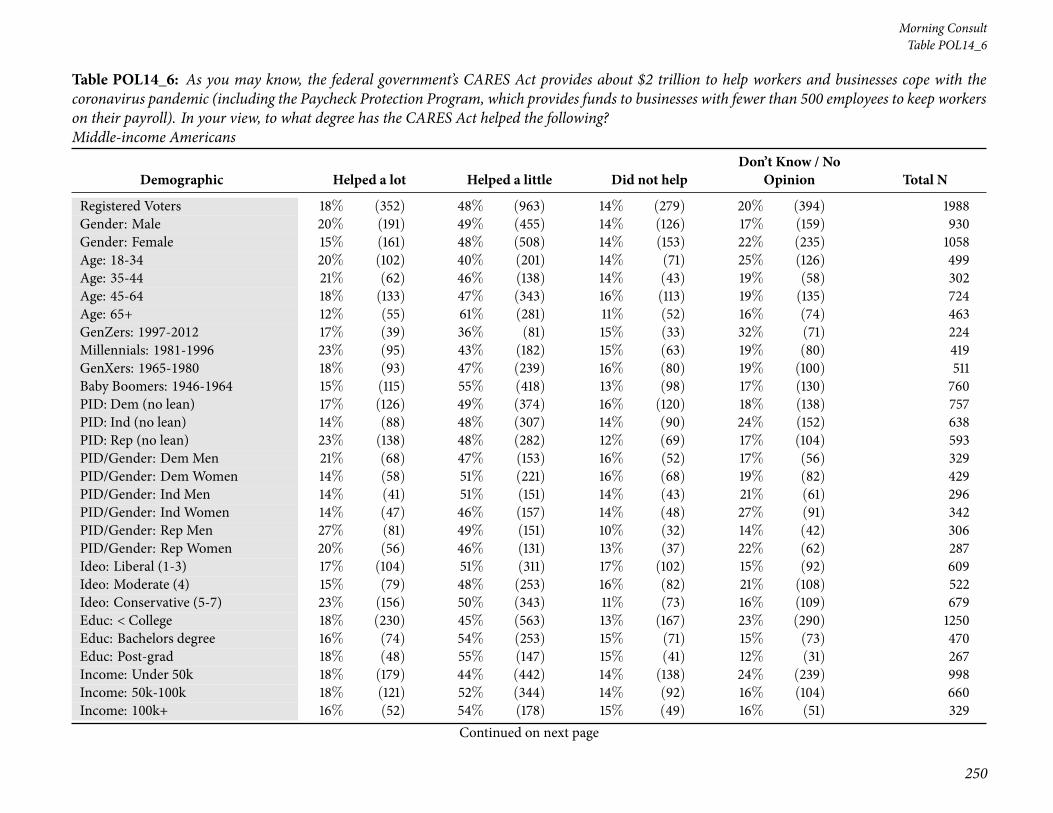
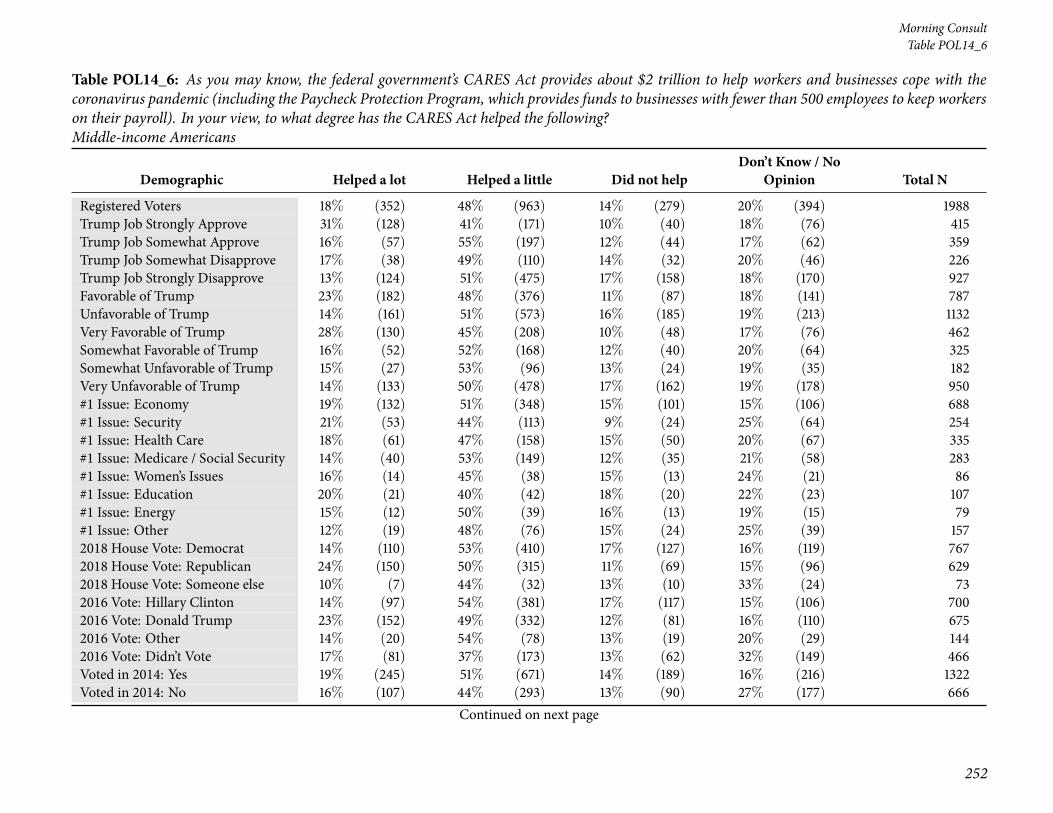
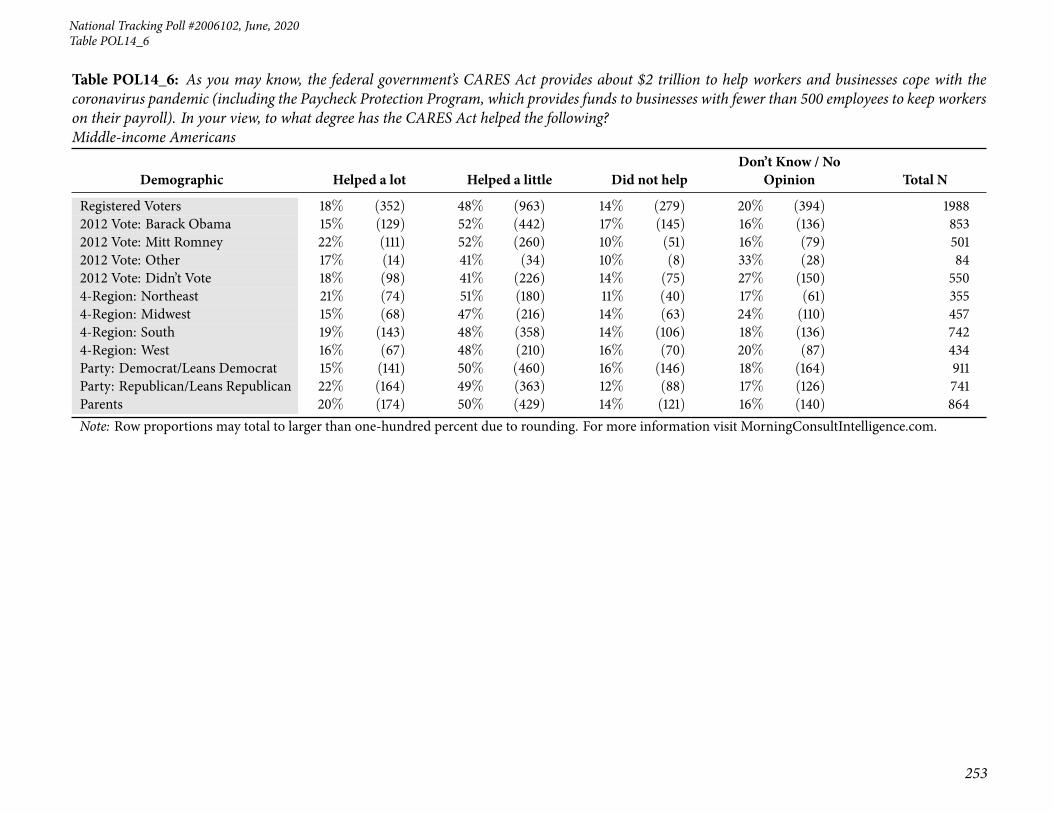
61 Table POL14_6: As you may know, the federal government’s CARES Act provides about $2 trillion tohelp workers and businesses cope with the coronavirus pandemic (including the Paycheck ProtectionProgram, which provides funds to businesses with fewer than 500 employees to keep workers on theirpayroll). In your view, to what degree has the CARES Act helped the following? Middle-income Americans250
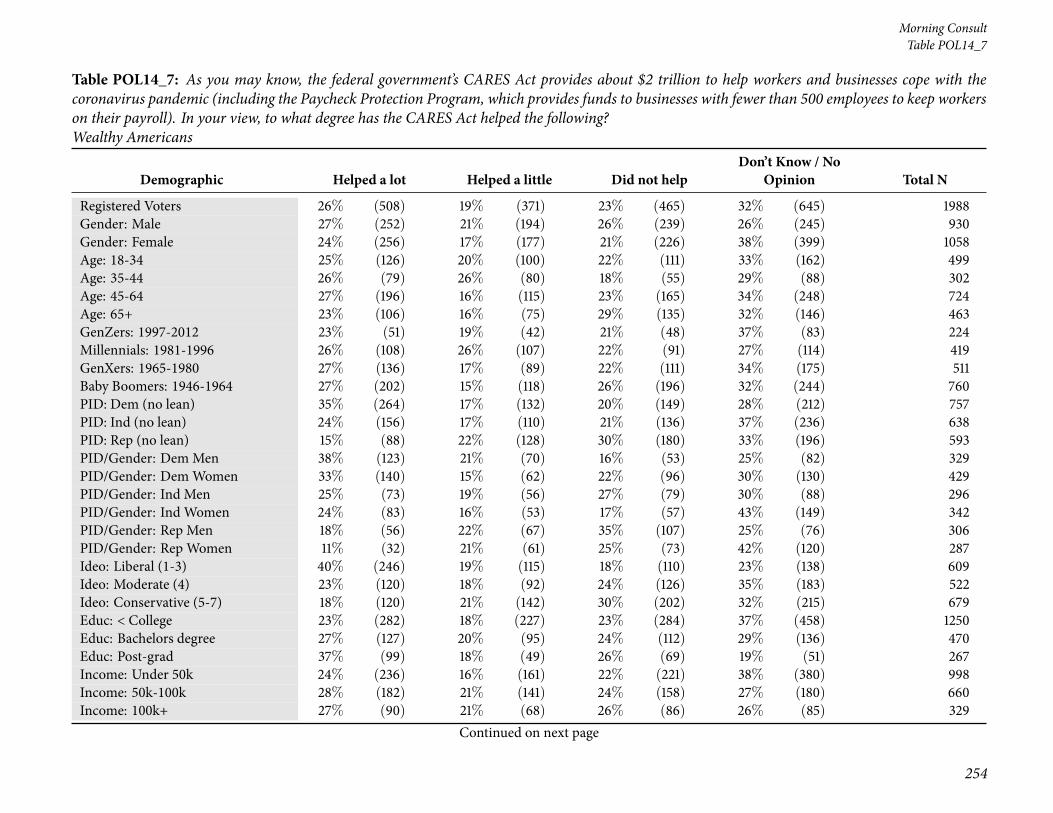
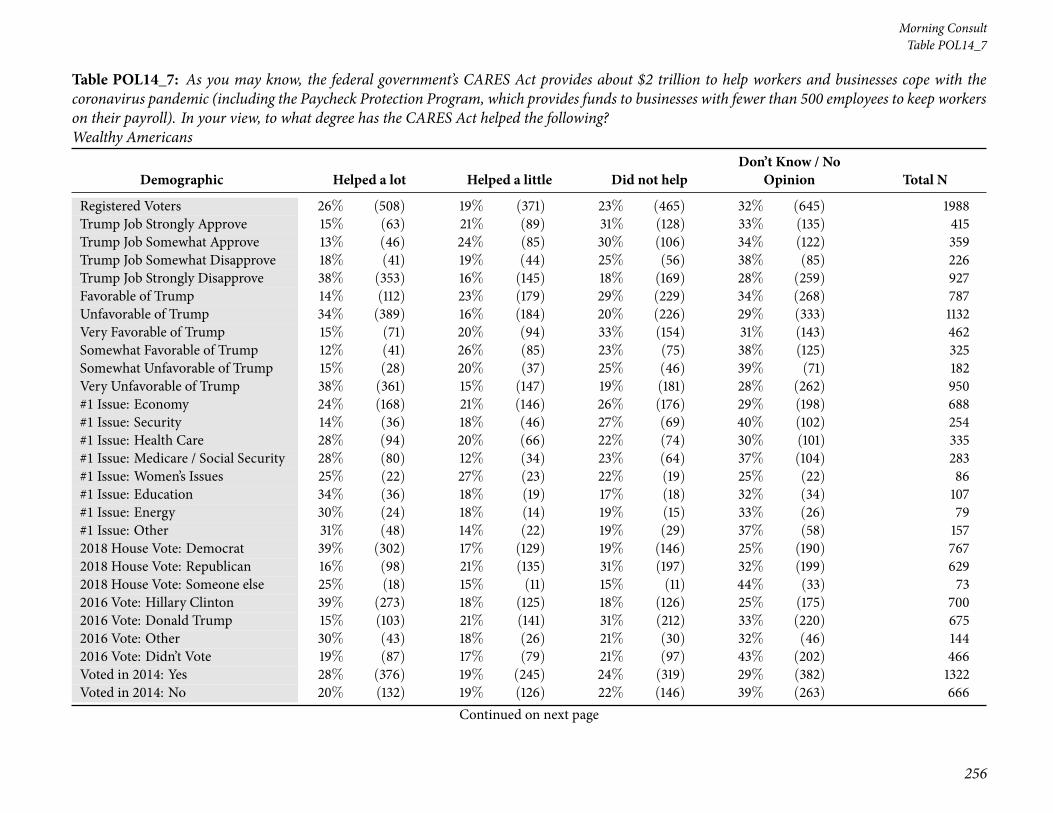
62 Table POL14_7: As you may know, the federal government’s CARES Act provides about $2 trillion tohelp workers and businesses cope with the coronavirus pandemic (including the Paycheck ProtectionProgram, which provides funds to businesses with fewer than 500 employees to keep workers on theirpayroll). In your view, to what degree has the CARES Act helped the following? Wealthy Americans . . 254
63 Table POL14_8: As you may know, the federal government’s CARES Act provides about $2 trillion tohelp workers and businesses cope with the coronavirus pandemic (including the Paycheck ProtectionProgram, which provides funds to businesses with fewer than 500 employees to keep workers on theirpayroll). In your view, to what degree has the CARES Act helped the following? Black Americans . . . 258
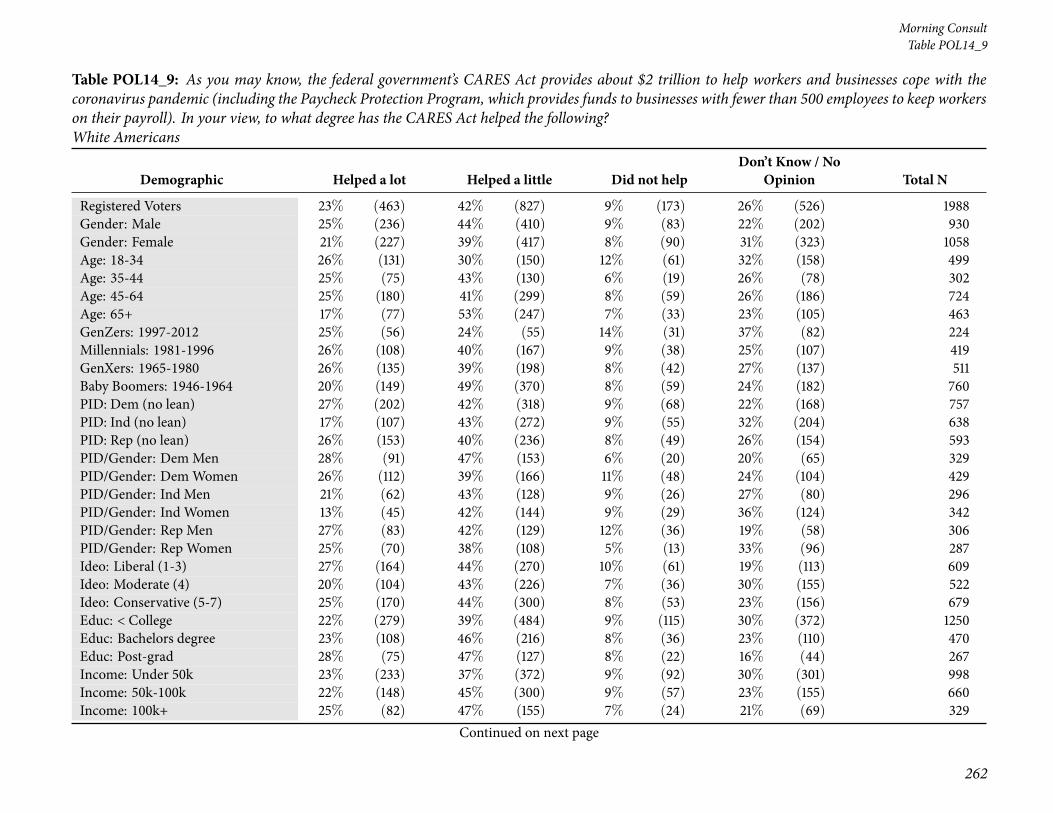
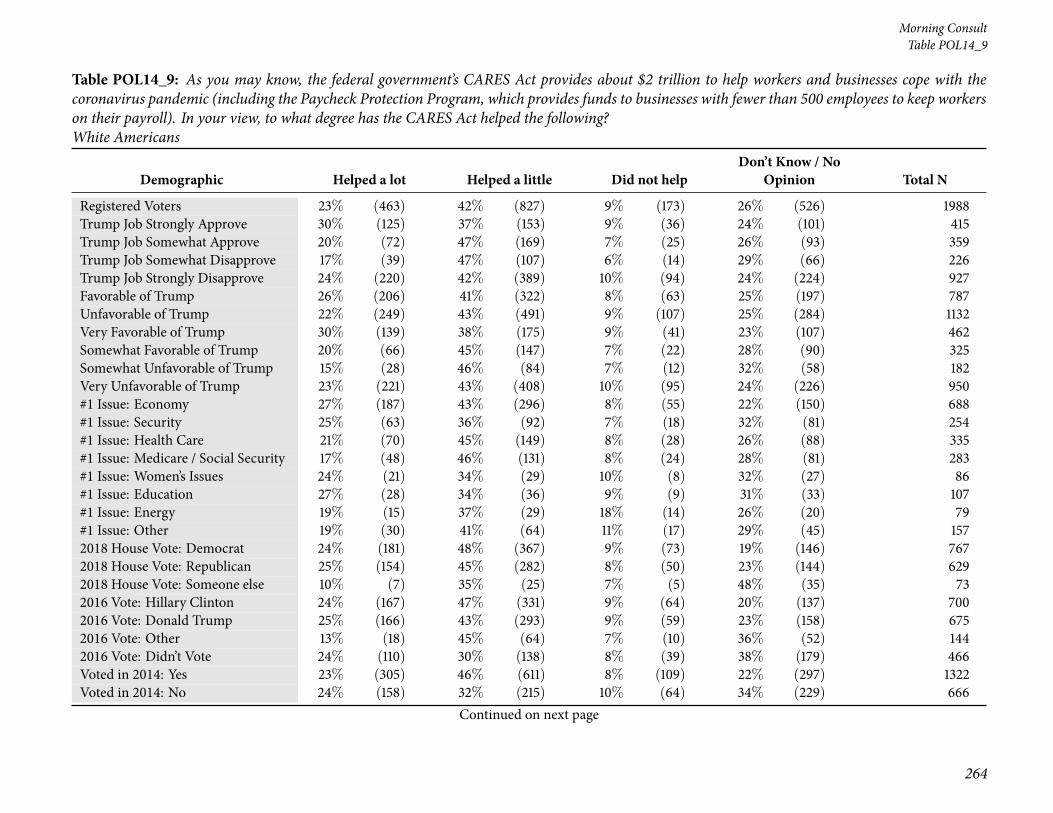
64 Table POL14_9: As you may know, the federal government’s CARES Act provides about $2 trillion tohelp workers and businesses cope with the coronavirus pandemic (including the Paycheck ProtectionProgram, which provides funds to businesses with fewer than 500 employees to keep workers on theirpayroll). In your view, to what degree has the CARES Act helped the following? White Americans . . . 262
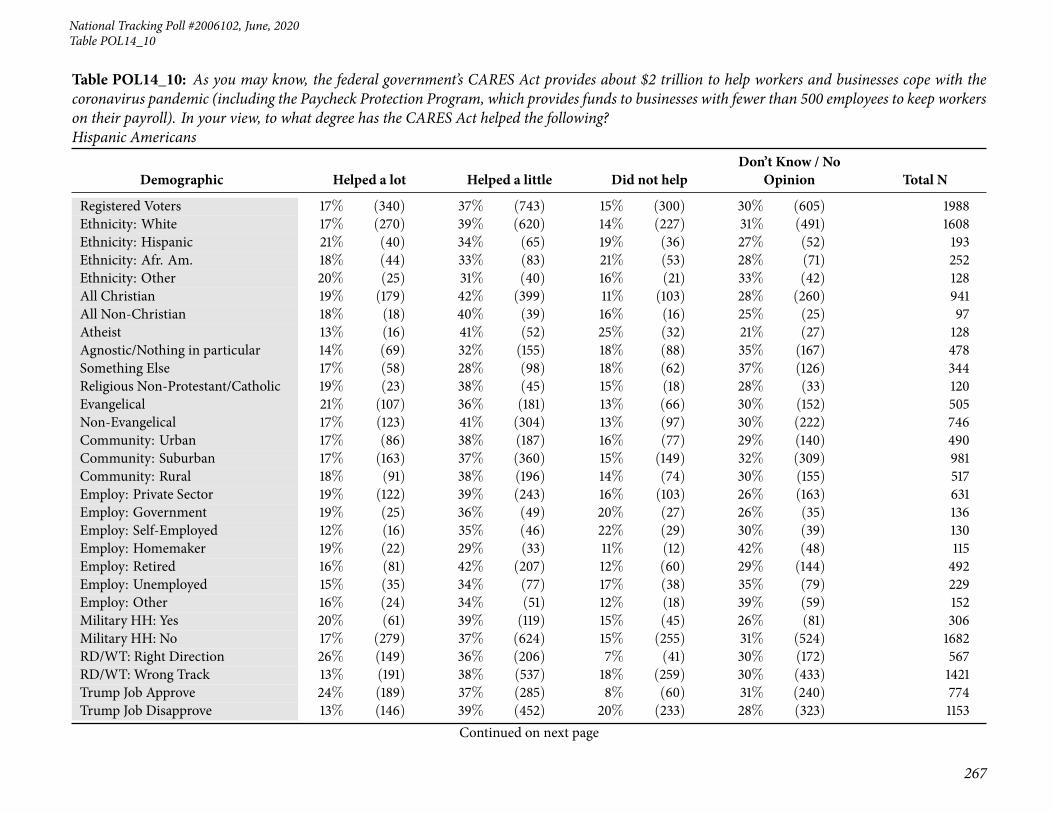
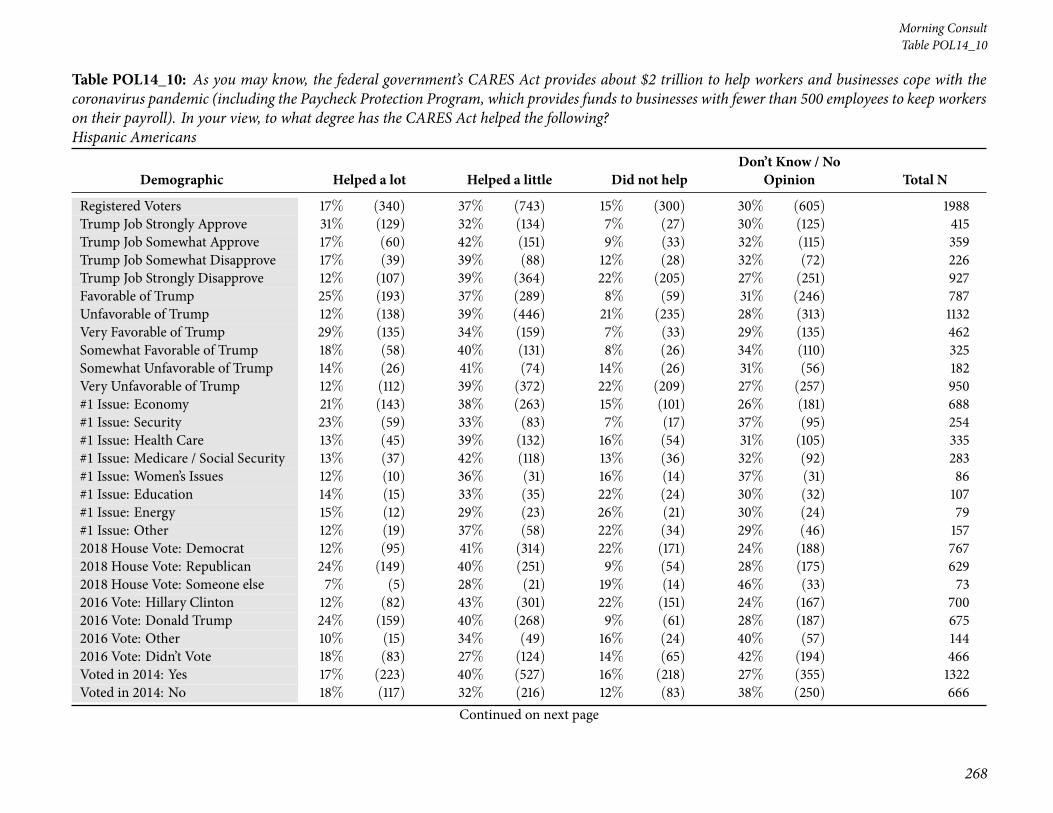
65 Table POL14_10: As you may know, the federal government’s CARES Act provides about $2 trillionto help workers and businesses cope with the coronavirus pandemic (including the Paycheck ProtectionProgram, which provides funds to businesses with fewer than 500 employees to keep workers on theirpayroll). In your view, to what degree has the CARES Act helped the following? Hispanic Americans . . 266
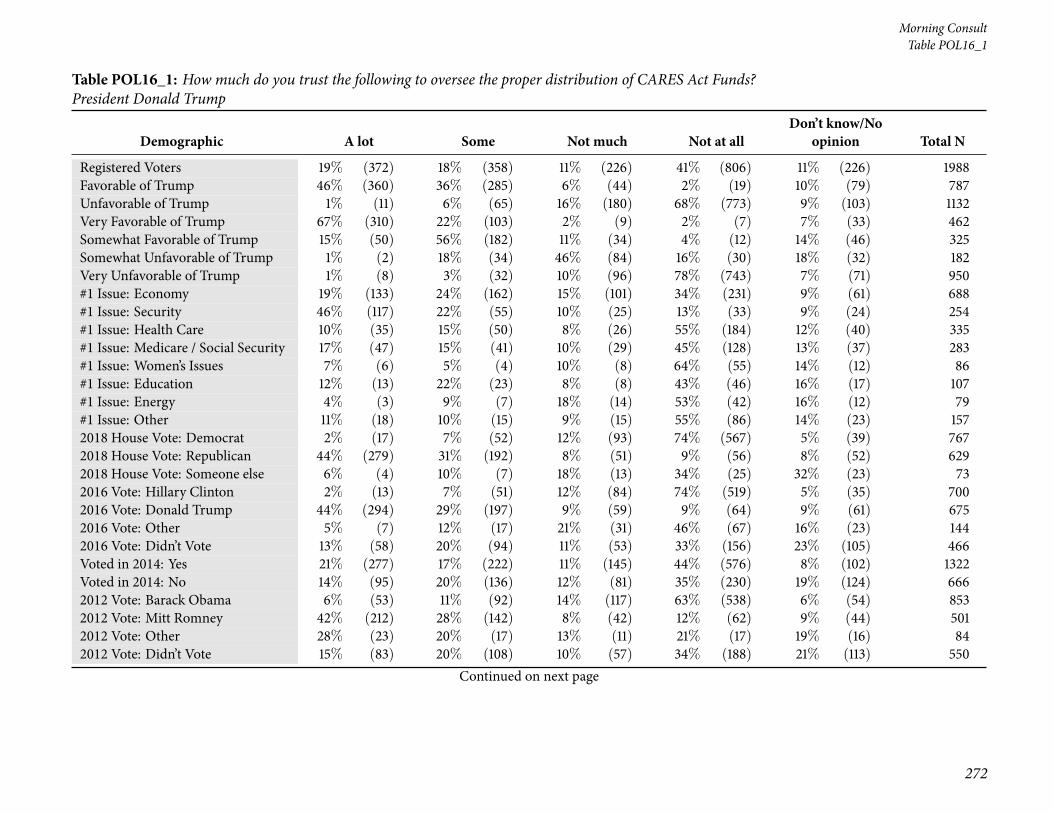
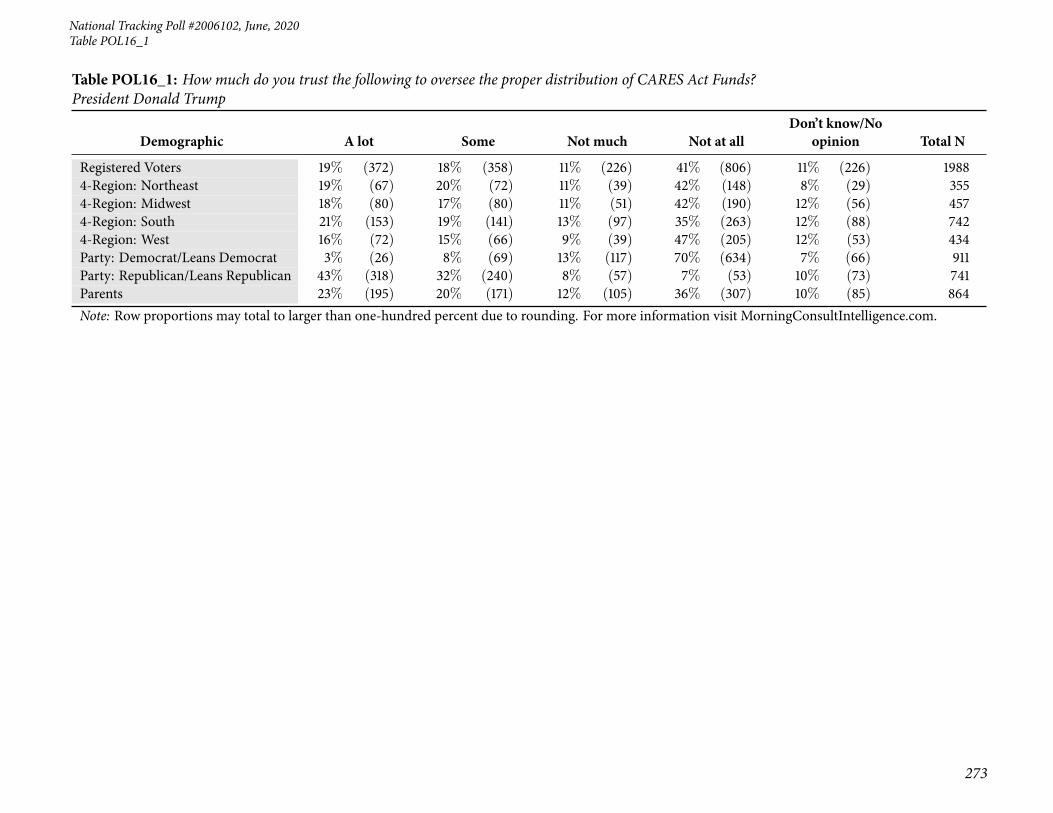
66 Table POL16_1: How much do you trust the following to oversee the proper distribution of CARES ActFunds? President Donald Trump . . . . . . . . . . . . . . . . . . . . . . . . . . . . . . . . . . . . . 270
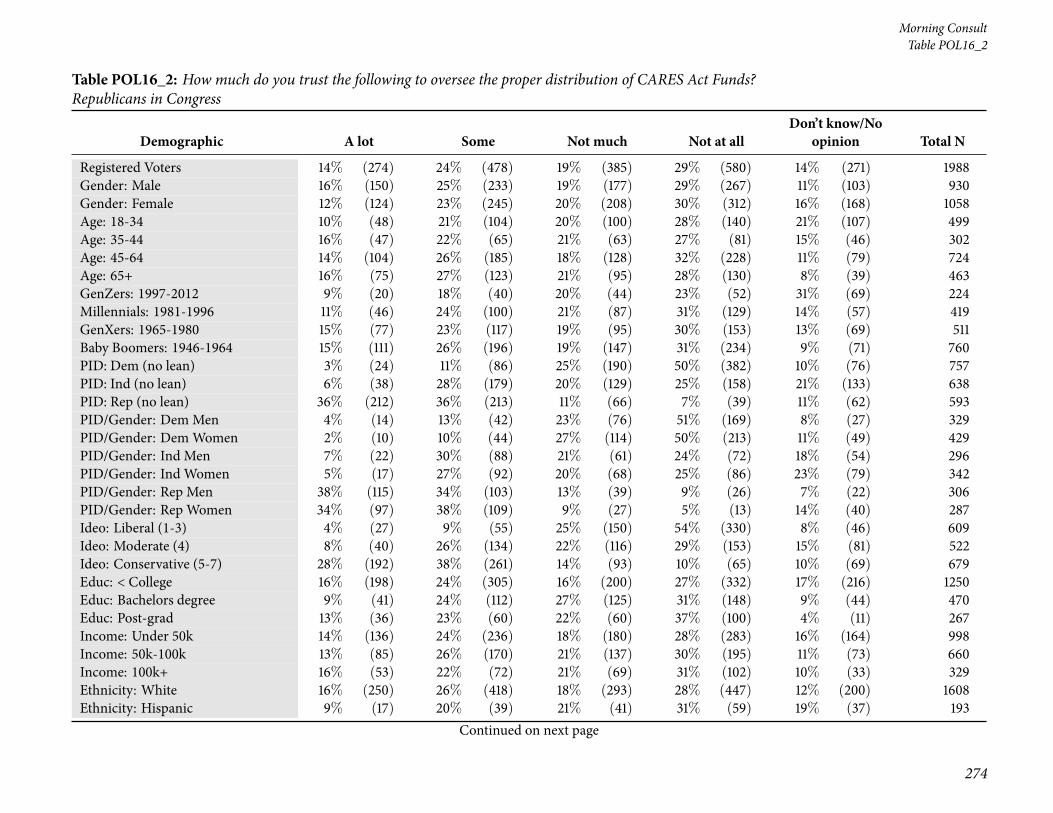
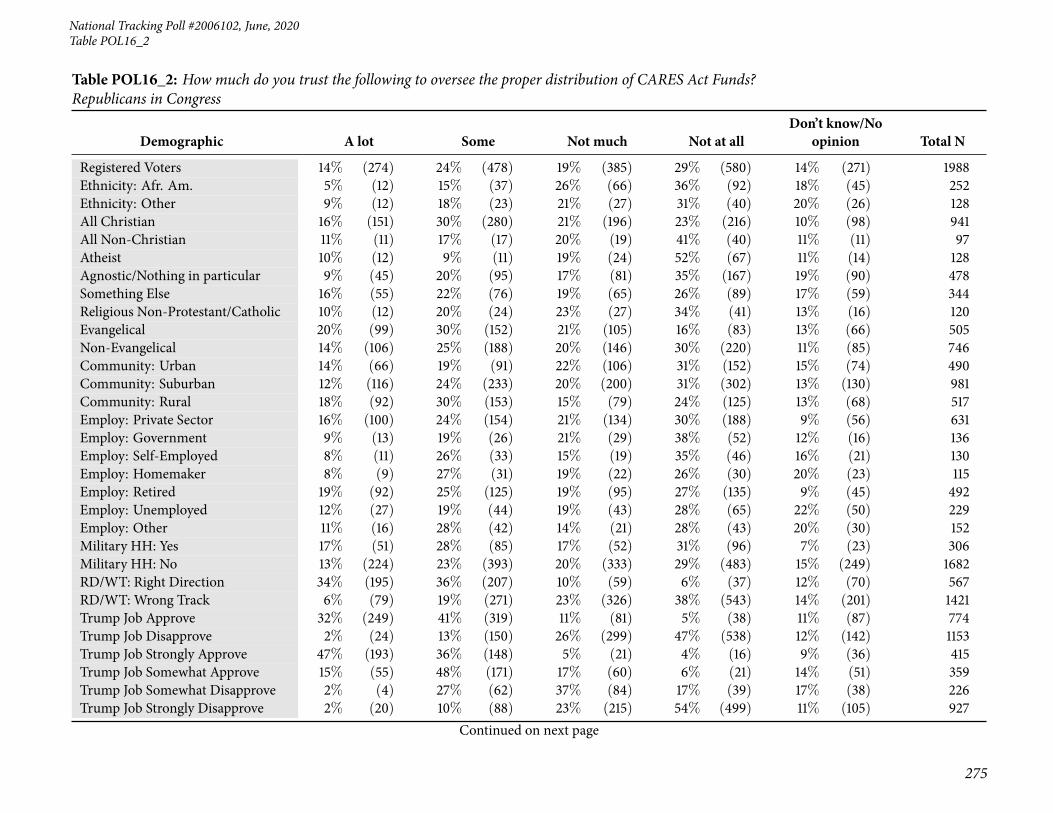
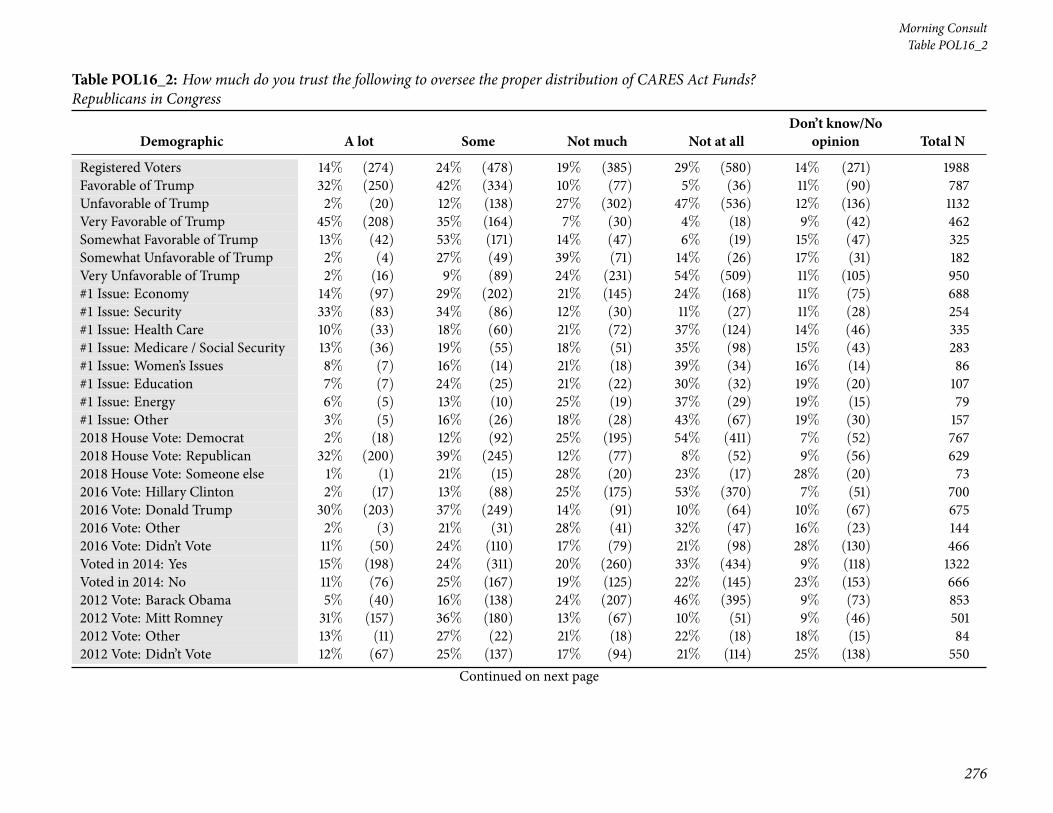
67 Table POL16_2: How much do you trust the following to oversee the proper distribution of CARES ActFunds? Republicans in Congress . . . . . . . . . . . . . . . . . . . . . . . . . . . . . . . . . . . . . . 274
5
Page 6
Morning Consult
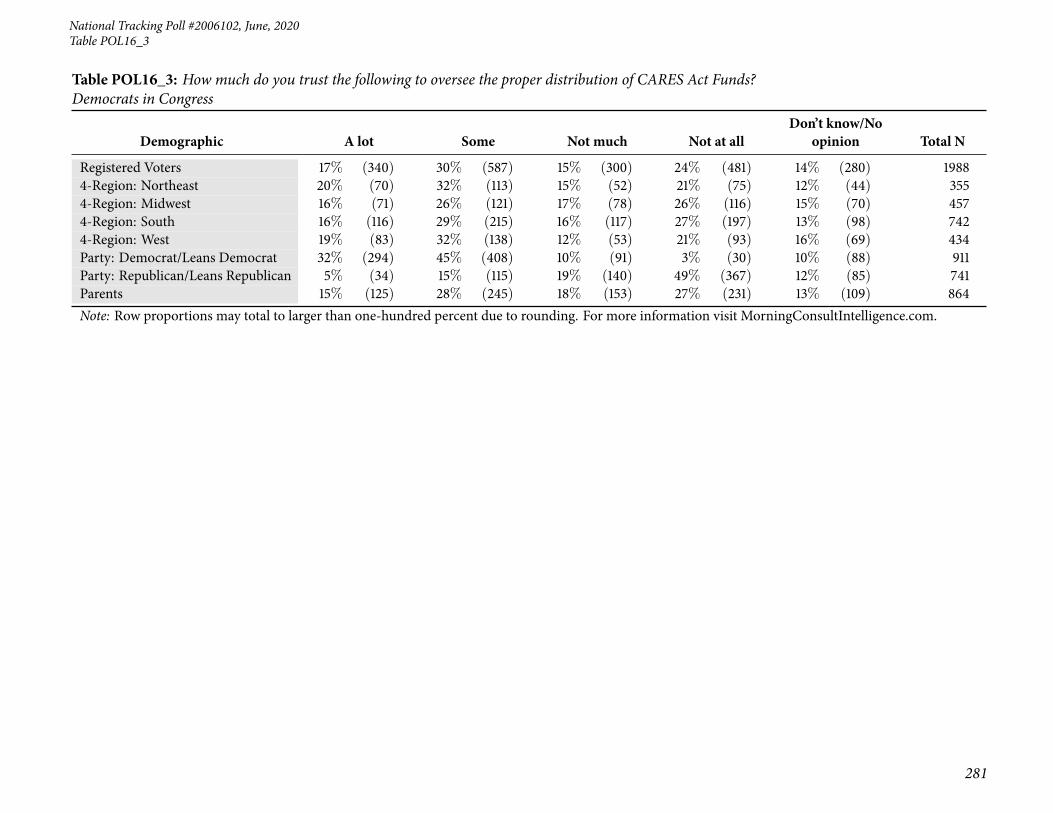
68 Table POL16_3: How much do you trust the following to oversee the proper distribution of CARES ActFunds? Democrats in Congress . . . . . . . . . . . . . . . . . . . . . . . . . . . . . . . . . . . . . . 278
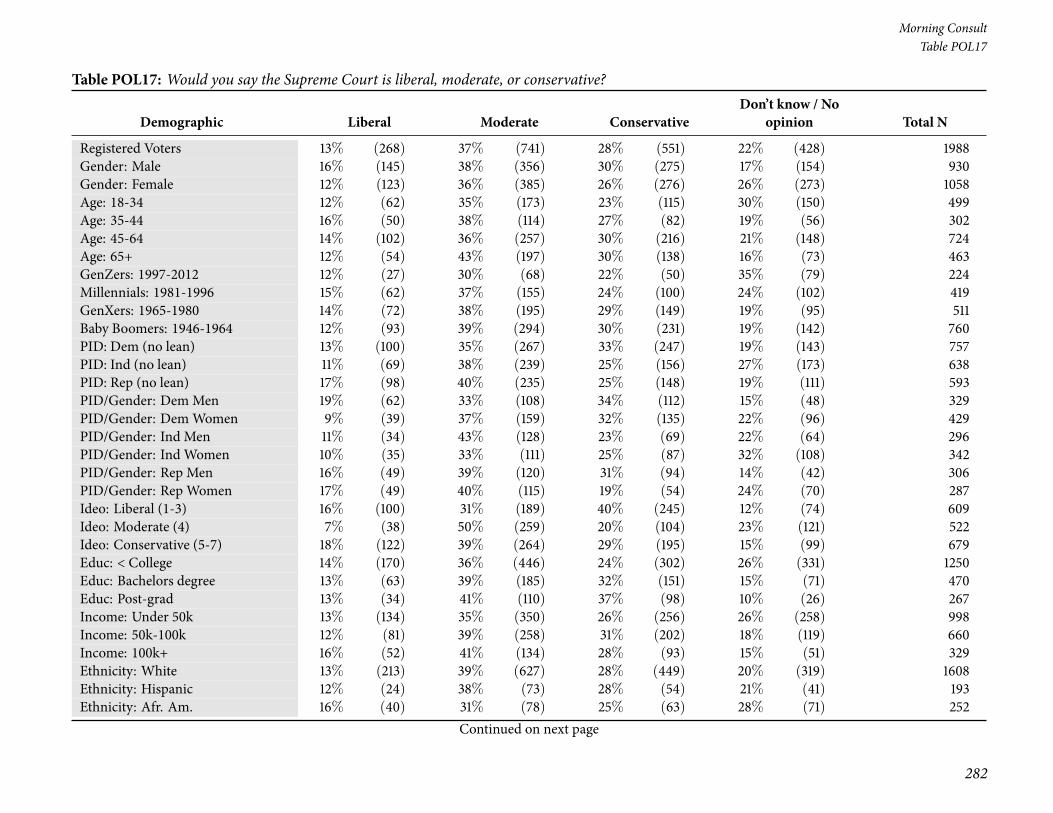
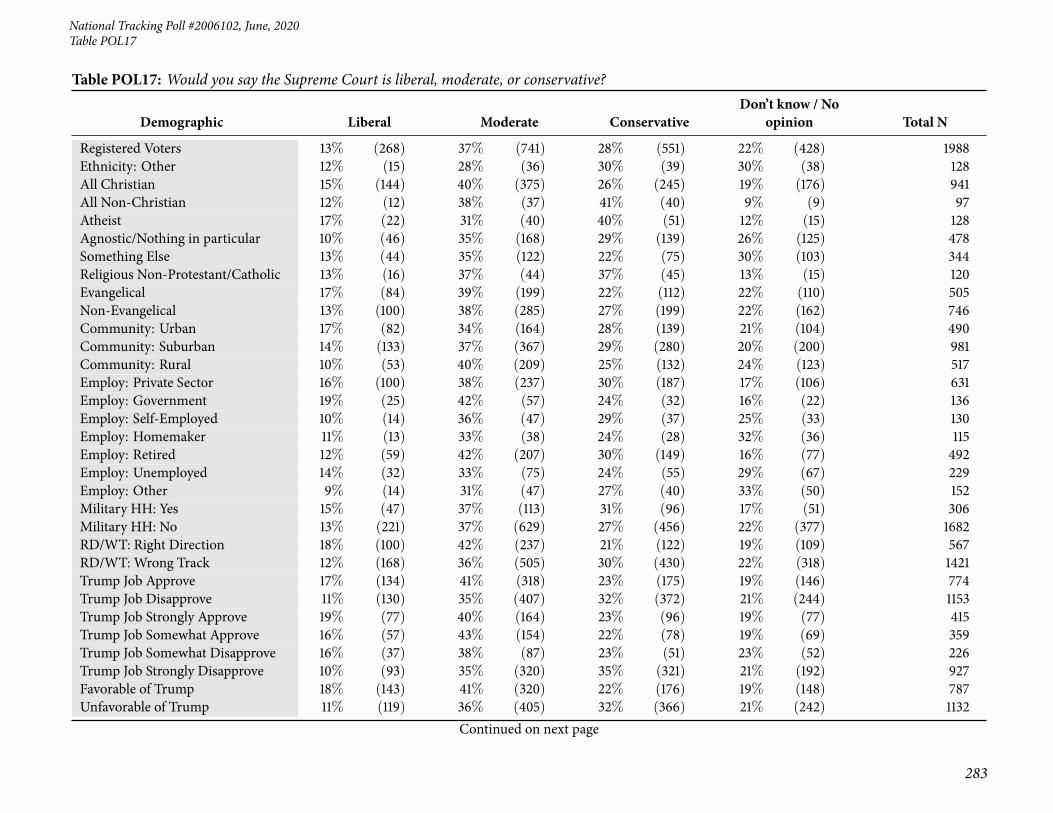
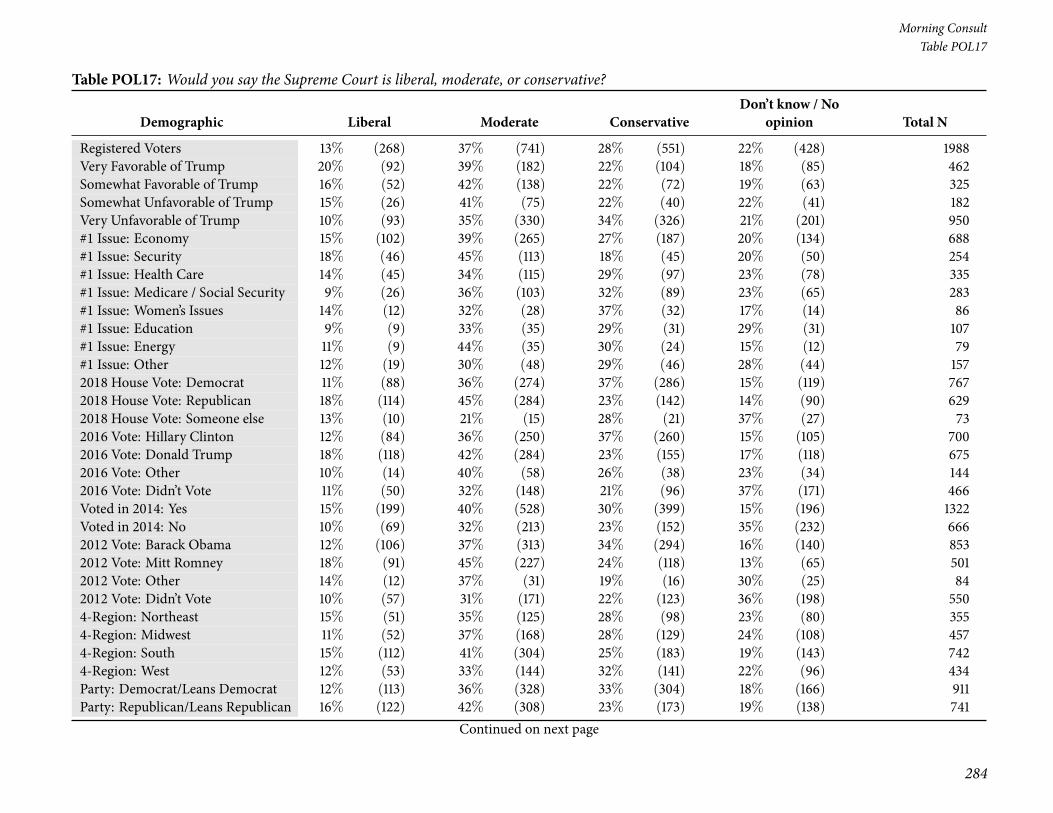
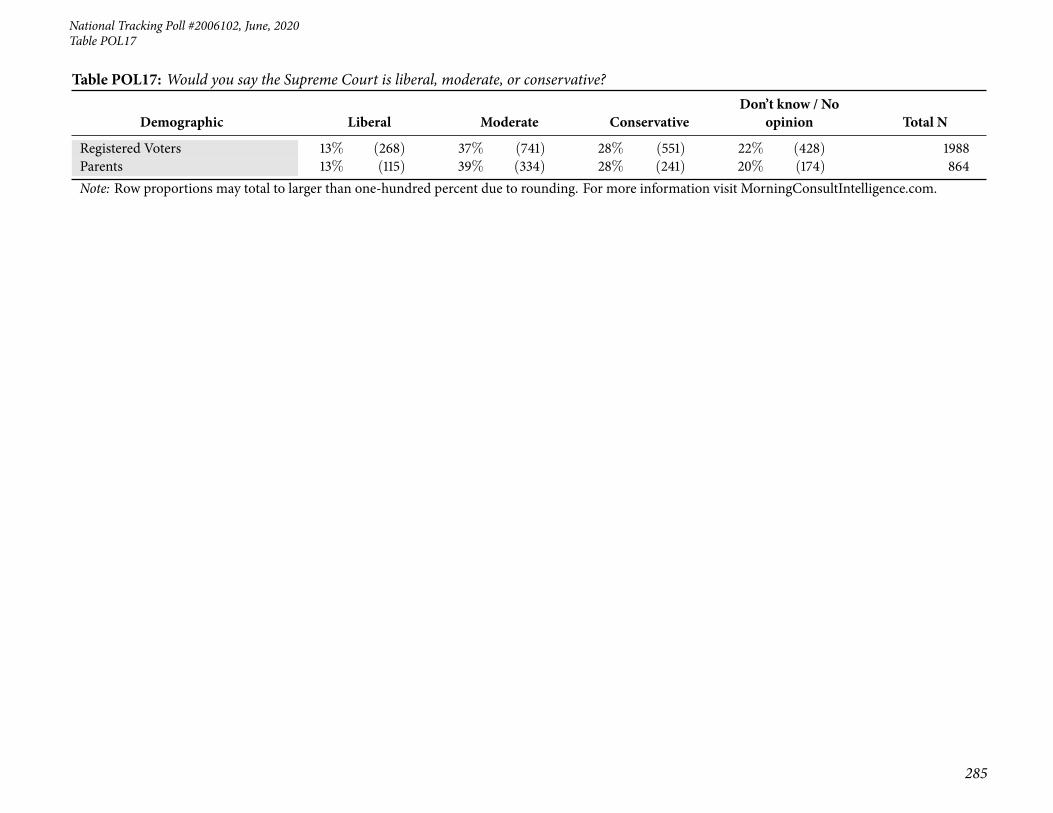
69 Table POL17: Would you say the Supreme Court is liberal, moderate, or conservative? . . . . . . . . . 282
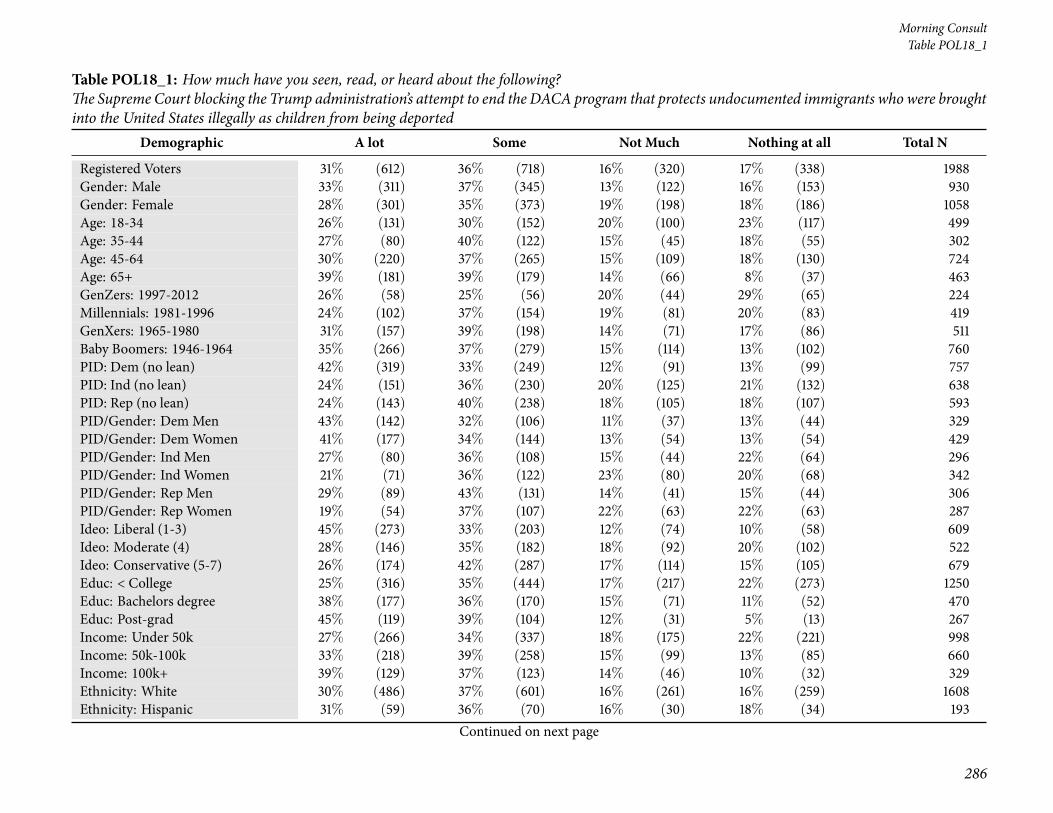
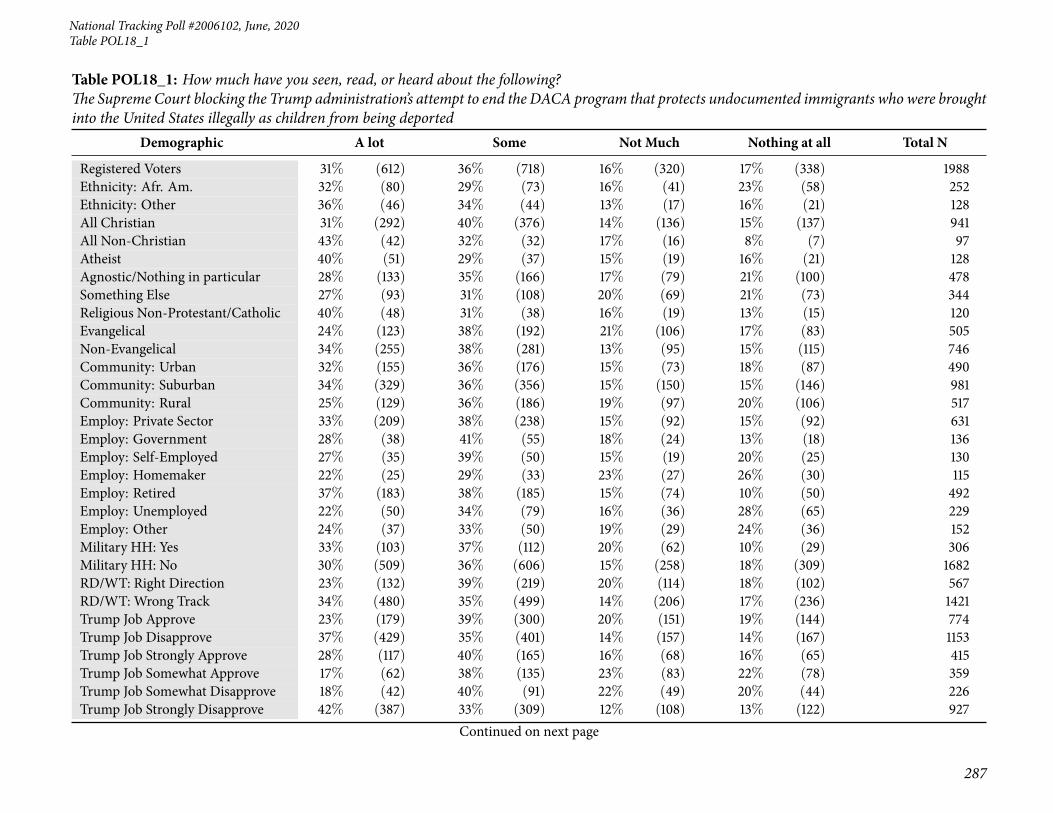
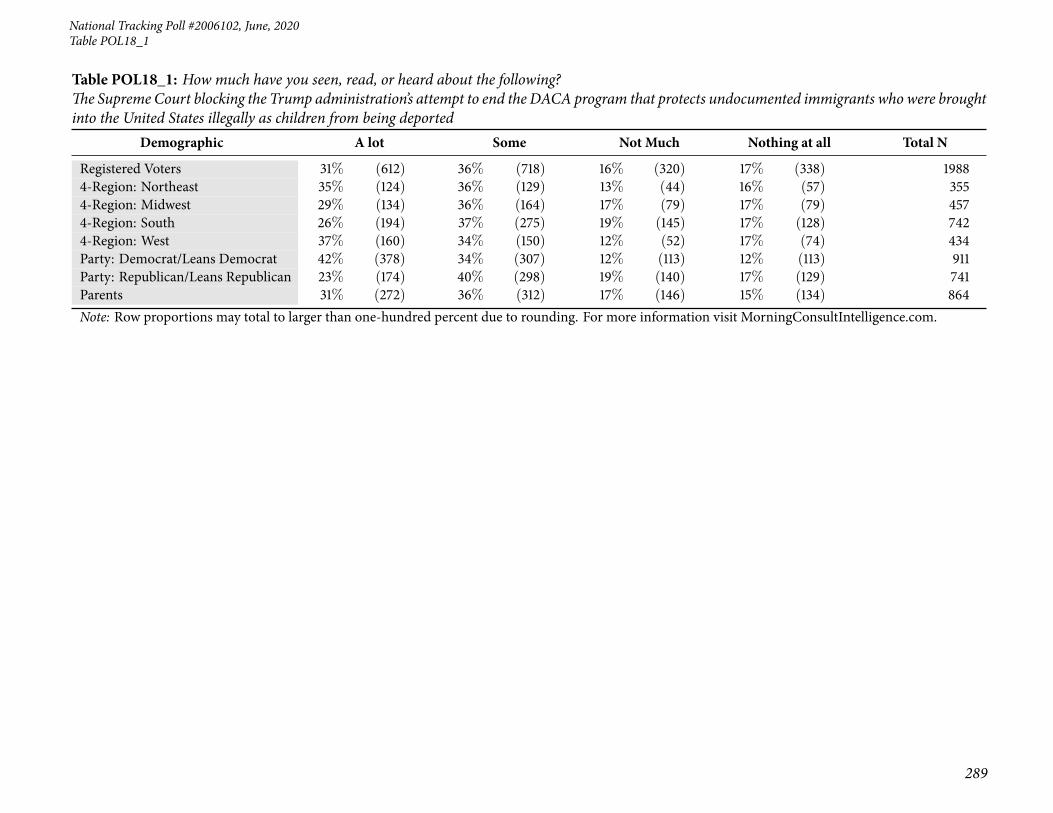
70 Table POL18_1: How much have you seen, read, or heard about the following? The Supreme Courtblocking the Trump administration’s attempt to end the DACA program that protects undocumentedimmigrants who were brought into the United States illegally as children from being deported . . . . . 286
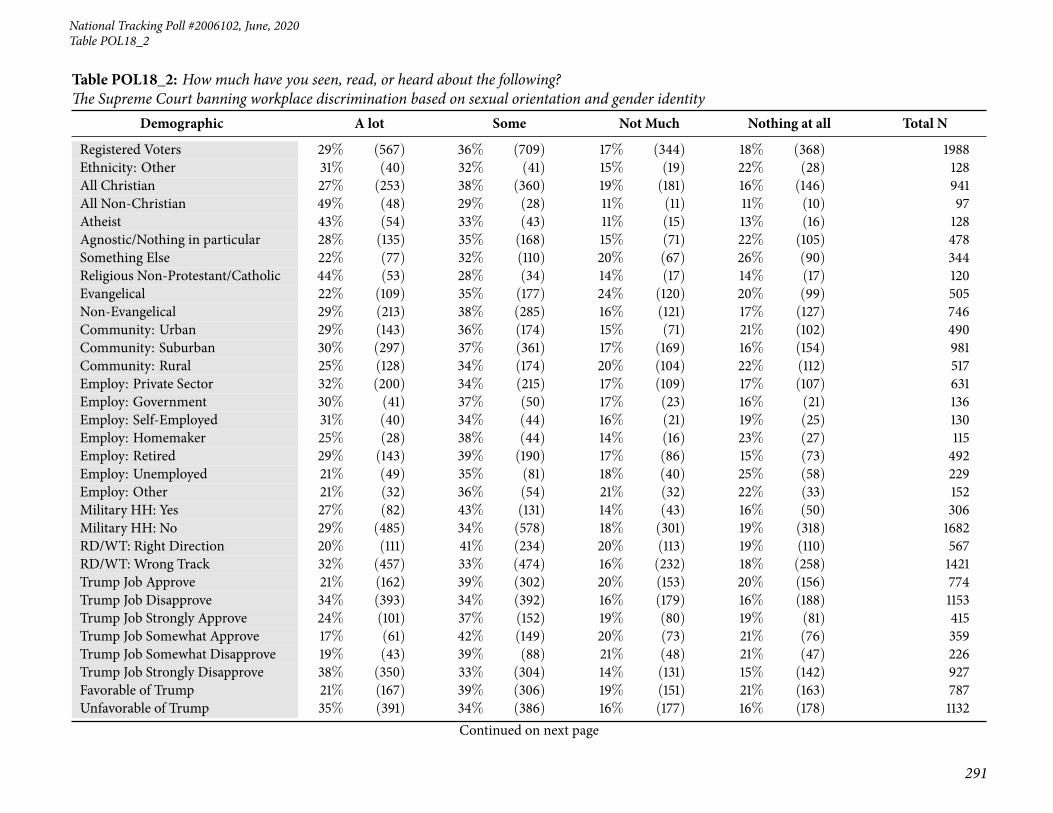
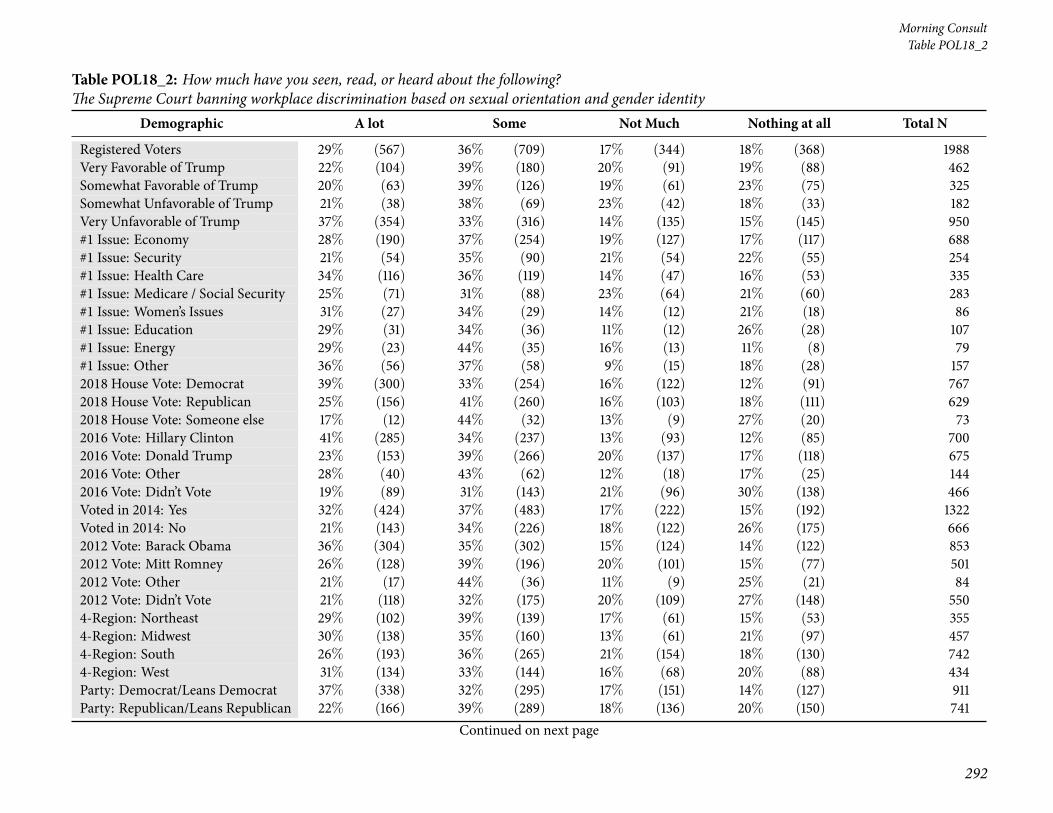
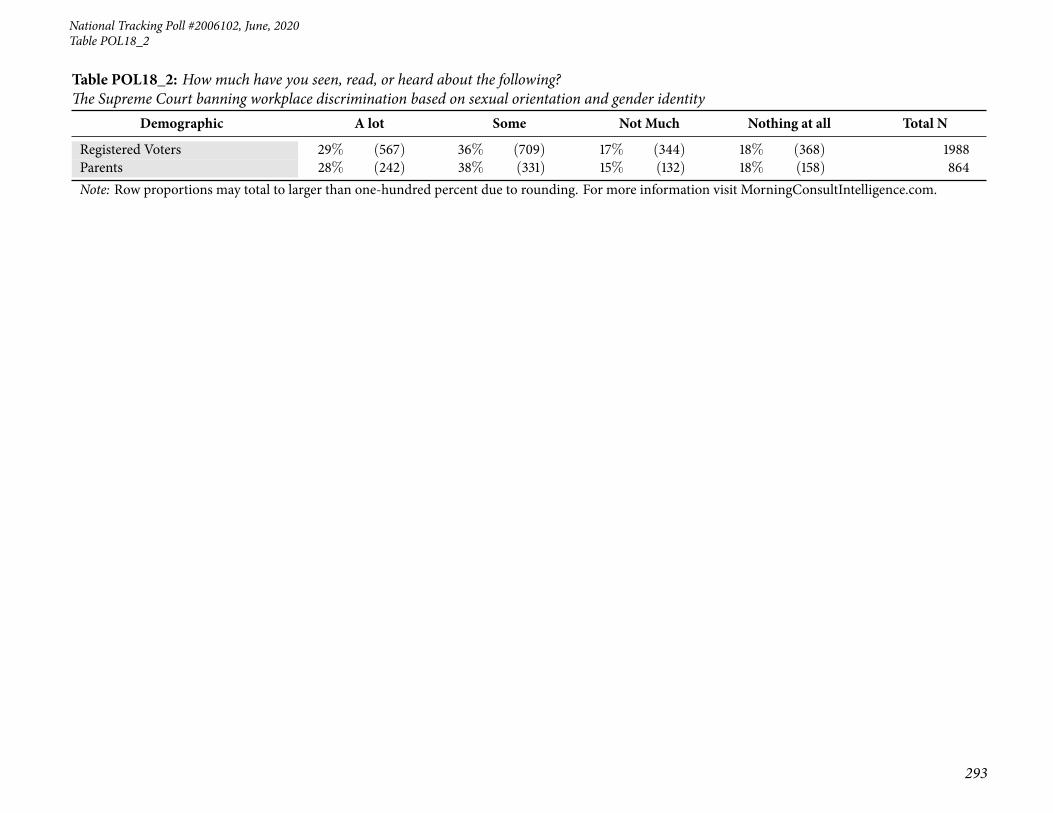
71 Table POL18_2: How much have you seen, read, or heard about the following? The Supreme Courtbanning workplace discrimination based on sexual orientation and gender identity . . . . . . . . . . . 290
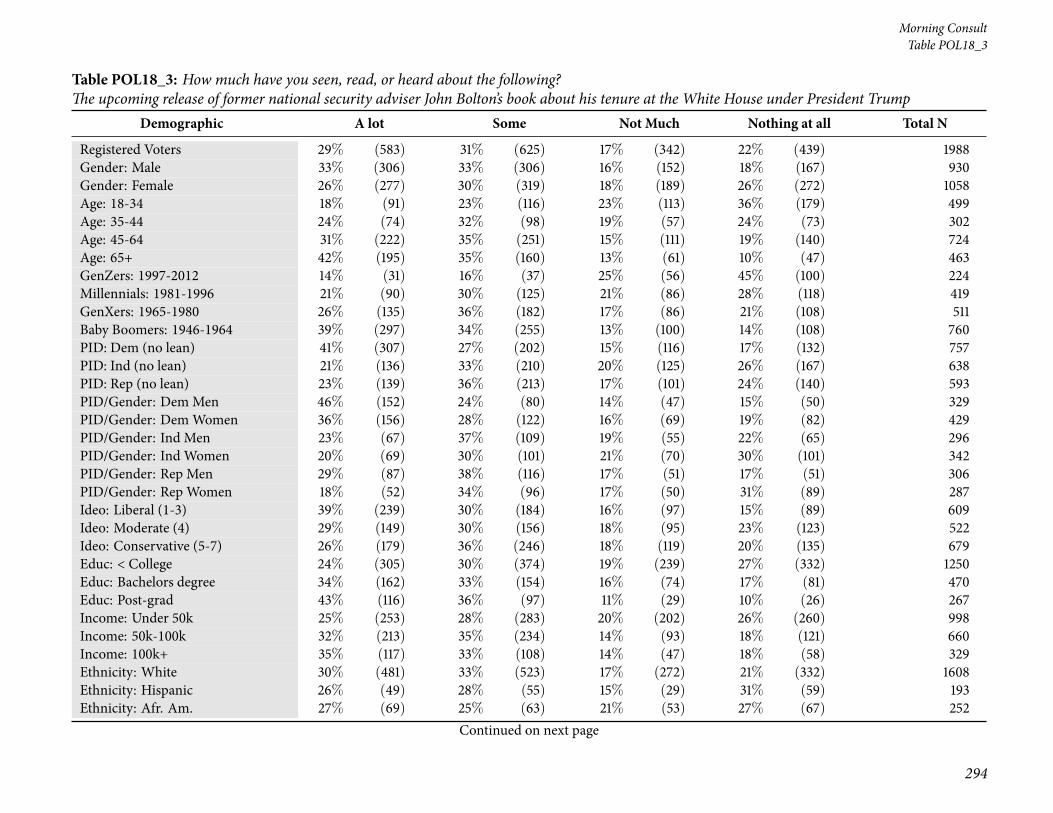
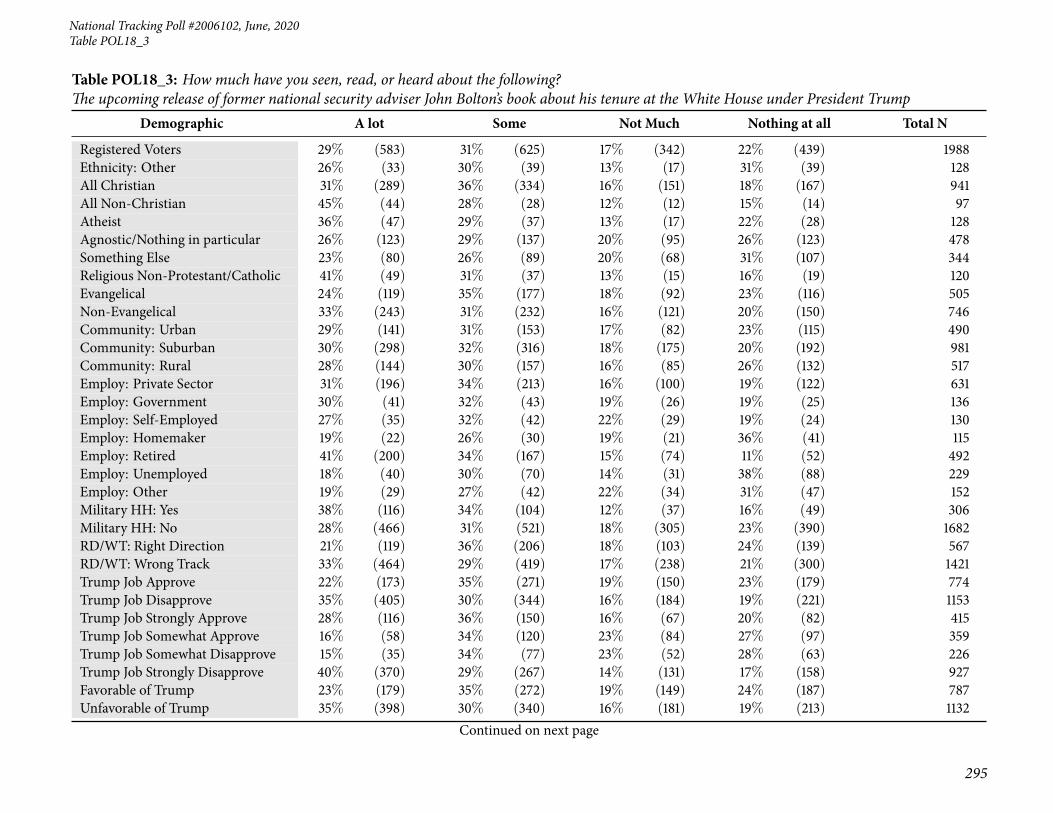
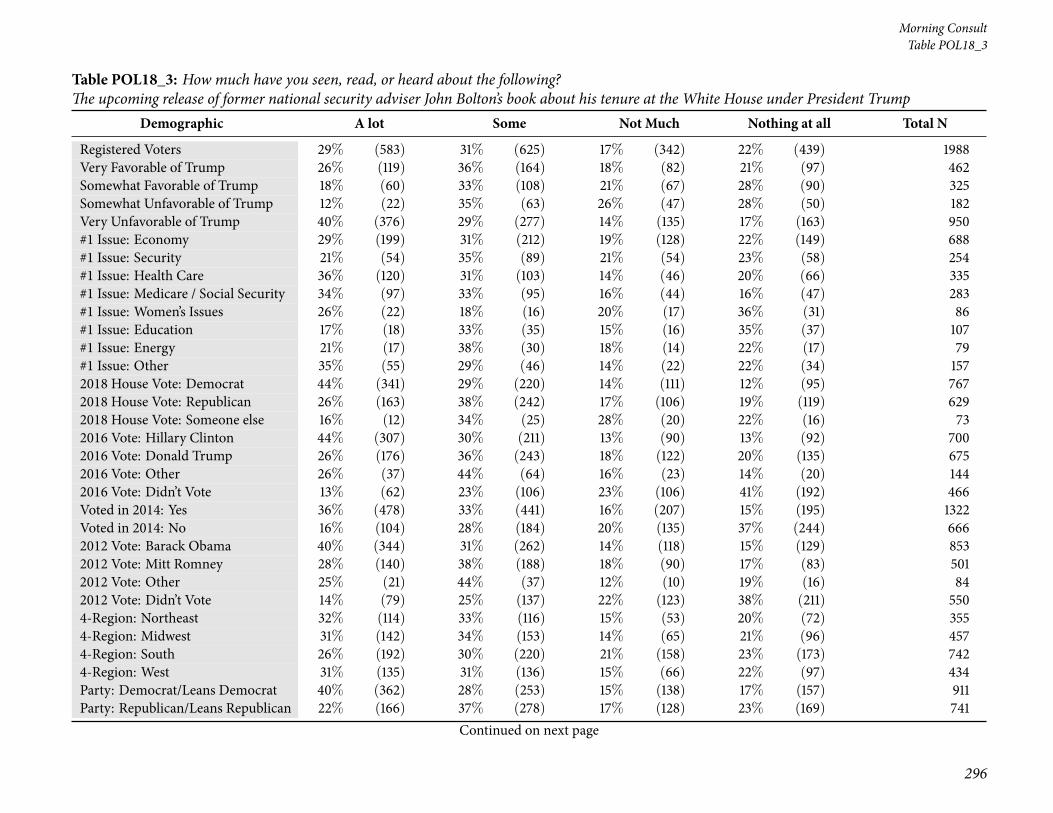
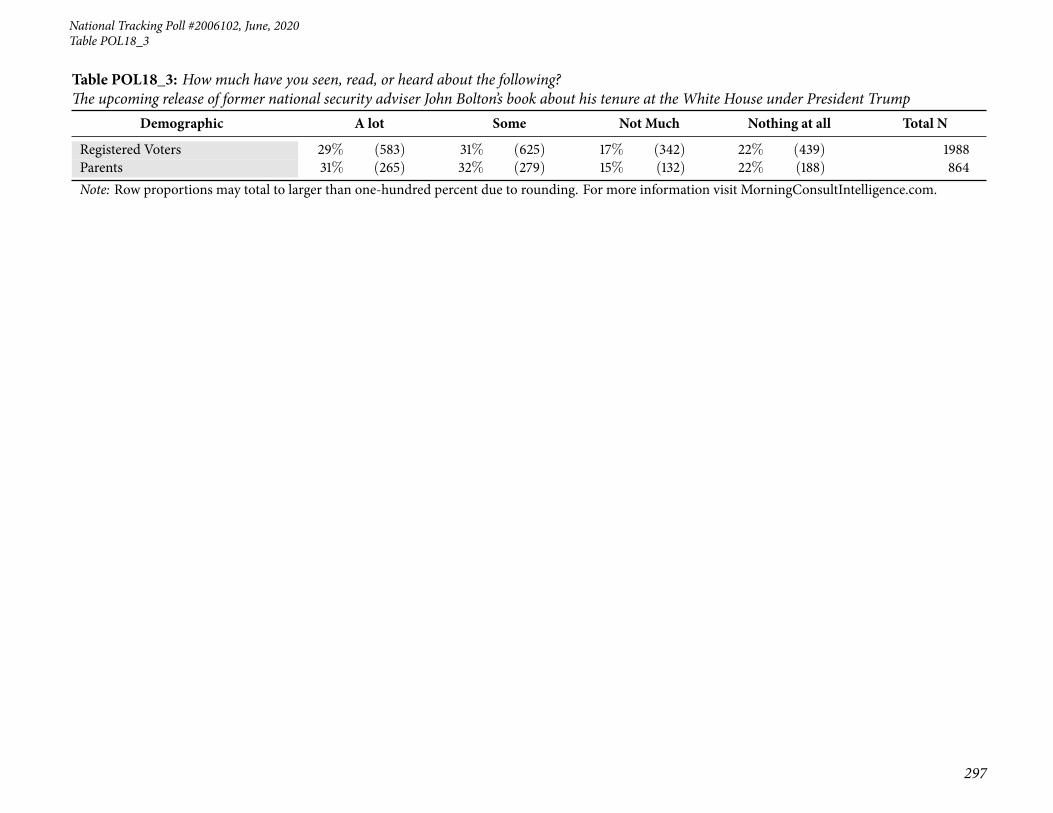
72 Table POL18_3: Howmuch have you seen, read, or heard about the following? The upcoming release offormer national security adviser John Bolton’s book about his tenure at theWhite House under PresidentTrump . . . . . . . . . . . . . . . . . . . . . . . . . . . . . . . . . . . . . . . . . . . . . . . . . . . 294
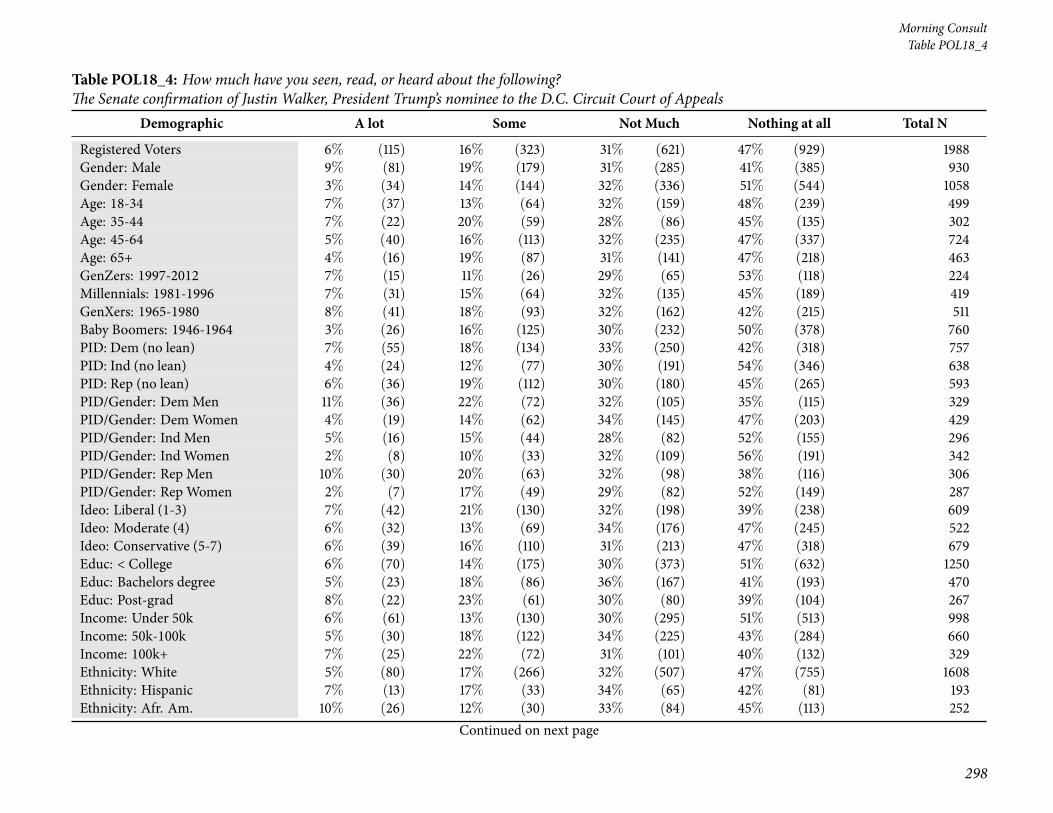
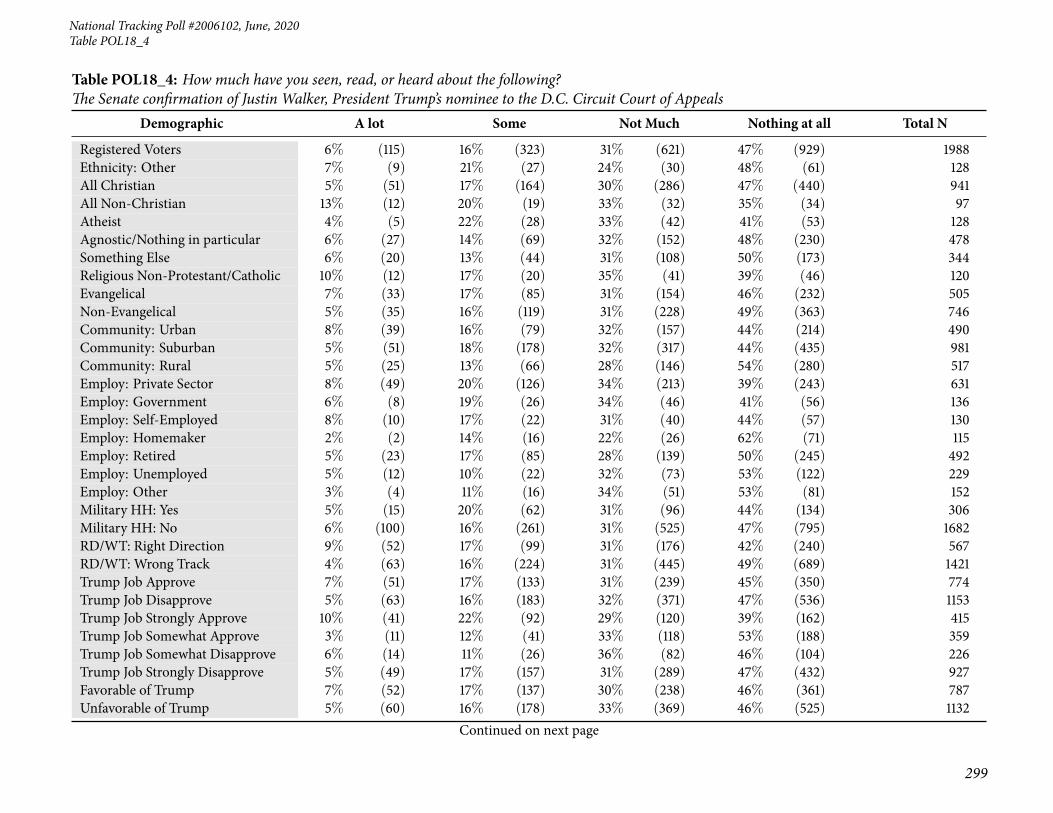
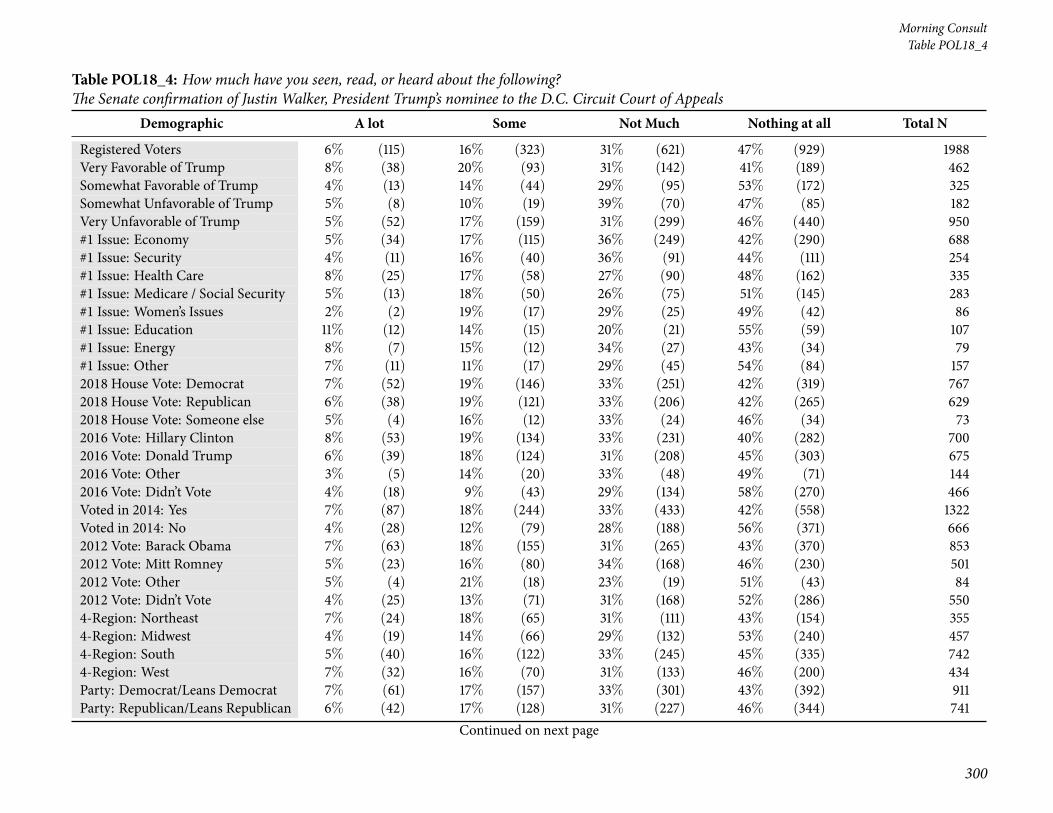
73 Table POL18_4: How much have you seen, read, or heard about the following? The Senate confirma-tion of Justin Walker, President Trump’s nominee to the D.C. Circuit Court of Appeals . . . . . . . . . 298
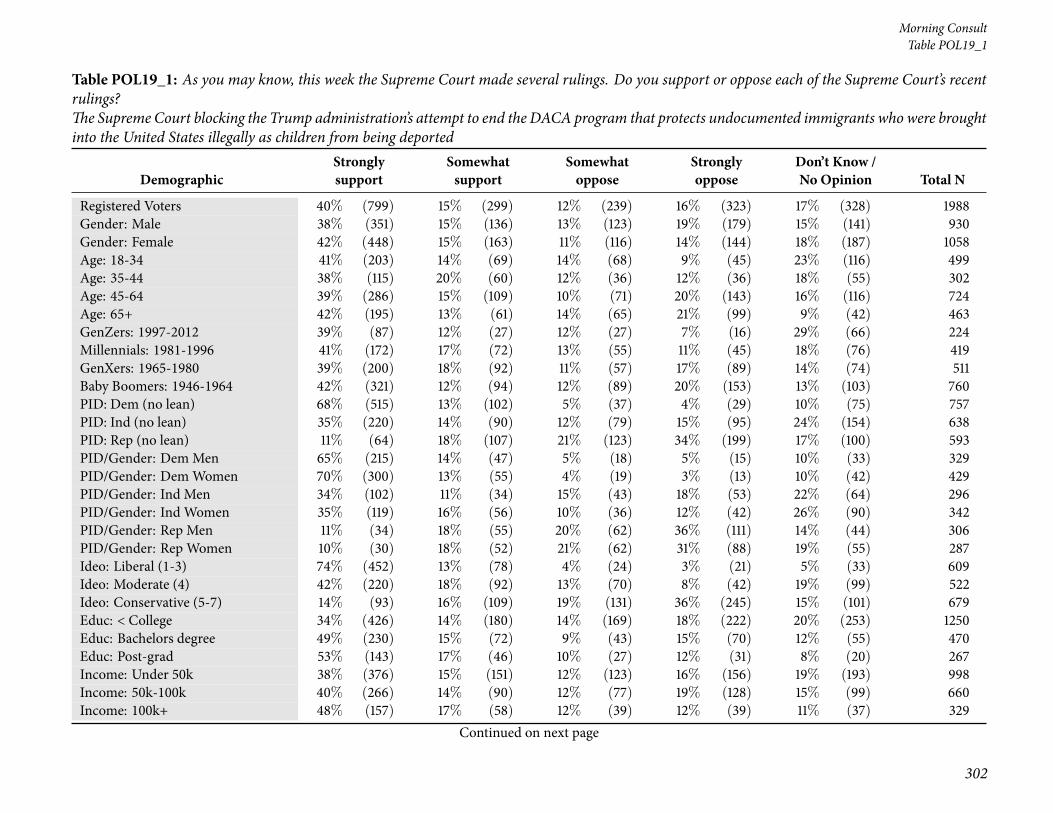
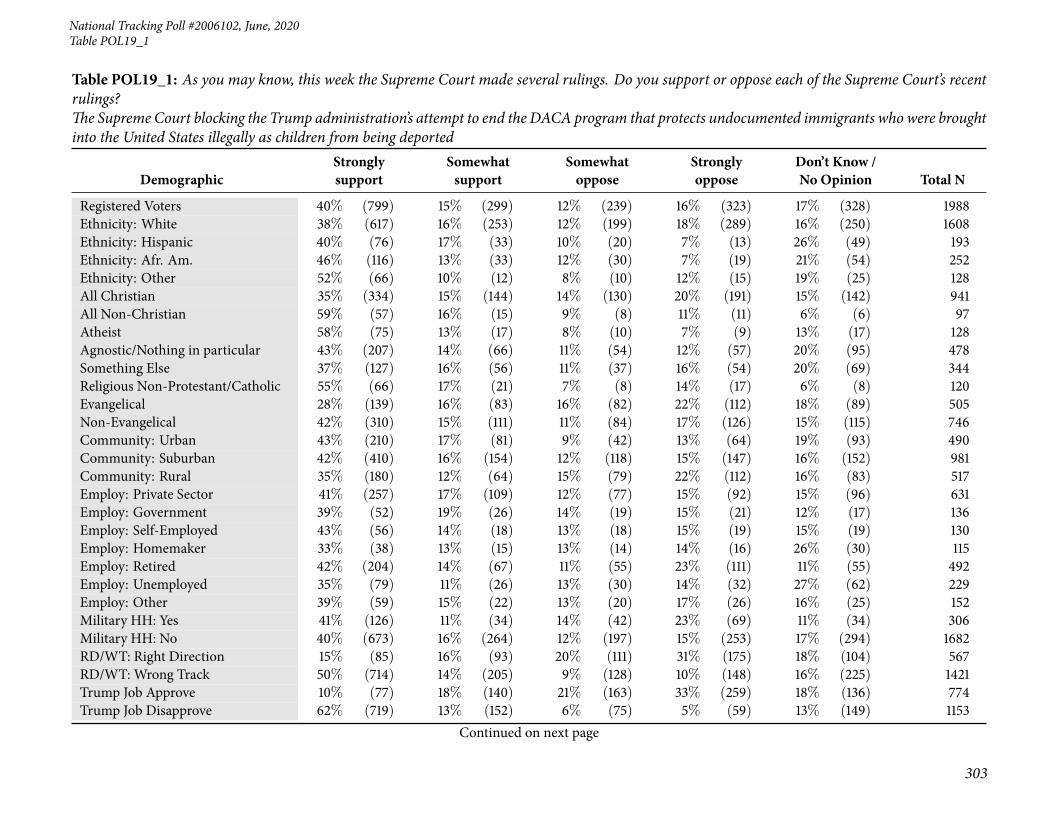
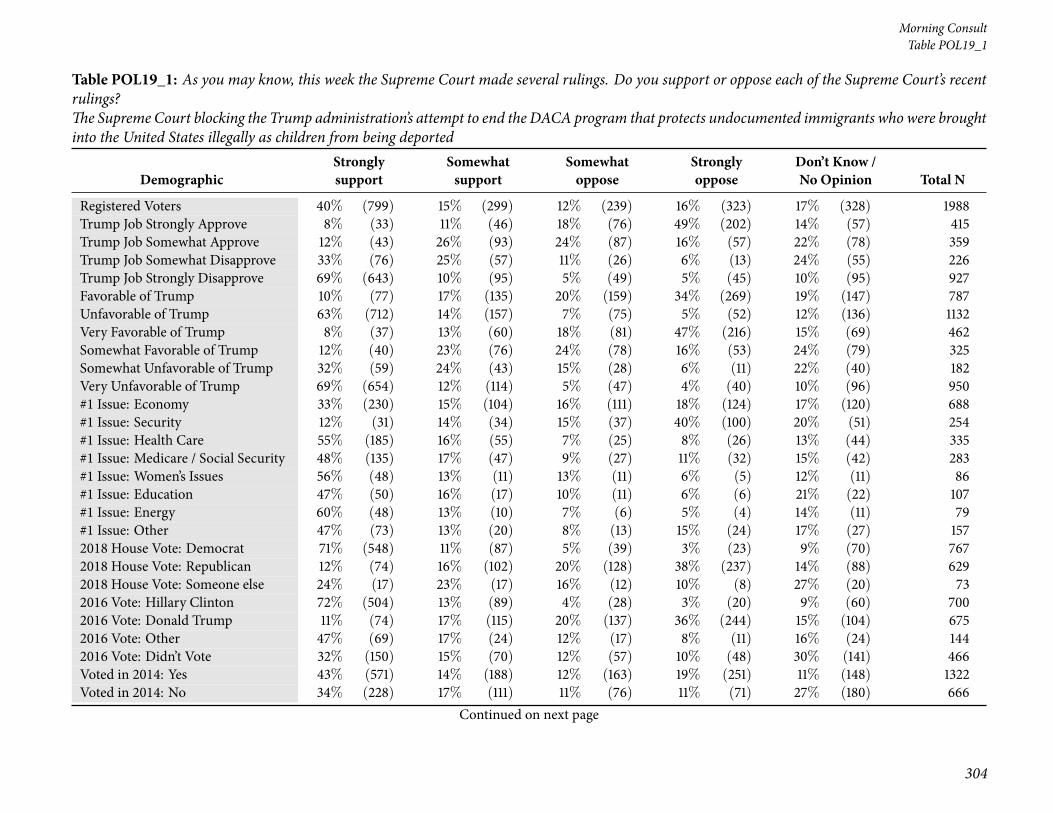
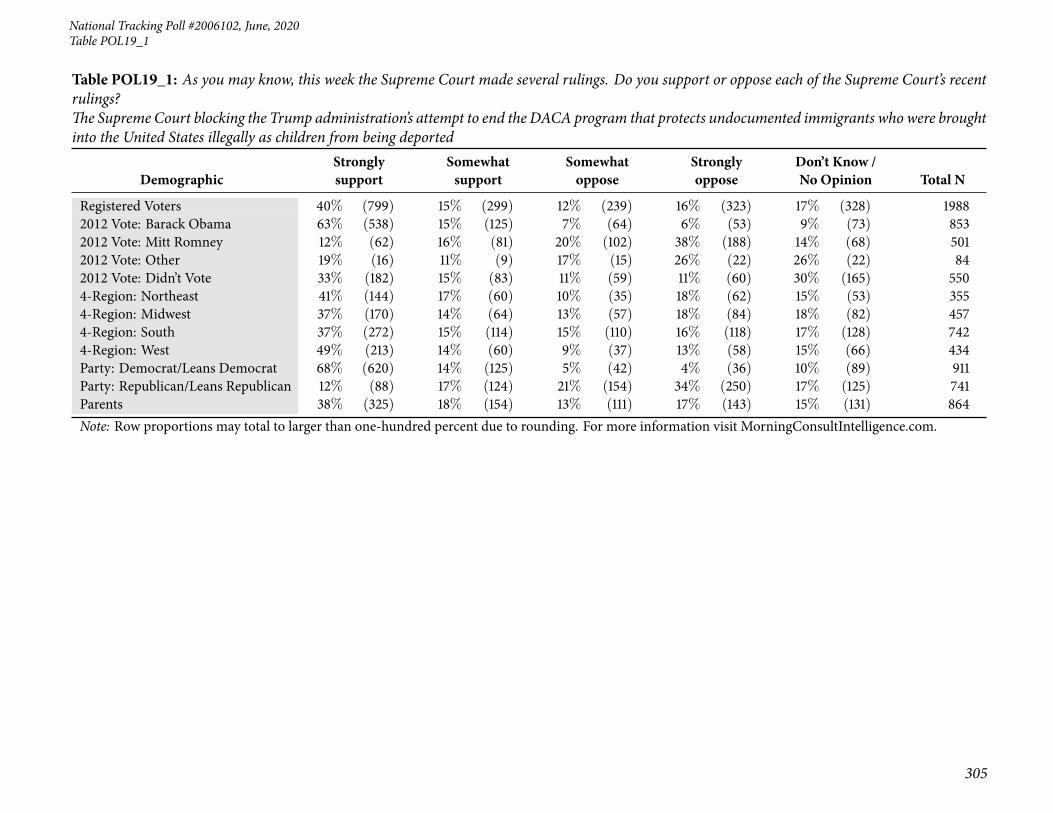
74 Table POL19_1: As you may know, this week the Supreme Court made several rulings. Do you supportor oppose each of the Supreme Court’s recent rulings? The Supreme Court blocking the Trump adminis-tration’s attempt to end the DACA program that protects undocumented immigrants who were broughtinto the United States illegally as children from being deported . . . . . . . . . . . . . . . . . . . . . . 302
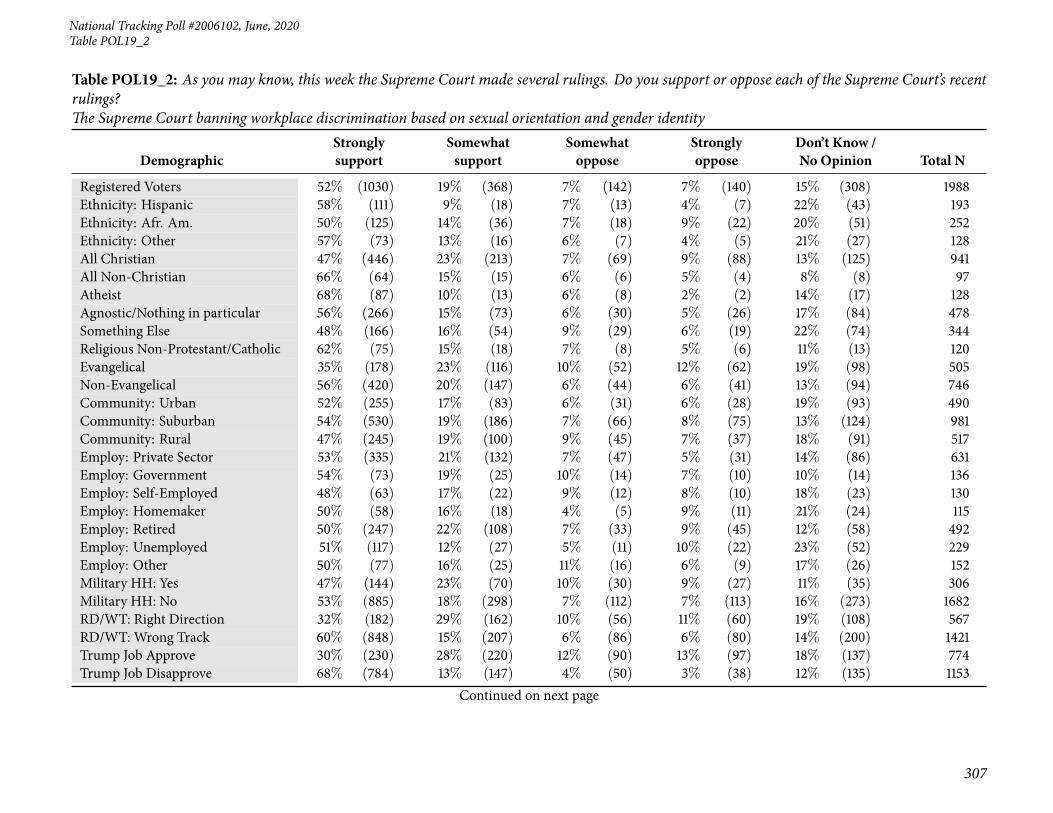
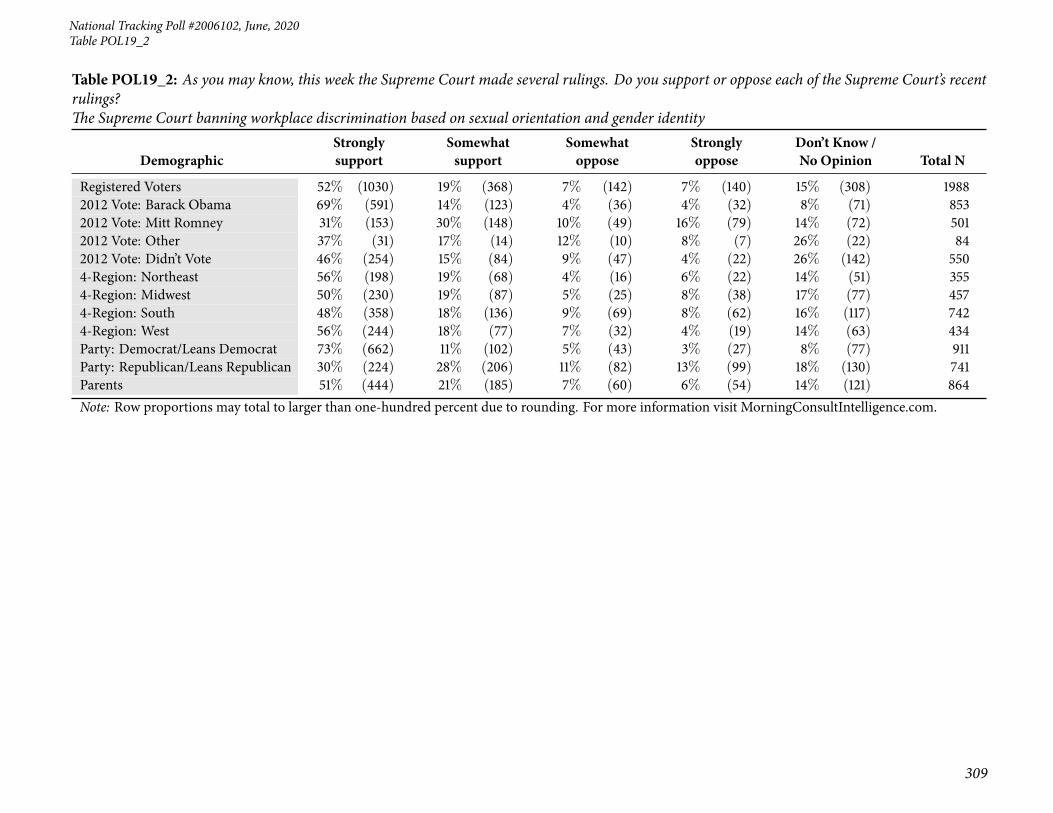
75 Table POL19_2: As you may know, this week the Supreme Court made several rulings. Do you sup-port or oppose each of the Supreme Court’s recent rulings? The Supreme Court banning workplacediscrimination based on sexual orientation and gender identity . . . . . . . . . . . . . . . . . . . . . 306
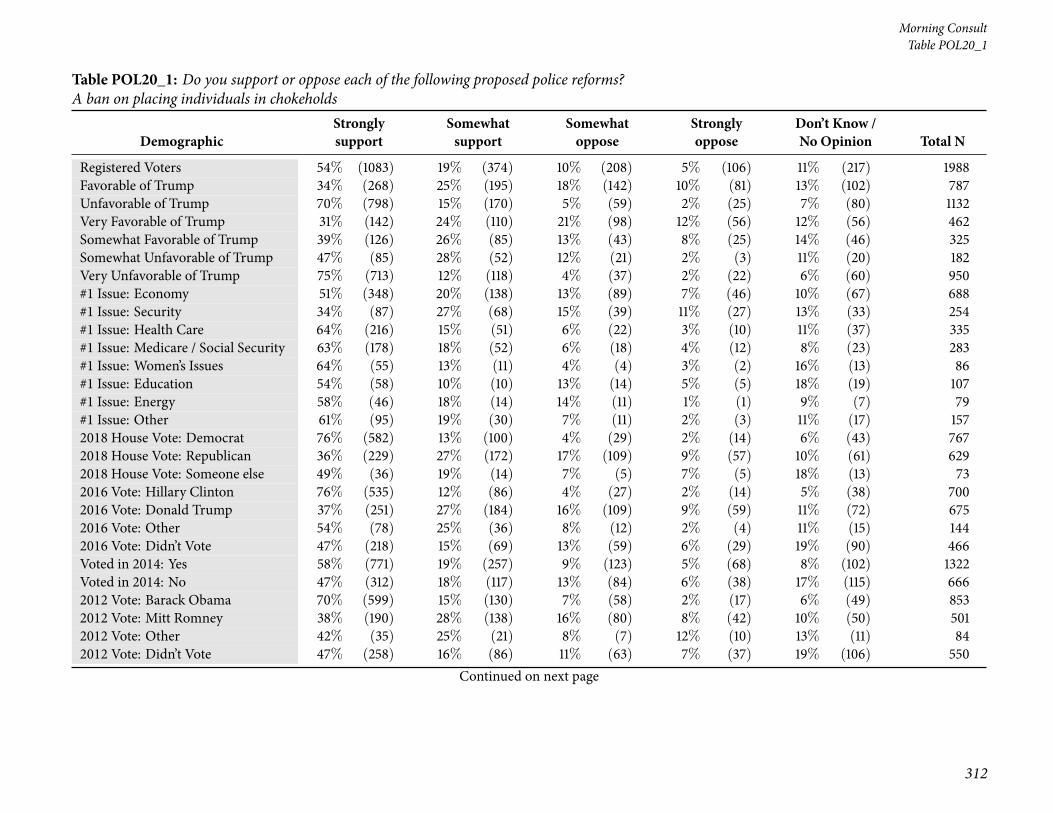
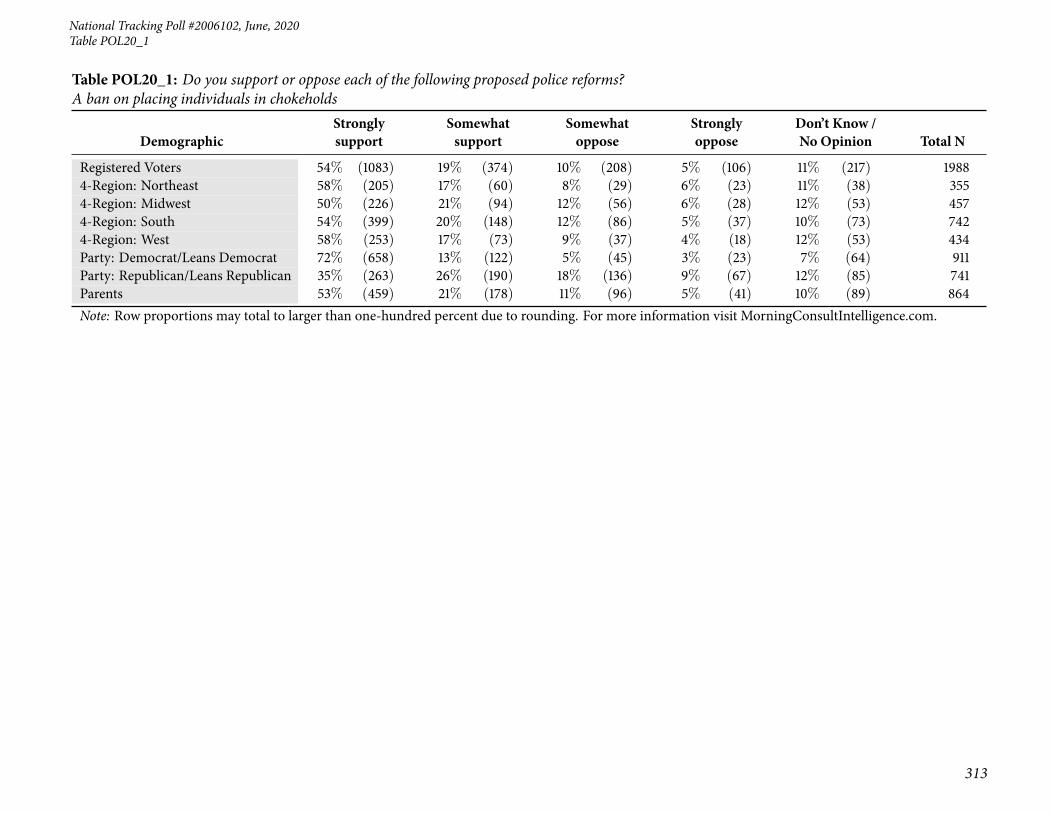
76 Table POL20_1: Do you support or oppose each of the following proposed police reforms? A ban onplacing individuals in chokeholds . . . . . . . . . . . . . . . . . . . . . . . . . . . . . . . . . . . . . 310
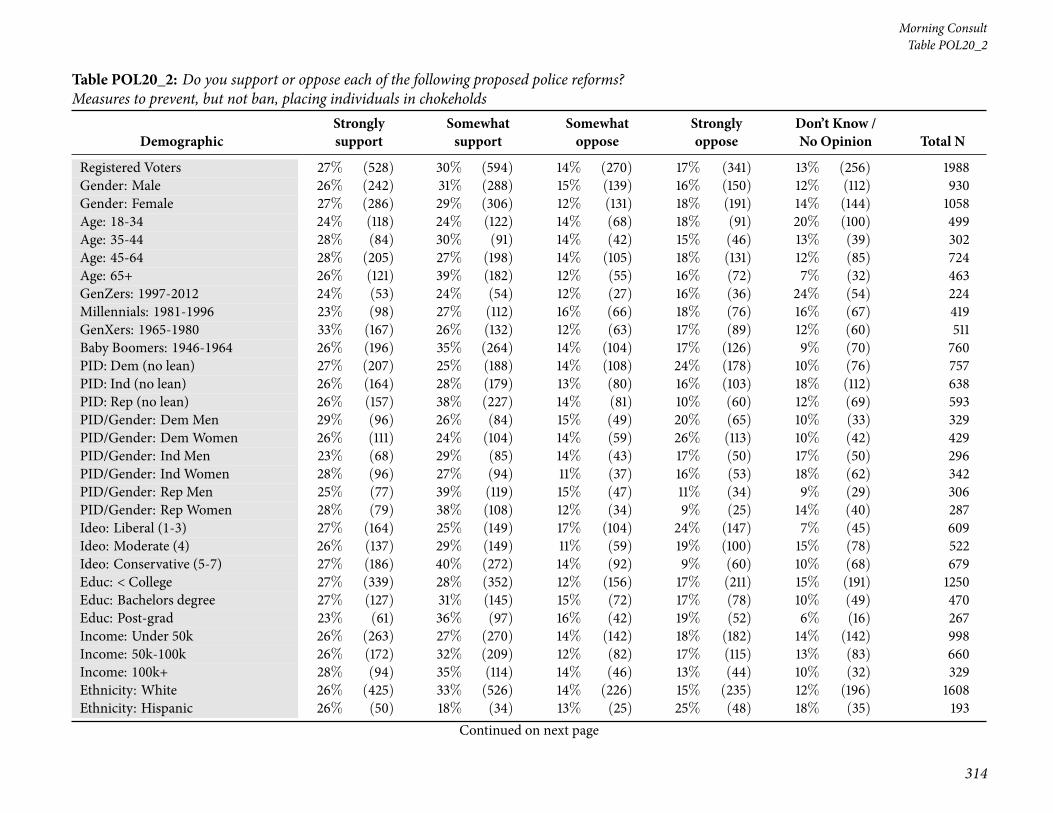
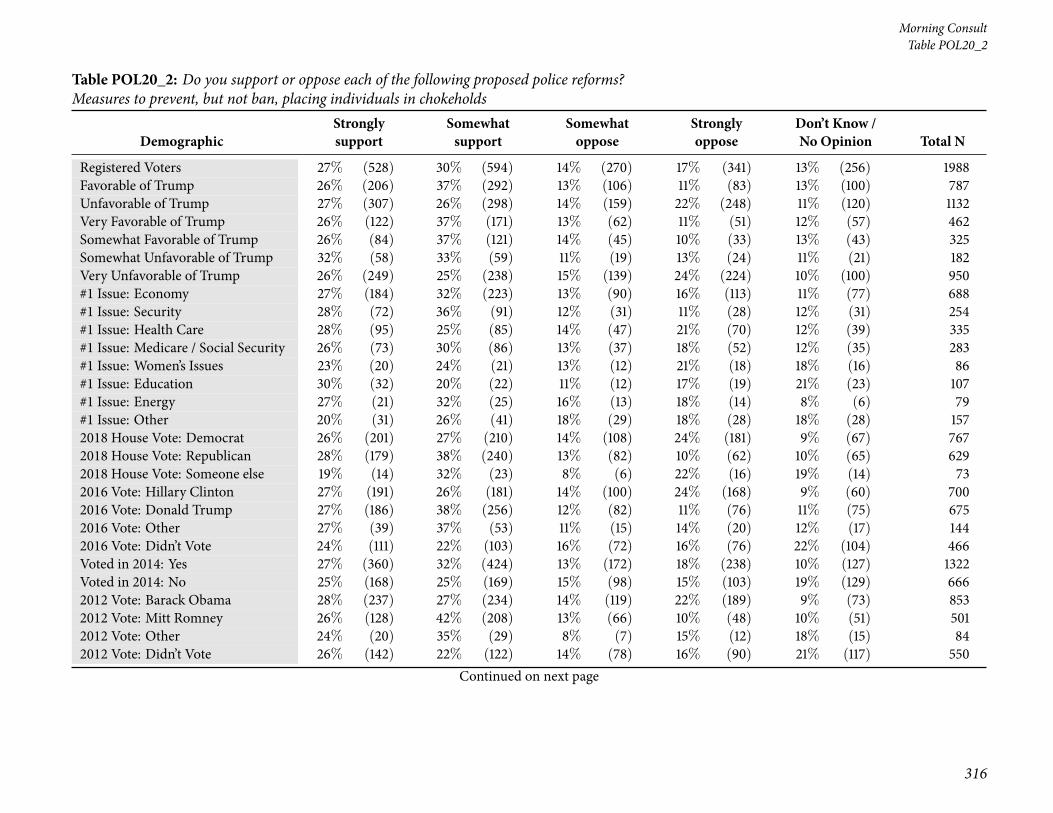
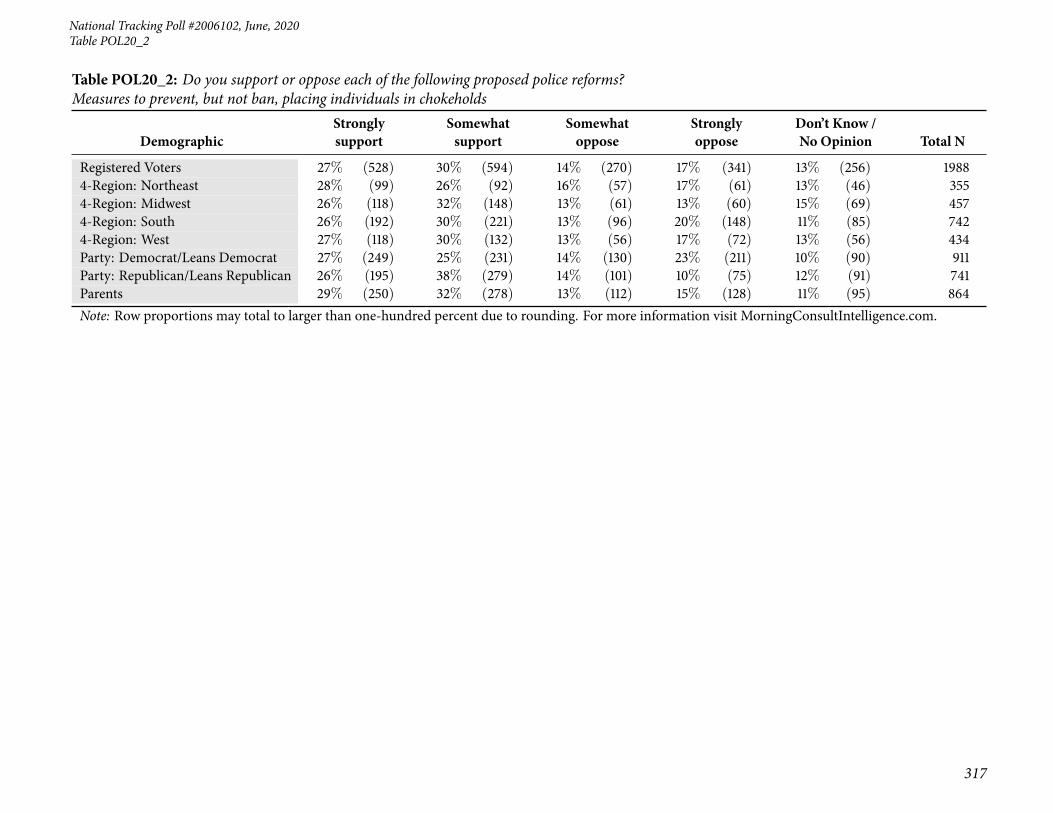
77 Table POL20_2: Do you support or oppose each of the following proposed police reforms? Measures toprevent, but not ban, placing individuals in chokeholds . . . . . . . . . . . . . . . . . . . . . . . . . . 314
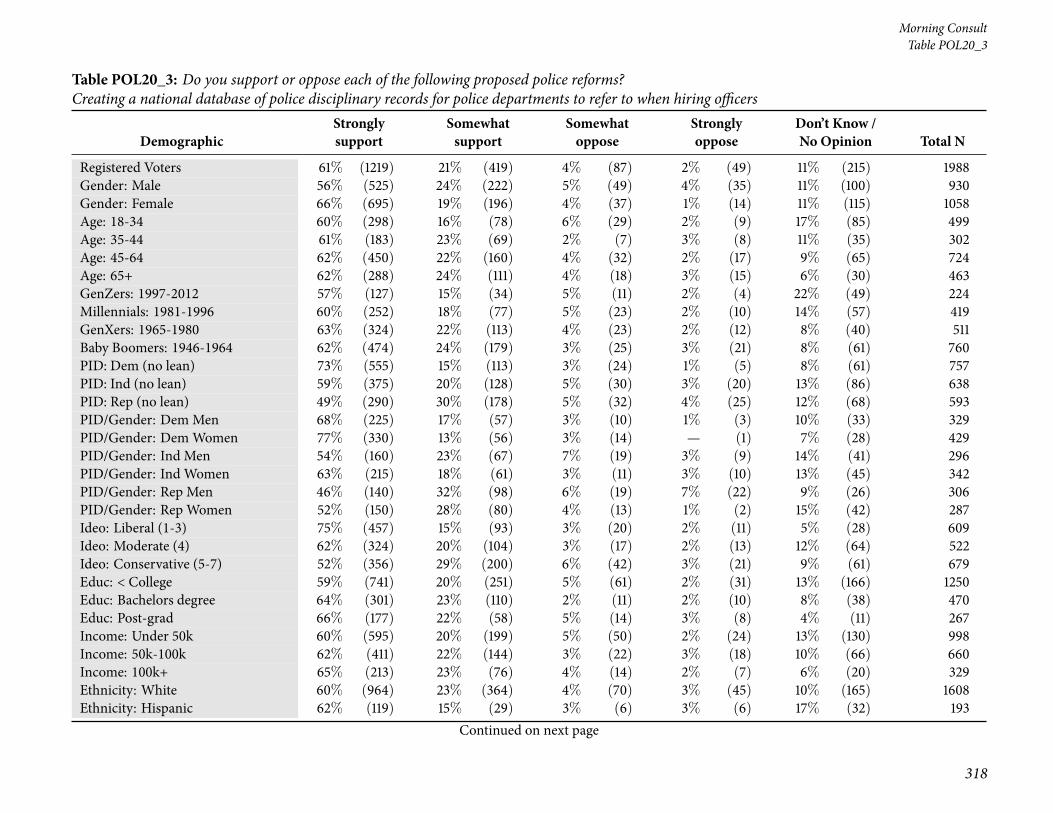
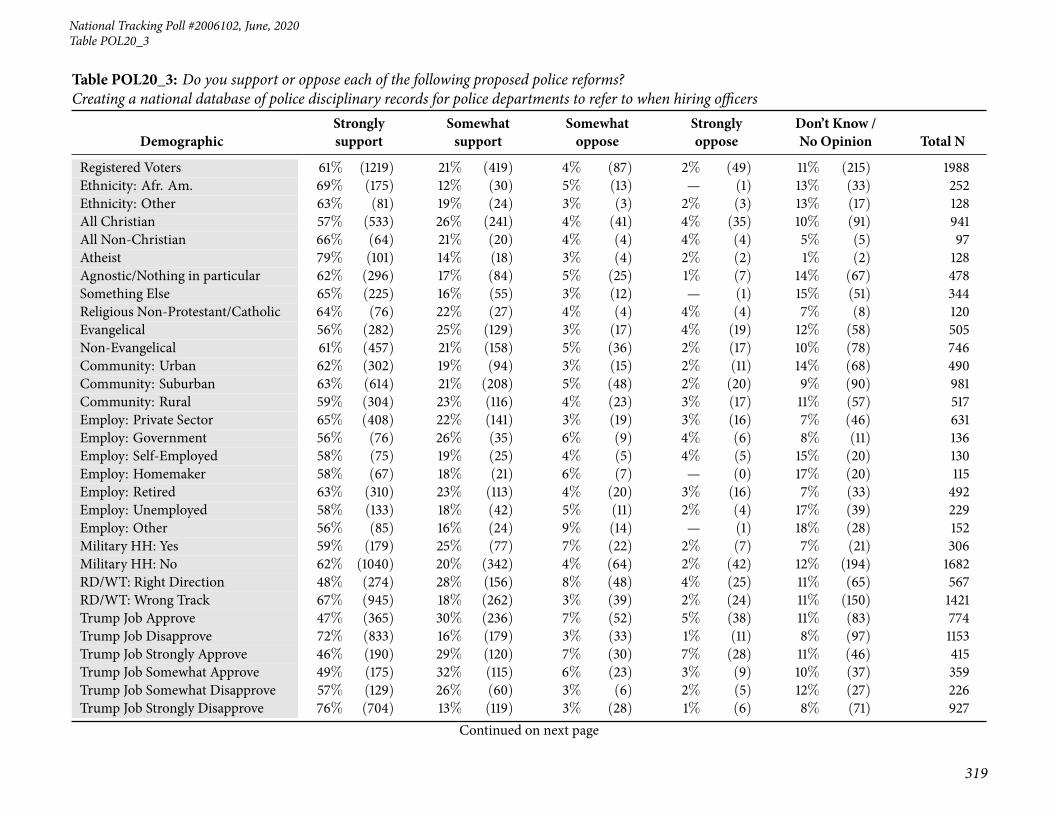
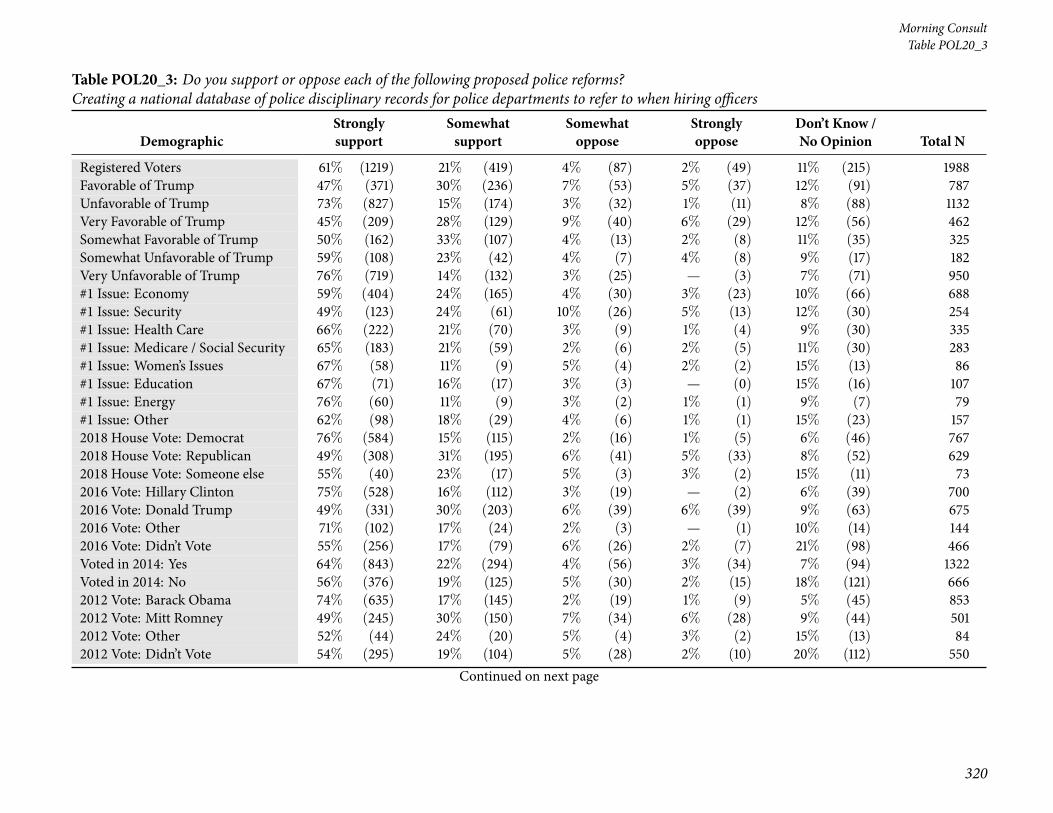
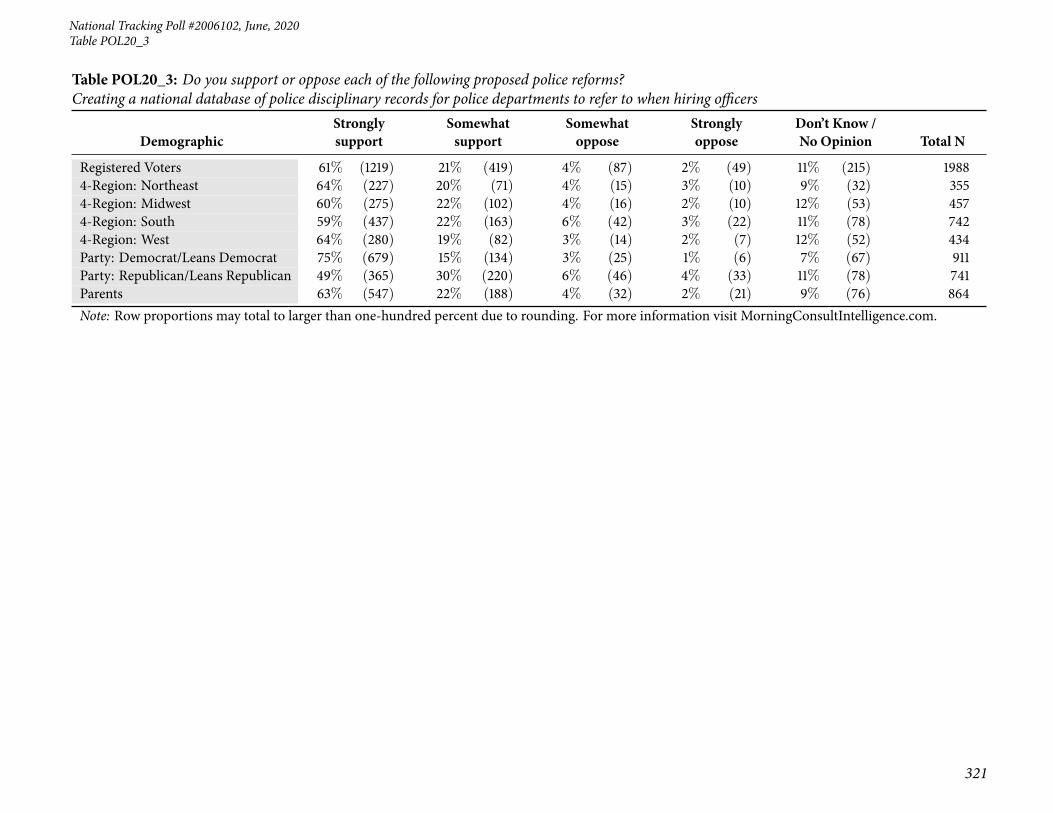
78 Table POL20_3: Do you support or oppose each of the following proposed police reforms? Creating anational database of police disciplinary records for police departments to refer to when hiring officers . 318
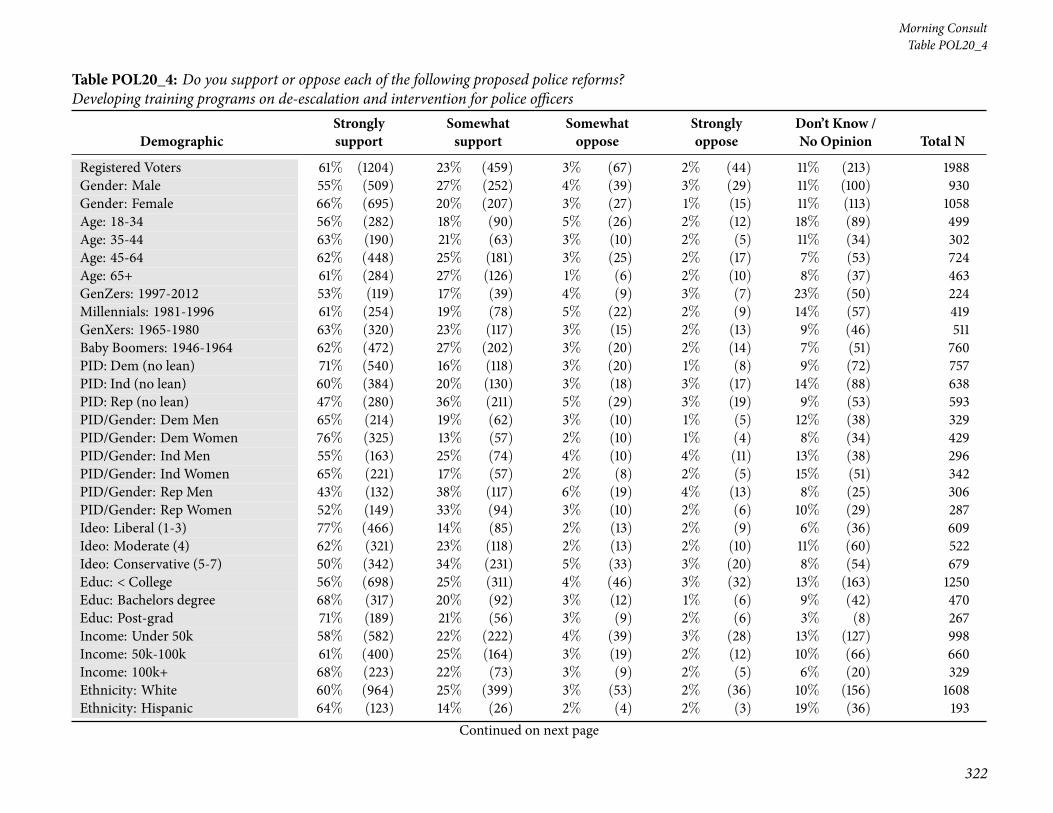
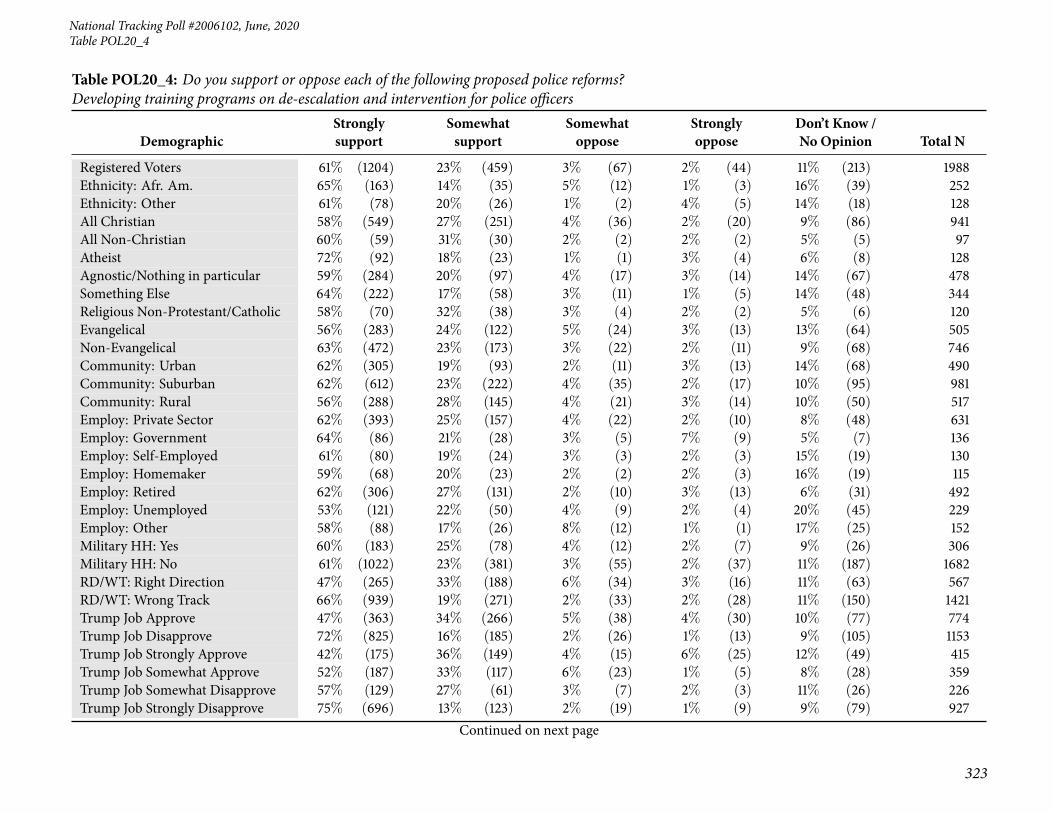
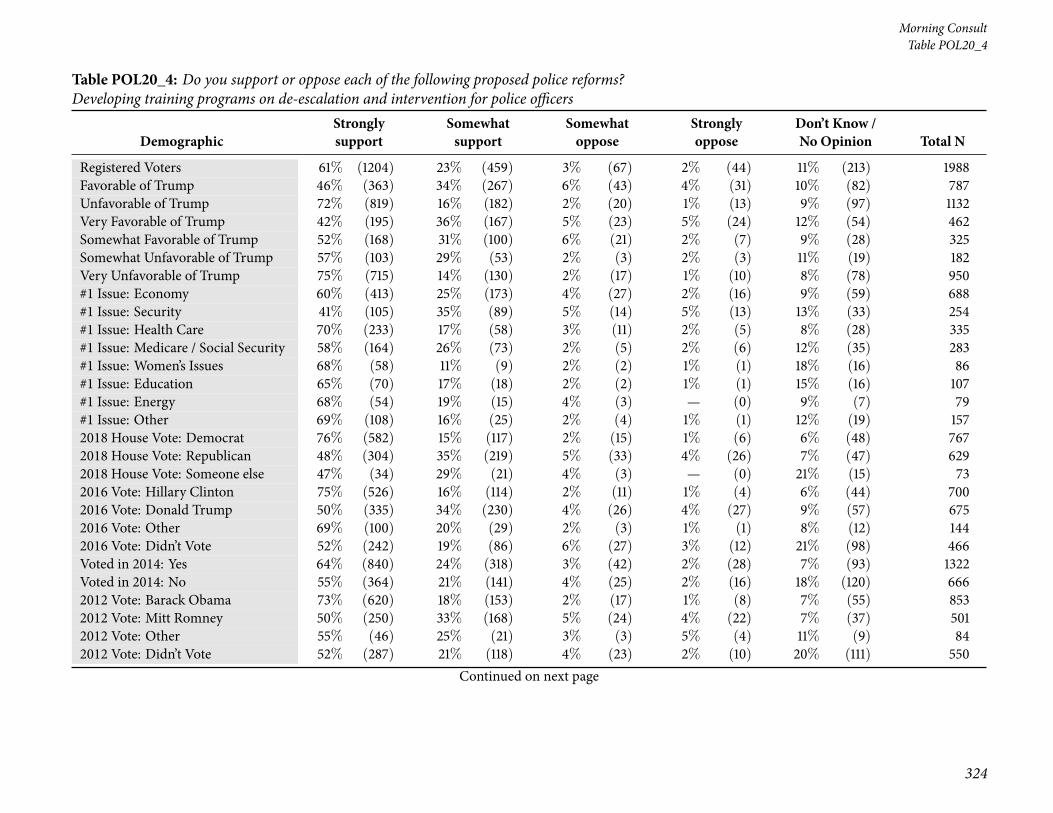
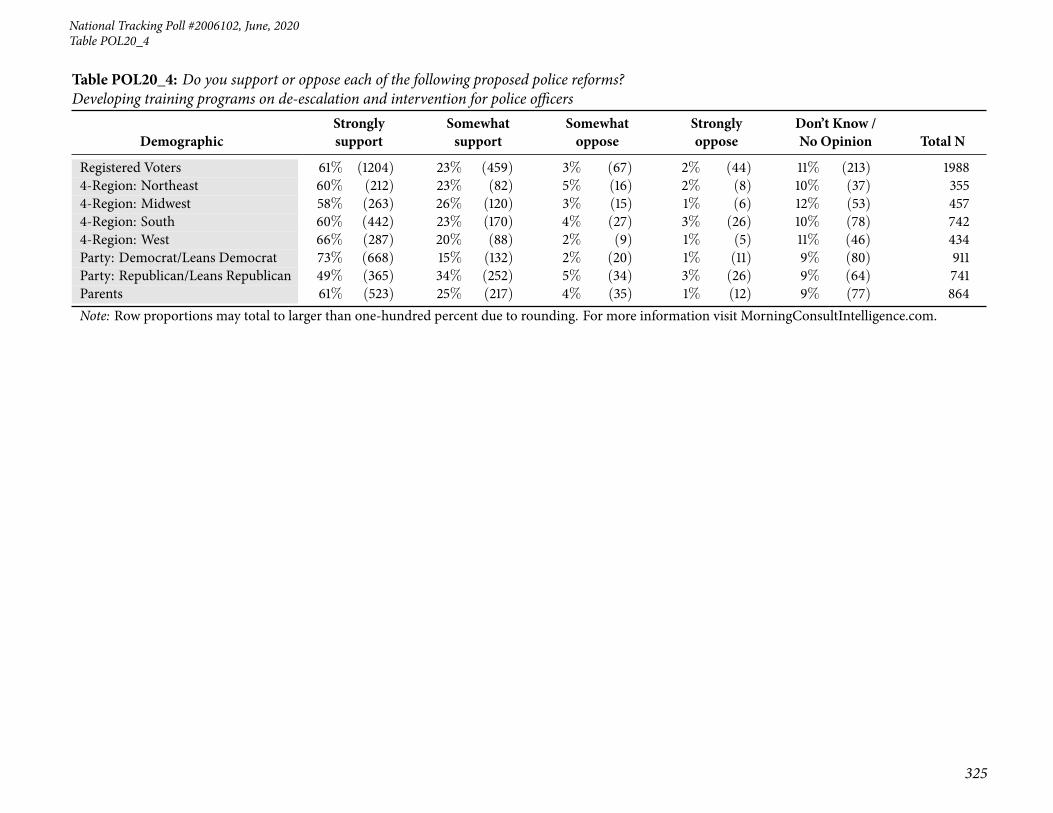
79 Table POL20_4: Do you support or oppose each of the following proposed police reforms? Developingtraining programs on de-escalation and intervention for police officers . . . . . . . . . . . . . . . . . . 322
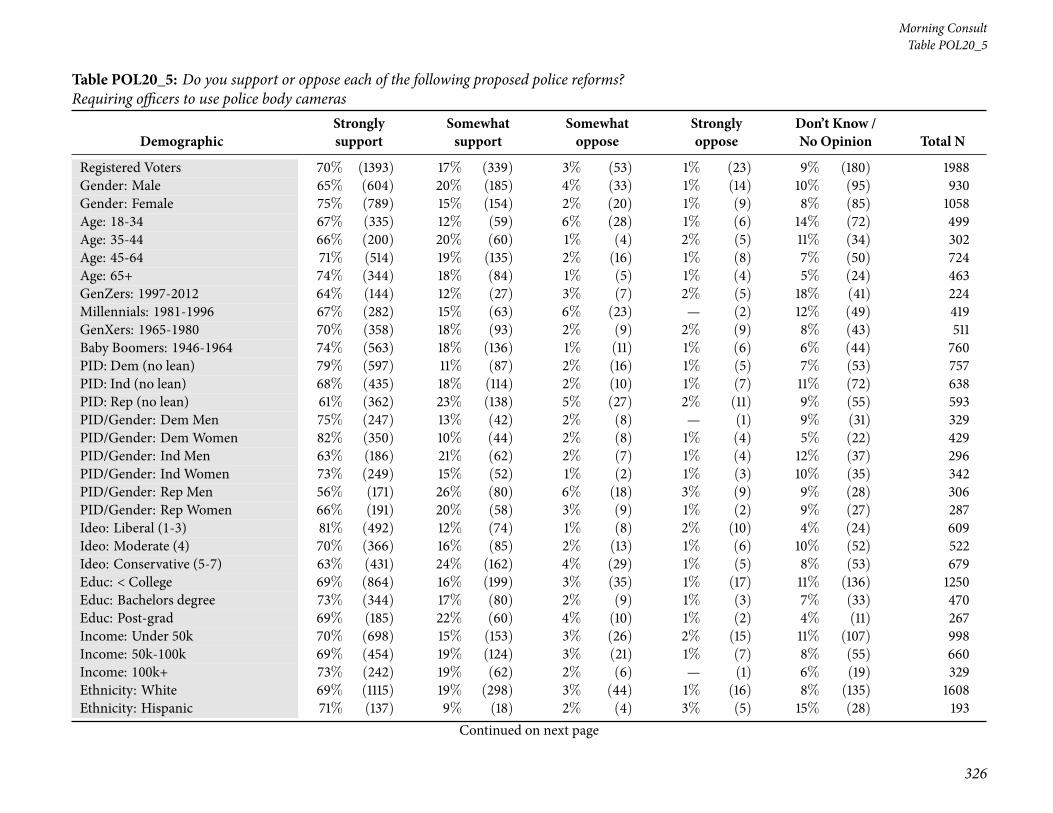
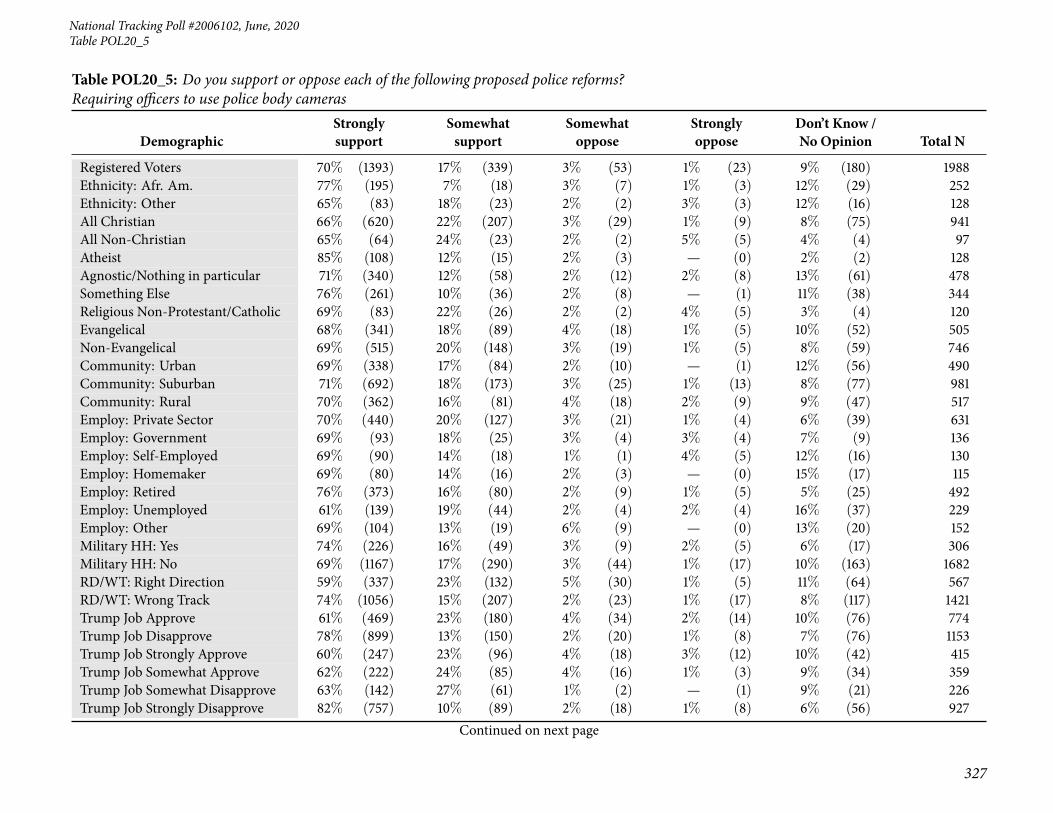
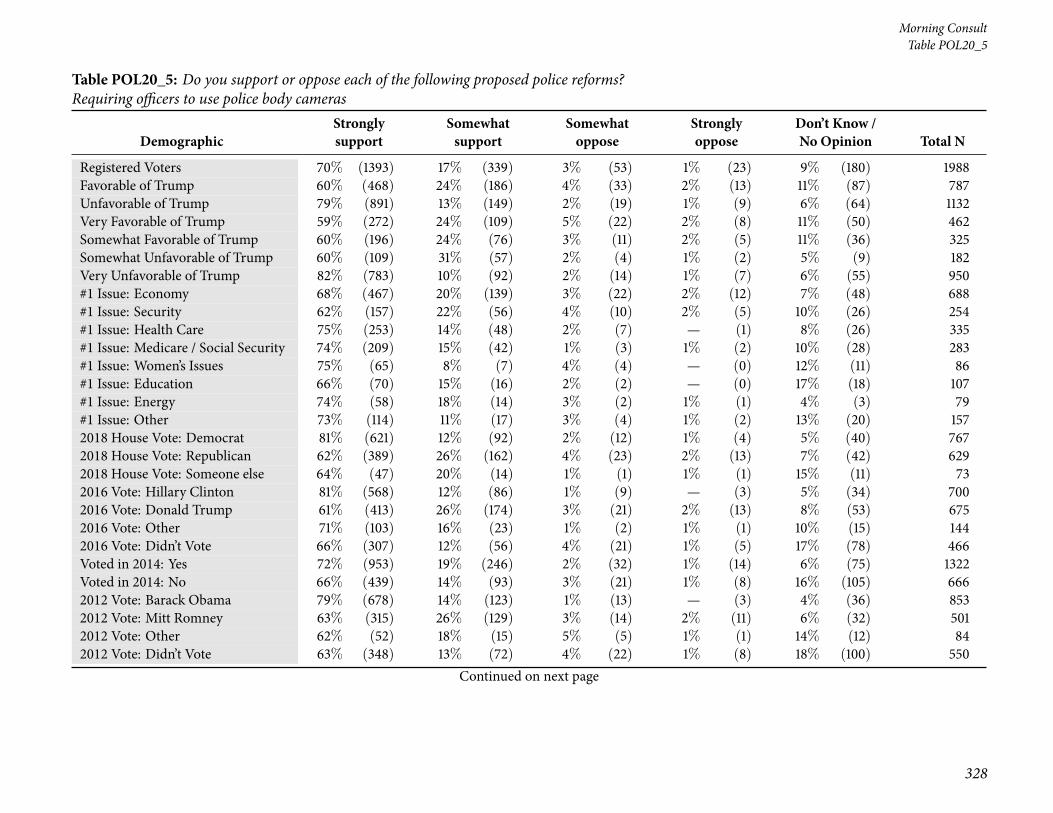
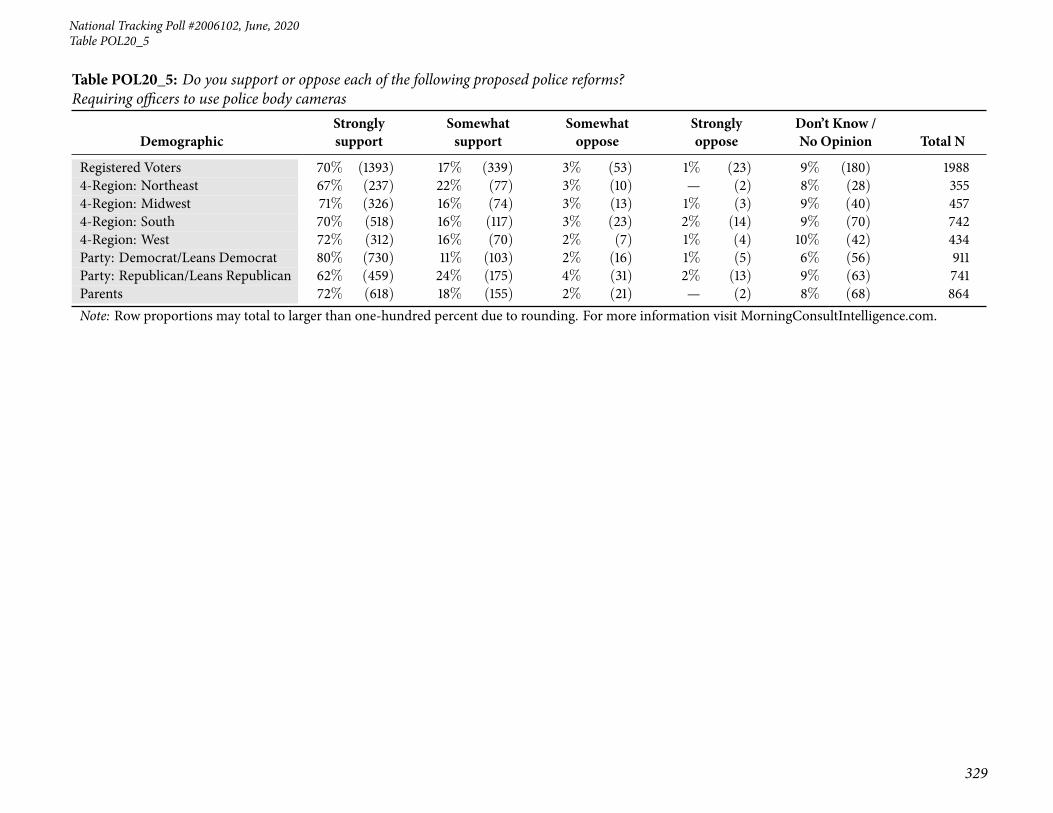
80 Table POL20_5: Do you support or oppose each of the following proposed police reforms? Requiringofficers to use police body cameras . . . . . . . . . . . . . . . . . . . . . . . . . . . . . . . . . . . . . 326
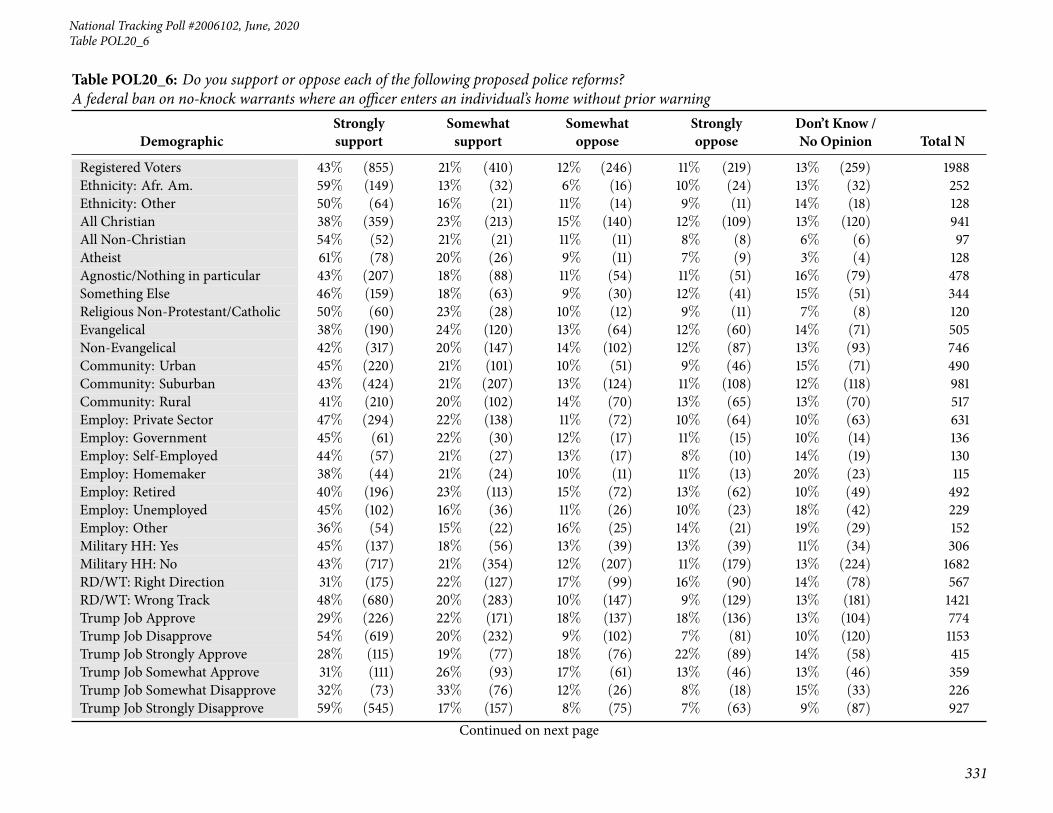
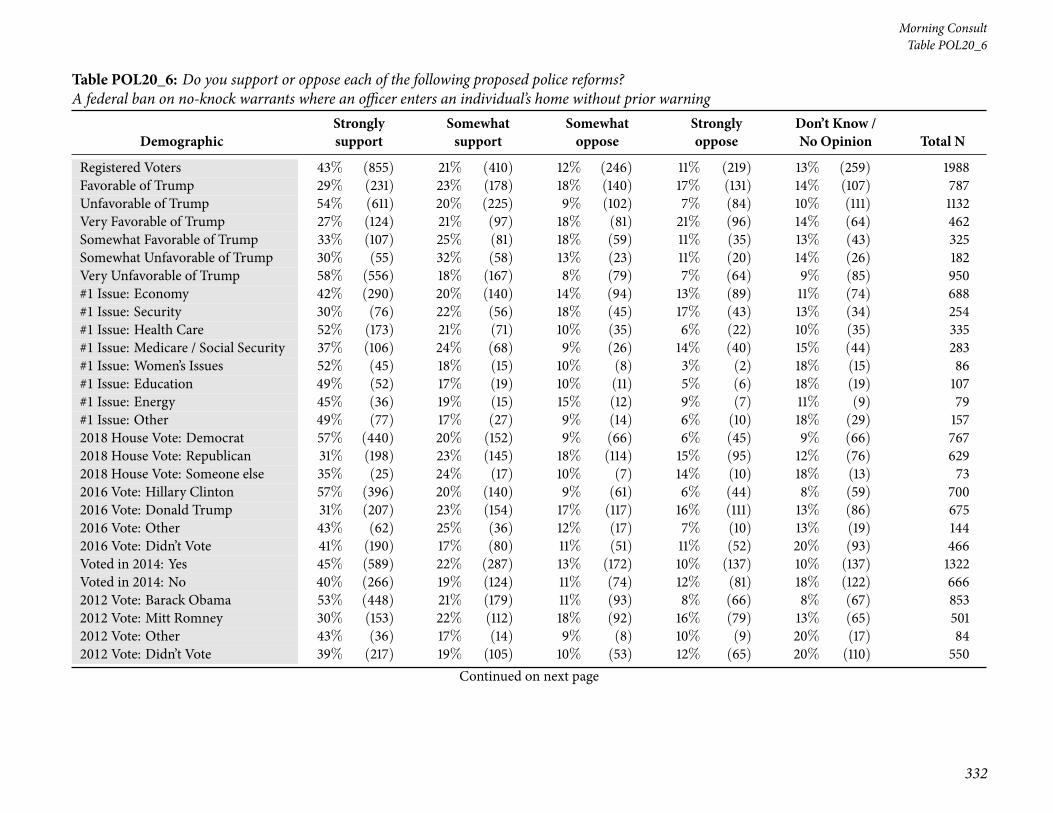
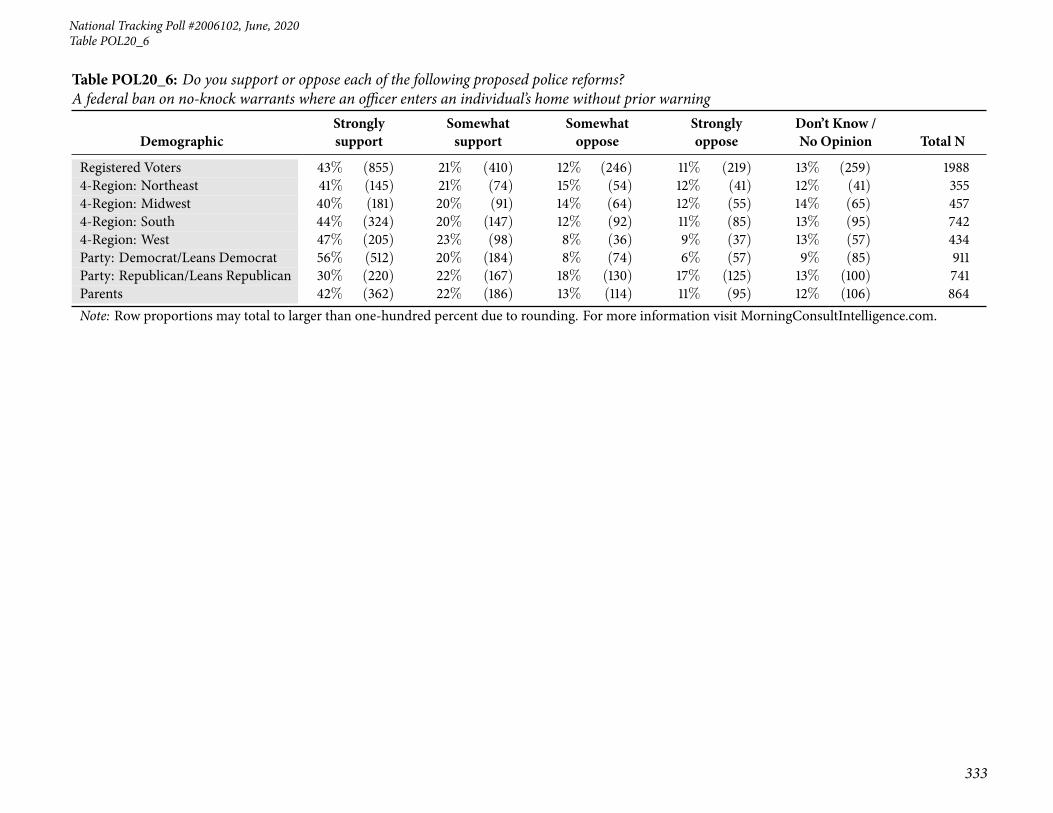
81 Table POL20_6: Do you support or oppose each of the following proposed police reforms? A federalban on no-knock warrants where an officer enters an individual’s home without prior warning . . . . . 330
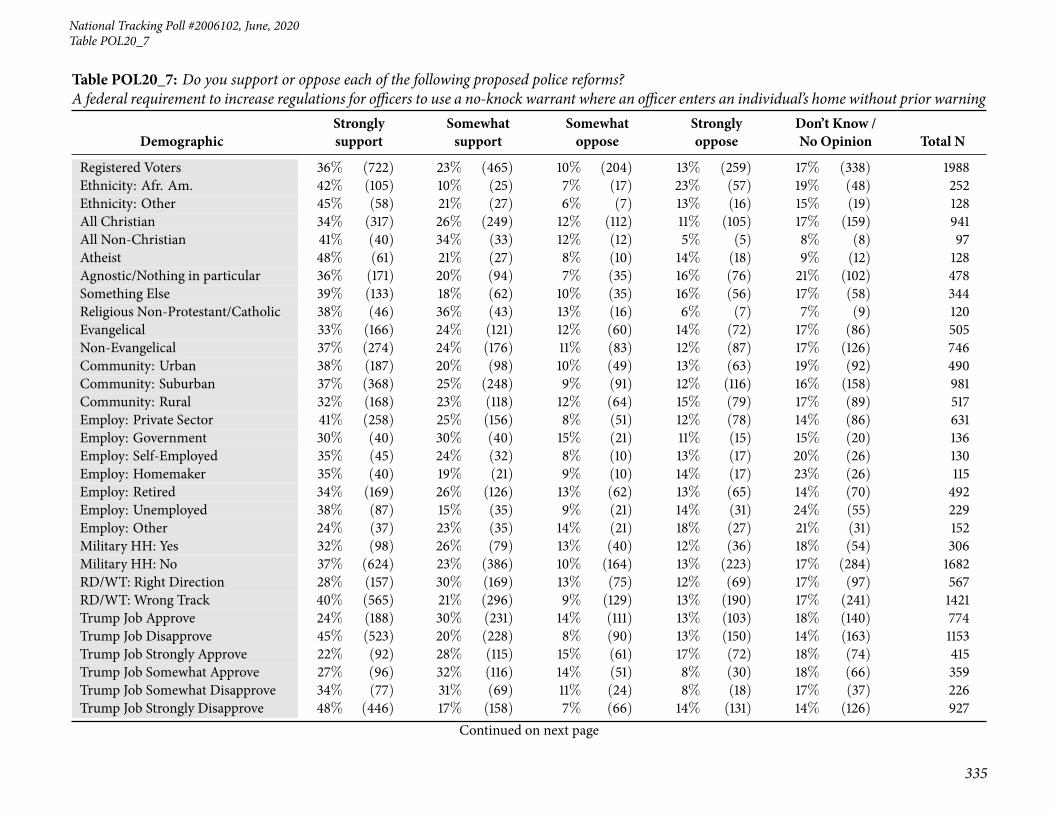
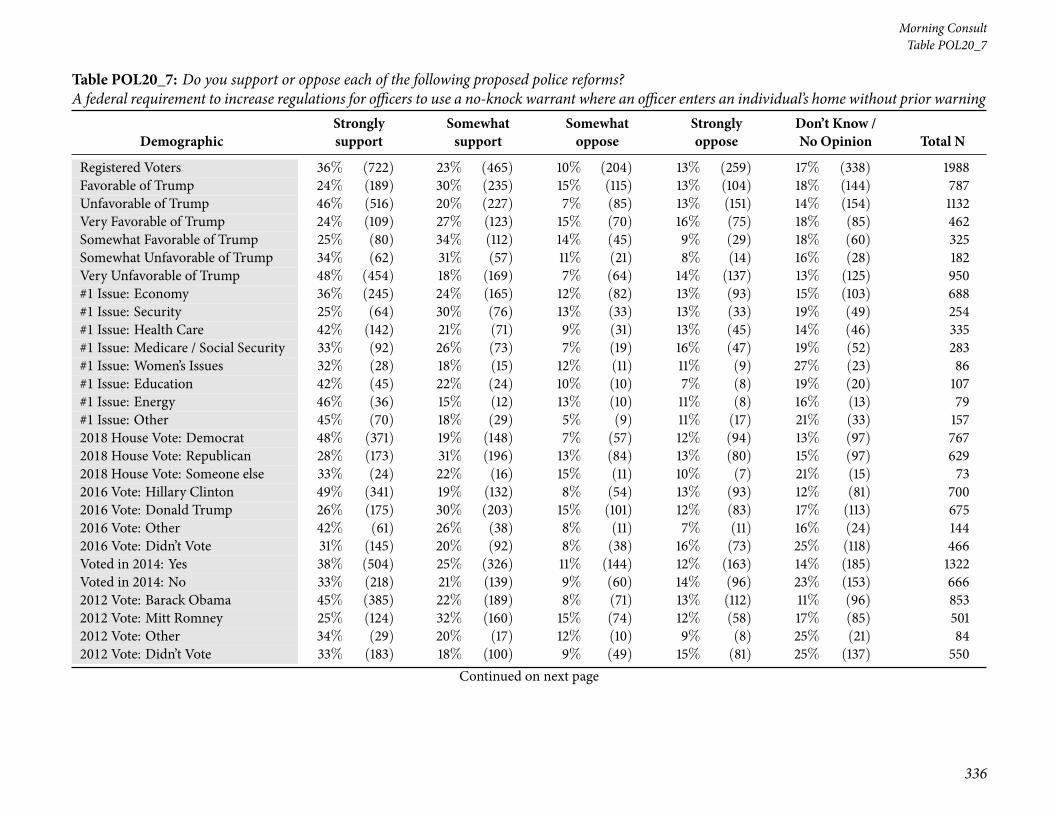
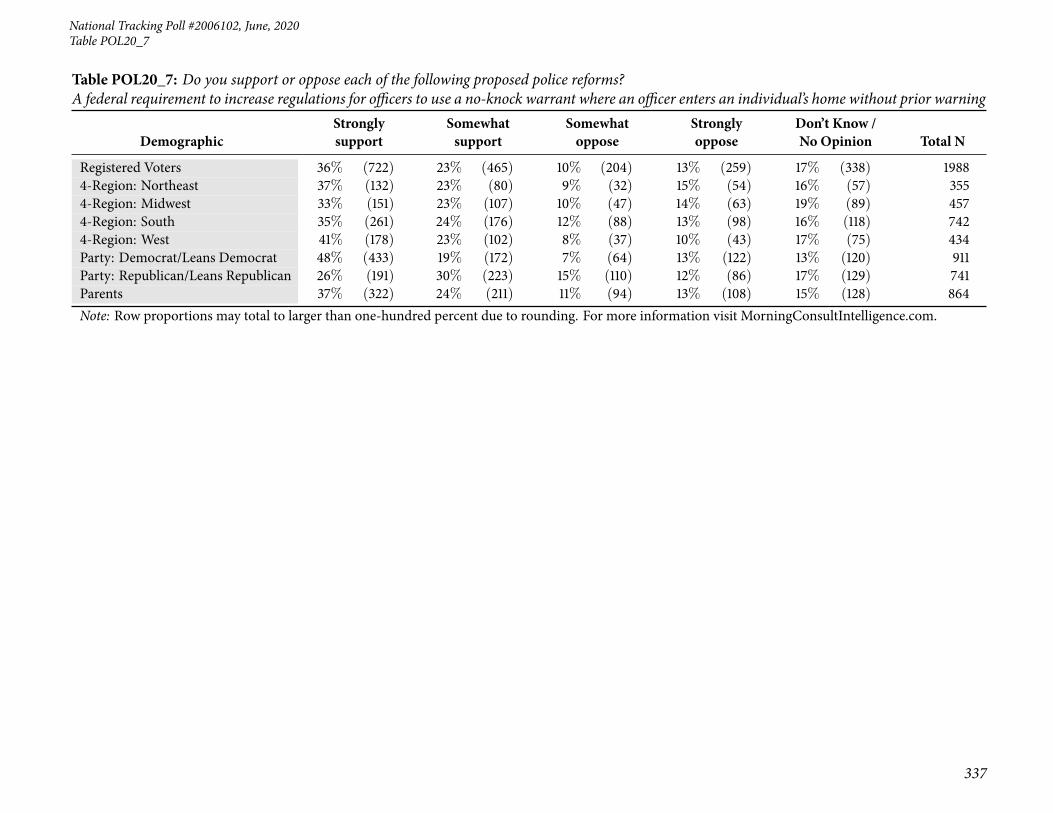
82 Table POL20_7: Do you support or oppose each of the following proposed police reforms? A federalrequirement to increase regulations for officers to use a no-knock warrant where an officer enters anindividual’s home without prior warning . . . . . . . . . . . . . . . . . . . . . . . . . . . . . . . . . 334
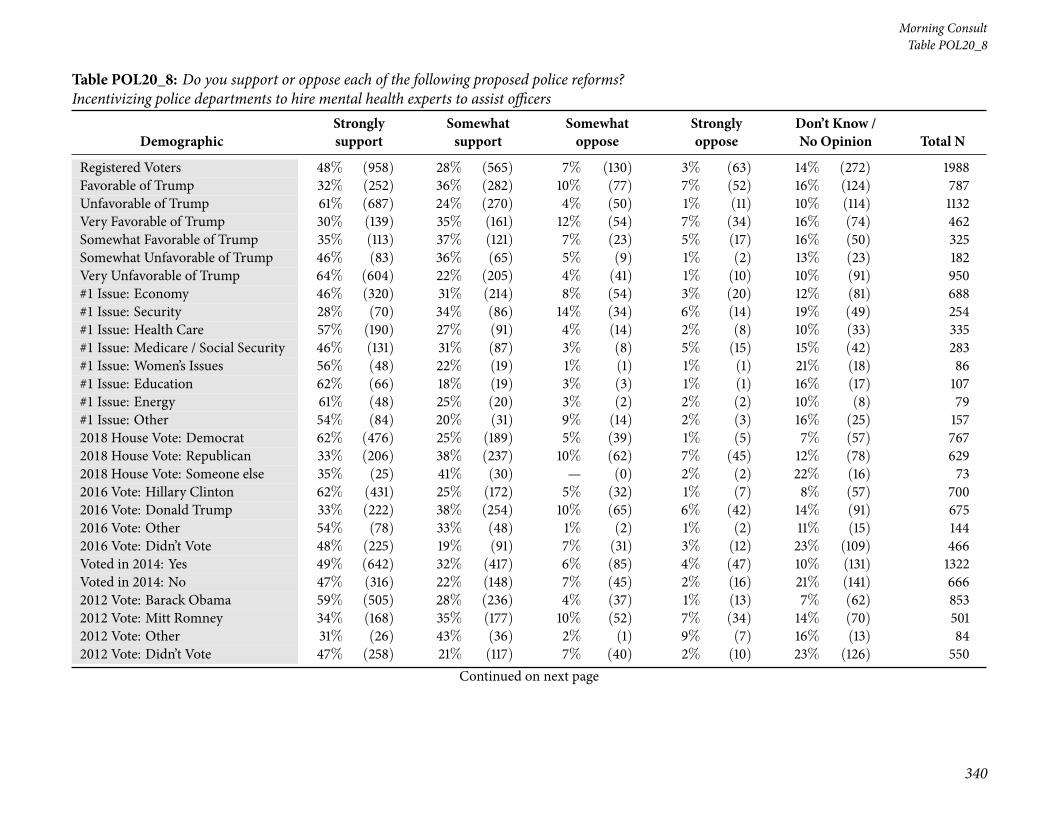
83 Table POL20_8: Do you support or oppose each of the following proposed police reforms? Incentivizingpolice departments to hire mental health experts to assist officers . . . . . . . . . . . . . . . . . . . . . 338
6
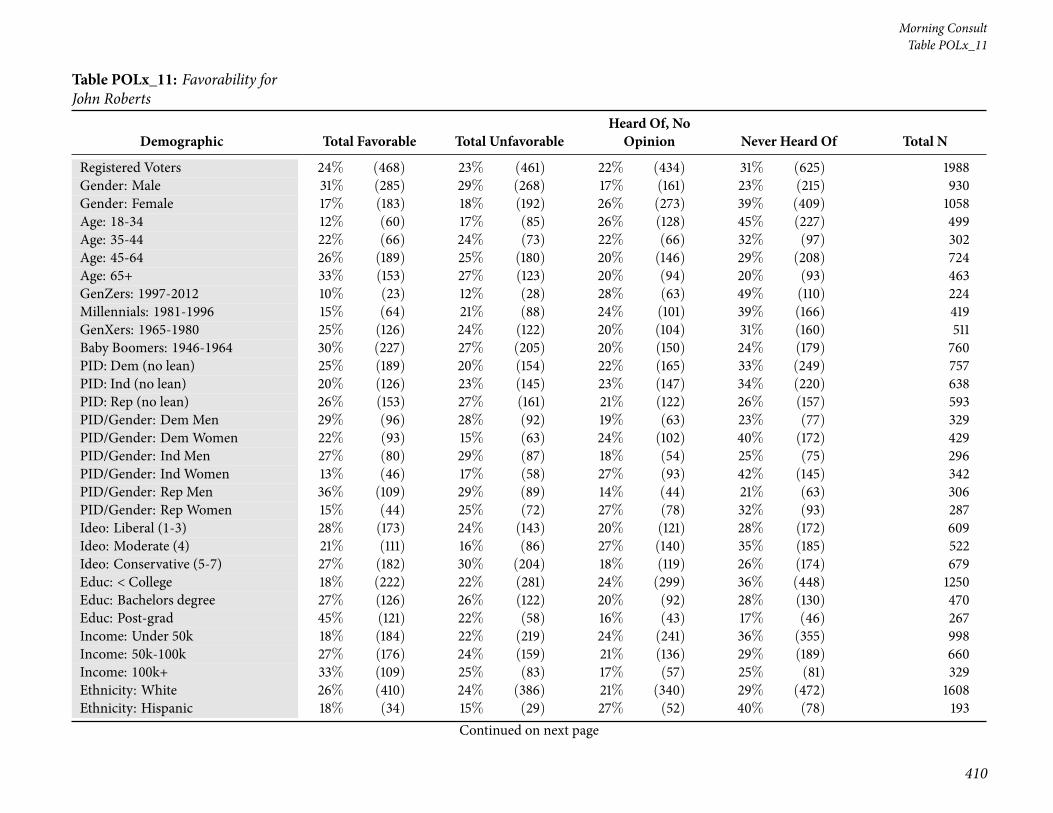
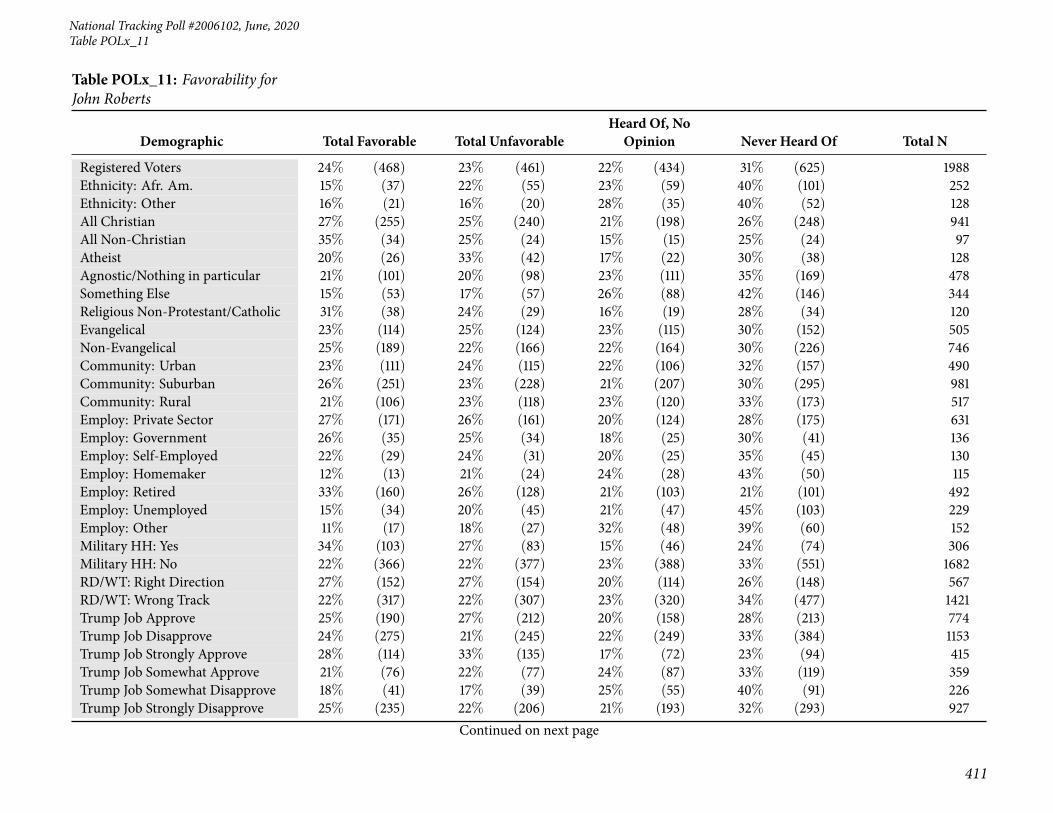
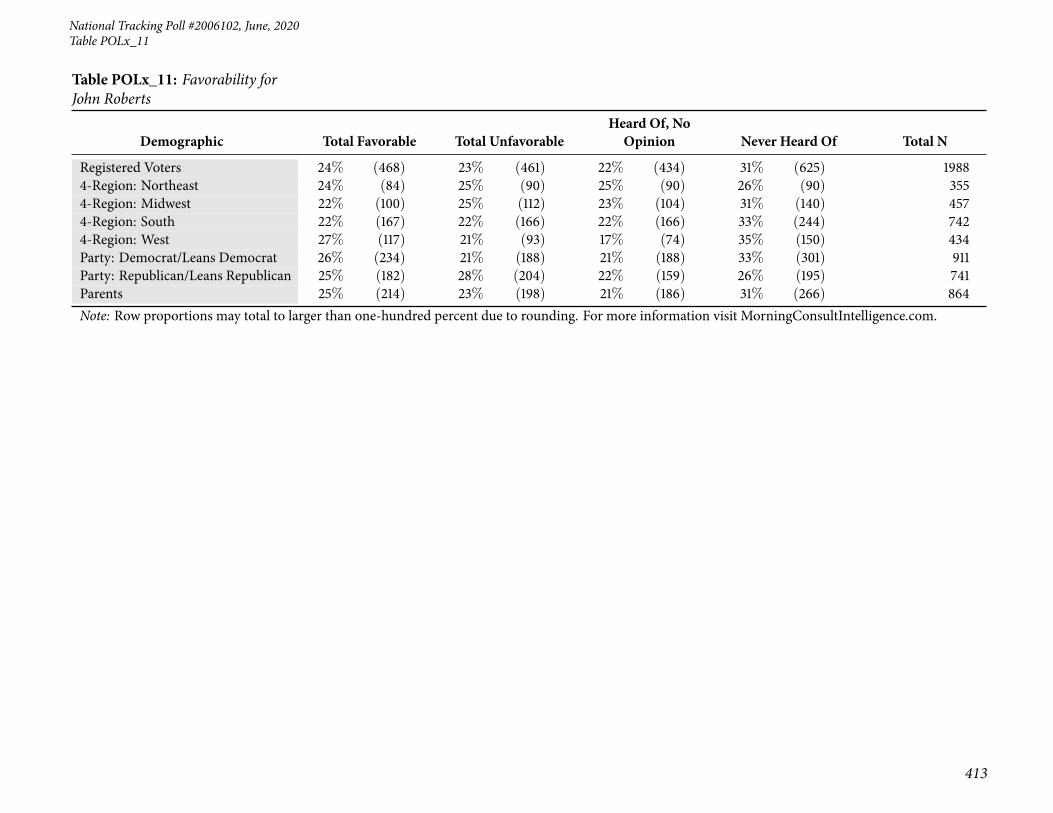
Page 7
National Tracking Poll #2006102, June, 2020
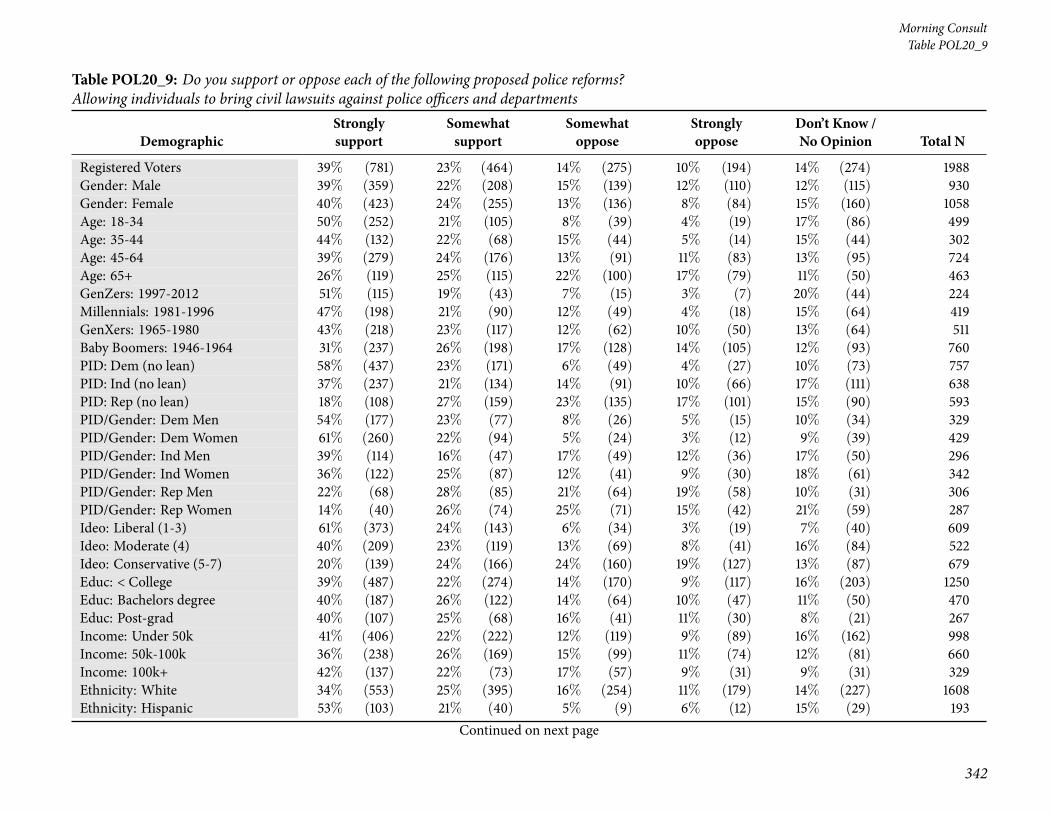
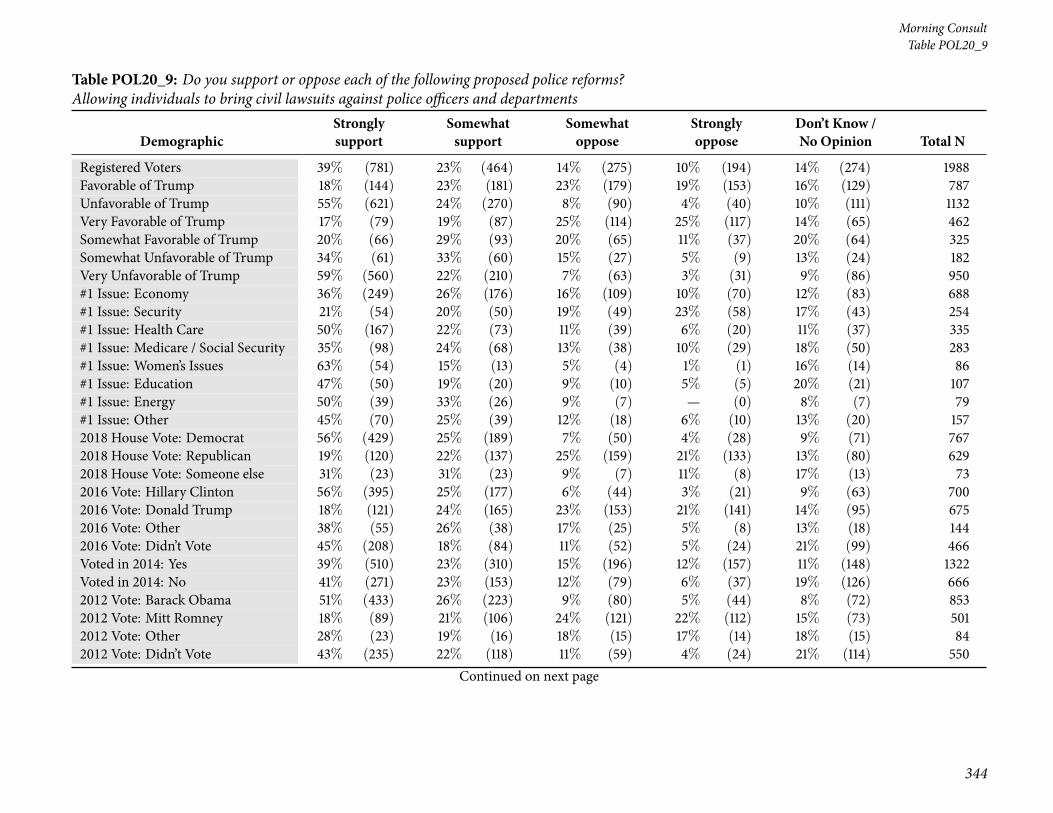
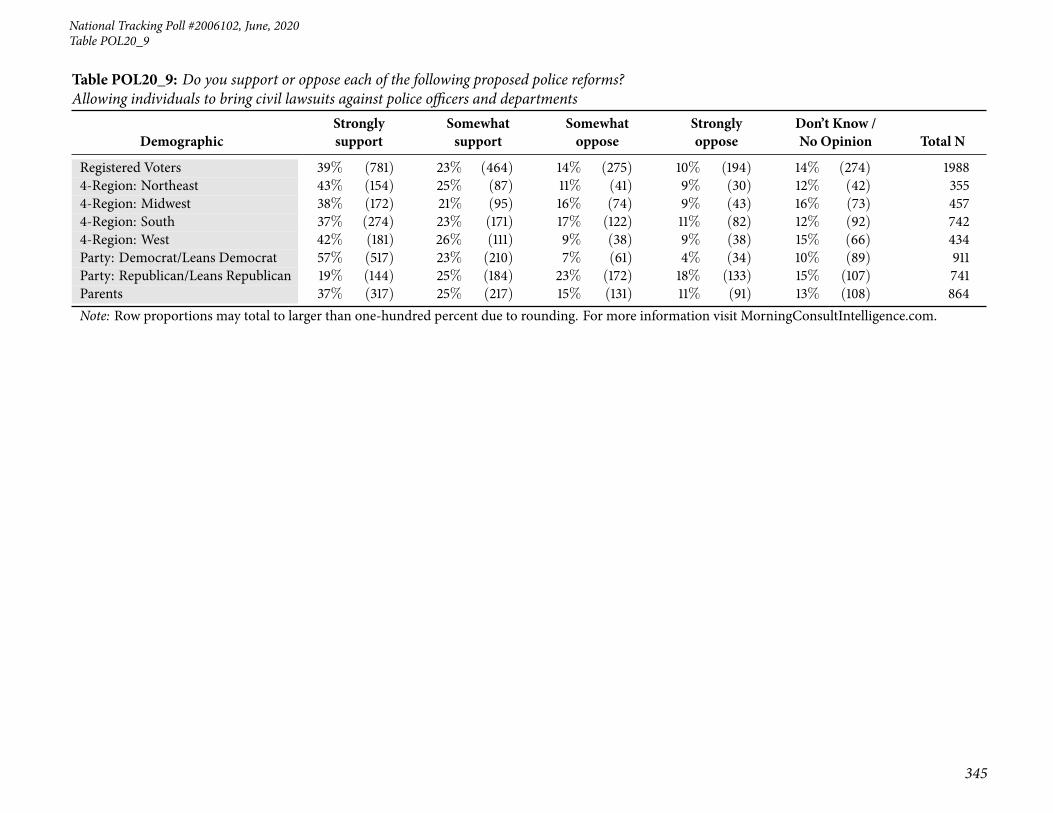
84 Table POL20_9: Do you support or oppose each of the following proposed police reforms? Allowingindividuals to bring civil lawsuits against police officers and departments . . . . . . . . . . . . . . . . 342
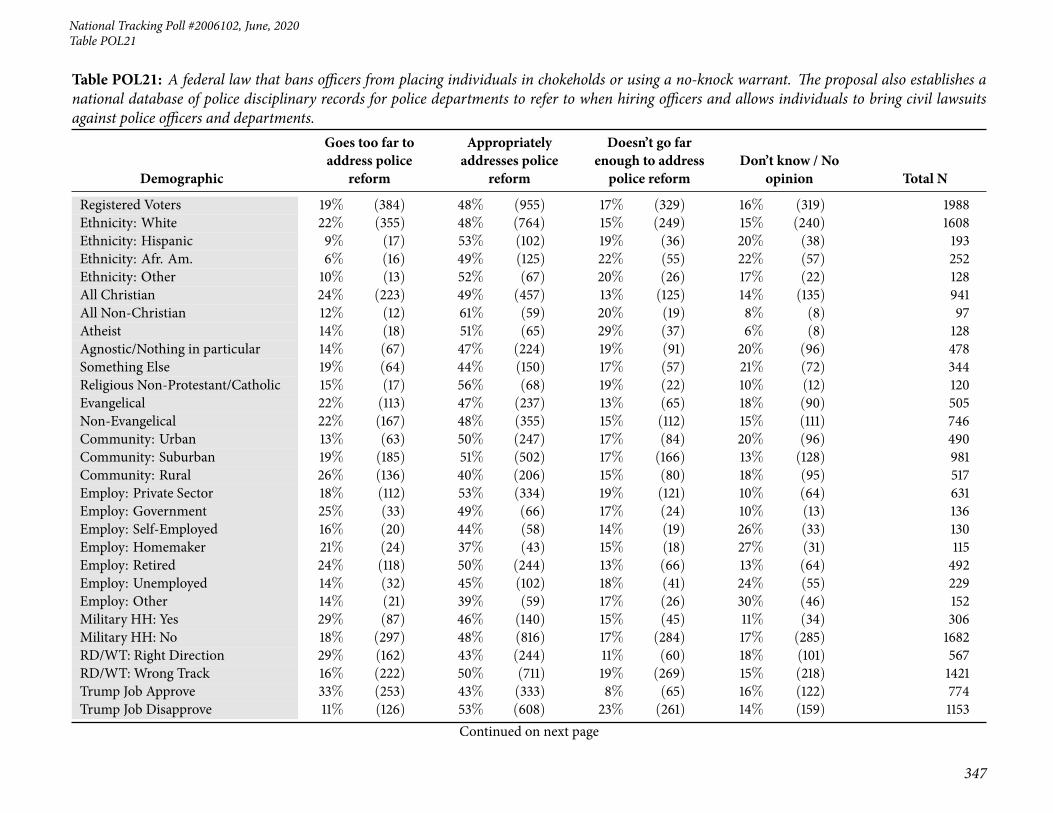
85 Table POL21: A federal law that bans officers from placing individuals in chokeholds or using a no-knock warrant. The proposal also establishes a national database of police disciplinary records for policedepartments to refer to when hiring officers and allows individuals to bring civil lawsuits against policeofficers and departments. . . . . . . . . . . . . . . . . . . . . . . . . . . . . . . . . . . . . . . . . . 346
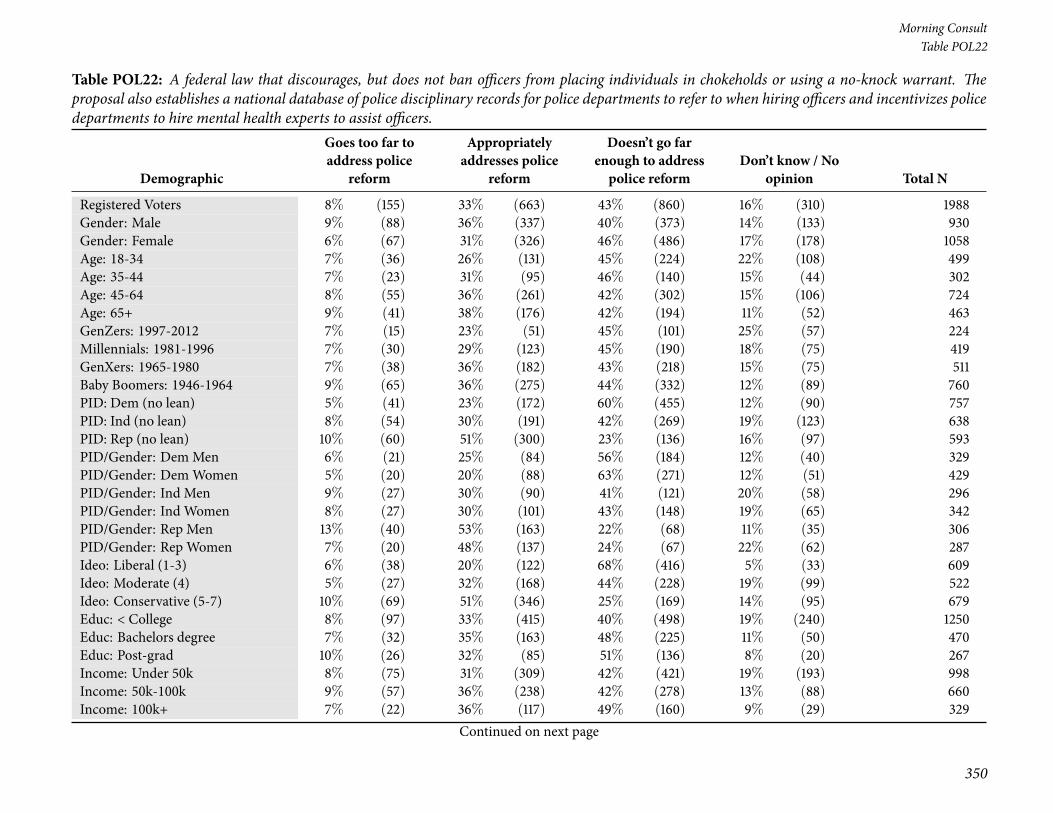
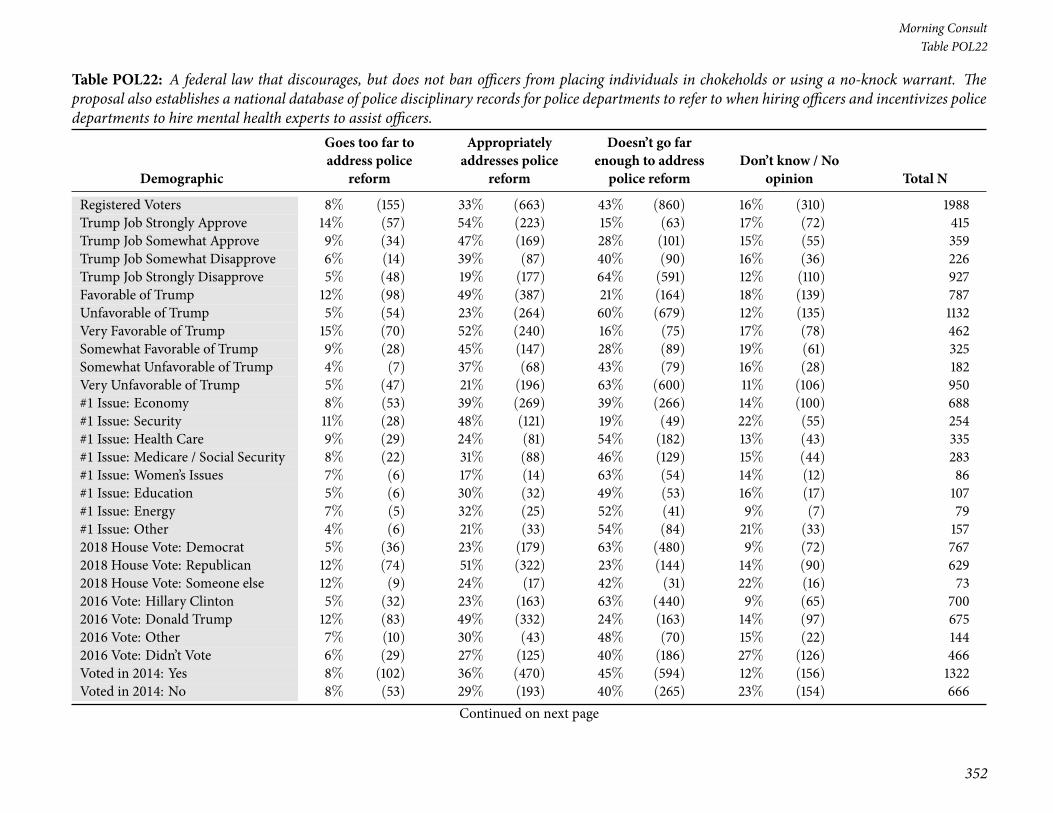
86 Table POL22: A federal law that discourages, but does not ban officers from placing individuals inchokeholds or using a no-knock warrant. The proposal also establishes a national database of policedisciplinary records for police departments to refer to when hiring officers and incentivizes police de-partments to hire mental health experts to assist officers. . . . . . . . . . . . . . . . . . . . . . . . . . 350
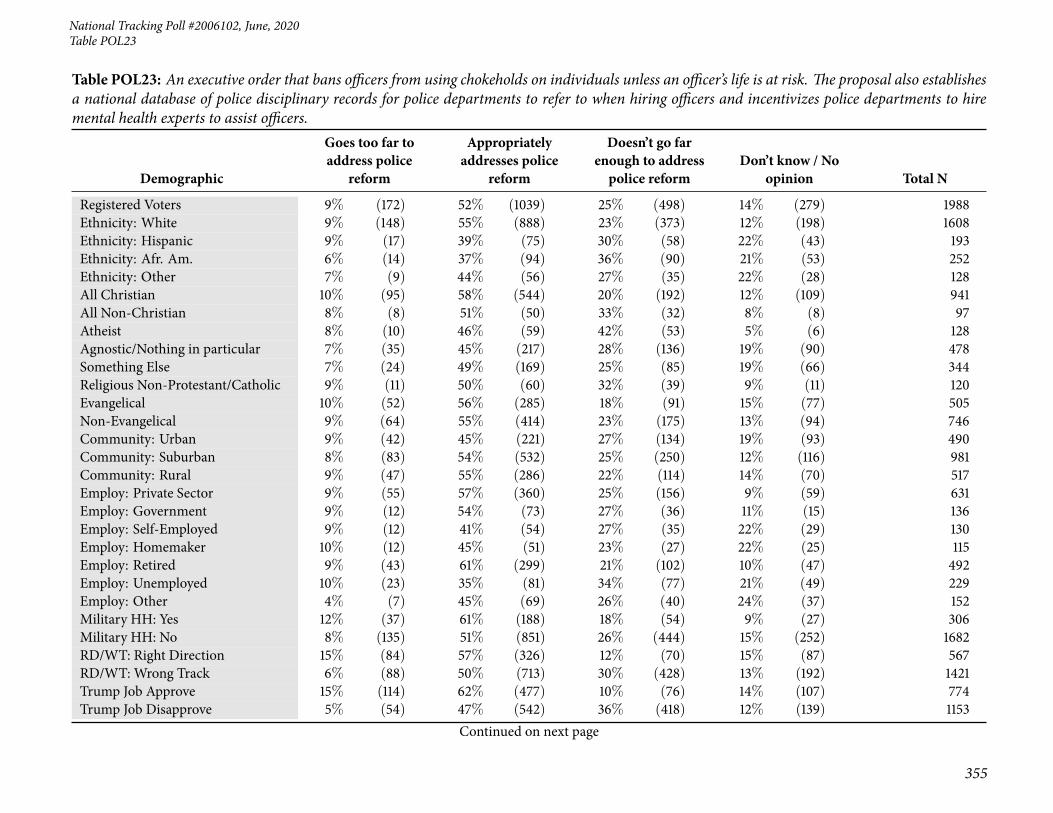
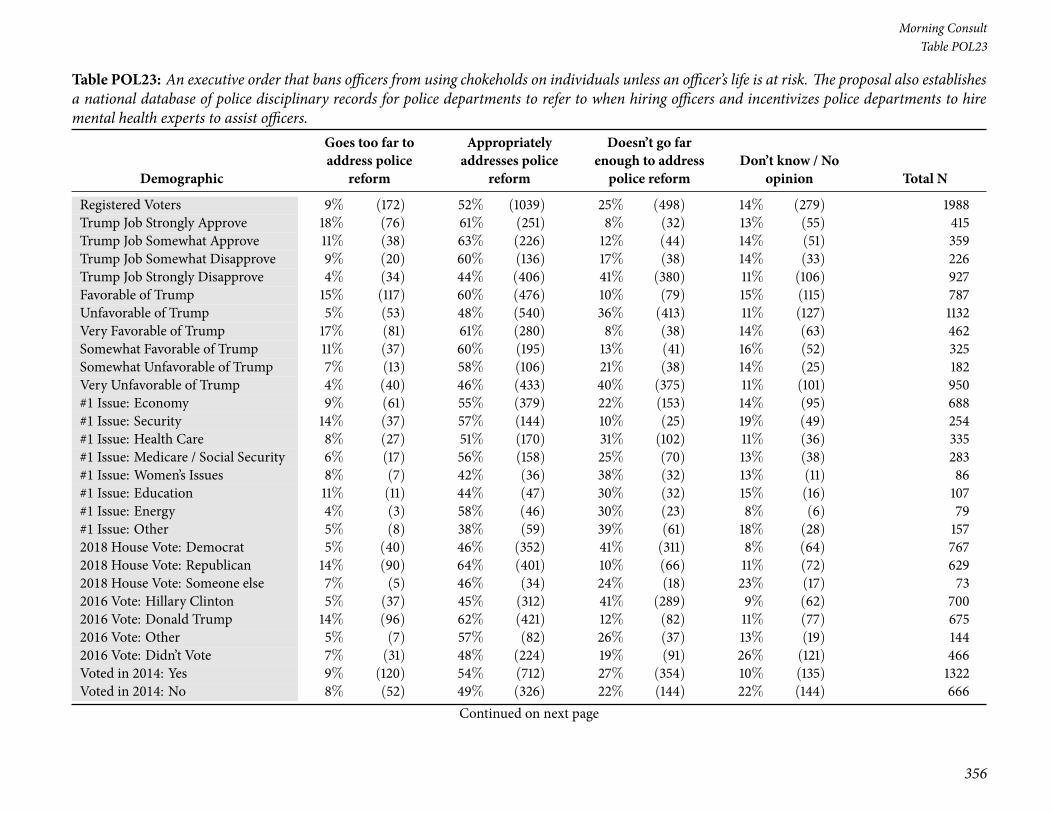
87 Table POL23: An executive order that bans officers from using chokeholds on individuals unless anofficer’s life is at risk. The proposal also establishes a national database of police disciplinary records forpolice departments to refer to when hiring officers and incentivizes police departments to hire mentalhealth experts to assist officers. . . . . . . . . . . . . . . . . . . . . . . . . . . . . . . . . . . . . . . 354
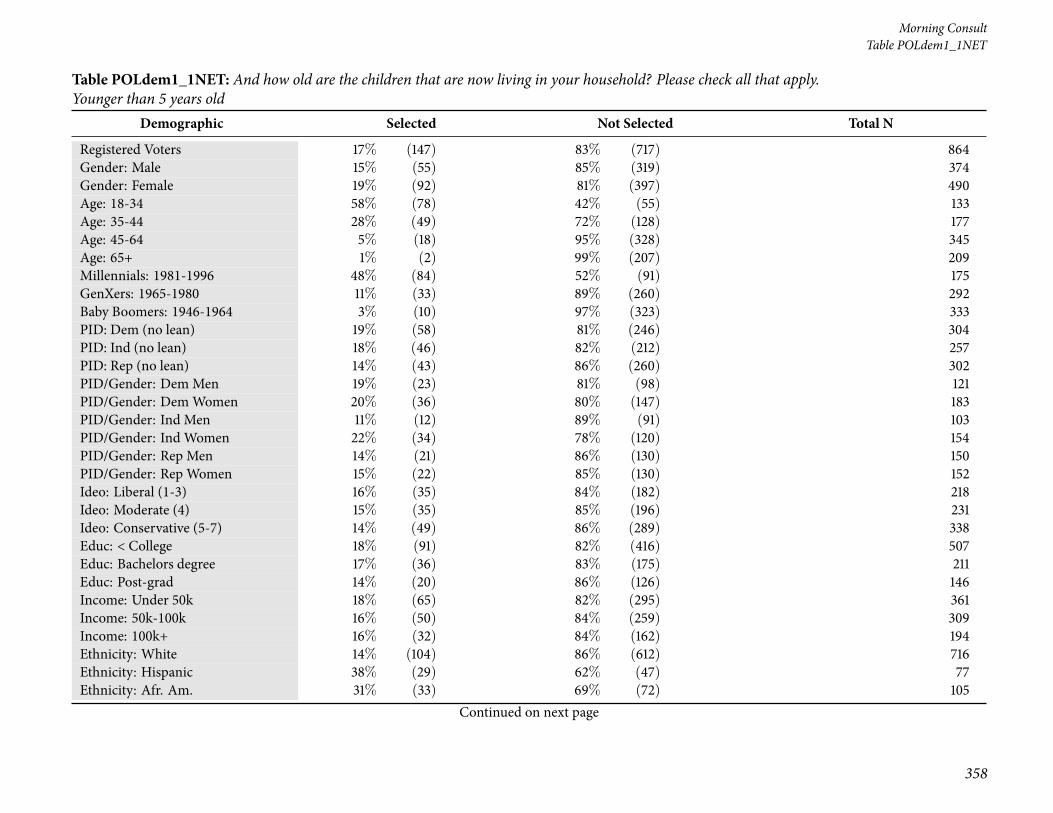
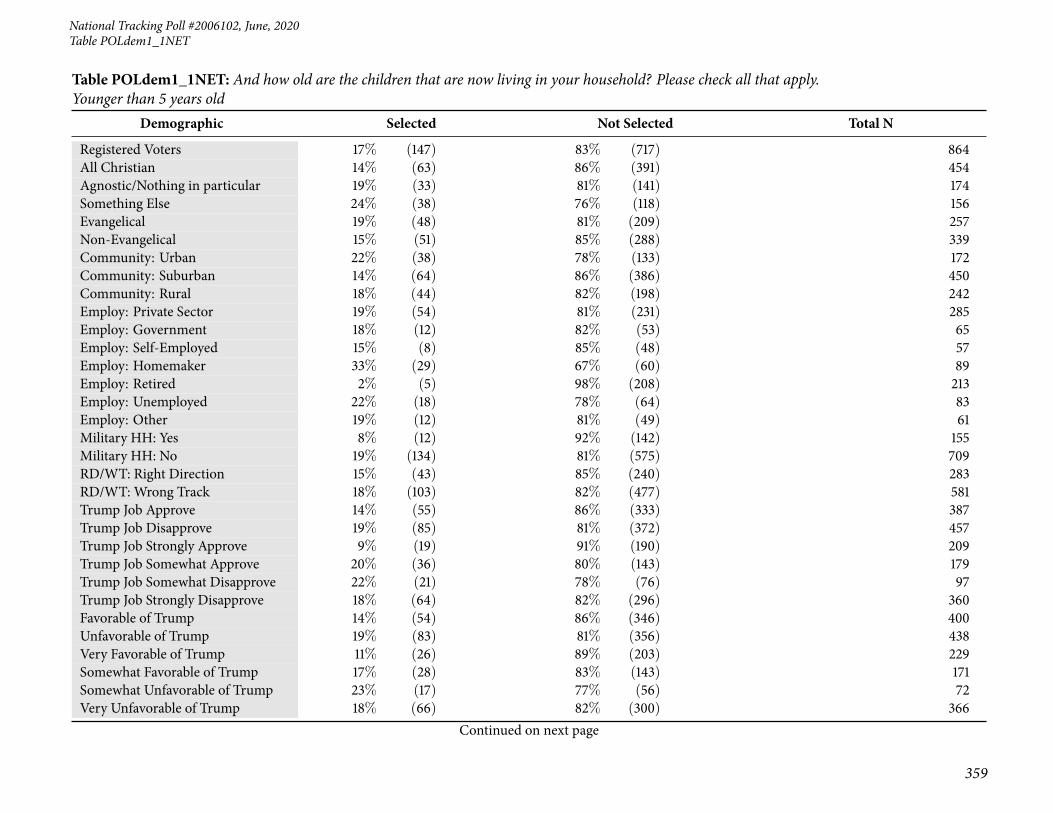
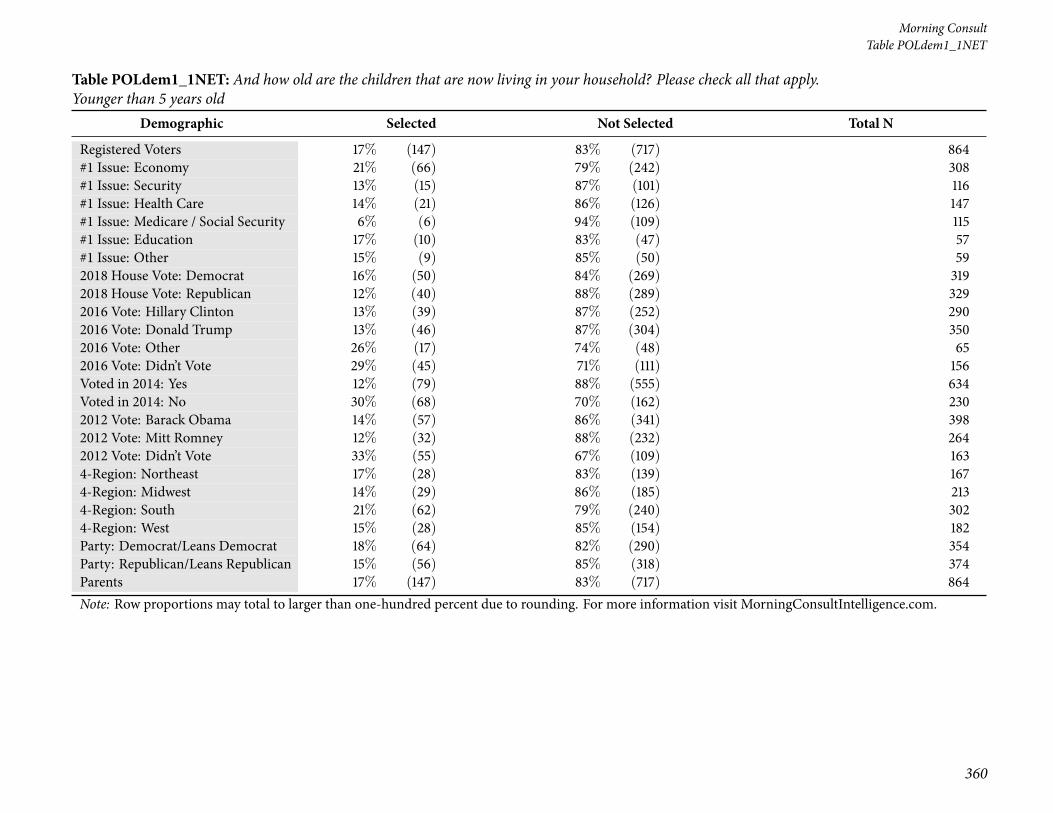
88 Table POLdem1_1NET: And how old are the children that are now living in your household? Pleasecheck all that apply. Younger than 5 years old . . . . . . . . . . . . . . . . . . . . . . . . . . . . . . . 358
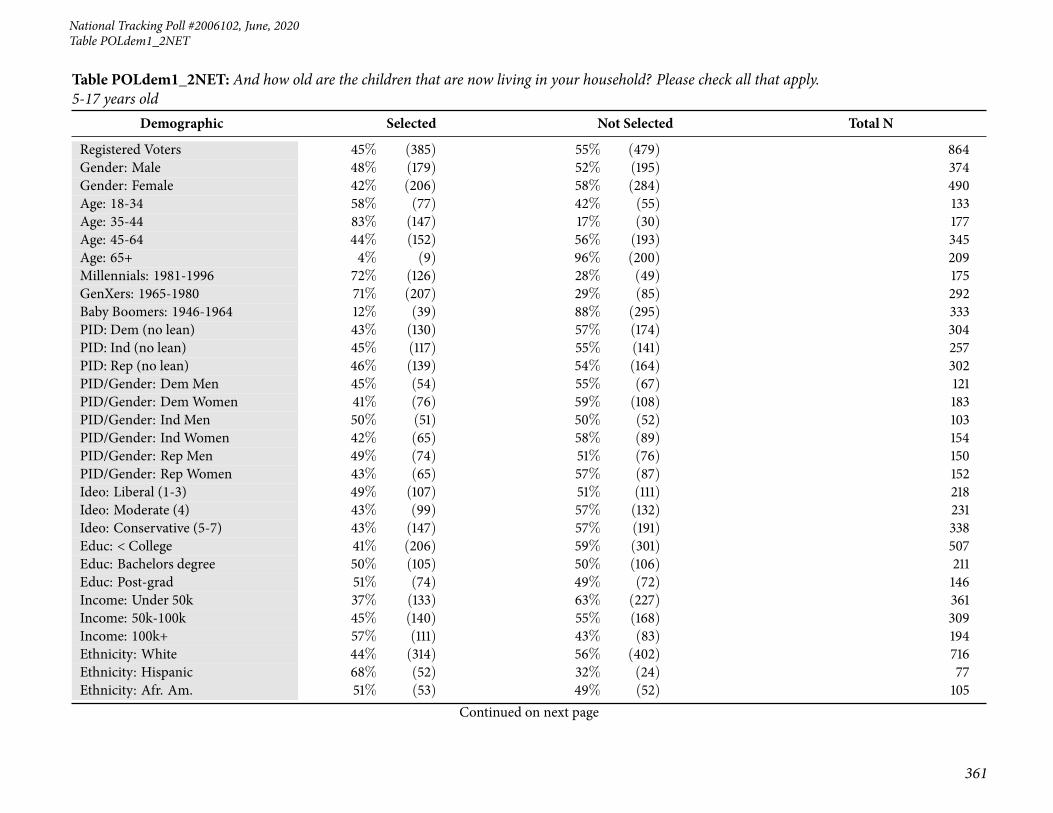
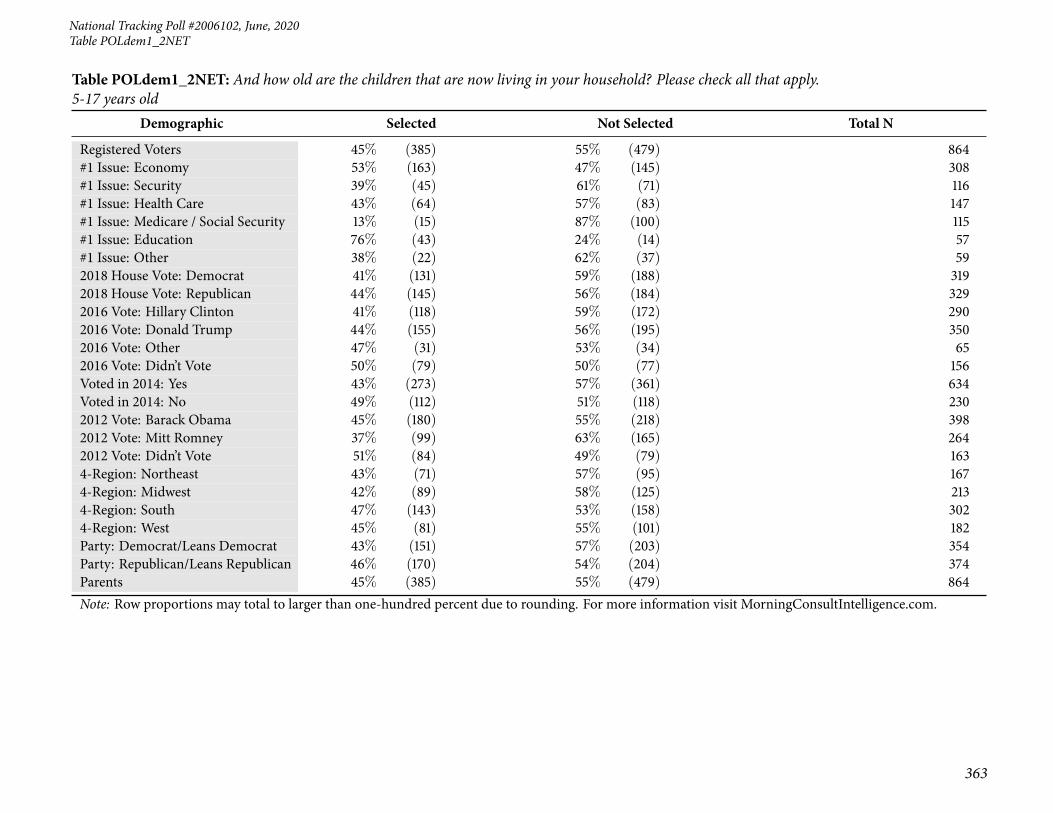
89 Table POLdem1_2NET: And how old are the children that are now living in your household? Pleasecheck all that apply. 5-17 years old . . . . . . . . . . . . . . . . . . . . . . . . . . . . . . . . . . . . 361
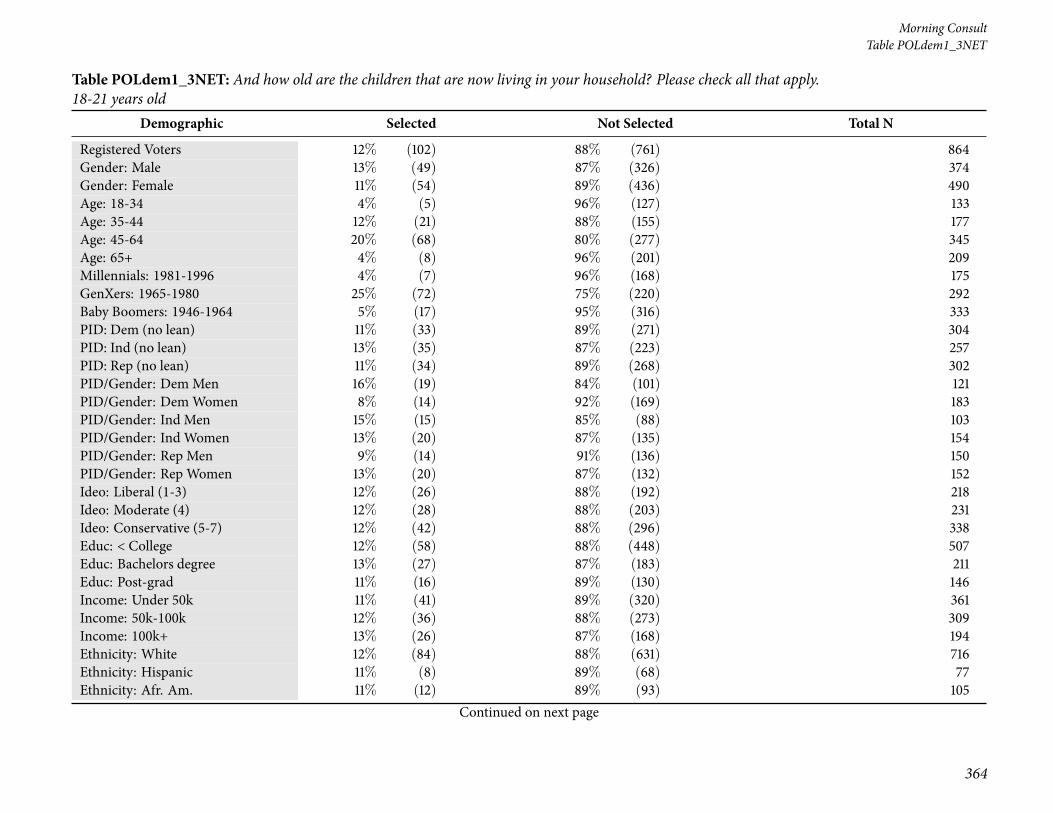
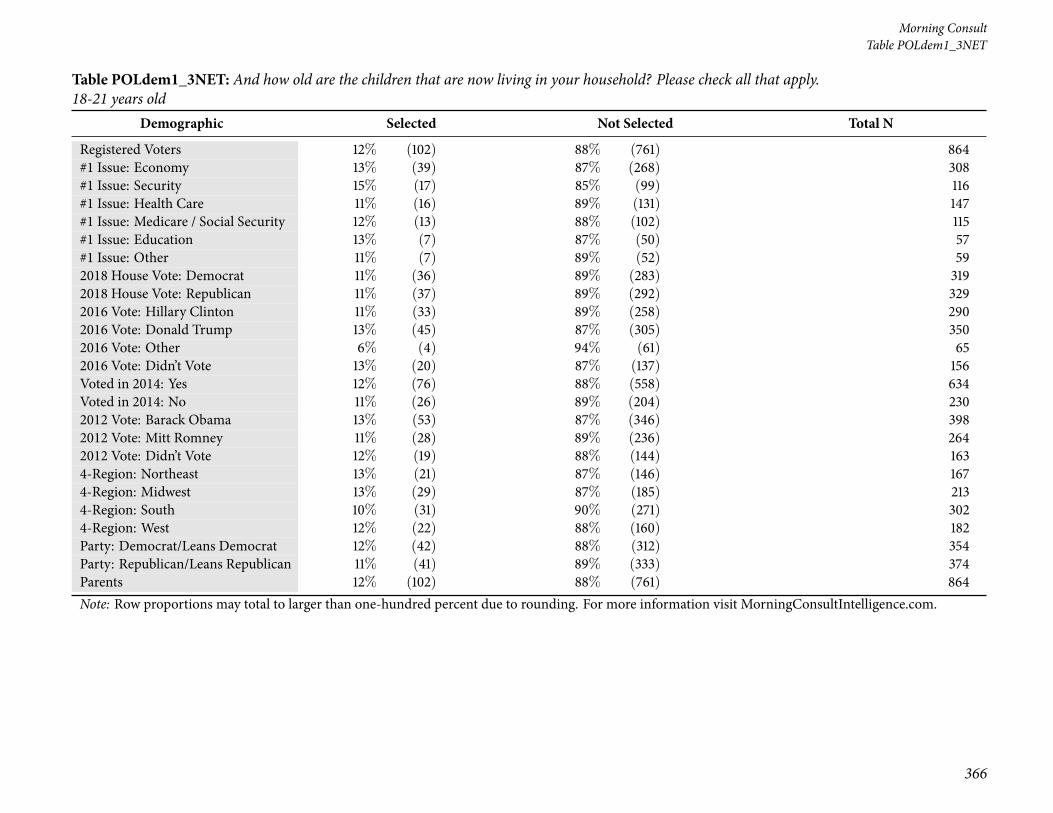
90 Table POLdem1_3NET: And how old are the children that are now living in your household? Pleasecheck all that apply. 18-21 years old . . . . . . . . . . . . . . . . . . . . . . . . . . . . . . . . . . . . 364
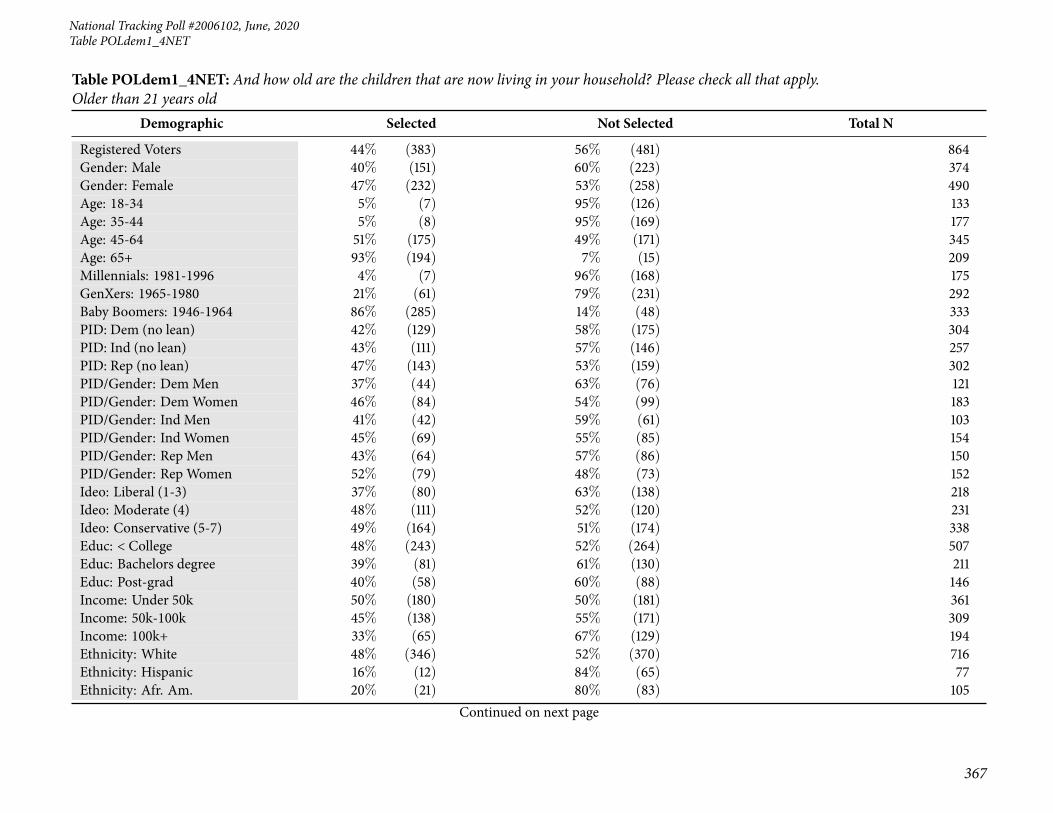
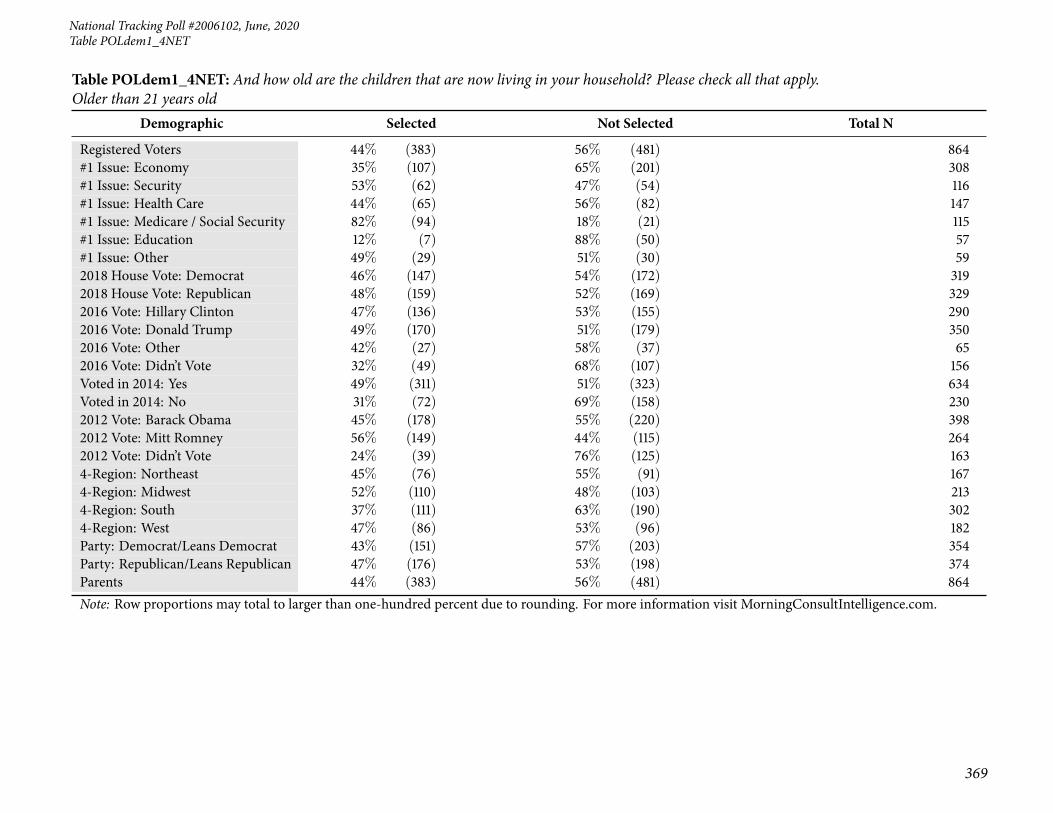
91 Table POLdem1_4NET: And how old are the children that are now living in your household? Pleasecheck all that apply. Older than 21 years old . . . . . . . . . . . . . . . . . . . . . . . . . . . . . . . 367
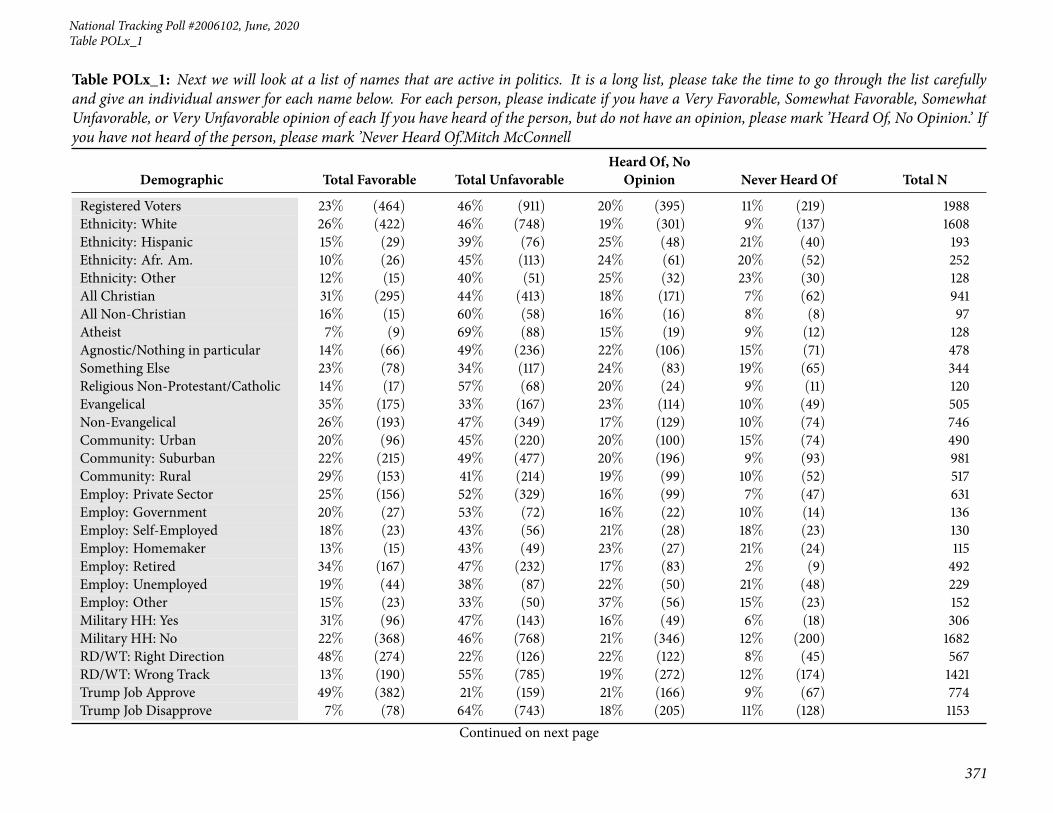
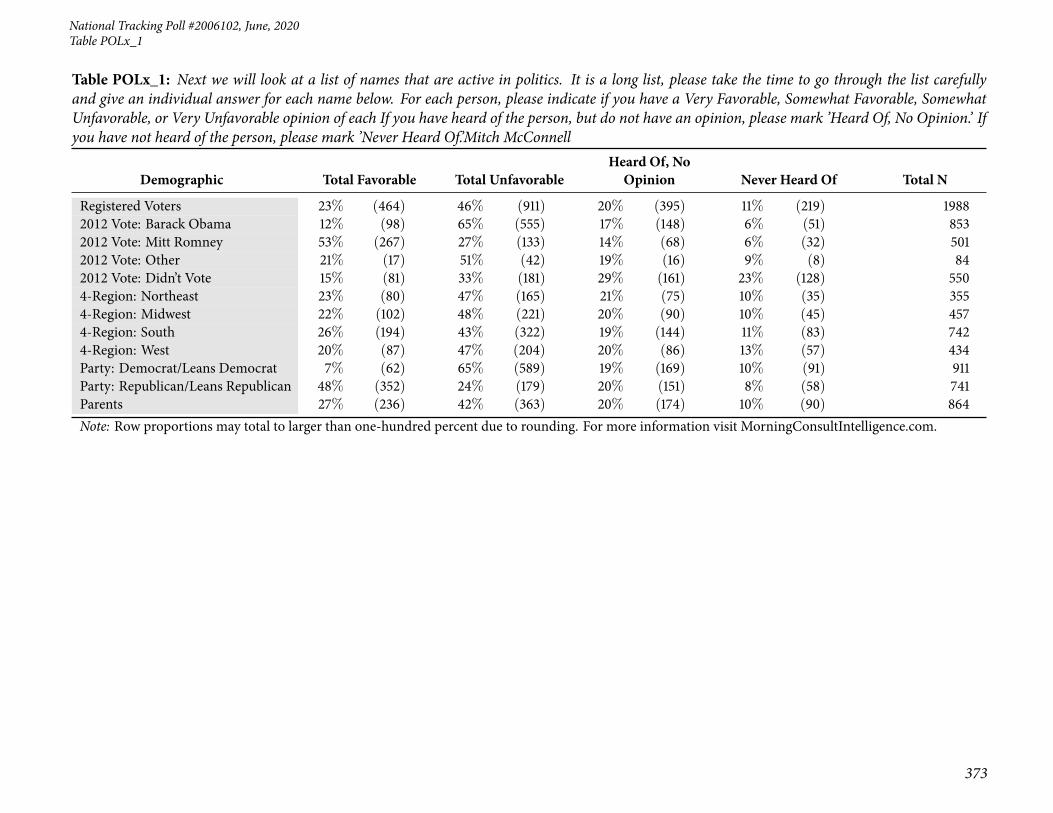
92 Table POLx_1: Next we will look at a list of names that are active in politics. It is a long list, please takethe time to go through the list carefully and give an individual answer for each name below. For eachperson, please indicate if you have a Very Favorable, Somewhat Favorable, Somewhat Unfavorable, orVery Unfavorable opinion of each If you have heard of the person, but do not have an opinion, pleasemark ’Heard Of, No Opinion.’ If you have not heard of the person, please mark ’Never Heard Of.’MitchMcConnell . . . . . . . . . . . . . . . . . . . . . . . . . . . . . . . . . . . . . . . . . . . . . . . . . 370
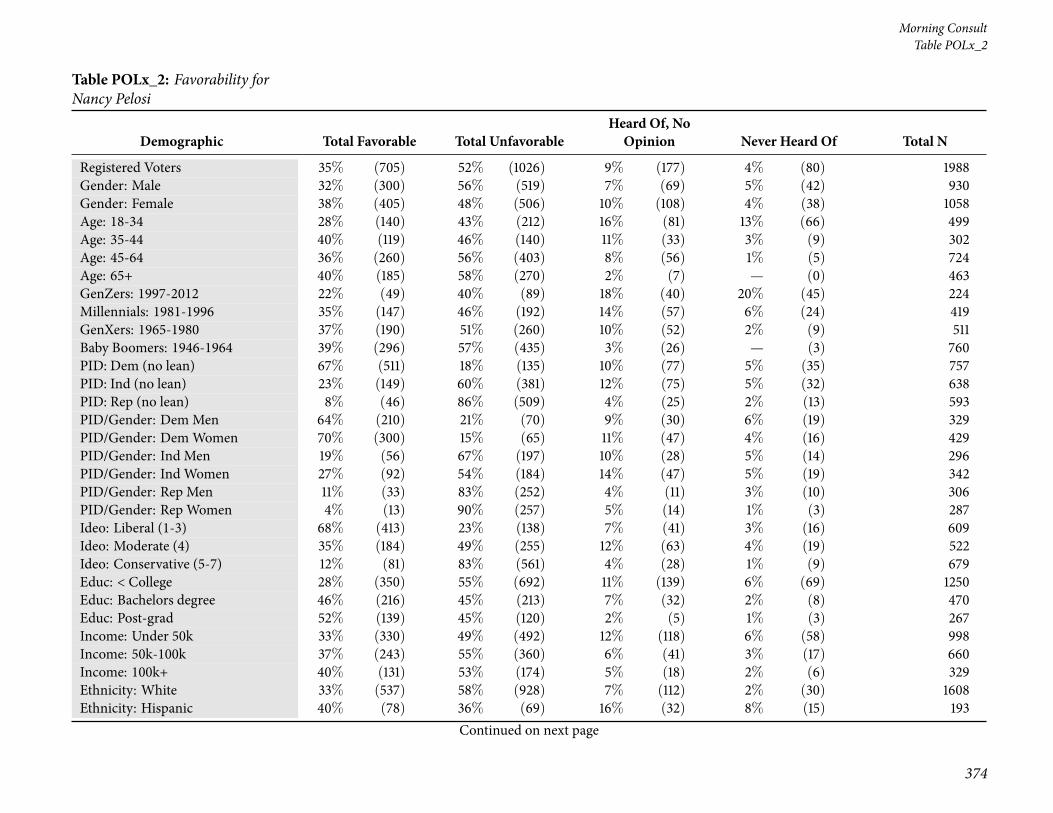
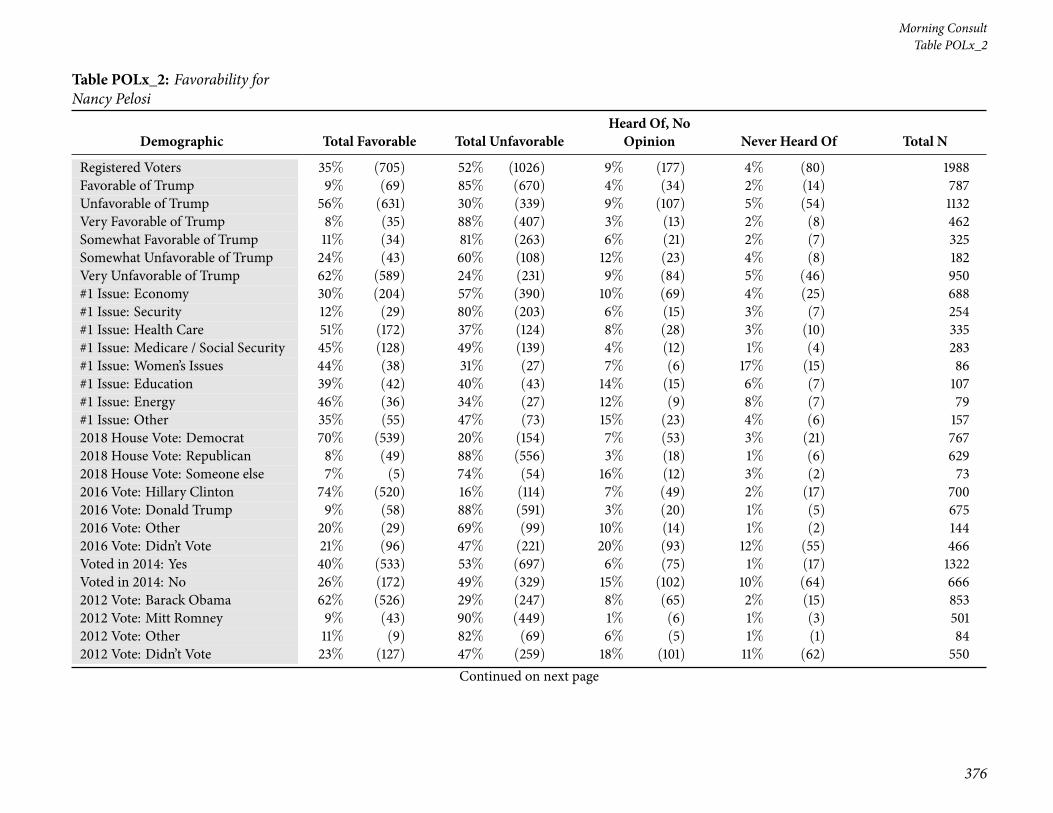
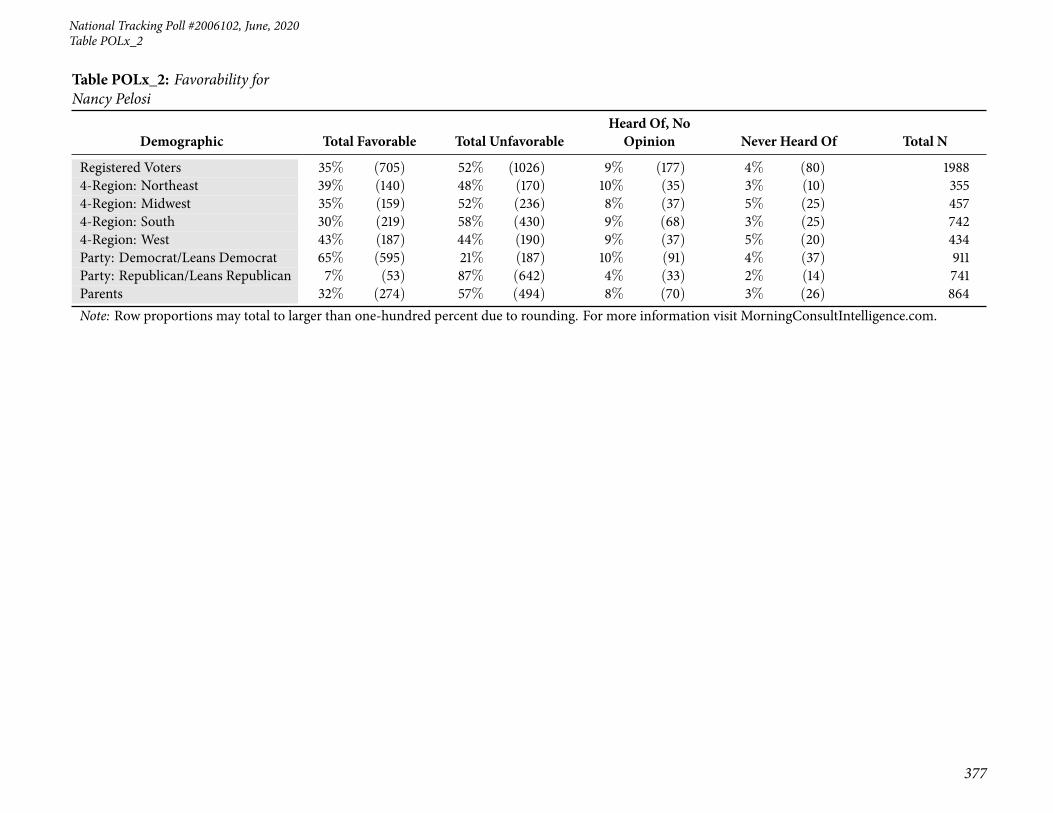
93 Table POLx_2: Favorability for Nancy Pelosi . . . . . . . . . . . . . . . . . . . . . . . . . . . . . . . 374
94 Table POLx_3: Favorability for Charles Schumer . . . . . . . . . . . . . . . . . . . . . . . . . . . . 378
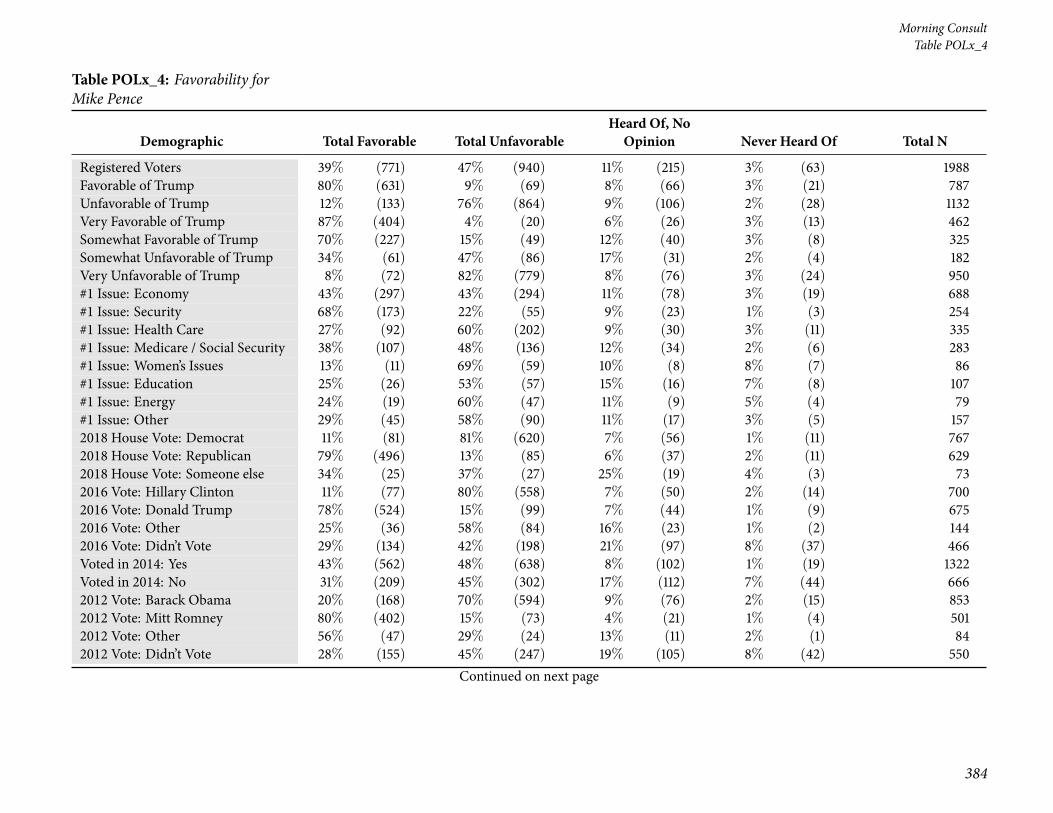
95 Table POLx_4: Favorability for Mike Pence . . . . . . . . . . . . . . . . . . . . . . . . . . . . . . . 382
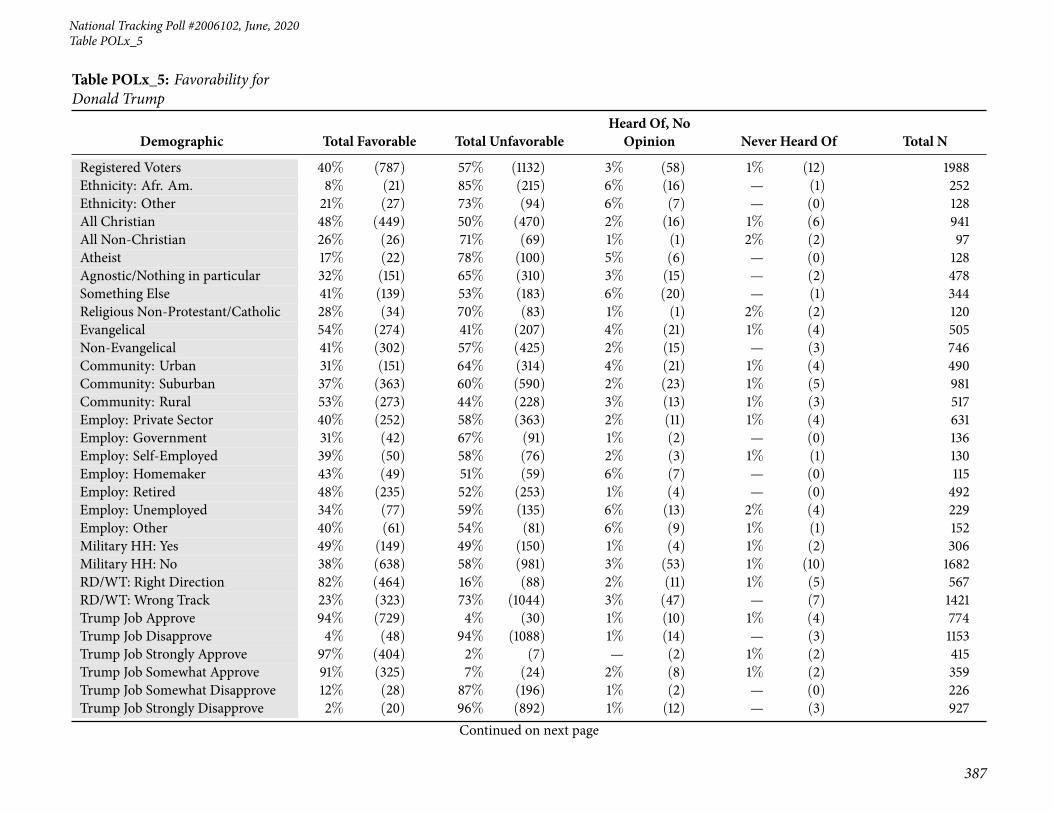
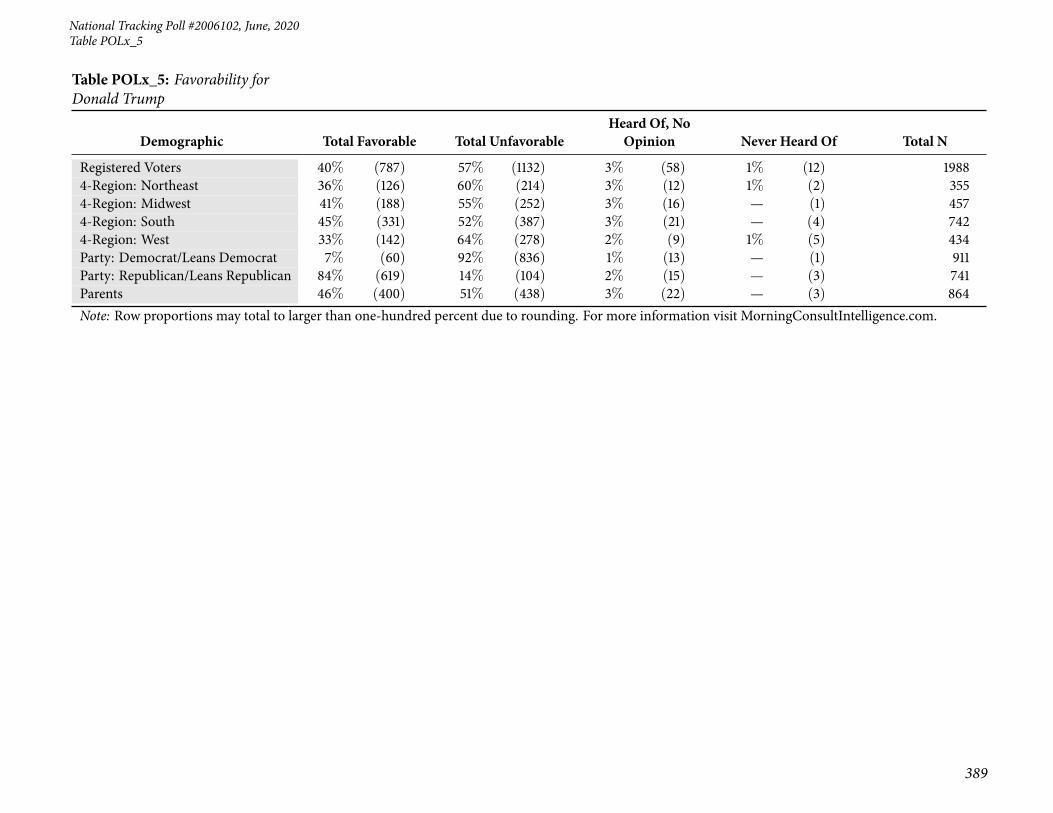
96 Table POLx_5: Favorability for Donald Trump . . . . . . . . . . . . . . . . . . . . . . . . . . . . . 386
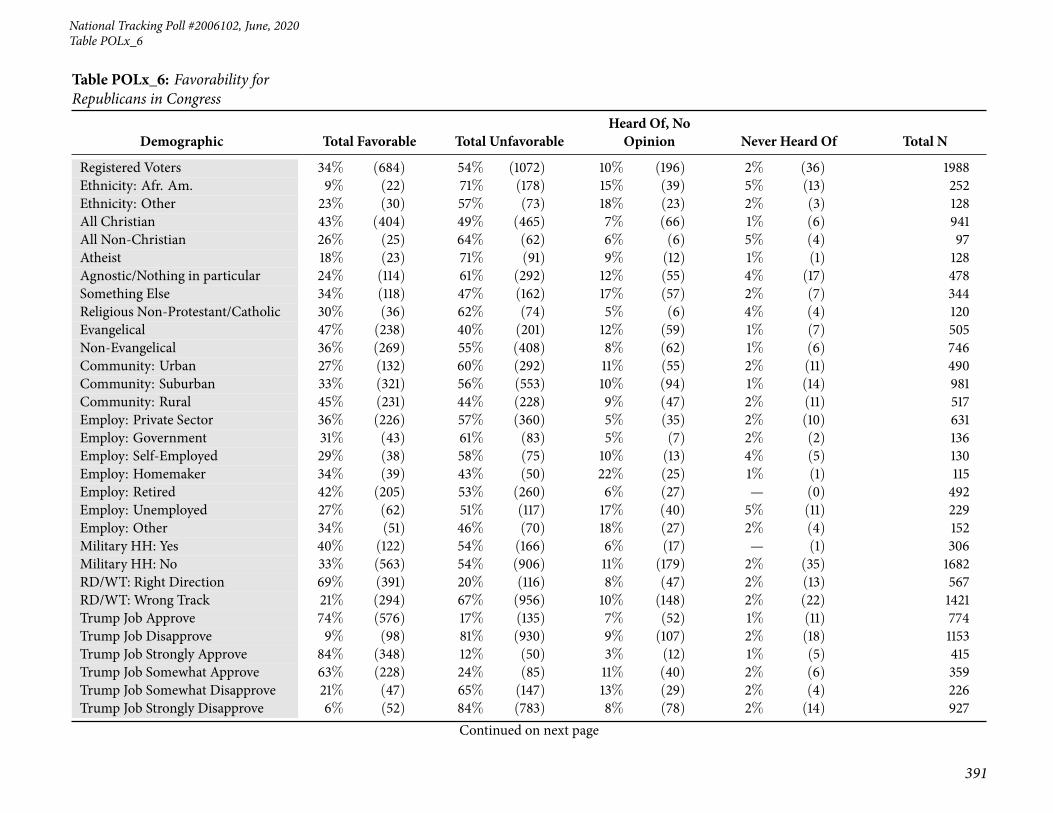
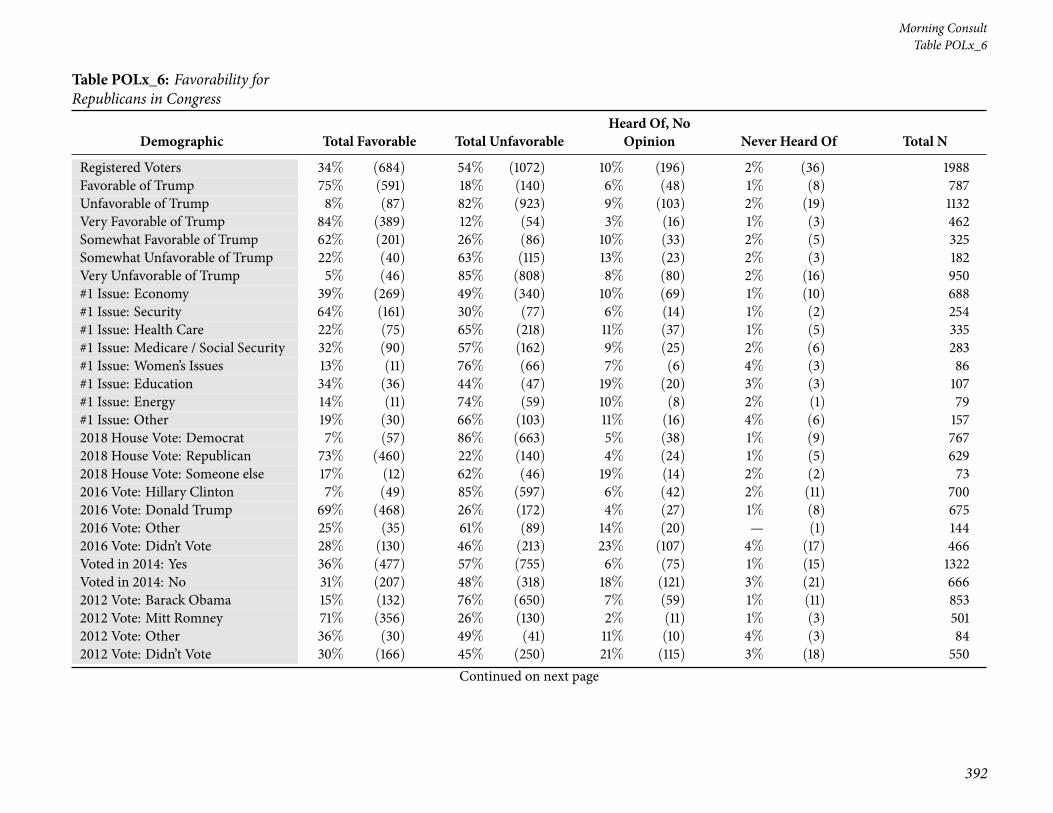
97 Table POLx_6: Favorability for Republicans in Congress . . . . . . . . . . . . . . . . . . . . . . . . . 390
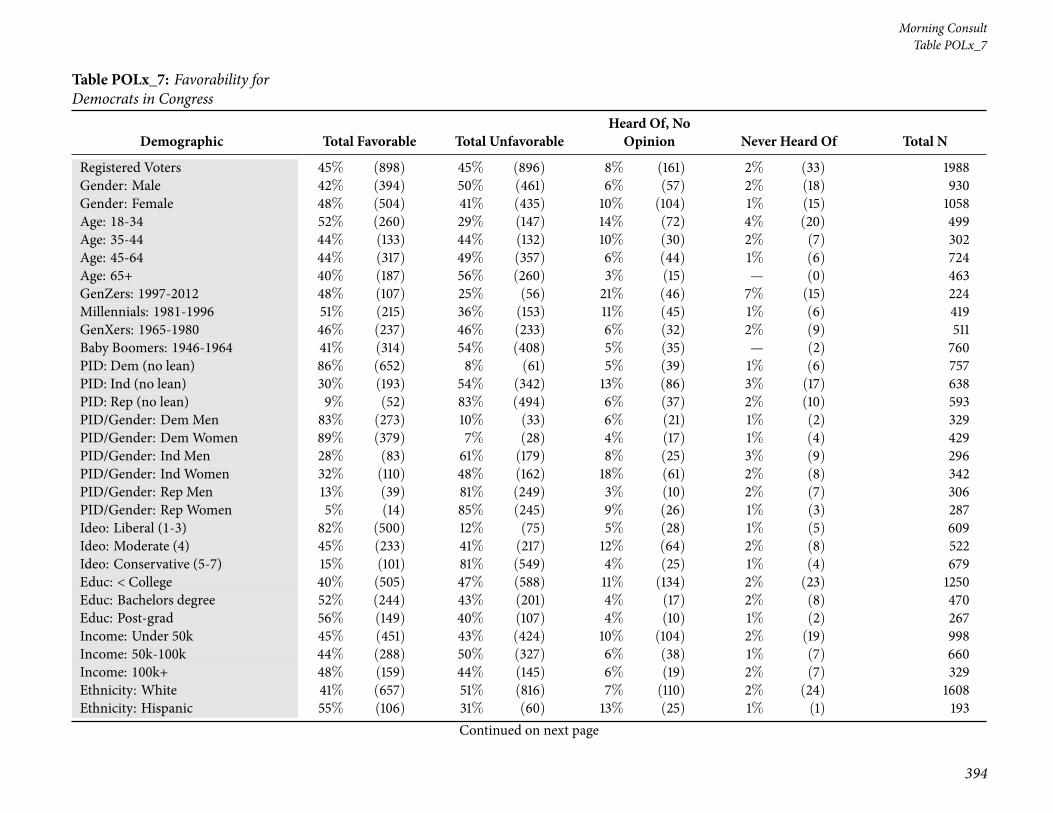
98 Table POLx_7: Favorability for Democrats in Congress . . . . . . . . . . . . . . . . . . . . . . . . . 394
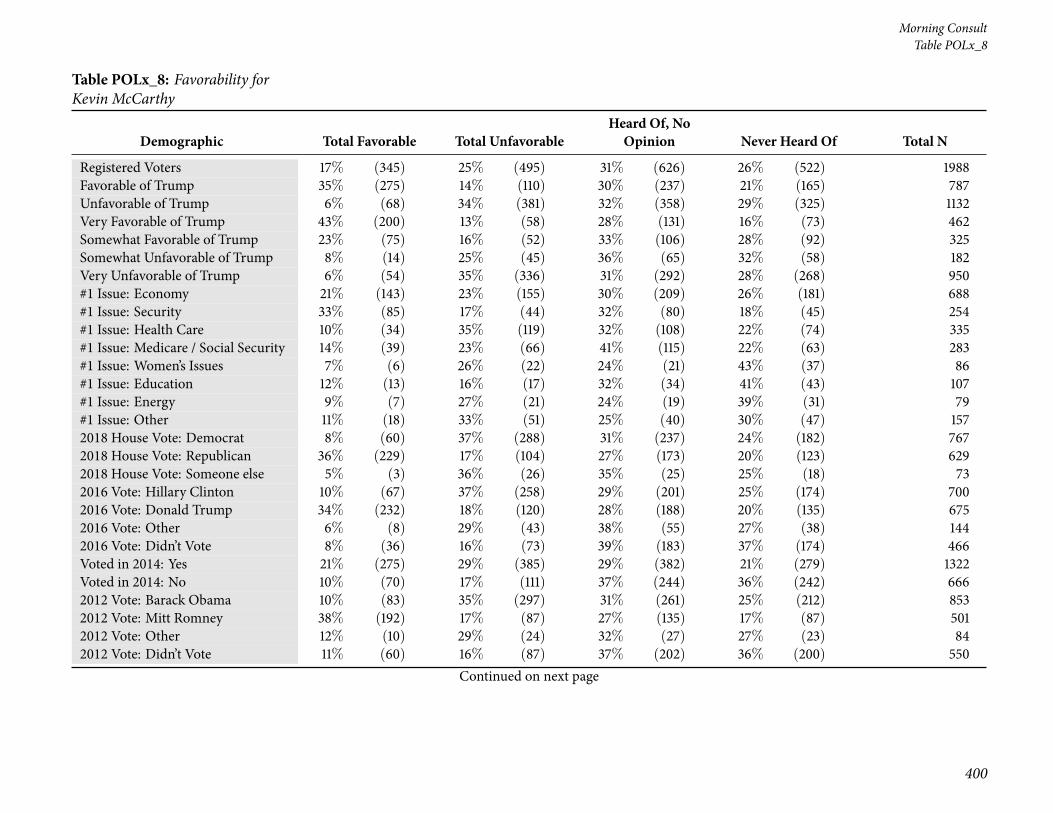
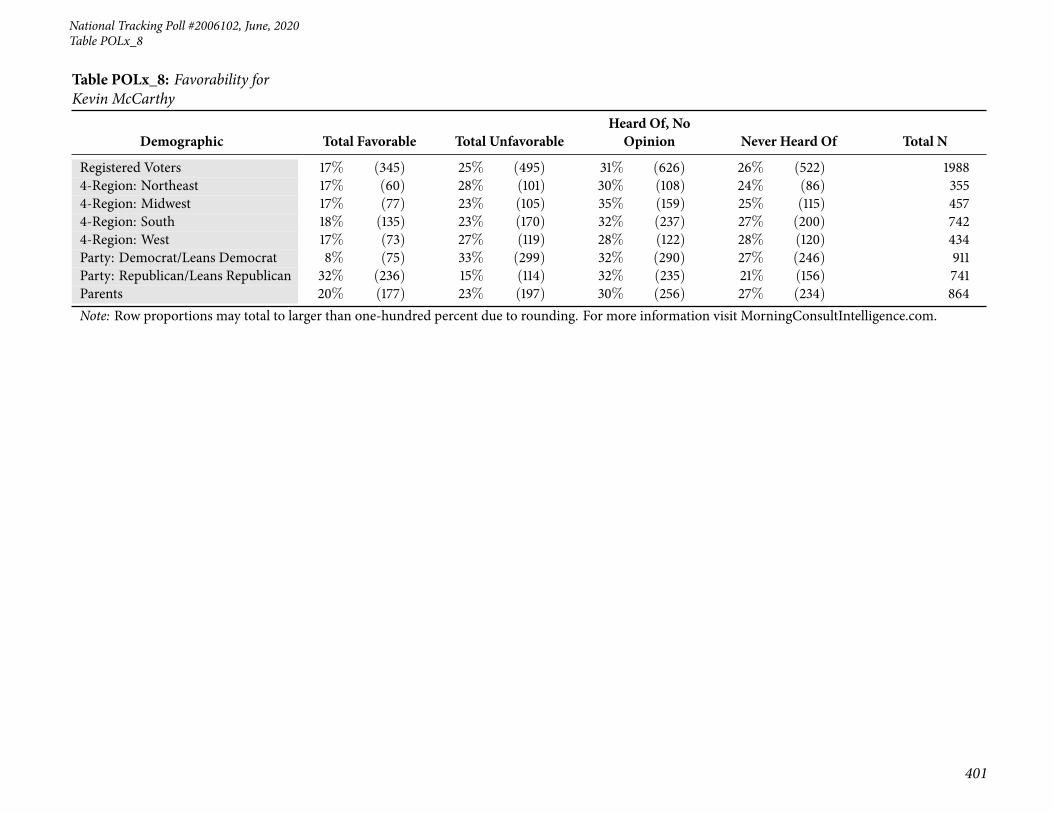
99 Table POLx_8: Favorability for Kevin McCarthy . . . . . . . . . . . . . . . . . . . . . . . . . . . . . 398
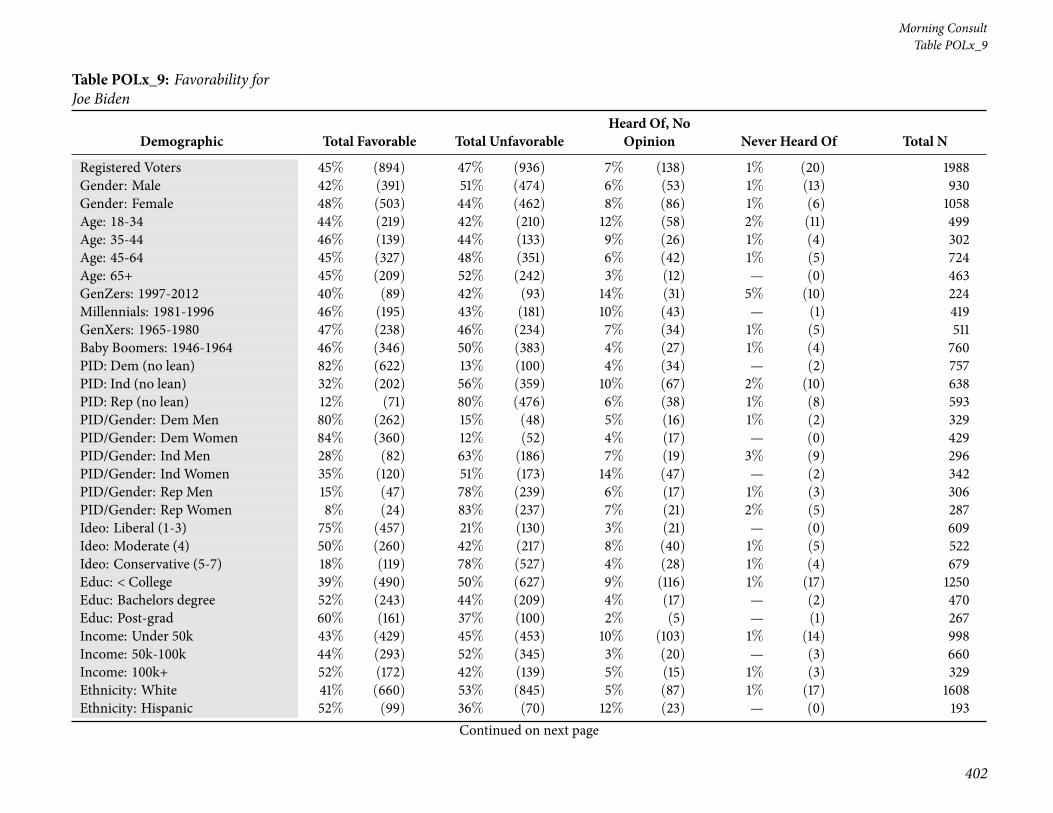
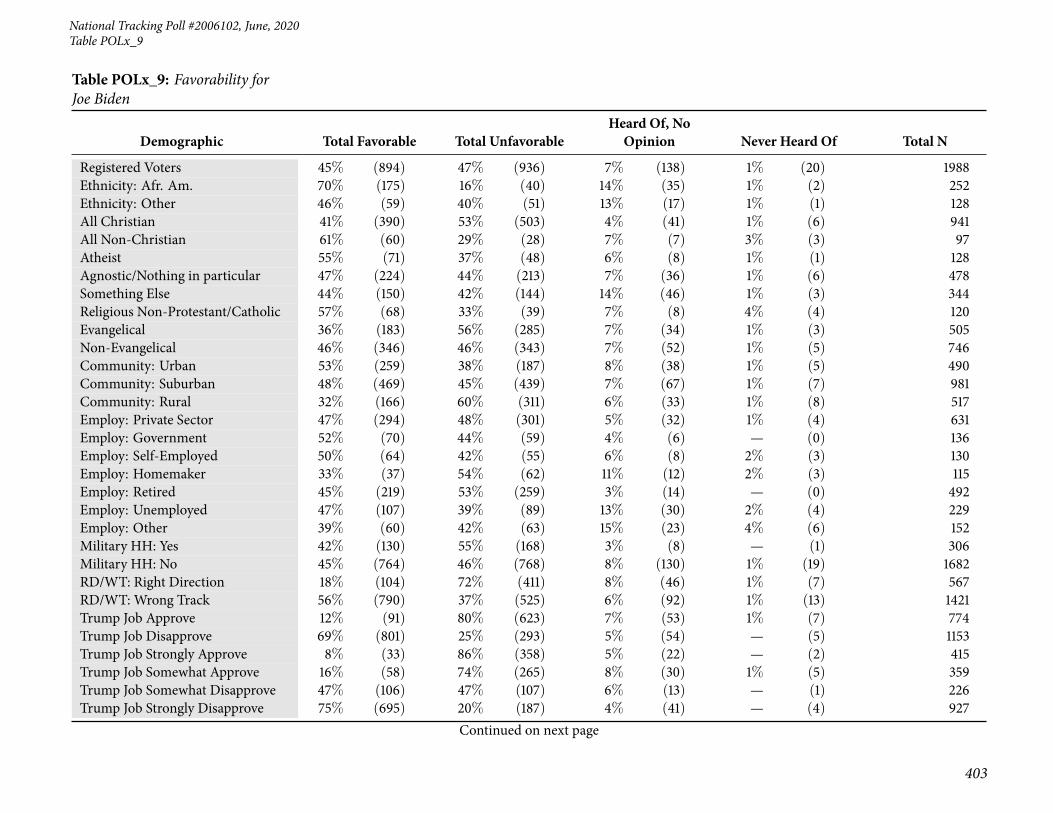
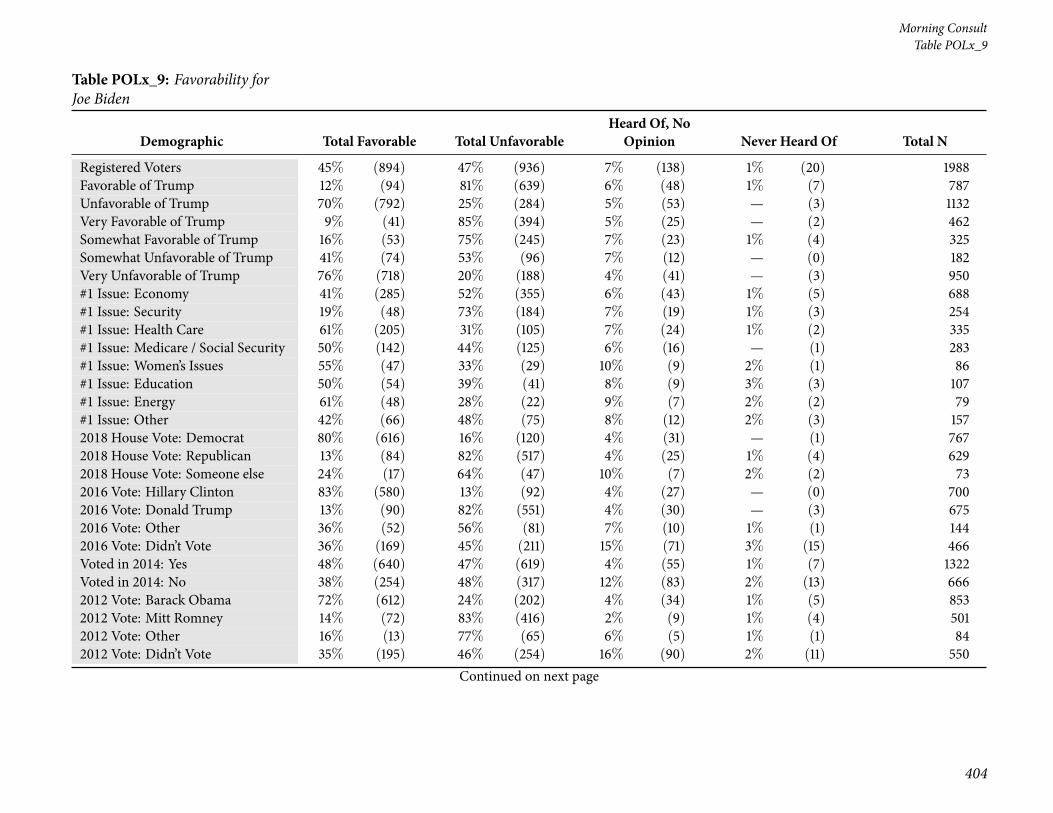
100 Table POLx_9: Favorability for Joe Biden . . . . . . . . . . . . . . . . . . . . . . . . . . . . . . . . 402
7
Page 8
Morning Consult
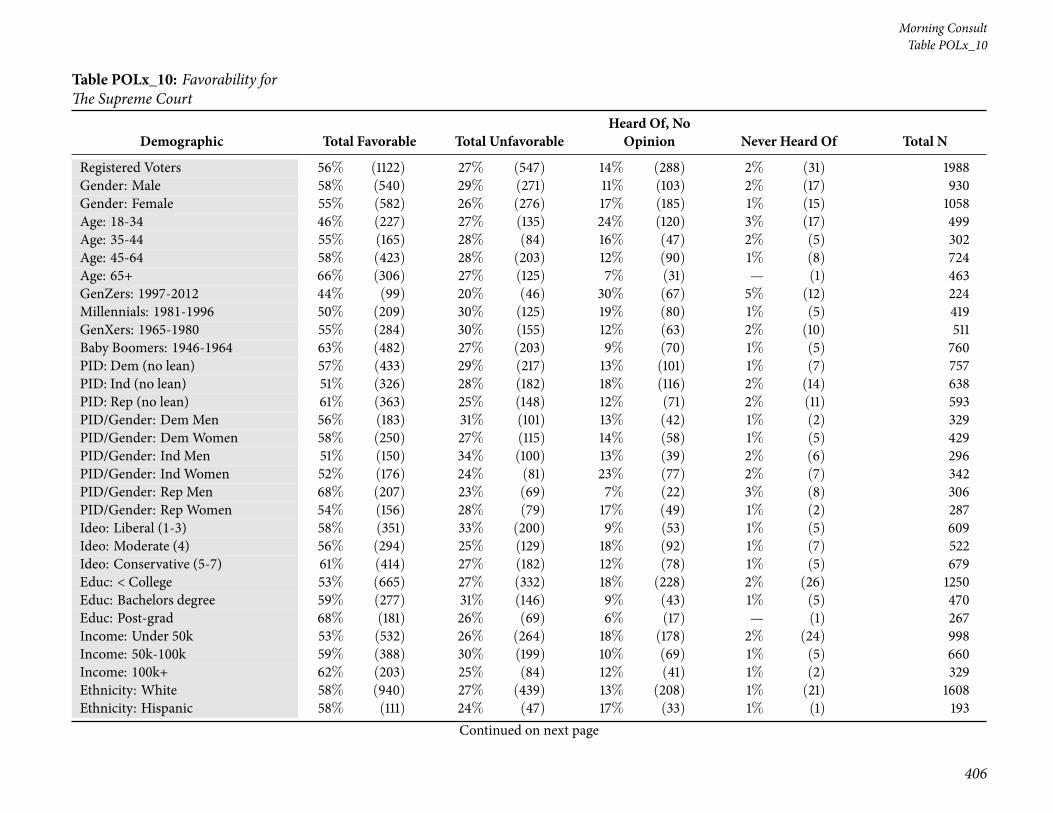
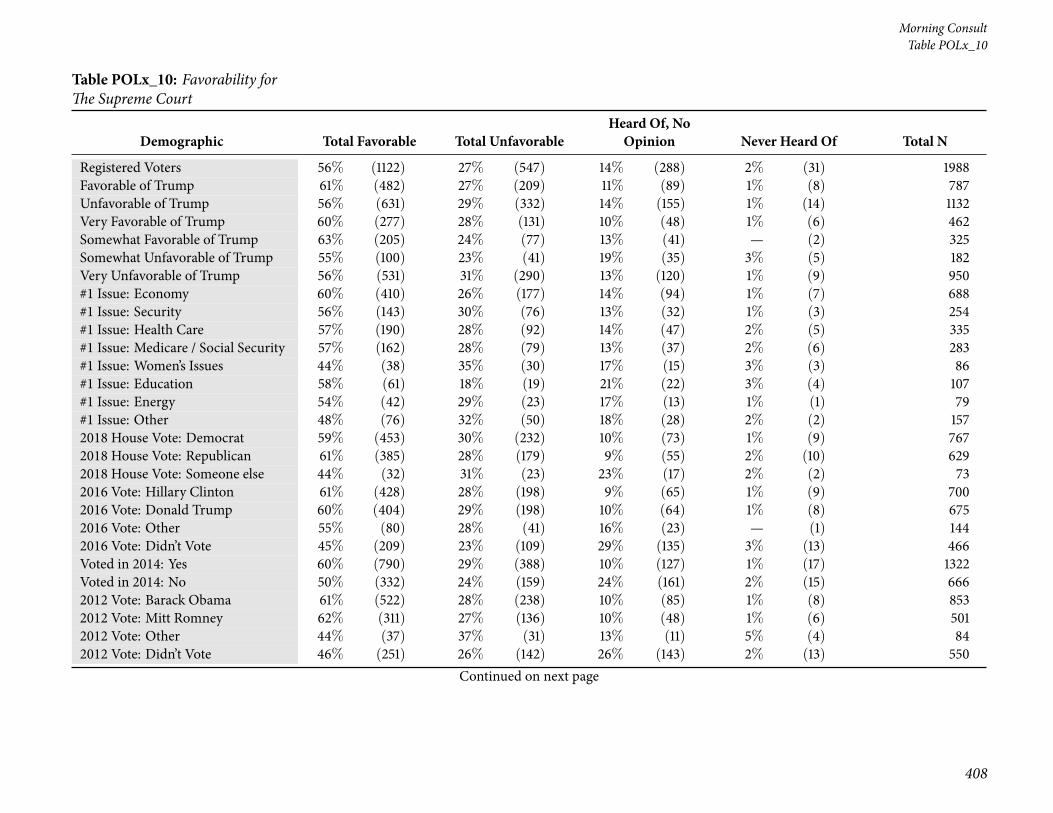
101 Table POLx_10: Favorability for The Supreme Court . . . . . . . . . . . . . . . . . . . . . . . . . . 406
102 Table POLx_11: Favorability for John Roberts . . . . . . . . . . . . . . . . . . . . . . . . . . . . . . 410
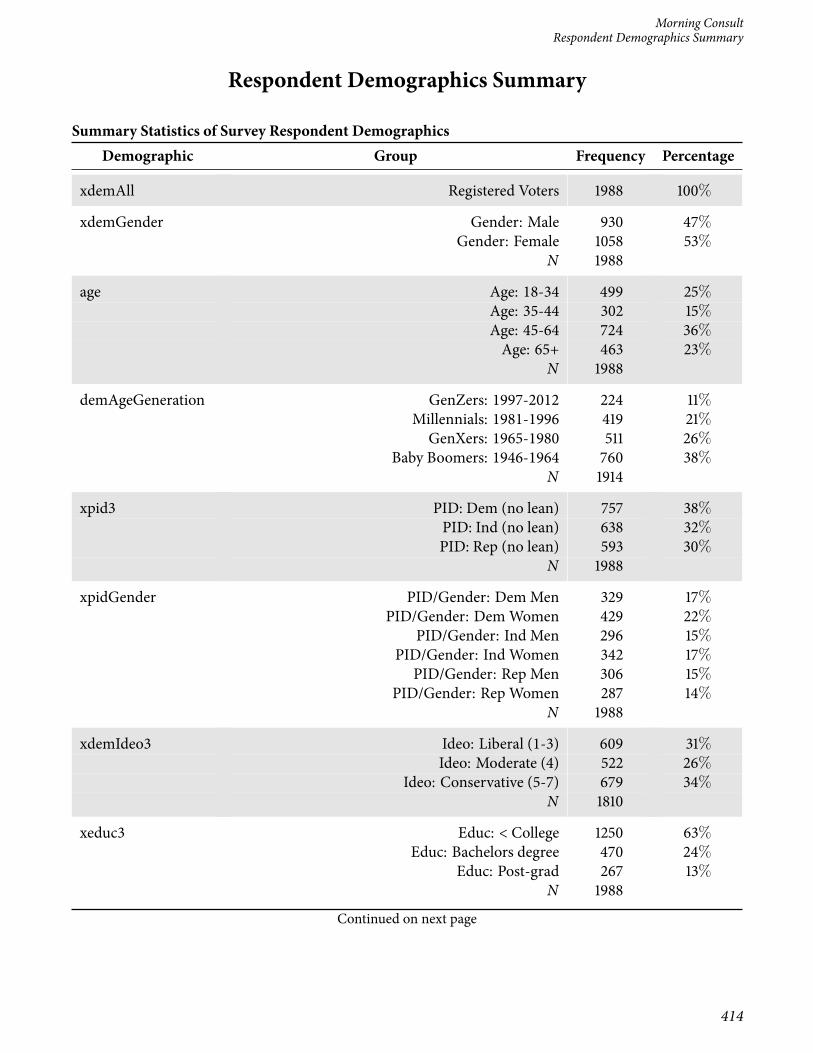
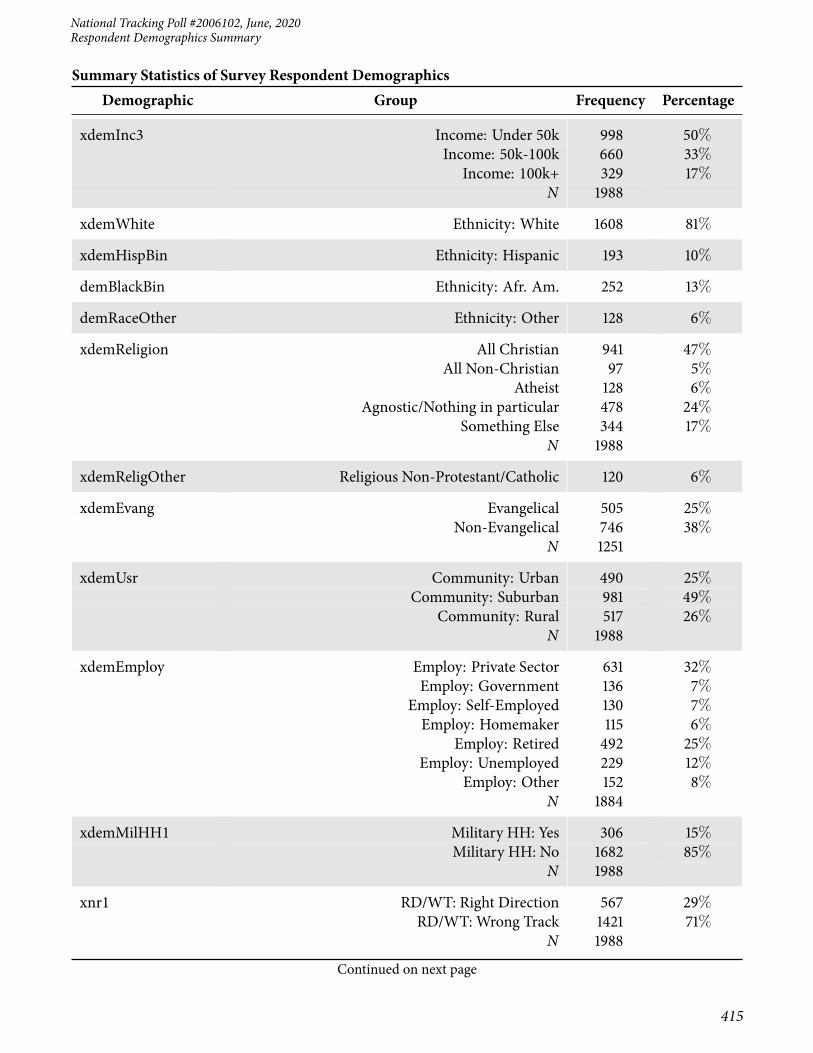
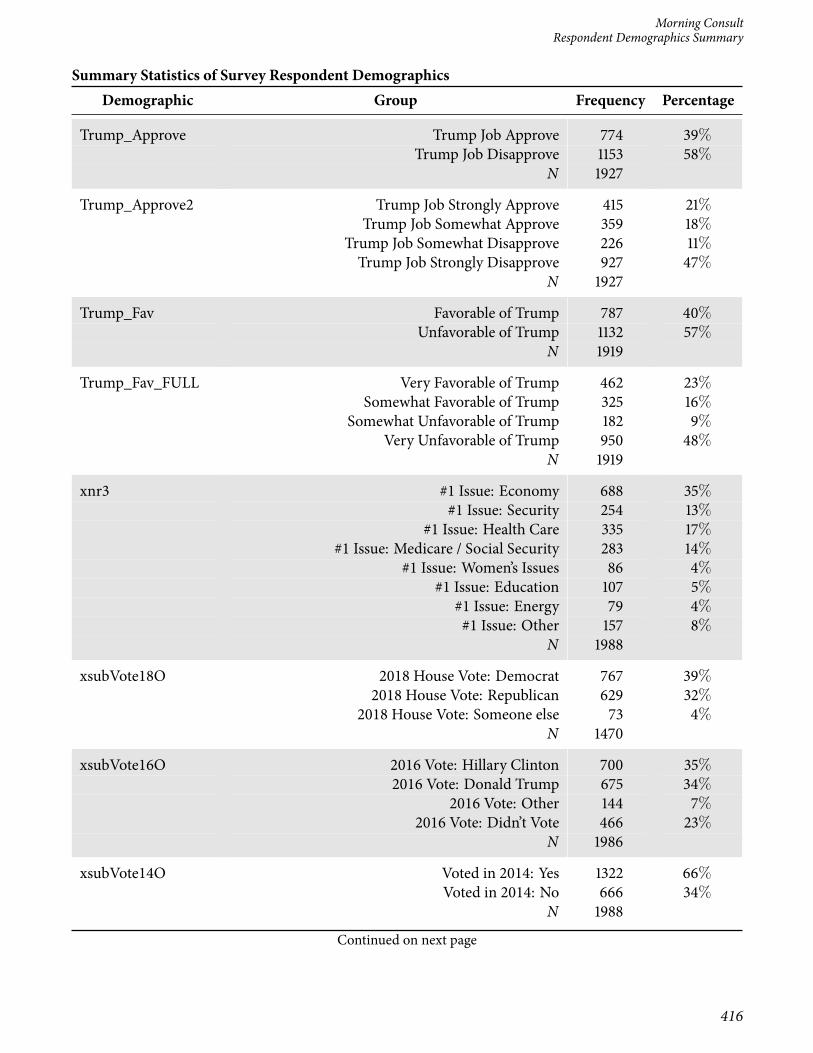
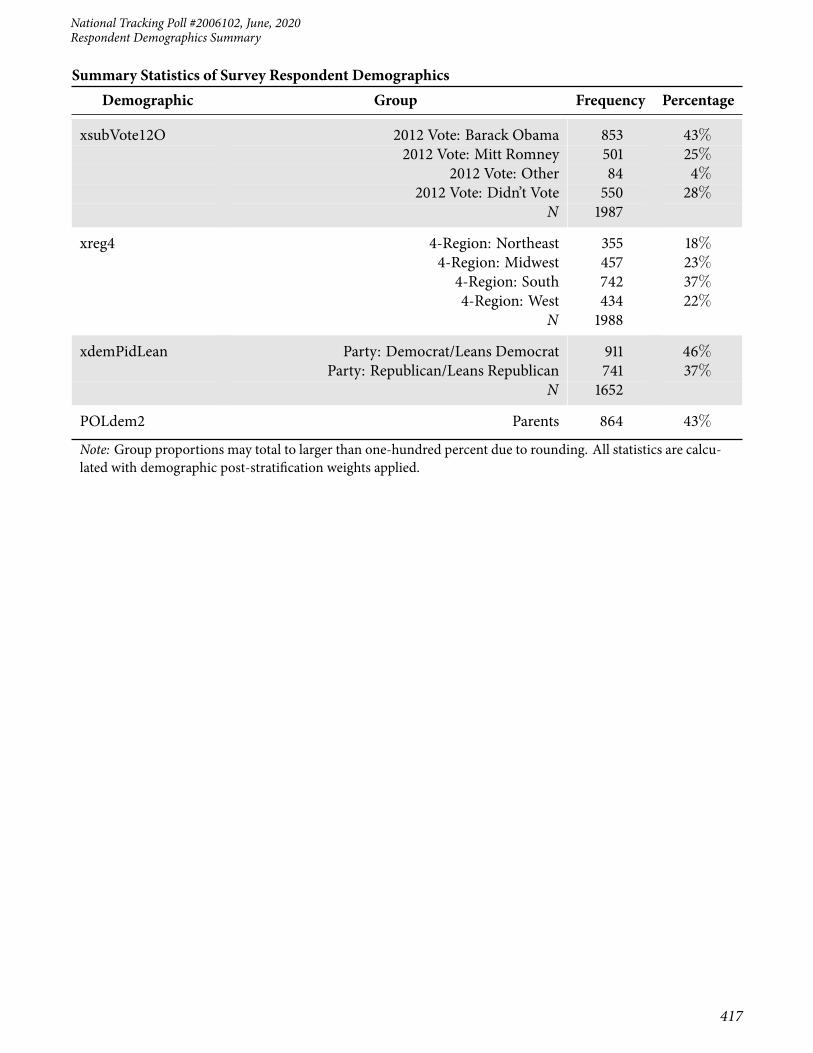
103 Summary Statistics of Survey Respondent Demographics . . . . . . . . . . . . . . . . . . . . . . 414
8
Page 9
National Tracking Poll #2006102, June, 2020
9
Table P1
Crosstabulation Results by Respondent Demographics
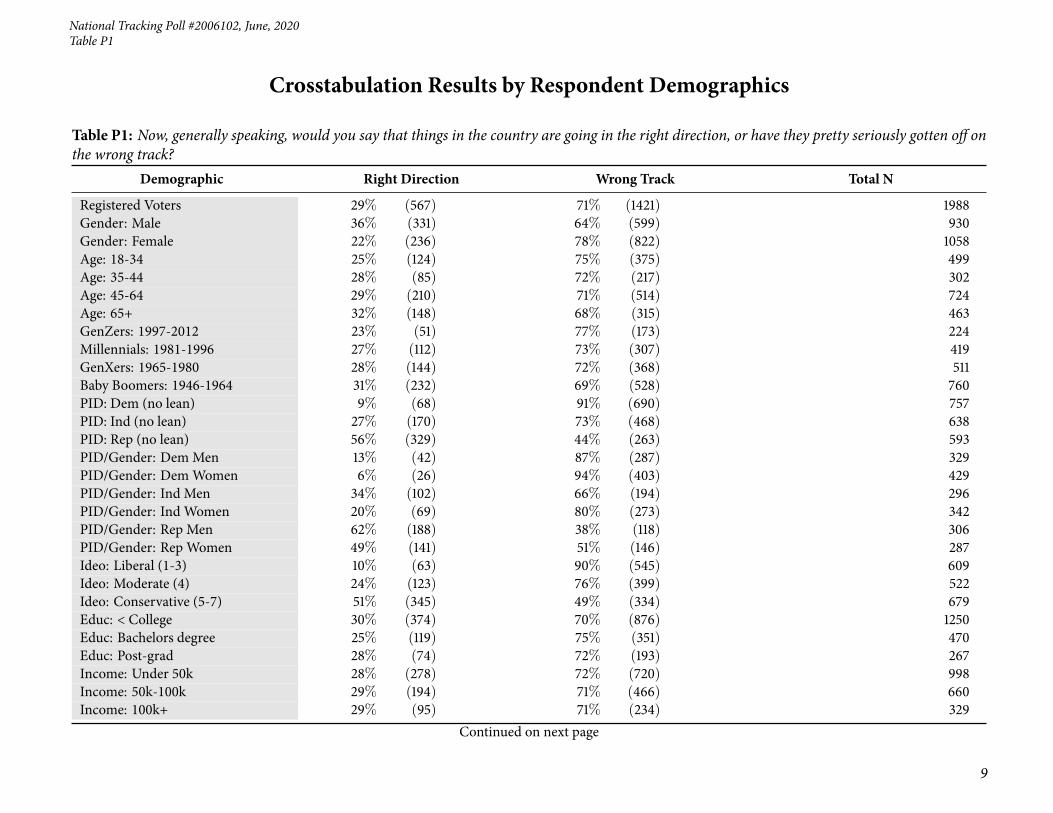
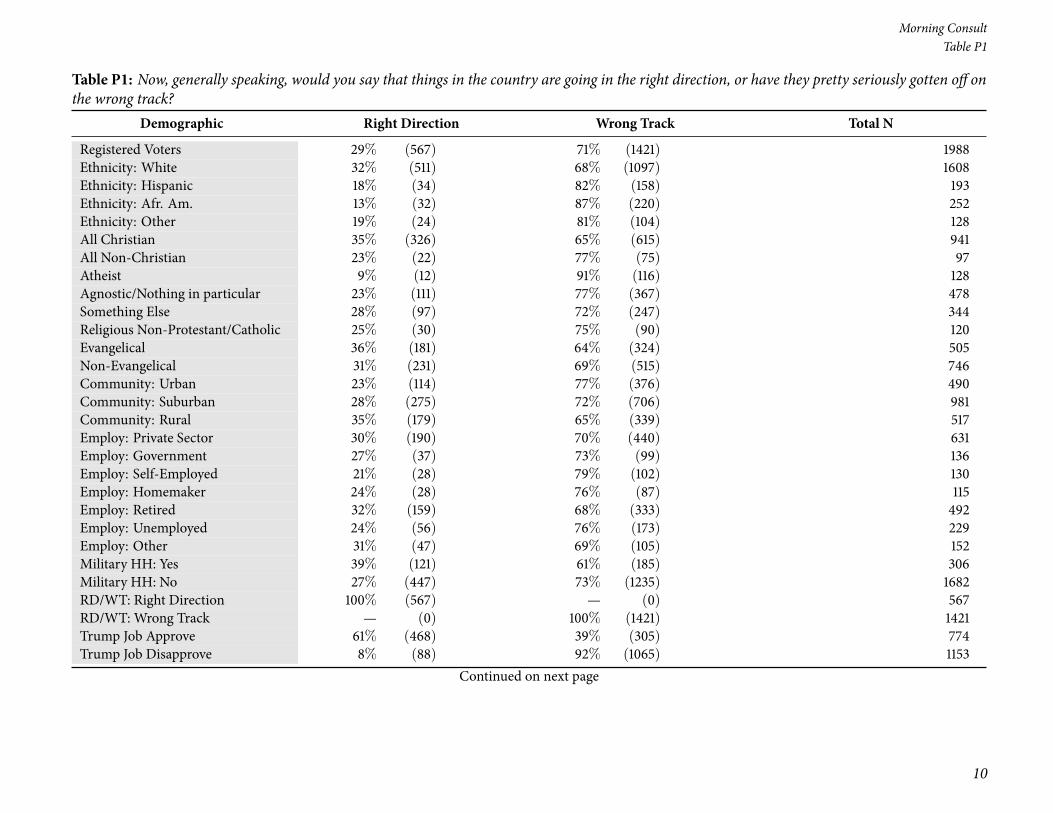
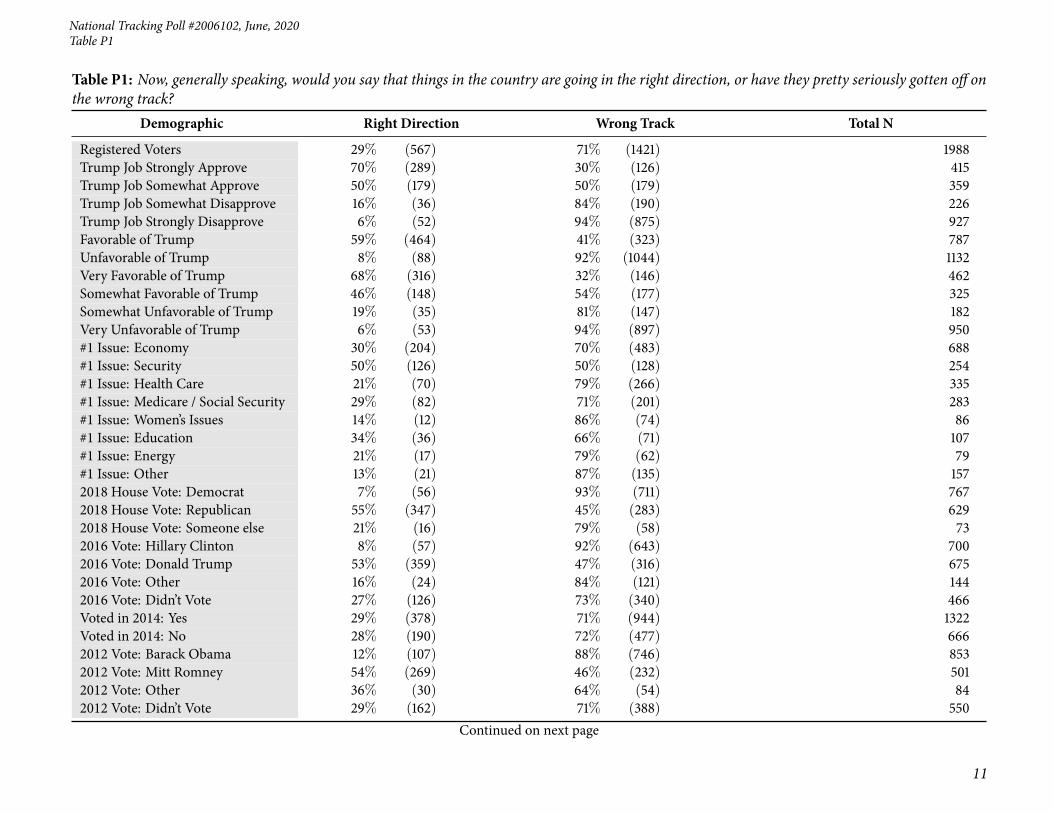
Table P1: Now, generally speaking, would you say that things in the country are going in the right direction, or have they pretty seriously gotten off onthe wrong track?
Demographic Right Direction Wrong Track Total N
Registered Voters 29% (567) 71% (1421) 1988Gender: Male 36% (331) 64% (599) 930Gender: Female 22% (236) 78% (822) 1058Age: 18-34 25% (124) 75% (375) 499Age: 35-44 28% (85) 72% (217) 302Age: 45-64 29% (210) 71% (514) 724Age: 65+ 32% (148) 68% (315) 463GenZers: 1997-2012 23% (51) 77% (173) 224Millennials: 1981-1996 27% (112) 73% (307) 419GenXers: 1965-1980 28% (144) 72% (368) 511Baby Boomers: 1946-1964 31% (232) 69% (528) 760PID: Dem (no lean) 9% (68) 91% (690) 757PID: Ind (no lean) 27% (170) 73% (468) 638PID: Rep (no lean) 56% (329) 44% (263) 593PID/Gender: DemMen 13% (42) 87% (287) 329PID/Gender: DemWomen 6% (26) 94% (403) 429PID/Gender: Ind Men 34% (102) 66% (194) 296PID/Gender: Ind Women 20% (69) 80% (273) 342PID/Gender: Rep Men 62% (188) 38% (118) 306PID/Gender: Rep Women 49% (141) 51% (146) 287Ideo: Liberal (1-3) 10% (63) 90% (545) 609Ideo: Moderate (4) 24% (123) 76% (399) 522Ideo: Conservative (5-7) 51% (345) 49% (334) 679Educ: < College 30% (374) 70% (876) 1250Educ: Bachelors degree 25% (119) 75% (351) 470Educ: Post-grad 28% (74) 72% (193) 267Income: Under 50k 28% (278) 72% (720) 998Income: 50k-100k 29% (194) 71% (466) 660Income: 100k+ 29% (95) 71% (234) 329
Continued on next page
Page 10
10
Morning ConsultTable P1
Table P1: Now, generally speaking, would you say that things in the country are going in the right direction, or have they pretty seriously gotten off onthe wrong track?
Demographic Right Direction Wrong Track Total N
Registered Voters 29% (567) 71% (1421) 1988Ethnicity: White 32% (511) 68% (1097) 1608Ethnicity: Hispanic 18% (34) 82% (158) 193Ethnicity: Afr. Am. 13% (32) 87% (220) 252Ethnicity: Other 19% (24) 81% (104) 128All Christian 35% (326) 65% (615) 941All Non-Christian 23% (22) 77% (75) 97Atheist 9% (12) 91% (116) 128Agnostic/Nothing in particular 23% (111) 77% (367) 478Something Else 28% (97) 72% (247) 344Religious Non-Protestant/Catholic 25% (30) 75% (90) 120Evangelical 36% (181) 64% (324) 505Non-Evangelical 31% (231) 69% (515) 746Community: Urban 23% (114) 77% (376) 490Community: Suburban 28% (275) 72% (706) 981Community: Rural 35% (179) 65% (339) 517Employ: Private Sector 30% (190) 70% (440) 631Employ: Government 27% (37) 73% (99) 136Employ: Self-Employed 21% (28) 79% (102) 130Employ: Homemaker 24% (28) 76% (87) 115Employ: Retired 32% (159) 68% (333) 492Employ: Unemployed 24% (56) 76% (173) 229Employ: Other 31% (47) 69% (105) 152Military HH: Yes 39% (121) 61% (185) 306Military HH: No 27% (447) 73% (1235) 1682RD/WT: Right Direction 100% (567) — (0) 567RD/WT: Wrong Track — (0) 100% (1421) 1421Trump Job Approve 61% (468) 39% (305) 774Trump Job Disapprove 8% (88) 92% (1065) 1153
Continued on next page
Page 11
National Tracking Poll #2006102, June, 2020
11
Table P1
Table P1: Now, generally speaking, would you say that things in the country are going in the right direction, or have they pretty seriously gotten off onthe wrong track?
Demographic Right Direction Wrong Track Total N
Registered Voters 29% (567) 71% (1421) 1988Trump Job Strongly Approve 70% (289) 30% (126) 415Trump Job Somewhat Approve 50% (179) 50% (179) 359Trump Job Somewhat Disapprove 16% (36) 84% (190) 226Trump Job Strongly Disapprove 6% (52) 94% (875) 927Favorable of Trump 59% (464) 41% (323) 787Unfavorable of Trump 8% (88) 92% (1044) 1132Very Favorable of Trump 68% (316) 32% (146) 462Somewhat Favorable of Trump 46% (148) 54% (177) 325Somewhat Unfavorable of Trump 19% (35) 81% (147) 182Very Unfavorable of Trump 6% (53) 94% (897) 950#1 Issue: Economy 30% (204) 70% (483) 688#1 Issue: Security 50% (126) 50% (128) 254#1 Issue: Health Care 21% (70) 79% (266) 335#1 Issue: Medicare / Social Security 29% (82) 71% (201) 283#1 Issue: Women’s Issues 14% (12) 86% (74) 86#1 Issue: Education 34% (36) 66% (71) 107#1 Issue: Energy 21% (17) 79% (62) 79#1 Issue: Other 13% (21) 87% (135) 1572018 House Vote: Democrat 7% (56) 93% (711) 7672018 House Vote: Republican 55% (347) 45% (283) 6292018 House Vote: Someone else 21% (16) 79% (58) 732016 Vote: Hillary Clinton 8% (57) 92% (643) 7002016 Vote: Donald Trump 53% (359) 47% (316) 6752016 Vote: Other 16% (24) 84% (121) 1442016 Vote: Didn’t Vote 27% (126) 73% (340) 466Voted in 2014: Yes 29% (378) 71% (944) 1322Voted in 2014: No 28% (190) 72% (477) 6662012 Vote: Barack Obama 12% (107) 88% (746) 8532012 Vote: Mitt Romney 54% (269) 46% (232) 5012012 Vote: Other 36% (30) 64% (54) 842012 Vote: Didn’t Vote 29% (162) 71% (388) 550
Continued on next page
Page 12
12
Morning ConsultTable P1
Table P1: Now, generally speaking, would you say that things in the country are going in the right direction, or have they pretty seriously gotten off onthe wrong track?
Demographic Right Direction Wrong Track Total N
Registered Voters 29% (567) 71% (1421) 19884-Region: Northeast 29% (104) 71% (251) 3554-Region: Midwest 30% (137) 70% (320) 4574-Region: South 30% (220) 70% (522) 7424-Region: West 25% (107) 75% (328) 434Party: Democrat/Leans Democrat 9% (83) 91% (828) 911Party: Republican/Leans Republican 54% (401) 46% (340) 741Parents 33% (283) 67% (581) 864Note: Row proportions may total to larger than one-hundred percent due to rounding. For more information visit MorningConsultIntelligence.com.
Page 13
National Tracking Poll #2006102, June, 2020
13
Table Q172
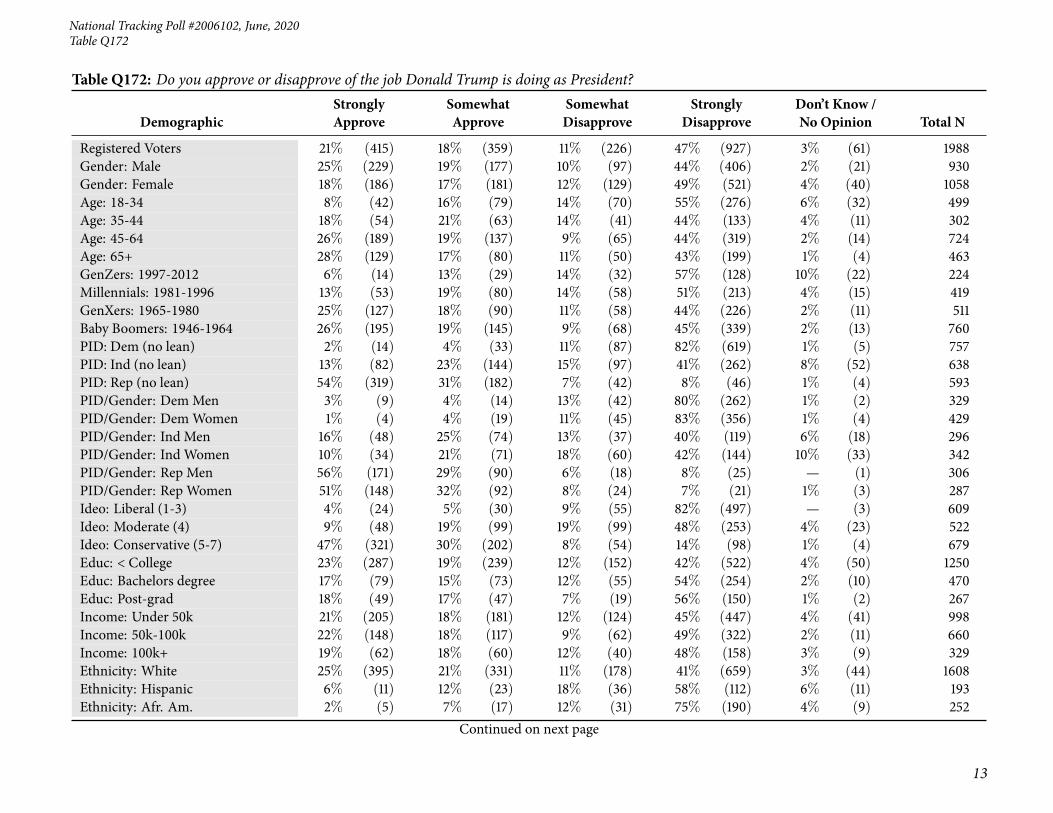
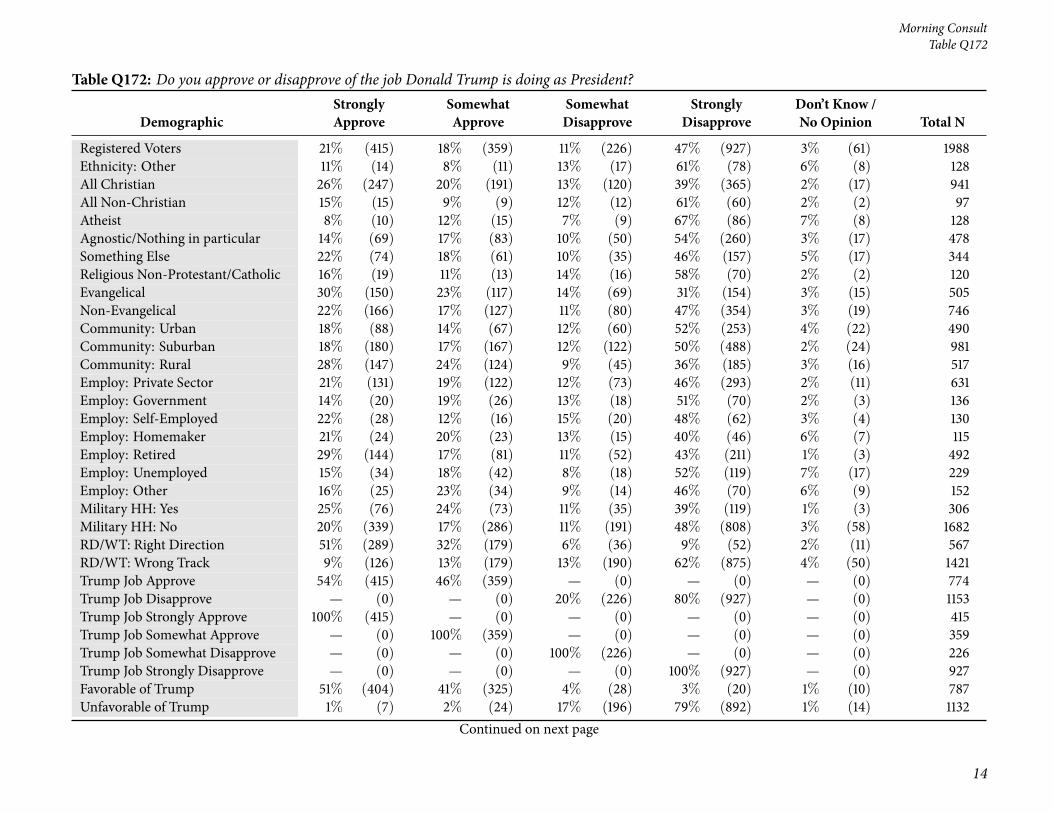
Table Q172: Do you approve or disapprove of the job Donald Trump is doing as President?
DemographicStronglyApprove
SomewhatApprove
SomewhatDisapprove
StronglyDisapprove
Don’t Know /No Opinion Total N
Registered Voters 21% (415) 18% (359) 11% (226) 47% (927) 3% (61) 1988Gender: Male 25% (229) 19% (177) 10% (97) 44% (406) 2% (21) 930Gender: Female 18% (186) 17% (181) 12% (129) 49% (521) 4% (40) 1058Age: 18-34 8% (42) 16% (79) 14% (70) 55% (276) 6% (32) 499Age: 35-44 18% (54) 21% (63) 14% (41) 44% (133) 4% (11) 302Age: 45-64 26% (189) 19% (137) 9% (65) 44% (319) 2% (14) 724Age: 65+ 28% (129) 17% (80) 11% (50) 43% (199) 1% (4) 463GenZers: 1997-2012 6% (14) 13% (29) 14% (32) 57% (128) 10% (22) 224Millennials: 1981-1996 13% (53) 19% (80) 14% (58) 51% (213) 4% (15) 419GenXers: 1965-1980 25% (127) 18% (90) 11% (58) 44% (226) 2% (11) 511Baby Boomers: 1946-1964 26% (195) 19% (145) 9% (68) 45% (339) 2% (13) 760PID: Dem (no lean) 2% (14) 4% (33) 11% (87) 82% (619) 1% (5) 757PID: Ind (no lean) 13% (82) 23% (144) 15% (97) 41% (262) 8% (52) 638PID: Rep (no lean) 54% (319) 31% (182) 7% (42) 8% (46) 1% (4) 593PID/Gender: DemMen 3% (9) 4% (14) 13% (42) 80% (262) 1% (2) 329PID/Gender: DemWomen 1% (4) 4% (19) 11% (45) 83% (356) 1% (4) 429PID/Gender: Ind Men 16% (48) 25% (74) 13% (37) 40% (119) 6% (18) 296PID/Gender: Ind Women 10% (34) 21% (71) 18% (60) 42% (144) 10% (33) 342PID/Gender: Rep Men 56% (171) 29% (90) 6% (18) 8% (25) — (1) 306PID/Gender: Rep Women 51% (148) 32% (92) 8% (24) 7% (21) 1% (3) 287Ideo: Liberal (1-3) 4% (24) 5% (30) 9% (55) 82% (497) — (3) 609Ideo: Moderate (4) 9% (48) 19% (99) 19% (99) 48% (253) 4% (23) 522Ideo: Conservative (5-7) 47% (321) 30% (202) 8% (54) 14% (98) 1% (4) 679Educ: < College 23% (287) 19% (239) 12% (152) 42% (522) 4% (50) 1250Educ: Bachelors degree 17% (79) 15% (73) 12% (55) 54% (254) 2% (10) 470Educ: Post-grad 18% (49) 17% (47) 7% (19) 56% (150) 1% (2) 267Income: Under 50k 21% (205) 18% (181) 12% (124) 45% (447) 4% (41) 998Income: 50k-100k 22% (148) 18% (117) 9% (62) 49% (322) 2% (11) 660Income: 100k+ 19% (62) 18% (60) 12% (40) 48% (158) 3% (9) 329Ethnicity: White 25% (395) 21% (331) 11% (178) 41% (659) 3% (44) 1608Ethnicity: Hispanic 6% (11) 12% (23) 18% (36) 58% (112) 6% (11) 193Ethnicity: Afr. Am. 2% (5) 7% (17) 12% (31) 75% (190) 4% (9) 252
Continued on next page
Page 14
14
Morning ConsultTable Q172
Table Q172: Do you approve or disapprove of the job Donald Trump is doing as President?
DemographicStronglyApprove
SomewhatApprove
SomewhatDisapprove
StronglyDisapprove
Don’t Know /No Opinion Total N
Registered Voters 21% (415) 18% (359) 11% (226) 47% (927) 3% (61) 1988Ethnicity: Other 11% (14) 8% (11) 13% (17) 61% (78) 6% (8) 128All Christian 26% (247) 20% (191) 13% (120) 39% (365) 2% (17) 941All Non-Christian 15% (15) 9% (9) 12% (12) 61% (60) 2% (2) 97Atheist 8% (10) 12% (15) 7% (9) 67% (86) 7% (8) 128Agnostic/Nothing in particular 14% (69) 17% (83) 10% (50) 54% (260) 3% (17) 478Something Else 22% (74) 18% (61) 10% (35) 46% (157) 5% (17) 344Religious Non-Protestant/Catholic 16% (19) 11% (13) 14% (16) 58% (70) 2% (2) 120Evangelical 30% (150) 23% (117) 14% (69) 31% (154) 3% (15) 505Non-Evangelical 22% (166) 17% (127) 11% (80) 47% (354) 3% (19) 746Community: Urban 18% (88) 14% (67) 12% (60) 52% (253) 4% (22) 490Community: Suburban 18% (180) 17% (167) 12% (122) 50% (488) 2% (24) 981Community: Rural 28% (147) 24% (124) 9% (45) 36% (185) 3% (16) 517Employ: Private Sector 21% (131) 19% (122) 12% (73) 46% (293) 2% (11) 631Employ: Government 14% (20) 19% (26) 13% (18) 51% (70) 2% (3) 136Employ: Self-Employed 22% (28) 12% (16) 15% (20) 48% (62) 3% (4) 130Employ: Homemaker 21% (24) 20% (23) 13% (15) 40% (46) 6% (7) 115Employ: Retired 29% (144) 17% (81) 11% (52) 43% (211) 1% (3) 492Employ: Unemployed 15% (34) 18% (42) 8% (18) 52% (119) 7% (17) 229Employ: Other 16% (25) 23% (34) 9% (14) 46% (70) 6% (9) 152Military HH: Yes 25% (76) 24% (73) 11% (35) 39% (119) 1% (3) 306Military HH: No 20% (339) 17% (286) 11% (191) 48% (808) 3% (58) 1682RD/WT: Right Direction 51% (289) 32% (179) 6% (36) 9% (52) 2% (11) 567RD/WT: Wrong Track 9% (126) 13% (179) 13% (190) 62% (875) 4% (50) 1421Trump Job Approve 54% (415) 46% (359) — (0) — (0) — (0) 774Trump Job Disapprove — (0) — (0) 20% (226) 80% (927) — (0) 1153Trump Job Strongly Approve 100% (415) — (0) — (0) — (0) — (0) 415Trump Job Somewhat Approve — (0) 100% (359) — (0) — (0) — (0) 359Trump Job Somewhat Disapprove — (0) — (0) 100% (226) — (0) — (0) 226Trump Job Strongly Disapprove — (0) — (0) — (0) 100% (927) — (0) 927Favorable of Trump 51% (404) 41% (325) 4% (28) 3% (20) 1% (10) 787Unfavorable of Trump 1% (7) 2% (24) 17% (196) 79% (892) 1% (14) 1132
Continued on next page
Page 15
National Tracking Poll #2006102, June, 2020
15
Table Q172
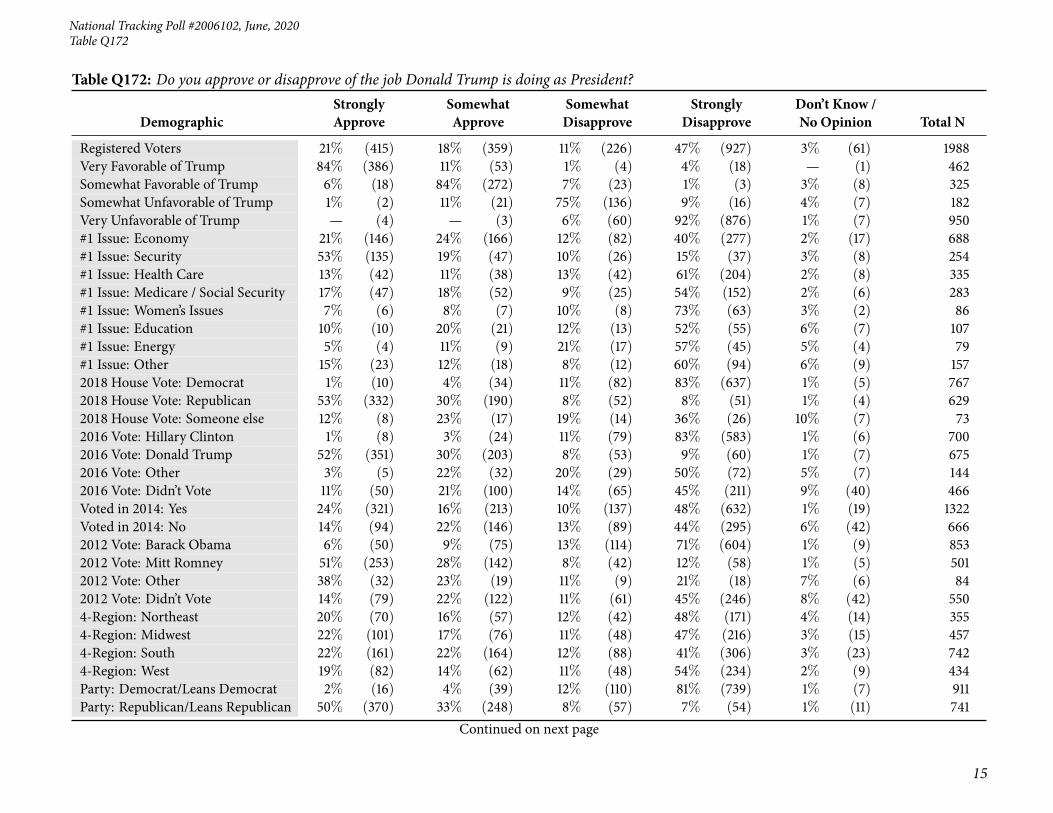
Table Q172: Do you approve or disapprove of the job Donald Trump is doing as President?
DemographicStronglyApprove
SomewhatApprove
SomewhatDisapprove
StronglyDisapprove
Don’t Know /No Opinion Total N
Registered Voters 21% (415) 18% (359) 11% (226) 47% (927) 3% (61) 1988Very Favorable of Trump 84% (386) 11% (53) 1% (4) 4% (18) — (1) 462Somewhat Favorable of Trump 6% (18) 84% (272) 7% (23) 1% (3) 3% (8) 325Somewhat Unfavorable of Trump 1% (2) 11% (21) 75% (136) 9% (16) 4% (7) 182Very Unfavorable of Trump — (4) — (3) 6% (60) 92% (876) 1% (7) 950#1 Issue: Economy 21% (146) 24% (166) 12% (82) 40% (277) 2% (17) 688#1 Issue: Security 53% (135) 19% (47) 10% (26) 15% (37) 3% (8) 254#1 Issue: Health Care 13% (42) 11% (38) 13% (42) 61% (204) 2% (8) 335#1 Issue: Medicare / Social Security 17% (47) 18% (52) 9% (25) 54% (152) 2% (6) 283#1 Issue: Women’s Issues 7% (6) 8% (7) 10% (8) 73% (63) 3% (2) 86#1 Issue: Education 10% (10) 20% (21) 12% (13) 52% (55) 6% (7) 107#1 Issue: Energy 5% (4) 11% (9) 21% (17) 57% (45) 5% (4) 79#1 Issue: Other 15% (23) 12% (18) 8% (12) 60% (94) 6% (9) 1572018 House Vote: Democrat 1% (10) 4% (34) 11% (82) 83% (637) 1% (5) 7672018 House Vote: Republican 53% (332) 30% (190) 8% (52) 8% (51) 1% (4) 6292018 House Vote: Someone else 12% (8) 23% (17) 19% (14) 36% (26) 10% (7) 732016 Vote: Hillary Clinton 1% (8) 3% (24) 11% (79) 83% (583) 1% (6) 7002016 Vote: Donald Trump 52% (351) 30% (203) 8% (53) 9% (60) 1% (7) 6752016 Vote: Other 3% (5) 22% (32) 20% (29) 50% (72) 5% (7) 1442016 Vote: Didn’t Vote 11% (50) 21% (100) 14% (65) 45% (211) 9% (40) 466Voted in 2014: Yes 24% (321) 16% (213) 10% (137) 48% (632) 1% (19) 1322Voted in 2014: No 14% (94) 22% (146) 13% (89) 44% (295) 6% (42) 6662012 Vote: Barack Obama 6% (50) 9% (75) 13% (114) 71% (604) 1% (9) 8532012 Vote: Mitt Romney 51% (253) 28% (142) 8% (42) 12% (58) 1% (5) 5012012 Vote: Other 38% (32) 23% (19) 11% (9) 21% (18) 7% (6) 842012 Vote: Didn’t Vote 14% (79) 22% (122) 11% (61) 45% (246) 8% (42) 5504-Region: Northeast 20% (70) 16% (57) 12% (42) 48% (171) 4% (14) 3554-Region: Midwest 22% (101) 17% (76) 11% (48) 47% (216) 3% (15) 4574-Region: South 22% (161) 22% (164) 12% (88) 41% (306) 3% (23) 7424-Region: West 19% (82) 14% (62) 11% (48) 54% (234) 2% (9) 434Party: Democrat/Leans Democrat 2% (16) 4% (39) 12% (110) 81% (739) 1% (7) 911Party: Republican/Leans Republican 50% (370) 33% (248) 8% (57) 7% (54) 1% (11) 741
Continued on next page
Page 16
16
Morning ConsultTable Q172
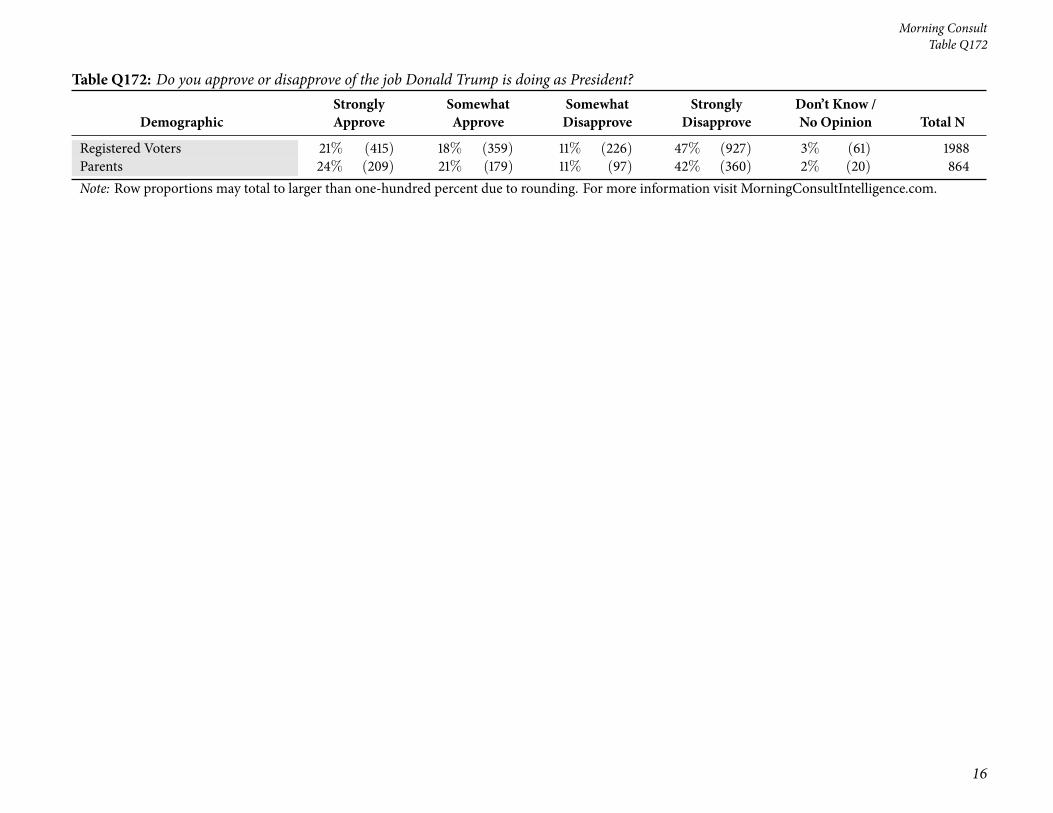
Table Q172: Do you approve or disapprove of the job Donald Trump is doing as President?
DemographicStronglyApprove
SomewhatApprove
SomewhatDisapprove
StronglyDisapprove
Don’t Know /No Opinion Total N
Registered Voters 21% (415) 18% (359) 11% (226) 47% (927) 3% (61) 1988Parents 24% (209) 21% (179) 11% (97) 42% (360) 2% (20) 864Note: Row proportions may total to larger than one-hundred percent due to rounding. For more information visit MorningConsultIntelligence.com.
Page 17
National Tracking Poll #2006102, June, 2020
17
Table Q172NET
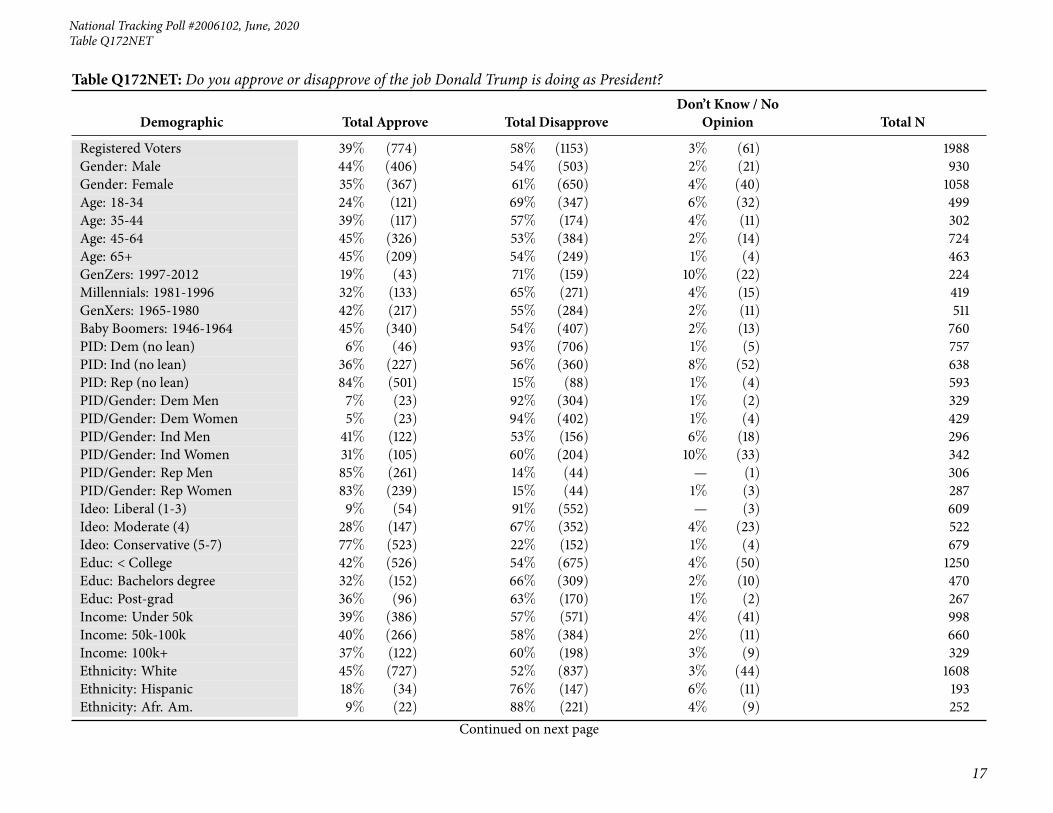
Table Q172NET: Do you approve or disapprove of the job Donald Trump is doing as President?
Demographic Total Approve Total DisapproveDon’t Know / No
Opinion Total N
Registered Voters 39% (774) 58% (1153) 3% (61) 1988Gender: Male 44% (406) 54% (503) 2% (21) 930Gender: Female 35% (367) 61% (650) 4% (40) 1058Age: 18-34 24% (121) 69% (347) 6% (32) 499Age: 35-44 39% (117) 57% (174) 4% (11) 302Age: 45-64 45% (326) 53% (384) 2% (14) 724Age: 65+ 45% (209) 54% (249) 1% (4) 463GenZers: 1997-2012 19% (43) 71% (159) 10% (22) 224Millennials: 1981-1996 32% (133) 65% (271) 4% (15) 419GenXers: 1965-1980 42% (217) 55% (284) 2% (11) 511Baby Boomers: 1946-1964 45% (340) 54% (407) 2% (13) 760PID: Dem (no lean) 6% (46) 93% (706) 1% (5) 757PID: Ind (no lean) 36% (227) 56% (360) 8% (52) 638PID: Rep (no lean) 84% (501) 15% (88) 1% (4) 593PID/Gender: DemMen 7% (23) 92% (304) 1% (2) 329PID/Gender: DemWomen 5% (23) 94% (402) 1% (4) 429PID/Gender: Ind Men 41% (122) 53% (156) 6% (18) 296PID/Gender: Ind Women 31% (105) 60% (204) 10% (33) 342PID/Gender: Rep Men 85% (261) 14% (44) — (1) 306PID/Gender: Rep Women 83% (239) 15% (44) 1% (3) 287Ideo: Liberal (1-3) 9% (54) 91% (552) — (3) 609Ideo: Moderate (4) 28% (147) 67% (352) 4% (23) 522Ideo: Conservative (5-7) 77% (523) 22% (152) 1% (4) 679Educ: < College 42% (526) 54% (675) 4% (50) 1250Educ: Bachelors degree 32% (152) 66% (309) 2% (10) 470Educ: Post-grad 36% (96) 63% (170) 1% (2) 267Income: Under 50k 39% (386) 57% (571) 4% (41) 998Income: 50k-100k 40% (266) 58% (384) 2% (11) 660Income: 100k+ 37% (122) 60% (198) 3% (9) 329Ethnicity: White 45% (727) 52% (837) 3% (44) 1608Ethnicity: Hispanic 18% (34) 76% (147) 6% (11) 193Ethnicity: Afr. Am. 9% (22) 88% (221) 4% (9) 252
Continued on next page
Page 18
18
Morning ConsultTable Q172NET
Table Q172NET: Do you approve or disapprove of the job Donald Trump is doing as President?
Demographic Total Approve Total DisapproveDon’t Know / No
Opinion Total N
Registered Voters 39% (774) 58% (1153) 3% (61) 1988Ethnicity: Other 20% (25) 74% (95) 6% (8) 128All Christian 47% (438) 52% (486) 2% (17) 941All Non-Christian 24% (24) 74% (72) 2% (2) 97Atheist 19% (25) 74% (95) 7% (8) 128Agnostic/Nothing in particular 32% (152) 65% (309) 3% (17) 478Something Else 39% (135) 56% (192) 5% (17) 344Religious Non-Protestant/Catholic 26% (32) 72% (86) 2% (2) 120Evangelical 53% (267) 44% (224) 3% (15) 505Non-Evangelical 39% (293) 58% (433) 3% (19) 746Community: Urban 32% (155) 64% (313) 4% (22) 490Community: Suburban 35% (347) 62% (610) 2% (24) 981Community: Rural 52% (271) 45% (230) 3% (16) 517Employ: Private Sector 40% (254) 58% (366) 2% (11) 631Employ: Government 33% (45) 65% (88) 2% (3) 136Employ: Self-Employed 34% (44) 63% (82) 3% (4) 130Employ: Homemaker 40% (46) 54% (62) 6% (7) 115Employ: Retired 46% (225) 54% (264) 1% (3) 492Employ: Unemployed 33% (76) 59% (136) 7% (17) 229Employ: Other 39% (59) 55% (84) 6% (9) 152Military HH: Yes 49% (149) 50% (154) 1% (3) 306Military HH: No 37% (624) 59% (999) 3% (58) 1682RD/WT: Right Direction 83% (468) 16% (88) 2% (11) 567RD/WT: Wrong Track 21% (305) 75% (1065) 4% (50) 1421Trump Job Approve 100% (774) — (0) — (0) 774Trump Job Disapprove — (0) 100% (1153) — (0) 1153Trump Job Strongly Approve 100% (415) — (0) — (0) 415Trump Job Somewhat Approve 100% (359) — (0) — (0) 359Trump Job Somewhat Disapprove — (0) 100% (226) — (0) 226Trump Job Strongly Disapprove — (0) 100% (927) — (0) 927Favorable of Trump 93% (729) 6% (48) 1% (10) 787Unfavorable of Trump 3% (30) 96% (1088) 1% (14) 1132
Continued on next page
Page 19
National Tracking Poll #2006102, June, 2020
19
Table Q172NET
Table Q172NET: Do you approve or disapprove of the job Donald Trump is doing as President?
Demographic Total Approve Total DisapproveDon’t Know / No
Opinion Total N
Registered Voters 39% (774) 58% (1153) 3% (61) 1988Very Favorable of Trump 95% (439) 5% (22) — (1) 462Somewhat Favorable of Trump 89% (291) 8% (26) 3% (8) 325Somewhat Unfavorable of Trump 13% (23) 83% (151) 4% (7) 182Very Unfavorable of Trump 1% (7) 99% (936) 1% (7) 950#1 Issue: Economy 45% (312) 52% (359) 2% (17) 688#1 Issue: Security 72% (182) 25% (63) 3% (8) 254#1 Issue: Health Care 24% (81) 74% (247) 2% (8) 335#1 Issue: Medicare / Social Security 35% (99) 63% (178) 2% (6) 283#1 Issue: Women’s Issues 15% (13) 82% (71) 3% (2) 86#1 Issue: Education 30% (32) 64% (68) 6% (7) 107#1 Issue: Energy 17% (13) 78% (62) 5% (4) 79#1 Issue: Other 26% (41) 68% (106) 6% (9) 1572018 House Vote: Democrat 6% (44) 94% (719) 1% (5) 7672018 House Vote: Republican 83% (522) 16% (103) 1% (4) 6292018 House Vote: Someone else 35% (26) 55% (40) 10% (7) 732016 Vote: Hillary Clinton 5% (32) 95% (662) 1% (6) 7002016 Vote: Donald Trump 82% (554) 17% (113) 1% (7) 6752016 Vote: Other 25% (37) 70% (100) 5% (7) 1442016 Vote: Didn’t Vote 32% (149) 59% (277) 9% (40) 466Voted in 2014: Yes 40% (534) 58% (769) 1% (19) 1322Voted in 2014: No 36% (240) 58% (385) 6% (42) 6662012 Vote: Barack Obama 15% (126) 84% (718) 1% (9) 8532012 Vote: Mitt Romney 79% (396) 20% (100) 1% (5) 5012012 Vote: Other 61% (51) 32% (27) 7% (6) 842012 Vote: Didn’t Vote 36% (201) 56% (307) 8% (42) 5504-Region: Northeast 36% (127) 60% (214) 4% (14) 3554-Region: Midwest 39% (177) 58% (264) 3% (15) 4574-Region: South 44% (325) 53% (394) 3% (23) 7424-Region: West 33% (144) 65% (282) 2% (9) 434Party: Democrat/Leans Democrat 6% (55) 93% (850) 1% (7) 911Party: Republican/Leans Republican 83% (618) 15% (111) 1% (11) 741
Continued on next page
Page 20
20
Morning ConsultTable Q172NET
Table Q172NET: Do you approve or disapprove of the job Donald Trump is doing as President?
Demographic Total Approve Total DisapproveDon’t Know / No
Opinion Total N
Registered Voters 39% (774) 58% (1153) 3% (61) 1988Parents 45% (387) 53% (457) 2% (20) 864Note: Row proportions may total to larger than one-hundred percent due to rounding. For more information visit MorningConsultIntelligence.com.
Page 21
National Tracking Poll #2006102, June, 2020
21
Table P3
Table P3: Now, thinking about your vote, what would you say is the top set of issues on your mind when you cast your vote for federal offices such asU.S. Senate or Congress?
Demographic
EconomicIssues –like taxes,wages,jobs,
unemploy-ment, andspending
SecurityIssues –like
terrorism,foreign
policy, andbordersecurity
HealthCare Issues– like the2010 healthcare law,Medicaid,other
challenges
SeniorsIssues –like
Medicareand SocialSecurity
Women’sIssues –like birthcontrol,abortion,and equal
pay
EducationIssues – like
schoolstandards,class sizes,
school choice,and student
loans
Energy Issues– like carbonemissions,cost ofelectric-
ity/gasoline,or renewables Other: Total N
Registered Voters 35%(688) 13%(254) 17%(335) 14%(283) 4% (86) 5%(107) 4% (79) 8%(157) 1988Gender: Male 39%(366) 12% (113) 18% (171) 11%(105) 2% (18) 4% (38) 4% (42) 8% (78) 930Gender: Female 30%(322) 13% (141) 16%(164) 17%(178) 6% (68) 6% (68) 4% (37) 7% (78) 1058Age: 18-34 38%(192) 8% (41) 17% (85) 1% (7) 10% (51) 10% (49) 7% (35) 8% (40) 499Age: 35-44 46%(139) 9% (28) 18% (55) 3% (9) 4% (13) 8% (24) 4% (13) 7% (21) 302Age: 45-64 34%(250) 13% (95) 21%(152) 14%(102) 2% (16) 4% (29) 3% (21) 8% (60) 724Age: 65+ 23%(107) 19% (90) 9% (43) 36%(165) 1% (6) 1% (5) 2% (10) 8% (36) 463GenZers: 1997-2012 30% (66) 11% (24) 13% (28) 2% (5) 15% (34) 11% (25) 9% (21) 9% (21) 224Millennials: 1981-1996 45%(187) 7% (31) 19% (80) 2% (9) 6% (26) 9% (38) 5% (19) 7% (29) 419GenXers: 1965-1980 41%(210) 11% (58) 21%(108) 5% (26) 3% (17) 7% (35) 5% (23) 7% (34) 511Baby Boomers: 1946-1964 27%(206) 16%(122) 15% (112) 28%(215) 1% (9) 1% (10) 2% (13) 10% (73) 760PID: Dem (no lean) 31%(237) 4% (32) 23% (171) 15% (113) 7% (51) 6% (49) 6% (43) 8% (61) 757PID: Ind (no lean) 34%(216) 13% (82) 15% (98) 14% (92) 4% (25) 6% (36) 4% (24) 10% (64) 638PID: Rep (no lean) 40%(234) 24%(140) 11% (66) 13% (78) 2% (10) 4% (22) 2% (12) 5% (31) 593PID/Gender: DemMen 36%(120) 4% (14) 24% (80) 12% (40) 4% (13) 4% (13) 8% (25) 7% (24) 329PID/Gender: DemWomen 27% (118) 4% (18) 21% (91) 17% (73) 9% (39) 8% (36) 4% (18) 9% (37) 429PID/Gender: Ind Men 41% (121) 11% (33) 16% (48) 11% (32) 1% (2) 6% (18) 3% (8) 11% (33) 296PID/Gender: Ind Women 28% (95) 14% (48) 15% (50) 18% (60) 7% (23) 5% (18) 5% (16) 9% (31) 342PID/Gender: Rep Men 41%(125) 21% (65) 14% (43) 11% (33) 1% (3) 2% (7) 3% (8) 7% (21) 306PID/Gender: Rep Women 38%(109) 26% (75) 8% (23) 16% (45) 2% (7) 5% (15) 1% (3) 4% (10) 287Ideo: Liberal (1-3) 31%(190) 3% (21) 21%(129) 14% (83) 9% (54) 6% (36) 7% (41) 9% (55) 609Ideo: Moderate (4) 33%(173) 12% (63) 20%(105) 16% (84) 3% (14) 6% (29) 4% (20) 6% (33) 522Ideo: Conservative (5-7) 39%(267) 22%(149) 11% (77) 14% (92) 2% (12) 5% (32) 1% (8) 6% (44) 679
Continued on next page
Page 22
22
Morning ConsultTable P3
Table P3: Now, thinking about your vote, what would you say is the top set of issues on your mind when you cast your vote for federal offices such asU.S. Senate or Congress?
Demographic
EconomicIssues –like taxes,wages,jobs,
unemploy-ment, andspending
SecurityIssues –like
terrorism,foreign
policy, andbordersecurity
HealthCare Issues– like the2010 healthcare law,Medicaid,other
challenges
SeniorsIssues –like
Medicareand SocialSecurity
Women’sIssues –like birthcontrol,abortion,and equal
pay
EducationIssues – like
schoolstandards,class sizes,
school choice,and student
loans
Energy Issues– like carbonemissions,cost ofelectric-
ity/gasoline,or renewables Other: Total N
Registered Voters 35%(688) 13%(254) 17%(335) 14%(283) 4% (86) 5%(107) 4% (79) 8%(157) 1988Educ: < College 32%(405) 15% (191) 16%(195) 17%(208) 4% (54) 5% (61) 3% (40) 8% (96) 1250Educ: Bachelors degree 40%(187) 8% (36) 19% (89) 10% (48) 4% (20) 6% (29) 5% (26) 7% (35) 470Educ: Post-grad 36% (96) 10% (27) 19% (51) 10% (28) 4% (12) 6% (16) 5% (13) 10% (26) 267Income: Under 50k 31%(314) 14%(137) 15%(152) 19%(192) 4% (39) 5% (45) 3% (32) 9% (87) 998Income: 50k-100k 37%(246) 11% (75) 18%(122) 10% (68) 6% (37) 6% (42) 4% (27) 7% (44) 660Income: 100k+ 39%(128) 13% (42) 18% (61) 7% (23) 3% (10) 6% (20) 6% (20) 8% (26) 329Ethnicity: White 33%(527) 14%(224) 17%(276) 16%(257) 4% (68) 5% (73) 4% (64) 7%(120) 1608Ethnicity: Hispanic 42% (80) 9% (18) 14% (27) 7% (13) 6% (12) 9% (17) 7% (13) 6% (12) 193Ethnicity: Afr. Am. 47% (118) 7% (17) 15% (39) 6% (16) 5% (12) 9% (21) 2% (6) 10% (24) 252Ethnicity: Other 33% (43) 10% (13) 16% (21) 8% (11) 5% (6) 9% (12) 8% (10) 10% (12) 128All Christian 34%(320) 16%(148) 15%(142) 18%(169) 2% (23) 5% (46) 3% (31) 7% (64) 941All Non-Christian 28% (27) 3% (3) 31% (30) 19% (18) 4% (4) 6% (5) 4% (4) 6% (6) 97Atheist 26% (33) 10% (13) 21% (27) 4% (5) 13% (17) 5% (7) 8% (11) 12% (16) 128Agnostic/Nothing in particular 38%(183) 8% (40) 19% (91) 12% (59) 4% (21) 5% (23) 5% (23) 8% (38) 478Something Else 36%(125) 14% (49) 13% (45) 10% (33) 6% (22) 7% (25) 3% (10) 10% (34) 344Religious Non-Protestant/Catholic 27% (33) 4% (5) 27% (32) 20% (24) 3% (4) 6% (7) 5% (6) 7% (8) 120Evangelical 33%(169) 19% (96) 15% (75) 13% (64) 4% (21) 6% (31) 2% (12) 7% (37) 505Non-Evangelical 36%(265) 13% (99) 15%(109) 17%(130) 3% (23) 5% (37) 3% (25) 8% (57) 746Community: Urban 38%(185) 11% (56) 17% (85) 10% (47) 5% (24) 4% (20) 4% (22) 10% (50) 490Community: Suburban 35%(340) 12% (114) 19%(182) 14%(133) 4% (40) 6% (57) 5% (44) 7% (70) 981Community: Rural 31%(162) 16% (83) 13% (68) 20%(103) 4% (22) 6% (29) 3% (13) 7% (37) 517
Continued on next page
Page 23
National Tracking Poll #2006102, June, 2020
23
Table P3
Table P3: Now, thinking about your vote, what would you say is the top set of issues on your mind when you cast your vote for federal offices such asU.S. Senate or Congress?
Demographic
EconomicIssues –like taxes,wages,jobs,
unemploy-ment, andspending
SecurityIssues –like
terrorism,foreign
policy, andbordersecurity
HealthCare Issues– like the2010 healthcare law,Medicaid,other
challenges
SeniorsIssues –like
Medicareand SocialSecurity
Women’sIssues –like birthcontrol,abortion,and equal
pay
EducationIssues – like
schoolstandards,class sizes,
school choice,and student
loans
Energy Issues– like carbonemissions,cost ofelectric-
ity/gasoline,or renewables Other: Total N
Registered Voters 35%(688) 13%(254) 17%(335) 14%(283) 4% (86) 5%(107) 4% (79) 8%(157) 1988Employ: Private Sector 41%(257) 11% (69) 23%(147) 5% (33) 4% (27) 5% (31) 5% (29) 6% (38) 631Employ: Government 45% (61) 8% (10) 14% (20) 3% (5) 3% (5) 12% (16) 5% (7) 9% (12) 136Employ: Self-Employed 45% (58) 9% (12) 16% (21) 7% (9) 3% (4) 8% (11) 5% (6) 8% (10) 130Employ: Homemaker 30% (35) 15% (18) 18% (21) 10% (11) 6% (7) 11% (12) 3% (4) 8% (9) 115Employ: Retired 21%(104) 20%(100) 11% (54) 36%(178) 1% (7) 1% (5) 2% (10) 7% (34) 492Employ: Unemployed 39% (90) 10% (23) 16% (37) 9% (21) 5% (11) 6% (14) 3% (7) 12% (27) 229Employ: Other 36% (54) 8% (12) 15% (23) 14% (22) 5% (8) 6% (9) 3% (5) 12% (18) 152Military HH: Yes 30% (93) 18% (56) 10% (32) 20% (60) 3% (11) 4% (13) 4% (13) 9% (28) 306Military HH: No 35%(595) 12%(197) 18%(303) 13%(223) 4% (75) 6% (93) 4% (66) 8%(129) 1682RD/WT: Right Direction 36%(204) 22%(126) 12% (70) 14% (82) 2% (12) 6% (36) 3% (17) 4% (21) 567RD/WT: Wrong Track 34%(483) 9%(128) 19%(266) 14%(201) 5% (74) 5% (71) 4% (62) 10%(135) 1421Trump Job Approve 40%(312) 24%(182) 10% (81) 13% (99) 2% (13) 4% (32) 2% (13) 5% (41) 774Trump Job Disapprove 31%(359) 5% (63) 21%(247) 15%(178) 6% (71) 6% (68) 5% (62) 9%(106) 1153Trump Job Strongly Approve 35%(146) 32%(135) 10% (42) 11% (47) 1% (6) 3% (10) 1% (4) 6% (23) 415Trump Job Somewhat Approve 46%(166) 13% (47) 11% (38) 15% (52) 2% (7) 6% (21) 2% (9) 5% (18) 359Trump Job Somewhat Disapprove 36% (82) 11% (26) 19% (42) 11% (25) 4% (8) 6% (13) 7% (17) 5% (12) 226Trump Job Strongly Disapprove 30%(277) 4% (37) 22%(204) 16%(152) 7% (63) 6% (55) 5% (45) 10% (94) 927Favorable of Trump 40%(316) 24%(185) 11% (86) 13%(103) 1% (10) 5% (37) 2% (12) 5% (37) 787Unfavorable of Trump 30%(344) 5% (62) 22%(244) 15%(174) 6% (72) 6% (65) 5% (62) 10%(109) 1132Very Favorable of Trump 35%(164) 30%(139) 10% (47) 14% (63) 1% (5) 4% (16) 1% (4) 5% (24) 462Somewhat Favorable of Trump 47%(153) 14% (46) 12% (39) 12% (39) 2% (5) 6% (21) 2% (8) 4% (13) 325Somewhat Unfavorable of Trump 35% (65) 11% (20) 16% (29) 13% (23) 4% (8) 6% (12) 7% (13) 7% (13) 182Very Unfavorable of Trump 29%(280) 4% (42) 23%(215) 16% (151) 7% (65) 6% (53) 5% (49) 10% (96) 950
Continued on next page
Page 24
24
Morning ConsultTable P3
Table P3: Now, thinking about your vote, what would you say is the top set of issues on your mind when you cast your vote for federal offices such asU.S. Senate or Congress?
Demographic
EconomicIssues –like taxes,wages,jobs,
unemploy-ment, andspending
SecurityIssues –like
terrorism,foreign
policy, andbordersecurity
HealthCare Issues– like the2010 healthcare law,Medicaid,other
challenges
SeniorsIssues –like
Medicareand SocialSecurity
Women’sIssues –like birthcontrol,abortion,and equal
pay
EducationIssues – like
schoolstandards,class sizes,
school choice,and student
loans
Energy Issues– like carbonemissions,cost ofelectric-
ity/gasoline,or renewables Other: Total N
Registered Voters 35%(688) 13%(254) 17%(335) 14%(283) 4% (86) 5%(107) 4% (79) 8%(157) 1988#1 Issue: Economy 100%(688) — (0) — (0) — (0) — (0) — (0) — (0) — (0) 688#1 Issue: Security — (0) 100%(254) — (0) — (0) — (0) — (0) — (0) — (0) 254#1 Issue: Health Care — (0) — (0) 100%(335) — (0) — (0) — (0) — (0) — (0) 335#1 Issue: Medicare / Social Security — (0) — (0) — (0) 100%(283) — (0) — (0) — (0) — (0) 283#1 Issue: Women’s Issues — (0) — (0) — (0) — (0) 100% (86) — (0) — (0) — (0) 86#1 Issue: Education — (0) — (0) — (0) — (0) — (0) 100%(107) — (0) — (0) 107#1 Issue: Energy — (0) — (0) — (0) — (0) — (0) — (0) 100% (79) — (0) 79#1 Issue: Other — (0) — (0) — (0) — (0) — (0) — (0) — (0) 100%(157) 1572018 House Vote: Democrat 31%(236) 5% (37) 23%(179) 16%(126) 5% (39) 6% (45) 5% (40) 9% (67) 7672018 House Vote: Republican 39%(245) 25%(159) 11% (72) 14% (88) 2% (10) 2% (15) 1% (5) 6% (35) 6292018 House Vote: Someone else 30% (22) 6% (4) 11% (8) 21% (15) 3% (2) 8% (6) 6% (4) 16% (12) 732016 Vote: Hillary Clinton 29%(203) 4% (31) 23%(162) 18%(125) 5% (35) 6% (41) 6% (41) 9% (63) 7002016 Vote: Donald Trump 39%(263) 24%(164) 11% (77) 14% (95) 1% (7) 3% (22) 1% (7) 6% (41) 6752016 Vote: Other 39% (56) 6% (9) 20% (29) 12% (17) 4% (6) 5% (7) 4% (5) 10% (15) 1442016 Vote: Didn’t Vote 36%(166) 11% (50) 14% (67) 10% (46) 8% (37) 8% (36) 5% (26) 8% (37) 466Voted in 2014: Yes 34%(444) 14%(180) 17%(224) 17%(228) 3% (41) 4% (58) 3% (38) 8%(108) 1322Voted in 2014: No 37%(244) 11% (73) 17% (111) 8% (55) 7% (45) 7% (49) 6% (41) 7% (48) 6662012 Vote: Barack Obama 32%(276) 5% (44) 20%(168) 20% (171) 3% (30) 5% (46) 5% (42) 9% (76) 8532012 Vote: Mitt Romney 37%(186) 27%(135) 12% (60) 13% (64) 2% (12) 3% (14) 1% (4) 5% (25) 5012012 Vote: Other 36% (30) 16% (13) 12% (10) 13% (11) 3% (3) 4% (3) — (0) 16% (13) 842012 Vote: Didn’t Vote 35%(194) 11% (61) 18% (97) 7% (37) 8% (42) 8% (43) 6% (33) 8% (42) 550
Continued on next page
Page 25
National Tracking Poll #2006102, June, 2020
25
Table P3
Table P3: Now, thinking about your vote, what would you say is the top set of issues on your mind when you cast your vote for federal offices such asU.S. Senate or Congress?
Demographic
EconomicIssues –like taxes,wages,jobs,
unemploy-ment, andspending
SecurityIssues –like
terrorism,foreign
policy, andbordersecurity
HealthCare Issues– like the2010 healthcare law,Medicaid,other
challenges
SeniorsIssues –like
Medicareand SocialSecurity
Women’sIssues –like birthcontrol,abortion,and equal
pay
EducationIssues – like
schoolstandards,class sizes,
school choice,and student
loans
Energy Issues– like carbonemissions,cost ofelectric-
ity/gasoline,or renewables Other: Total N
Registered Voters 35%(688) 13%(254) 17%(335) 14%(283) 4% (86) 5%(107) 4% (79) 8%(157) 19884-Region: Northeast 36%(127) 14% (50) 17% (61) 12% (44) 4% (13) 4% (13) 5% (18) 8% (28) 3554-Region: Midwest 32%(147) 11% (52) 18% (81) 16% (71) 5% (21) 6% (27) 3% (12) 10% (45) 4574-Region: South 36%(264) 14%(105) 17%(125) 13% (95) 4% (29) 6% (48) 4% (27) 7% (50) 7424-Region: West 34%(149) 11% (47) 16% (68) 17% (73) 5% (23) 4% (19) 5% (22) 8% (34) 434Party: Democrat/Leans Democrat 32%(290) 4% (39) 22%(201) 15%(137) 7% (60) 6% (58) 6% (51) 8% (76) 911Party: Republican/Leans Republican 40%(294) 23%(170) 11% (80) 13% (99) 2% (13) 4% (29) 2% (15) 6% (42) 741Parents 36%(308) 13% (116) 17%(147) 13% (115) 3% (27) 7% (57) 4% (35) 7% (59) 864Note: Row proportions may total to larger than one-hundred percent due to rounding. For more information visit MorningConsultIntelligence.com.
Page 26
26
Morning ConsultTable POL1
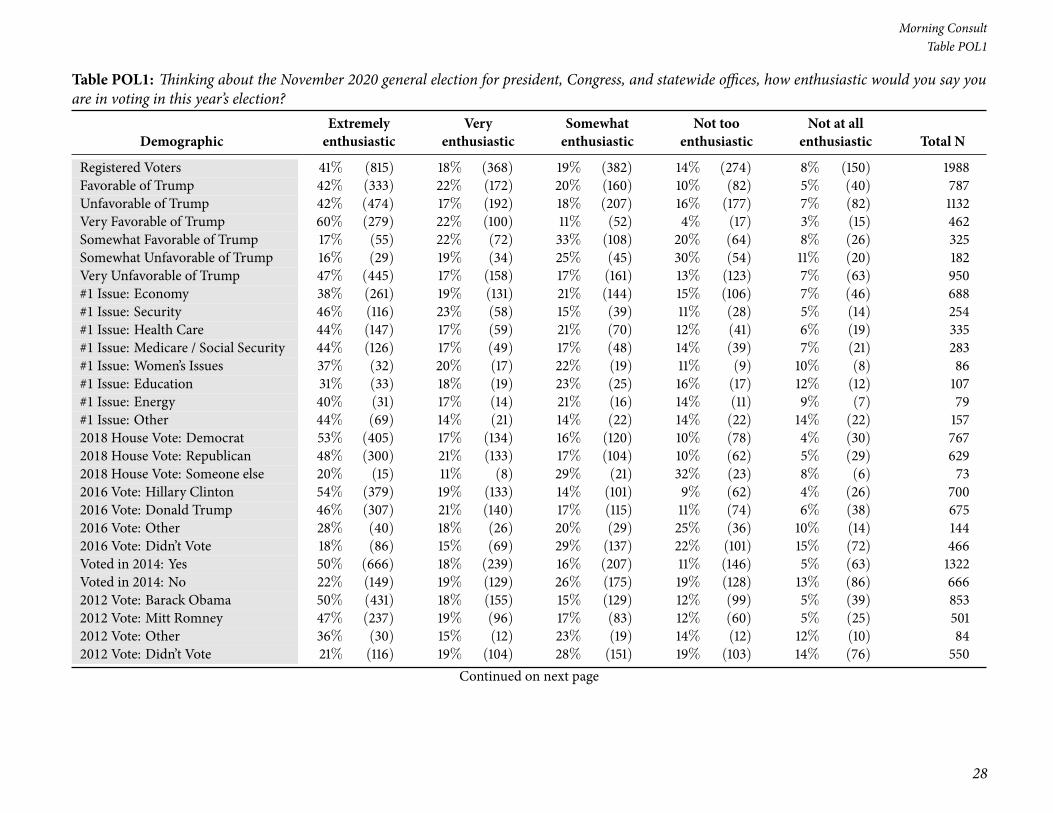
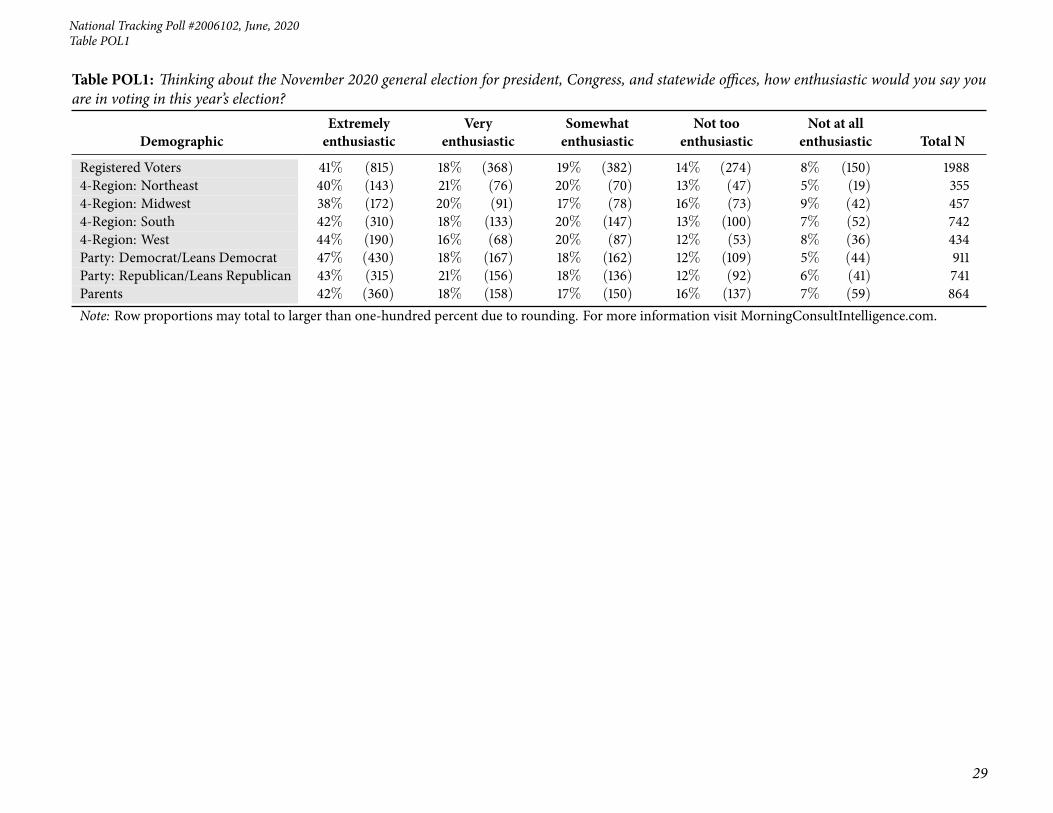
Table POL1: Thinking about the November 2020 general election for president, Congress, and statewide offices, how enthusiastic would you say youare in voting in this year’s election?
DemographicExtremelyenthusiastic
Veryenthusiastic
Somewhatenthusiastic
Not tooenthusiastic
Not at allenthusiastic Total N
Registered Voters 41% (815) 18% (368) 19% (382) 14% (274) 8% (150) 1988Gender: Male 43% (404) 20% (188) 19% (176) 11% (103) 6% (59) 930Gender: Female 39% (411) 17% (179) 20% (206) 16% (171) 9% (90) 1058Age: 18-34 28% (138) 19% (92) 28% (139) 15% (76) 11% (54) 499Age: 35-44 38% (115) 18% (56) 20% (61) 15% (47) 8% (24) 302Age: 45-64 44% (319) 20% (144) 15% (107) 14% (103) 7% (50) 724Age: 65+ 53% (243) 16% (75) 16% (75) 10% (47) 5% (22) 463GenZers: 1997-2012 21% (46) 19% (43) 30% (67) 18% (40) 12% (28) 224Millennials: 1981-1996 34% (145) 18% (74) 26% (109) 14% (57) 8% (35) 419GenXers: 1965-1980 41% (208) 22% (111) 13% (68) 16% (82) 8% (42) 511Baby Boomers: 1946-1964 49% (373) 17% (127) 17% (132) 11% (85) 6% (43) 760PID: Dem (no lean) 49% (369) 19% (143) 18% (136) 10% (78) 4% (32) 757PID: Ind (no lean) 28% (176) 17% (110) 21% (136) 20% (128) 14% (88) 638PID: Rep (no lean) 45% (269) 20% (116) 19% (110) 11% (68) 5% (30) 593PID/Gender: DemMen 48% (157) 21% (69) 19% (62) 9% (28) 4% (12) 329PID/Gender: DemWomen 49% (212) 17% (73) 17% (74) 12% (50) 5% (19) 429PID/Gender: Ind Men 32% (95) 18% (55) 22% (67) 16% (47) 11% (33) 296PID/Gender: Ind Women 24% (81) 16% (55) 20% (70) 24% (81) 16% (55) 342PID/Gender: Rep Men 50% (152) 21% (65) 16% (48) 9% (27) 5% (14) 306PID/Gender: Rep Women 41% (117) 18% (51) 22% (62) 14% (41) 5% (16) 287Ideo: Liberal (1-3) 51% (310) 19% (113) 17% (102) 9% (56) 5% (28) 609Ideo: Moderate (4) 33% (171) 16% (84) 26% (136) 16% (83) 9% (48) 522Ideo: Conservative (5-7) 45% (304) 21% (146) 16% (105) 13% (91) 5% (32) 679Educ: < College 36% (449) 19% (240) 21% (260) 15% (192) 9% (110) 1250Educ: Bachelors degree 46% (214) 19% (88) 18% (84) 12% (57) 6% (27) 470Educ: Post-grad 57% (152) 15% (39) 15% (39) 9% (25) 5% (13) 267Income: Under 50k 38% (375) 18% (181) 20% (202) 16% (155) 9% (85) 998Income: 50k-100k 46% (301) 19% (125) 17% (112) 12% (77) 7% (45) 660Income: 100k+ 42% (139) 19% (62) 21% (68) 13% (41) 6% (19) 329Ethnicity: White 42% (682) 18% (286) 19% (301) 14% (221) 7% (117) 1608Ethnicity: Hispanic 31% (60) 17% (32) 22% (43) 20% (39) 10% (19) 193
Continued on next page
Page 27
National Tracking Poll #2006102, June, 2020
27
Table POL1
Table POL1: Thinking about the November 2020 general election for president, Congress, and statewide offices, how enthusiastic would you say youare in voting in this year’s election?
DemographicExtremelyenthusiastic
Veryenthusiastic
Somewhatenthusiastic
Not tooenthusiastic
Not at allenthusiastic Total N
Registered Voters 41% (815) 18% (368) 19% (382) 14% (274) 8% (150) 1988Ethnicity: Afr. Am. 35% (89) 22% (56) 22% (55) 13% (32) 8% (19) 252Ethnicity: Other 34% (43) 19% (25) 21% (27) 16% (20) 11% (14) 128All Christian 43% (402) 20% (188) 18% (171) 14% (128) 5% (51) 941All Non-Christian 49% (48) 20% (19) 16% (16) 7% (7) 8% (8) 97Atheist 41% (52) 21% (27) 17% (21) 12% (15) 10% (12) 128Agnostic/Nothing in particular 38% (181) 16% (75) 22% (103) 15% (72) 10% (46) 478Something Else 38% (132) 17% (58) 21% (71) 15% (51) 9% (32) 344Religious Non-Protestant/Catholic 46% (55) 22% (27) 17% (20) 9% (10) 7% (8) 120Evangelical 43% (216) 17% (87) 19% (95) 14% (71) 7% (35) 505Non-Evangelical 42% (310) 20% (150) 18% (137) 14% (101) 6% (47) 746Community: Urban 38% (188) 22% (106) 16% (79) 15% (73) 9% (43) 490Community: Suburban 43% (419) 18% (181) 19% (187) 14% (133) 6% (61) 981Community: Rural 40% (208) 16% (81) 22% (115) 13% (67) 9% (46) 517Employ: Private Sector 40% (255) 22% (137) 18% (115) 14% (87) 6% (37) 631Employ: Government 42% (57) 20% (27) 20% (28) 10% (14) 8% (10) 136Employ: Self-Employed 42% (55) 23% (30) 15% (19) 11% (14) 9% (12) 130Employ: Homemaker 33% (38) 15% (17) 16% (19) 20% (23) 16% (18) 115Employ: Retired 54% (268) 15% (74) 15% (75) 11% (52) 5% (23) 492Employ: Unemployed 30% (69) 18% (40) 24% (55) 16% (37) 12% (27) 229Employ: Other 32% (49) 17% (25) 25% (37) 20% (31) 6% (10) 152Military HH: Yes 52% (159) 16% (48) 18% (56) 10% (29) 4% (14) 306Military HH: No 39% (656) 19% (319) 19% (326) 15% (244) 8% (136) 1682RD/WT: Right Direction 47% (265) 21% (119) 19% (108) 9% (48) 5% (27) 567RD/WT: Wrong Track 39% (550) 17% (248) 19% (274) 16% (225) 9% (123) 1421Trump Job Approve 43% (333) 22% (171) 20% (155) 11% (82) 4% (32) 774Trump Job Disapprove 41% (477) 17% (196) 18% (212) 16% (180) 8% (88) 1153Trump Job Strongly Approve 65% (269) 19% (80) 10% (40) 3% (14) 3% (13) 415Trump Job Somewhat Approve 18% (64) 25% (91) 32% (116) 19% (68) 5% (19) 359Trump Job Somewhat Disapprove 16% (36) 20% (44) 27% (60) 29% (66) 9% (20) 226Trump Job Strongly Disapprove 48% (441) 16% (152) 16% (152) 12% (114) 7% (68) 927
Continued on next page
Page 28
28
Morning ConsultTable POL1
Table POL1: Thinking about the November 2020 general election for president, Congress, and statewide offices, how enthusiastic would you say youare in voting in this year’s election?
DemographicExtremelyenthusiastic
Veryenthusiastic
Somewhatenthusiastic
Not tooenthusiastic
Not at allenthusiastic Total N
Registered Voters 41% (815) 18% (368) 19% (382) 14% (274) 8% (150) 1988Favorable of Trump 42% (333) 22% (172) 20% (160) 10% (82) 5% (40) 787Unfavorable of Trump 42% (474) 17% (192) 18% (207) 16% (177) 7% (82) 1132Very Favorable of Trump 60% (279) 22% (100) 11% (52) 4% (17) 3% (15) 462Somewhat Favorable of Trump 17% (55) 22% (72) 33% (108) 20% (64) 8% (26) 325Somewhat Unfavorable of Trump 16% (29) 19% (34) 25% (45) 30% (54) 11% (20) 182Very Unfavorable of Trump 47% (445) 17% (158) 17% (161) 13% (123) 7% (63) 950#1 Issue: Economy 38% (261) 19% (131) 21% (144) 15% (106) 7% (46) 688#1 Issue: Security 46% (116) 23% (58) 15% (39) 11% (28) 5% (14) 254#1 Issue: Health Care 44% (147) 17% (59) 21% (70) 12% (41) 6% (19) 335#1 Issue: Medicare / Social Security 44% (126) 17% (49) 17% (48) 14% (39) 7% (21) 283#1 Issue: Women’s Issues 37% (32) 20% (17) 22% (19) 11% (9) 10% (8) 86#1 Issue: Education 31% (33) 18% (19) 23% (25) 16% (17) 12% (12) 107#1 Issue: Energy 40% (31) 17% (14) 21% (16) 14% (11) 9% (7) 79#1 Issue: Other 44% (69) 14% (21) 14% (22) 14% (22) 14% (22) 1572018 House Vote: Democrat 53% (405) 17% (134) 16% (120) 10% (78) 4% (30) 7672018 House Vote: Republican 48% (300) 21% (133) 17% (104) 10% (62) 5% (29) 6292018 House Vote: Someone else 20% (15) 11% (8) 29% (21) 32% (23) 8% (6) 732016 Vote: Hillary Clinton 54% (379) 19% (133) 14% (101) 9% (62) 4% (26) 7002016 Vote: Donald Trump 46% (307) 21% (140) 17% (115) 11% (74) 6% (38) 6752016 Vote: Other 28% (40) 18% (26) 20% (29) 25% (36) 10% (14) 1442016 Vote: Didn’t Vote 18% (86) 15% (69) 29% (137) 22% (101) 15% (72) 466Voted in 2014: Yes 50% (666) 18% (239) 16% (207) 11% (146) 5% (63) 1322Voted in 2014: No 22% (149) 19% (129) 26% (175) 19% (128) 13% (86) 6662012 Vote: Barack Obama 50% (431) 18% (155) 15% (129) 12% (99) 5% (39) 8532012 Vote: Mitt Romney 47% (237) 19% (96) 17% (83) 12% (60) 5% (25) 5012012 Vote: Other 36% (30) 15% (12) 23% (19) 14% (12) 12% (10) 842012 Vote: Didn’t Vote 21% (116) 19% (104) 28% (151) 19% (103) 14% (76) 550
Continued on next page
Page 29
National Tracking Poll #2006102, June, 2020
29
Table POL1
Table POL1: Thinking about the November 2020 general election for president, Congress, and statewide offices, how enthusiastic would you say youare in voting in this year’s election?
DemographicExtremelyenthusiastic
Veryenthusiastic
Somewhatenthusiastic
Not tooenthusiastic
Not at allenthusiastic Total N
Registered Voters 41% (815) 18% (368) 19% (382) 14% (274) 8% (150) 19884-Region: Northeast 40% (143) 21% (76) 20% (70) 13% (47) 5% (19) 3554-Region: Midwest 38% (172) 20% (91) 17% (78) 16% (73) 9% (42) 4574-Region: South 42% (310) 18% (133) 20% (147) 13% (100) 7% (52) 7424-Region: West 44% (190) 16% (68) 20% (87) 12% (53) 8% (36) 434Party: Democrat/Leans Democrat 47% (430) 18% (167) 18% (162) 12% (109) 5% (44) 911Party: Republican/Leans Republican 43% (315) 21% (156) 18% (136) 12% (92) 6% (41) 741Parents 42% (360) 18% (158) 17% (150) 16% (137) 7% (59) 864Note: Row proportions may total to larger than one-hundred percent due to rounding. For more information visit MorningConsultIntelligence.com.
Page 30
30
Morning ConsultTable POL2
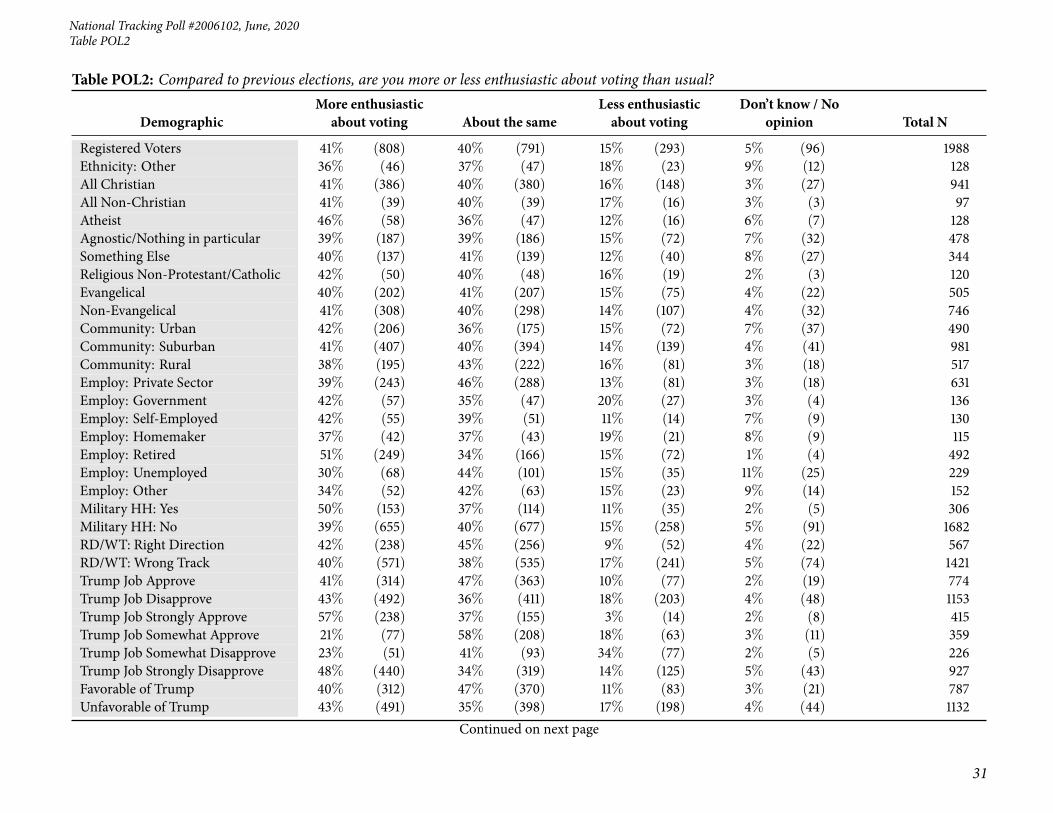
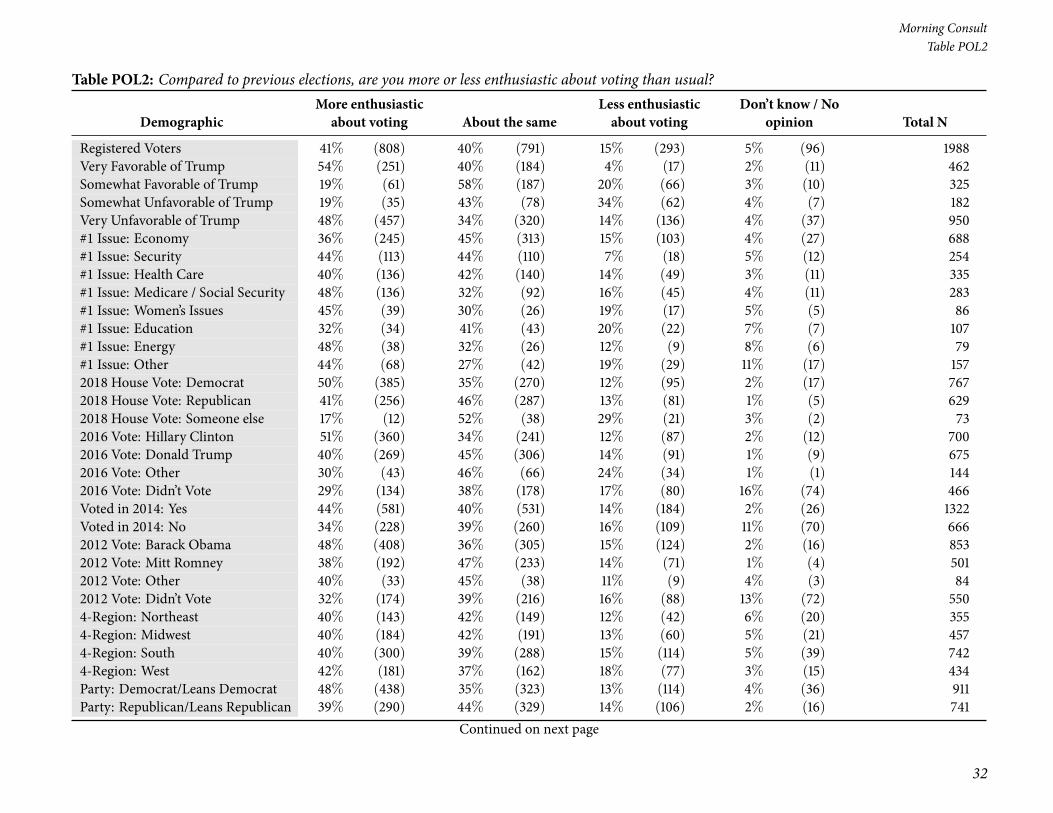
Table POL2: Compared to previous elections, are you more or less enthusiastic about voting than usual?
DemographicMore enthusiasticabout voting About the same
Less enthusiasticabout voting
Don’t know / Noopinion Total N
Registered Voters 41% (808) 40% (791) 15% (293) 5% (96) 1988Gender: Male 43% (400) 41% (384) 11% (104) 5% (42) 930Gender: Female 39% (408) 38% (407) 18% (188) 5% (54) 1058Age: 18-34 31% (155) 42% (208) 17% (85) 10% (51) 499Age: 35-44 39% (118) 38% (114) 17% (52) 6% (18) 302Age: 45-64 42% (305) 41% (300) 13% (95) 3% (23) 724Age: 65+ 50% (230) 37% (169) 13% (61) 1% (3) 463GenZers: 1997-2012 30% (68) 37% (83) 16% (35) 17% (38) 224Millennials: 1981-1996 33% (138) 45% (189) 17% (73) 5% (20) 419GenXers: 1965-1980 43% (219) 38% (193) 16% (81) 4% (18) 511Baby Boomers: 1946-1964 44% (338) 41% (314) 12% (89) 2% (19) 760PID: Dem (no lean) 48% (366) 36% (274) 11% (85) 4% (33) 757PID: Ind (no lean) 30% (193) 42% (268) 20% (127) 8% (49) 638PID: Rep (no lean) 42% (249) 42% (249) 14% (81) 2% (14) 593PID/Gender: DemMen 51% (168) 35% (116) 9% (30) 4% (14) 329PID/Gender: DemWomen 46% (198) 37% (158) 13% (54) 4% (19) 429PID/Gender: Ind Men 32% (95) 48% (143) 13% (38) 7% (19) 296PID/Gender: Ind Women 29% (98) 36% (125) 26% (89) 9% (30) 342PID/Gender: Rep Men 45% (137) 41% (125) 12% (36) 3% (8) 306PID/Gender: Rep Women 39% (112) 43% (124) 16% (45) 2% (5) 287Ideo: Liberal (1-3) 51% (313) 34% (209) 12% (71) 2% (15) 609Ideo: Moderate (4) 33% (171) 45% (235) 17% (91) 5% (24) 522Ideo: Conservative (5-7) 42% (287) 42% (284) 14% (98) 1% (10) 679Educ: < College 37% (466) 41% (514) 15% (191) 6% (79) 1250Educ: Bachelors degree 45% (210) 40% (186) 13% (61) 3% (13) 470Educ: Post-grad 49% (132) 34% (91) 15% (40) 1% (4) 267Income: Under 50k 40% (397) 39% (389) 15% (149) 6% (63) 998Income: 50k-100k 40% (264) 43% (285) 14% (91) 3% (20) 660Income: 100k+ 45% (147) 36% (117) 16% (52) 4% (13) 329Ethnicity: White 41% (666) 40% (639) 15% (239) 4% (64) 1608Ethnicity: Hispanic 39% (75) 34% (65) 19% (37) 9% (16) 193Ethnicity: Afr. Am. 38% (97) 42% (105) 12% (31) 8% (20) 252
Continued on next page
Page 31
National Tracking Poll #2006102, June, 2020
31
Table POL2
Table POL2: Compared to previous elections, are you more or less enthusiastic about voting than usual?
DemographicMore enthusiasticabout voting About the same
Less enthusiasticabout voting
Don’t know / Noopinion Total N
Registered Voters 41% (808) 40% (791) 15% (293) 5% (96) 1988Ethnicity: Other 36% (46) 37% (47) 18% (23) 9% (12) 128All Christian 41% (386) 40% (380) 16% (148) 3% (27) 941All Non-Christian 41% (39) 40% (39) 17% (16) 3% (3) 97Atheist 46% (58) 36% (47) 12% (16) 6% (7) 128Agnostic/Nothing in particular 39% (187) 39% (186) 15% (72) 7% (32) 478Something Else 40% (137) 41% (139) 12% (40) 8% (27) 344Religious Non-Protestant/Catholic 42% (50) 40% (48) 16% (19) 2% (3) 120Evangelical 40% (202) 41% (207) 15% (75) 4% (22) 505Non-Evangelical 41% (308) 40% (298) 14% (107) 4% (32) 746Community: Urban 42% (206) 36% (175) 15% (72) 7% (37) 490Community: Suburban 41% (407) 40% (394) 14% (139) 4% (41) 981Community: Rural 38% (195) 43% (222) 16% (81) 3% (18) 517Employ: Private Sector 39% (243) 46% (288) 13% (81) 3% (18) 631Employ: Government 42% (57) 35% (47) 20% (27) 3% (4) 136Employ: Self-Employed 42% (55) 39% (51) 11% (14) 7% (9) 130Employ: Homemaker 37% (42) 37% (43) 19% (21) 8% (9) 115Employ: Retired 51% (249) 34% (166) 15% (72) 1% (4) 492Employ: Unemployed 30% (68) 44% (101) 15% (35) 11% (25) 229Employ: Other 34% (52) 42% (63) 15% (23) 9% (14) 152Military HH: Yes 50% (153) 37% (114) 11% (35) 2% (5) 306Military HH: No 39% (655) 40% (677) 15% (258) 5% (91) 1682RD/WT: Right Direction 42% (238) 45% (256) 9% (52) 4% (22) 567RD/WT: Wrong Track 40% (571) 38% (535) 17% (241) 5% (74) 1421Trump Job Approve 41% (314) 47% (363) 10% (77) 2% (19) 774Trump Job Disapprove 43% (492) 36% (411) 18% (203) 4% (48) 1153Trump Job Strongly Approve 57% (238) 37% (155) 3% (14) 2% (8) 415Trump Job Somewhat Approve 21% (77) 58% (208) 18% (63) 3% (11) 359Trump Job Somewhat Disapprove 23% (51) 41% (93) 34% (77) 2% (5) 226Trump Job Strongly Disapprove 48% (440) 34% (319) 14% (125) 5% (43) 927Favorable of Trump 40% (312) 47% (370) 11% (83) 3% (21) 787Unfavorable of Trump 43% (491) 35% (398) 17% (198) 4% (44) 1132
Continued on next page
Page 32
32
Morning ConsultTable POL2
Table POL2: Compared to previous elections, are you more or less enthusiastic about voting than usual?
DemographicMore enthusiasticabout voting About the same
Less enthusiasticabout voting
Don’t know / Noopinion Total N
Registered Voters 41% (808) 40% (791) 15% (293) 5% (96) 1988Very Favorable of Trump 54% (251) 40% (184) 4% (17) 2% (11) 462Somewhat Favorable of Trump 19% (61) 58% (187) 20% (66) 3% (10) 325Somewhat Unfavorable of Trump 19% (35) 43% (78) 34% (62) 4% (7) 182Very Unfavorable of Trump 48% (457) 34% (320) 14% (136) 4% (37) 950#1 Issue: Economy 36% (245) 45% (313) 15% (103) 4% (27) 688#1 Issue: Security 44% (113) 44% (110) 7% (18) 5% (12) 254#1 Issue: Health Care 40% (136) 42% (140) 14% (49) 3% (11) 335#1 Issue: Medicare / Social Security 48% (136) 32% (92) 16% (45) 4% (11) 283#1 Issue: Women’s Issues 45% (39) 30% (26) 19% (17) 5% (5) 86#1 Issue: Education 32% (34) 41% (43) 20% (22) 7% (7) 107#1 Issue: Energy 48% (38) 32% (26) 12% (9) 8% (6) 79#1 Issue: Other 44% (68) 27% (42) 19% (29) 11% (17) 1572018 House Vote: Democrat 50% (385) 35% (270) 12% (95) 2% (17) 7672018 House Vote: Republican 41% (256) 46% (287) 13% (81) 1% (5) 6292018 House Vote: Someone else 17% (12) 52% (38) 29% (21) 3% (2) 732016 Vote: Hillary Clinton 51% (360) 34% (241) 12% (87) 2% (12) 7002016 Vote: Donald Trump 40% (269) 45% (306) 14% (91) 1% (9) 6752016 Vote: Other 30% (43) 46% (66) 24% (34) 1% (1) 1442016 Vote: Didn’t Vote 29% (134) 38% (178) 17% (80) 16% (74) 466Voted in 2014: Yes 44% (581) 40% (531) 14% (184) 2% (26) 1322Voted in 2014: No 34% (228) 39% (260) 16% (109) 11% (70) 6662012 Vote: Barack Obama 48% (408) 36% (305) 15% (124) 2% (16) 8532012 Vote: Mitt Romney 38% (192) 47% (233) 14% (71) 1% (4) 5012012 Vote: Other 40% (33) 45% (38) 11% (9) 4% (3) 842012 Vote: Didn’t Vote 32% (174) 39% (216) 16% (88) 13% (72) 5504-Region: Northeast 40% (143) 42% (149) 12% (42) 6% (20) 3554-Region: Midwest 40% (184) 42% (191) 13% (60) 5% (21) 4574-Region: South 40% (300) 39% (288) 15% (114) 5% (39) 7424-Region: West 42% (181) 37% (162) 18% (77) 3% (15) 434Party: Democrat/Leans Democrat 48% (438) 35% (323) 13% (114) 4% (36) 911Party: Republican/Leans Republican 39% (290) 44% (329) 14% (106) 2% (16) 741
Continued on next page
Page 33
National Tracking Poll #2006102, June, 2020
33
Table POL2
Table POL2: Compared to previous elections, are you more or less enthusiastic about voting than usual?
DemographicMore enthusiasticabout voting About the same
Less enthusiasticabout voting
Don’t know / Noopinion Total N
Registered Voters 41% (808) 40% (791) 15% (293) 5% (96) 1988Parents 42% (360) 39% (333) 17% (145) 3% (25) 864Note: Row proportions may total to larger than one-hundred percent due to rounding. For more information visit MorningConsultIntelligence.com.
Page 34
34
Morning ConsultTable POL3_1
Table POL3_1: Who do you trust more to handle each of the following issues?The economy
Demographic Democrats in CongressRepublicans in
CongressDon’t know / No
opinion Total N
Registered Voters 39% (777) 40% (802) 21% (409) 1988Gender: Male 38% (350) 47% (435) 16% (145) 930Gender: Female 40% (427) 35% (367) 25% (264) 1058Age: 18-34 45% (227) 29% (145) 26% (128) 499Age: 35-44 40% (122) 39% (118) 20% (62) 302Age: 45-64 36% (263) 44% (317) 20% (144) 724Age: 65+ 36% (165) 48% (222) 16% (75) 463GenZers: 1997-2012 44% (98) 28% (63) 28% (62) 224Millennials: 1981-1996 45% (190) 33% (140) 21% (89) 419GenXers: 1965-1980 36% (185) 43% (219) 21% (107) 511Baby Boomers: 1946-1964 37% (284) 45% (339) 18% (137) 760PID: Dem (no lean) 79% (599) 8% (58) 13% (101) 757PID: Ind (no lean) 23% (148) 40% (254) 37% (236) 638PID: Rep (no lean) 5% (30) 83% (490) 12% (73) 593PID/Gender: DemMen 80% (262) 10% (33) 10% (34) 329PID/Gender: DemWomen 78% (337) 6% (26) 16% (67) 429PID/Gender: Ind Men 22% (66) 48% (141) 30% (88) 296PID/Gender: Ind Women 24% (82) 33% (113) 43% (147) 342PID/Gender: Rep Men 7% (22) 85% (261) 7% (23) 306PID/Gender: Rep Women 3% (8) 80% (228) 17% (50) 287Ideo: Liberal (1-3) 76% (463) 11% (68) 13% (77) 609Ideo: Moderate (4) 36% (187) 34% (180) 30% (155) 522Ideo: Conservative (5-7) 12% (79) 78% (529) 10% (71) 679Educ: < College 35% (442) 41% (509) 24% (299) 1250Educ: Bachelors degree 44% (206) 41% (191) 16% (74) 470Educ: Post-grad 48% (129) 38% (102) 14% (36) 267Income: Under 50k 39% (389) 37% (374) 24% (235) 998Income: 50k-100k 39% (257) 43% (285) 18% (118) 660Income: 100k+ 40% (131) 43% (143) 17% (56) 329Ethnicity: White 36% (571) 45% (721) 20% (315) 1608Ethnicity: Hispanic 43% (82) 30% (57) 28% (54) 193
Continued on next page
Page 35
National Tracking Poll #2006102, June, 2020
35
Table POL3_1
Table POL3_1: Who do you trust more to handle each of the following issues?The economy
Demographic Democrats in CongressRepublicans in
CongressDon’t know / No
opinion Total N
Registered Voters 39% (777) 40% (802) 21% (409) 1988Ethnicity: Afr. Am. 62% (155) 18% (46) 20% (51) 252Ethnicity: Other 39% (50) 27% (35) 33% (43) 128All Christian 33% (311) 49% (462) 18% (167) 941All Non-Christian 59% (58) 28% (28) 13% (12) 97Atheist 64% (82) 22% (28) 14% (18) 128Agnostic/Nothing in particular 43% (206) 32% (155) 24% (117) 478Something Else 35% (120) 38% (129) 28% (95) 344Religious Non-Protestant/Catholic 53% (64) 30% (37) 16% (19) 120Evangelical 24% (123) 53% (268) 23% (114) 505Non-Evangelical 40% (296) 42% (310) 19% (139) 746Community: Urban 48% (233) 32% (159) 20% (97) 490Community: Suburban 40% (394) 41% (398) 19% (189) 981Community: Rural 29% (150) 47% (245) 24% (123) 517Employ: Private Sector 39% (249) 43% (270) 18% (112) 631Employ: Government 50% (68) 32% (43) 18% (25) 136Employ: Self-Employed 45% (59) 33% (43) 21% (28) 130Employ: Homemaker 32% (37) 45% (52) 23% (26) 115Employ: Retired 36% (178) 47% (231) 17% (82) 492Employ: Unemployed 40% (92) 33% (75) 27% (62) 229Employ: Other 33% (50) 35% (54) 32% (48) 152Military HH: Yes 35% (108) 48% (146) 17% (52) 306Military HH: No 40% (668) 39% (656) 21% (357) 1682RD/WT: Right Direction 10% (56) 73% (413) 17% (99) 567RD/WT: Wrong Track 51% (720) 27% (390) 22% (310) 1421Trump Job Approve 5% (39) 81% (629) 14% (106) 774Trump Job Disapprove 63% (730) 14% (167) 22% (256) 1153Trump Job Strongly Approve 3% (13) 89% (371) 7% (30) 415Trump Job Somewhat Approve 7% (25) 72% (257) 21% (76) 359Trump Job Somewhat Disapprove 32% (72) 36% (81) 32% (73) 226Trump Job Strongly Disapprove 71% (658) 9% (85) 20% (183) 927
Continued on next page
Page 36
36
Morning ConsultTable POL3_1
Table POL3_1: Who do you trust more to handle each of the following issues?The economy
Demographic Democrats in CongressRepublicans in
CongressDon’t know / No
opinion Total N
Registered Voters 39% (777) 40% (802) 21% (409) 1988Favorable of Trump 5% (37) 81% (638) 14% (112) 787Unfavorable of Trump 64% (726) 14% (156) 22% (250) 1132Very Favorable of Trump 2% (10) 90% (414) 8% (38) 462Somewhat Favorable of Trump 8% (27) 69% (224) 23% (74) 325Somewhat Unfavorable of Trump 22% (40) 44% (80) 34% (61) 182Very Unfavorable of Trump 72% (685) 8% (76) 20% (189) 950#1 Issue: Economy 34% (237) 47% (323) 19% (128) 688#1 Issue: Security 14% (34) 73% (185) 14% (35) 254#1 Issue: Health Care 55% (186) 24% (80) 21% (69) 335#1 Issue: Medicare / Social Security 41% (116) 34% (97) 25% (70) 283#1 Issue: Women’s Issues 61% (52) 24% (20) 15% (13) 86#1 Issue: Education 43% (45) 31% (33) 27% (28) 107#1 Issue: Energy 53% (42) 22% (17) 25% (20) 79#1 Issue: Other 41% (64) 30% (47) 29% (45) 1572018 House Vote: Democrat 75% (577) 10% (77) 15% (113) 7672018 House Vote: Republican 5% (31) 85% (533) 10% (65) 6292018 House Vote: Someone else 15% (11) 29% (21) 56% (41) 732016 Vote: Hillary Clinton 76% (535) 9% (63) 15% (103) 7002016 Vote: Donald Trump 6% (39) 81% (549) 13% (87) 6752016 Vote: Other 27% (39) 33% (48) 40% (58) 1442016 Vote: Didn’t Vote 35% (161) 31% (143) 35% (162) 466Voted in 2014: Yes 42% (550) 43% (565) 16% (207) 1322Voted in 2014: No 34% (227) 36% (237) 30% (203) 6662012 Vote: Barack Obama 64% (549) 18% (149) 18% (155) 8532012 Vote: Mitt Romney 7% (34) 82% (411) 11% (55) 5012012 Vote: Other 13% (11) 54% (45) 33% (28) 842012 Vote: Didn’t Vote 33% (183) 36% (195) 31% (171) 550
Continued on next page
Page 37
National Tracking Poll #2006102, June, 2020
37
Table POL3_1
Table POL3_1: Who do you trust more to handle each of the following issues?The economy
Demographic Democrats in CongressRepublicans in
CongressDon’t know / No
opinion Total N
Registered Voters 39% (777) 40% (802) 21% (409) 19884-Region: Northeast 44% (156) 39% (139) 17% (60) 3554-Region: Midwest 38% (173) 40% (184) 22% (99) 4574-Region: South 34% (254) 45% (331) 21% (158) 7424-Region: West 44% (193) 34% (149) 21% (92) 434Party: Democrat/Leans Democrat 75% (686) 9% (86) 15% (138) 911Party: Republican/Leans Republican 5% (37) 83% (611) 13% (93) 741Parents 35% (304) 45% (389) 20% (170) 864Note: Row proportions may total to larger than one-hundred percent due to rounding. For more information visit MorningConsultIntelligence.com.
Page 38
38
Morning ConsultTable POL3_2
Table POL3_2: Who do you trust more to handle each of the following issues?Jobs
Demographic Democrats in CongressRepublicans in
CongressDon’t know / No
opinion Total N
Registered Voters 39% (776) 40% (790) 21% (421) 1988Gender: Male 37% (348) 45% (419) 18% (163) 930Gender: Female 41% (428) 35% (371) 24% (258) 1058Age: 18-34 46% (229) 29% (145) 25% (126) 499Age: 35-44 38% (115) 41% (122) 21% (65) 302Age: 45-64 37% (269) 42% (306) 21% (148) 724Age: 65+ 35% (163) 47% (217) 18% (83) 463GenZers: 1997-2012 43% (95) 30% (67) 27% (61) 224Millennials: 1981-1996 45% (189) 33% (137) 22% (94) 419GenXers: 1965-1980 37% (191) 41% (211) 21% (110) 511Baby Boomers: 1946-1964 37% (283) 44% (334) 19% (143) 760PID: Dem (no lean) 79% (602) 7% (54) 13% (101) 757PID: Ind (no lean) 22% (143) 40% (254) 38% (241) 638PID: Rep (no lean) 5% (32) 81% (482) 13% (79) 593PID/Gender: DemMen 78% (258) 9% (28) 13% (42) 329PID/Gender: DemWomen 80% (344) 6% (26) 14% (59) 429PID/Gender: Ind Men 22% (65) 47% (140) 31% (91) 296PID/Gender: Ind Women 23% (78) 33% (114) 44% (150) 342PID/Gender: Rep Men 8% (25) 82% (251) 10% (29) 306PID/Gender: Rep Women 2% (7) 80% (231) 17% (50) 287Ideo: Liberal (1-3) 76% (460) 10% (63) 14% (86) 609Ideo: Moderate (4) 37% (193) 32% (167) 31% (162) 522Ideo: Conservative (5-7) 11% (75) 78% (531) 11% (73) 679Educ: < College 35% (433) 41% (511) 25% (307) 1250Educ: Bachelors degree 46% (214) 38% (180) 16% (76) 470Educ: Post-grad 48% (129) 37% (100) 14% (39) 267Income: Under 50k 39% (386) 36% (361) 25% (252) 998Income: 50k-100k 39% (256) 43% (287) 18% (117) 660Income: 100k+ 41% (135) 43% (142) 16% (52) 329Ethnicity: White 35% (558) 44% (713) 21% (337) 1608Ethnicity: Hispanic 43% (83) 27% (52) 30% (58) 193
Continued on next page
Page 39
National Tracking Poll #2006102, June, 2020
39
Table POL3_2
Table POL3_2: Who do you trust more to handle each of the following issues?Jobs
Demographic Democrats in CongressRepublicans in
CongressDon’t know / No
opinion Total N
Registered Voters 39% (776) 40% (790) 21% (421) 1988Ethnicity: Afr. Am. 67% (169) 16% (40) 17% (43) 252Ethnicity: Other 39% (49) 29% (37) 32% (41) 128All Christian 33% (314) 49% (457) 18% (170) 941All Non-Christian 53% (51) 26% (25) 22% (21) 97Atheist 61% (78) 23% (30) 16% (20) 128Agnostic/Nothing in particular 42% (201) 32% (155) 26% (123) 478Something Else 38% (132) 36% (124) 26% (88) 344Religious Non-Protestant/Catholic 48% (58) 30% (36) 21% (26) 120Evangelical 27% (137) 52% (264) 20% (103) 505Non-Evangelical 40% (298) 40% (300) 20% (148) 746Community: Urban 49% (240) 31% (151) 20% (99) 490Community: Suburban 40% (388) 39% (386) 21% (207) 981Community: Rural 29% (149) 49% (253) 22% (115) 517Employ: Private Sector 41% (259) 43% (274) 16% (98) 631Employ: Government 46% (62) 34% (45) 21% (28) 136Employ: Self-Employed 48% (63) 30% (39) 22% (28) 130Employ: Homemaker 33% (37) 42% (48) 26% (29) 115Employ: Retired 35% (171) 46% (225) 20% (96) 492Employ: Unemployed 39% (89) 33% (76) 28% (65) 229Employ: Other 34% (51) 35% (53) 31% (47) 152Military HH: Yes 36% (109) 45% (137) 19% (59) 306Military HH: No 40% (667) 39% (653) 22% (362) 1682RD/WT: Right Direction 11% (60) 73% (414) 16% (93) 567RD/WT: Wrong Track 50% (716) 26% (376) 23% (328) 1421Trump Job Approve 5% (39) 80% (619) 15% (116) 774Trump Job Disapprove 64% (735) 14% (161) 22% (257) 1153Trump Job Strongly Approve 2% (9) 90% (372) 8% (34) 415Trump Job Somewhat Approve 8% (30) 69% (247) 23% (82) 359Trump Job Somewhat Disapprove 33% (76) 33% (74) 34% (76) 226Trump Job Strongly Disapprove 71% (660) 9% (87) 19% (181) 927
Continued on next page
Page 40
40
Morning ConsultTable POL3_2
Table POL3_2: Who do you trust more to handle each of the following issues?Jobs
Demographic Democrats in CongressRepublicans in
CongressDon’t know / No
opinion Total N
Registered Voters 39% (776) 40% (790) 21% (421) 1988Favorable of Trump 5% (36) 80% (632) 15% (119) 787Unfavorable of Trump 64% (729) 13% (151) 22% (251) 1132Very Favorable of Trump 2% (11) 89% (412) 8% (39) 462Somewhat Favorable of Trump 8% (25) 68% (220) 25% (80) 325Somewhat Unfavorable of Trump 26% (48) 38% (68) 36% (66) 182Very Unfavorable of Trump 72% (681) 9% (83) 20% (186) 950#1 Issue: Economy 35% (241) 47% (324) 18% (124) 688#1 Issue: Security 13% (34) 71% (179) 16% (41) 254#1 Issue: Health Care 54% (182) 24% (80) 22% (73) 335#1 Issue: Medicare / Social Security 41% (116) 32% (91) 27% (76) 283#1 Issue: Women’s Issues 61% (53) 24% (21) 15% (13) 86#1 Issue: Education 39% (42) 33% (35) 28% (30) 107#1 Issue: Energy 54% (43) 19% (15) 27% (21) 79#1 Issue: Other 42% (67) 30% (47) 28% (43) 1572018 House Vote: Democrat 76% (587) 10% (74) 14% (106) 7672018 House Vote: Republican 5% (31) 84% (529) 11% (70) 6292018 House Vote: Someone else 9% (7) 32% (23) 59% (43) 732016 Vote: Hillary Clinton 78% (550) 8% (54) 14% (97) 7002016 Vote: Donald Trump 5% (33) 81% (549) 14% (93) 6752016 Vote: Other 24% (35) 32% (46) 44% (64) 1442016 Vote: Didn’t Vote 34% (157) 30% (142) 36% (167) 466Voted in 2014: Yes 42% (552) 42% (557) 16% (212) 1322Voted in 2014: No 34% (224) 35% (233) 31% (209) 6662012 Vote: Barack Obama 64% (542) 17% (145) 19% (166) 8532012 Vote: Mitt Romney 7% (34) 82% (410) 11% (56) 5012012 Vote: Other 14% (11) 49% (41) 37% (31) 842012 Vote: Didn’t Vote 34% (187) 35% (194) 31% (169) 550
Continued on next page
Page 41
National Tracking Poll #2006102, June, 2020
41
Table POL3_2
Table POL3_2: Who do you trust more to handle each of the following issues?Jobs
Demographic Democrats in CongressRepublicans in
CongressDon’t know / No
opinion Total N
Registered Voters 39% (776) 40% (790) 21% (421) 19884-Region: Northeast 45% (158) 40% (141) 16% (56) 3554-Region: Midwest 37% (170) 40% (183) 23% (104) 4574-Region: South 34% (252) 43% (320) 23% (169) 7424-Region: West 45% (196) 34% (146) 21% (92) 434Party: Democrat/Leans Democrat 76% (694) 9% (81) 15% (136) 911Party: Republican/Leans Republican 5% (37) 81% (600) 14% (104) 741Parents 34% (293) 46% (395) 20% (175) 864Note: Row proportions may total to larger than one-hundred percent due to rounding. For more information visit MorningConsultIntelligence.com.
Page 42
42
Morning ConsultTable POL3_3
Table POL3_3: Who do you trust more to handle each of the following issues?Health care
Demographic Democrats in CongressRepublicans in
CongressDon’t know / No
opinion Total N
Registered Voters 48% (952) 31% (615) 21% (421) 1988Gender: Male 46% (431) 35% (321) 19% (178) 930Gender: Female 49% (521) 28% (293) 23% (243) 1058Age: 18-34 57% (283) 17% (84) 26% (132) 499Age: 35-44 50% (150) 29% (87) 21% (65) 302Age: 45-64 44% (319) 35% (251) 21% (154) 724Age: 65+ 43% (200) 42% (192) 15% (71) 463GenZers: 1997-2012 56% (126) 12% (27) 32% (71) 224Millennials: 1981-1996 55% (231) 24% (99) 21% (89) 419GenXers: 1965-1980 46% (238) 32% (165) 21% (109) 511Baby Boomers: 1946-1964 44% (337) 37% (282) 19% (141) 760PID: Dem (no lean) 88% (665) 3% (24) 9% (69) 757PID: Ind (no lean) 38% (241) 23% (147) 39% (250) 638PID: Rep (no lean) 8% (45) 75% (444) 17% (103) 593PID/Gender: DemMen 85% (280) 4% (14) 11% (35) 329PID/Gender: DemWomen 90% (386) 2% (10) 8% (33) 429PID/Gender: Ind Men 38% (114) 27% (81) 34% (101) 296PID/Gender: Ind Women 37% (128) 19% (66) 43% (149) 342PID/Gender: Rep Men 12% (38) 74% (226) 14% (42) 306PID/Gender: Rep Women 3% (8) 76% (218) 21% (61) 287Ideo: Liberal (1-3) 85% (520) 6% (37) 8% (51) 609Ideo: Moderate (4) 53% (275) 18% (93) 30% (154) 522Ideo: Conservative (5-7) 15% (105) 69% (468) 16% (107) 679Educ: < College 43% (535) 32% (404) 25% (311) 1250Educ: Bachelors degree 56% (265) 27% (129) 16% (76) 470Educ: Post-grad 57% (153) 30% (81) 13% (34) 267Income: Under 50k 47% (468) 28% (282) 25% (248) 998Income: 50k-100k 47% (312) 35% (228) 18% (119) 660Income: 100k+ 52% (172) 32% (104) 16% (53) 329Ethnicity: White 43% (693) 36% (579) 21% (335) 1608Ethnicity: Hispanic 53% (101) 13% (26) 34% (65) 193
Continued on next page
Page 43
National Tracking Poll #2006102, June, 2020
43
Table POL3_3
Table POL3_3: Who do you trust more to handle each of the following issues?Health care
Demographic Democrats in CongressRepublicans in
CongressDon’t know / No
opinion Total N
Registered Voters 48% (952) 31% (615) 21% (421) 1988Ethnicity: Afr. Am. 75% (189) 6% (14) 20% (49) 252Ethnicity: Other 55% (70) 17% (21) 28% (36) 128All Christian 42% (396) 40% (377) 18% (168) 941All Non-Christian 64% (63) 21% (20) 15% (15) 97Atheist 69% (88) 15% (19) 17% (21) 128Agnostic/Nothing in particular 54% (258) 20% (95) 26% (126) 478Something Else 43% (149) 30% (104) 27% (91) 344Religious Non-Protestant/Catholic 60% (71) 22% (27) 18% (22) 120Evangelical 34% (173) 45% (228) 21% (104) 505Non-Evangelical 48% (356) 33% (243) 20% (147) 746Community: Urban 55% (271) 26% (127) 19% (91) 490Community: Suburban 50% (495) 28% (278) 21% (208) 981Community: Rural 36% (186) 40% (209) 24% (122) 517Employ: Private Sector 50% (315) 32% (199) 18% (117) 631Employ: Government 53% (72) 26% (35) 20% (28) 136Employ: Self-Employed 54% (70) 26% (34) 20% (25) 130Employ: Homemaker 37% (43) 36% (42) 26% (30) 115Employ: Retired 44% (214) 40% (195) 17% (82) 492Employ: Unemployed 50% (115) 21% (48) 29% (66) 229Employ: Other 41% (62) 29% (45) 30% (46) 152Military HH: Yes 41% (125) 40% (124) 19% (57) 306Military HH: No 49% (827) 29% (491) 22% (364) 1682RD/WT: Right Direction 15% (86) 63% (359) 22% (123) 567RD/WT: Wrong Track 61% (866) 18% (256) 21% (298) 1421Trump Job Approve 10% (76) 70% (539) 21% (159) 774Trump Job Disapprove 76% (875) 6% (72) 18% (206) 1153Trump Job Strongly Approve 4% (17) 84% (347) 12% (51) 415Trump Job Somewhat Approve 16% (59) 53% (192) 30% (108) 359Trump Job Somewhat Disapprove 50% (112) 17% (39) 33% (75) 226Trump Job Strongly Disapprove 82% (763) 4% (34) 14% (131) 927
Continued on next page
Page 44
44
Morning ConsultTable POL3_3
Table POL3_3: Who do you trust more to handle each of the following issues?Health care
Demographic Democrats in CongressRepublicans in
CongressDon’t know / No
opinion Total N
Registered Voters 48% (952) 31% (615) 21% (421) 1988Favorable of Trump 9% (67) 71% (559) 20% (160) 787Unfavorable of Trump 77% (871) 5% (54) 18% (207) 1132Very Favorable of Trump 4% (18) 84% (387) 12% (57) 462Somewhat Favorable of Trump 15% (50) 53% (172) 32% (103) 325Somewhat Unfavorable of Trump 47% (85) 15% (28) 38% (69) 182Very Unfavorable of Trump 83% (786) 3% (26) 15% (138) 950#1 Issue: Economy 42% (290) 37% (256) 21% (141) 688#1 Issue: Security 19% (49) 61% (154) 20% (50) 254#1 Issue: Health Care 66% (221) 16% (53) 18% (62) 335#1 Issue: Medicare / Social Security 48% (136) 28% (78) 24% (68) 283#1 Issue: Women’s Issues 71% (61) 10% (9) 19% (16) 86#1 Issue: Education 56% (59) 21% (23) 23% (25) 107#1 Issue: Energy 73% (57) 10% (8) 17% (13) 79#1 Issue: Other 50% (78) 21% (33) 29% (46) 1572018 House Vote: Democrat 87% (669) 4% (32) 9% (66) 7672018 House Vote: Republican 10% (63) 74% (465) 16% (101) 6292018 House Vote: Someone else 24% (18) 18% (13) 58% (43) 732016 Vote: Hillary Clinton 87% (606) 4% (29) 9% (65) 7002016 Vote: Donald Trump 11% (77) 71% (480) 18% (119) 6752016 Vote: Other 47% (68) 13% (19) 40% (57) 1442016 Vote: Didn’t Vote 43% (200) 19% (88) 38% (179) 466Voted in 2014: Yes 49% (653) 35% (468) 15% (201) 1322Voted in 2014: No 45% (299) 22% (146) 33% (221) 6662012 Vote: Barack Obama 74% (634) 11% (96) 14% (123) 8532012 Vote: Mitt Romney 11% (55) 74% (371) 15% (74) 5012012 Vote: Other 20% (17) 32% (27) 48% (40) 842012 Vote: Didn’t Vote 44% (244) 22% (121) 33% (184) 550
Continued on next page
Page 45
National Tracking Poll #2006102, June, 2020
45
Table POL3_3
Table POL3_3: Who do you trust more to handle each of the following issues?Health care
Demographic Democrats in CongressRepublicans in
CongressDon’t know / No
opinion Total N
Registered Voters 48% (952) 31% (615) 21% (421) 19884-Region: Northeast 55% (194) 28% (101) 17% (59) 3554-Region: Midwest 47% (213) 32% (148) 21% (96) 4574-Region: South 42% (313) 35% (261) 23% (168) 7424-Region: West 53% (231) 24% (105) 23% (98) 434Party: Democrat/Leans Democrat 87% (794) 3% (29) 10% (88) 911Party: Republican/Leans Republican 8% (63) 72% (533) 20% (145) 741Parents 43% (371) 37% (316) 20% (177) 864Note: Row proportions may total to larger than one-hundred percent due to rounding. For more information visit MorningConsultIntelligence.com.
Page 46
46
Morning ConsultTable POL3_4
Table POL3_4: Who do you trust more to handle each of the following issues?Immigration
Demographic Democrats in CongressRepublicans in
CongressDon’t know / No
opinion Total N
Registered Voters 44% (881) 36% (720) 19% (387) 1988Gender: Male 43% (404) 41% (380) 16% (147) 930Gender: Female 45% (477) 32% (340) 23% (241) 1058Age: 18-34 55% (276) 22% (108) 23% (116) 499Age: 35-44 44% (132) 37% (110) 20% (60) 302Age: 45-64 40% (288) 41% (295) 20% (141) 724Age: 65+ 40% (185) 45% (207) 15% (71) 463GenZers: 1997-2012 54% (121) 19% (42) 27% (61) 224Millennials: 1981-1996 52% (219) 28% (117) 20% (83) 419GenXers: 1965-1980 42% (214) 39% (199) 19% (99) 511Baby Boomers: 1946-1964 41% (309) 42% (322) 17% (129) 760PID: Dem (no lean) 83% (628) 7% (53) 10% (77) 757PID: Ind (no lean) 33% (207) 31% (197) 37% (234) 638PID: Rep (no lean) 8% (45) 79% (470) 13% (77) 593PID/Gender: DemMen 84% (276) 8% (27) 8% (25) 329PID/Gender: DemWomen 82% (352) 6% (26) 12% (51) 429PID/Gender: Ind Men 32% (96) 38% (112) 30% (88) 296PID/Gender: Ind Women 33% (112) 25% (85) 43% (146) 342PID/Gender: Rep Men 10% (32) 79% (241) 11% (33) 306PID/Gender: Rep Women 5% (14) 80% (229) 15% (44) 287Ideo: Liberal (1-3) 82% (496) 9% (53) 10% (59) 609Ideo: Moderate (4) 45% (235) 27% (139) 28% (148) 522Ideo: Conservative (5-7) 14% (93) 74% (502) 12% (85) 679Educ: < College 39% (490) 38% (477) 23% (284) 1250Educ: Bachelors degree 52% (246) 32% (152) 15% (72) 470Educ: Post-grad 54% (145) 34% (91) 12% (31) 267Income: Under 50k 43% (427) 35% (346) 23% (225) 998Income: 50k-100k 44% (292) 39% (254) 17% (113) 660Income: 100k+ 49% (161) 36% (119) 15% (49) 329Ethnicity: White 40% (644) 41% (660) 19% (304) 1608Ethnicity: Hispanic 55% (106) 18% (35) 27% (51) 193
Continued on next page
Page 47
National Tracking Poll #2006102, June, 2020
47
Table POL3_4
Table POL3_4: Who do you trust more to handle each of the following issues?Immigration
Demographic Democrats in CongressRepublicans in
CongressDon’t know / No
opinion Total N
Registered Voters 44% (881) 36% (720) 19% (387) 1988Ethnicity: Afr. Am. 68% (170) 14% (36) 18% (46) 252Ethnicity: Other 52% (66) 19% (25) 29% (38) 128All Christian 38% (358) 45% (424) 17% (159) 941All Non-Christian 60% (59) 28% (27) 12% (12) 97Atheist 68% (87) 19% (24) 13% (17) 128Agnostic/Nothing in particular 49% (235) 26% (126) 24% (116) 478Something Else 41% (141) 34% (118) 24% (84) 344Religious Non-Protestant/Catholic 51% (61) 31% (37) 19% (23) 120Evangelical 31% (155) 51% (256) 19% (94) 505Non-Evangelical 45% (337) 37% (273) 18% (136) 746Community: Urban 54% (264) 29% (140) 18% (86) 490Community: Suburban 46% (451) 35% (341) 19% (189) 981Community: Rural 32% (166) 46% (239) 22% (112) 517Employ: Private Sector 46% (291) 37% (234) 17% (106) 631Employ: Government 54% (73) 29% (39) 18% (24) 136Employ: Self-Employed 53% (69) 28% (37) 18% (24) 130Employ: Homemaker 37% (43) 42% (49) 20% (23) 115Employ: Retired 38% (189) 45% (223) 16% (80) 492Employ: Unemployed 46% (106) 29% (66) 25% (57) 229Employ: Other 36% (54) 30% (45) 34% (52) 152Military HH: Yes 38% (116) 45% (139) 17% (52) 306Military HH: No 45% (765) 35% (581) 20% (336) 1682RD/WT: Right Direction 14% (77) 69% (391) 18% (100) 567RD/WT: Wrong Track 57% (804) 23% (329) 20% (288) 1421Trump Job Approve 6% (49) 78% (601) 16% (123) 774Trump Job Disapprove 71% (823) 10% (112) 19% (218) 1153Trump Job Strongly Approve 4% (15) 89% (369) 7% (31) 415Trump Job Somewhat Approve 9% (34) 65% (233) 26% (92) 359Trump Job Somewhat Disapprove 44% (99) 26% (59) 30% (68) 226Trump Job Strongly Disapprove 78% (725) 6% (52) 16% (150) 927
Continued on next page
Page 48
48
Morning ConsultTable POL3_4
Table POL3_4: Who do you trust more to handle each of the following issues?Immigration
Demographic Democrats in CongressRepublicans in
CongressDon’t know / No
opinion Total N
Registered Voters 44% (881) 36% (720) 19% (387) 1988Favorable of Trump 6% (47) 78% (614) 16% (126) 787Unfavorable of Trump 72% (816) 9% (100) 19% (217) 1132Very Favorable of Trump 3% (15) 88% (408) 9% (39) 462Somewhat Favorable of Trump 10% (32) 63% (206) 27% (87) 325Somewhat Unfavorable of Trump 37% (67) 31% (56) 33% (59) 182Very Unfavorable of Trump 79% (749) 5% (44) 17% (157) 950#1 Issue: Economy 39% (266) 43% (294) 19% (128) 688#1 Issue: Security 17% (44) 72% (182) 11% (28) 254#1 Issue: Health Care 59% (198) 20% (67) 21% (71) 335#1 Issue: Medicare / Social Security 45% (127) 32% (90) 23% (66) 283#1 Issue: Women’s Issues 72% (62) 15% (13) 13% (11) 86#1 Issue: Education 53% (56) 26% (27) 22% (23) 107#1 Issue: Energy 61% (48) 17% (14) 21% (17) 79#1 Issue: Other 51% (80) 21% (33) 28% (43) 1572018 House Vote: Democrat 82% (629) 7% (56) 11% (82) 7672018 House Vote: Republican 7% (47) 81% (510) 11% (72) 6292018 House Vote: Someone else 16% (11) 23% (17) 61% (45) 732016 Vote: Hillary Clinton 82% (571) 6% (44) 12% (85) 7002016 Vote: Donald Trump 8% (54) 79% (533) 13% (89) 6752016 Vote: Other 40% (57) 18% (26) 43% (62) 1442016 Vote: Didn’t Vote 42% (198) 25% (118) 32% (150) 466Voted in 2014: Yes 45% (599) 40% (530) 15% (193) 1322Voted in 2014: No 42% (282) 29% (190) 29% (194) 6662012 Vote: Barack Obama 69% (589) 15% (131) 16% (133) 8532012 Vote: Mitt Romney 10% (51) 78% (392) 12% (59) 5012012 Vote: Other 14% (12) 47% (39) 39% (33) 842012 Vote: Didn’t Vote 42% (228) 29% (159) 30% (163) 550
Continued on next page
Page 49
National Tracking Poll #2006102, June, 2020
49
Table POL3_4
Table POL3_4: Who do you trust more to handle each of the following issues?Immigration
Demographic Democrats in CongressRepublicans in
CongressDon’t know / No
opinion Total N
Registered Voters 44% (881) 36% (720) 19% (387) 19884-Region: Northeast 50% (178) 33% (116) 17% (60) 3554-Region: Midwest 41% (186) 39% (180) 20% (91) 4574-Region: South 39% (292) 41% (303) 20% (148) 7424-Region: West 52% (225) 28% (121) 20% (89) 434Party: Democrat/Leans Democrat 82% (745) 7% (63) 11% (103) 911Party: Republican/Leans Republican 8% (57) 78% (578) 14% (106) 741Parents 39% (339) 41% (356) 20% (169) 864Note: Row proportions may total to larger than one-hundred percent due to rounding. For more information visit MorningConsultIntelligence.com.
Page 50
50
Morning ConsultTable POL3_5
Table POL3_5: Who do you trust more to handle each of the following issues?The environment
Demographic Democrats in CongressRepublicans in
CongressDon’t know / No
opinion Total N
Registered Voters 50% (998) 25% (503) 25% (487) 1988Gender: Male 50% (465) 29% (267) 21% (199) 930Gender: Female 50% (533) 22% (236) 27% (288) 1058Age: 18-34 60% (298) 14% (70) 26% (131) 499Age: 35-44 52% (158) 24% (74) 23% (70) 302Age: 45-64 47% (337) 28% (204) 25% (183) 724Age: 65+ 44% (205) 33% (155) 22% (103) 463GenZers: 1997-2012 60% (134) 10% (21) 30% (68) 224Millennials: 1981-1996 56% (236) 21% (87) 23% (96) 419GenXers: 1965-1980 49% (249) 28% (141) 24% (121) 511Baby Boomers: 1946-1964 47% (357) 28% (216) 25% (188) 760PID: Dem (no lean) 85% (646) 3% (22) 12% (90) 757PID: Ind (no lean) 41% (262) 18% (116) 41% (259) 638PID: Rep (no lean) 15% (90) 61% (364) 23% (138) 593PID/Gender: DemMen 85% (279) 4% (12) 12% (38) 329PID/Gender: DemWomen 86% (367) 2% (10) 12% (52) 429PID/Gender: Ind Men 43% (128) 23% (67) 34% (101) 296PID/Gender: Ind Women 39% (135) 14% (49) 46% (158) 342PID/Gender: Rep Men 19% (59) 61% (188) 19% (59) 306PID/Gender: Rep Women 11% (32) 62% (177) 27% (79) 287Ideo: Liberal (1-3) 84% (514) 5% (31) 10% (64) 609Ideo: Moderate (4) 53% (278) 15% (80) 31% (163) 522Ideo: Conservative (5-7) 22% (151) 55% (371) 23% (157) 679Educ: < College 44% (545) 27% (343) 29% (362) 1250Educ: Bachelors degree 62% (290) 21% (97) 18% (83) 470Educ: Post-grad 61% (163) 23% (62) 16% (42) 267Income: Under 50k 46% (461) 25% (250) 29% (288) 998Income: 50k-100k 53% (347) 27% (177) 21% (136) 660Income: 100k+ 58% (190) 23% (75) 19% (64) 329Ethnicity: White 47% (751) 29% (474) 24% (383) 1608Ethnicity: Hispanic 55% (105) 15% (28) 31% (59) 193
Continued on next page
Page 51
National Tracking Poll #2006102, June, 2020
51
Table POL3_5
Table POL3_5: Who do you trust more to handle each of the following issues?The environment
Demographic Democrats in CongressRepublicans in
CongressDon’t know / No
opinion Total N
Registered Voters 50% (998) 25% (503) 25% (487) 1988Ethnicity: Afr. Am. 70% (175) 6% (15) 24% (61) 252Ethnicity: Other 56% (72) 10% (13) 34% (43) 128All Christian 45% (420) 32% (304) 23% (218) 941All Non-Christian 66% (65) 20% (19) 14% (14) 97Atheist 72% (92) 11% (14) 17% (22) 128Agnostic/Nothing in particular 56% (269) 17% (79) 27% (130) 478Something Else 45% (153) 25% (87) 30% (103) 344Religious Non-Protestant/Catholic 59% (70) 22% (26) 19% (23) 120Evangelical 34% (169) 39% (196) 28% (139) 505Non-Evangelical 52% (389) 25% (186) 23% (171) 746Community: Urban 55% (270) 19% (95) 25% (125) 490Community: Suburban 54% (533) 22% (217) 23% (230) 981Community: Rural 38% (195) 37% (190) 26% (132) 517Employ: Private Sector 54% (340) 25% (156) 21% (135) 631Employ: Government 59% (80) 21% (28) 20% (27) 136Employ: Self-Employed 54% (70) 26% (34) 20% (26) 130Employ: Homemaker 42% (48) 29% (33) 29% (34) 115Employ: Retired 45% (219) 33% (162) 22% (110) 492Employ: Unemployed 50% (115) 18% (42) 32% (72) 229Employ: Other 41% (62) 24% (36) 35% (54) 152Military HH: Yes 42% (129) 35% (106) 23% (70) 306Military HH: No 52% (869) 24% (396) 25% (417) 1682RD/WT: Right Direction 20% (115) 54% (305) 26% (148) 567RD/WT: Wrong Track 62% (883) 14% (198) 24% (339) 1421Trump Job Approve 16% (123) 58% (446) 26% (204) 774Trump Job Disapprove 75% (868) 5% (53) 20% (233) 1153Trump Job Strongly Approve 7% (31) 77% (318) 16% (66) 415Trump Job Somewhat Approve 26% (93) 36% (128) 38% (138) 359Trump Job Somewhat Disapprove 51% (115) 10% (22) 39% (89) 226Trump Job Strongly Disapprove 81% (753) 3% (31) 15% (143) 927
Continued on next page
Page 52
52
Morning ConsultTable POL3_5
Table POL3_5: Who do you trust more to handle each of the following issues?The environment
Demographic Democrats in CongressRepublicans in
CongressDon’t know / No
opinion Total N
Registered Voters 50% (998) 25% (503) 25% (487) 1988Favorable of Trump 15% (118) 58% (460) 27% (209) 787Unfavorable of Trump 77% (868) 4% (40) 20% (225) 1132Very Favorable of Trump 7% (34) 74% (344) 18% (84) 462Somewhat Favorable of Trump 26% (84) 36% (116) 39% (125) 325Somewhat Unfavorable of Trump 51% (93) 10% (19) 38% (70) 182Very Unfavorable of Trump 82% (775) 2% (21) 16% (155) 950#1 Issue: Economy 47% (326) 29% (196) 24% (165) 688#1 Issue: Security 21% (52) 56% (143) 23% (58) 254#1 Issue: Health Care 66% (222) 13% (43) 21% (70) 335#1 Issue: Medicare / Social Security 48% (137) 23% (64) 29% (82) 283#1 Issue: Women’s Issues 73% (63) 6% (5) 21% (18) 86#1 Issue: Education 52% (56) 19% (20) 29% (31) 107#1 Issue: Energy 79% (62) 9% (7) 12% (10) 79#1 Issue: Other 51% (80) 15% (24) 34% (53) 1572018 House Vote: Democrat 86% (658) 3% (24) 11% (86) 7672018 House Vote: Republican 17% (105) 60% (378) 23% (147) 6292018 House Vote: Someone else 23% (17) 15% (11) 61% (45) 732016 Vote: Hillary Clinton 85% (596) 3% (23) 12% (82) 7002016 Vote: Donald Trump 17% (114) 58% (390) 25% (172) 6752016 Vote: Other 50% (72) 11% (15) 39% (57) 1442016 Vote: Didn’t Vote 46% (216) 16% (75) 38% (175) 466Voted in 2014: Yes 52% (682) 29% (380) 20% (259) 1322Voted in 2014: No 48% (317) 18% (122) 34% (228) 6662012 Vote: Barack Obama 74% (629) 10% (81) 17% (142) 8532012 Vote: Mitt Romney 18% (88) 58% (290) 24% (123) 5012012 Vote: Other 26% (22) 31% (26) 43% (36) 842012 Vote: Didn’t Vote 47% (257) 19% (105) 34% (187) 550
Continued on next page
Page 53
National Tracking Poll #2006102, June, 2020
53
Table POL3_5
Table POL3_5: Who do you trust more to handle each of the following issues?The environment
Demographic Democrats in CongressRepublicans in
CongressDon’t know / No
opinion Total N
Registered Voters 50% (998) 25% (503) 25% (487) 19884-Region: Northeast 55% (196) 24% (87) 20% (72) 3554-Region: Midwest 49% (224) 25% (115) 26% (118) 4574-Region: South 46% (339) 28% (206) 27% (197) 7424-Region: West 55% (239) 22% (95) 23% (100) 434Party: Democrat/Leans Democrat 85% (771) 3% (26) 13% (114) 911Party: Republican/Leans Republican 17% (123) 58% (432) 25% (186) 741Parents 45% (391) 31% (267) 24% (206) 864Note: Row proportions may total to larger than one-hundred percent due to rounding. For more information visit MorningConsultIntelligence.com.
Page 54
54
Morning ConsultTable POL3_6
Table POL3_6: Who do you trust more to handle each of the following issues?Energy
Demographic Democrats in CongressRepublicans in
CongressDon’t know / No
opinion Total N
Registered Voters 44% (881) 30% (601) 25% (506) 1988Gender: Male 43% (402) 37% (341) 20% (188) 930Gender: Female 45% (479) 25% (261) 30% (318) 1058Age: 18-34 55% (274) 16% (78) 29% (147) 499Age: 35-44 43% (130) 30% (92) 27% (80) 302Age: 45-64 41% (294) 34% (245) 25% (184) 724Age: 65+ 39% (182) 40% (187) 20% (94) 463GenZers: 1997-2012 55% (122) 11% (24) 35% (77) 224Millennials: 1981-1996 51% (213) 24% (102) 25% (104) 419GenXers: 1965-1980 44% (224) 32% (163) 24% (124) 511Baby Boomers: 1946-1964 40% (303) 35% (269) 25% (187) 760PID: Dem (no lean) 82% (620) 4% (28) 14% (109) 757PID: Ind (no lean) 32% (205) 24% (151) 44% (282) 638PID: Rep (no lean) 10% (57) 71% (422) 19% (114) 593PID/Gender: DemMen 81% (265) 4% (15) 15% (49) 329PID/Gender: DemWomen 83% (355) 3% (13) 14% (61) 429PID/Gender: Ind Men 33% (96) 31% (93) 36% (107) 296PID/Gender: Ind Women 32% (108) 17% (58) 51% (175) 342PID/Gender: Rep Men 13% (40) 76% (233) 11% (33) 306PID/Gender: Rep Women 6% (17) 66% (189) 28% (82) 287Ideo: Liberal (1-3) 80% (487) 6% (39) 13% (82) 609Ideo: Moderate (4) 47% (247) 17% (90) 35% (185) 522Ideo: Conservative (5-7) 15% (101) 67% (456) 18% (123) 679Educ: < College 39% (494) 31% (382) 30% (375) 1250Educ: Bachelors degree 53% (251) 28% (130) 19% (89) 470Educ: Post-grad 51% (136) 33% (90) 16% (42) 267Income: Under 50k 42% (419) 29% (288) 29% (291) 998Income: 50k-100k 47% (309) 33% (216) 21% (136) 660Income: 100k+ 47% (154) 30% (97) 24% (78) 329Ethnicity: White 40% (645) 35% (566) 25% (397) 1608Ethnicity: Hispanic 47% (90) 17% (33) 36% (69) 193
Continued on next page
Page 55
National Tracking Poll #2006102, June, 2020
55
Table POL3_6
Table POL3_6: Who do you trust more to handle each of the following issues?Energy
Demographic Democrats in CongressRepublicans in
CongressDon’t know / No
opinion Total N
Registered Voters 44% (881) 30% (601) 25% (506) 1988Ethnicity: Afr. Am. 69% (174) 5% (12) 26% (67) 252Ethnicity: Other 49% (63) 18% (24) 33% (42) 128All Christian 38% (358) 39% (363) 23% (220) 941All Non-Christian 58% (57) 25% (25) 16% (16) 97Atheist 63% (81) 16% (20) 21% (27) 128Agnostic/Nothing in particular 52% (250) 19% (92) 28% (136) 478Something Else 39% (135) 29% (101) 31% (108) 344Religious Non-Protestant/Catholic 53% (63) 27% (32) 21% (25) 120Evangelical 30% (151) 46% (230) 25% (124) 505Non-Evangelical 44% (331) 30% (223) 26% (192) 746Community: Urban 50% (243) 25% (121) 26% (126) 490Community: Suburban 47% (464) 28% (279) 24% (238) 981Community: Rural 34% (174) 39% (201) 27% (142) 517Employ: Private Sector 47% (295) 32% (201) 21% (135) 631Employ: Government 49% (67) 21% (29) 30% (40) 136Employ: Self-Employed 53% (69) 24% (32) 22% (29) 130Employ: Homemaker 33% (38) 35% (40) 32% (37) 115Employ: Retired 39% (190) 40% (198) 21% (104) 492Employ: Unemployed 48% (110) 20% (45) 32% (74) 229Employ: Other 36% (54) 28% (43) 36% (54) 152Military HH: Yes 38% (118) 40% (124) 21% (65) 306Military HH: No 45% (763) 28% (477) 26% (441) 1682RD/WT: Right Direction 14% (78) 62% (350) 25% (140) 567RD/WT: Wrong Track 57% (803) 18% (252) 26% (366) 1421Trump Job Approve 10% (76) 67% (518) 23% (180) 774Trump Job Disapprove 70% (802) 7% (81) 23% (270) 1153Trump Job Strongly Approve 4% (18) 82% (342) 13% (55) 415Trump Job Somewhat Approve 16% (59) 49% (176) 35% (124) 359Trump Job Somewhat Disapprove 43% (97) 18% (40) 39% (89) 226Trump Job Strongly Disapprove 76% (705) 4% (41) 20% (181) 927
Continued on next page
Page 56
56
Morning ConsultTable POL3_6
Table POL3_6: Who do you trust more to handle each of the following issues?Energy
Demographic Democrats in CongressRepublicans in
CongressDon’t know / No
opinion Total N
Registered Voters 44% (881) 30% (601) 25% (506) 1988Favorable of Trump 10% (75) 67% (529) 23% (182) 787Unfavorable of Trump 70% (794) 6% (69) 24% (269) 1132Very Favorable of Trump 4% (20) 82% (381) 13% (61) 462Somewhat Favorable of Trump 17% (55) 46% (149) 37% (121) 325Somewhat Unfavorable of Trump 38% (68) 21% (38) 41% (75) 182Very Unfavorable of Trump 76% (725) 3% (31) 20% (194) 950#1 Issue: Economy 41% (279) 36% (249) 23% (160) 688#1 Issue: Security 15% (39) 60% (152) 25% (63) 254#1 Issue: Health Care 60% (202) 17% (56) 23% (77) 335#1 Issue: Medicare / Social Security 44% (124) 26% (73) 31% (87) 283#1 Issue: Women’s Issues 68% (59) 12% (11) 19% (17) 86#1 Issue: Education 49% (52) 19% (21) 32% (34) 107#1 Issue: Energy 69% (55) 10% (8) 21% (16) 79#1 Issue: Other 46% (71) 20% (32) 34% (53) 1572018 House Vote: Democrat 80% (616) 5% (41) 14% (111) 7672018 House Vote: Republican 11% (69) 72% (453) 17% (107) 6292018 House Vote: Someone else 16% (12) 14% (11) 70% (51) 732016 Vote: Hillary Clinton 81% (569) 5% (32) 14% (99) 7002016 Vote: Donald Trump 11% (72) 69% (467) 20% (136) 6752016 Vote: Other 36% (52) 16% (22) 48% (70) 1442016 Vote: Didn’t Vote 40% (185) 17% (80) 43% (201) 466Voted in 2014: Yes 47% (615) 34% (452) 19% (254) 1322Voted in 2014: No 40% (266) 22% (149) 38% (251) 6662012 Vote: Barack Obama 70% (597) 10% (85) 20% (171) 8532012 Vote: Mitt Romney 11% (56) 71% (356) 18% (88) 5012012 Vote: Other 16% (13) 38% (32) 46% (38) 842012 Vote: Didn’t Vote 39% (213) 23% (128) 38% (208) 550
Continued on next page
Page 57
National Tracking Poll #2006102, June, 2020
57
Table POL3_6
Table POL3_6: Who do you trust more to handle each of the following issues?Energy
Demographic Democrats in CongressRepublicans in
CongressDon’t know / No
opinion Total N
Registered Voters 44% (881) 30% (601) 25% (506) 19884-Region: Northeast 48% (171) 29% (102) 23% (81) 3554-Region: Midwest 43% (197) 30% (136) 27% (124) 4574-Region: South 40% (294) 34% (249) 27% (200) 7424-Region: West 50% (219) 26% (115) 23% (101) 434Party: Democrat/Leans Democrat 80% (731) 4% (40) 15% (140) 911Party: Republican/Leans Republican 10% (74) 69% (509) 21% (157) 741Parents 39% (341) 35% (305) 25% (218) 864Note: Row proportions may total to larger than one-hundred percent due to rounding. For more information visit MorningConsultIntelligence.com.
Page 58
58
Morning ConsultTable POL3_7
Table POL3_7: Who do you trust more to handle each of the following issues?Education
Demographic Democrats in CongressRepublicans in
CongressDon’t know / No
opinion Total N
Registered Voters 46% (907) 30% (606) 24% (476) 1988Gender: Male 45% (418) 35% (325) 20% (187) 930Gender: Female 46% (489) 26% (280) 27% (289) 1058Age: 18-34 57% (285) 19% (92) 24% (122) 499Age: 35-44 44% (132) 32% (97) 24% (73) 302Age: 45-64 42% (302) 33% (236) 26% (186) 724Age: 65+ 40% (187) 39% (180) 21% (95) 463GenZers: 1997-2012 57% (128) 16% (37) 26% (59) 224Millennials: 1981-1996 52% (220) 25% (104) 23% (95) 419GenXers: 1965-1980 43% (221) 33% (167) 24% (123) 511Baby Boomers: 1946-1964 42% (318) 34% (258) 24% (184) 760PID: Dem (no lean) 86% (648) 3% (22) 11% (87) 757PID: Ind (no lean) 34% (216) 24% (150) 43% (272) 638PID: Rep (no lean) 7% (43) 73% (433) 20% (117) 593PID/Gender: DemMen 84% (277) 5% (16) 11% (36) 329PID/Gender: DemWomen 87% (371) 1% (6) 12% (51) 429PID/Gender: Ind Men 36% (108) 27% (80) 36% (108) 296PID/Gender: Ind Women 32% (108) 21% (70) 48% (164) 342PID/Gender: Rep Men 11% (33) 75% (229) 14% (43) 306PID/Gender: Rep Women 3% (10) 71% (204) 26% (74) 287Ideo: Liberal (1-3) 81% (493) 7% (43) 12% (73) 609Ideo: Moderate (4) 48% (252) 19% (100) 33% (170) 522Ideo: Conservative (5-7) 15% (104) 65% (444) 19% (131) 679Educ: < College 40% (501) 32% (404) 28% (345) 1250Educ: Bachelors degree 55% (258) 26% (123) 19% (89) 470Educ: Post-grad 55% (147) 29% (79) 16% (42) 267Income: Under 50k 44% (437) 28% (282) 28% (280) 998Income: 50k-100k 46% (307) 34% (225) 19% (129) 660Income: 100k+ 50% (163) 30% (99) 20% (67) 329Ethnicity: White 41% (662) 35% (564) 24% (383) 1608Ethnicity: Hispanic 53% (101) 18% (34) 30% (57) 193
Continued on next page
Page 59
National Tracking Poll #2006102, June, 2020
59
Table POL3_7
Table POL3_7: Who do you trust more to handle each of the following issues?Education
Demographic Democrats in CongressRepublicans in
CongressDon’t know / No
opinion Total N
Registered Voters 46% (907) 30% (606) 24% (476) 1988Ethnicity: Afr. Am. 71% (180) 9% (23) 19% (49) 252Ethnicity: Other 51% (65) 15% (19) 34% (44) 128All Christian 40% (374) 38% (358) 22% (209) 941All Non-Christian 63% (61) 22% (21) 16% (16) 97Atheist 70% (89) 19% (24) 12% (15) 128Agnostic/Nothing in particular 51% (243) 21% (101) 28% (134) 478Something Else 40% (139) 30% (102) 30% (103) 344Religious Non-Protestant/Catholic 58% (69) 24% (29) 18% (22) 120Evangelical 32% (160) 45% (230) 23% (115) 505Non-Evangelical 45% (338) 30% (221) 25% (187) 746Community: Urban 53% (259) 24% (116) 23% (114) 490Community: Suburban 49% (476) 28% (278) 23% (227) 981Community: Rural 33% (172) 41% (212) 26% (134) 517Employ: Private Sector 48% (300) 31% (194) 22% (136) 631Employ: Government 55% (75) 24% (33) 20% (27) 136Employ: Self-Employed 55% (71) 25% (32) 21% (27) 130Employ: Homemaker 36% (42) 34% (39) 30% (34) 115Employ: Retired 39% (194) 40% (196) 21% (102) 492Employ: Unemployed 46% (106) 21% (48) 33% (75) 229Employ: Other 38% (58) 29% (44) 33% (50) 152Military HH: Yes 39% (119) 40% (123) 21% (64) 306Military HH: No 47% (788) 29% (482) 24% (412) 1682RD/WT: Right Direction 14% (79) 62% (352) 24% (137) 567RD/WT: Wrong Track 58% (828) 18% (254) 24% (339) 1421Trump Job Approve 9% (67) 69% (531) 23% (176) 774Trump Job Disapprove 73% (838) 6% (67) 22% (249) 1153Trump Job Strongly Approve 3% (11) 84% (350) 13% (54) 415Trump Job Somewhat Approve 15% (56) 50% (181) 34% (122) 359Trump Job Somewhat Disapprove 47% (105) 16% (36) 37% (85) 226Trump Job Strongly Disapprove 79% (732) 3% (31) 18% (164) 927
Continued on next page
Page 60
60
Morning ConsultTable POL3_7
Table POL3_7: Who do you trust more to handle each of the following issues?Education
Demographic Democrats in CongressRepublicans in
CongressDon’t know / No
opinion Total N
Registered Voters 46% (907) 30% (606) 24% (476) 1988Favorable of Trump 8% (67) 68% (538) 23% (182) 787Unfavorable of Trump 73% (828) 5% (60) 22% (244) 1132Very Favorable of Trump 4% (17) 83% (382) 14% (63) 462Somewhat Favorable of Trump 15% (49) 48% (156) 37% (119) 325Somewhat Unfavorable of Trump 38% (69) 21% (38) 41% (75) 182Very Unfavorable of Trump 80% (759) 2% (23) 18% (169) 950#1 Issue: Economy 42% (292) 35% (243) 22% (153) 688#1 Issue: Security 16% (39) 62% (156) 23% (58) 254#1 Issue: Health Care 60% (200) 17% (56) 24% (79) 335#1 Issue: Medicare / Social Security 46% (130) 27% (76) 27% (77) 283#1 Issue: Women’s Issues 66% (57) 16% (14) 17% (15) 86#1 Issue: Education 57% (60) 19% (21) 24% (26) 107#1 Issue: Energy 68% (54) 11% (9) 21% (16) 79#1 Issue: Other 48% (74) 20% (31) 33% (51) 1572018 House Vote: Democrat 84% (644) 4% (28) 12% (95) 7672018 House Vote: Republican 9% (57) 72% (450) 19% (122) 6292018 House Vote: Someone else 20% (15) 21% (15) 59% (43) 732016 Vote: Hillary Clinton 84% (587) 4% (28) 12% (85) 7002016 Vote: Donald Trump 10% (65) 69% (465) 22% (145) 6752016 Vote: Other 39% (57) 15% (22) 46% (66) 1442016 Vote: Didn’t Vote 42% (198) 19% (91) 38% (178) 466Voted in 2014: Yes 48% (630) 34% (448) 18% (244) 1322Voted in 2014: No 42% (277) 24% (158) 35% (232) 6662012 Vote: Barack Obama 71% (603) 12% (99) 18% (151) 8532012 Vote: Mitt Romney 11% (56) 68% (338) 21% (106) 5012012 Vote: Other 19% (16) 42% (35) 39% (32) 842012 Vote: Didn’t Vote 42% (230) 24% (134) 34% (185) 550
Continued on next page
Page 61
National Tracking Poll #2006102, June, 2020
61
Table POL3_7
Table POL3_7: Who do you trust more to handle each of the following issues?Education
Demographic Democrats in CongressRepublicans in
CongressDon’t know / No
opinion Total N
Registered Voters 46% (907) 30% (606) 24% (476) 19884-Region: Northeast 48% (169) 29% (104) 23% (81) 3554-Region: Midwest 44% (201) 30% (137) 26% (119) 4574-Region: South 42% (313) 35% (256) 23% (173) 7424-Region: West 51% (223) 25% (108) 24% (103) 434Party: Democrat/Leans Democrat 84% (766) 3% (29) 13% (116) 911Party: Republican/Leans Republican 8% (63) 69% (512) 22% (166) 741Parents 41% (350) 34% (297) 25% (216) 864Note: Row proportions may total to larger than one-hundred percent due to rounding. For more information visit MorningConsultIntelligence.com.
Page 62
62
Morning ConsultTable POL3_8
Table POL3_8: Who do you trust more to handle each of the following issues?National security
Demographic Democrats in CongressRepublicans in
CongressDon’t know / No
opinion Total N
Registered Voters 38% (750) 41% (815) 21% (423) 1988Gender: Male 36% (337) 46% (430) 18% (163) 930Gender: Female 39% (412) 36% (385) 25% (260) 1058Age: 18-34 43% (215) 30% (151) 27% (134) 499Age: 35-44 38% (115) 39% (117) 23% (70) 302Age: 45-64 35% (256) 46% (331) 19% (137) 724Age: 65+ 35% (164) 47% (216) 18% (83) 463GenZers: 1997-2012 41% (92) 29% (65) 30% (67) 224Millennials: 1981-1996 43% (180) 34% (143) 23% (97) 419GenXers: 1965-1980 34% (176) 44% (226) 21% (110) 511Baby Boomers: 1946-1964 37% (283) 45% (339) 18% (138) 760PID: Dem (no lean) 76% (576) 9% (70) 15% (112) 757PID: Ind (no lean) 23% (145) 41% (260) 37% (233) 638PID: Rep (no lean) 5% (29) 82% (486) 13% (78) 593PID/Gender: DemMen 76% (248) 10% (33) 14% (47) 329PID/Gender: DemWomen 76% (328) 9% (37) 15% (64) 429PID/Gender: Ind Men 23% (67) 47% (139) 30% (90) 296PID/Gender: Ind Women 23% (78) 35% (121) 42% (143) 342PID/Gender: Rep Men 7% (22) 84% (258) 8% (26) 306PID/Gender: Rep Women 2% (7) 79% (228) 18% (52) 287Ideo: Liberal (1-3) 74% (449) 12% (75) 14% (84) 609Ideo: Moderate (4) 33% (172) 35% (184) 32% (165) 522Ideo: Conservative (5-7) 12% (81) 77% (525) 11% (73) 679Educ: < College 33% (417) 43% (534) 24% (300) 1250Educ: Bachelors degree 43% (204) 38% (180) 18% (85) 470Educ: Post-grad 48% (128) 38% (101) 14% (38) 267Income: Under 50k 37% (369) 38% (375) 25% (254) 998Income: 50k-100k 39% (255) 45% (298) 16% (107) 660Income: 100k+ 38% (126) 43% (142) 19% (62) 329Ethnicity: White 34% (541) 46% (742) 20% (326) 1608Ethnicity: Hispanic 42% (81) 31% (60) 27% (52) 193
Continued on next page
Page 63
National Tracking Poll #2006102, June, 2020
63
Table POL3_8
Table POL3_8: Who do you trust more to handle each of the following issues?National security
Demographic Democrats in CongressRepublicans in
CongressDon’t know / No
opinion Total N
Registered Voters 38% (750) 41% (815) 21% (423) 1988Ethnicity: Afr. Am. 62% (157) 15% (38) 23% (57) 252Ethnicity: Other 40% (52) 28% (36) 32% (41) 128All Christian 32% (302) 49% (465) 18% (173) 941All Non-Christian 57% (55) 32% (31) 11% (11) 97Atheist 63% (80) 23% (30) 14% (18) 128Agnostic/Nothing in particular 40% (191) 34% (161) 26% (126) 478Something Else 35% (121) 37% (128) 28% (95) 344Religious Non-Protestant/Catholic 53% (63) 33% (39) 15% (18) 120Evangelical 26% (130) 53% (267) 21% (108) 505Non-Evangelical 38% (281) 42% (313) 20% (152) 746Community: Urban 46% (227) 31% (152) 23% (111) 490Community: Suburban 39% (383) 41% (406) 20% (192) 981Community: Rural 27% (140) 50% (257) 23% (121) 517Employ: Private Sector 39% (249) 42% (266) 18% (116) 631Employ: Government 45% (61) 35% (48) 19% (26) 136Employ: Self-Employed 43% (55) 40% (52) 17% (23) 130Employ: Homemaker 27% (32) 45% (52) 27% (31) 115Employ: Retired 36% (176) 47% (231) 17% (85) 492Employ: Unemployed 38% (88) 33% (76) 29% (66) 229Employ: Other 33% (50) 34% (52) 32% (49) 152Military HH: Yes 34% (105) 49% (150) 17% (51) 306Military HH: No 38% (645) 40% (665) 22% (372) 1682RD/WT: Right Direction 10% (56) 71% (403) 19% (109) 567RD/WT: Wrong Track 49% (694) 29% (412) 22% (314) 1421Trump Job Approve 5% (36) 81% (626) 14% (111) 774Trump Job Disapprove 61% (708) 16% (179) 23% (266) 1153Trump Job Strongly Approve 3% (14) 89% (370) 8% (31) 415Trump Job Somewhat Approve 6% (22) 72% (257) 22% (80) 359Trump Job Somewhat Disapprove 29% (66) 37% (84) 34% (76) 226Trump Job Strongly Disapprove 69% (642) 10% (95) 20% (190) 927
Continued on next page
Page 64
64
Morning ConsultTable POL3_8
Table POL3_8: Who do you trust more to handle each of the following issues?National security
Demographic Democrats in CongressRepublicans in
CongressDon’t know / No
opinion Total N
Registered Voters 38% (750) 41% (815) 21% (423) 1988Favorable of Trump 5% (38) 80% (633) 15% (116) 787Unfavorable of Trump 62% (701) 15% (174) 23% (256) 1132Very Favorable of Trump 3% (15) 89% (410) 8% (38) 462Somewhat Favorable of Trump 7% (24) 69% (223) 24% (79) 325Somewhat Unfavorable of Trump 20% (37) 46% (83) 34% (62) 182Very Unfavorable of Trump 70% (665) 10% (91) 20% (194) 950#1 Issue: Economy 32% (223) 47% (326) 20% (138) 688#1 Issue: Security 14% (35) 74% (187) 13% (32) 254#1 Issue: Health Care 52% (174) 28% (93) 20% (69) 335#1 Issue: Medicare / Social Security 41% (115) 33% (95) 26% (73) 283#1 Issue: Women’s Issues 59% (51) 24% (20) 17% (15) 86#1 Issue: Education 40% (43) 31% (33) 29% (31) 107#1 Issue: Energy 52% (41) 23% (18) 26% (20) 79#1 Issue: Other 43% (68) 28% (43) 29% (46) 1572018 House Vote: Democrat 73% (564) 11% (88) 15% (116) 7672018 House Vote: Republican 5% (30) 85% (533) 10% (65) 6292018 House Vote: Someone else 18% (13) 27% (20) 56% (41) 732016 Vote: Hillary Clinton 75% (527) 10% (69) 15% (104) 7002016 Vote: Donald Trump 5% (34) 83% (561) 12% (81) 6752016 Vote: Other 27% (39) 31% (44) 43% (62) 1442016 Vote: Didn’t Vote 32% (147) 30% (141) 38% (177) 466Voted in 2014: Yes 40% (527) 44% (580) 16% (214) 1322Voted in 2014: No 33% (222) 35% (235) 31% (209) 6662012 Vote: Barack Obama 62% (530) 20% (169) 18% (154) 8532012 Vote: Mitt Romney 6% (31) 82% (411) 12% (58) 5012012 Vote: Other 11% (9) 49% (41) 40% (33) 842012 Vote: Didn’t Vote 32% (178) 35% (193) 32% (178) 550
Continued on next page
Page 65
National Tracking Poll #2006102, June, 2020
65
Table POL3_8
Table POL3_8: Who do you trust more to handle each of the following issues?National security
Demographic Democrats in CongressRepublicans in
CongressDon’t know / No
opinion Total N
Registered Voters 38% (750) 41% (815) 21% (423) 19884-Region: Northeast 41% (147) 38% (136) 20% (72) 3554-Region: Midwest 35% (162) 39% (180) 25% (115) 4574-Region: South 33% (245) 47% (348) 20% (149) 7424-Region: West 45% (196) 35% (151) 20% (87) 434Party: Democrat/Leans Democrat 73% (666) 11% (99) 16% (146) 911Party: Republican/Leans Republican 5% (34) 82% (610) 13% (97) 741Parents 33% (287) 46% (402) 20% (175) 864Note: Row proportions may total to larger than one-hundred percent due to rounding. For more information visit MorningConsultIntelligence.com.
Page 66
66
Morning ConsultTable POL3_9
Table POL3_9: Who do you trust more to handle each of the following issues?Sexual harassment and misconduct in the workplace
Demographic Democrats in CongressRepublicans in
CongressDon’t know / No
opinion Total N
Registered Voters 44% (875) 24% (485) 32% (628) 1988Gender: Male 43% (402) 28% (257) 29% (272) 930Gender: Female 45% (473) 22% (229) 34% (356) 1058Age: 18-34 53% (266) 13% (64) 34% (169) 499Age: 35-44 42% (126) 26% (78) 32% (98) 302Age: 45-64 41% (294) 27% (195) 33% (236) 724Age: 65+ 41% (189) 32% (148) 27% (125) 463GenZers: 1997-2012 55% (122) 11% (24) 35% (77) 224Millennials: 1981-1996 49% (206) 19% (79) 32% (135) 419GenXers: 1965-1980 41% (209) 27% (138) 32% (165) 511Baby Boomers: 1946-1964 42% (317) 27% (207) 31% (235) 760PID: Dem (no lean) 80% (605) 3% (25) 17% (128) 757PID: Ind (no lean) 33% (210) 17% (105) 51% (323) 638PID: Rep (no lean) 10% (60) 60% (355) 30% (177) 593PID/Gender: DemMen 79% (259) 5% (16) 16% (54) 329PID/Gender: DemWomen 81% (346) 2% (9) 17% (74) 429PID/Gender: Ind Men 33% (99) 20% (60) 46% (137) 296PID/Gender: Ind Women 32% (110) 13% (46) 54% (186) 342PID/Gender: Rep Men 14% (43) 59% (181) 27% (81) 306PID/Gender: Rep Women 6% (17) 61% (174) 33% (96) 287Ideo: Liberal (1-3) 78% (475) 6% (34) 16% (100) 609Ideo: Moderate (4) 45% (236) 13% (70) 41% (216) 522Ideo: Conservative (5-7) 16% (107) 54% (367) 30% (205) 679Educ: < College 39% (488) 26% (322) 35% (440) 1250Educ: Bachelors degree 52% (246) 21% (98) 27% (126) 470Educ: Post-grad 53% (141) 24% (65) 23% (61) 267Income: Under 50k 42% (415) 23% (234) 35% (349) 998Income: 50k-100k 46% (301) 27% (176) 28% (184) 660Income: 100k+ 48% (159) 23% (76) 29% (94) 329Ethnicity: White 41% (652) 29% (459) 31% (497) 1608Ethnicity: Hispanic 53% (103) 10% (19) 37% (70) 193
Continued on next page
Page 67
National Tracking Poll #2006102, June, 2020
67
Table POL3_9
Table POL3_9: Who do you trust more to handle each of the following issues?Sexual harassment and misconduct in the workplace
Demographic Democrats in CongressRepublicans in
CongressDon’t know / No
opinion Total N
Registered Voters 44% (875) 24% (485) 32% (628) 1988Ethnicity: Afr. Am. 63% (159) 4% (10) 33% (82) 252Ethnicity: Other 50% (63) 13% (16) 38% (48) 128All Christian 39% (370) 32% (299) 29% (272) 941All Non-Christian 60% (59) 15% (15) 24% (24) 97Atheist 67% (85) 9% (11) 24% (31) 128Agnostic/Nothing in particular 48% (230) 15% (72) 37% (177) 478Something Else 38% (131) 26% (88) 36% (124) 344Religious Non-Protestant/Catholic 55% (66) 17% (20) 28% (34) 120Evangelical 29% (147) 40% (203) 31% (156) 505Non-Evangelical 45% (339) 24% (178) 31% (229) 746Community: Urban 50% (246) 19% (92) 31% (152) 490Community: Suburban 47% (458) 22% (215) 31% (307) 981Community: Rural 33% (170) 34% (178) 33% (169) 517Employ: Private Sector 45% (283) 26% (162) 29% (185) 631Employ: Government 54% (74) 19% (26) 27% (36) 136Employ: Self-Employed 53% (69) 21% (27) 27% (35) 130Employ: Homemaker 35% (40) 30% (34) 35% (41) 115Employ: Retired 39% (192) 32% (157) 29% (143) 492Employ: Unemployed 45% (102) 16% (36) 40% (91) 229Employ: Other 37% (56) 21% (31) 42% (64) 152Military HH: Yes 39% (118) 35% (106) 27% (82) 306Military HH: No 45% (757) 23% (379) 32% (546) 1682RD/WT: Right Direction 15% (83) 52% (295) 33% (189) 567RD/WT: Wrong Track 56% (792) 13% (190) 31% (438) 1421Trump Job Approve 10% (76) 56% (436) 34% (261) 774Trump Job Disapprove 69% (793) 4% (48) 27% (313) 1153Trump Job Strongly Approve 4% (19) 74% (307) 22% (90) 415Trump Job Somewhat Approve 16% (58) 36% (129) 48% (172) 359Trump Job Somewhat Disapprove 45% (101) 11% (25) 45% (101) 226Trump Job Strongly Disapprove 75% (692) 3% (23) 23% (212) 927
Continued on next page
Page 68
68
Morning ConsultTable POL3_9
Table POL3_9: Who do you trust more to handle each of the following issues?Sexual harassment and misconduct in the workplace
Demographic Democrats in CongressRepublicans in
CongressDon’t know / No
opinion Total N
Registered Voters 44% (875) 24% (485) 32% (628) 1988Favorable of Trump 9% (73) 57% (445) 34% (269) 787Unfavorable of Trump 70% (792) 3% (38) 27% (302) 1132Very Favorable of Trump 4% (21) 71% (330) 24% (112) 462Somewhat Favorable of Trump 16% (52) 35% (115) 49% (158) 325Somewhat Unfavorable of Trump 40% (73) 9% (17) 50% (92) 182Very Unfavorable of Trump 76% (719) 2% (21) 22% (211) 950#1 Issue: Economy 38% (264) 27% (188) 34% (236) 688#1 Issue: Security 17% (42) 53% (134) 30% (77) 254#1 Issue: Health Care 62% (208) 14% (46) 24% (82) 335#1 Issue: Medicare / Social Security 44% (124) 22% (63) 34% (96) 283#1 Issue: Women’s Issues 71% (61) 10% (8) 19% (16) 86#1 Issue: Education 45% (48) 17% (19) 37% (40) 107#1 Issue: Energy 71% (56) 4% (3) 25% (20) 79#1 Issue: Other 46% (72) 15% (24) 39% (61) 1572018 House Vote: Democrat 78% (599) 4% (32) 18% (136) 7672018 House Vote: Republican 10% (65) 59% (371) 31% (192) 6292018 House Vote: Someone else 22% (16) 11% (8) 67% (49) 732016 Vote: Hillary Clinton 78% (549) 3% (23) 18% (128) 7002016 Vote: Donald Trump 11% (74) 57% (383) 32% (218) 6752016 Vote: Other 39% (57) 7% (10) 54% (78) 1442016 Vote: Didn’t Vote 42% (194) 15% (69) 44% (204) 466Voted in 2014: Yes 45% (595) 28% (368) 27% (359) 1322Voted in 2014: No 42% (279) 18% (118) 40% (269) 6662012 Vote: Barack Obama 66% (564) 9% (74) 25% (215) 8532012 Vote: Mitt Romney 13% (65) 57% (286) 30% (149) 5012012 Vote: Other 20% (17) 26% (22) 54% (45) 842012 Vote: Didn’t Vote 41% (228) 19% (103) 40% (219) 550
Continued on next page
Page 69
National Tracking Poll #2006102, June, 2020
69
Table POL3_9
Table POL3_9: Who do you trust more to handle each of the following issues?Sexual harassment and misconduct in the workplace
Demographic Democrats in CongressRepublicans in
CongressDon’t know / No
opinion Total N
Registered Voters 44% (875) 24% (485) 32% (628) 19884-Region: Northeast 48% (170) 22% (79) 30% (106) 3554-Region: Midwest 43% (194) 25% (113) 33% (149) 4574-Region: South 40% (295) 28% (209) 32% (238) 7424-Region: West 50% (216) 19% (83) 31% (135) 434Party: Democrat/Leans Democrat 78% (711) 3% (29) 19% (170) 911Party: Republican/Leans Republican 11% (79) 56% (417) 33% (245) 741Parents 38% (330) 29% (250) 33% (284) 864Note: Row proportions may total to larger than one-hundred percent due to rounding. For more information visit MorningConsultIntelligence.com.
Page 70
70
Morning ConsultTable POL3_10
Table POL3_10: Who do you trust more to handle each of the following issues?Gun policy
Demographic Democrats in CongressRepublicans in
CongressDon’t know / No
opinion Total N
Registered Voters 41% (815) 38% (760) 21% (413) 1988Gender: Male 38% (358) 44% (409) 18% (164) 930Gender: Female 43% (457) 33% (351) 24% (250) 1058Age: 18-34 49% (242) 28% (140) 24% (118) 499Age: 35-44 41% (124) 39% (119) 20% (60) 302Age: 45-64 39% (279) 41% (295) 21% (150) 724Age: 65+ 37% (170) 45% (207) 19% (86) 463GenZers: 1997-2012 47% (104) 27% (60) 27% (60) 224Millennials: 1981-1996 48% (199) 32% (134) 20% (86) 419GenXers: 1965-1980 39% (198) 41% (211) 20% (103) 511Baby Boomers: 1946-1964 39% (295) 41% (315) 20% (149) 760PID: Dem (no lean) 79% (598) 9% (65) 13% (95) 757PID: Ind (no lean) 29% (184) 35% (222) 36% (231) 638PID: Rep (no lean) 6% (33) 80% (473) 15% (87) 593PID/Gender: DemMen 75% (248) 12% (40) 12% (41) 329PID/Gender: DemWomen 82% (350) 6% (25) 13% (54) 429PID/Gender: Ind Men 29% (85) 41% (120) 31% (90) 296PID/Gender: Ind Women 29% (99) 30% (102) 41% (141) 342PID/Gender: Rep Men 8% (25) 81% (248) 11% (33) 306PID/Gender: Rep Women 3% (9) 78% (224) 19% (54) 287Ideo: Liberal (1-3) 77% (471) 10% (59) 13% (78) 609Ideo: Moderate (4) 41% (213) 30% (157) 29% (153) 522Ideo: Conservative (5-7) 12% (84) 75% (512) 12% (83) 679Educ: < College 36% (447) 40% (503) 24% (301) 1250Educ: Bachelors degree 49% (230) 33% (156) 18% (83) 470Educ: Post-grad 51% (138) 38% (101) 11% (29) 267Income: Under 50k 39% (394) 36% (357) 25% (247) 998Income: 50k-100k 41% (269) 41% (273) 18% (119) 660Income: 100k+ 46% (151) 39% (130) 15% (48) 329Ethnicity: White 37% (592) 43% (690) 20% (326) 1608Ethnicity: Hispanic 47% (91) 26% (51) 27% (51) 193
Continued on next page
Page 71
National Tracking Poll #2006102, June, 2020
71
Table POL3_10
Table POL3_10: Who do you trust more to handle each of the following issues?Gun policy
Demographic Democrats in CongressRepublicans in
CongressDon’t know / No
opinion Total N
Registered Voters 41% (815) 38% (760) 21% (413) 1988Ethnicity: Afr. Am. 63% (160) 17% (43) 20% (50) 252Ethnicity: Other 49% (63) 22% (28) 29% (37) 128All Christian 34% (324) 47% (438) 19% (179) 941All Non-Christian 63% (61) 24% (23) 14% (13) 97Atheist 62% (80) 23% (29) 15% (19) 128Agnostic/Nothing in particular 47% (223) 29% (139) 24% (116) 478Something Else 37% (127) 38% (131) 25% (86) 344Religious Non-Protestant/Catholic 56% (67) 25% (30) 19% (23) 120Evangelical 27% (138) 54% (274) 19% (94) 505Non-Evangelical 41% (304) 38% (285) 21% (156) 746Community: Urban 49% (239) 30% (147) 21% (105) 490Community: Suburban 43% (426) 36% (357) 20% (198) 981Community: Rural 29% (150) 50% (256) 21% (111) 517Employ: Private Sector 41% (258) 40% (254) 19% (118) 631Employ: Government 53% (71) 28% (38) 19% (26) 136Employ: Self-Employed 44% (57) 37% (48) 20% (26) 130Employ: Homemaker 31% (36) 45% (52) 23% (27) 115Employ: Retired 36% (179) 46% (225) 18% (88) 492Employ: Unemployed 43% (98) 29% (65) 29% (66) 229Employ: Other 39% (59) 33% (50) 28% (42) 152Military HH: Yes 34% (104) 48% (147) 18% (55) 306Military HH: No 42% (710) 36% (613) 21% (359) 1682RD/WT: Right Direction 13% (76) 67% (381) 19% (110) 567RD/WT: Wrong Track 52% (738) 27% (379) 21% (303) 1421Trump Job Approve 6% (43) 78% (603) 17% (128) 774Trump Job Disapprove 66% (764) 13% (152) 21% (237) 1153Trump Job Strongly Approve 3% (11) 86% (358) 11% (45) 415Trump Job Somewhat Approve 9% (32) 68% (245) 23% (82) 359Trump Job Somewhat Disapprove 38% (86) 30% (69) 32% (72) 226Trump Job Strongly Disapprove 73% (679) 9% (83) 18% (166) 927
Continued on next page
Page 72
72
Morning ConsultTable POL3_10
Table POL3_10: Who do you trust more to handle each of the following issues?Gun policy
Demographic Democrats in CongressRepublicans in
CongressDon’t know / No
opinion Total N
Registered Voters 41% (815) 38% (760) 21% (413) 1988Favorable of Trump 6% (46) 77% (608) 17% (134) 787Unfavorable of Trump 67% (756) 13% (144) 21% (232) 1132Very Favorable of Trump 4% (16) 86% (398) 10% (48) 462Somewhat Favorable of Trump 9% (29) 64% (209) 27% (86) 325Somewhat Unfavorable of Trump 34% (62) 33% (60) 33% (60) 182Very Unfavorable of Trump 73% (694) 9% (84) 18% (173) 950#1 Issue: Economy 35% (241) 45% (308) 20% (139) 688#1 Issue: Security 15% (37) 69% (174) 17% (43) 254#1 Issue: Health Care 56% (188) 25% (83) 19% (64) 335#1 Issue: Medicare / Social Security 43% (121) 32% (90) 25% (72) 283#1 Issue: Women’s Issues 67% (58) 19% (16) 14% (12) 86#1 Issue: Education 44% (47) 27% (29) 29% (31) 107#1 Issue: Energy 66% (52) 17% (14) 17% (13) 79#1 Issue: Other 45% (71) 30% (46) 25% (39) 1572018 House Vote: Democrat 77% (588) 10% (77) 13% (103) 7672018 House Vote: Republican 7% (45) 82% (513) 11% (71) 6292018 House Vote: Someone else 15% (11) 34% (25) 51% (37) 732016 Vote: Hillary Clinton 79% (551) 9% (61) 13% (88) 7002016 Vote: Donald Trump 8% (52) 79% (531) 14% (92) 6752016 Vote: Other 29% (42) 30% (43) 42% (60) 1442016 Vote: Didn’t Vote 36% (169) 27% (125) 37% (172) 466Voted in 2014: Yes 43% (572) 42% (552) 15% (198) 1322Voted in 2014: No 36% (243) 31% (208) 32% (216) 6662012 Vote: Barack Obama 66% (565) 18% (157) 15% (131) 8532012 Vote: Mitt Romney 9% (43) 77% (384) 15% (74) 5012012 Vote: Other 16% (13) 48% (40) 36% (30) 842012 Vote: Didn’t Vote 35% (194) 32% (178) 32% (177) 550
Continued on next page
Page 73
National Tracking Poll #2006102, June, 2020
73
Table POL3_10
Table POL3_10: Who do you trust more to handle each of the following issues?Gun policy
Demographic Democrats in CongressRepublicans in
CongressDon’t know / No
opinion Total N
Registered Voters 41% (815) 38% (760) 21% (413) 19884-Region: Northeast 47% (167) 33% (119) 20% (69) 3554-Region: Midwest 39% (179) 37% (167) 24% (111) 4574-Region: South 36% (267) 44% (328) 20% (147) 7424-Region: West 47% (202) 34% (146) 20% (86) 434Party: Democrat/Leans Democrat 77% (704) 9% (86) 13% (122) 911Party: Republican/Leans Republican 6% (47) 78% (581) 15% (113) 741Parents 36% (314) 44% (380) 20% (170) 864Note: Row proportions may total to larger than one-hundred percent due to rounding. For more information visit MorningConsultIntelligence.com.
Page 74
74
Morning ConsultTable POL3_11
Table POL3_11: Who do you trust more to handle each of the following issues?Protecting Medicare and Social Security
Demographic Democrats in CongressRepublicans in
CongressDon’t know / No
opinion Total N
Registered Voters 49% (967) 29% (586) 22% (435) 1988Gender: Male 49% (452) 33% (304) 19% (175) 930Gender: Female 49% (515) 27% (282) 25% (260) 1058Age: 18-34 57% (287) 17% (85) 26% (128) 499Age: 35-44 49% (148) 28% (85) 23% (69) 302Age: 45-64 46% (331) 34% (245) 21% (149) 724Age: 65+ 44% (202) 37% (171) 19% (89) 463GenZers: 1997-2012 57% (127) 17% (38) 27% (59) 224Millennials: 1981-1996 55% (229) 21% (89) 24% (102) 419GenXers: 1965-1980 47% (242) 32% (165) 21% (105) 511Baby Boomers: 1946-1964 46% (348) 34% (256) 21% (156) 760PID: Dem (no lean) 86% (652) 3% (21) 11% (84) 757PID: Ind (no lean) 39% (248) 22% (141) 39% (248) 638PID: Rep (no lean) 11% (67) 71% (423) 17% (103) 593PID/Gender: DemMen 86% (284) 3% (9) 11% (36) 329PID/Gender: DemWomen 86% (369) 3% (12) 11% (48) 429PID/Gender: Ind Men 40% (119) 25% (74) 35% (103) 296PID/Gender: Ind Women 38% (130) 20% (68) 42% (145) 342PID/Gender: Rep Men 16% (50) 72% (221) 12% (35) 306PID/Gender: Rep Women 6% (17) 71% (202) 23% (67) 287Ideo: Liberal (1-3) 84% (511) 6% (39) 10% (59) 609Ideo: Moderate (4) 52% (271) 19% (97) 29% (154) 522Ideo: Conservative (5-7) 19% (129) 63% (429) 18% (122) 679Educ: < College 44% (544) 31% (389) 25% (318) 1250Educ: Bachelors degree 57% (267) 26% (123) 17% (81) 470Educ: Post-grad 59% (157) 28% (74) 14% (36) 267Income: Under 50k 47% (466) 28% (282) 25% (250) 998Income: 50k-100k 49% (326) 31% (207) 19% (128) 660Income: 100k+ 53% (175) 30% (97) 17% (57) 329Ethnicity: White 45% (720) 34% (544) 21% (344) 1608Ethnicity: Hispanic 58% (111) 15% (29) 28% (53) 193
Continued on next page
Page 75
National Tracking Poll #2006102, June, 2020
75
Table POL3_11
Table POL3_11: Who do you trust more to handle each of the following issues?Protecting Medicare and Social Security
Demographic Democrats in CongressRepublicans in
CongressDon’t know / No
opinion Total N
Registered Voters 49% (967) 29% (586) 22% (435) 1988Ethnicity: Afr. Am. 72% (181) 7% (17) 21% (54) 252Ethnicity: Other 52% (66) 19% (25) 29% (37) 128All Christian 43% (404) 37% (349) 20% (188) 941All Non-Christian 68% (66) 20% (19) 12% (12) 97Atheist 71% (91) 14% (18) 15% (19) 128Agnostic/Nothing in particular 54% (258) 20% (94) 26% (126) 478Something Else 43% (148) 31% (105) 26% (90) 344Religious Non-Protestant/Catholic 62% (74) 22% (26) 16% (20) 120Evangelical 35% (178) 44% (222) 21% (105) 505Non-Evangelical 48% (362) 30% (221) 22% (163) 746Community: Urban 58% (283) 23% (114) 19% (93) 490Community: Suburban 50% (494) 28% (273) 22% (214) 981Community: Rural 37% (191) 39% (199) 25% (127) 517Employ: Private Sector 52% (328) 29% (184) 19% (119) 631Employ: Government 59% (80) 23% (32) 18% (24) 136Employ: Self-Employed 54% (70) 29% (37) 18% (23) 130Employ: Homemaker 35% (40) 36% (41) 30% (34) 115Employ: Retired 44% (217) 36% (179) 19% (96) 492Employ: Unemployed 49% (111) 22% (51) 29% (66) 229Employ: Other 41% (62) 29% (44) 30% (46) 152Military HH: Yes 42% (129) 37% (114) 21% (63) 306Military HH: No 50% (839) 28% (472) 22% (371) 1682RD/WT: Right Direction 17% (97) 60% (338) 23% (132) 567RD/WT: Wrong Track 61% (870) 17% (248) 21% (302) 1421Trump Job Approve 12% (97) 67% (518) 21% (159) 774Trump Job Disapprove 75% (865) 5% (63) 20% (226) 1153Trump Job Strongly Approve 5% (22) 84% (347) 11% (45) 415Trump Job Somewhat Approve 21% (74) 48% (171) 32% (114) 359Trump Job Somewhat Disapprove 53% (119) 12% (27) 35% (80) 226Trump Job Strongly Disapprove 80% (746) 4% (35) 16% (146) 927
Continued on next page
Page 76
76
Morning ConsultTable POL3_11
Table POL3_11: Who do you trust more to handle each of the following issues?Protecting Medicare and Social Security
Demographic Democrats in CongressRepublicans in
CongressDon’t know / No
opinion Total N
Registered Voters 49% (967) 29% (586) 22% (435) 1988Favorable of Trump 13% (100) 66% (523) 21% (164) 787Unfavorable of Trump 75% (853) 5% (59) 19% (220) 1132Very Favorable of Trump 7% (34) 81% (374) 12% (55) 462Somewhat Favorable of Trump 20% (66) 46% (149) 34% (109) 325Somewhat Unfavorable of Trump 46% (84) 16% (28) 38% (70) 182Very Unfavorable of Trump 81% (769) 3% (31) 16% (150) 950#1 Issue: Economy 46% (319) 33% (225) 21% (144) 688#1 Issue: Security 22% (55) 60% (152) 18% (47) 254#1 Issue: Health Care 64% (214) 17% (57) 19% (64) 335#1 Issue: Medicare / Social Security 50% (140) 25% (70) 26% (73) 283#1 Issue: Women’s Issues 66% (57) 12% (11) 21% (18) 86#1 Issue: Education 49% (52) 24% (26) 27% (29) 107#1 Issue: Energy 63% (50) 14% (11) 23% (18) 79#1 Issue: Other 51% (80) 22% (34) 27% (42) 1572018 House Vote: Democrat 85% (653) 4% (30) 11% (85) 7672018 House Vote: Republican 14% (88) 70% (443) 16% (98) 6292018 House Vote: Someone else 28% (21) 19% (14) 53% (39) 732016 Vote: Hillary Clinton 85% (594) 4% (28) 11% (78) 7002016 Vote: Donald Trump 15% (102) 66% (447) 19% (126) 6752016 Vote: Other 45% (65) 13% (19) 42% (60) 1442016 Vote: Didn’t Vote 44% (204) 20% (92) 37% (170) 466Voted in 2014: Yes 50% (666) 33% (438) 17% (218) 1322Voted in 2014: No 45% (302) 22% (148) 32% (216) 6662012 Vote: Barack Obama 74% (633) 10% (86) 16% (134) 8532012 Vote: Mitt Romney 14% (72) 67% (338) 18% (91) 5012012 Vote: Other 20% (17) 36% (30) 44% (37) 842012 Vote: Didn’t Vote 44% (244) 24% (132) 32% (173) 550
Continued on next page
Page 77
National Tracking Poll #2006102, June, 2020
77
Table POL3_11
Table POL3_11: Who do you trust more to handle each of the following issues?Protecting Medicare and Social Security
Demographic Democrats in CongressRepublicans in
CongressDon’t know / No
opinion Total N
Registered Voters 49% (967) 29% (586) 22% (435) 19884-Region: Northeast 53% (188) 27% (95) 20% (72) 3554-Region: Midwest 47% (215) 29% (132) 24% (109) 4574-Region: South 45% (334) 33% (244) 22% (165) 7424-Region: West 53% (230) 27% (115) 20% (89) 434Party: Democrat/Leans Democrat 85% (777) 3% (27) 12% (107) 911Party: Republican/Leans Republican 12% (89) 68% (507) 20% (145) 741Parents 43% (372) 35% (302) 22% (190) 864Note: Row proportions may total to larger than one-hundred percent due to rounding. For more information visit MorningConsultIntelligence.com.
Page 78
78
Morning ConsultTable POL3_12
Table POL3_12: Who do you trust more to handle each of the following issues?Coronavirus
Demographic Democrats in CongressRepublicans in
CongressDon’t know / No
opinion Total N
Registered Voters 43% (847) 30% (605) 27% (536) 1988Gender: Male 42% (393) 35% (325) 23% (212) 930Gender: Female 43% (454) 26% (279) 31% (324) 1058Age: 18-34 50% (250) 19% (96) 31% (153) 499Age: 35-44 43% (130) 29% (87) 28% (85) 302Age: 45-64 39% (283) 33% (241) 28% (200) 724Age: 65+ 40% (184) 39% (180) 21% (98) 463GenZers: 1997-2012 49% (110) 16% (37) 34% (76) 224Millennials: 1981-1996 49% (207) 25% (104) 26% (109) 419GenXers: 1965-1980 40% (205) 32% (163) 28% (143) 511Baby Boomers: 1946-1964 40% (305) 34% (261) 25% (193) 760PID: Dem (no lean) 82% (620) 4% (30) 14% (108) 757PID: Ind (no lean) 31% (197) 23% (149) 46% (292) 638PID: Rep (no lean) 5% (30) 72% (426) 23% (137) 593PID/Gender: DemMen 84% (275) 5% (16) 12% (38) 329PID/Gender: DemWomen 81% (346) 3% (14) 16% (69) 429PID/Gender: Ind Men 33% (96) 28% (83) 40% (117) 296PID/Gender: Ind Women 30% (101) 19% (66) 51% (175) 342PID/Gender: Rep Men 7% (22) 74% (227) 19% (57) 306PID/Gender: Rep Women 3% (7) 70% (200) 28% (80) 287Ideo: Liberal (1-3) 79% (482) 6% (39) 14% (87) 609Ideo: Moderate (4) 45% (236) 18% (92) 37% (194) 522Ideo: Conservative (5-7) 12% (82) 66% (450) 22% (148) 679Educ: < College 37% (461) 32% (402) 31% (387) 1250Educ: Bachelors degree 53% (249) 27% (125) 20% (96) 470Educ: Post-grad 51% (138) 29% (77) 20% (53) 267Income: Under 50k 41% (408) 29% (292) 30% (298) 998Income: 50k-100k 43% (283) 34% (224) 23% (153) 660Income: 100k+ 47% (156) 27% (88) 26% (85) 329Ethnicity: White 39% (621) 35% (555) 27% (431) 1608Ethnicity: Hispanic 48% (93) 19% (36) 33% (63) 193
Continued on next page
Page 79
National Tracking Poll #2006102, June, 2020
79
Table POL3_12
Table POL3_12: Who do you trust more to handle each of the following issues?Coronavirus
Demographic Democrats in CongressRepublicans in
CongressDon’t know / No
opinion Total N
Registered Voters 43% (847) 30% (605) 27% (536) 1988Ethnicity: Afr. Am. 65% (163) 9% (23) 26% (66) 252Ethnicity: Other 49% (63) 21% (27) 30% (39) 128All Christian 37% (349) 38% (358) 25% (234) 941All Non-Christian 64% (63) 23% (22) 13% (13) 97Atheist 65% (83) 15% (19) 20% (26) 128Agnostic/Nothing in particular 47% (224) 21% (100) 32% (154) 478Something Else 37% (129) 30% (105) 32% (110) 344Religious Non-Protestant/Catholic 57% (68) 24% (29) 19% (23) 120Evangelical 29% (146) 45% (227) 26% (132) 505Non-Evangelical 43% (322) 30% (225) 27% (199) 746Community: Urban 50% (246) 24% (120) 25% (124) 490Community: Suburban 45% (446) 28% (276) 26% (259) 981Community: Rural 30% (155) 40% (209) 30% (154) 517Employ: Private Sector 44% (276) 32% (202) 24% (153) 631Employ: Government 50% (68) 20% (27) 30% (40) 136Employ: Self-Employed 51% (66) 27% (35) 23% (29) 130Employ: Homemaker 31% (36) 33% (38) 36% (42) 115Employ: Retired 39% (191) 39% (193) 22% (108) 492Employ: Unemployed 43% (99) 21% (48) 36% (83) 229Employ: Other 39% (59) 30% (46) 31% (48) 152Military HH: Yes 37% (114) 40% (122) 23% (70) 306Military HH: No 44% (734) 29% (483) 28% (466) 1682RD/WT: Right Direction 12% (68) 61% (348) 27% (152) 567RD/WT: Wrong Track 55% (779) 18% (257) 27% (384) 1421Trump Job Approve 5% (36) 69% (536) 26% (202) 774Trump Job Disapprove 70% (807) 6% (68) 24% (278) 1153Trump Job Strongly Approve 4% (15) 82% (341) 14% (59) 415Trump Job Somewhat Approve 6% (22) 54% (194) 40% (142) 359Trump Job Somewhat Disapprove 39% (88) 14% (32) 47% (106) 226Trump Job Strongly Disapprove 78% (719) 4% (36) 19% (172) 927
Continued on next page
Page 80
80
Morning ConsultTable POL3_12
Table POL3_12: Who do you trust more to handle each of the following issues?Coronavirus
Demographic Democrats in CongressRepublicans in
CongressDon’t know / No
opinion Total N
Registered Voters 43% (847) 30% (605) 27% (536) 1988Favorable of Trump 5% (37) 69% (546) 26% (204) 787Unfavorable of Trump 71% (800) 5% (57) 24% (275) 1132Very Favorable of Trump 2% (11) 83% (384) 15% (68) 462Somewhat Favorable of Trump 8% (26) 50% (162) 42% (136) 325Somewhat Unfavorable of Trump 33% (60) 15% (28) 51% (93) 182Very Unfavorable of Trump 78% (740) 3% (29) 19% (181) 950#1 Issue: Economy 37% (252) 36% (249) 27% (187) 688#1 Issue: Security 15% (38) 60% (153) 25% (63) 254#1 Issue: Health Care 60% (202) 17% (57) 23% (76) 335#1 Issue: Medicare / Social Security 44% (126) 28% (79) 28% (79) 283#1 Issue: Women’s Issues 67% (58) 11% (9) 22% (19) 86#1 Issue: Education 47% (50) 23% (25) 30% (32) 107#1 Issue: Energy 64% (50) 9% (7) 28% (22) 79#1 Issue: Other 46% (71) 17% (27) 37% (59) 1572018 House Vote: Democrat 81% (620) 5% (35) 15% (113) 7672018 House Vote: Republican 7% (45) 71% (444) 22% (141) 6292018 House Vote: Someone else 22% (16) 19% (14) 60% (44) 732016 Vote: Hillary Clinton 80% (561) 5% (32) 15% (108) 7002016 Vote: Donald Trump 7% (48) 68% (461) 25% (167) 6752016 Vote: Other 38% (55) 13% (18) 49% (71) 1442016 Vote: Didn’t Vote 39% (182) 20% (94) 41% (190) 466Voted in 2014: Yes 44% (584) 34% (451) 22% (287) 1322Voted in 2014: No 39% (263) 23% (154) 37% (249) 6662012 Vote: Barack Obama 68% (577) 12% (100) 21% (176) 8532012 Vote: Mitt Romney 8% (39) 68% (340) 24% (122) 5012012 Vote: Other 17% (14) 37% (31) 46% (38) 842012 Vote: Didn’t Vote 39% (215) 24% (134) 36% (200) 550
Continued on next page
Page 81
National Tracking Poll #2006102, June, 2020
81
Table POL3_12
Table POL3_12: Who do you trust more to handle each of the following issues?Coronavirus
Demographic Democrats in CongressRepublicans in
CongressDon’t know / No
opinion Total N
Registered Voters 43% (847) 30% (605) 27% (536) 19884-Region: Northeast 48% (169) 27% (97) 25% (89) 3554-Region: Midwest 42% (191) 30% (137) 28% (129) 4574-Region: South 37% (277) 35% (259) 28% (206) 7424-Region: West 49% (211) 26% (111) 26% (112) 434Party: Democrat/Leans Democrat 81% (735) 4% (33) 16% (143) 911Party: Republican/Leans Republican 5% (40) 70% (515) 25% (186) 741Parents 38% (329) 34% (290) 28% (244) 864Note: Row proportions may total to larger than one-hundred percent due to rounding. For more information visit MorningConsultIntelligence.com.
Page 82
82
Morning ConsultTable POL4_1
Table POL4_1: How important of a priority should each of the following be for Congress?Passing a healthcare reform bill
Demographic A top priority
An important,but lowerpriority
Not tooimportant apriority
Should not bedone
Don’t know /No opinion Total N
Registered Voters 47% (936) 30% (599) 11% (209) 3% (66) 9% (178) 1988Gender: Male 43% (404) 31% (291) 13% (121) 3% (31) 9% (84) 930Gender: Female 50% (533) 29% (308) 8% (88) 3% (34) 9% (95) 1058Age: 18-34 44% (220) 26% (131) 12% (58) 3% (14) 15% (75) 499Age: 35-44 45% (135) 32% (95) 10% (31) 3% (10) 10% (30) 302Age: 45-64 50% (364) 30% (214) 9% (69) 4% (28) 7% (49) 724Age: 65+ 47% (217) 34% (158) 11% (51) 3% (13) 5% (23) 463GenZers: 1997-2012 39% (88) 30% (67) 10% (22) 3% (8) 17% (39) 224Millennials: 1981-1996 45% (189) 27% (113) 12% (50) 3% (13) 13% (54) 419GenXers: 1965-1980 49% (250) 31% (160) 10% (53) 3% (17) 6% (32) 511Baby Boomers: 1946-1964 49% (375) 31% (235) 10% (76) 3% (22) 7% (52) 760PID: Dem (no lean) 59% (443) 27% (204) 7% (57) 2% (17) 5% (37) 757PID: Ind (no lean) 40% (255) 31% (195) 12% (77) 4% (27) 13% (83) 638PID: Rep (no lean) 40% (238) 34% (200) 13% (75) 4% (22) 10% (58) 593PID/Gender: DemMen 53% (176) 29% (95) 9% (31) 2% (8) 6% (19) 329PID/Gender: DemWomen 62% (268) 25% (109) 6% (25) 2% (9) 4% (18) 429PID/Gender: Ind Men 36% (106) 32% (93) 14% (42) 5% (14) 14% (41) 296PID/Gender: Ind Women 44% (150) 30% (102) 10% (35) 4% (13) 12% (42) 342PID/Gender: Rep Men 40% (123) 33% (102) 16% (48) 3% (10) 8% (23) 306PID/Gender: Rep Women 40% (115) 34% (98) 9% (27) 4% (12) 12% (35) 287Ideo: Liberal (1-3) 59% (359) 27% (163) 8% (49) 3% (17) 3% (21) 609Ideo: Moderate (4) 46% (240) 29% (150) 13% (66) 3% (15) 10% (51) 522Ideo: Conservative (5-7) 39% (267) 37% (250) 12% (82) 5% (33) 7% (47) 679Educ: < College 47% (593) 29% (360) 10% (120) 3% (36) 11% (141) 1250Educ: Bachelors degree 45% (211) 33% (153) 12% (58) 4% (17) 7% (31) 470Educ: Post-grad 50% (133) 32% (85) 12% (31) 4% (12) 2% (6) 267Income: Under 50k 48% (480) 28% (279) 9% (93) 3% (32) 11% (115) 998Income: 50k-100k 47% (308) 31% (204) 12% (81) 3% (19) 7% (49) 660Income: 100k+ 45% (149) 35% (116) 11% (35) 4% (14) 5% (15) 329Ethnicity: White 46% (745) 31% (504) 11% (177) 3% (52) 8% (130) 1608
Continued on next page
Page 83
National Tracking Poll #2006102, June, 2020
83
Table POL4_1
Table POL4_1: How important of a priority should each of the following be for Congress?Passing a healthcare reform bill
Demographic A top priority
An important,but lowerpriority
Not tooimportant apriority
Should not bedone
Don’t know /No opinion Total N
Registered Voters 47% (936) 30% (599) 11% (209) 3% (66) 9% (178) 1988Ethnicity: Hispanic 50% (96) 24% (47) 9% (17) 5% (10) 12% (23) 193Ethnicity: Afr. Am. 50% (127) 23% (58) 10% (26) 3% (9) 13% (32) 252Ethnicity: Other 50% (65) 28% (36) 4% (6) 4% (5) 13% (17) 128All Christian 44% (410) 35% (329) 11% (100) 4% (35) 7% (67) 941All Non-Christian 57% (55) 24% (24) 12% (12) 3% (3) 3% (3) 97Atheist 54% (70) 23% (29) 12% (15) 5% (7) 6% (7) 128Agnostic/Nothing in particular 48% (228) 28% (132) 9% (45) 2% (11) 13% (62) 478Something Else 50% (173) 25% (84) 11% (37) 3% (10) 11% (39) 344Religious Non-Protestant/Catholic 53% (63) 27% (32) 12% (14) 3% (4) 5% (6) 120Evangelical 44% (223) 34% (169) 8% (41) 5% (26) 9% (46) 505Non-Evangelical 47% (349) 31% (231) 12% (90) 3% (19) 8% (56) 746Community: Urban 46% (225) 26% (128) 11% (52) 5% (22) 13% (63) 490Community: Suburban 47% (464) 32% (317) 11% (107) 3% (26) 7% (67) 981Community: Rural 48% (248) 30% (154) 10% (49) 3% (17) 9% (49) 517Employ: Private Sector 47% (299) 30% (190) 13% (82) 3% (21) 6% (38) 631Employ: Government 41% (56) 28% (38) 15% (20) 7% (9) 9% (12) 136Employ: Self-Employed 50% (65) 29% (38) 8% (10) 3% (3) 10% (14) 130Employ: Homemaker 50% (57) 27% (31) 8% (9) 3% (4) 13% (14) 115Employ: Retired 49% (242) 32% (156) 10% (50) 4% (18) 5% (26) 492Employ: Unemployed 48% (109) 26% (59) 9% (20) 2% (4) 16% (36) 229Employ: Other 45% (69) 32% (49) 5% (8) 4% (5) 13% (20) 152Military HH: Yes 44% (135) 34% (103) 13% (40) 4% (11) 6% (17) 306Military HH: No 48% (802) 29% (496) 10% (169) 3% (54) 10% (161) 1682RD/WT: Right Direction 39% (220) 33% (185) 14% (82) 5% (26) 9% (54) 567RD/WT: Wrong Track 50% (716) 29% (414) 9% (127) 3% (39) 9% (125) 1421Trump Job Approve 38% (292) 36% (275) 14% (106) 4% (32) 9% (69) 774Trump Job Disapprove 55% (629) 27% (313) 8% (98) 3% (34) 7% (80) 1153
Continued on next page
Page 84
84
Morning ConsultTable POL4_1
Table POL4_1: How important of a priority should each of the following be for Congress?Passing a healthcare reform bill
Demographic A top priority
An important,but lowerpriority
Not tooimportant apriority
Should not bedone
Don’t know /No opinion Total N
Registered Voters 47% (936) 30% (599) 11% (209) 3% (66) 9% (178) 1988Trump Job Strongly Approve 40% (165) 35% (144) 14% (57) 4% (16) 8% (33) 415Trump Job Somewhat Approve 35% (127) 36% (130) 14% (50) 5% (16) 10% (35) 359Trump Job Somewhat Disapprove 41% (94) 34% (77) 12% (28) 4% (9) 8% (18) 226Trump Job Strongly Disapprove 58% (535) 26% (237) 8% (70) 3% (25) 7% (61) 927Favorable of Trump 37% (291) 35% (278) 13% (106) 5% (36) 10% (76) 787Unfavorable of Trump 55% (625) 27% (309) 9% (98) 3% (29) 6% (71) 1132Very Favorable of Trump 37% (171) 34% (158) 15% (68) 5% (24) 9% (40) 462Somewhat Favorable of Trump 37% (120) 37% (120) 11% (37) 4% (13) 11% (35) 325Somewhat Unfavorable of Trump 41% (75) 29% (53) 15% (28) 4% (7) 10% (19) 182Very Unfavorable of Trump 58% (549) 27% (256) 7% (70) 2% (23) 5% (52) 950#1 Issue: Economy 43% (294) 33% (224) 11% (78) 5% (35) 8% (58) 688#1 Issue: Security 33% (83) 39% (99) 16% (42) 2% (6) 9% (23) 254#1 Issue: Health Care 68% (227) 19% (62) 6% (19) 1% (5) 7% (22) 335#1 Issue: Medicare / Social Security 53% (150) 26% (75) 9% (26) 2% (6) 10% (27) 283#1 Issue: Women’s Issues 42% (36) 36% (31) 10% (8) 6% (5) 6% (6) 86#1 Issue: Education 49% (53) 31% (34) 7% (8) — (0) 12% (13) 107#1 Issue: Energy 37% (29) 40% (31) 12% (9) 2% (2) 9% (7) 79#1 Issue: Other 41% (64) 27% (43) 12% (19) 5% (7) 15% (23) 1572018 House Vote: Democrat 60% (457) 27% (208) 8% (61) 2% (14) 4% (28) 7672018 House Vote: Republican 39% (244) 37% (233) 14% (86) 5% (29) 6% (38) 6292018 House Vote: Someone else 32% (24) 33% (24) 15% (11) 6% (4) 13% (10) 732016 Vote: Hillary Clinton 59% (413) 27% (190) 9% (61) 1% (10) 4% (26) 7002016 Vote: Donald Trump 40% (271) 36% (242) 12% (78) 5% (33) 7% (50) 6752016 Vote: Other 42% (61) 31% (45) 14% (20) 4% (6) 8% (12) 1442016 Vote: Didn’t Vote 41% (191) 26% (122) 11% (49) 3% (16) 19% (89) 466Voted in 2014: Yes 49% (653) 31% (409) 11% (142) 3% (46) 5% (72) 1322Voted in 2014: No 43% (284) 28% (190) 10% (67) 3% (20) 16% (107) 666
Continued on next page
Page 85
National Tracking Poll #2006102, June, 2020
85
Table POL4_1
Table POL4_1: How important of a priority should each of the following be for Congress?Passing a healthcare reform bill
Demographic A top priority
An important,but lowerpriority
Not tooimportant apriority
Should not bedone
Don’t know /No opinion Total N
Registered Voters 47% (936) 30% (599) 11% (209) 3% (66) 9% (178) 19882012 Vote: Barack Obama 57% (485) 27% (233) 9% (73) 2% (16) 5% (47) 8532012 Vote: Mitt Romney 37% (184) 38% (190) 14% (69) 5% (26) 6% (31) 5012012 Vote: Other 35% (29) 31% (26) 14% (11) 11% (9) 9% (8) 842012 Vote: Didn’t Vote 43% (237) 27% (149) 10% (55) 3% (15) 17% (93) 5504-Region: Northeast 46% (165) 32% (115) 12% (41) 3% (11) 6% (23) 3554-Region: Midwest 47% (214) 28% (127) 11% (52) 4% (17) 10% (47) 4574-Region: South 45% (334) 33% (244) 10% (72) 3% (19) 10% (72) 7424-Region: West 51% (224) 26% (113) 10% (43) 4% (18) 8% (37) 434Party: Democrat/Leans Democrat 58% (525) 28% (256) 7% (68) 2% (20) 5% (43) 911Party: Republican/Leans Republican 38% (281) 34% (254) 14% (107) 4% (30) 9% (69) 741Parents 49% (425) 31% (264) 10% (83) 3% (29) 7% (64) 864Note: Row proportions may total to larger than one-hundred percent due to rounding. For more information visit MorningConsultIntelligence.com.
Page 86
86
Morning ConsultTable POL4_2
Table POL4_2: How important of a priority should each of the following be for Congress?Passing a bill to address climate change
Demographic A top priority
An important,but lowerpriority
Not tooimportant apriority
Should not bedone
Don’t know /No opinion Total N
Registered Voters 35% (697) 26% (525) 18% (348) 12% (246) 9% (172) 1988Gender: Male 34% (319) 25% (236) 18% (167) 15% (136) 8% (73) 930Gender: Female 36% (377) 27% (289) 17% (182) 10% (110) 9% (99) 1058Age: 18-34 40% (199) 28% (141) 13% (67) 7% (33) 12% (60) 499Age: 35-44 34% (102) 30% (91) 15% (47) 12% (35) 9% (28) 302Age: 45-64 34% (245) 25% (180) 19% (138) 14% (99) 8% (61) 724Age: 65+ 32% (150) 24% (113) 21% (97) 17% (79) 5% (23) 463GenZers: 1997-2012 37% (84) 31% (69) 11% (24) 6% (13) 15% (34) 224Millennials: 1981-1996 39% (162) 27% (112) 16% (68) 9% (38) 9% (39) 419GenXers: 1965-1980 35% (180) 27% (140) 18% (91) 12% (63) 7% (37) 511Baby Boomers: 1946-1964 33% (253) 24% (184) 20% (150) 15% (115) 8% (57) 760PID: Dem (no lean) 56% (421) 29% (223) 8% (64) 2% (18) 4% (32) 757PID: Ind (no lean) 30% (189) 25% (161) 17% (106) 15% (93) 14% (90) 638PID: Rep (no lean) 15% (88) 24% (141) 30% (179) 23% (136) 8% (49) 593PID/Gender: DemMen 56% (183) 29% (97) 8% (27) 2% (8) 4% (14) 329PID/Gender: DemWomen 55% (238) 29% (126) 9% (37) 2% (10) 4% (18) 429PID/Gender: Ind Men 28% (84) 21% (61) 20% (58) 20% (58) 12% (35) 296PID/Gender: Ind Women 31% (104) 29% (99) 14% (48) 10% (35) 16% (55) 342PID/Gender: Rep Men 17% (52) 25% (78) 27% (82) 23% (70) 8% (24) 306PID/Gender: Rep Women 12% (36) 22% (64) 34% (96) 23% (66) 9% (26) 287Ideo: Liberal (1-3) 61% (368) 26% (160) 7% (44) 3% (19) 3% (17) 609Ideo: Moderate (4) 35% (183) 32% (168) 17% (89) 5% (26) 11% (56) 522Ideo: Conservative (5-7) 15% (101) 22% (151) 29% (195) 28% (191) 6% (40) 679Educ: < College 32% (400) 26% (319) 19% (241) 12% (152) 11% (139) 1250Educ: Bachelors degree 38% (177) 28% (132) 16% (74) 13% (59) 6% (28) 470Educ: Post-grad 45% (120) 28% (74) 13% (34) 13% (35) 2% (5) 267Income: Under 50k 34% (337) 25% (253) 18% (176) 12% (119) 11% (114) 998Income: 50k-100k 33% (218) 29% (193) 17% (111) 14% (89) 7% (49) 660Income: 100k+ 43% (142) 24% (79) 19% (61) 12% (38) 3% (9) 329Ethnicity: White 35% (558) 25% (403) 19% (303) 13% (216) 8% (127) 1608
Continued on next page
Page 87
National Tracking Poll #2006102, June, 2020
87
Table POL4_2
Table POL4_2: How important of a priority should each of the following be for Congress?Passing a bill to address climate change
Demographic A top priority
An important,but lowerpriority
Not tooimportant apriority
Should not bedone
Don’t know /No opinion Total N
Registered Voters 35% (697) 26% (525) 18% (348) 12% (246) 9% (172) 1988Ethnicity: Hispanic 35% (68) 31% (60) 11% (21) 8% (16) 14% (28) 193Ethnicity: Afr. Am. 35% (89) 33% (82) 12% (30) 9% (22) 11% (28) 252Ethnicity: Other 39% (49) 31% (39) 11% (15) 6% (8) 13% (17) 128All Christian 30% (280) 28% (266) 18% (169) 17% (159) 7% (67) 941All Non-Christian 51% (50) 20% (20) 16% (16) 7% (7) 5% (5) 97Atheist 56% (72) 19% (24) 16% (20) 3% (4) 5% (7) 128Agnostic/Nothing in particular 39% (188) 25% (121) 15% (70) 9% (43) 12% (56) 478Something Else 31% (106) 27% (94) 21% (72) 10% (33) 11% (38) 344Religious Non-Protestant/Catholic 45% (53) 21% (25) 16% (20) 10% (12) 8% (10) 120Evangelical 24% (121) 28% (143) 20% (101) 19% (98) 8% (41) 505Non-Evangelical 34% (256) 28% (209) 18% (136) 12% (88) 8% (57) 746Community: Urban 38% (186) 31% (153) 14% (69) 8% (38) 9% (44) 490Community: Suburban 35% (343) 27% (265) 17% (165) 13% (132) 8% (75) 981Community: Rural 32% (167) 21% (107) 22% (115) 15% (76) 10% (52) 517Employ: Private Sector 36% (227) 30% (189) 18% (113) 11% (67) 5% (35) 631Employ: Government 33% (45) 32% (44) 13% (17) 13% (17) 9% (12) 136Employ: Self-Employed 34% (44) 22% (29) 20% (25) 11% (14) 13% (18) 130Employ: Homemaker 41% (47) 18% (20) 19% (22) 12% (14) 11% (12) 115Employ: Retired 32% (160) 25% (122) 20% (96) 18% (87) 5% (27) 492Employ: Unemployed 35% (80) 23% (53) 13% (31) 13% (30) 15% (35) 229Employ: Other 31% (48) 26% (39) 19% (29) 10% (15) 14% (21) 152Military HH: Yes 33% (102) 23% (70) 20% (60) 18% (54) 6% (20) 306Military HH: No 35% (594) 27% (455) 17% (288) 11% (193) 9% (152) 1682RD/WT: Right Direction 16% (92) 22% (125) 29% (166) 24% (135) 9% (49) 567RD/WT: Wrong Track 43% (604) 28% (400) 13% (182) 8% (111) 9% (123) 1421Trump Job Approve 14% (108) 22% (167) 31% (239) 26% (198) 8% (61) 774Trump Job Disapprove 51% (583) 30% (342) 9% (102) 4% (43) 7% (83) 1153
Continued on next page
Page 88
88
Morning ConsultTable POL4_2
Table POL4_2: How important of a priority should each of the following be for Congress?Passing a bill to address climate change
Demographic A top priority
An important,but lowerpriority
Not tooimportant apriority
Should not bedone
Don’t know /No opinion Total N
Registered Voters 35% (697) 26% (525) 18% (348) 12% (246) 9% (172) 1988Trump Job Strongly Approve 13% (53) 15% (63) 30% (124) 35% (144) 8% (31) 415Trump Job Somewhat Approve 15% (55) 29% (104) 32% (115) 15% (55) 8% (30) 359Trump Job Somewhat Disapprove 37% (83) 35% (78) 14% (31) 3% (8) 12% (26) 226Trump Job Strongly Disapprove 54% (500) 28% (264) 8% (71) 4% (36) 6% (57) 927Favorable of Trump 14% (111) 21% (167) 30% (239) 26% (203) 9% (67) 787Unfavorable of Trump 50% (571) 31% (345) 9% (102) 4% (40) 7% (74) 1132Very Favorable of Trump 12% (55) 16% (72) 31% (143) 33% (153) 9% (40) 462Somewhat Favorable of Trump 17% (57) 29% (94) 30% (96) 15% (50) 9% (28) 325Somewhat Unfavorable of Trump 32% (58) 33% (61) 18% (32) 6% (10) 12% (21) 182Very Unfavorable of Trump 54% (513) 30% (285) 7% (70) 3% (30) 6% (53) 950#1 Issue: Economy 29% (202) 30% (210) 18% (122) 15% (104) 7% (50) 688#1 Issue: Security 12% (30) 23% (57) 29% (74) 27% (69) 9% (23) 254#1 Issue: Health Care 48% (159) 27% (91) 13% (43) 5% (18) 7% (24) 335#1 Issue: Medicare / Social Security 37% (106) 23% (65) 19% (53) 7% (21) 13% (38) 283#1 Issue: Women’s Issues 51% (44) 27% (23) 8% (7) 10% (8) 4% (3) 86#1 Issue: Education 28% (30) 32% (34) 21% (22) 5% (6) 14% (15) 107#1 Issue: Energy 72% (57) 16% (13) 6% (5) — (0) 6% (4) 79#1 Issue: Other 43% (68) 21% (33) 13% (21) 14% (21) 9% (14) 1572018 House Vote: Democrat 57% (439) 28% (216) 8% (61) 3% (22) 4% (30) 7672018 House Vote: Republican 14% (90) 21% (130) 31% (197) 27% (172) 6% (41) 6292018 House Vote: Someone else 20% (15) 30% (22) 19% (14) 16% (11) 15% (11) 732016 Vote: Hillary Clinton 55% (384) 29% (204) 8% (59) 3% (20) 5% (34) 7002016 Vote: Donald Trump 16% (105) 21% (142) 30% (203) 26% (177) 7% (48) 6752016 Vote: Other 39% (56) 25% (36) 18% (25) 8% (12) 10% (15) 1442016 Vote: Didn’t Vote 32% (149) 31% (143) 13% (61) 8% (38) 16% (75) 466Voted in 2014: Yes 36% (478) 24% (321) 19% (251) 15% (195) 6% (77) 1322Voted in 2014: No 33% (219) 31% (204) 15% (98) 8% (51) 14% (94) 666
Continued on next page
Page 89
National Tracking Poll #2006102, June, 2020
89
Table POL4_2
Table POL4_2: How important of a priority should each of the following be for Congress?Passing a bill to address climate change
Demographic A top priority
An important,but lowerpriority
Not tooimportant apriority
Should not bedone
Don’t know /No opinion Total N
Registered Voters 35% (697) 26% (525) 18% (348) 12% (246) 9% (172) 19882012 Vote: Barack Obama 52% (447) 28% (235) 11% (93) 4% (33) 5% (45) 8532012 Vote: Mitt Romney 12% (61) 22% (108) 30% (153) 30% (149) 6% (31) 5012012 Vote: Other 20% (16) 13% (11) 23% (19) 30% (25) 14% (12) 842012 Vote: Didn’t Vote 31% (172) 31% (170) 15% (84) 7% (40) 15% (84) 5504-Region: Northeast 38% (136) 26% (93) 18% (65) 10% (36) 7% (25) 3554-Region: Midwest 34% (155) 25% (113) 19% (85) 14% (65) 9% (40) 4574-Region: South 31% (234) 28% (208) 18% (136) 13% (98) 9% (66) 7424-Region: West 40% (173) 26% (112) 14% (63) 11% (47) 9% (40) 434Party: Democrat/Leans Democrat 56% (509) 29% (268) 8% (72) 2% (20) 5% (41) 911Party: Republican/Leans Republican 15% (110) 23% (168) 29% (217) 25% (183) 8% (63) 741Parents 32% (277) 29% (246) 19% (165) 13% (110) 8% (66) 864Note: Row proportions may total to larger than one-hundred percent due to rounding. For more information visit MorningConsultIntelligence.com.
Page 90
90
Morning ConsultTable POL4_3
Table POL4_3: How important of a priority should each of the following be for Congress?Passing a bill to reduce economic inequality
Demographic A top priority
An important,but lowerpriority
Not tooimportant apriority
Should not bedone
Don’t know /No opinion Total N
Registered Voters 37% (731) 29% (568) 14% (285) 11% (209) 10% (195) 1988Gender: Male 35% (322) 27% (248) 17% (157) 13% (124) 9% (79) 930Gender: Female 39% (408) 30% (320) 12% (128) 8% (86) 11% (115) 1058Age: 18-34 45% (224) 26% (128) 13% (63) 5% (25) 12% (59) 499Age: 35-44 39% (119) 29% (89) 12% (36) 10% (30) 9% (28) 302Age: 45-64 35% (252) 30% (217) 14% (100) 11% (81) 10% (73) 724Age: 65+ 29% (135) 29% (134) 18% (85) 16% (72) 8% (35) 463GenZers: 1997-2012 38% (84) 30% (67) 12% (26) 4% (8) 17% (38) 224Millennials: 1981-1996 47% (197) 25% (104) 12% (52) 8% (34) 8% (32) 419GenXers: 1965-1980 39% (201) 29% (149) 12% (63) 9% (46) 10% (53) 511Baby Boomers: 1946-1964 31% (232) 30% (226) 17% (130) 14% (106) 9% (66) 760PID: Dem (no lean) 55% (420) 29% (219) 8% (60) 2% (14) 6% (44) 757PID: Ind (no lean) 30% (193) 28% (179) 14% (87) 13% (84) 15% (95) 638PID: Rep (no lean) 20% (117) 29% (170) 23% (138) 19% (112) 9% (56) 593PID/Gender: DemMen 51% (168) 31% (100) 9% (31) 2% (8) 7% (22) 329PID/Gender: DemWomen 59% (253) 28% (119) 7% (29) 1% (6) 5% (22) 429PID/Gender: Ind Men 30% (87) 25% (74) 17% (50) 16% (47) 13% (39) 296PID/Gender: Ind Women 31% (106) 31% (105) 11% (37) 11% (37) 17% (56) 342PID/Gender: Rep Men 22% (67) 24% (74) 25% (76) 23% (69) 6% (19) 306PID/Gender: Rep Women 17% (50) 33% (96) 22% (62) 15% (43) 13% (37) 287Ideo: Liberal (1-3) 56% (340) 30% (181) 9% (52) 2% (13) 4% (23) 609Ideo: Moderate (4) 39% (203) 32% (165) 13% (66) 6% (30) 11% (58) 522Ideo: Conservative (5-7) 19% (127) 28% (188) 22% (150) 23% (156) 9% (58) 679Educ: < College 36% (455) 27% (343) 14% (175) 10% (129) 12% (149) 1250Educ: Bachelors degree 35% (162) 31% (147) 15% (71) 11% (52) 8% (37) 470Educ: Post-grad 42% (114) 29% (78) 14% (38) 11% (28) 3% (9) 267Income: Under 50k 39% (388) 27% (269) 12% (123) 10% (97) 12% (122) 998Income: 50k-100k 34% (224) 30% (197) 16% (107) 11% (73) 9% (59) 660Income: 100k+ 36% (118) 31% (102) 17% (55) 12% (40) 4% (14) 329Ethnicity: White 32% (523) 30% (489) 16% (250) 12% (194) 9% (152) 1608
Continued on next page
Page 91
National Tracking Poll #2006102, June, 2020
91
Table POL4_3
Table POL4_3: How important of a priority should each of the following be for Congress?Passing a bill to reduce economic inequality
Demographic A top priority
An important,but lowerpriority
Not tooimportant apriority
Should not bedone
Don’t know /No opinion Total N
Registered Voters 37% (731) 29% (568) 14% (285) 11% (209) 10% (195) 1988Ethnicity: Hispanic 46% (88) 27% (51) 8% (15) 7% (14) 12% (24) 193Ethnicity: Afr. Am. 60% (152) 18% (44) 8% (20) 3% (9) 11% (28) 252Ethnicity: Other 44% (57) 27% (35) 12% (15) 5% (7) 11% (15) 128All Christian 32% (301) 28% (262) 17% (159) 15% (140) 8% (80) 941All Non-Christian 41% (40) 29% (28) 19% (18) 5% (5) 6% (6) 97Atheist 38% (48) 36% (46) 11% (14) 8% (11) 7% (9) 128Agnostic/Nothing in particular 39% (188) 28% (135) 12% (56) 7% (36) 13% (63) 478Something Else 45% (154) 28% (97) 11% (38) 5% (18) 11% (37) 344Religious Non-Protestant/Catholic 36% (43) 34% (41) 16% (19) 6% (7) 8% (9) 120Evangelical 39% (195) 24% (123) 13% (65) 15% (76) 9% (46) 505Non-Evangelical 34% (254) 29% (220) 17% (126) 11% (79) 9% (67) 746Community: Urban 42% (207) 26% (129) 13% (63) 9% (44) 10% (47) 490Community: Suburban 37% (363) 30% (293) 14% (140) 10% (101) 9% (85) 981Community: Rural 31% (161) 28% (147) 16% (82) 12% (64) 12% (63) 517Employ: Private Sector 41% (256) 30% (191) 13% (82) 10% (60) 7% (42) 631Employ: Government 41% (55) 24% (32) 12% (16) 11% (15) 12% (16) 136Employ: Self-Employed 42% (55) 20% (27) 14% (18) 9% (12) 14% (18) 130Employ: Homemaker 32% (37) 34% (39) 10% (11) 12% (13) 13% (14) 115Employ: Retired 29% (143) 29% (143) 20% (100) 16% (77) 6% (28) 492Employ: Unemployed 36% (83) 25% (58) 10% (24) 10% (23) 18% (41) 229Employ: Other 43% (66) 28% (42) 12% (19) 4% (6) 13% (20) 152Military HH: Yes 28% (87) 29% (90) 18% (55) 17% (51) 7% (23) 306Military HH: No 38% (644) 28% (478) 14% (230) 9% (158) 10% (172) 1682RD/WT: Right Direction 19% (111) 29% (165) 20% (115) 20% (116) 11% (61) 567RD/WT: Wrong Track 44% (620) 28% (403) 12% (170) 7% (93) 9% (134) 1421Trump Job Approve 19% (143) 28% (214) 23% (180) 21% (163) 9% (73) 774Trump Job Disapprove 50% (575) 29% (339) 9% (104) 4% (42) 8% (93) 1153
Continued on next page
Page 92
92
Morning ConsultTable POL4_3
Table POL4_3: How important of a priority should each of the following be for Congress?Passing a bill to reduce economic inequality
Demographic A top priority
An important,but lowerpriority
Not tooimportant apriority
Should not bedone
Don’t know /No opinion Total N
Registered Voters 37% (731) 29% (568) 14% (285) 11% (209) 10% (195) 1988Trump Job Strongly Approve 17% (69) 22% (91) 22% (92) 30% (123) 10% (39) 415Trump Job Somewhat Approve 21% (74) 34% (123) 24% (87) 11% (40) 9% (34) 359Trump Job Somewhat Disapprove 37% (83) 32% (74) 13% (29) 7% (16) 11% (24) 226Trump Job Strongly Disapprove 53% (492) 29% (265) 8% (75) 3% (26) 7% (69) 927Favorable of Trump 19% (152) 28% (217) 22% (172) 21% (166) 10% (80) 787Unfavorable of Trump 49% (558) 30% (340) 10% (108) 4% (41) 7% (84) 1132Very Favorable of Trump 16% (75) 24% (110) 21% (99) 28% (130) 10% (48) 462Somewhat Favorable of Trump 24% (78) 33% (107) 22% (72) 11% (36) 10% (32) 325Somewhat Unfavorable of Trump 29% (53) 34% (62) 16% (29) 10% (18) 11% (21) 182Very Unfavorable of Trump 53% (506) 29% (278) 8% (79) 2% (24) 7% (63) 950#1 Issue: Economy 35% (244) 27% (188) 17% (115) 12% (85) 8% (56) 688#1 Issue: Security 21% (52) 25% (63) 20% (52) 23% (60) 11% (27) 254#1 Issue: Health Care 44% (148) 32% (106) 10% (33) 6% (19) 9% (29) 335#1 Issue: Medicare / Social Security 32% (89) 32% (89) 15% (41) 7% (19) 16% (44) 283#1 Issue: Women’s Issues 53% (46) 26% (22) 8% (7) 6% (5) 7% (6) 86#1 Issue: Education 48% (51) 29% (31) 5% (6) 4% (4) 14% (15) 107#1 Issue: Energy 42% (33) 37% (29) 13% (10) 1% (1) 8% (6) 79#1 Issue: Other 44% (68) 25% (39) 14% (21) 10% (16) 8% (12) 1572018 House Vote: Democrat 55% (424) 28% (217) 9% (71) 3% (22) 4% (34) 7672018 House Vote: Republican 16% (103) 29% (185) 23% (145) 23% (143) 8% (52) 6292018 House Vote: Someone else 29% (21) 26% (19) 16% (11) 13% (9) 16% (12) 732016 Vote: Hillary Clinton 53% (374) 29% (204) 10% (69) 2% (15) 5% (38) 7002016 Vote: Donald Trump 19% (125) 28% (191) 22% (148) 23% (154) 9% (58) 6752016 Vote: Other 36% (52) 29% (42) 14% (20) 11% (15) 10% (15) 1442016 Vote: Didn’t Vote 38% (177) 28% (131) 10% (47) 5% (26) 18% (85) 466Voted in 2014: Yes 36% (479) 29% (378) 16% (207) 12% (163) 7% (94) 1322Voted in 2014: No 38% (252) 29% (190) 12% (78) 7% (46) 15% (100) 666
Continued on next page
Page 93
National Tracking Poll #2006102, June, 2020
93
Table POL4_3
Table POL4_3: How important of a priority should each of the following be for Congress?Passing a bill to reduce economic inequality
Demographic A top priority
An important,but lowerpriority
Not tooimportant apriority
Should not bedone
Don’t know /No opinion Total N
Registered Voters 37% (731) 29% (568) 14% (285) 11% (209) 10% (195) 19882012 Vote: Barack Obama 52% (440) 29% (245) 10% (85) 4% (32) 6% (51) 8532012 Vote: Mitt Romney 14% (68) 29% (147) 24% (118) 25% (125) 9% (43) 5012012 Vote: Other 21% (17) 25% (21) 10% (9) 28% (23) 17% (14) 842012 Vote: Didn’t Vote 37% (204) 28% (156) 13% (73) 5% (29) 16% (87) 5504-Region: Northeast 36% (129) 30% (107) 15% (52) 10% (35) 9% (31) 3554-Region: Midwest 33% (151) 31% (140) 15% (68) 10% (48) 11% (50) 4574-Region: South 36% (267) 29% (213) 14% (102) 11% (85) 10% (76) 7424-Region: West 42% (184) 25% (108) 14% (63) 10% (42) 9% (37) 434Party: Democrat/Leans Democrat 54% (495) 30% (272) 8% (75) 2% (18) 6% (51) 911Party: Republican/Leans Republican 19% (141) 28% (206) 22% (166) 20% (151) 10% (77) 741Parents 36% (309) 29% (248) 15% (134) 11% (95) 9% (78) 864Note: Row proportions may total to larger than one-hundred percent due to rounding. For more information visit MorningConsultIntelligence.com.
Page 94
94
Morning ConsultTable POL4_4
Table POL4_4: How important of a priority should each of the following be for Congress?Passing an infrastructure spending bill
Demographic A top priority
An important,but lowerpriority
Not tooimportant apriority
Should not bedone
Don’t know /No opinion Total N
Registered Voters 32% (632) 39% (768) 13% (250) 2% (39) 15% (300) 1988Gender: Male 35% (330) 41% (380) 11% (105) 2% (15) 11% (101) 930Gender: Female 29% (302) 37% (388) 14% (145) 2% (23) 19% (199) 1058Age: 18-34 20% (99) 34% (170) 21% (105) 3% (16) 22% (110) 499Age: 35-44 28% (84) 42% (127) 13% (39) 2% (7) 15% (45) 302Age: 45-64 34% (248) 43% (308) 9% (68) 1% (8) 13% (92) 724Age: 65+ 44% (201) 35% (163) 8% (38) 2% (7) 11% (53) 463GenZers: 1997-2012 17% (38) 28% (63) 24% (53) 3% (8) 27% (61) 224Millennials: 1981-1996 24% (100) 39% (165) 17% (69) 3% (13) 17% (72) 419GenXers: 1965-1980 34% (174) 40% (206) 12% (59) 2% (8) 13% (64) 511Baby Boomers: 1946-1964 38% (288) 41% (308) 8% (59) 1% (8) 13% (96) 760PID: Dem (no lean) 36% (275) 38% (288) 12% (93) 1% (11) 12% (90) 757PID: Ind (no lean) 26% (165) 40% (252) 13% (86) 3% (16) 19% (118) 638PID: Rep (no lean) 32% (192) 38% (228) 12% (71) 2% (11) 15% (91) 593PID/Gender: DemMen 38% (123) 41% (134) 12% (40) 1% (2) 9% (29) 329PID/Gender: DemWomen 35% (151) 36% (154) 12% (53) 2% (9) 14% (62) 429PID/Gender: Ind Men 31% (93) 39% (117) 12% (36) 1% (4) 15% (45) 296PID/Gender: Ind Women 21% (72) 40% (135) 15% (50) 3% (12) 21% (73) 342PID/Gender: Rep Men 37% (113) 42% (129) 9% (28) 3% (9) 9% (27) 306PID/Gender: Rep Women 27% (79) 34% (99) 15% (43) 1% (2) 22% (65) 287Ideo: Liberal (1-3) 35% (215) 44% (266) 11% (70) 1% (5) 9% (53) 609Ideo: Moderate (4) 31% (162) 37% (191) 13% (69) 3% (17) 16% (84) 522Ideo: Conservative (5-7) 34% (228) 40% (272) 13% (88) 2% (13) 12% (79) 679Educ: < College 32% (396) 36% (446) 12% (153) 2% (24) 19% (233) 1250Educ: Bachelors degree 30% (139) 42% (195) 15% (69) 2% (10) 12% (56) 470Educ: Post-grad 36% (97) 48% (127) 11% (28) 2% (4) 4% (11) 267Income: Under 50k 30% (302) 36% (355) 12% (123) 2% (21) 20% (197) 998Income: 50k-100k 33% (219) 40% (262) 14% (90) 2% (14) 11% (76) 660Income: 100k+ 34% (110) 46% (151) 11% (37) 1% (4) 8% (27) 329Ethnicity: White 32% (520) 40% (638) 12% (191) 2% (28) 14% (229) 1608
Continued on next page
Page 95
National Tracking Poll #2006102, June, 2020
95
Table POL4_4
Table POL4_4: How important of a priority should each of the following be for Congress?Passing an infrastructure spending bill
Demographic A top priority
An important,but lowerpriority
Not tooimportant apriority
Should not bedone
Don’t know /No opinion Total N
Registered Voters 32% (632) 39% (768) 13% (250) 2% (39) 15% (300) 1988Ethnicity: Hispanic 28% (53) 33% (64) 14% (28) 4% (7) 21% (41) 193Ethnicity: Afr. Am. 31% (79) 33% (84) 15% (38) 3% (7) 17% (44) 252Ethnicity: Other 26% (33) 36% (46) 16% (20) 2% (3) 21% (26) 128All Christian 35% (330) 39% (364) 12% (108) 2% (19) 13% (120) 941All Non-Christian 25% (24) 46% (45) 14% (13) 2% (2) 13% (12) 97Atheist 28% (35) 45% (57) 15% (19) 3% (3) 10% (13) 128Agnostic/Nothing in particular 29% (137) 37% (179) 13% (62) 2% (8) 19% (91) 478Something Else 30% (105) 36% (123) 13% (46) 2% (6) 18% (63) 344Religious Non-Protestant/Catholic 21% (25) 50% (60) 11% (13) 3% (4) 15% (18) 120Evangelical 35% (178) 34% (173) 13% (66) 3% (13) 15% (75) 505Non-Evangelical 34% (255) 39% (293) 12% (87) 1% (11) 14% (101) 746Community: Urban 30% (148) 40% (194) 13% (63) 3% (12) 15% (72) 490Community: Suburban 34% (331) 38% (375) 12% (119) 2% (19) 14% (136) 981Community: Rural 29% (152) 39% (200) 13% (67) 1% (7) 18% (92) 517Employ: Private Sector 32% (199) 43% (268) 14% (88) 2% (10) 10% (66) 631Employ: Government 30% (40) 41% (56) 13% (17) 3% (4) 14% (19) 136Employ: Self-Employed 31% (40) 41% (53) 7% (10) 3% (4) 17% (23) 130Employ: Homemaker 29% (34) 24% (27) 14% (17) 5% (6) 27% (31) 115Employ: Retired 41% (201) 39% (190) 10% (48) 1% (5) 10% (48) 492Employ: Unemployed 25% (58) 38% (88) 12% (28) 1% (3) 23% (52) 229Employ: Other 27% (41) 36% (54) 15% (23) 2% (3) 20% (31) 152Military HH: Yes 40% (124) 39% (119) 9% (26) 1% (3) 11% (34) 306Military HH: No 30% (508) 39% (650) 13% (223) 2% (35) 16% (266) 1682RD/WT: Right Direction 31% (174) 41% (235) 12% (71) 2% (13) 13% (76) 567RD/WT: Wrong Track 32% (458) 38% (534) 13% (179) 2% (26) 16% (224) 1421Trump Job Approve 30% (228) 43% (331) 12% (95) 2% (15) 13% (104) 774Trump Job Disapprove 34% (396) 37% (429) 12% (143) 2% (21) 14% (165) 1153
Continued on next page
Page 96
96
Morning ConsultTable POL4_4
Table POL4_4: How important of a priority should each of the following be for Congress?Passing an infrastructure spending bill
Demographic A top priority
An important,but lowerpriority
Not tooimportant apriority
Should not bedone
Don’t know /No opinion Total N
Registered Voters 32% (632) 39% (768) 13% (250) 2% (39) 15% (300) 1988Trump Job Strongly Approve 34% (141) 42% (175) 10% (43) 2% (8) 11% (47) 415Trump Job Somewhat Approve 25% (88) 43% (156) 14% (51) 2% (7) 16% (56) 359Trump Job Somewhat Disapprove 31% (70) 39% (88) 12% (27) 2% (5) 17% (37) 226Trump Job Strongly Disapprove 35% (326) 37% (341) 13% (116) 2% (16) 14% (127) 927Favorable of Trump 30% (235) 42% (331) 11% (90) 2% (17) 14% (114) 787Unfavorable of Trump 34% (384) 38% (428) 13% (151) 2% (19) 13% (150) 1132Very Favorable of Trump 32% (150) 41% (191) 11% (52) 3% (12) 12% (58) 462Somewhat Favorable of Trump 26% (86) 43% (140) 12% (38) 2% (6) 17% (56) 325Somewhat Unfavorable of Trump 27% (48) 39% (70) 21% (38) 2% (3) 12% (22) 182Very Unfavorable of Trump 35% (336) 38% (358) 12% (113) 2% (16) 13% (128) 950#1 Issue: Economy 33% (226) 39% (266) 13% (86) 3% (18) 13% (92) 688#1 Issue: Security 32% (81) 42% (107) 10% (26) 2% (6) 13% (33) 254#1 Issue: Health Care 32% (106) 42% (141) 12% (40) 1% (3) 14% (46) 335#1 Issue: Medicare / Social Security 38% (107) 34% (98) 8% (23) 1% (3) 18% (51) 283#1 Issue: Women’s Issues 20% (17) 41% (35) 23% (20) 2% (2) 14% (12) 86#1 Issue: Education 21% (22) 37% (39) 20% (22) 1% (1) 22% (23) 107#1 Issue: Energy 33% (26) 39% (31) 11% (9) 5% (4) 12% (10) 79#1 Issue: Other 29% (46) 33% (52) 16% (24) 1% (2) 21% (32) 1572018 House Vote: Democrat 37% (282) 41% (318) 11% (86) 1% (11) 9% (70) 7672018 House Vote: Republican 35% (218) 42% (263) 11% (71) 2% (12) 10% (64) 6292018 House Vote: Someone else 25% (19) 33% (24) 18% (13) 2% (2) 22% (16) 732016 Vote: Hillary Clinton 37% (258) 40% (283) 11% (81) 1% (6) 10% (73) 7002016 Vote: Donald Trump 34% (226) 43% (287) 11% (71) 2% (15) 11% (76) 6752016 Vote: Other 34% (48) 37% (54) 16% (23) 2% (2) 11% (17) 1442016 Vote: Didn’t Vote 21% (97) 31% (145) 16% (75) 3% (15) 29% (134) 466Voted in 2014: Yes 37% (483) 41% (539) 11% (151) 2% (21) 10% (128) 1322Voted in 2014: No 22% (148) 34% (229) 15% (99) 3% (18) 26% (172) 666
Continued on next page
Page 97
National Tracking Poll #2006102, June, 2020
97
Table POL4_4
Table POL4_4: How important of a priority should each of the following be for Congress?Passing an infrastructure spending bill
Demographic A top priority
An important,but lowerpriority
Not tooimportant apriority
Should not bedone
Don’t know /No opinion Total N
Registered Voters 32% (632) 39% (768) 13% (250) 2% (39) 15% (300) 19882012 Vote: Barack Obama 39% (336) 40% (339) 9% (79) 1% (5) 11% (94) 8532012 Vote: Mitt Romney 33% (166) 42% (211) 13% (65) 2% (11) 10% (48) 5012012 Vote: Other 24% (20) 39% (33) 15% (13) 4% (4) 18% (15) 842012 Vote: Didn’t Vote 20% (110) 34% (184) 17% (93) 4% (20) 26% (143) 5504-Region: Northeast 34% (122) 39% (138) 10% (36) 3% (9) 14% (49) 3554-Region: Midwest 32% (148) 35% (160) 13% (59) 2% (8) 18% (82) 4574-Region: South 30% (226) 38% (285) 14% (103) 1% (11) 16% (117) 7424-Region: West 31% (136) 43% (185) 12% (51) 2% (11) 12% (52) 434Party: Democrat/Leans Democrat 36% (327) 39% (356) 12% (108) 1% (13) 12% (107) 911Party: Republican/Leans Republican 31% (228) 41% (300) 12% (90) 2% (16) 14% (106) 741Parents 32% (279) 40% (342) 11% (99) 2% (19) 14% (125) 864Note: Row proportions may total to larger than one-hundred percent due to rounding. For more information visit MorningConsultIntelligence.com.
Page 98
98
Morning ConsultTable POL4_5
Table POL4_5: How important of a priority should each of the following be for Congress?Passing an immigration reform bill
Demographic A top priority
An important,but lowerpriority
Not tooimportant apriority
Should not bedone
Don’t know /No opinion Total N
Registered Voters 33% (664) 36% (707) 15% (295) 6% (118) 10% (205) 1988Gender: Male 33% (311) 36% (332) 17% (156) 6% (57) 8% (74) 930Gender: Female 33% (352) 35% (375) 13% (138) 6% (60) 12% (131) 1058Age: 18-34 25% (124) 34% (170) 18% (90) 6% (30) 17% (86) 499Age: 35-44 27% (83) 36% (108) 20% (60) 6% (19) 11% (32) 302Age: 45-64 34% (249) 37% (266) 13% (97) 6% (47) 9% (65) 724Age: 65+ 45% (208) 35% (163) 10% (49) 5% (22) 5% (22) 463GenZers: 1997-2012 22% (50) 35% (78) 15% (33) 6% (14) 22% (49) 224Millennials: 1981-1996 27% (114) 35% (146) 20% (84) 5% (23) 13% (53) 419GenXers: 1965-1980 34% (172) 33% (168) 16% (84) 9% (47) 8% (40) 511Baby Boomers: 1946-1964 38% (286) 39% (297) 11% (84) 4% (32) 8% (60) 760PID: Dem (no lean) 33% (251) 39% (294) 15% (117) 6% (42) 7% (54) 757PID: Ind (no lean) 29% (186) 33% (211) 17% (106) 6% (40) 15% (95) 638PID: Rep (no lean) 38% (227) 34% (202) 12% (72) 6% (36) 9% (55) 593PID/Gender: DemMen 28% (93) 41% (135) 21% (68) 4% (12) 6% (20) 329PID/Gender: DemWomen 37% (157) 37% (159) 11% (49) 7% (30) 8% (34) 429PID/Gender: Ind Men 34% (100) 32% (95) 16% (48) 6% (17) 12% (36) 296PID/Gender: Ind Women 25% (86) 34% (116) 17% (58) 7% (22) 17% (60) 342PID/Gender: Rep Men 39% (118) 33% (102) 13% (40) 9% (28) 6% (17) 306PID/Gender: Rep Women 38% (109) 35% (101) 11% (31) 3% (9) 13% (37) 287Ideo: Liberal (1-3) 30% (184) 41% (247) 18% (110) 6% (36) 5% (32) 609Ideo: Moderate (4) 31% (160) 36% (189) 15% (80) 5% (25) 13% (68) 522Ideo: Conservative (5-7) 40% (271) 34% (232) 13% (91) 6% (43) 6% (43) 679Educ: < College 33% (408) 34% (428) 14% (176) 6% (78) 13% (160) 1250Educ: Bachelors degree 32% (151) 37% (175) 17% (78) 6% (28) 8% (38) 470Educ: Post-grad 39% (104) 39% (104) 15% (41) 4% (12) 2% (7) 267Income: Under 50k 33% (329) 33% (326) 15% (151) 6% (63) 13% (129) 998Income: 50k-100k 34% (226) 39% (255) 13% (85) 6% (40) 8% (54) 660Income: 100k+ 33% (109) 38% (126) 18% (58) 4% (14) 7% (22) 329Ethnicity: White 34% (544) 36% (580) 16% (252) 5% (81) 9% (151) 1608
Continued on next page
Page 99
National Tracking Poll #2006102, June, 2020
99
Table POL4_5
Table POL4_5: How important of a priority should each of the following be for Congress?Passing an immigration reform bill
Demographic A top priority
An important,but lowerpriority
Not tooimportant apriority
Should not bedone
Don’t know /No opinion Total N
Registered Voters 33% (664) 36% (707) 15% (295) 6% (118) 10% (205) 1988Ethnicity: Hispanic 30% (57) 30% (58) 15% (29) 10% (19) 15% (29) 193Ethnicity: Afr. Am. 31% (78) 32% (82) 12% (30) 12% (31) 12% (31) 252Ethnicity: Other 33% (42) 35% (45) 9% (12) 5% (6) 17% (22) 128All Christian 37% (344) 36% (337) 15% (136) 5% (48) 8% (75) 941All Non-Christian 35% (34) 44% (43) 11% (11) 6% (6) 4% (4) 97Atheist 24% (30) 42% (54) 19% (25) 6% (8) 9% (11) 128Agnostic/Nothing in particular 29% (140) 34% (164) 16% (79) 5% (26) 15% (69) 478Something Else 33% (115) 32% (110) 13% (44) 9% (30) 13% (45) 344Religious Non-Protestant/Catholic 32% (38) 42% (51) 13% (16) 5% (6) 8% (9) 120Evangelical 36% (184) 35% (177) 12% (62) 6% (33) 10% (49) 505Non-Evangelical 36% (267) 35% (259) 15% (110) 6% (46) 9% (65) 746Community: Urban 32% (157) 38% (184) 13% (62) 7% (33) 11% (53) 490Community: Suburban 32% (315) 37% (361) 16% (157) 6% (57) 9% (91) 981Community: Rural 37% (191) 31% (162) 15% (75) 5% (28) 12% (61) 517Employ: Private Sector 31% (194) 38% (238) 17% (106) 7% (45) 7% (47) 631Employ: Government 34% (45) 33% (45) 22% (30) 5% (7) 7% (9) 136Employ: Self-Employed 32% (41) 33% (43) 14% (18) 9% (12) 12% (16) 130Employ: Homemaker 38% (44) 27% (31) 13% (15) 4% (5) 18% (21) 115Employ: Retired 41% (201) 37% (184) 12% (60) 4% (19) 6% (28) 492Employ: Unemployed 26% (60) 36% (83) 12% (27) 8% (18) 18% (41) 229Employ: Other 36% (55) 25% (38) 16% (24) 6% (9) 17% (26) 152Military HH: Yes 41% (126) 35% (106) 15% (45) 4% (12) 6% (18) 306Military HH: No 32% (538) 36% (601) 15% (250) 6% (106) 11% (187) 1682RD/WT: Right Direction 37% (210) 32% (181) 14% (81) 6% (36) 10% (59) 567RD/WT: Wrong Track 32% (453) 37% (526) 15% (214) 6% (82) 10% (146) 1421Trump Job Approve 38% (292) 33% (252) 14% (107) 7% (51) 9% (71) 774Trump Job Disapprove 31% (361) 39% (445) 16% (181) 6% (65) 9% (101) 1153
Continued on next page
Page 100
100
Morning ConsultTable POL4_5
Table POL4_5: How important of a priority should each of the following be for Congress?Passing an immigration reform bill
Demographic A top priority
An important,but lowerpriority
Not tooimportant apriority
Should not bedone
Don’t know /No opinion Total N
Registered Voters 33% (664) 36% (707) 15% (295) 6% (118) 10% (205) 1988Trump Job Strongly Approve 47% (195) 25% (105) 11% (46) 9% (37) 8% (31) 415Trump Job Somewhat Approve 27% (97) 41% (147) 17% (61) 4% (14) 11% (39) 359Trump Job Somewhat Disapprove 26% (59) 38% (87) 20% (45) 4% (9) 12% (26) 226Trump Job Strongly Disapprove 33% (302) 39% (358) 15% (136) 6% (56) 8% (75) 927Favorable of Trump 38% (302) 32% (254) 13% (103) 6% (50) 10% (79) 787Unfavorable of Trump 31% (349) 39% (437) 16% (185) 6% (66) 8% (94) 1132Very Favorable of Trump 43% (201) 27% (124) 12% (56) 8% (39) 9% (42) 462Somewhat Favorable of Trump 31% (102) 40% (130) 14% (47) 3% (11) 11% (36) 325Somewhat Unfavorable of Trump 26% (47) 35% (64) 21% (38) 5% (9) 13% (24) 182Very Unfavorable of Trump 32% (302) 39% (373) 16% (147) 6% (57) 7% (70) 950#1 Issue: Economy 32% (218) 36% (251) 15% (103) 7% (49) 10% (66) 688#1 Issue: Security 40% (101) 34% (86) 10% (25) 6% (15) 10% (27) 254#1 Issue: Health Care 34% (114) 37% (124) 18% (60) 2% (7) 9% (30) 335#1 Issue: Medicare / Social Security 35% (99) 36% (103) 13% (35) 5% (13) 12% (33) 283#1 Issue: Women’s Issues 29% (25) 34% (30) 16% (14) 11% (10) 10% (8) 86#1 Issue: Education 30% (32) 30% (32) 20% (22) 5% (5) 14% (15) 107#1 Issue: Energy 26% (21) 38% (30) 24% (19) 4% (3) 8% (6) 79#1 Issue: Other 35% (54) 33% (52) 10% (16) 9% (14) 13% (20) 1572018 House Vote: Democrat 33% (253) 39% (300) 16% (125) 6% (46) 6% (44) 7672018 House Vote: Republican 41% (256) 35% (219) 12% (75) 6% (37) 7% (42) 6292018 House Vote: Someone else 27% (20) 33% (24) 18% (13) 4% (3) 18% (13) 732016 Vote: Hillary Clinton 33% (229) 39% (275) 17% (119) 5% (37) 6% (39) 7002016 Vote: Donald Trump 39% (264) 35% (235) 12% (83) 7% (44) 7% (50) 6752016 Vote: Other 31% (45) 37% (54) 16% (23) 3% (5) 12% (18) 1442016 Vote: Didn’t Vote 26% (123) 31% (143) 15% (70) 7% (32) 21% (98) 466Voted in 2014: Yes 37% (485) 36% (471) 15% (195) 7% (87) 6% (83) 1322Voted in 2014: No 27% (179) 35% (236) 15% (100) 5% (31) 18% (121) 666
Continued on next page
Page 101
National Tracking Poll #2006102, June, 2020
101
Table POL4_5
Table POL4_5: How important of a priority should each of the following be for Congress?Passing an immigration reform bill
Demographic A top priority
An important,but lowerpriority
Not tooimportant apriority
Should not bedone
Don’t know /No opinion Total N
Registered Voters 33% (664) 36% (707) 15% (295) 6% (118) 10% (205) 19882012 Vote: Barack Obama 34% (292) 37% (318) 17% (142) 6% (48) 6% (53) 8532012 Vote: Mitt Romney 39% (197) 36% (180) 13% (64) 6% (29) 6% (31) 5012012 Vote: Other 35% (29) 29% (25) 12% (10) 9% (8) 14% (12) 842012 Vote: Didn’t Vote 27% (146) 34% (185) 14% (78) 6% (32) 20% (108) 5504-Region: Northeast 35% (123) 36% (129) 15% (53) 6% (20) 8% (29) 3554-Region: Midwest 30% (138) 38% (175) 16% (72) 4% (20) 11% (52) 4574-Region: South 36% (270) 32% (237) 14% (106) 7% (51) 11% (78) 7424-Region: West 31% (133) 38% (166) 15% (64) 6% (27) 10% (45) 434Party: Democrat/Leans Democrat 34% (308) 38% (350) 15% (138) 5% (50) 7% (65) 911Party: Republican/Leans Republican 38% (280) 34% (254) 13% (95) 6% (44) 9% (69) 741Parents 36% (311) 37% (315) 13% (115) 6% (51) 8% (71) 864Note: Row proportions may total to larger than one-hundred percent due to rounding. For more information visit MorningConsultIntelligence.com.
Page 102
102
Morning ConsultTable POL4_6
Table POL4_6: How important of a priority should each of the following be for Congress?Constructing a wall along the U.S. / Mexico border
Demographic A top priority
An important,but lowerpriority
Not tooimportant apriority
Should not bedone
Don’t know /No opinion Total N
Registered Voters 22% (433) 17% (336) 14% (281) 40% (793) 7% (145) 1988Gender: Male 25% (235) 18% (171) 14% (131) 35% (326) 7% (67) 930Gender: Female 19% (198) 16% (164) 14% (150) 44% (466) 7% (78) 1058Age: 18-34 11% (53) 15% (75) 16% (81) 48% (238) 10% (52) 499Age: 35-44 17% (53) 20% (60) 17% (52) 36% (109) 9% (28) 302Age: 45-64 24% (174) 19% (137) 13% (95) 37% (269) 7% (49) 724Age: 65+ 33% (153) 14% (64) 11% (53) 38% (176) 3% (16) 463GenZers: 1997-2012 8% (19) 14% (30) 14% (32) 50% (113) 13% (30) 224Millennials: 1981-1996 14% (60) 17% (69) 19% (78) 42% (175) 9% (37) 419GenXers: 1965-1980 23% (117) 17% (89) 14% (70) 40% (202) 7% (33) 511Baby Boomers: 1946-1964 27% (206) 17% (132) 12% (93) 38% (285) 6% (43) 760PID: Dem (no lean) 8% (64) 10% (76) 13% (102) 64% (482) 4% (34) 757PID: Ind (no lean) 15% (93) 16% (103) 17% (107) 41% (260) 12% (76) 638PID: Rep (no lean) 47% (276) 27% (157) 12% (72) 9% (51) 6% (36) 593PID/Gender: DemMen 10% (34) 12% (39) 16% (51) 57% (187) 5% (17) 329PID/Gender: DemWomen 7% (30) 8% (36) 12% (50) 69% (295) 4% (17) 429PID/Gender: Ind Men 17% (49) 20% (58) 14% (40) 38% (113) 12% (35) 296PID/Gender: Ind Women 13% (44) 13% (45) 19% (67) 43% (147) 12% (40) 342PID/Gender: Rep Men 49% (151) 24% (74) 13% (39) 9% (27) 5% (15) 306PID/Gender: Rep Women 44% (125) 29% (83) 12% (33) 8% (24) 7% (21) 287Ideo: Liberal (1-3) 7% (41) 7% (42) 11% (67) 72% (437) 4% (22) 609Ideo: Moderate (4) 14% (71) 16% (83) 19% (100) 43% (224) 9% (45) 522Ideo: Conservative (5-7) 43% (295) 27% (183) 13% (86) 12% (80) 5% (35) 679Educ: < College 25% (310) 18% (229) 15% (188) 33% (416) 9% (107) 1250Educ: Bachelors degree 17% (80) 13% (61) 13% (63) 50% (233) 7% (33) 470Educ: Post-grad 16% (43) 17% (46) 11% (29) 54% (144) 2% (5) 267Income: Under 50k 22% (224) 17% (172) 14% (141) 37% (365) 10% (95) 998Income: 50k-100k 22% (145) 17% (111) 14% (95) 41% (269) 6% (40) 660Income: 100k+ 19% (63) 16% (52) 14% (45) 48% (159) 3% (10) 329Ethnicity: White 25% (395) 18% (283) 14% (218) 37% (602) 7% (109) 1608
Continued on next page
Page 103
National Tracking Poll #2006102, June, 2020
103
Table POL4_6
Table POL4_6: How important of a priority should each of the following be for Congress?Constructing a wall along the U.S. / Mexico border
Demographic A top priority
An important,but lowerpriority
Not tooimportant apriority
Should not bedone
Don’t know /No opinion Total N
Registered Voters 22% (433) 17% (336) 14% (281) 40% (793) 7% (145) 1988Ethnicity: Hispanic 9% (17) 15% (29) 13% (25) 51% (98) 13% (24) 193Ethnicity: Afr. Am. 11% (28) 14% (36) 18% (44) 48% (122) 9% (22) 252Ethnicity: Other 8% (10) 13% (16) 15% (19) 54% (69) 11% (14) 128All Christian 27% (255) 19% (178) 15% (144) 33% (309) 6% (55) 941All Non-Christian 13% (12) 18% (18) 17% (17) 48% (47) 4% (4) 97Atheist 9% (11) 16% (21) 13% (16) 58% (74) 4% (5) 128Agnostic/Nothing in particular 16% (78) 13% (64) 11% (55) 48% (230) 11% (52) 478Something Else 22% (77) 16% (56) 15% (50) 38% (132) 9% (29) 344Religious Non-Protestant/Catholic 11% (14) 21% (26) 17% (21) 43% (52) 7% (8) 120Evangelical 31% (158) 18% (93) 17% (88) 26% (131) 7% (36) 505Non-Evangelical 23% (171) 18% (132) 13% (98) 40% (300) 6% (45) 746Community: Urban 19% (92) 17% (82) 13% (65) 42% (207) 9% (44) 490Community: Suburban 20% (195) 16% (154) 16% (155) 42% (411) 7% (66) 981Community: Rural 28% (146) 19% (100) 12% (61) 34% (175) 7% (35) 517Employ: Private Sector 21% (132) 18% (112) 17% (107) 40% (251) 5% (28) 631Employ: Government 12% (16) 16% (21) 13% (18) 51% (69) 9% (12) 136Employ: Self-Employed 13% (17) 15% (19) 17% (22) 47% (61) 8% (10) 130Employ: Homemaker 22% (26) 21% (25) 15% (17) 32% (36) 10% (11) 115Employ: Retired 33% (163) 15% (74) 10% (50) 37% (184) 4% (21) 492Employ: Unemployed 18% (40) 18% (41) 15% (33) 38% (87) 12% (28) 229Employ: Other 23% (35) 17% (26) 18% (27) 28% (42) 14% (22) 152Military HH: Yes 30% (91) 19% (57) 13% (40) 35% (107) 4% (12) 306Military HH: No 20% (342) 17% (279) 14% (241) 41% (686) 8% (134) 1682RD/WT: Right Direction 44% (251) 24% (139) 12% (68) 12% (66) 8% (44) 567RD/WT: Wrong Track 13% (182) 14% (197) 15% (213) 51% (726) 7% (102) 1421Trump Job Approve 45% (349) 28% (218) 14% (111) 6% (49) 6% (47) 774Trump Job Disapprove 7% (81) 10% (110) 13% (155) 64% (733) 6% (74) 1153
Continued on next page
Page 104
104
Morning ConsultTable POL4_6
Table POL4_6: How important of a priority should each of the following be for Congress?Constructing a wall along the U.S. / Mexico border
Demographic A top priority
An important,but lowerpriority
Not tooimportant apriority
Should not bedone
Don’t know /No opinion Total N
Registered Voters 22% (433) 17% (336) 14% (281) 40% (793) 7% (145) 1988Trump Job Strongly Approve 66% (274) 20% (82) 8% (34) 1% (4) 5% (20) 415Trump Job Somewhat Approve 21% (74) 38% (136) 21% (77) 13% (45) 7% (27) 359Trump Job Somewhat Disapprove 11% (25) 18% (40) 23% (53) 36% (81) 12% (28) 226Trump Job Strongly Disapprove 6% (56) 8% (70) 11% (103) 70% (651) 5% (46) 927Favorable of Trump 45% (356) 28% (223) 14% (110) 6% (45) 7% (52) 787Unfavorable of Trump 6% (73) 9% (103) 14% (158) 65% (734) 6% (64) 1132Very Favorable of Trump 62% (288) 22% (101) 7% (33) 2% (10) 6% (30) 462Somewhat Favorable of Trump 21% (68) 38% (122) 24% (77) 11% (34) 7% (23) 325Somewhat Unfavorable of Trump 9% (16) 22% (39) 25% (45) 34% (62) 10% (18) 182Very Unfavorable of Trump 6% (56) 7% (64) 12% (113) 71% (671) 5% (45) 950#1 Issue: Economy 21% (144) 19% (134) 17% (120) 35% (243) 7% (47) 688#1 Issue: Security 55% (141) 22% (55) 11% (27) 7% (19) 5% (12) 254#1 Issue: Health Care 13% (43) 13% (44) 16% (54) 52% (175) 6% (20) 335#1 Issue: Medicare / Social Security 24% (67) 14% (39) 12% (33) 40% (113) 11% (30) 283#1 Issue: Women’s Issues 10% (8) 15% (13) 13% (11) 60% (52) 2% (2) 86#1 Issue: Education 5% (6) 21% (22) 12% (13) 49% (52) 13% (14) 107#1 Issue: Energy 5% (4) 7% (6) 10% (8) 74% (58) 4% (3) 79#1 Issue: Other 13% (20) 15% (24) 9% (14) 52% (82) 11% (17) 1572018 House Vote: Democrat 6% (44) 9% (69) 13% (102) 69% (526) 3% (25) 7672018 House Vote: Republican 48% (301) 26% (162) 12% (77) 10% (63) 4% (26) 6292018 House Vote: Someone else 24% (17) 9% (6) 15% (11) 32% (23) 21% (16) 732016 Vote: Hillary Clinton 7% (47) 8% (54) 12% (84) 70% (488) 4% (27) 7002016 Vote: Donald Trump 46% (311) 27% (183) 14% (95) 8% (54) 5% (31) 6752016 Vote: Other 7% (11) 11% (16) 20% (29) 48% (69) 14% (20) 1442016 Vote: Didn’t Vote 14% (63) 18% (83) 16% (73) 39% (180) 14% (67) 466Voted in 2014: Yes 25% (329) 17% (219) 13% (169) 41% (538) 5% (66) 1322Voted in 2014: No 16% (104) 17% (116) 17% (112) 38% (255) 12% (79) 666
Continued on next page
Page 105
National Tracking Poll #2006102, June, 2020
105
Table POL4_6
Table POL4_6: How important of a priority should each of the following be for Congress?Constructing a wall along the U.S. / Mexico border
Demographic A top priority
An important,but lowerpriority
Not tooimportant apriority
Should not bedone
Don’t know /No opinion Total N
Registered Voters 22% (433) 17% (336) 14% (281) 40% (793) 7% (145) 19882012 Vote: Barack Obama 10% (88) 10% (83) 15% (129) 60% (512) 5% (40) 8532012 Vote: Mitt Romney 46% (230) 27% (137) 10% (51) 13% (63) 4% (21) 5012012 Vote: Other 32% (27) 24% (20) 9% (8) 21% (18) 14% (12) 842012 Vote: Didn’t Vote 16% (89) 17% (96) 17% (94) 36% (198) 13% (73) 5504-Region: Northeast 21% (74) 17% (59) 13% (47) 42% (150) 7% (24) 3554-Region: Midwest 22% (101) 18% (80) 14% (62) 40% (184) 6% (29) 4574-Region: South 25% (184) 17% (123) 15% (112) 35% (263) 8% (61) 7424-Region: West 17% (74) 17% (74) 14% (60) 45% (196) 7% (31) 434Party: Democrat/Leans Democrat 8% (69) 9% (83) 14% (123) 65% (594) 5% (42) 911Party: Republican/Leans Republican 43% (321) 28% (206) 14% (104) 9% (65) 6% (45) 741Parents 24% (207) 19% (165) 15% (126) 36% (311) 6% (55) 864Note: Row proportions may total to larger than one-hundred percent due to rounding. For more information visit MorningConsultIntelligence.com.
Page 106
106
Morning ConsultTable POL4_7
Table POL4_7: How important of a priority should each of the following be for Congress?Passing a bill that grants young people who were brought to the United States illegally when they were children, often with their parents, protectionfrom deportation
Demographic A top priority
An important,but lowerpriority
Not tooimportant apriority
Should not bedone
Don’t know /No opinion Total N
Registered Voters 32% (637) 30% (598) 13% (263) 16% (312) 9% (178) 1988Gender: Male 29% (268) 29% (269) 15% (139) 19% (173) 9% (81) 930Gender: Female 35% (369) 31% (329) 12% (124) 13% (139) 9% (97) 1058Age: 18-34 38% (190) 30% (148) 12% (61) 8% (42) 12% (58) 499Age: 35-44 31% (94) 28% (84) 16% (47) 14% (42) 12% (35) 302Age: 45-64 29% (209) 31% (226) 11% (83) 20% (146) 8% (61) 724Age: 65+ 31% (144) 30% (140) 15% (71) 18% (83) 5% (24) 463GenZers: 1997-2012 37% (83) 30% (67) 11% (25) 8% (17) 14% (32) 224Millennials: 1981-1996 35% (146) 28% (117) 15% (64) 11% (46) 11% (47) 419GenXers: 1965-1980 32% (162) 32% (163) 10% (53) 17% (88) 9% (46) 511Baby Boomers: 1946-1964 30% (227) 30% (225) 15% (112) 19% (145) 7% (50) 760PID: Dem (no lean) 50% (377) 33% (251) 6% (49) 5% (38) 6% (43) 757PID: Ind (no lean) 26% (166) 29% (182) 16% (100) 17% (106) 13% (85) 638PID: Rep (no lean) 16% (95) 28% (165) 19% (114) 28% (168) 8% (50) 593PID/Gender: DemMen 44% (145) 37% (121) 9% (28) 5% (15) 6% (19) 329PID/Gender: DemWomen 54% (232) 30% (130) 5% (20) 5% (23) 6% (24) 429PID/Gender: Ind Men 24% (70) 24% (72) 17% (51) 22% (65) 13% (38) 296PID/Gender: Ind Women 28% (96) 32% (110) 14% (49) 12% (40) 14% (47) 342PID/Gender: Rep Men 17% (53) 25% (76) 20% (60) 30% (92) 8% (24) 306PID/Gender: Rep Women 14% (42) 31% (89) 19% (54) 27% (76) 9% (26) 287Ideo: Liberal (1-3) 48% (291) 35% (215) 7% (42) 6% (38) 4% (22) 609Ideo: Moderate (4) 33% (174) 33% (171) 13% (68) 10% (51) 11% (58) 522Ideo: Conservative (5-7) 17% (118) 26% (173) 19% (131) 31% (208) 7% (49) 679Educ: < College 31% (384) 28% (351) 14% (178) 16% (205) 11% (133) 1250Educ: Bachelors degree 31% (144) 34% (162) 13% (61) 15% (68) 7% (35) 470Educ: Post-grad 41% (109) 32% (85) 9% (24) 15% (39) 4% (11) 267Income: Under 50k 34% (335) 28% (276) 14% (136) 14% (143) 11% (108) 998Income: 50k-100k 30% (197) 30% (199) 14% (96) 19% (122) 7% (46) 660Income: 100k+ 32% (105) 37% (122) 9% (31) 14% (47) 7% (24) 329
Continued on next page
Page 107
National Tracking Poll #2006102, June, 2020
107
Table POL4_7
Table POL4_7: How important of a priority should each of the following be for Congress?Passing a bill that grants young people who were brought to the United States illegally when they were children, often with their parents, protectionfrom deportation
Demographic A top priority
An important,but lowerpriority
Not tooimportant apriority
Should not bedone
Don’t know /No opinion Total N
Registered Voters 32% (637) 30% (598) 13% (263) 16% (312) 9% (178) 1988Ethnicity: White 29% (474) 31% (499) 14% (223) 17% (275) 9% (138) 1608Ethnicity: Hispanic 41% (79) 26% (50) 11% (21) 11% (21) 11% (20) 193Ethnicity: Afr. Am. 43% (109) 25% (63) 12% (29) 9% (24) 11% (27) 252Ethnicity: Other 42% (54) 29% (37) 8% (11) 11% (14) 10% (13) 128All Christian 28% (265) 30% (286) 14% (133) 20% (190) 7% (67) 941All Non-Christian 45% (44) 35% (34) 8% (8) 6% (6) 6% (6) 97Atheist 37% (48) 33% (42) 15% (19) 10% (13) 5% (6) 128Agnostic/Nothing in particular 35% (168) 30% (141) 13% (61) 10% (48) 13% (60) 478Something Else 33% (112) 28% (95) 12% (43) 16% (56) 11% (38) 344Religious Non-Protestant/Catholic 42% (50) 38% (46) 9% (11) 6% (7) 5% (6) 120Evangelical 27% (139) 27% (137) 14% (72) 22% (109) 10% (49) 505Non-Evangelical 31% (230) 30% (226) 13% (99) 18% (135) 7% (55) 746Community: Urban 38% (188) 29% (140) 12% (61) 10% (49) 10% (51) 490Community: Suburban 32% (317) 32% (318) 12% (120) 15% (152) 8% (74) 981Community: Rural 26% (132) 27% (140) 16% (81) 21% (111) 10% (53) 517Employ: Private Sector 32% (199) 31% (194) 13% (82) 18% (113) 7% (43) 631Employ: Government 30% (40) 35% (48) 15% (21) 12% (16) 8% (11) 136Employ: Self-Employed 35% (46) 26% (34) 8% (10) 17% (22) 13% (17) 130Employ: Homemaker 35% (41) 20% (24) 18% (21) 10% (11) 17% (19) 115Employ: Retired 29% (144) 32% (155) 16% (79) 18% (91) 5% (23) 492Employ: Unemployed 33% (77) 27% (61) 11% (26) 14% (32) 14% (33) 229Employ: Other 36% (54) 29% (45) 8% (13) 13% (19) 14% (21) 152Military HH: Yes 30% (93) 26% (79) 17% (52) 18% (56) 9% (27) 306Military HH: No 32% (544) 31% (519) 13% (211) 15% (256) 9% (151) 1682RD/WT: Right Direction 19% (106) 25% (141) 19% (108) 28% (160) 9% (53) 567RD/WT: Wrong Track 37% (532) 32% (456) 11% (155) 11% (153) 9% (125) 1421Trump Job Approve 16% (121) 25% (192) 21% (165) 29% (225) 9% (71) 774Trump Job Disapprove 44% (508) 34% (395) 8% (87) 7% (82) 7% (80) 1153
Continued on next page
Page 108
108
Morning ConsultTable POL4_7
Table POL4_7: How important of a priority should each of the following be for Congress?Passing a bill that grants young people who were brought to the United States illegally when they were children, often with their parents, protectionfrom deportation
Demographic A top priority
An important,but lowerpriority
Not tooimportant apriority
Should not bedone
Don’t know /No opinion Total N
Registered Voters 32% (637) 30% (598) 13% (263) 16% (312) 9% (178) 1988Trump Job Strongly Approve 15% (64) 20% (83) 18% (76) 39% (160) 8% (32) 415Trump Job Somewhat Approve 16% (56) 30% (109) 25% (89) 18% (66) 11% (39) 359Trump Job Somewhat Disapprove 29% (65) 39% (89) 14% (31) 9% (21) 9% (21) 226Trump Job Strongly Disapprove 48% (443) 33% (306) 6% (57) 7% (61) 6% (59) 927Favorable of Trump 16% (125) 24% (187) 21% (162) 30% (237) 10% (77) 787Unfavorable of Trump 44% (501) 35% (399) 8% (90) 6% (73) 6% (69) 1132Very Favorable of Trump 14% (63) 19% (89) 20% (91) 39% (179) 9% (41) 462Somewhat Favorable of Trump 19% (62) 30% (99) 22% (71) 18% (57) 11% (36) 325Somewhat Unfavorable of Trump 23% (42) 42% (77) 14% (26) 12% (22) 8% (15) 182Very Unfavorable of Trump 48% (459) 34% (322) 7% (64) 5% (51) 6% (54) 950#1 Issue: Economy 26% (180) 33% (228) 17% (118) 16% (109) 8% (53) 688#1 Issue: Security 15% (39) 23% (58) 16% (40) 37% (93) 10% (24) 254#1 Issue: Health Care 42% (141) 31% (103) 10% (33) 10% (34) 7% (24) 335#1 Issue: Medicare / Social Security 35% (100) 29% (83) 11% (30) 13% (37) 11% (32) 283#1 Issue: Women’s Issues 41% (36) 35% (30) 7% (6) 11% (10) 5% (4) 86#1 Issue: Education 44% (47) 28% (29) 11% (12) 3% (3) 15% (15) 107#1 Issue: Energy 35% (28) 44% (35) 6% (4) 7% (6) 8% (6) 79#1 Issue: Other 43% (68) 21% (32) 12% (19) 13% (20) 11% (18) 1572018 House Vote: Democrat 50% (385) 33% (252) 8% (59) 5% (40) 4% (31) 7672018 House Vote: Republican 15% (97) 27% (173) 18% (115) 32% (201) 7% (43) 6292018 House Vote: Someone else 20% (15) 23% (17) 13% (10) 24% (17) 21% (15) 732016 Vote: Hillary Clinton 49% (343) 34% (239) 7% (52) 5% (34) 5% (32) 7002016 Vote: Donald Trump 15% (99) 26% (174) 20% (132) 33% (222) 7% (48) 6752016 Vote: Other 32% (47) 36% (52) 13% (19) 10% (14) 9% (12) 1442016 Vote: Didn’t Vote 32% (148) 29% (133) 13% (60) 9% (41) 18% (84) 466Voted in 2014: Yes 32% (429) 30% (392) 13% (172) 19% (247) 6% (83) 1322Voted in 2014: No 31% (208) 31% (206) 14% (91) 10% (66) 14% (95) 666
Continued on next page
Page 109
National Tracking Poll #2006102, June, 2020
109
Table POL4_7
Table POL4_7: How important of a priority should each of the following be for Congress?Passing a bill that grants young people who were brought to the United States illegally when they were children, often with their parents, protectionfrom deportation
Demographic A top priority
An important,but lowerpriority
Not tooimportant apriority
Should not bedone
Don’t know /No opinion Total N
Registered Voters 32% (637) 30% (598) 13% (263) 16% (312) 9% (178) 19882012 Vote: Barack Obama 44% (379) 35% (299) 8% (66) 7% (64) 5% (46) 8532012 Vote: Mitt Romney 13% (65) 26% (132) 21% (107) 33% (165) 7% (33) 5012012 Vote: Other 23% (19) 12% (10) 15% (13) 33% (28) 16% (14) 842012 Vote: Didn’t Vote 32% (174) 29% (157) 14% (77) 10% (55) 16% (86) 5504-Region: Northeast 33% (116) 28% (98) 12% (44) 18% (64) 9% (33) 3554-Region: Midwest 29% (133) 31% (142) 14% (63) 18% (82) 8% (37) 4574-Region: South 30% (226) 29% (218) 14% (103) 17% (127) 9% (69) 7424-Region: West 38% (163) 32% (141) 12% (53) 9% (39) 9% (39) 434Party: Democrat/Leans Democrat 49% (448) 34% (308) 7% (63) 5% (45) 5% (47) 911Party: Republican/Leans Republican 16% (117) 26% (193) 20% (152) 28% (210) 9% (68) 741Parents 31% (268) 31% (268) 14% (118) 15% (128) 9% (81) 864Note: Row proportions may total to larger than one-hundred percent due to rounding. For more information visit MorningConsultIntelligence.com.
Page 110
110
Morning ConsultTable POL4_8
Table POL4_8: How important of a priority should each of the following be for Congress?Reducing the federal budget deficit
Demographic A top priority
An important,but lowerpriority
Not tooimportant apriority
Should not bedone
Don’t know /No opinion Total N
Registered Voters 39% (776) 37% (727) 12% (247) 2% (32) 10% (206) 1988Gender: Male 41% (385) 33% (307) 16% (147) 2% (17) 8% (74) 930Gender: Female 37% (392) 40% (420) 9% (100) 1% (14) 12% (132) 1058Age: 18-34 29% (145) 32% (158) 19% (93) 2% (10) 19% (92) 499Age: 35-44 36% (107) 39% (118) 12% (35) 2% (7) 11% (34) 302Age: 45-64 41% (296) 36% (264) 13% (91) 2% (11) 8% (61) 724Age: 65+ 49% (227) 40% (187) 6% (27) 1% (3) 4% (18) 463GenZers: 1997-2012 21% (48) 32% (72) 18% (41) 3% (7) 25% (56) 224Millennials: 1981-1996 36% (149) 32% (134) 17% (72) 2% (7) 14% (57) 419GenXers: 1965-1980 40% (204) 39% (201) 11% (58) 2% (9) 8% (40) 511Baby Boomers: 1946-1964 44% (331) 39% (300) 9% (72) 1% (8) 6% (49) 760PID: Dem (no lean) 36% (273) 38% (288) 17% (128) 2% (12) 7% (55) 757PID: Ind (no lean) 34% (220) 35% (224) 12% (75) 2% (11) 17% (107) 638PID: Rep (no lean) 48% (283) 36% (215) 7% (44) 1% (8) 7% (43) 593PID/Gender: DemMen 37% (121) 34% (112) 21% (68) 3% (9) 6% (19) 329PID/Gender: DemWomen 36% (153) 41% (176) 14% (60) 1% (3) 9% (37) 429PID/Gender: Ind Men 38% (112) 31% (91) 16% (48) 1% (3) 14% (41) 296PID/Gender: Ind Women 32% (108) 39% (133) 8% (27) 2% (8) 19% (66) 342PID/Gender: Rep Men 50% (152) 34% (104) 10% (31) 2% (5) 5% (14) 306PID/Gender: Rep Women 46% (131) 39% (111) 4% (13) 1% (3) 10% (29) 287Ideo: Liberal (1-3) 31% (186) 43% (260) 18% (109) 3% (17) 6% (37) 609Ideo: Moderate (4) 37% (192) 37% (193) 14% (71) 1% (4) 12% (61) 522Ideo: Conservative (5-7) 52% (350) 34% (234) 7% (49) 1% (8) 6% (39) 679Educ: < College 41% (508) 34% (428) 11% (137) 1% (17) 13% (160) 1250Educ: Bachelors degree 35% (162) 39% (182) 16% (77) 2% (9) 9% (40) 470Educ: Post-grad 40% (106) 44% (117) 12% (33) 2% (5) 2% (6) 267Income: Under 50k 39% (392) 35% (345) 12% (118) 1% (9) 13% (135) 998Income: 50k-100k 39% (260) 37% (247) 12% (81) 2% (15) 9% (57) 660Income: 100k+ 38% (124) 41% (135) 14% (48) 2% (8) 4% (15) 329Ethnicity: White 40% (644) 37% (596) 12% (199) 2% (27) 9% (142) 1608
Continued on next page
Page 111
National Tracking Poll #2006102, June, 2020
111
Table POL4_8
Table POL4_8: How important of a priority should each of the following be for Congress?Reducing the federal budget deficit
Demographic A top priority
An important,but lowerpriority
Not tooimportant apriority
Should not bedone
Don’t know /No opinion Total N
Registered Voters 39% (776) 37% (727) 12% (247) 2% (32) 10% (206) 1988Ethnicity: Hispanic 35% (68) 31% (61) 16% (31) 2% (3) 16% (30) 193Ethnicity: Afr. Am. 35% (89) 33% (82) 12% (31) 2% (5) 18% (45) 252Ethnicity: Other 34% (44) 38% (48) 13% (16) — (0) 15% (19) 128All Christian 45% (426) 36% (343) 10% (91) 1% (14) 7% (67) 941All Non-Christian 27% (26) 41% (40) 23% (22) 2% (2) 8% (8) 97Atheist 31% (40) 41% (53) 15% (19) 5% (6) 8% (10) 128Agnostic/Nothing in particular 32% (152) 36% (171) 16% (78) 1% (6) 15% (71) 478Something Else 39% (133) 35% (120) 11% (37) 1% (4) 15% (50) 344Religious Non-Protestant/Catholic 27% (33) 43% (52) 20% (24) 1% (2) 8% (10) 120Evangelical 46% (232) 35% (178) 6% (30) 2% (9) 11% (56) 505Non-Evangelical 42% (316) 37% (273) 12% (89) 1% (9) 8% (58) 746Community: Urban 37% (181) 34% (165) 15% (74) 2% (10) 12% (59) 490Community: Suburban 41% (400) 37% (362) 12% (116) 2% (16) 9% (88) 981Community: Rural 38% (195) 39% (201) 11% (58) 1% (5) 11% (59) 517Employ: Private Sector 39% (248) 37% (233) 15% (95) 3% (16) 6% (39) 631Employ: Government 35% (48) 38% (51) 15% (20) 1% (1) 11% (15) 136Employ: Self-Employed 35% (45) 30% (39) 17% (23) 2% (3) 16% (20) 130Employ: Homemaker 33% (38) 40% (46) 7% (8) 1% (1) 20% (23) 115Employ: Retired 49% (243) 39% (191) 7% (34) 1% (3) 4% (22) 492Employ: Unemployed 35% (79) 31% (70) 13% (31) 3% (6) 19% (42) 229Employ: Other 35% (53) 38% (58) 13% (19) — (0) 15% (22) 152Military HH: Yes 51% (155) 31% (96) 11% (33) 1% (2) 6% (19) 306Military HH: No 37% (621) 37% (631) 13% (214) 2% (29) 11% (187) 1682RD/WT: Right Direction 46% (261) 33% (189) 10% (58) 1% (5) 10% (56) 567RD/WT: Wrong Track 36% (515) 38% (538) 13% (190) 2% (27) 11% (150) 1421Trump Job Approve 47% (364) 35% (272) 9% (71) 1% (11) 7% (56) 774Trump Job Disapprove 34% (397) 39% (445) 15% (171) 2% (21) 10% (119) 1153
Continued on next page
Page 112
112
Morning ConsultTable POL4_8
Table POL4_8: How important of a priority should each of the following be for Congress?Reducing the federal budget deficit
Demographic A top priority
An important,but lowerpriority
Not tooimportant apriority
Should not bedone
Don’t know /No opinion Total N
Registered Voters 39% (776) 37% (727) 12% (247) 2% (32) 10% (206) 1988Trump Job Strongly Approve 51% (213) 36% (148) 6% (24) 1% (4) 6% (26) 415Trump Job Somewhat Approve 42% (151) 35% (124) 13% (47) 2% (6) 8% (30) 359Trump Job Somewhat Disapprove 40% (90) 37% (83) 8% (19) 1% (2) 14% (33) 226Trump Job Strongly Disapprove 33% (307) 39% (362) 16% (152) 2% (20) 9% (87) 927Favorable of Trump 48% (376) 34% (268) 9% (70) 1% (10) 8% (63) 787Unfavorable of Trump 34% (388) 40% (448) 15% (170) 2% (21) 9% (106) 1132Very Favorable of Trump 50% (230) 34% (157) 7% (33) 1% (5) 8% (38) 462Somewhat Favorable of Trump 45% (146) 34% (111) 11% (37) 1% (5) 8% (26) 325Somewhat Unfavorable of Trump 37% (68) 39% (70) 11% (20) 1% (1) 12% (22) 182Very Unfavorable of Trump 34% (320) 40% (377) 16% (150) 2% (20) 9% (84) 950#1 Issue: Economy 43% (294) 35% (241) 11% (74) 2% (10) 10% (68) 688#1 Issue: Security 47% (119) 35% (88) 8% (21) 1% (2) 9% (23) 254#1 Issue: Health Care 37% (123) 35% (118) 17% (56) 3% (10) 9% (29) 335#1 Issue: Medicare / Social Security 38% (109) 39% (112) 11% (31) 1% (2) 10% (29) 283#1 Issue: Women’s Issues 26% (22) 43% (37) 17% (15) 4% (3) 11% (9) 86#1 Issue: Education 30% (32) 47% (50) 11% (12) — (0) 12% (13) 107#1 Issue: Energy 31% (25) 39% (31) 16% (12) 3% (2) 11% (9) 79#1 Issue: Other 33% (52) 33% (51) 17% (26) 1% (1) 16% (26) 1572018 House Vote: Democrat 34% (259) 42% (325) 15% (117) 2% (13) 7% (54) 7672018 House Vote: Republican 51% (320) 37% (233) 7% (43) 1% (4) 5% (29) 6292018 House Vote: Someone else 44% (32) 31% (23) 8% (6) 3% (2) 14% (10) 732016 Vote: Hillary Clinton 33% (232) 42% (296) 16% (112) 1% (10) 7% (50) 7002016 Vote: Donald Trump 52% (350) 35% (239) 6% (41) 1% (7) 5% (37) 6752016 Vote: Other 43% (62) 38% (55) 8% (12) 2% (3) 9% (13) 1442016 Vote: Didn’t Vote 28% (129) 29% (137) 17% (81) 3% (12) 23% (106) 466Voted in 2014: Yes 42% (558) 39% (511) 11% (148) 1% (19) 6% (86) 1322Voted in 2014: No 33% (218) 32% (216) 15% (99) 2% (13) 18% (121) 666
Continued on next page
Page 113
National Tracking Poll #2006102, June, 2020
113
Table POL4_8
Table POL4_8: How important of a priority should each of the following be for Congress?Reducing the federal budget deficit
Demographic A top priority
An important,but lowerpriority
Not tooimportant apriority
Should not bedone
Don’t know /No opinion Total N
Registered Voters 39% (776) 37% (727) 12% (247) 2% (32) 10% (206) 19882012 Vote: Barack Obama 37% (316) 41% (351) 13% (114) 2% (13) 7% (59) 8532012 Vote: Mitt Romney 51% (256) 36% (180) 7% (37) 1% (5) 5% (23) 5012012 Vote: Other 38% (32) 36% (30) 11% (9) 2% (1) 13% (11) 842012 Vote: Didn’t Vote 31% (172) 30% (166) 16% (87) 2% (12) 20% (113) 5504-Region: Northeast 38% (134) 37% (130) 13% (47) 2% (8) 10% (35) 3554-Region: Midwest 36% (166) 36% (166) 13% (60) 3% (12) 12% (53) 4574-Region: South 42% (310) 36% (266) 10% (78) 1% (8) 11% (81) 7424-Region: West 38% (166) 38% (164) 15% (63) 1% (4) 8% (37) 434Party: Democrat/Leans Democrat 35% (318) 40% (364) 16% (143) 2% (16) 8% (70) 911Party: Republican/Leans Republican 47% (346) 35% (262) 9% (66) 1% (9) 8% (58) 741Parents 41% (355) 37% (318) 11% (95) 2% (18) 9% (77) 864Note: Row proportions may total to larger than one-hundred percent due to rounding. For more information visit MorningConsultIntelligence.com.
Page 114
114
Morning ConsultTable POL4_9
Table POL4_9: How important of a priority should each of the following be for Congress?Passing legislation placing additional restrictions on gun ownership
Demographic A top priority
An important,but lowerpriority
Not tooimportant apriority
Should not bedone
Don’t know /No opinion Total N
Registered Voters 32% (628) 23% (466) 13% (252) 24% (476) 8% (166) 1988Gender: Male 27% (256) 24% (222) 13% (124) 27% (247) 9% (82) 930Gender: Female 35% (373) 23% (244) 12% (127) 22% (230) 8% (84) 1058Age: 18-34 32% (159) 27% (136) 15% (73) 15% (75) 11% (57) 499Age: 35-44 30% (90) 28% (84) 12% (36) 23% (71) 7% (22) 302Age: 45-64 31% (222) 21% (155) 12% (88) 27% (192) 9% (68) 724Age: 65+ 34% (157) 20% (91) 12% (55) 30% (139) 4% (20) 463GenZers: 1997-2012 30% (68) 29% (64) 13% (29) 13% (30) 15% (33) 224Millennials: 1981-1996 31% (131) 28% (118) 13% (57) 19% (80) 8% (34) 419GenXers: 1965-1980 28% (145) 23% (120) 13% (68) 25% (130) 10% (49) 511Baby Boomers: 1946-1964 34% (258) 20% (152) 12% (92) 28% (212) 6% (47) 760PID: Dem (no lean) 52% (396) 30% (228) 9% (66) 4% (30) 5% (37) 757PID: Ind (no lean) 22% (142) 21% (136) 16% (101) 27% (170) 14% (89) 638PID: Rep (no lean) 15% (90) 17% (102) 14% (85) 47% (276) 7% (39) 593PID/Gender: DemMen 47% (153) 34% (112) 9% (30) 5% (16) 5% (18) 329PID/Gender: DemWomen 57% (243) 27% (116) 8% (35) 3% (14) 5% (19) 429PID/Gender: Ind Men 19% (57) 20% (58) 16% (46) 30% (90) 15% (45) 296PID/Gender: Ind Women 25% (85) 23% (78) 16% (54) 23% (80) 13% (44) 342PID/Gender: Rep Men 15% (45) 17% (52) 16% (48) 46% (141) 6% (19) 306PID/Gender: Rep Women 16% (44) 17% (50) 13% (38) 47% (135) 7% (20) 287Ideo: Liberal (1-3) 48% (295) 31% (188) 13% (79) 4% (24) 4% (23) 609Ideo: Moderate (4) 34% (179) 24% (125) 13% (69) 19% (97) 10% (53) 522Ideo: Conservative (5-7) 16% (110) 16% (112) 14% (93) 49% (330) 5% (35) 679Educ: < College 30% (377) 21% (260) 12% (151) 27% (334) 10% (129) 1250Educ: Bachelors degree 33% (156) 27% (129) 14% (64) 20% (92) 6% (29) 470Educ: Post-grad 36% (96) 29% (77) 14% (37) 19% (50) 3% (8) 267Income: Under 50k 32% (317) 22% (224) 12% (120) 22% (224) 11% (114) 998Income: 50k-100k 30% (198) 23% (149) 13% (88) 28% (185) 6% (40) 660Income: 100k+ 35% (114) 28% (93) 13% (44) 21% (68) 3% (11) 329Ethnicity: White 30% (476) 23% (375) 12% (200) 27% (442) 7% (114) 1608
Continued on next page
Page 115
National Tracking Poll #2006102, June, 2020
115
Table POL4_9
Table POL4_9: How important of a priority should each of the following be for Congress?Passing legislation placing additional restrictions on gun ownership
Demographic A top priority
An important,but lowerpriority
Not tooimportant apriority
Should not bedone
Don’t know /No opinion Total N
Registered Voters 32% (628) 23% (466) 13% (252) 24% (476) 8% (166) 1988Ethnicity: Hispanic 36% (69) 22% (43) 17% (32) 10% (20) 15% (28) 193Ethnicity: Afr. Am. 40% (102) 25% (64) 13% (33) 8% (21) 13% (32) 252Ethnicity: Other 39% (50) 21% (27) 14% (18) 10% (13) 15% (19) 128All Christian 30% (278) 23% (212) 13% (124) 29% (273) 6% (54) 941All Non-Christian 46% (45) 33% (32) 8% (8) 8% (8) 5% (5) 97Atheist 41% (53) 27% (35) 15% (19) 13% (17) 3% (4) 128Agnostic/Nothing in particular 32% (154) 26% (125) 12% (57) 18% (84) 12% (58) 478Something Else 29% (99) 18% (62) 13% (44) 28% (95) 13% (45) 344Religious Non-Protestant/Catholic 42% (50) 32% (39) 8% (10) 14% (17) 4% (5) 120Evangelical 24% (119) 20% (100) 14% (69) 34% (173) 9% (43) 505Non-Evangelical 34% (253) 22% (162) 13% (95) 24% (182) 7% (53) 746Community: Urban 38% (185) 25% (123) 10% (47) 17% (84) 10% (50) 490Community: Suburban 32% (311) 26% (254) 14% (136) 22% (212) 7% (69) 981Community: Rural 26% (132) 17% (90) 13% (69) 35% (181) 9% (46) 517Employ: Private Sector 30% (192) 28% (174) 13% (82) 25% (155) 5% (29) 631Employ: Government 27% (37) 24% (33) 20% (27) 19% (25) 10% (13) 136Employ: Self-Employed 27% (35) 29% (38) 10% (13) 23% (30) 11% (14) 130Employ: Homemaker 28% (32) 18% (21) 11% (13) 30% (34) 13% (15) 115Employ: Retired 35% (172) 18% (88) 12% (57) 29% (145) 6% (29) 492Employ: Unemployed 30% (68) 20% (47) 15% (35) 21% (48) 14% (33) 229Employ: Other 35% (54) 24% (37) 11% (17) 17% (25) 13% (20) 152Military HH: Yes 27% (81) 19% (59) 13% (40) 35% (106) 6% (20) 306Military HH: No 33% (547) 24% (407) 13% (212) 22% (370) 9% (146) 1682RD/WT: Right Direction 18% (100) 17% (97) 13% (73) 44% (249) 9% (49) 567RD/WT: Wrong Track 37% (529) 26% (369) 13% (179) 16% (227) 8% (117) 1421Trump Job Approve 14% (108) 16% (127) 16% (121) 47% (366) 7% (51) 774Trump Job Disapprove 44% (511) 28% (326) 11% (124) 9% (105) 8% (87) 1153
Continued on next page
Page 116
116
Morning ConsultTable POL4_9
Table POL4_9: How important of a priority should each of the following be for Congress?Passing legislation placing additional restrictions on gun ownership
Demographic A top priority
An important,but lowerpriority
Not tooimportant apriority
Should not bedone
Don’t know /No opinion Total N
Registered Voters 32% (628) 23% (466) 13% (252) 24% (476) 8% (166) 1988Trump Job Strongly Approve 14% (60) 12% (49) 10% (42) 57% (238) 6% (26) 415Trump Job Somewhat Approve 14% (49) 22% (78) 22% (79) 36% (129) 7% (25) 359Trump Job Somewhat Disapprove 32% (73) 28% (64) 15% (35) 17% (37) 7% (17) 226Trump Job Strongly Disapprove 47% (438) 28% (262) 10% (89) 7% (68) 8% (71) 927Favorable of Trump 14% (108) 16% (124) 15% (118) 48% (376) 8% (61) 787Unfavorable of Trump 45% (506) 29% (332) 11% (129) 8% (91) 7% (74) 1132Very Favorable of Trump 13% (61) 12% (56) 11% (49) 56% (261) 8% (35) 462Somewhat Favorable of Trump 14% (47) 21% (68) 21% (69) 35% (115) 8% (26) 325Somewhat Unfavorable of Trump 29% (53) 29% (53) 18% (33) 16% (30) 7% (13) 182Very Unfavorable of Trump 48% (453) 29% (279) 10% (96) 6% (61) 6% (60) 950#1 Issue: Economy 25% (169) 25% (174) 16% (112) 27% (184) 7% (49) 688#1 Issue: Security 20% (51) 13% (32) 11% (29) 51% (129) 5% (13) 254#1 Issue: Health Care 41% (136) 29% (99) 10% (34) 12% (39) 8% (27) 335#1 Issue: Medicare / Social Security 42% (120) 16% (46) 8% (24) 21% (60) 12% (33) 283#1 Issue: Women’s Issues 39% (34) 35% (30) 12% (10) 7% (6) 7% (6) 86#1 Issue: Education 34% (37) 25% (27) 14% (15) 14% (15) 13% (14) 107#1 Issue: Energy 41% (32) 31% (24) 12% (10) 10% (8) 6% (5) 79#1 Issue: Other 32% (50) 21% (33) 11% (18) 24% (37) 12% (18) 1572018 House Vote: Democrat 51% (391) 30% (227) 10% (73) 6% (43) 4% (33) 7672018 House Vote: Republican 14% (89) 16% (102) 15% (96) 50% (314) 5% (29) 6292018 House Vote: Someone else 21% (15) 17% (13) 18% (13) 26% (19) 18% (13) 732016 Vote: Hillary Clinton 52% (366) 29% (202) 9% (65) 5% (35) 5% (33) 7002016 Vote: Donald Trump 15% (99) 16% (105) 15% (100) 50% (336) 5% (35) 6752016 Vote: Other 21% (31) 32% (46) 15% (22) 20% (29) 11% (16) 1442016 Vote: Didn’t Vote 28% (132) 24% (113) 14% (65) 16% (76) 17% (81) 466Voted in 2014: Yes 33% (441) 22% (291) 13% (174) 26% (350) 5% (65) 1322Voted in 2014: No 28% (187) 26% (175) 12% (78) 19% (126) 15% (100) 666
Continued on next page
Page 117
National Tracking Poll #2006102, June, 2020
117
Table POL4_9
Table POL4_9: How important of a priority should each of the following be for Congress?Passing legislation placing additional restrictions on gun ownership
Demographic A top priority
An important,but lowerpriority
Not tooimportant apriority
Should not bedone
Don’t know /No opinion Total N
Registered Voters 32% (628) 23% (466) 13% (252) 24% (476) 8% (166) 19882012 Vote: Barack Obama 48% (407) 26% (218) 11% (97) 10% (89) 5% (43) 8532012 Vote: Mitt Romney 12% (58) 18% (92) 15% (75) 50% (252) 5% (23) 5012012 Vote: Other 15% (13) 13% (10) 13% (11) 47% (39) 12% (10) 842012 Vote: Didn’t Vote 27% (150) 27% (146) 13% (69) 17% (95) 16% (90) 5504-Region: Northeast 35% (125) 24% (84) 11% (38) 21% (76) 9% (31) 3554-Region: Midwest 28% (130) 24% (110) 11% (52) 29% (133) 7% (31) 4574-Region: South 29% (218) 21% (156) 16% (117) 25% (186) 9% (67) 7424-Region: West 36% (156) 27% (116) 10% (45) 19% (81) 8% (37) 434Party: Democrat/Leans Democrat 50% (455) 30% (273) 10% (88) 5% (48) 5% (48) 911Party: Republican/Leans Republican 15% (110) 17% (124) 15% (108) 47% (349) 7% (49) 741Parents 29% (254) 24% (204) 12% (104) 27% (230) 8% (72) 864Note: Row proportions may total to larger than one-hundred percent due to rounding. For more information visit MorningConsultIntelligence.com.
Page 118
118
Morning ConsultTable POL4_10
Table POL4_10: How important of a priority should each of the following be for Congress?Regulating tech companies
Demographic A top priority
An important,but lowerpriority
Not tooimportant apriority
Should not bedone
Don’t know /No opinion Total N
Registered Voters 15% (303) 35% (688) 30% (591) 7% (133) 14% (273) 1988Gender: Male 18% (167) 35% (329) 29% (269) 8% (75) 10% (92) 930Gender: Female 13% (137) 34% (359) 30% (322) 5% (58) 17% (182) 1058Age: 18-34 17% (86) 30% (149) 29% (147) 6% (28) 18% (89) 499Age: 35-44 15% (44) 34% (103) 27% (83) 10% (29) 14% (42) 302Age: 45-64 14% (98) 36% (259) 31% (226) 6% (45) 13% (96) 724Age: 65+ 16% (75) 38% (176) 29% (135) 7% (30) 10% (46) 463GenZers: 1997-2012 16% (35) 25% (56) 32% (71) 5% (12) 22% (49) 224Millennials: 1981-1996 16% (68) 34% (142) 27% (113) 8% (35) 15% (62) 419GenXers: 1965-1980 17% (86) 35% (177) 31% (156) 6% (32) 12% (61) 511Baby Boomers: 1946-1964 14% (103) 38% (290) 29% (223) 6% (48) 13% (95) 760PID: Dem (no lean) 15% (115) 41% (308) 30% (226) 4% (32) 10% (76) 757PID: Ind (no lean) 14% (88) 30% (192) 29% (187) 8% (51) 19% (120) 638PID: Rep (no lean) 17% (100) 32% (188) 30% (178) 8% (50) 13% (77) 593PID/Gender: DemMen 18% (61) 41% (134) 29% (95) 5% (15) 7% (25) 329PID/Gender: DemWomen 13% (55) 41% (174) 31% (132) 4% (17) 12% (51) 429PID/Gender: Ind Men 15% (45) 30% (88) 30% (89) 11% (32) 14% (42) 296PID/Gender: Ind Women 13% (43) 30% (104) 29% (98) 6% (19) 23% (78) 342PID/Gender: Rep Men 20% (61) 35% (107) 28% (85) 9% (28) 8% (25) 306PID/Gender: Rep Women 13% (38) 28% (81) 32% (93) 8% (22) 18% (53) 287Ideo: Liberal (1-3) 13% (81) 42% (256) 32% (197) 5% (30) 7% (44) 609Ideo: Moderate (4) 17% (86) 32% (169) 30% (155) 6% (33) 15% (78) 522Ideo: Conservative (5-7) 16% (111) 34% (230) 30% (204) 9% (63) 10% (71) 679Educ: < College 17% (207) 32% (400) 28% (356) 6% (76) 17% (212) 1250Educ: Bachelors degree 12% (57) 37% (172) 32% (150) 8% (40) 11% (51) 470Educ: Post-grad 15% (40) 43% (115) 32% (85) 6% (17) 4% (11) 267Income: Under 50k 17% (165) 33% (327) 28% (278) 5% (55) 17% (174) 998Income: 50k-100k 14% (93) 35% (233) 32% (212) 7% (45) 12% (77) 660Income: 100k+ 14% (45) 39% (128) 31% (101) 10% (33) 7% (22) 329Ethnicity: White 15% (237) 35% (560) 31% (491) 7% (113) 13% (206) 1608
Continued on next page
Page 119
National Tracking Poll #2006102, June, 2020
119
Table POL4_10
Table POL4_10: How important of a priority should each of the following be for Congress?Regulating tech companies
Demographic A top priority
An important,but lowerpriority
Not tooimportant apriority
Should not bedone
Don’t know /No opinion Total N
Registered Voters 15% (303) 35% (688) 30% (591) 7% (133) 14% (273) 1988Ethnicity: Hispanic 16% (31) 33% (63) 28% (55) 4% (7) 19% (36) 193Ethnicity: Afr. Am. 19% (48) 33% (82) 27% (68) 5% (13) 17% (42) 252Ethnicity: Other 15% (19) 35% (45) 25% (32) 5% (7) 20% (25) 128All Christian 14% (136) 35% (331) 30% (281) 8% (80) 12% (113) 941All Non-Christian 14% (13) 44% (43) 27% (27) 5% (5) 10% (9) 97Atheist 16% (20) 35% (44) 34% (43) 4% (5) 12% (15) 128Agnostic/Nothing in particular 14% (65) 35% (167) 27% (130) 6% (30) 18% (85) 478Something Else 20% (68) 30% (103) 32% (110) 4% (13) 14% (50) 344Religious Non-Protestant/Catholic 12% (15) 41% (49) 29% (35) 5% (6) 12% (15) 120Evangelical 19% (97) 34% (173) 28% (141) 8% (38) 11% (55) 505Non-Evangelical 14% (105) 33% (248) 32% (241) 7% (51) 14% (102) 746Community: Urban 17% (82) 38% (185) 28% (138) 5% (24) 12% (61) 490Community: Suburban 14% (133) 37% (359) 31% (304) 7% (66) 12% (120) 981Community: Rural 17% (89) 28% (144) 29% (149) 8% (43) 18% (93) 517Employ: Private Sector 16% (98) 38% (237) 30% (188) 8% (49) 9% (58) 631Employ: Government 15% (20) 36% (49) 27% (36) 8% (11) 14% (19) 136Employ: Self-Employed 14% (18) 35% (45) 29% (38) 7% (9) 16% (21) 130Employ: Homemaker 18% (21) 24% (28) 29% (33) 4% (4) 25% (29) 115Employ: Retired 16% (78) 37% (180) 33% (161) 6% (30) 9% (43) 492Employ: Unemployed 16% (37) 29% (66) 24% (55) 9% (20) 22% (51) 229Employ: Other 15% (23) 33% (51) 25% (38) 4% (7) 22% (33) 152Military HH: Yes 17% (51) 34% (104) 31% (96) 8% (25) 10% (30) 306Military HH: No 15% (252) 35% (584) 29% (495) 6% (108) 14% (243) 1682RD/WT: Right Direction 19% (107) 33% (186) 26% (149) 10% (56) 12% (70) 567RD/WT: Wrong Track 14% (196) 35% (502) 31% (442) 5% (77) 14% (204) 1421Trump Job Approve 17% (131) 32% (244) 30% (233) 9% (68) 13% (98) 774Trump Job Disapprove 15% (169) 37% (432) 30% (344) 6% (64) 13% (145) 1153
Continued on next page
Page 120
120
Morning ConsultTable POL4_10
Table POL4_10: How important of a priority should each of the following be for Congress?Regulating tech companies
Demographic A top priority
An important,but lowerpriority
Not tooimportant apriority
Should not bedone
Don’t know /No opinion Total N
Registered Voters 15% (303) 35% (688) 30% (591) 7% (133) 14% (273) 1988Trump Job Strongly Approve 24% (101) 30% (124) 27% (112) 9% (36) 10% (42) 415Trump Job Somewhat Approve 8% (30) 33% (120) 34% (121) 9% (32) 16% (57) 359Trump Job Somewhat Disapprove 13% (29) 36% (83) 30% (68) 7% (16) 14% (31) 226Trump Job Strongly Disapprove 15% (141) 38% (349) 30% (276) 5% (47) 12% (114) 927Favorable of Trump 17% (135) 32% (251) 29% (227) 9% (67) 14% (107) 787Unfavorable of Trump 14% (158) 38% (425) 31% (350) 6% (64) 12% (135) 1132Very Favorable of Trump 22% (100) 31% (144) 27% (124) 9% (42) 11% (52) 462Somewhat Favorable of Trump 11% (36) 33% (107) 32% (103) 8% (25) 17% (55) 325Somewhat Unfavorable of Trump 9% (16) 38% (70) 34% (62) 6% (11) 12% (23) 182Very Unfavorable of Trump 15% (142) 37% (355) 30% (288) 6% (53) 12% (112) 950#1 Issue: Economy 16% (111) 31% (216) 32% (223) 7% (49) 13% (88) 688#1 Issue: Security 18% (45) 40% (103) 23% (57) 6% (16) 13% (32) 254#1 Issue: Health Care 13% (42) 40% (135) 29% (96) 7% (23) 12% (40) 335#1 Issue: Medicare / Social Security 16% (46) 30% (84) 28% (80) 7% (21) 18% (52) 283#1 Issue: Women’s Issues 15% (13) 39% (33) 35% (30) 4% (4) 7% (6) 86#1 Issue: Education 13% (14) 36% (38) 31% (33) 4% (4) 16% (17) 107#1 Issue: Energy 10% (8) 35% (28) 33% (26) 8% (6) 13% (10) 79#1 Issue: Other 15% (24) 32% (50) 29% (45) 7% (10) 17% (27) 1572018 House Vote: Democrat 13% (103) 41% (315) 31% (238) 5% (42) 9% (69) 7672018 House Vote: Republican 18% (111) 33% (209) 31% (193) 10% (61) 9% (55) 6292018 House Vote: Someone else 20% (15) 23% (17) 30% (22) 6% (4) 21% (15) 732016 Vote: Hillary Clinton 15% (102) 40% (280) 32% (227) 4% (31) 9% (61) 7002016 Vote: Donald Trump 17% (114) 33% (221) 29% (199) 10% (66) 11% (75) 6752016 Vote: Other 13% (18) 38% (55) 26% (38) 8% (11) 15% (22) 1442016 Vote: Didn’t Vote 14% (67) 28% (131) 27% (128) 5% (24) 25% (116) 466Voted in 2014: Yes 15% (202) 37% (487) 30% (403) 8% (100) 10% (130) 1322Voted in 2014: No 15% (101) 30% (201) 28% (188) 5% (33) 22% (144) 666
Continued on next page
Page 121
National Tracking Poll #2006102, June, 2020
121
Table POL4_10
Table POL4_10: How important of a priority should each of the following be for Congress?Regulating tech companies
Demographic A top priority
An important,but lowerpriority
Not tooimportant apriority
Should not bedone
Don’t know /No opinion Total N
Registered Voters 15% (303) 35% (688) 30% (591) 7% (133) 14% (273) 19882012 Vote: Barack Obama 15% (128) 41% (348) 29% (247) 5% (46) 10% (85) 8532012 Vote: Mitt Romney 14% (72) 30% (153) 33% (166) 12% (60) 10% (50) 5012012 Vote: Other 21% (17) 32% (27) 21% (17) 7% (6) 19% (16) 842012 Vote: Didn’t Vote 16% (87) 29% (161) 29% (159) 4% (21) 22% (122) 5504-Region: Northeast 16% (56) 36% (128) 28% (98) 7% (24) 14% (49) 3554-Region: Midwest 14% (65) 30% (137) 35% (158) 6% (26) 15% (71) 4574-Region: South 14% (107) 35% (263) 28% (211) 7% (54) 14% (106) 7424-Region: West 17% (75) 37% (160) 28% (123) 7% (28) 11% (48) 434Party: Democrat/Leans Democrat 15% (139) 40% (368) 30% (275) 4% (40) 10% (90) 911Party: Republican/Leans Republican 16% (118) 32% (234) 30% (225) 9% (68) 13% (95) 741Parents 16% (136) 36% (308) 27% (233) 8% (69) 14% (119) 864Note: Row proportions may total to larger than one-hundred percent due to rounding. For more information visit MorningConsultIntelligence.com.
Page 122
122
Morning ConsultTable POL4_11
Table POL4_11: How important of a priority should each of the following be for Congress?Controlling the spread of the coronavirus in the US
Demographic A top priority
An important,but lowerpriority
Not tooimportant apriority
Should not bedone
Don’t know /No opinion Total N
Registered Voters 72% (1431) 14% (279) 6% (109) 2% (46) 6% (122) 1988Gender: Male 68% (630) 16% (152) 7% (62) 3% (25) 7% (61) 930Gender: Female 76% (801) 12% (127) 4% (47) 2% (21) 6% (61) 1058Age: 18-34 66% (330) 15% (74) 5% (27) 3% (16) 10% (52) 499Age: 35-44 65% (196) 20% (60) 5% (14) 3% (10) 7% (21) 302Age: 45-64 76% (552) 11% (76) 6% (43) 2% (16) 5% (37) 724Age: 65+ 77% (354) 15% (68) 5% (25) 1% (4) 3% (12) 463GenZers: 1997-2012 63% (142) 14% (31) 5% (11) 3% (7) 15% (33) 224Millennials: 1981-1996 67% (281) 16% (67) 6% (25) 4% (17) 7% (29) 419GenXers: 1965-1980 71% (365) 15% (79) 6% (30) 2% (11) 5% (27) 511Baby Boomers: 1946-1964 77% (582) 13% (96) 6% (42) 2% (11) 4% (28) 760PID: Dem (no lean) 83% (626) 10% (79) 2% (16) 2% (12) 3% (24) 757PID: Ind (no lean) 68% (435) 14% (87) 6% (40) 2% (15) 10% (61) 638PID: Rep (no lean) 62% (370) 19% (113) 9% (54) 3% (19) 6% (37) 593PID/Gender: DemMen 77% (255) 14% (47) 1% (5) 2% (7) 5% (15) 329PID/Gender: DemWomen 87% (371) 7% (32) 3% (11) 1% (5) 2% (9) 429PID/Gender: Ind Men 62% (184) 17% (50) 7% (21) 3% (10) 10% (30) 296PID/Gender: Ind Women 73% (251) 11% (37) 5% (18) 2% (5) 9% (30) 342PID/Gender: Rep Men 63% (191) 18% (54) 12% (36) 3% (8) 5% (16) 306PID/Gender: Rep Women 62% (178) 20% (59) 6% (18) 4% (11) 7% (21) 287Ideo: Liberal (1-3) 81% (490) 12% (73) 4% (22) 2% (13) 2% (11) 609Ideo: Moderate (4) 77% (400) 12% (61) 3% (17) 1% (5) 8% (39) 522Ideo: Conservative (5-7) 62% (424) 20% (135) 9% (64) 4% (28) 4% (30) 679Educ: < College 71% (887) 14% (169) 6% (70) 2% (29) 8% (95) 1250Educ: Bachelors degree 73% (345) 15% (68) 5% (23) 2% (11) 5% (23) 470Educ: Post-grad 74% (199) 16% (42) 6% (16) 2% (6) 2% (5) 267Income: Under 50k 73% (726) 12% (115) 6% (56) 2% (22) 8% (79) 998Income: 50k-100k 70% (461) 16% (107) 6% (39) 3% (21) 5% (33) 660Income: 100k+ 74% (244) 17% (57) 5% (15) 1% (4) 3% (10) 329Ethnicity: White 71% (1142) 15% (247) 6% (94) 2% (35) 6% (91) 1608
Continued on next page
Page 123
National Tracking Poll #2006102, June, 2020
123
Table POL4_11
Table POL4_11: How important of a priority should each of the following be for Congress?Controlling the spread of the coronavirus in the US
Demographic A top priority
An important,but lowerpriority
Not tooimportant apriority
Should not bedone
Don’t know /No opinion Total N
Registered Voters 72% (1431) 14% (279) 6% (109) 2% (46) 6% (122) 1988Ethnicity: Hispanic 73% (141) 11% (20) 4% (7) 3% (5) 10% (19) 193Ethnicity: Afr. Am. 76% (192) 8% (21) 5% (12) 2% (6) 8% (20) 252Ethnicity: Other 76% (97) 9% (11) 3% (3) 4% (5) 9% (12) 128All Christian 72% (680) 16% (147) 5% (51) 2% (22) 4% (41) 941All Non-Christian 81% (79) 11% (10) 6% (6) 1% (1) 2% (2) 97Atheist 75% (96) 12% (16) 9% (11) 2% (3) 2% (2) 128Agnostic/Nothing in particular 71% (338) 13% (63) 4% (20) 2% (10) 10% (47) 478Something Else 70% (239) 13% (44) 6% (22) 3% (10) 8% (29) 344Religious Non-Protestant/Catholic 80% (96) 12% (15) 5% (6) 1% (1) 2% (2) 120Evangelical 68% (342) 16% (80) 7% (35) 2% (12) 7% (36) 505Non-Evangelical 74% (551) 14% (103) 5% (38) 3% (20) 4% (33) 746Community: Urban 73% (358) 12% (57) 6% (28) 3% (14) 7% (34) 490Community: Suburban 74% (724) 14% (137) 5% (46) 2% (23) 5% (51) 981Community: Rural 68% (350) 16% (85) 7% (35) 2% (10) 7% (38) 517Employ: Private Sector 71% (449) 18% (111) 5% (31) 2% (15) 4% (25) 631Employ: Government 66% (90) 16% (22) 6% (8) 5% (7) 6% (8) 136Employ: Self-Employed 76% (99) 9% (12) 5% (6) 3% (4) 7% (9) 130Employ: Homemaker 72% (82) 11% (12) 5% (6) 2% (2) 11% (12) 115Employ: Retired 76% (372) 13% (62) 6% (31) 2% (9) 3% (16) 492Employ: Unemployed 67% (153) 12% (28) 9% (21) 2% (4) 10% (24) 229Employ: Other 74% (112) 11% (17) 3% (5) 2% (3) 10% (15) 152Military HH: Yes 69% (211) 17% (53) 7% (21) 1% (4) 5% (16) 306Military HH: No 73% (1220) 13% (225) 5% (88) 3% (42) 6% (106) 1682RD/WT: Right Direction 57% (322) 23% (132) 9% (50) 4% (23) 7% (40) 567RD/WT: Wrong Track 78% (1109) 10% (147) 4% (59) 2% (23) 6% (82) 1421Trump Job Approve 60% (465) 20% (156) 9% (72) 4% (32) 6% (48) 774Trump Job Disapprove 81% (936) 10% (117) 3% (35) 1% (14) 4% (51) 1153
Continued on next page
Page 124
124
Morning ConsultTable POL4_11
Table POL4_11: How important of a priority should each of the following be for Congress?Controlling the spread of the coronavirus in the US
Demographic A top priority
An important,but lowerpriority
Not tooimportant apriority
Should not bedone
Don’t know /No opinion Total N
Registered Voters 72% (1431) 14% (279) 6% (109) 2% (46) 6% (122) 1988Trump Job Strongly Approve 54% (224) 21% (88) 13% (53) 6% (25) 6% (25) 415Trump Job Somewhat Approve 67% (241) 19% (68) 5% (19) 2% (7) 6% (23) 359Trump Job Somewhat Disapprove 75% (170) 14% (32) 4% (9) 1% (3) 5% (12) 226Trump Job Strongly Disapprove 83% (766) 9% (85) 3% (26) 1% (11) 4% (39) 927Favorable of Trump 60% (474) 20% (155) 10% (76) 4% (32) 6% (51) 787Unfavorable of Trump 82% (924) 11% (120) 3% (31) 1% (14) 4% (43) 1132Very Favorable of Trump 54% (247) 21% (98) 13% (60) 5% (25) 7% (32) 462Somewhat Favorable of Trump 70% (227) 18% (57) 5% (16) 2% (7) 6% (18) 325Somewhat Unfavorable of Trump 73% (133) 16% (29) 5% (9) 1% (2) 5% (9) 182Very Unfavorable of Trump 83% (790) 10% (91) 2% (22) 1% (13) 4% (34) 950#1 Issue: Economy 72% (493) 14% (100) 6% (42) 3% (22) 4% (31) 688#1 Issue: Security 58% (147) 22% (55) 10% (26) 3% (8) 7% (17) 254#1 Issue: Health Care 81% (271) 9% (30) 3% (9) 2% (6) 6% (19) 335#1 Issue: Medicare / Social Security 77% (219) 11% (30) 4% (11) 1% (2) 7% (21) 283#1 Issue: Women’s Issues 61% (53) 23% (20) 7% (6) 1% (1) 7% (6) 86#1 Issue: Education 74% (79) 12% (13) 3% (3) 1% (1) 10% (11) 107#1 Issue: Energy 77% (61) 16% (13) 3% (2) — (0) 4% (3) 79#1 Issue: Other 70% (109) 11% (18) 6% (10) 3% (5) 9% (14) 1572018 House Vote: Democrat 85% (652) 9% (72) 2% (16) 1% (10) 2% (17) 7672018 House Vote: Republican 62% (388) 21% (130) 10% (64) 3% (20) 4% (28) 6292018 House Vote: Someone else 62% (46) 11% (8) 7% (5) 5% (4) 14% (10) 732016 Vote: Hillary Clinton 86% (599) 10% (67) 1% (10) 1% (8) 2% (17) 7002016 Vote: Donald Trump 62% (417) 20% (134) 10% (68) 4% (26) 4% (30) 6752016 Vote: Other 67% (96) 18% (26) 7% (10) 3% (4) 6% (9) 1442016 Vote: Didn’t Vote 68% (319) 11% (52) 5% (23) 2% (8) 14% (65) 466Voted in 2014: Yes 74% (972) 14% (184) 6% (83) 3% (34) 4% (49) 1322Voted in 2014: No 69% (459) 14% (95) 4% (27) 2% (12) 11% (73) 666
Continued on next page
Page 125
National Tracking Poll #2006102, June, 2020
125
Table POL4_11
Table POL4_11: How important of a priority should each of the following be for Congress?Controlling the spread of the coronavirus in the US
Demographic A top priority
An important,but lowerpriority
Not tooimportant apriority
Should not bedone
Don’t know /No opinion Total N
Registered Voters 72% (1431) 14% (279) 6% (109) 2% (46) 6% (122) 19882012 Vote: Barack Obama 84% (720) 10% (82) 2% (21) 1% (9) 2% (21) 8532012 Vote: Mitt Romney 60% (302) 21% (108) 10% (50) 4% (21) 4% (20) 5012012 Vote: Other 50% (42) 17% (15) 12% (10) 6% (5) 15% (12) 842012 Vote: Didn’t Vote 67% (366) 14% (75) 5% (28) 2% (12) 13% (69) 5504-Region: Northeast 77% (272) 13% (47) 4% (12) 2% (6) 5% (18) 3554-Region: Midwest 70% (318) 17% (77) 6% (30) 2% (7) 6% (25) 4574-Region: South 70% (523) 13% (99) 6% (44) 3% (22) 7% (55) 7424-Region: West 73% (319) 13% (57) 5% (24) 3% (11) 6% (24) 434Party: Democrat/Leans Democrat 83% (758) 10% (95) 2% (20) 1% (12) 3% (27) 911Party: Republican/Leans Republican 62% (461) 20% (146) 9% (66) 3% (24) 6% (44) 741Parents 71% (614) 16% (142) 5% (41) 2% (21) 5% (46) 864Note: Row proportions may total to larger than one-hundred percent due to rounding. For more information visit MorningConsultIntelligence.com.
Page 126
126
Morning ConsultTable POL4_12
Table POL4_12: How important of a priority should each of the following be for Congress?Stimulating the economy to recover from the coronavirus pandemic
Demographic A top priority
An important,but lowerpriority
Not tooimportant apriority
Should not bedone
Don’t know /No opinion Total N
Registered Voters 65% (1298) 23% (462) 4% (88) 1% (28) 6% (112) 1988Gender: Male 64% (591) 23% (218) 5% (48) 2% (15) 6% (58) 930Gender: Female 67% (707) 23% (243) 4% (40) 1% (14) 5% (54) 1058Age: 18-34 57% (285) 25% (127) 7% (34) 2% (9) 9% (44) 499Age: 35-44 64% (192) 21% (64) 6% (18) 2% (6) 7% (23) 302Age: 45-64 69% (498) 22% (160) 3% (25) 1% (7) 5% (34) 724Age: 65+ 70% (323) 24% (111) 2% (12) 1% (6) 2% (11) 463GenZers: 1997-2012 48% (107) 31% (70) 8% (17) — (1) 13% (29) 224Millennials: 1981-1996 65% (272) 20% (85) 5% (22) 3% (13) 6% (26) 419GenXers: 1965-1980 66% (336) 23% (117) 5% (26) 1% (6) 5% (27) 511Baby Boomers: 1946-1964 70% (528) 23% (174) 3% (21) 1% (8) 4% (28) 760PID: Dem (no lean) 68% (512) 24% (181) 4% (33) 1% (5) 3% (26) 757PID: Ind (no lean) 61% (386) 24% (152) 5% (31) 2% (10) 9% (59) 638PID: Rep (no lean) 67% (400) 22% (129) 4% (24) 2% (13) 5% (27) 593PID/Gender: DemMen 67% (219) 24% (77) 5% (16) 1% (2) 4% (14) 329PID/Gender: DemWomen 68% (292) 24% (104) 4% (17) 1% (3) 3% (12) 429PID/Gender: Ind Men 58% (171) 24% (71) 6% (19) 1% (4) 10% (30) 296PID/Gender: Ind Women 63% (215) 23% (80) 4% (12) 2% (6) 8% (28) 342PID/Gender: Rep Men 66% (201) 23% (70) 4% (14) 3% (8) 4% (13) 306PID/Gender: Rep Women 69% (199) 21% (59) 4% (10) 2% (5) 5% (14) 287Ideo: Liberal (1-3) 62% (374) 29% (178) 6% (38) — (2) 3% (16) 609Ideo: Moderate (4) 67% (349) 22% (113) 4% (21) 1% (5) 7% (35) 522Ideo: Conservative (5-7) 69% (470) 21% (145) 4% (27) 3% (18) 3% (20) 679Educ: < College 67% (837) 21% (262) 4% (49) 1% (16) 7% (86) 1250Educ: Bachelors degree 61% (288) 27% (129) 5% (23) 2% (9) 4% (21) 470Educ: Post-grad 65% (173) 26% (71) 6% (16) 1% (3) 2% (5) 267Income: Under 50k 67% (671) 21% (206) 3% (33) 1% (13) 8% (75) 998Income: 50k-100k 63% (417) 26% (171) 5% (34) 1% (9) 4% (29) 660Income: 100k+ 64% (210) 26% (84) 6% (21) 2% (6) 3% (8) 329Ethnicity: White 65% (1052) 24% (383) 4% (65) 1% (24) 5% (84) 1608
Continued on next page
Page 127
National Tracking Poll #2006102, June, 2020
127
Table POL4_12
Table POL4_12: How important of a priority should each of the following be for Congress?Stimulating the economy to recover from the coronavirus pandemic
Demographic A top priority
An important,but lowerpriority
Not tooimportant apriority
Should not bedone
Don’t know /No opinion Total N
Registered Voters 65% (1298) 23% (462) 4% (88) 1% (28) 6% (112) 1988Ethnicity: Hispanic 63% (122) 21% (41) 6% (11) 1% (2) 9% (18) 193Ethnicity: Afr. Am. 68% (170) 20% (50) 5% (13) 1% (3) 6% (15) 252Ethnicity: Other 59% (76) 22% (28) 8% (10) 1% (2) 10% (12) 128All Christian 65% (615) 25% (234) 5% (43) 2% (15) 4% (33) 941All Non-Christian 58% (56) 31% (30) 6% (6) 2% (2) 4% (3) 97Atheist 57% (73) 34% (43) 7% (8) — (0) 3% (3) 128Agnostic/Nothing in particular 66% (318) 20% (96) 3% (14) 1% (7) 9% (43) 478Something Else 69% (236) 17% (58) 5% (17) 1% (4) 8% (29) 344Religious Non-Protestant/Catholic 60% (72) 29% (35) 6% (7) 2% (2) 3% (3) 120Evangelical 69% (347) 18% (92) 5% (25) 2% (11) 6% (30) 505Non-Evangelical 65% (482) 26% (192) 4% (32) 1% (8) 4% (30) 746Community: Urban 64% (316) 22% (109) 6% (27) 2% (8) 6% (31) 490Community: Suburban 66% (643) 24% (233) 5% (46) 2% (15) 4% (44) 981Community: Rural 66% (339) 23% (120) 3% (15) 1% (5) 7% (37) 517Employ: Private Sector 66% (415) 23% (147) 5% (34) 2% (14) 3% (21) 631Employ: Government 57% (77) 30% (40) 6% (8) 1% (2) 6% (8) 136Employ: Self-Employed 68% (88) 19% (25) 3% (4) 2% (3) 7% (10) 130Employ: Homemaker 70% (81) 17% (19) 5% (5) 1% (2) 7% (8) 115Employ: Retired 71% (350) 22% (108) 3% (13) 1% (5) 3% (15) 492Employ: Unemployed 57% (131) 26% (59) 4% (9) 1% (2) 12% (28) 229Employ: Other 64% (98) 25% (38) 3% (5) — (0) 8% (11) 152Military HH: Yes 71% (218) 20% (60) 3% (9) 2% (5) 5% (14) 306Military HH: No 64% (1080) 24% (402) 5% (79) 1% (23) 6% (98) 1682RD/WT: Right Direction 63% (359) 24% (137) 5% (26) 2% (13) 6% (32) 567RD/WT: Wrong Track 66% (939) 23% (324) 4% (62) 1% (15) 6% (80) 1421Trump Job Approve 67% (517) 22% (168) 4% (33) 3% (20) 5% (35) 774Trump Job Disapprove 65% (750) 25% (284) 5% (55) 1% (8) 5% (57) 1153
Continued on next page
Page 128
128
Morning ConsultTable POL4_12
Table POL4_12: How important of a priority should each of the following be for Congress?Stimulating the economy to recover from the coronavirus pandemic
Demographic A top priority
An important,but lowerpriority
Not tooimportant apriority
Should not bedone
Don’t know /No opinion Total N
Registered Voters 65% (1298) 23% (462) 4% (88) 1% (28) 6% (112) 1988Trump Job Strongly Approve 67% (279) 21% (85) 4% (15) 4% (16) 5% (19) 415Trump Job Somewhat Approve 66% (238) 23% (83) 5% (18) 1% (4) 5% (16) 359Trump Job Somewhat Disapprove 66% (150) 21% (47) 3% (8) 1% (3) 8% (19) 226Trump Job Strongly Disapprove 65% (600) 26% (236) 5% (47) 1% (6) 4% (38) 927Favorable of Trump 68% (533) 21% (165) 4% (30) 3% (21) 5% (37) 787Unfavorable of Trump 65% (735) 25% (285) 5% (55) 1% (7) 4% (50) 1132Very Favorable of Trump 69% (318) 19% (89) 4% (18) 4% (17) 4% (20) 462Somewhat Favorable of Trump 66% (215) 23% (76) 4% (12) 1% (4) 5% (17) 325Somewhat Unfavorable of Trump 65% (117) 22% (39) 4% (8) 1% (3) 8% (15) 182Very Unfavorable of Trump 65% (618) 26% (246) 5% (47) — (4) 4% (35) 950#1 Issue: Economy 74% (510) 16% (112) 4% (28) 2% (11) 4% (26) 688#1 Issue: Security 59% (150) 28% (71) 5% (13) 3% (8) 5% (12) 254#1 Issue: Health Care 61% (205) 27% (90) 4% (13) 2% (7) 6% (21) 335#1 Issue: Medicare / Social Security 71% (201) 20% (57) 1% (3) — (0) 8% (21) 283#1 Issue: Women’s Issues 43% (37) 36% (31) 17% (14) — (0) 5% (4) 86#1 Issue: Education 55% (59) 30% (32) 6% (6) — (0) 9% (9) 107#1 Issue: Energy 56% (45) 30% (24) 5% (4) 1% (1) 7% (6) 79#1 Issue: Other 58% (91) 29% (46) 4% (6) 1% (1) 8% (12) 1572018 House Vote: Democrat 68% (522) 24% (188) 4% (34) 1% (7) 2% (17) 7672018 House Vote: Republican 68% (431) 23% (144) 4% (22) 2% (16) 3% (17) 6292018 House Vote: Someone else 61% (45) 16% (12) 9% (6) — (0) 14% (10) 732016 Vote: Hillary Clinton 68% (479) 24% (167) 5% (33) — (3) 3% (19) 7002016 Vote: Donald Trump 68% (458) 22% (151) 3% (21) 3% (22) 3% (22) 6752016 Vote: Other 61% (88) 28% (40) 6% (8) — (0) 6% (8) 1442016 Vote: Didn’t Vote 58% (272) 22% (103) 6% (26) 1% (3) 13% (62) 466Voted in 2014: Yes 68% (895) 23% (305) 4% (57) 2% (20) 3% (44) 1322Voted in 2014: No 60% (402) 24% (157) 5% (32) 1% (8) 10% (68) 666
Continued on next page
Page 129
National Tracking Poll #2006102, June, 2020
129
Table POL4_12
Table POL4_12: How important of a priority should each of the following be for Congress?Stimulating the economy to recover from the coronavirus pandemic
Demographic A top priority
An important,but lowerpriority
Not tooimportant apriority
Should not bedone
Don’t know /No opinion Total N
Registered Voters 65% (1298) 23% (462) 4% (88) 1% (28) 6% (112) 19882012 Vote: Barack Obama 71% (604) 22% (187) 4% (32) 1% (5) 3% (25) 8532012 Vote: Mitt Romney 64% (322) 26% (128) 4% (21) 3% (13) 3% (16) 5012012 Vote: Other 59% (49) 25% (21) 4% (3) 2% (2) 11% (9) 842012 Vote: Didn’t Vote 59% (322) 23% (125) 6% (32) 1% (8) 11% (62) 5504-Region: Northeast 68% (240) 23% (81) 3% (12) 2% (6) 4% (15) 3554-Region: Midwest 64% (293) 25% (112) 4% (20) 1% (5) 6% (27) 4574-Region: South 66% (492) 22% (164) 4% (33) 1% (6) 6% (47) 7424-Region: West 63% (274) 24% (104) 5% (23) 3% (11) 5% (23) 434Party: Democrat/Leans Democrat 67% (609) 25% (225) 4% (40) 1% (5) 4% (32) 911Party: Republican/Leans Republican 68% (500) 21% (156) 4% (33) 2% (18) 5% (34) 741Parents 68% (585) 22% (189) 4% (35) 2% (15) 5% (40) 864Note: Row proportions may total to larger than one-hundred percent due to rounding. For more information visit MorningConsultIntelligence.com.
Page 130
130
Morning ConsultTable POL5_1
Table POL5_1: Based on what you’ve seen, read, or heard, how would you rate the health of each of the following?President Donald Trump
Demographic Excellent Good Fair PoorDon’t Know /No Opinion Total N
Registered Voters 18% (356) 22% (437) 18% (350) 33% (658) 9% (187) 1988Gender: Male 22% (201) 21% (195) 18% (168) 32% (297) 7% (69) 930Gender: Female 15% (155) 23% (243) 17% (182) 34% (360) 11% (118) 1058Age: 18-34 9% (45) 12% (60) 18% (91) 49% (245) 12% (58) 499Age: 35-44 16% (48) 20% (60) 18% (54) 36% (110) 10% (29) 302Age: 45-64 22% (162) 24% (171) 17% (125) 27% (195) 10% (70) 724Age: 65+ 22% (101) 32% (146) 17% (79) 23% (107) 6% (30) 463GenZers: 1997-2012 5% (12) 11% (25) 21% (48) 47% (104) 16% (35) 224Millennials: 1981-1996 13% (54) 15% (63) 16% (69) 47% (196) 9% (37) 419GenXers: 1965-1980 22% (111) 21% (107) 16% (83) 32% (164) 9% (47) 511Baby Boomers: 1946-1964 20% (153) 29% (221) 19% (143) 24% (184) 8% (60) 760PID: Dem (no lean) 3% (22) 10% (79) 20% (154) 57% (432) 9% (70) 757PID: Ind (no lean) 12% (80) 22% (142) 23% (146) 29% (186) 13% (85) 638PID: Rep (no lean) 43% (255) 36% (216) 8% (50) 7% (40) 5% (32) 593PID/Gender: DemMen 5% (15) 8% (27) 22% (74) 57% (189) 7% (23) 329PID/Gender: DemWomen 1% (6) 12% (52) 19% (80) 57% (244) 11% (47) 429PID/Gender: Ind Men 14% (42) 22% (65) 23% (69) 30% (88) 11% (32) 296PID/Gender: Ind Women 11% (38) 23% (77) 23% (77) 29% (97) 15% (52) 342PID/Gender: Rep Men 47% (144) 34% (102) 8% (25) 7% (20) 5% (14) 306PID/Gender: Rep Women 39% (111) 39% (113) 9% (25) 7% (19) 6% (18) 287Ideo: Liberal (1-3) 5% (31) 8% (49) 25% (151) 58% (351) 4% (26) 609Ideo: Moderate (4) 9% (49) 22% (117) 22% (116) 34% (177) 12% (63) 522Ideo: Conservative (5-7) 39% (263) 37% (252) 8% (54) 10% (67) 6% (42) 679Educ: < College 19% (235) 23% (287) 16% (196) 31% (387) 12% (145) 1250Educ: Bachelors degree 16% (75) 19% (91) 19% (91) 39% (182) 7% (31) 470Educ: Post-grad 17% (46) 22% (59) 23% (62) 33% (90) 4% (11) 267Income: Under 50k 17% (172) 24% (235) 15% (145) 33% (331) 12% (116) 998Income: 50k-100k 19% (123) 21% (141) 20% (130) 33% (216) 8% (51) 660Income: 100k+ 19% (61) 19% (61) 23% (75) 34% (112) 6% (20) 329Ethnicity: White 21% (343) 25% (398) 17% (281) 28% (452) 8% (135) 1608Ethnicity: Hispanic 9% (18) 12% (24) 14% (28) 53% (102) 11% (22) 193
Continued on next page
Page 131
National Tracking Poll #2006102, June, 2020
131
Table POL5_1
Table POL5_1: Based on what you’ve seen, read, or heard, how would you rate the health of each of the following?President Donald Trump
Demographic Excellent Good Fair PoorDon’t Know /No Opinion Total N
Registered Voters 18% (356) 22% (437) 18% (350) 33% (658) 9% (187) 1988Ethnicity: Afr. Am. 1% (2) 8% (20) 19% (47) 60% (151) 12% (31) 252Ethnicity: Other 8% (11) 15% (20) 17% (22) 43% (55) 17% (22) 128All Christian 22% (204) 28% (266) 16% (153) 25% (240) 8% (78) 941All Non-Christian 14% (13) 18% (17) 16% (16) 45% (44) 7% (7) 97Atheist 9% (11) 10% (12) 22% (28) 54% (69) 6% (8) 128Agnostic/Nothing in particular 13% (62) 15% (73) 20% (93) 41% (197) 11% (52) 478Something Else 19% (66) 20% (68) 17% (60) 31% (108) 12% (42) 344Religious Non-Protestant/Catholic 14% (17) 19% (23) 18% (22) 41% (49) 7% (9) 120Evangelical 25% (128) 28% (140) 15% (76) 23% (115) 9% (45) 505Non-Evangelical 18% (137) 25% (184) 17% (129) 30% (224) 10% (71) 746Community: Urban 16% (78) 17% (83) 17% (82) 38% (188) 12% (58) 490Community: Suburban 17% (164) 20% (199) 19% (183) 36% (350) 9% (85) 981Community: Rural 22% (114) 30% (155) 16% (84) 23% (119) 9% (45) 517Employ: Private Sector 20% (124) 20% (128) 18% (116) 35% (219) 7% (43) 631Employ: Government 9% (13) 17% (23) 23% (31) 43% (58) 8% (11) 136Employ: Self-Employed 15% (19) 21% (27) 15% (20) 38% (49) 11% (15) 130Employ: Homemaker 20% (23) 19% (21) 13% (15) 32% (37) 16% (18) 115Employ: Retired 24% (116) 30% (149) 16% (80) 23% (112) 7% (34) 492Employ: Unemployed 12% (28) 18% (41) 16% (38) 41% (94) 12% (28) 229Employ: Other 19% (28) 22% (33) 18% (28) 28% (42) 13% (20) 152Military HH: Yes 24% (73) 26% (81) 15% (47) 27% (83) 7% (22) 306Military HH: No 17% (283) 21% (357) 18% (303) 34% (574) 10% (165) 1682RD/WT: Right Direction 44% (247) 33% (186) 10% (54) 7% (39) 7% (41) 567RD/WT: Wrong Track 8% (109) 18% (251) 21% (295) 44% (619) 10% (146) 1421Trump Job Approve 43% (333) 41% (315) 9% (72) 2% (12) 5% (42) 774Trump Job Disapprove 2% (22) 10% (118) 23% (264) 55% (639) 10% (111) 1153Trump Job Strongly Approve 65% (270) 29% (120) 2% (7) 1% (2) 4% (15) 415Trump Job Somewhat Approve 17% (63) 54% (195) 18% (65) 3% (10) 7% (26) 359Trump Job Somewhat Disapprove 2% (4) 23% (53) 34% (78) 28% (63) 13% (29) 226Trump Job Strongly Disapprove 2% (18) 7% (65) 20% (186) 62% (576) 9% (82) 927
Continued on next page
Page 132
132
Morning ConsultTable POL5_1
Table POL5_1: Based on what you’ve seen, read, or heard, how would you rate the health of each of the following?President Donald Trump
Demographic Excellent Good Fair PoorDon’t Know /No Opinion Total N
Registered Voters 18% (356) 22% (437) 18% (350) 33% (658) 9% (187) 1988Favorable of Trump 43% (340) 40% (314) 9% (72) 2% (17) 6% (44) 787Unfavorable of Trump 1% (13) 11% (119) 24% (271) 55% (621) 9% (107) 1132Very Favorable of Trump 65% (301) 29% (133) 2% (9) 1% (7) 3% (13) 462Somewhat Favorable of Trump 12% (39) 56% (181) 19% (63) 3% (11) 10% (32) 325Somewhat Unfavorable of Trump 2% (3) 28% (50) 36% (66) 23% (41) 12% (21) 182Very Unfavorable of Trump 1% (10) 7% (69) 22% (205) 61% (580) 9% (86) 950#1 Issue: Economy 20% (137) 24% (165) 19% (130) 29% (200) 8% (56) 688#1 Issue: Security 41% (103) 30% (76) 8% (20) 13% (33) 8% (21) 254#1 Issue: Health Care 11% (36) 17% (57) 23% (78) 41% (136) 9% (29) 335#1 Issue: Medicare / Social Security 17% (47) 25% (70) 18% (50) 32% (90) 9% (26) 283#1 Issue: Women’s Issues 4% (4) 8% (6) 21% (18) 57% (49) 11% (9) 86#1 Issue: Education 8% (8) 23% (24) 15% (16) 37% (40) 17% (18) 107#1 Issue: Energy 5% (4) 18% (14) 17% (14) 46% (36) 14% (11) 79#1 Issue: Other 11% (17) 16% (25) 16% (24) 46% (73) 11% (17) 1572018 House Vote: Democrat 3% (26) 11% (84) 22% (167) 56% (432) 8% (59) 7672018 House Vote: Republican 43% (270) 35% (223) 11% (69) 6% (37) 5% (30) 6292018 House Vote: Someone else 9% (6) 24% (18) 21% (15) 28% (21) 19% (14) 732016 Vote: Hillary Clinton 2% (16) 11% (75) 23% (160) 58% (403) 7% (47) 7002016 Vote: Donald Trump 42% (283) 37% (247) 10% (68) 6% (40) 5% (37) 6752016 Vote: Other 7% (10) 18% (25) 23% (34) 38% (55) 14% (20) 1442016 Vote: Didn’t Vote 10% (47) 19% (89) 19% (88) 34% (159) 18% (84) 466Voted in 2014: Yes 21% (279) 22% (288) 18% (231) 33% (433) 7% (90) 1322Voted in 2014: No 12% (77) 22% (150) 18% (118) 34% (225) 15% (97) 6662012 Vote: Barack Obama 7% (59) 15% (124) 22% (191) 49% (414) 8% (65) 8532012 Vote: Mitt Romney 41% (205) 36% (178) 11% (53) 8% (38) 5% (27) 5012012 Vote: Other 26% (22) 28% (23) 16% (13) 19% (16) 12% (10) 842012 Vote: Didn’t Vote 13% (71) 20% (112) 17% (92) 34% (189) 16% (85) 550
Continued on next page
Page 133
National Tracking Poll #2006102, June, 2020
133
Table POL5_1
Table POL5_1: Based on what you’ve seen, read, or heard, how would you rate the health of each of the following?President Donald Trump
Demographic Excellent Good Fair PoorDon’t Know /No Opinion Total N
Registered Voters 18% (356) 22% (437) 18% (350) 33% (658) 9% (187) 19884-Region: Northeast 17% (62) 22% (79) 19% (66) 31% (108) 11% (40) 3554-Region: Midwest 17% (76) 25% (113) 16% (75) 31% (142) 11% (51) 4574-Region: South 20% (146) 21% (158) 18% (132) 33% (242) 9% (64) 7424-Region: West 17% (73) 20% (86) 18% (77) 38% (165) 7% (33) 434Party: Democrat/Leans Democrat 3% (28) 11% (99) 22% (199) 56% (508) 9% (78) 911Party: Republican/Leans Republican 40% (297) 38% (280) 10% (73) 7% (48) 6% (43) 741Parents 21% (184) 25% (215) 17% (147) 28% (239) 9% (79) 864Note: Row proportions may total to larger than one-hundred percent due to rounding. For more information visit MorningConsultIntelligence.com.
Page 134
134
Morning ConsultTable POL5_2
Table POL5_2: Based on what you’ve seen, read, or heard, how would you rate the health of each of the following?Joe Biden
Demographic Excellent Good Fair PoorDon’t Know /No Opinion Total N
Registered Voters 12% (248) 27% (529) 20% (402) 27% (544) 13% (265) 1988Gender: Male 13% (117) 24% (225) 21% (197) 32% (299) 10% (92) 930Gender: Female 12% (132) 29% (303) 19% (205) 23% (245) 16% (173) 1058Age: 18-34 13% (63) 22% (108) 24% (121) 24% (118) 18% (91) 499Age: 35-44 14% (43) 25% (76) 22% (66) 25% (74) 14% (43) 302Age: 45-64 12% (88) 28% (201) 19% (135) 29% (208) 13% (92) 724Age: 65+ 12% (54) 31% (145) 17% (80) 31% (145) 8% (39) 463GenZers: 1997-2012 12% (27) 21% (46) 24% (53) 21% (47) 22% (50) 224Millennials: 1981-1996 14% (58) 22% (94) 23% (97) 25% (107) 15% (63) 419GenXers: 1965-1980 12% (62) 27% (136) 23% (119) 26% (133) 12% (61) 511Baby Boomers: 1946-1964 12% (95) 31% (233) 16% (121) 30% (231) 11% (80) 760PID: Dem (no lean) 25% (192) 41% (312) 18% (137) 6% (42) 10% (74) 757PID: Ind (no lean) 6% (36) 22% (141) 23% (147) 31% (195) 19% (119) 638PID: Rep (no lean) 3% (20) 13% (76) 20% (118) 52% (307) 12% (72) 593PID/Gender: DemMen 26% (86) 37% (122) 20% (67) 8% (27) 8% (27) 329PID/Gender: DemWomen 25% (107) 44% (190) 16% (70) 4% (15) 11% (47) 429PID/Gender: Ind Men 6% (19) 19% (57) 25% (74) 35% (103) 15% (44) 296PID/Gender: Ind Women 5% (17) 25% (84) 21% (73) 27% (92) 22% (75) 342PID/Gender: Rep Men 4% (12) 15% (46) 19% (57) 55% (169) 7% (22) 306PID/Gender: Rep Women 3% (8) 10% (29) 21% (61) 48% (138) 18% (50) 287Ideo: Liberal (1-3) 21% (128) 43% (260) 19% (115) 10% (59) 8% (46) 609Ideo: Moderate (4) 12% (63) 28% (145) 24% (126) 22% (114) 14% (73) 522Ideo: Conservative (5-7) 6% (41) 13% (91) 19% (127) 52% (354) 10% (65) 679Educ: < College 13% (158) 22% (277) 19% (240) 29% (365) 17% (211) 1250Educ: Bachelors degree 12% (57) 31% (148) 23% (106) 25% (120) 8% (39) 470Educ: Post-grad 13% (34) 39% (103) 21% (56) 22% (60) 5% (15) 267Income: Under 50k 14% (135) 25% (250) 18% (179) 27% (266) 17% (167) 998Income: 50k-100k 11% (71) 27% (177) 22% (147) 30% (197) 10% (68) 660Income: 100k+ 13% (42) 31% (102) 23% (75) 25% (81) 9% (29) 329Ethnicity: White 11% (180) 26% (411) 20% (314) 31% (505) 12% (198) 1608Ethnicity: Hispanic 19% (37) 26% (50) 16% (31) 21% (40) 18% (34) 193
Continued on next page
Page 135
National Tracking Poll #2006102, June, 2020
135
Table POL5_2
Table POL5_2: Based on what you’ve seen, read, or heard, how would you rate the health of each of the following?Joe Biden
Demographic Excellent Good Fair PoorDon’t Know /No Opinion Total N
Registered Voters 12% (248) 27% (529) 20% (402) 27% (544) 13% (265) 1988Ethnicity: Afr. Am. 21% (54) 34% (86) 24% (62) 7% (17) 13% (34) 252Ethnicity: Other 12% (15) 25% (31) 21% (26) 18% (23) 25% (33) 128All Christian 10% (96) 27% (251) 19% (181) 33% (307) 11% (107) 941All Non-Christian 24% (23) 32% (32) 18% (18) 16% (15) 9% (9) 97Atheist 19% (24) 25% (32) 27% (34) 16% (21) 13% (17) 128Agnostic/Nothing in particular 13% (61) 28% (132) 21% (100) 24% (113) 15% (73) 478Something Else 13% (45) 24% (83) 20% (68) 26% (89) 17% (60) 344Religious Non-Protestant/Catholic 20% (24) 33% (40) 18% (21) 18% (22) 11% (13) 120Evangelical 11% (55) 23% (117) 19% (97) 34% (171) 13% (64) 505Non-Evangelical 11% (85) 28% (206) 19% (144) 29% (215) 13% (96) 746Community: Urban 12% (57) 32% (156) 22% (109) 20% (99) 14% (69) 490Community: Suburban 14% (139) 26% (259) 20% (198) 27% (269) 12% (115) 981Community: Rural 10% (52) 22% (113) 18% (94) 34% (176) 16% (81) 517Employ: Private Sector 12% (73) 29% (181) 24% (149) 26% (166) 10% (62) 631Employ: Government 15% (20) 26% (36) 22% (30) 26% (35) 11% (14) 136Employ: Self-Employed 17% (22) 27% (35) 17% (22) 28% (37) 10% (13) 130Employ: Homemaker 13% (15) 15% (18) 19% (22) 27% (31) 26% (30) 115Employ: Retired 13% (62) 30% (146) 15% (76) 34% (165) 9% (42) 492Employ: Unemployed 13% (30) 23% (53) 23% (52) 21% (48) 20% (46) 229Employ: Other 10% (16) 25% (38) 19% (28) 23% (36) 23% (34) 152Military HH: Yes 15% (45) 24% (74) 15% (47) 36% (110) 10% (30) 306Military HH: No 12% (203) 27% (454) 21% (355) 26% (434) 14% (235) 1682RD/WT: Right Direction 6% (32) 13% (72) 19% (106) 49% (281) 14% (77) 567RD/WT: Wrong Track 15% (217) 32% (456) 21% (295) 19% (264) 13% (188) 1421Trump Job Approve 4% (31) 12% (90) 21% (160) 53% (409) 11% (85) 774Trump Job Disapprove 19% (217) 38% (436) 20% (232) 11% (127) 12% (141) 1153Trump Job Strongly Approve 4% (17) 6% (26) 15% (64) 65% (271) 9% (37) 415Trump Job Somewhat Approve 4% (13) 18% (64) 27% (96) 38% (137) 13% (48) 359Trump Job Somewhat Disapprove 9% (20) 31% (69) 23% (52) 20% (45) 18% (41) 226Trump Job Strongly Disapprove 21% (198) 40% (367) 19% (180) 9% (82) 11% (100) 927
Continued on next page
Page 136
136
Morning ConsultTable POL5_2
Table POL5_2: Based on what you’ve seen, read, or heard, how would you rate the health of each of the following?Joe Biden
Demographic Excellent Good Fair PoorDon’t Know /No Opinion Total N
Registered Voters 12% (248) 27% (529) 20% (402) 27% (544) 13% (265) 1988Favorable of Trump 3% (26) 11% (90) 20% (159) 53% (421) 12% (92) 787Unfavorable of Trump 19% (215) 38% (435) 21% (237) 10% (113) 12% (132) 1132Very Favorable of Trump 3% (16) 6% (30) 15% (67) 66% (305) 10% (44) 462Somewhat Favorable of Trump 3% (10) 19% (60) 28% (91) 36% (115) 15% (48) 325Somewhat Unfavorable of Trump 7% (14) 25% (45) 32% (59) 19% (34) 17% (30) 182Very Unfavorable of Trump 21% (201) 41% (390) 19% (178) 8% (79) 11% (102) 950#1 Issue: Economy 11% (74) 26% (180) 21% (141) 31% (214) 11% (79) 688#1 Issue: Security 7% (17) 13% (34) 16% (42) 51% (128) 13% (33) 254#1 Issue: Health Care 16% (53) 32% (107) 23% (78) 16% (52) 13% (45) 335#1 Issue: Medicare / Social Security 16% (45) 33% (93) 14% (41) 22% (63) 15% (41) 283#1 Issue: Women’s Issues 17% (15) 23% (20) 28% (24) 18% (15) 14% (12) 86#1 Issue: Education 16% (17) 27% (29) 25% (26) 18% (20) 14% (15) 107#1 Issue: Energy 13% (10) 36% (29) 22% (18) 13% (10) 16% (13) 79#1 Issue: Other 11% (18) 24% (37) 20% (32) 27% (42) 17% (27) 1572018 House Vote: Democrat 24% (182) 43% (333) 18% (138) 7% (52) 8% (63) 7672018 House Vote: Republican 4% (25) 13% (84) 21% (129) 53% (334) 9% (56) 6292018 House Vote: Someone else 6% (5) 16% (12) 27% (19) 29% (21) 21% (16) 732016 Vote: Hillary Clinton 24% (169) 45% (314) 18% (125) 6% (42) 7% (50) 7002016 Vote: Donald Trump 4% (27) 13% (90) 20% (137) 53% (356) 10% (65) 6752016 Vote: Other 5% (7) 24% (34) 25% (36) 29% (42) 17% (24) 1442016 Vote: Didn’t Vote 9% (43) 20% (91) 22% (103) 22% (104) 27% (125) 466Voted in 2014: Yes 14% (189) 29% (384) 19% (249) 29% (379) 9% (121) 1322Voted in 2014: No 9% (59) 22% (145) 23% (153) 25% (165) 22% (144) 6662012 Vote: Barack Obama 21% (177) 41% (347) 18% (154) 12% (102) 9% (73) 8532012 Vote: Mitt Romney 3% (15) 15% (73) 20% (100) 53% (265) 9% (46) 5012012 Vote: Other 3% (2) 9% (8) 23% (19) 48% (40) 17% (14) 842012 Vote: Didn’t Vote 10% (52) 18% (101) 23% (128) 25% (137) 24% (131) 550
Continued on next page
Page 137
National Tracking Poll #2006102, June, 2020
137
Table POL5_2
Table POL5_2: Based on what you’ve seen, read, or heard, how would you rate the health of each of the following?Joe Biden
Demographic Excellent Good Fair PoorDon’t Know /No Opinion Total N
Registered Voters 12% (248) 27% (529) 20% (402) 27% (544) 13% (265) 19884-Region: Northeast 12% (44) 31% (109) 18% (63) 27% (94) 12% (44) 3554-Region: Midwest 11% (51) 25% (114) 21% (95) 25% (115) 18% (82) 4574-Region: South 13% (99) 23% (171) 22% (162) 29% (216) 13% (93) 7424-Region: West 12% (54) 31% (135) 19% (81) 27% (119) 10% (45) 434Party: Democrat/Leans Democrat 23% (209) 42% (380) 19% (172) 7% (63) 10% (87) 911Party: Republican/Leans Republican 3% (24) 12% (92) 20% (150) 52% (389) 12% (86) 741Parents 11% (99) 28% (244) 19% (160) 28% (245) 13% (116) 864Note: Row proportions may total to larger than one-hundred percent due to rounding. For more information visit MorningConsultIntelligence.com.
Page 138
138
Morning ConsultTable POL6_1
Table POL6_1: How would you rate each of the following on their handling of the coronavirus?President Donald Trump
Demographic Excellent Good Just Fair PoorDon’t Know /No Opinion Total N
Registered Voters 17% (339) 17% (338) 10% (200) 50% (999) 6% (112) 1988Gender: Male 20% (186) 18% (171) 11% (98) 46% (432) 5% (44) 930Gender: Female 14% (153) 16% (168) 10% (103) 54% (567) 6% (68) 1058Age: 18-34 8% (42) 10% (52) 12% (58) 61% (306) 8% (42) 499Age: 35-44 16% (49) 17% (51) 10% (31) 49% (149) 7% (22) 302Age: 45-64 20% (147) 20% (141) 9% (66) 46% (332) 5% (37) 724Age: 65+ 22% (101) 20% (94) 10% (46) 46% (211) 2% (11) 463GenZers: 1997-2012 7% (16) 7% (15) 14% (30) 62% (139) 10% (23) 224Millennials: 1981-1996 11% (45) 15% (62) 11% (45) 56% (236) 7% (31) 419GenXers: 1965-1980 18% (93) 19% (99) 9% (44) 48% (244) 6% (31) 511Baby Boomers: 1946-1964 21% (163) 19% (143) 10% (73) 47% (356) 3% (25) 760PID: Dem (no lean) 3% (19) 5% (39) 6% (46) 82% (622) 4% (31) 757PID: Ind (no lean) 10% (65) 19% (118) 14% (89) 49% (311) 9% (55) 638PID: Rep (no lean) 43% (255) 30% (181) 11% (66) 11% (65) 4% (27) 593PID/Gender: DemMen 4% (13) 6% (21) 6% (20) 80% (263) 3% (11) 329PID/Gender: DemWomen 1% (6) 4% (18) 6% (25) 84% (360) 5% (20) 429PID/Gender: Ind Men 11% (32) 21% (61) 14% (43) 46% (136) 8% (23) 296PID/Gender: Ind Women 9% (32) 17% (57) 14% (46) 51% (175) 9% (31) 342PID/Gender: Rep Men 46% (140) 29% (88) 11% (35) 11% (33) 3% (10) 306PID/Gender: Rep Women 40% (115) 32% (92) 11% (31) 11% (32) 6% (17) 287Ideo: Liberal (1-3) 3% (18) 6% (38) 6% (36) 83% (502) 2% (14) 609Ideo: Moderate (4) 9% (48) 13% (69) 13% (68) 57% (299) 7% (38) 522Ideo: Conservative (5-7) 38% (257) 32% (220) 11% (76) 16% (107) 3% (20) 679Educ: < College 19% (238) 18% (228) 10% (128) 45% (564) 7% (93) 1250Educ: Bachelors degree 13% (62) 14% (66) 10% (47) 59% (280) 3% (16) 470Educ: Post-grad 15% (39) 17% (44) 10% (25) 58% (155) 1% (3) 267Income: Under 50k 17% (172) 17% (167) 10% (102) 48% (482) 8% (76) 998Income: 50k-100k 18% (117) 18% (117) 10% (65) 51% (336) 4% (25) 660Income: 100k+ 15% (50) 16% (54) 10% (33) 55% (181) 3% (11) 329Ethnicity: White 20% (319) 20% (314) 10% (166) 45% (724) 5% (85) 1608Ethnicity: Hispanic 5% (10) 11% (20) 13% (26) 61% (118) 10% (19) 193
Continued on next page
Page 139
National Tracking Poll #2006102, June, 2020
139
Table POL6_1
Table POL6_1: How would you rate each of the following on their handling of the coronavirus?President Donald Trump
Demographic Excellent Good Just Fair PoorDon’t Know /No Opinion Total N
Registered Voters 17% (339) 17% (338) 10% (200) 50% (999) 6% (112) 1988Ethnicity: Afr. Am. 2% (6) 5% (13) 8% (21) 77% (193) 7% (18) 252Ethnicity: Other 11% (14) 9% (11) 10% (13) 64% (82) 7% (9) 128All Christian 21% (201) 21% (196) 11% (104) 43% (403) 4% (37) 941All Non-Christian 12% (11) 11% (10) 9% (9) 64% (62) 5% (5) 97Atheist 7% (8) 9% (12) 9% (11) 72% (92) 3% (4) 128Agnostic/Nothing in particular 11% (52) 13% (63) 10% (46) 59% (281) 8% (37) 478Something Else 19% (66) 17% (57) 9% (30) 47% (161) 9% (29) 344Religious Non-Protestant/Catholic 13% (16) 11% (13) 8% (10) 63% (76) 5% (6) 120Evangelical 26% (129) 24% (121) 12% (59) 33% (167) 6% (29) 505Non-Evangelical 18% (133) 17% (128) 10% (72) 51% (378) 5% (35) 746Community: Urban 16% (77) 12% (61) 10% (48) 56% (274) 6% (31) 490Community: Suburban 14% (134) 18% (175) 9% (91) 54% (526) 6% (54) 981Community: Rural 25% (128) 20% (102) 12% (62) 38% (198) 5% (27) 517Employ: Private Sector 17% (108) 18% (111) 11% (68) 50% (318) 4% (26) 631Employ: Government 10% (13) 12% (16) 14% (19) 60% (82) 4% (5) 136Employ: Self-Employed 17% (22) 11% (14) 13% (17) 52% (67) 7% (9) 130Employ: Homemaker 18% (21) 19% (22) 6% (7) 46% (53) 11% (12) 115Employ: Retired 24% (118) 19% (96) 9% (44) 45% (222) 3% (12) 492Employ: Unemployed 10% (22) 18% (41) 10% (23) 53% (121) 10% (22) 229Employ: Other 19% (29) 17% (26) 7% (10) 49% (74) 8% (13) 152Military HH: Yes 22% (68) 21% (63) 10% (30) 43% (130) 5% (15) 306Military HH: No 16% (271) 16% (275) 10% (170) 52% (868) 6% (97) 1682RD/WT: Right Direction 43% (243) 32% (179) 9% (52) 10% (59) 6% (34) 567RD/WT: Wrong Track 7% (96) 11% (159) 10% (149) 66% (940) 5% (78) 1421Trump Job Approve 42% (323) 37% (288) 13% (102) 3% (23) 5% (37) 774Trump Job Disapprove 1% (16) 4% (47) 7% (84) 84% (964) 4% (43) 1153Trump Job Strongly Approve 66% (274) 26% (109) 3% (11) 1% (4) 4% (17) 415Trump Job Somewhat Approve 14% (49) 50% (179) 26% (92) 5% (19) 6% (20) 359Trump Job Somewhat Disapprove 1% (2) 14% (33) 26% (59) 49% (112) 9% (21) 226Trump Job Strongly Disapprove 2% (14) 1% (14) 3% (25) 92% (852) 2% (22) 927
Continued on next page
Page 140
140
Morning ConsultTable POL6_1
Table POL6_1: How would you rate each of the following on their handling of the coronavirus?President Donald Trump
Demographic Excellent Good Just Fair PoorDon’t Know /No Opinion Total N
Registered Voters 17% (339) 17% (338) 10% (200) 50% (999) 6% (112) 1988Favorable of Trump 42% (332) 37% (289) 13% (100) 4% (30) 5% (36) 787Unfavorable of Trump 1% (6) 4% (46) 8% (95) 84% (948) 3% (37) 1132Very Favorable of Trump 65% (299) 28% (130) 3% (12) 1% (5) 3% (16) 462Somewhat Favorable of Trump 10% (33) 49% (159) 27% (87) 8% (25) 6% (21) 325Somewhat Unfavorable of Trump 1% (2) 18% (33) 31% (56) 44% (80) 6% (12) 182Very Unfavorable of Trump — (4) 1% (14) 4% (39) 91% (869) 3% (25) 950#1 Issue: Economy 18% (121) 21% (142) 12% (85) 44% (303) 5% (37) 688#1 Issue: Security 40% (102) 26% (66) 11% (28) 18% (45) 5% (12) 254#1 Issue: Health Care 10% (33) 10% (34) 10% (34) 64% (216) 5% (18) 335#1 Issue: Medicare / Social Security 17% (49) 16% (45) 6% (18) 55% (156) 5% (14) 283#1 Issue: Women’s Issues 6% (5) 5% (4) 8% (7) 74% (64) 6% (5) 86#1 Issue: Education 9% (10) 17% (18) 9% (9) 57% (61) 8% (9) 107#1 Issue: Energy 3% (2) 13% (10) 9% (7) 68% (53) 8% (6) 79#1 Issue: Other 10% (16) 12% (18) 8% (12) 64% (100) 6% (10) 1572018 House Vote: Democrat 2% (15) 4% (32) 6% (46) 85% (654) 3% (21) 7672018 House Vote: Republican 40% (254) 33% (210) 11% (72) 12% (77) 2% (15) 6292018 House Vote: Someone else 5% (3) 21% (15) 19% (14) 41% (30) 15% (11) 732016 Vote: Hillary Clinton 1% (10) 4% (26) 7% (51) 84% (591) 3% (21) 7002016 Vote: Donald Trump 40% (272) 34% (226) 11% (74) 12% (83) 3% (19) 6752016 Vote: Other 5% (8) 7% (10) 18% (25) 62% (89) 8% (12) 1442016 Vote: Didn’t Vote 11% (49) 16% (75) 11% (49) 50% (235) 12% (58) 466Voted in 2014: Yes 20% (260) 17% (230) 8% (103) 51% (675) 4% (53) 1322Voted in 2014: No 12% (78) 16% (108) 15% (98) 49% (323) 9% (59) 6662012 Vote: Barack Obama 7% (57) 7% (62) 8% (66) 75% (640) 3% (27) 8532012 Vote: Mitt Romney 38% (190) 33% (168) 11% (57) 15% (74) 2% (12) 5012012 Vote: Other 27% (22) 22% (18) 9% (8) 27% (23) 16% (13) 842012 Vote: Didn’t Vote 12% (69) 16% (90) 13% (69) 47% (260) 11% (61) 550
Continued on next page
Page 141
National Tracking Poll #2006102, June, 2020
141
Table POL6_1
Table POL6_1: How would you rate each of the following on their handling of the coronavirus?President Donald Trump
Demographic Excellent Good Just Fair PoorDon’t Know /No Opinion Total N
Registered Voters 17% (339) 17% (338) 10% (200) 50% (999) 6% (112) 19884-Region: Northeast 17% (60) 20% (72) 7% (26) 51% (183) 4% (14) 3554-Region: Midwest 16% (74) 19% (85) 8% (36) 51% (232) 7% (30) 4574-Region: South 19% (141) 16% (120) 14% (106) 45% (330) 6% (45) 7424-Region: West 14% (63) 14% (62) 8% (33) 58% (254) 5% (23) 434Party: Democrat/Leans Democrat 2% (22) 5% (47) 6% (55) 83% (754) 4% (34) 911Party: Republican/Leans Republican 39% (290) 33% (247) 12% (89) 11% (82) 4% (33) 741Parents 20% (169) 20% (169) 11% (93) 45% (386) 5% (46) 864Note: Row proportions may total to larger than one-hundred percent due to rounding. For more information visit MorningConsultIntelligence.com.
Page 142
142
Morning ConsultTable POL6_2
Table POL6_2: How would you rate each of the following on their handling of the coronavirus?Vice President Mike Pence
Demographic Excellent Good Just Fair PoorDon’t Know /No Opinion Total N
Registered Voters 15% (308) 18% (357) 14% (276) 38% (761) 14% (286) 1988Gender: Male 18% (170) 19% (176) 15% (144) 36% (336) 11% (105) 930Gender: Female 13% (138) 17% (182) 13% (132) 40% (425) 17% (181) 1058Age: 18-34 6% (31) 11% (54) 18% (88) 41% (207) 24% (119) 499Age: 35-44 11% (35) 20% (61) 12% (37) 42% (127) 14% (43) 302Age: 45-64 20% (144) 18% (131) 13% (96) 37% (265) 12% (87) 724Age: 65+ 21% (98) 24% (111) 12% (54) 35% (162) 8% (37) 463GenZers: 1997-2012 5% (12) 8% (17) 16% (36) 42% (94) 29% (65) 224Millennials: 1981-1996 8% (34) 16% (66) 17% (69) 42% (177) 17% (73) 419GenXers: 1965-1980 16% (81) 18% (94) 12% (63) 39% (197) 15% (77) 511Baby Boomers: 1946-1964 21% (160) 21% (156) 13% (97) 37% (279) 9% (68) 760PID: Dem (no lean) 4% (27) 7% (55) 14% (109) 64% (486) 11% (80) 757PID: Ind (no lean) 9% (59) 18% (114) 17% (106) 36% (231) 20% (127) 638PID: Rep (no lean) 37% (221) 32% (188) 10% (60) 7% (44) 13% (80) 593PID/Gender: DemMen 4% (13) 8% (26) 17% (55) 63% (206) 9% (28) 329PID/Gender: DemWomen 3% (14) 7% (29) 13% (54) 65% (280) 12% (52) 429PID/Gender: Ind Men 11% (31) 19% (57) 18% (54) 36% (108) 15% (46) 296PID/Gender: Ind Women 8% (28) 17% (57) 15% (52) 36% (123) 24% (81) 342PID/Gender: Rep Men 41% (126) 30% (92) 11% (35) 7% (22) 10% (31) 306PID/Gender: Rep Women 33% (95) 33% (96) 9% (26) 8% (22) 17% (48) 287Ideo: Liberal (1-3) 3% (20) 6% (35) 12% (72) 72% (436) 7% (45) 609Ideo: Moderate (4) 8% (41) 16% (81) 19% (98) 40% (207) 18% (95) 522Ideo: Conservative (5-7) 36% (242) 32% (219) 12% (81) 10% (66) 11% (72) 679Educ: < College 17% (206) 19% (234) 14% (170) 34% (426) 17% (214) 1250Educ: Bachelors degree 12% (59) 16% (77) 15% (70) 45% (210) 12% (55) 470Educ: Post-grad 16% (43) 18% (47) 14% (36) 47% (125) 6% (17) 267Income: Under 50k 15% (148) 17% (169) 13% (131) 36% (361) 19% (190) 998Income: 50k-100k 17% (111) 20% (129) 15% (99) 39% (260) 9% (61) 660Income: 100k+ 15% (49) 18% (59) 14% (46) 42% (140) 11% (36) 329Ethnicity: White 18% (288) 20% (323) 13% (210) 36% (574) 13% (212) 1608Ethnicity: Hispanic 8% (15) 10% (19) 19% (36) 47% (90) 17% (33) 193
Continued on next page
Page 143
National Tracking Poll #2006102, June, 2020
143
Table POL6_2
Table POL6_2: How would you rate each of the following on their handling of the coronavirus?Vice President Mike Pence
Demographic Excellent Good Just Fair PoorDon’t Know /No Opinion Total N
Registered Voters 15% (308) 18% (357) 14% (276) 38% (761) 14% (286) 1988Ethnicity: Afr. Am. 4% (9) 7% (18) 21% (53) 49% (123) 19% (48) 252Ethnicity: Other 8% (10) 12% (16) 10% (13) 50% (64) 20% (26) 128All Christian 22% (204) 23% (218) 14% (130) 31% (288) 11% (101) 941All Non-Christian 10% (10) 10% (10) 13% (12) 52% (50) 16% (15) 97Atheist 3% (3) 12% (15) 12% (15) 63% (81) 10% (13) 128Agnostic/Nothing in particular 8% (39) 13% (63) 14% (68) 46% (218) 19% (90) 478Something Else 15% (52) 15% (51) 14% (49) 36% (124) 20% (67) 344Religious Non-Protestant/Catholic 13% (15) 9% (10) 17% (20) 45% (54) 17% (20) 120Evangelical 24% (119) 24% (123) 15% (77) 22% (113) 15% (74) 505Non-Evangelical 18% (131) 19% (144) 12% (92) 39% (291) 12% (88) 746Community: Urban 16% (76) 13% (62) 14% (68) 43% (211) 15% (74) 490Community: Suburban 13% (132) 18% (176) 15% (146) 41% (399) 13% (128) 981Community: Rural 19% (99) 23% (120) 12% (62) 29% (152) 16% (84) 517Employ: Private Sector 16% (100) 19% (120) 15% (93) 41% (259) 9% (59) 631Employ: Government 7% (9) 18% (24) 20% (28) 44% (59) 11% (15) 136Employ: Self-Employed 12% (16) 12% (16) 20% (26) 35% (46) 21% (27) 130Employ: Homemaker 12% (14) 21% (24) 8% (10) 37% (43) 21% (24) 115Employ: Retired 24% (117) 22% (107) 12% (59) 34% (167) 9% (42) 492Employ: Unemployed 10% (22) 12% (27) 14% (32) 42% (97) 22% (51) 229Employ: Other 16% (24) 19% (28) 7% (11) 31% (47) 28% (42) 152Military HH: Yes 21% (66) 22% (69) 12% (38) 34% (103) 10% (32) 306Military HH: No 14% (242) 17% (289) 14% (238) 39% (658) 15% (255) 1682RD/WT: Right Direction 38% (213) 31% (175) 11% (61) 8% (45) 13% (73) 567RD/WT: Wrong Track 7% (94) 13% (182) 15% (215) 50% (716) 15% (213) 1421Trump Job Approve 36% (280) 35% (270) 12% (92) 4% (34) 13% (98) 774Trump Job Disapprove 2% (26) 7% (81) 16% (181) 63% (721) 12% (143) 1153Trump Job Strongly Approve 55% (228) 29% (118) 5% (22) 2% (8) 9% (38) 415Trump Job Somewhat Approve 15% (52) 42% (151) 19% (70) 7% (26) 17% (60) 359Trump Job Somewhat Disapprove 3% (7) 17% (39) 29% (66) 26% (59) 25% (56) 226Trump Job Strongly Disapprove 2% (20) 5% (42) 12% (115) 72% (663) 9% (87) 927
Continued on next page
Page 144
144
Morning ConsultTable POL6_2
Table POL6_2: How would you rate each of the following on their handling of the coronavirus?Vice President Mike Pence
Demographic Excellent Good Just Fair PoorDon’t Know /No Opinion Total N
Registered Voters 15% (308) 18% (357) 14% (276) 38% (761) 14% (286) 1988Favorable of Trump 36% (286) 35% (278) 12% (93) 5% (39) 12% (92) 787Unfavorable of Trump 2% (20) 7% (77) 16% (180) 62% (703) 13% (152) 1132Very Favorable of Trump 53% (244) 29% (133) 6% (29) 3% (12) 9% (43) 462Somewhat Favorable of Trump 13% (42) 45% (145) 20% (64) 8% (26) 15% (48) 325Somewhat Unfavorable of Trump 3% (5) 20% (36) 29% (52) 22% (39) 27% (49) 182Very Unfavorable of Trump 2% (15) 4% (41) 13% (128) 70% (664) 11% (103) 950#1 Issue: Economy 16% (109) 22% (149) 15% (101) 34% (232) 14% (97) 688#1 Issue: Security 36% (91) 26% (66) 14% (36) 13% (34) 11% (27) 254#1 Issue: Health Care 10% (34) 11% (36) 14% (47) 51% (170) 14% (47) 335#1 Issue: Medicare / Social Security 15% (43) 19% (55) 12% (35) 42% (118) 11% (32) 283#1 Issue: Women’s Issues 3% (2) 9% (8) 10% (8) 61% (52) 18% (15) 86#1 Issue: Education 14% (15) 10% (11) 18% (19) 36% (39) 21% (23) 107#1 Issue: Energy 3% (2) 10% (8) 23% (18) 46% (37) 18% (14) 79#1 Issue: Other 7% (10) 15% (24) 7% (12) 51% (79) 20% (31) 1572018 House Vote: Democrat 3% (22) 6% (46) 14% (106) 68% (525) 9% (68) 7672018 House Vote: Republican 37% (231) 35% (222) 11% (69) 8% (48) 9% (59) 6292018 House Vote: Someone else 4% (3) 20% (15) 21% (16) 27% (19) 28% (20) 732016 Vote: Hillary Clinton 3% (23) 6% (40) 15% (106) 66% (465) 9% (66) 7002016 Vote: Donald Trump 36% (243) 35% (238) 11% (72) 9% (61) 9% (60) 6752016 Vote: Other 5% (7) 10% (14) 16% (24) 49% (71) 20% (29) 1442016 Vote: Didn’t Vote 7% (34) 14% (65) 16% (74) 35% (163) 28% (130) 466Voted in 2014: Yes 19% (246) 20% (261) 12% (161) 40% (527) 10% (126) 1322Voted in 2014: No 9% (62) 14% (96) 17% (114) 35% (234) 24% (160) 6662012 Vote: Barack Obama 6% (51) 10% (88) 16% (133) 59% (500) 9% (81) 8532012 Vote: Mitt Romney 39% (195) 34% (171) 9% (45) 10% (48) 8% (42) 5012012 Vote: Other 18% (15) 24% (20) 14% (12) 24% (20) 21% (18) 842012 Vote: Didn’t Vote 9% (47) 14% (79) 16% (86) 35% (191) 27% (146) 550
Continued on next page
Page 145
National Tracking Poll #2006102, June, 2020
145
Table POL6_2
Table POL6_2: How would you rate each of the following on their handling of the coronavirus?Vice President Mike Pence
Demographic Excellent Good Just Fair PoorDon’t Know /No Opinion Total N
Registered Voters 15% (308) 18% (357) 14% (276) 38% (761) 14% (286) 19884-Region: Northeast 17% (62) 19% (66) 12% (42) 39% (140) 13% (45) 3554-Region: Midwest 15% (69) 21% (95) 11% (49) 40% (181) 14% (62) 4574-Region: South 17% (124) 18% (132) 16% (122) 33% (247) 16% (117) 7424-Region: West 12% (53) 15% (64) 14% (63) 44% (192) 14% (62) 434Party: Democrat/Leans Democrat 3% (29) 7% (64) 14% (132) 65% (590) 11% (97) 911Party: Republican/Leans Republican 34% (250) 34% (254) 11% (79) 8% (60) 13% (98) 741Parents 18% (153) 22% (191) 13% (114) 34% (293) 13% (113) 864Note: Row proportions may total to larger than one-hundred percent due to rounding. For more information visit MorningConsultIntelligence.com.
Page 146
146
Morning ConsultTable POL6_3
Table POL6_3: How would you rate each of the following on their handling of the coronavirus?Congress
Demographic Excellent Good Just Fair PoorDon’t Know /No Opinion Total N
Registered Voters 6% (111) 22% (438) 38% (750) 21% (414) 14% (276) 1988Gender: Male 6% (60) 21% (196) 39% (359) 24% (222) 10% (93) 930Gender: Female 5% (51) 23% (241) 37% (391) 18% (192) 17% (183) 1058Age: 18-34 4% (22) 17% (86) 36% (178) 22% (111) 20% (102) 499Age: 35-44 7% (22) 26% (79) 32% (97) 18% (56) 16% (48) 302Age: 45-64 7% (51) 22% (160) 38% (279) 20% (144) 13% (91) 724Age: 65+ 3% (16) 24% (113) 42% (196) 22% (104) 7% (35) 463GenZers: 1997-2012 5% (11) 18% (41) 27% (60) 20% (46) 29% (66) 224Millennials: 1981-1996 5% (22) 19% (78) 40% (167) 22% (92) 14% (60) 419GenXers: 1965-1980 7% (37) 23% (119) 38% (193) 19% (95) 13% (67) 511Baby Boomers: 1946-1964 5% (38) 24% (182) 39% (296) 22% (165) 10% (79) 760PID: Dem (no lean) 7% (55) 24% (181) 42% (318) 18% (133) 9% (70) 757PID: Ind (no lean) 2% (15) 16% (105) 36% (230) 25% (160) 20% (128) 638PID: Rep (no lean) 7% (41) 26% (151) 34% (201) 20% (121) 13% (79) 593PID/Gender: DemMen 7% (23) 24% (79) 42% (138) 19% (62) 8% (27) 329PID/Gender: DemWomen 8% (32) 24% (102) 42% (180) 16% (71) 10% (43) 429PID/Gender: Ind Men 2% (7) 14% (43) 38% (114) 30% (90) 14% (42) 296PID/Gender: Ind Women 2% (8) 18% (62) 34% (116) 21% (70) 25% (85) 342PID/Gender: Rep Men 10% (30) 24% (75) 35% (107) 23% (70) 8% (24) 306PID/Gender: Rep Women 4% (11) 27% (77) 33% (94) 18% (51) 19% (54) 287Ideo: Liberal (1-3) 7% (41) 24% (145) 41% (247) 21% (125) 8% (50) 609Ideo: Moderate (4) 4% (22) 19% (101) 42% (221) 18% (96) 16% (82) 522Ideo: Conservative (5-7) 6% (42) 25% (168) 36% (245) 23% (159) 10% (66) 679Educ: < College 6% (79) 21% (267) 35% (440) 20% (252) 17% (212) 1250Educ: Bachelors degree 4% (19) 20% (95) 44% (206) 21% (100) 11% (50) 470Educ: Post-grad 5% (13) 28% (76) 39% (104) 23% (61) 5% (13) 267Income: Under 50k 7% (68) 21% (205) 35% (350) 20% (195) 18% (181) 998Income: 50k-100k 5% (32) 22% (148) 42% (277) 22% (148) 8% (56) 660Income: 100k+ 3% (11) 26% (84) 37% (123) 21% (70) 12% (40) 329Ethnicity: White 6% (89) 21% (345) 39% (629) 20% (329) 13% (217) 1608Ethnicity: Hispanic 9% (17) 21% (41) 32% (61) 23% (44) 15% (30) 193
Continued on next page
Page 147
National Tracking Poll #2006102, June, 2020
147
Table POL6_3
Table POL6_3: How would you rate each of the following on their handling of the coronavirus?Congress
Demographic Excellent Good Just Fair PoorDon’t Know /No Opinion Total N
Registered Voters 6% (111) 22% (438) 38% (750) 21% (414) 14% (276) 1988Ethnicity: Afr. Am. 4% (11) 27% (68) 34% (86) 21% (53) 13% (34) 252Ethnicity: Other 8% (11) 19% (25) 28% (35) 25% (32) 20% (25) 128All Christian 6% (52) 24% (228) 40% (375) 20% (188) 10% (98) 941All Non-Christian 11% (11) 19% (19) 46% (45) 12% (12) 11% (11) 97Atheist 3% (4) 22% (28) 37% (47) 26% (33) 12% (15) 128Agnostic/Nothing in particular 4% (19) 19% (93) 33% (156) 24% (116) 20% (94) 478Something Else 7% (24) 20% (70) 37% (128) 19% (65) 17% (57) 344Religious Non-Protestant/Catholic 9% (11) 17% (21) 45% (54) 14% (17) 14% (17) 120Evangelical 6% (28) 27% (138) 37% (189) 18% (91) 12% (59) 505Non-Evangelical 6% (48) 21% (155) 40% (298) 21% (155) 12% (89) 746Community: Urban 6% (30) 26% (125) 37% (183) 17% (85) 14% (67) 490Community: Suburban 5% (49) 21% (208) 38% (377) 22% (212) 14% (135) 981Community: Rural 6% (32) 20% (104) 37% (191) 23% (117) 14% (74) 517Employ: Private Sector 5% (33) 23% (144) 39% (244) 25% (156) 9% (54) 631Employ: Government 4% (5) 23% (31) 44% (59) 16% (22) 13% (18) 136Employ: Self-Employed 7% (9) 23% (30) 36% (47) 17% (22) 16% (21) 130Employ: Homemaker 7% (8) 15% (18) 35% (41) 18% (21) 24% (28) 115Employ: Retired 5% (25) 25% (124) 41% (201) 19% (96) 9% (47) 492Employ: Unemployed 6% (14) 20% (47) 34% (77) 21% (49) 19% (42) 229Employ: Other 8% (13) 17% (26) 30% (45) 19% (28) 26% (40) 152Military HH: Yes 6% (18) 24% (74) 36% (111) 28% (85) 6% (18) 306Military HH: No 6% (93) 22% (363) 38% (639) 20% (329) 15% (258) 1682RD/WT: Right Direction 7% (38) 27% (153) 35% (197) 19% (107) 13% (72) 567RD/WT: Wrong Track 5% (73) 20% (284) 39% (553) 22% (307) 14% (204) 1421Trump Job Approve 7% (54) 27% (206) 34% (264) 21% (160) 12% (90) 774Trump Job Disapprove 5% (57) 20% (228) 41% (475) 22% (251) 12% (142) 1153Trump Job Strongly Approve 10% (42) 24% (100) 33% (136) 23% (94) 11% (44) 415Trump Job Somewhat Approve 3% (12) 30% (107) 36% (128) 18% (66) 13% (46) 359Trump Job Somewhat Disapprove 5% (10) 19% (44) 38% (85) 17% (39) 21% (48) 226Trump Job Strongly Disapprove 5% (46) 20% (184) 42% (389) 23% (212) 10% (95) 927
Continued on next page
Page 148
148
Morning ConsultTable POL6_3
Table POL6_3: How would you rate each of the following on their handling of the coronavirus?Congress
Demographic Excellent Good Just Fair PoorDon’t Know /No Opinion Total N
Registered Voters 6% (111) 22% (438) 38% (750) 21% (414) 14% (276) 1988Favorable of Trump 7% (53) 26% (207) 35% (273) 21% (165) 11% (89) 787Unfavorable of Trump 5% (55) 20% (226) 42% (470) 21% (238) 13% (143) 1132Very Favorable of Trump 9% (40) 25% (117) 33% (151) 23% (108) 10% (47) 462Somewhat Favorable of Trump 4% (13) 28% (90) 38% (122) 18% (57) 13% (42) 325Somewhat Unfavorable of Trump 2% (3) 22% (41) 37% (67) 15% (27) 24% (44) 182Very Unfavorable of Trump 5% (52) 19% (185) 42% (403) 22% (211) 11% (100) 950#1 Issue: Economy 4% (29) 24% (165) 38% (263) 22% (151) 12% (80) 688#1 Issue: Security 8% (20) 22% (56) 35% (89) 24% (62) 11% (27) 254#1 Issue: Health Care 7% (23) 19% (63) 41% (139) 19% (63) 14% (47) 335#1 Issue: Medicare / Social Security 7% (19) 22% (61) 38% (109) 20% (56) 14% (38) 283#1 Issue: Women’s Issues 8% (7) 22% (19) 36% (31) 21% (18) 13% (11) 86#1 Issue: Education 6% (6) 26% (28) 37% (39) 11% (12) 21% (22) 107#1 Issue: Energy 2% (2) 30% (24) 32% (25) 17% (13) 19% (15) 79#1 Issue: Other 3% (5) 14% (22) 35% (55) 24% (38) 23% (36) 1572018 House Vote: Democrat 7% (51) 25% (190) 43% (330) 18% (136) 8% (60) 7672018 House Vote: Republican 7% (41) 24% (151) 36% (224) 24% (153) 10% (60) 6292018 House Vote: Someone else 1% (1) 9% (7) 43% (31) 23% (16) 24% (18) 732016 Vote: Hillary Clinton 7% (48) 25% (176) 44% (306) 16% (109) 9% (61) 7002016 Vote: Donald Trump 6% (43) 24% (162) 37% (249) 24% (161) 9% (61) 6752016 Vote: Other — (0) 11% (16) 41% (60) 33% (47) 15% (22) 1442016 Vote: Didn’t Vote 4% (18) 18% (84) 29% (135) 21% (96) 29% (133) 466Voted in 2014: Yes 6% (81) 23% (303) 41% (535) 22% (288) 9% (114) 1322Voted in 2014: No 4% (30) 20% (134) 32% (214) 19% (126) 24% (162) 6662012 Vote: Barack Obama 7% (57) 23% (192) 43% (366) 19% (165) 9% (74) 8532012 Vote: Mitt Romney 5% (26) 24% (122) 39% (194) 23% (117) 8% (42) 5012012 Vote: Other 1% (1) 11% (9) 34% (29) 36% (30) 18% (15) 842012 Vote: Didn’t Vote 5% (27) 21% (114) 30% (162) 19% (102) 26% (145) 550
Continued on next page
Page 149
National Tracking Poll #2006102, June, 2020
149
Table POL6_3
Table POL6_3: How would you rate each of the following on their handling of the coronavirus?Congress
Demographic Excellent Good Just Fair PoorDon’t Know /No Opinion Total N
Registered Voters 6% (111) 22% (438) 38% (750) 21% (414) 14% (276) 19884-Region: Northeast 7% (25) 24% (86) 35% (124) 18% (63) 16% (58) 3554-Region: Midwest 3% (13) 22% (100) 38% (173) 24% (110) 13% (61) 4574-Region: South 7% (49) 21% (155) 39% (289) 21% (152) 13% (98) 7424-Region: West 6% (24) 23% (98) 38% (165) 20% (88) 14% (59) 434Party: Democrat/Leans Democrat 6% (58) 24% (217) 42% (380) 18% (167) 10% (88) 911Party: Republican/Leans Republican 6% (46) 24% (178) 35% (263) 21% (159) 13% (96) 741Parents 5% (46) 25% (217) 38% (331) 18% (155) 13% (114) 864Note: Row proportions may total to larger than one-hundred percent due to rounding. For more information visit MorningConsultIntelligence.com.
Page 150
150
Morning ConsultTable POL6_4
Table POL6_4: How would you rate each of the following on their handling of the coronavirus?Congressional Democrats
Demographic Excellent Good Just Fair PoorDon’t Know /No Opinion Total N
Registered Voters 12% (237) 25% (496) 21% (416) 28% (560) 14% (279) 1988Gender: Male 12% (113) 23% (214) 22% (202) 33% (306) 10% (95) 930Gender: Female 12% (124) 27% (282) 20% (214) 24% (253) 17% (184) 1058Age: 18-34 12% (60) 25% (125) 24% (119) 17% (82) 23% (113) 499Age: 35-44 11% (34) 26% (77) 24% (73) 24% (71) 15% (47) 302Age: 45-64 13% (94) 24% (170) 19% (138) 32% (232) 12% (89) 724Age: 65+ 11% (50) 27% (123) 19% (86) 37% (173) 7% (31) 463GenZers: 1997-2012 12% (27) 24% (54) 20% (45) 14% (30) 30% (68) 224Millennials: 1981-1996 11% (48) 25% (105) 27% (115) 21% (88) 15% (64) 419GenXers: 1965-1980 11% (56) 26% (134) 21% (106) 29% (148) 13% (68) 511Baby Boomers: 1946-1964 13% (99) 26% (194) 17% (132) 34% (259) 10% (76) 760PID: Dem (no lean) 26% (195) 43% (322) 18% (135) 5% (40) 9% (65) 757PID: Ind (no lean) 4% (25) 19% (123) 25% (157) 30% (190) 22% (142) 638PID: Rep (no lean) 3% (17) 8% (50) 21% (124) 56% (329) 12% (72) 593PID/Gender: DemMen 26% (87) 40% (130) 21% (68) 6% (20) 7% (24) 329PID/Gender: DemWomen 25% (108) 45% (192) 16% (67) 5% (20) 10% (41) 429PID/Gender: Ind Men 5% (14) 16% (49) 25% (75) 37% (109) 17% (49) 296PID/Gender: Ind Women 3% (12) 22% (74) 24% (82) 24% (81) 27% (93) 342PID/Gender: Rep Men 4% (12) 12% (35) 19% (59) 58% (177) 7% (22) 306PID/Gender: Rep Women 2% (4) 5% (15) 23% (65) 53% (152) 18% (50) 287Ideo: Liberal (1-3) 22% (137) 43% (259) 20% (123) 6% (37) 9% (52) 609Ideo: Moderate (4) 10% (52) 26% (135) 25% (131) 23% (119) 16% (86) 522Ideo: Conservative (5-7) 4% (29) 11% (75) 21% (142) 55% (375) 9% (58) 679Educ: < College 12% (144) 21% (269) 20% (254) 29% (368) 17% (216) 1250Educ: Bachelors degree 13% (60) 30% (139) 21% (101) 26% (122) 10% (49) 470Educ: Post-grad 12% (33) 33% (88) 23% (62) 26% (70) 5% (14) 267Income: Under 50k 13% (131) 24% (241) 18% (175) 27% (273) 18% (179) 998Income: 50k-100k 9% (60) 26% (170) 25% (163) 31% (206) 9% (61) 660Income: 100k+ 14% (45) 26% (85) 24% (78) 25% (81) 12% (39) 329Ethnicity: White 10% (166) 24% (379) 21% (344) 32% (507) 13% (211) 1608Ethnicity: Hispanic 20% (38) 23% (45) 22% (43) 16% (31) 19% (36) 193
Continued on next page
Page 151
National Tracking Poll #2006102, June, 2020
151
Table POL6_4
Table POL6_4: How would you rate each of the following on their handling of the coronavirus?Congressional Democrats
Demographic Excellent Good Just Fair PoorDon’t Know /No Opinion Total N
Registered Voters 12% (237) 25% (496) 21% (416) 28% (560) 14% (279) 1988Ethnicity: Afr. Am. 23% (58) 33% (84) 18% (45) 11% (29) 14% (36) 252Ethnicity: Other 10% (13) 26% (33) 21% (26) 18% (24) 25% (32) 128All Christian 11% (101) 23% (215) 21% (200) 34% (320) 11% (104) 941All Non-Christian 27% (26) 30% (29) 19% (18) 14% (14) 11% (10) 97Atheist 17% (22) 30% (39) 22% (28) 19% (24) 12% (15) 128Agnostic/Nothing in particular 11% (51) 26% (126) 22% (105) 23% (112) 18% (84) 478Something Else 11% (37) 25% (87) 19% (64) 26% (89) 19% (66) 344Religious Non-Protestant/Catholic 23% (27) 26% (31) 18% (22) 20% (24) 13% (16) 120Evangelical 9% (44) 21% (107) 19% (98) 36% (183) 14% (73) 505Non-Evangelical 12% (93) 25% (189) 21% (158) 29% (216) 12% (90) 746Community: Urban 15% (72) 30% (145) 22% (109) 20% (99) 13% (66) 490Community: Suburban 12% (122) 25% (243) 22% (212) 27% (261) 15% (143) 981Community: Rural 8% (44) 21% (108) 18% (96) 39% (200) 14% (70) 517Employ: Private Sector 12% (73) 27% (170) 23% (145) 30% (187) 9% (55) 631Employ: Government 11% (15) 27% (36) 31% (42) 20% (27) 11% (15) 136Employ: Self-Employed 17% (22) 26% (34) 23% (29) 22% (28) 13% (17) 130Employ: Homemaker 9% (10) 22% (25) 18% (21) 29% (33) 22% (26) 115Employ: Retired 11% (56) 24% (120) 18% (88) 37% (183) 9% (45) 492Employ: Unemployed 17% (40) 24% (56) 16% (36) 22% (51) 20% (47) 229Employ: Other 10% (14) 16% (24) 21% (32) 25% (37) 29% (45) 152Military HH: Yes 13% (40) 21% (66) 17% (52) 41% (124) 8% (24) 306Military HH: No 12% (197) 26% (430) 22% (364) 26% (435) 15% (255) 1682RD/WT: Right Direction 5% (28) 11% (65) 21% (121) 49% (279) 13% (75) 567RD/WT: Wrong Track 15% (209) 30% (431) 21% (295) 20% (281) 14% (204) 1421Trump Job Approve 3% (24) 10% (74) 22% (171) 54% (415) 12% (89) 774Trump Job Disapprove 18% (212) 36% (419) 21% (241) 12% (141) 12% (141) 1153Trump Job Strongly Approve 4% (16) 6% (23) 16% (68) 67% (277) 8% (32) 415Trump Job Somewhat Approve 2% (9) 14% (51) 29% (103) 39% (138) 16% (58) 359Trump Job Somewhat Disapprove 7% (17) 25% (56) 27% (61) 22% (49) 19% (44) 226Trump Job Strongly Disapprove 21% (195) 39% (363) 19% (180) 10% (92) 10% (97) 927
Continued on next page
Page 152
152
Morning ConsultTable POL6_4
Table POL6_4: How would you rate each of the following on their handling of the coronavirus?Congressional Democrats
Demographic Excellent Good Just Fair PoorDon’t Know /No Opinion Total N
Registered Voters 12% (237) 25% (496) 21% (416) 28% (560) 14% (279) 1988Favorable of Trump 3% (26) 9% (70) 22% (176) 54% (423) 12% (93) 787Unfavorable of Trump 18% (207) 37% (420) 21% (236) 12% (130) 12% (139) 1132Very Favorable of Trump 3% (16) 5% (22) 16% (75) 66% (306) 9% (43) 462Somewhat Favorable of Trump 3% (10) 15% (48) 31% (100) 36% (118) 15% (49) 325Somewhat Unfavorable of Trump 5% (8) 25% (45) 27% (50) 22% (40) 21% (39) 182Very Unfavorable of Trump 21% (198) 39% (374) 20% (186) 10% (91) 11% (100) 950#1 Issue: Economy 11% (73) 24% (167) 22% (151) 32% (217) 12% (79) 688#1 Issue: Security 7% (17) 7% (19) 18% (45) 57% (144) 11% (28) 254#1 Issue: Health Care 14% (48) 34% (114) 22% (74) 14% (46) 16% (53) 335#1 Issue: Medicare / Social Security 14% (39) 27% (77) 18% (50) 28% (79) 13% (38) 283#1 Issue: Women’s Issues 12% (11) 35% (30) 23% (20) 16% (14) 14% (12) 86#1 Issue: Education 18% (19) 20% (21) 28% (29) 13% (14) 21% (22) 107#1 Issue: Energy 12% (9) 38% (30) 24% (19) 7% (5) 20% (15) 79#1 Issue: Other 13% (20) 24% (37) 18% (28) 25% (39) 20% (32) 1572018 House Vote: Democrat 24% (185) 42% (324) 19% (149) 7% (56) 7% (53) 7672018 House Vote: Republican 3% (19) 9% (57) 20% (129) 59% (371) 8% (53) 6292018 House Vote: Someone else 3% (2) 10% (7) 32% (23) 27% (20) 28% (21) 732016 Vote: Hillary Clinton 26% (183) 43% (300) 19% (130) 5% (32) 8% (55) 7002016 Vote: Donald Trump 3% (19) 10% (66) 20% (135) 58% (394) 9% (60) 6752016 Vote: Other 2% (2) 20% (29) 32% (47) 29% (41) 18% (26) 1442016 Vote: Didn’t Vote 7% (31) 22% (100) 22% (104) 20% (92) 30% (138) 466Voted in 2014: Yes 14% (181) 26% (349) 20% (262) 32% (417) 9% (113) 1322Voted in 2014: No 8% (56) 22% (147) 23% (154) 21% (143) 25% (166) 6662012 Vote: Barack Obama 21% (175) 37% (319) 21% (178) 12% (103) 9% (78) 8532012 Vote: Mitt Romney 1% (7) 10% (49) 21% (105) 61% (305) 7% (34) 5012012 Vote: Other 2% (2) 12% (10) 20% (16) 44% (37) 22% (19) 842012 Vote: Didn’t Vote 9% (52) 21% (117) 21% (117) 21% (115) 27% (149) 550
Continued on next page
Page 153
National Tracking Poll #2006102, June, 2020
153
Table POL6_4
Table POL6_4: How would you rate each of the following on their handling of the coronavirus?Congressional Democrats
Demographic Excellent Good Just Fair PoorDon’t Know /No Opinion Total N
Registered Voters 12% (237) 25% (496) 21% (416) 28% (560) 14% (279) 19884-Region: Northeast 14% (51) 28% (100) 18% (62) 27% (95) 13% (46) 3554-Region: Midwest 10% (47) 25% (115) 19% (87) 32% (145) 14% (64) 4574-Region: South 11% (83) 21% (155) 24% (177) 30% (225) 14% (103) 7424-Region: West 13% (56) 29% (126) 21% (90) 22% (95) 15% (67) 434Party: Democrat/Leans Democrat 23% (210) 43% (393) 19% (171) 6% (53) 9% (84) 911Party: Republican/Leans Republican 3% (20) 8% (61) 22% (163) 55% (408) 12% (89) 741Parents 10% (86) 24% (209) 23% (199) 30% (262) 12% (107) 864Note: Row proportions may total to larger than one-hundred percent due to rounding. For more information visit MorningConsultIntelligence.com.
Page 154
154
Morning ConsultTable POL6_5
Table POL6_5: How would you rate each of the following on their handling of the coronavirus?Congressional Republicans
Demographic Excellent Good Just Fair PoorDon’t Know /No Opinion Total N
Registered Voters 10% (190) 21% (419) 21% (426) 34% (674) 14% (278) 1988Gender: Male 12% (107) 23% (209) 21% (196) 34% (319) 11% (99) 930Gender: Female 8% (83) 20% (210) 22% (230) 34% (356) 17% (179) 1058Age: 18-34 6% (31) 15% (74) 22% (108) 35% (177) 22% (109) 499Age: 35-44 11% (33) 19% (57) 23% (69) 32% (98) 15% (46) 302Age: 45-64 11% (83) 22% (159) 20% (143) 34% (247) 13% (92) 724Age: 65+ 9% (44) 28% (129) 23% (107) 33% (152) 7% (31) 463GenZers: 1997-2012 7% (15) 11% (24) 21% (46) 31% (69) 31% (68) 224Millennials: 1981-1996 7% (28) 19% (81) 22% (93) 37% (156) 15% (61) 419GenXers: 1965-1980 12% (59) 19% (99) 22% (111) 33% (168) 15% (75) 511Baby Boomers: 1946-1964 10% (80) 25% (187) 21% (156) 35% (267) 9% (70) 760PID: Dem (no lean) 3% (21) 9% (66) 20% (151) 58% (441) 10% (79) 757PID: Ind (no lean) 4% (24) 17% (107) 28% (176) 30% (194) 21% (136) 638PID: Rep (no lean) 24% (145) 42% (246) 17% (99) 7% (40) 11% (63) 593PID/Gender: DemMen 3% (11) 12% (38) 17% (55) 60% (197) 8% (28) 329PID/Gender: DemWomen 2% (10) 7% (28) 22% (96) 57% (243) 12% (51) 429PID/Gender: Ind Men 5% (15) 17% (50) 29% (86) 33% (96) 17% (49) 296PID/Gender: Ind Women 3% (9) 17% (57) 26% (90) 29% (98) 25% (87) 342PID/Gender: Rep Men 27% (82) 40% (122) 18% (55) 8% (25) 7% (22) 306PID/Gender: Rep Women 22% (63) 43% (124) 15% (44) 5% (15) 14% (41) 287Ideo: Liberal (1-3) 3% (21) 9% (52) 18% (109) 62% (380) 8% (47) 609Ideo: Moderate (4) 5% (24) 17% (91) 26% (135) 35% (185) 17% (88) 522Ideo: Conservative (5-7) 20% (137) 38% (261) 23% (154) 10% (69) 8% (57) 679Educ: < College 11% (137) 22% (275) 20% (254) 29% (368) 17% (216) 1250Educ: Bachelors degree 7% (31) 19% (89) 24% (113) 41% (191) 10% (46) 470Educ: Post-grad 8% (22) 21% (55) 22% (59) 43% (115) 6% (16) 267Income: Under 50k 9% (93) 21% (210) 19% (192) 32% (317) 19% (187) 998Income: 50k-100k 11% (73) 21% (140) 24% (160) 35% (233) 8% (55) 660Income: 100k+ 7% (24) 21% (70) 23% (75) 38% (125) 11% (36) 329Ethnicity: White 11% (173) 24% (378) 20% (328) 32% (518) 13% (211) 1608Ethnicity: Hispanic 5% (9) 16% (32) 23% (44) 39% (75) 17% (33) 193
Continued on next page
Page 155
National Tracking Poll #2006102, June, 2020
155
Table POL6_5
Table POL6_5: How would you rate each of the following on their handling of the coronavirus?Congressional Republicans
Demographic Excellent Good Just Fair PoorDon’t Know /No Opinion Total N
Registered Voters 10% (190) 21% (419) 21% (426) 34% (674) 14% (278) 1988Ethnicity: Afr. Am. 3% (8) 10% (25) 27% (69) 43% (109) 17% (42) 252Ethnicity: Other 8% (10) 13% (16) 23% (29) 37% (47) 20% (26) 128All Christian 11% (100) 27% (257) 24% (229) 27% (253) 11% (101) 941All Non-Christian 12% (12) 12% (12) 18% (18) 47% (46) 10% (10) 97Atheist 5% (6) 11% (13) 13% (16) 60% (77) 12% (15) 128Agnostic/Nothing in particular 5% (25) 16% (77) 20% (96) 40% (191) 18% (88) 478Something Else 14% (47) 17% (60) 19% (67) 31% (107) 19% (64) 344Religious Non-Protestant/Catholic 12% (14) 13% (16) 19% (22) 44% (53) 12% (15) 120Evangelical 14% (72) 28% (140) 25% (125) 20% (103) 13% (65) 505Non-Evangelical 10% (73) 23% (169) 22% (162) 33% (249) 13% (93) 746Community: Urban 11% (56) 19% (92) 21% (104) 37% (182) 12% (56) 490Community: Suburban 7% (64) 20% (200) 23% (224) 36% (349) 15% (143) 981Community: Rural 14% (70) 25% (127) 19% (98) 28% (144) 15% (78) 517Employ: Private Sector 11% (67) 21% (135) 22% (141) 37% (233) 9% (55) 631Employ: Government 9% (12) 17% (23) 31% (41) 33% (45) 10% (14) 136Employ: Self-Employed 8% (10) 21% (27) 14% (18) 40% (52) 18% (24) 130Employ: Homemaker 8% (9) 19% (22) 21% (24) 29% (33) 22% (26) 115Employ: Retired 12% (57) 27% (134) 22% (106) 31% (151) 9% (44) 492Employ: Unemployed 7% (17) 16% (36) 18% (42) 37% (84) 22% (50) 229Employ: Other 9% (14) 18% (27) 20% (30) 29% (45) 24% (37) 152Military HH: Yes 12% (38) 26% (79) 21% (66) 31% (95) 9% (28) 306Military HH: No 9% (152) 20% (341) 21% (361) 34% (579) 15% (249) 1682RD/WT: Right Direction 22% (125) 43% (243) 17% (97) 6% (35) 12% (68) 567RD/WT: Wrong Track 5% (66) 12% (176) 23% (329) 45% (640) 15% (210) 1421Trump Job Approve 21% (165) 43% (333) 21% (159) 4% (31) 11% (85) 774Trump Job Disapprove 2% (25) 7% (83) 23% (262) 55% (640) 13% (144) 1153Trump Job Strongly Approve 33% (135) 44% (181) 14% (58) 2% (9) 7% (31) 415Trump Job Somewhat Approve 8% (30) 42% (152) 28% (100) 6% (22) 15% (54) 359Trump Job Somewhat Disapprove 2% (5) 20% (44) 35% (79) 23% (51) 20% (46) 226Trump Job Strongly Disapprove 2% (20) 4% (38) 20% (183) 63% (588) 11% (98) 927
Continued on next page
Page 156
156
Morning ConsultTable POL6_5
Table POL6_5: How would you rate each of the following on their handling of the coronavirus?Congressional Republicans
Demographic Excellent Good Just Fair PoorDon’t Know /No Opinion Total N
Registered Voters 10% (190) 21% (419) 21% (426) 34% (674) 14% (278) 1988Favorable of Trump 21% (169) 43% (336) 21% (164) 5% (36) 10% (82) 787Unfavorable of Trump 2% (18) 7% (80) 23% (259) 55% (625) 13% (150) 1132Very Favorable of Trump 31% (146) 44% (205) 13% (60) 3% (13) 8% (38) 462Somewhat Favorable of Trump 7% (23) 40% (131) 32% (104) 7% (22) 14% (44) 325Somewhat Unfavorable of Trump 2% (3) 19% (35) 34% (62) 22% (40) 23% (41) 182Very Unfavorable of Trump 2% (15) 5% (44) 21% (197) 62% (584) 12% (109) 950#1 Issue: Economy 10% (70) 22% (154) 27% (182) 29% (200) 12% (82) 688#1 Issue: Security 23% (58) 35% (90) 20% (51) 11% (29) 10% (26) 254#1 Issue: Health Care 7% (25) 14% (46) 18% (60) 46% (155) 15% (49) 335#1 Issue: Medicare / Social Security 8% (22) 22% (63) 16% (47) 40% (114) 13% (38) 283#1 Issue: Women’s Issues 5% (4) 11% (9) 16% (14) 53% (45) 15% (13) 86#1 Issue: Education 8% (8) 19% (21) 19% (20) 29% (30) 25% (27) 107#1 Issue: Energy 3% (2) 17% (13) 28% (22) 39% (31) 14% (11) 79#1 Issue: Other 1% (2) 15% (23) 20% (31) 45% (70) 20% (32) 1572018 House Vote: Democrat 3% (20) 7% (55) 21% (162) 61% (469) 8% (62) 7672018 House Vote: Republican 21% (133) 42% (267) 20% (127) 9% (54) 8% (48) 6292018 House Vote: Someone else 1% (1) 7% (5) 37% (27) 26% (19) 29% (21) 732016 Vote: Hillary Clinton 3% (19) 8% (53) 22% (151) 60% (417) 9% (60) 7002016 Vote: Donald Trump 20% (136) 41% (276) 20% (133) 11% (76) 8% (53) 6752016 Vote: Other 1% (2) 11% (16) 31% (45) 36% (52) 20% (29) 1442016 Vote: Didn’t Vote 7% (32) 16% (74) 21% (98) 27% (128) 29% (135) 466Voted in 2014: Yes 11% (139) 23% (301) 21% (284) 37% (488) 8% (110) 1322Voted in 2014: No 8% (51) 18% (118) 21% (142) 28% (187) 25% (167) 6662012 Vote: Barack Obama 4% (38) 11% (92) 22% (189) 53% (456) 9% (78) 8532012 Vote: Mitt Romney 20% (100) 42% (210) 22% (108) 10% (52) 6% (31) 5012012 Vote: Other 6% (5) 17% (14) 30% (25) 23% (19) 24% (20) 842012 Vote: Didn’t Vote 9% (47) 19% (103) 19% (104) 27% (146) 27% (149) 550
Continued on next page
Page 157
National Tracking Poll #2006102, June, 2020
157
Table POL6_5
Table POL6_5: How would you rate each of the following on their handling of the coronavirus?Congressional Republicans
Demographic Excellent Good Just Fair PoorDon’t Know /No Opinion Total N
Registered Voters 10% (190) 21% (419) 21% (426) 34% (674) 14% (278) 19884-Region: Northeast 9% (33) 25% (89) 20% (70) 33% (117) 13% (46) 3554-Region: Midwest 7% (31) 24% (110) 20% (91) 35% (161) 14% (64) 4574-Region: South 13% (93) 19% (142) 25% (182) 29% (215) 15% (110) 7424-Region: West 8% (33) 18% (79) 19% (83) 42% (182) 13% (58) 434Party: Democrat/Leans Democrat 2% (22) 8% (75) 21% (193) 58% (524) 11% (97) 911Party: Republican/Leans Republican 21% (156) 41% (305) 20% (150) 7% (52) 11% (78) 741Parents 12% (100) 25% (216) 22% (193) 29% (246) 13% (109) 864Note: Row proportions may total to larger than one-hundred percent due to rounding. For more information visit MorningConsultIntelligence.com.
Page 158
158
Morning ConsultTable POL6_6
Table POL6_6: How would you rate each of the following on their handling of the coronavirus?The World Health Organization (WHO)
Demographic Excellent Good Just Fair PoorDon’t Know /No Opinion Total N
Registered Voters 14% (272) 29% (582) 21% (421) 24% (486) 11% (227) 1988Gender: Male 13% (120) 27% (249) 22% (206) 29% (270) 9% (86) 930Gender: Female 14% (153) 31% (333) 20% (216) 20% (216) 13% (140) 1058Age: 18-34 14% (70) 30% (148) 21% (103) 16% (82) 19% (96) 499Age: 35-44 16% (49) 30% (91) 19% (58) 23% (69) 12% (36) 302Age: 45-64 14% (104) 28% (201) 21% (155) 27% (192) 10% (72) 724Age: 65+ 11% (50) 31% (142) 23% (105) 31% (143) 5% (23) 463GenZers: 1997-2012 15% (33) 29% (65) 22% (48) 12% (28) 22% (50) 224Millennials: 1981-1996 14% (58) 30% (124) 20% (85) 20% (85) 16% (67) 419GenXers: 1965-1980 15% (79) 30% (154) 22% (114) 23% (118) 9% (47) 511Baby Boomers: 1946-1964 13% (96) 29% (220) 21% (162) 29% (224) 8% (59) 760PID: Dem (no lean) 21% (162) 41% (312) 20% (153) 9% (69) 8% (61) 757PID: Ind (no lean) 10% (63) 25% (159) 24% (156) 25% (157) 16% (103) 638PID: Rep (no lean) 8% (47) 19% (112) 19% (112) 44% (259) 10% (62) 593PID/Gender: DemMen 21% (69) 39% (128) 22% (71) 11% (36) 8% (26) 329PID/Gender: DemWomen 22% (94) 43% (184) 19% (82) 8% (34) 8% (36) 429PID/Gender: Ind Men 9% (28) 20% (60) 26% (78) 31% (92) 13% (38) 296PID/Gender: Ind Women 10% (35) 29% (99) 23% (78) 19% (65) 19% (65) 342PID/Gender: Rep Men 8% (23) 20% (62) 19% (57) 46% (141) 7% (22) 306PID/Gender: Rep Women 8% (24) 17% (50) 19% (55) 41% (118) 14% (40) 287Ideo: Liberal (1-3) 22% (132) 43% (260) 21% (126) 10% (60) 5% (31) 609Ideo: Moderate (4) 13% (69) 32% (166) 26% (136) 16% (81) 13% (70) 522Ideo: Conservative (5-7) 9% (60) 18% (121) 20% (133) 47% (319) 7% (47) 679Educ: < College 12% (150) 27% (333) 21% (265) 25% (312) 15% (192) 1250Educ: Bachelors degree 16% (76) 33% (157) 21% (98) 24% (112) 6% (26) 470Educ: Post-grad 17% (46) 35% (92) 22% (58) 23% (62) 3% (9) 267Income: Under 50k 13% (126) 27% (268) 21% (207) 24% (237) 16% (160) 998Income: 50k-100k 14% (90) 31% (207) 21% (139) 27% (180) 7% (46) 660Income: 100k+ 17% (56) 33% (107) 23% (76) 21% (70) 6% (20) 329Ethnicity: White 14% (229) 28% (457) 21% (338) 27% (428) 10% (156) 1608Ethnicity: Hispanic 16% (30) 33% (63) 21% (41) 16% (31) 14% (28) 193
Continued on next page
Page 159
National Tracking Poll #2006102, June, 2020
159
Table POL6_6
Table POL6_6: How would you rate each of the following on their handling of the coronavirus?The World Health Organization (WHO)
Demographic Excellent Good Just Fair PoorDon’t Know /No Opinion Total N
Registered Voters 14% (272) 29% (582) 21% (421) 24% (486) 11% (227) 1988Ethnicity: Afr. Am. 13% (32) 33% (82) 23% (58) 11% (28) 21% (52) 252Ethnicity: Other 9% (12) 33% (43) 20% (25) 23% (30) 15% (19) 128All Christian 13% (126) 29% (277) 22% (205) 29% (272) 6% (60) 941All Non-Christian 23% (23) 31% (30) 23% (23) 20% (19) 3% (3) 97Atheist 21% (26) 40% (51) 19% (24) 12% (15) 9% (12) 128Agnostic/Nothing in particular 10% (49) 30% (144) 22% (105) 21% (102) 17% (79) 478Something Else 14% (48) 23% (80) 19% (65) 23% (78) 21% (73) 344Religious Non-Protestant/Catholic 22% (27) 29% (35) 23% (28) 19% (23) 6% (7) 120Evangelical 12% (59) 26% (130) 20% (100) 30% (152) 13% (64) 505Non-Evangelical 15% (110) 29% (216) 22% (162) 26% (193) 9% (64) 746Community: Urban 16% (78) 33% (164) 16% (79) 20% (97) 15% (72) 490Community: Suburban 14% (138) 29% (283) 24% (231) 24% (237) 9% (92) 981Community: Rural 11% (56) 26% (136) 21% (111) 29% (152) 12% (63) 517Employ: Private Sector 16% (99) 33% (207) 20% (127) 25% (156) 7% (42) 631Employ: Government 15% (20) 36% (48) 23% (31) 19% (25) 9% (12) 136Employ: Self-Employed 10% (13) 27% (36) 30% (39) 18% (23) 15% (20) 130Employ: Homemaker 10% (11) 22% (25) 17% (20) 26% (29) 25% (29) 115Employ: Retired 11% (55) 28% (138) 22% (109) 32% (160) 6% (30) 492Employ: Unemployed 15% (35) 24% (55) 22% (50) 19% (44) 20% (46) 229Employ: Other 16% (24) 27% (40) 16% (24) 21% (32) 21% (32) 152Military HH: Yes 12% (37) 24% (73) 20% (62) 34% (105) 10% (29) 306Military HH: No 14% (236) 30% (509) 21% (359) 23% (381) 12% (197) 1682RD/WT: Right Direction 11% (62) 20% (113) 20% (115) 38% (215) 11% (64) 567RD/WT: Wrong Track 15% (211) 33% (469) 22% (306) 19% (271) 11% (163) 1421Trump Job Approve 8% (62) 18% (138) 20% (154) 43% (336) 11% (83) 774Trump Job Disapprove 18% (209) 38% (436) 22% (255) 13% (144) 10% (110) 1153Trump Job Strongly Approve 8% (34) 11% (46) 19% (79) 52% (217) 9% (38) 415Trump Job Somewhat Approve 8% (28) 26% (92) 21% (75) 33% (119) 13% (45) 359Trump Job Somewhat Disapprove 12% (27) 36% (80) 21% (47) 21% (49) 10% (23) 226Trump Job Strongly Disapprove 20% (182) 38% (355) 22% (207) 10% (96) 9% (87) 927
Continued on next page
Page 160
160
Morning ConsultTable POL6_6
Table POL6_6: How would you rate each of the following on their handling of the coronavirus?The World Health Organization (WHO)
Demographic Excellent Good Just Fair PoorDon’t Know /No Opinion Total N
Registered Voters 14% (272) 29% (582) 21% (421) 24% (486) 11% (227) 1988Favorable of Trump 8% (65) 17% (134) 21% (162) 44% (346) 10% (79) 787Unfavorable of Trump 18% (203) 39% (437) 22% (250) 12% (132) 10% (109) 1132Very Favorable of Trump 9% (40) 12% (55) 18% (85) 53% (243) 8% (39) 462Somewhat Favorable of Trump 8% (26) 24% (79) 24% (77) 32% (103) 12% (40) 325Somewhat Unfavorable of Trump 12% (22) 35% (63) 19% (35) 25% (45) 9% (17) 182Very Unfavorable of Trump 19% (181) 39% (374) 23% (215) 9% (87) 10% (92) 950#1 Issue: Economy 12% (83) 27% (186) 20% (138) 30% (206) 11% (75) 688#1 Issue: Security 8% (21) 14% (36) 21% (53) 45% (115) 11% (28) 254#1 Issue: Health Care 15% (52) 37% (124) 22% (73) 16% (53) 10% (34) 335#1 Issue: Medicare / Social Security 14% (41) 33% (93) 26% (73) 17% (48) 10% (28) 283#1 Issue: Women’s Issues 20% (18) 34% (29) 17% (15) 12% (10) 17% (14) 86#1 Issue: Education 21% (23) 31% (33) 25% (26) 11% (11) 13% (14) 107#1 Issue: Energy 10% (8) 57% (45) 19% (15) 8% (6) 6% (5) 79#1 Issue: Other 17% (27) 23% (36) 18% (29) 24% (37) 18% (28) 1572018 House Vote: Democrat 22% (165) 42% (321) 21% (162) 9% (69) 6% (49) 7672018 House Vote: Republican 7% (47) 17% (106) 22% (135) 47% (294) 7% (47) 6292018 House Vote: Someone else 10% (7) 25% (18) 24% (17) 25% (18) 16% (12) 732016 Vote: Hillary Clinton 23% (162) 42% (292) 21% (148) 8% (57) 6% (42) 7002016 Vote: Donald Trump 7% (48) 18% (119) 21% (145) 47% (317) 7% (45) 6752016 Vote: Other 9% (13) 31% (44) 24% (35) 25% (36) 11% (16) 1442016 Vote: Didn’t Vote 11% (49) 27% (126) 20% (93) 17% (77) 26% (122) 466Voted in 2014: Yes 15% (199) 30% (396) 21% (277) 28% (364) 6% (85) 1322Voted in 2014: No 11% (73) 28% (186) 22% (144) 18% (122) 21% (142) 6662012 Vote: Barack Obama 20% (171) 40% (338) 22% (188) 12% (102) 6% (54) 8532012 Vote: Mitt Romney 6% (30) 16% (81) 21% (103) 51% (255) 6% (31) 5012012 Vote: Other 1% (1) 21% (17) 16% (14) 41% (35) 20% (17) 842012 Vote: Didn’t Vote 13% (70) 27% (146) 21% (116) 17% (93) 23% (125) 550
Continued on next page
Page 161
National Tracking Poll #2006102, June, 2020
161
Table POL6_6
Table POL6_6: How would you rate each of the following on their handling of the coronavirus?The World Health Organization (WHO)
Demographic Excellent Good Just Fair PoorDon’t Know /No Opinion Total N
Registered Voters 14% (272) 29% (582) 21% (421) 24% (486) 11% (227) 19884-Region: Northeast 15% (53) 29% (102) 24% (84) 23% (83) 9% (33) 3554-Region: Midwest 14% (62) 30% (136) 18% (82) 26% (119) 12% (57) 4574-Region: South 13% (93) 26% (195) 23% (169) 26% (195) 12% (89) 7424-Region: West 15% (64) 34% (149) 20% (86) 20% (88) 11% (48) 434Party: Democrat/Leans Democrat 21% (187) 41% (377) 22% (197) 8% (75) 8% (75) 911Party: Republican/Leans Republican 8% (60) 17% (129) 21% (152) 44% (327) 10% (72) 741Parents 12% (101) 29% (254) 22% (190) 26% (222) 11% (96) 864Note: Row proportions may total to larger than one-hundred percent due to rounding. For more information visit MorningConsultIntelligence.com.
Page 162
162
Morning ConsultTable POL6_7
Table POL6_7: How would you rate each of the following on their handling of the coronavirus?The Centers for Disease Control and Prevention (CDC)
Demographic Excellent Good Just Fair PoorDon’t Know /No Opinion Total N
Registered Voters 20% (404) 37% (734) 23% (456) 11% (221) 9% (173) 1988Gender: Male 20% (185) 34% (314) 26% (244) 12% (109) 9% (80) 930Gender: Female 21% (220) 40% (420) 20% (212) 11% (112) 9% (94) 1058Age: 18-34 19% (94) 33% (165) 21% (104) 12% (59) 16% (78) 499Age: 35-44 23% (69) 32% (97) 25% (75) 11% (34) 9% (27) 302Age: 45-64 20% (148) 38% (272) 24% (174) 11% (81) 7% (49) 724Age: 65+ 20% (95) 43% (200) 22% (103) 10% (46) 4% (19) 463GenZers: 1997-2012 20% (45) 32% (72) 17% (37) 11% (25) 20% (44) 224Millennials: 1981-1996 19% (80) 33% (140) 23% (97) 13% (55) 12% (48) 419GenXers: 1965-1980 20% (103) 36% (184) 25% (130) 12% (59) 7% (36) 511Baby Boomers: 1946-1964 21% (161) 40% (302) 24% (181) 10% (73) 6% (43) 760PID: Dem (no lean) 27% (207) 42% (321) 18% (135) 7% (53) 6% (42) 757PID: Ind (no lean) 16% (100) 32% (207) 25% (159) 13% (86) 14% (87) 638PID: Rep (no lean) 17% (98) 35% (206) 27% (162) 14% (82) 7% (44) 593PID/Gender: DemMen 26% (84) 38% (125) 21% (70) 7% (24) 8% (26) 329PID/Gender: DemWomen 29% (123) 46% (196) 15% (65) 7% (29) 4% (16) 429PID/Gender: Ind Men 16% (47) 27% (81) 29% (85) 15% (45) 13% (38) 296PID/Gender: Ind Women 16% (53) 37% (126) 22% (74) 12% (41) 14% (49) 342PID/Gender: Rep Men 18% (54) 35% (108) 29% (89) 13% (40) 5% (16) 306PID/Gender: Rep Women 15% (44) 34% (98) 26% (74) 15% (43) 10% (28) 287Ideo: Liberal (1-3) 24% (145) 45% (273) 22% (134) 7% (41) 2% (15) 609Ideo: Moderate (4) 22% (116) 36% (187) 21% (108) 10% (51) 12% (61) 522Ideo: Conservative (5-7) 17% (118) 34% (228) 27% (184) 16% (112) 5% (37) 679Educ: < College 19% (244) 35% (439) 23% (282) 11% (138) 12% (148) 1250Educ: Bachelors degree 22% (102) 39% (182) 23% (107) 12% (56) 5% (22) 470Educ: Post-grad 22% (58) 42% (112) 25% (67) 10% (27) 1% (3) 267Income: Under 50k 22% (220) 34% (344) 21% (207) 11% (109) 12% (118) 998Income: 50k-100k 18% (118) 39% (257) 25% (167) 12% (81) 6% (37) 660Income: 100k+ 20% (67) 40% (132) 25% (82) 9% (30) 5% (18) 329Ethnicity: White 21% (330) 37% (600) 23% (374) 11% (177) 8% (127) 1608Ethnicity: Hispanic 19% (37) 31% (60) 29% (55) 11% (21) 10% (20) 193
Continued on next page
Page 163
National Tracking Poll #2006102, June, 2020
163
Table POL6_7
Table POL6_7: How would you rate each of the following on their handling of the coronavirus?The Centers for Disease Control and Prevention (CDC)
Demographic Excellent Good Just Fair PoorDon’t Know /No Opinion Total N
Registered Voters 20% (404) 37% (734) 23% (456) 11% (221) 9% (173) 1988Ethnicity: Afr. Am. 21% (53) 35% (89) 19% (48) 12% (29) 13% (33) 252Ethnicity: Other 17% (21) 35% (45) 27% (34) 11% (14) 10% (13) 128All Christian 22% (204) 37% (345) 26% (243) 11% (102) 5% (47) 941All Non-Christian 19% (18) 48% (46) 20% (20) 7% (7) 7% (6) 97Atheist 30% (39) 36% (46) 16% (20) 11% (13) 7% (9) 128Agnostic/Nothing in particular 17% (80) 37% (177) 21% (101) 12% (56) 13% (64) 478Something Else 19% (64) 34% (118) 21% (72) 12% (42) 14% (47) 344Religious Non-Protestant/Catholic 18% (22) 47% (57) 18% (22) 9% (11) 7% (9) 120Evangelical 18% (92) 37% (187) 25% (124) 11% (56) 9% (47) 505Non-Evangelical 23% (169) 35% (264) 25% (185) 11% (83) 6% (44) 746Community: Urban 22% (109) 37% (183) 20% (99) 10% (49) 10% (50) 490Community: Suburban 21% (209) 36% (354) 25% (241) 11% (105) 7% (71) 981Community: Rural 17% (86) 38% (196) 23% (117) 13% (66) 10% (51) 517Employ: Private Sector 21% (134) 38% (238) 25% (157) 11% (72) 5% (30) 631Employ: Government 21% (29) 35% (47) 29% (39) 7% (10) 7% (10) 136Employ: Self-Employed 12% (16) 38% (49) 27% (35) 12% (16) 11% (15) 130Employ: Homemaker 14% (16) 31% (36) 21% (24) 17% (20) 17% (19) 115Employ: Retired 22% (110) 42% (204) 22% (109) 11% (52) 4% (18) 492Employ: Unemployed 19% (45) 32% (73) 23% (53) 10% (24) 15% (34) 229Employ: Other 20% (30) 31% (47) 17% (25) 14% (21) 19% (28) 152Military HH: Yes 21% (63) 36% (111) 22% (68) 14% (43) 7% (21) 306Military HH: No 20% (341) 37% (623) 23% (388) 11% (178) 9% (152) 1682RD/WT: Right Direction 18% (103) 36% (204) 25% (139) 12% (67) 10% (54) 567RD/WT: Wrong Track 21% (301) 37% (530) 22% (317) 11% (154) 8% (119) 1421Trump Job Approve 16% (124) 33% (256) 27% (209) 15% (115) 9% (69) 774Trump Job Disapprove 24% (276) 40% (465) 21% (236) 9% (103) 6% (72) 1153Trump Job Strongly Approve 15% (64) 30% (123) 30% (123) 18% (73) 8% (32) 415Trump Job Somewhat Approve 17% (60) 37% (134) 24% (87) 12% (42) 10% (37) 359Trump Job Somewhat Disapprove 22% (49) 40% (91) 21% (47) 7% (17) 10% (23) 226Trump Job Strongly Disapprove 25% (228) 40% (375) 20% (190) 9% (86) 5% (49) 927
Continued on next page
Page 164
164
Morning ConsultTable POL6_7
Table POL6_7: How would you rate each of the following on their handling of the coronavirus?The Centers for Disease Control and Prevention (CDC)
Demographic Excellent Good Just Fair PoorDon’t Know /No Opinion Total N
Registered Voters 20% (404) 37% (734) 23% (456) 11% (221) 9% (173) 1988Favorable of Trump 16% (126) 32% (256) 28% (220) 15% (119) 8% (66) 787Unfavorable of Trump 24% (276) 41% (464) 20% (227) 8% (95) 6% (71) 1132Very Favorable of Trump 16% (73) 30% (138) 29% (134) 18% (84) 7% (33) 462Somewhat Favorable of Trump 16% (53) 36% (118) 27% (86) 11% (35) 10% (33) 325Somewhat Unfavorable of Trump 17% (31) 41% (74) 21% (39) 10% (18) 11% (20) 182Very Unfavorable of Trump 26% (245) 41% (389) 20% (188) 8% (77) 5% (51) 950#1 Issue: Economy 19% (128) 34% (236) 27% (183) 13% (92) 7% (48) 688#1 Issue: Security 18% (46) 34% (86) 27% (67) 13% (34) 8% (21) 254#1 Issue: Health Care 24% (79) 38% (127) 21% (70) 10% (32) 8% (28) 335#1 Issue: Medicare / Social Security 23% (65) 45% (126) 17% (47) 6% (18) 9% (26) 283#1 Issue: Women’s Issues 21% (18) 38% (33) 17% (14) 14% (12) 10% (9) 86#1 Issue: Education 27% (29) 36% (39) 22% (24) 6% (6) 9% (10) 107#1 Issue: Energy 12% (10) 49% (39) 26% (21) 2% (2) 11% (8) 79#1 Issue: Other 19% (30) 31% (48) 19% (30) 16% (25) 15% (24) 1572018 House Vote: Democrat 27% (208) 43% (327) 20% (157) 6% (47) 4% (29) 7672018 House Vote: Republican 15% (96) 35% (221) 29% (185) 15% (93) 5% (34) 6292018 House Vote: Someone else 10% (8) 30% (22) 27% (19) 15% (11) 19% (14) 732016 Vote: Hillary Clinton 28% (195) 44% (307) 19% (135) 5% (35) 4% (28) 7002016 Vote: Donald Trump 15% (103) 33% (223) 30% (202) 16% (105) 6% (42) 6752016 Vote: Other 16% (23) 36% (52) 24% (35) 15% (22) 9% (12) 1442016 Vote: Didn’t Vote 18% (83) 33% (152) 18% (83) 13% (59) 19% (90) 466Voted in 2014: Yes 21% (276) 39% (519) 24% (315) 11% (143) 5% (69) 1322Voted in 2014: No 19% (129) 32% (215) 21% (141) 12% (78) 16% (104) 6662012 Vote: Barack Obama 25% (215) 42% (362) 20% (172) 8% (65) 5% (39) 8532012 Vote: Mitt Romney 14% (72) 36% (181) 29% (147) 15% (75) 5% (26) 5012012 Vote: Other 9% (8) 27% (22) 22% (18) 27% (23) 15% (13) 842012 Vote: Didn’t Vote 20% (109) 31% (168) 22% (118) 11% (58) 17% (95) 550
Continued on next page
Page 165
National Tracking Poll #2006102, June, 2020
165
Table POL6_7
Table POL6_7: How would you rate each of the following on their handling of the coronavirus?The Centers for Disease Control and Prevention (CDC)
Demographic Excellent Good Just Fair PoorDon’t Know /No Opinion Total N
Registered Voters 20% (404) 37% (734) 23% (456) 11% (221) 9% (173) 19884-Region: Northeast 22% (78) 38% (135) 23% (83) 9% (32) 7% (26) 3554-Region: Midwest 17% (78) 37% (169) 24% (110) 12% (55) 10% (46) 4574-Region: South 22% (161) 34% (254) 23% (171) 12% (88) 9% (69) 7424-Region: West 20% (89) 40% (176) 21% (92) 10% (45) 7% (32) 434Party: Democrat/Leans Democrat 27% (242) 42% (387) 19% (175) 7% (60) 5% (47) 911Party: Republican/Leans Republican 16% (116) 34% (255) 28% (206) 14% (103) 8% (61) 741Parents 19% (166) 37% (317) 26% (224) 10% (90) 8% (67) 864Note: Row proportions may total to larger than one-hundred percent due to rounding. For more information visit MorningConsultIntelligence.com.
Page 166
166
Morning ConsultTable POL6_8
Table POL6_8: How would you rate each of the following on their handling of the coronavirus?Your state’s governor
Demographic Excellent Good Just Fair PoorDon’t Know /No Opinion Total N
Registered Voters 27% (527) 30% (599) 17% (347) 19% (372) 7% (143) 1988Gender: Male 25% (233) 29% (269) 18% (167) 21% (196) 7% (64) 930Gender: Female 28% (294) 31% (329) 17% (180) 17% (176) 7% (79) 1058Age: 18-34 20% (97) 26% (132) 22% (112) 17% (85) 15% (73) 499Age: 35-44 24% (73) 29% (88) 17% (53) 20% (62) 9% (26) 302Age: 45-64 29% (209) 31% (225) 16% (117) 20% (144) 4% (29) 724Age: 65+ 32% (148) 33% (153) 14% (65) 18% (81) 3% (15) 463GenZers: 1997-2012 18% (41) 23% (50) 23% (51) 17% (38) 19% (43) 224Millennials: 1981-1996 20% (83) 30% (126) 21% (87) 19% (78) 11% (45) 419GenXers: 1965-1980 28% (142) 28% (143) 16% (83) 23% (116) 5% (27) 511Baby Boomers: 1946-1964 32% (241) 33% (247) 16% (119) 17% (126) 4% (27) 760PID: Dem (no lean) 37% (282) 32% (239) 13% (96) 13% (101) 5% (39) 757PID: Ind (no lean) 18% (116) 29% (187) 22% (138) 19% (123) 12% (74) 638PID: Rep (no lean) 22% (129) 29% (173) 19% (113) 25% (148) 5% (30) 593PID/Gender: DemMen 35% (116) 33% (108) 13% (44) 12% (39) 7% (22) 329PID/Gender: DemWomen 39% (167) 30% (131) 12% (52) 14% (62) 4% (17) 429PID/Gender: Ind Men 16% (47) 28% (82) 23% (69) 23% (68) 10% (30) 296PID/Gender: Ind Women 20% (69) 31% (105) 20% (69) 16% (55) 13% (43) 342PID/Gender: Rep Men 23% (71) 26% (79) 18% (55) 29% (89) 4% (12) 306PID/Gender: Rep Women 20% (58) 33% (94) 20% (59) 20% (59) 6% (18) 287Ideo: Liberal (1-3) 36% (220) 32% (192) 15% (93) 14% (85) 3% (18) 609Ideo: Moderate (4) 25% (131) 29% (149) 21% (109) 17% (89) 8% (44) 522Ideo: Conservative (5-7) 22% (150) 30% (207) 18% (122) 26% (176) 4% (24) 679Educ: < College 24% (305) 29% (361) 19% (237) 18% (227) 10% (120) 1250Educ: Bachelors degree 29% (136) 31% (144) 14% (67) 22% (104) 4% (19) 470Educ: Post-grad 32% (86) 35% (94) 16% (43) 15% (40) 1% (3) 267Income: Under 50k 24% (244) 30% (299) 17% (165) 19% (188) 10% (103) 998Income: 50k-100k 27% (177) 30% (197) 20% (129) 20% (130) 4% (28) 660Income: 100k+ 32% (106) 31% (103) 16% (53) 16% (54) 4% (13) 329Ethnicity: White 27% (441) 30% (478) 17% (279) 19% (307) 6% (103) 1608Ethnicity: Hispanic 21% (40) 32% (61) 21% (40) 17% (33) 10% (18) 193
Continued on next page
Page 167
National Tracking Poll #2006102, June, 2020
167
Table POL6_8
Table POL6_8: How would you rate each of the following on their handling of the coronavirus?Your state’s governor
Demographic Excellent Good Just Fair PoorDon’t Know /No Opinion Total N
Registered Voters 27% (527) 30% (599) 17% (347) 19% (372) 7% (143) 1988Ethnicity: Afr. Am. 24% (60) 32% (80) 18% (44) 17% (44) 10% (24) 252Ethnicity: Other 21% (26) 32% (41) 19% (24) 16% (21) 12% (15) 128All Christian 28% (262) 33% (306) 18% (166) 19% (174) 3% (33) 941All Non-Christian 33% (32) 31% (30) 17% (16) 16% (15) 4% (4) 97Atheist 30% (38) 28% (35) 18% (22) 18% (23) 7% (8) 128Agnostic/Nothing in particular 24% (115) 26% (122) 19% (92) 19% (89) 12% (59) 478Something Else 23% (79) 31% (106) 15% (51) 20% (69) 11% (38) 344Religious Non-Protestant/Catholic 30% (35) 35% (42) 17% (21) 15% (18) 3% (4) 120Evangelical 23% (115) 35% (176) 17% (87) 19% (94) 7% (33) 505Non-Evangelical 29% (220) 29% (219) 17% (125) 19% (145) 5% (37) 746Community: Urban 30% (147) 30% (145) 17% (81) 15% (72) 9% (45) 490Community: Suburban 25% (247) 32% (311) 18% (173) 18% (181) 7% (69) 981Community: Rural 26% (134) 28% (143) 18% (93) 23% (119) 6% (29) 517Employ: Private Sector 29% (180) 32% (200) 18% (117) 17% (110) 4% (24) 631Employ: Government 21% (28) 32% (43) 24% (32) 17% (23) 6% (9) 136Employ: Self-Employed 24% (31) 29% (38) 14% (19) 24% (31) 9% (11) 130Employ: Homemaker 27% (31) 20% (23) 16% (18) 24% (28) 13% (15) 115Employ: Retired 32% (158) 35% (170) 15% (72) 16% (78) 3% (14) 492Employ: Unemployed 19% (45) 29% (65) 19% (43) 19% (43) 15% (33) 229Employ: Other 21% (32) 22% (34) 18% (28) 25% (37) 13% (20) 152Military HH: Yes 31% (94) 28% (87) 18% (54) 19% (59) 4% (11) 306Military HH: No 26% (433) 30% (512) 17% (293) 19% (312) 8% (132) 1682RD/WT: Right Direction 24% (135) 29% (164) 18% (104) 21% (119) 8% (45) 567RD/WT: Wrong Track 28% (392) 31% (435) 17% (244) 18% (252) 7% (98) 1421Trump Job Approve 20% (158) 30% (233) 19% (147) 24% (186) 6% (49) 774Trump Job Disapprove 32% (366) 31% (357) 16% (188) 16% (183) 5% (59) 1153Trump Job Strongly Approve 25% (105) 24% (101) 15% (63) 30% (126) 5% (20) 415Trump Job Somewhat Approve 15% (53) 37% (132) 23% (84) 17% (60) 8% (29) 359Trump Job Somewhat Disapprove 22% (49) 35% (79) 22% (49) 14% (32) 8% (17) 226Trump Job Strongly Disapprove 34% (318) 30% (277) 15% (139) 16% (151) 5% (42) 927
Continued on next page
Page 168
168
Morning ConsultTable POL6_8
Table POL6_8: How would you rate each of the following on their handling of the coronavirus?Your state’s governor
Demographic Excellent Good Just Fair PoorDon’t Know /No Opinion Total N
Registered Voters 27% (527) 30% (599) 17% (347) 19% (372) 7% (143) 1988Favorable of Trump 20% (158) 30% (235) 19% (151) 25% (193) 6% (50) 787Unfavorable of Trump 32% (362) 31% (354) 17% (188) 15% (170) 5% (58) 1132Very Favorable of Trump 25% (116) 24% (111) 17% (79) 28% (129) 6% (27) 462Somewhat Favorable of Trump 13% (42) 38% (124) 22% (71) 20% (64) 7% (23) 325Somewhat Unfavorable of Trump 19% (34) 34% (61) 28% (51) 13% (23) 7% (13) 182Very Unfavorable of Trump 35% (328) 31% (294) 14% (137) 15% (147) 5% (45) 950#1 Issue: Economy 24% (167) 31% (212) 19% (127) 21% (144) 6% (38) 688#1 Issue: Security 21% (54) 29% (75) 17% (44) 24% (62) 7% (19) 254#1 Issue: Health Care 28% (94) 32% (109) 17% (57) 15% (52) 7% (24) 335#1 Issue: Medicare / Social Security 31% (89) 32% (92) 15% (42) 15% (42) 6% (18) 283#1 Issue: Women’s Issues 30% (26) 23% (20) 20% (17) 20% (17) 7% (6) 86#1 Issue: Education 27% (29) 31% (33) 17% (18) 17% (18) 9% (9) 107#1 Issue: Energy 25% (20) 27% (21) 18% (14) 17% (13) 13% (10) 79#1 Issue: Other 31% (49) 24% (37) 18% (28) 15% (23) 12% (19) 1572018 House Vote: Democrat 38% (295) 33% (250) 13% (97) 14% (104) 3% (21) 7672018 House Vote: Republican 21% (135) 31% (194) 17% (107) 27% (170) 4% (23) 6292018 House Vote: Someone else 7% (5) 28% (20) 26% (19) 23% (17) 15% (11) 732016 Vote: Hillary Clinton 40% (277) 32% (227) 13% (92) 12% (85) 3% (19) 7002016 Vote: Donald Trump 20% (136) 32% (213) 18% (120) 26% (176) 4% (29) 6752016 Vote: Other 20% (29) 26% (37) 25% (36) 22% (31) 7% (10) 1442016 Vote: Didn’t Vote 18% (82) 26% (121) 21% (99) 17% (79) 18% (84) 466Voted in 2014: Yes 29% (383) 32% (425) 15% (201) 20% (263) 4% (50) 1322Voted in 2014: No 22% (144) 26% (174) 22% (146) 16% (109) 14% (93) 6662012 Vote: Barack Obama 35% (298) 33% (282) 15% (127) 14% (116) 4% (30) 8532012 Vote: Mitt Romney 20% (102) 31% (154) 17% (87) 29% (144) 3% (13) 5012012 Vote: Other 10% (8) 26% (21) 20% (17) 31% (26) 13% (11) 842012 Vote: Didn’t Vote 21% (118) 26% (141) 21% (117) 16% (86) 16% (88) 550
Continued on next page
Page 169
National Tracking Poll #2006102, June, 2020
169
Table POL6_8
Table POL6_8: How would you rate each of the following on their handling of the coronavirus?Your state’s governor
Demographic Excellent Good Just Fair PoorDon’t Know /No Opinion Total N
Registered Voters 27% (527) 30% (599) 17% (347) 19% (372) 7% (143) 19884-Region: Northeast 34% (122) 27% (96) 15% (54) 18% (63) 5% (19) 3554-Region: Midwest 31% (141) 30% (139) 13% (57) 19% (85) 7% (34) 4574-Region: South 21% (158) 30% (220) 20% (152) 21% (154) 8% (58) 7424-Region: West 25% (106) 33% (144) 19% (84) 16% (69) 7% (31) 434Party: Democrat/Leans Democrat 36% (331) 32% (293) 13% (121) 14% (123) 5% (42) 911Party: Republican/Leans Republican 21% (155) 30% (222) 19% (142) 25% (186) 5% (36) 741Parents 25% (219) 33% (286) 16% (139) 20% (171) 6% (49) 864Note: Row proportions may total to larger than one-hundred percent due to rounding. For more information visit MorningConsultIntelligence.com.
Page 170
170
Morning ConsultTable POL6_9
Table POL6_9: How would you rate each of the following on their handling of the coronavirus?Dr. Anthony Fauci, Director of the National Institute of Allergy and Infectious Diseases
Demographic Excellent Good Just Fair PoorDon’t Know /No Opinion Total N
Registered Voters 29% (582) 29% (585) 18% (356) 12% (237) 11% (228) 1988Gender: Male 27% (255) 30% (282) 19% (181) 13% (119) 10% (94) 930Gender: Female 31% (327) 29% (303) 17% (175) 11% (118) 13% (135) 1058Age: 18-34 21% (107) 28% (138) 16% (81) 11% (55) 24% (118) 499Age: 35-44 25% (75) 31% (94) 18% (55) 13% (39) 13% (39) 302Age: 45-64 32% (232) 28% (202) 20% (148) 12% (85) 8% (57) 724Age: 65+ 36% (167) 33% (152) 16% (72) 12% (57) 3% (14) 463GenZers: 1997-2012 22% (49) 25% (56) 15% (33) 7% (15) 31% (70) 224Millennials: 1981-1996 21% (87) 31% (132) 17% (72) 15% (63) 16% (66) 419GenXers: 1965-1980 30% (151) 28% (141) 21% (108) 12% (61) 10% (50) 511Baby Boomers: 1946-1964 36% (273) 30% (227) 17% (128) 12% (91) 5% (41) 760PID: Dem (no lean) 43% (329) 31% (236) 10% (78) 6% (43) 10% (72) 757PID: Ind (no lean) 26% (163) 27% (169) 19% (121) 13% (84) 16% (100) 638PID: Rep (no lean) 15% (90) 30% (180) 26% (156) 19% (111) 9% (56) 593PID/Gender: DemMen 41% (135) 35% (115) 9% (31) 5% (18) 9% (30) 329PID/Gender: DemWomen 45% (194) 28% (121) 11% (47) 6% (25) 10% (42) 429PID/Gender: Ind Men 26% (78) 23% (68) 21% (62) 16% (47) 14% (42) 296PID/Gender: Ind Women 25% (86) 30% (101) 17% (60) 11% (36) 17% (59) 342PID/Gender: Rep Men 14% (42) 32% (99) 29% (88) 18% (54) 7% (22) 306PID/Gender: Rep Women 17% (47) 28% (81) 24% (68) 20% (57) 12% (34) 287Ideo: Liberal (1-3) 43% (265) 34% (206) 11% (69) 5% (30) 6% (39) 609Ideo: Moderate (4) 33% (172) 31% (161) 15% (78) 9% (48) 12% (63) 522Ideo: Conservative (5-7) 18% (121) 27% (181) 27% (184) 22% (146) 7% (46) 679Educ: < College 24% (304) 28% (350) 20% (250) 13% (160) 15% (186) 1250Educ: Bachelors degree 36% (168) 32% (149) 13% (62) 11% (53) 8% (38) 470Educ: Post-grad 41% (110) 32% (86) 16% (44) 9% (24) 2% (5) 267Income: Under 50k 26% (261) 27% (273) 19% (194) 12% (120) 15% (150) 998Income: 50k-100k 30% (196) 32% (212) 17% (115) 13% (85) 8% (53) 660Income: 100k+ 38% (125) 30% (99) 14% (47) 10% (32) 8% (25) 329Ethnicity: White 30% (476) 30% (487) 18% (283) 13% (203) 10% (159) 1608Ethnicity: Hispanic 29% (55) 29% (56) 16% (31) 9% (18) 17% (32) 193
Continued on next page
Page 171
National Tracking Poll #2006102, June, 2020
171
Table POL6_9
Table POL6_9: How would you rate each of the following on their handling of the coronavirus?Dr. Anthony Fauci, Director of the National Institute of Allergy and Infectious Diseases
Demographic Excellent Good Just Fair PoorDon’t Know /No Opinion Total N
Registered Voters 29% (582) 29% (585) 18% (356) 12% (237) 11% (228) 1988Ethnicity: Afr. Am. 26% (66) 25% (64) 21% (54) 9% (24) 17% (44) 252Ethnicity: Other 32% (40) 26% (33) 15% (19) 8% (10) 20% (26) 128All Christian 29% (272) 32% (300) 19% (182) 13% (122) 7% (65) 941All Non-Christian 42% (41) 35% (34) 13% (12) 5% (5) 5% (5) 97Atheist 37% (48) 32% (40) 15% (19) 3% (4) 13% (16) 128Agnostic/Nothing in particular 30% (144) 26% (123) 15% (72) 12% (56) 17% (83) 478Something Else 22% (77) 25% (87) 20% (70) 14% (49) 17% (59) 344Religious Non-Protestant/Catholic 39% (47) 36% (43) 13% (16) 6% (7) 6% (8) 120Evangelical 21% (104) 30% (152) 24% (122) 15% (78) 10% (50) 505Non-Evangelical 32% (239) 29% (220) 17% (125) 12% (91) 10% (71) 746Community: Urban 28% (136) 32% (158) 18% (88) 9% (44) 13% (64) 490Community: Suburban 33% (319) 29% (283) 16% (157) 12% (119) 11% (104) 981Community: Rural 25% (127) 28% (144) 22% (111) 14% (74) 12% (61) 517Employ: Private Sector 32% (199) 30% (190) 20% (126) 11% (69) 7% (46) 631Employ: Government 33% (44) 28% (38) 19% (25) 9% (12) 12% (16) 136Employ: Self-Employed 22% (29) 31% (40) 17% (22) 14% (18) 16% (20) 130Employ: Homemaker 19% (22) 28% (33) 16% (19) 14% (16) 23% (26) 115Employ: Retired 36% (175) 31% (150) 17% (86) 13% (63) 4% (19) 492Employ: Unemployed 24% (55) 26% (59) 18% (40) 12% (27) 21% (47) 229Employ: Other 23% (36) 25% (39) 17% (25) 16% (24) 19% (28) 152Military HH: Yes 29% (88) 30% (93) 18% (55) 16% (49) 7% (20) 306Military HH: No 29% (494) 29% (492) 18% (301) 11% (188) 12% (208) 1682RD/WT: Right Direction 16% (91) 29% (166) 25% (140) 17% (98) 13% (73) 567RD/WT: Wrong Track 35% (491) 30% (419) 15% (216) 10% (139) 11% (155) 1421Trump Job Approve 13% (101) 29% (226) 28% (216) 20% (155) 10% (75) 774Trump Job Disapprove 41% (476) 30% (346) 12% (134) 7% (82) 10% (116) 1153Trump Job Strongly Approve 12% (50) 23% (96) 29% (122) 26% (110) 9% (37) 415Trump Job Somewhat Approve 14% (52) 36% (130) 26% (95) 13% (45) 11% (38) 359Trump Job Somewhat Disapprove 26% (58) 35% (78) 15% (35) 8% (19) 16% (36) 226Trump Job Strongly Disapprove 45% (418) 29% (267) 11% (99) 7% (63) 9% (80) 927
Continued on next page
Page 172
172
Morning ConsultTable POL6_9
Table POL6_9: How would you rate each of the following on their handling of the coronavirus?Dr. Anthony Fauci, Director of the National Institute of Allergy and Infectious Diseases
Demographic Excellent Good Just Fair PoorDon’t Know /No Opinion Total N
Registered Voters 29% (582) 29% (585) 18% (356) 12% (237) 11% (228) 1988Favorable of Trump 13% (102) 29% (228) 28% (223) 20% (157) 10% (77) 787Unfavorable of Trump 42% (472) 31% (349) 11% (127) 7% (74) 10% (110) 1132Very Favorable of Trump 11% (53) 22% (103) 31% (142) 26% (119) 10% (45) 462Somewhat Favorable of Trump 15% (49) 38% (124) 25% (81) 12% (38) 10% (32) 325Somewhat Unfavorable of Trump 26% (47) 34% (62) 17% (31) 9% (17) 14% (25) 182Very Unfavorable of Trump 45% (426) 30% (287) 10% (96) 6% (57) 9% (85) 950#1 Issue: Economy 24% (166) 29% (200) 22% (154) 14% (97) 10% (72) 688#1 Issue: Security 18% (46) 26% (66) 25% (63) 21% (52) 10% (27) 254#1 Issue: Health Care 38% (127) 31% (105) 14% (46) 6% (22) 11% (36) 335#1 Issue: Medicare / Social Security 39% (110) 37% (104) 9% (25) 9% (25) 7% (20) 283#1 Issue: Women’s Issues 30% (26) 29% (25) 16% (14) 11% (10) 14% (12) 86#1 Issue: Education 33% (36) 22% (24) 17% (18) 8% (8) 19% (21) 107#1 Issue: Energy 32% (25) 33% (26) 13% (10) 6% (5) 16% (12) 79#1 Issue: Other 30% (47) 22% (34) 17% (27) 12% (18) 19% (29) 1572018 House Vote: Democrat 48% (366) 31% (240) 10% (75) 5% (38) 6% (48) 7672018 House Vote: Republican 15% (96) 30% (192) 27% (172) 21% (129) 6% (40) 6292018 House Vote: Someone else 23% (17) 22% (16) 16% (12) 24% (18) 15% (11) 732016 Vote: Hillary Clinton 50% (350) 31% (215) 10% (71) 4% (25) 6% (40) 7002016 Vote: Donald Trump 16% (105) 29% (195) 27% (185) 21% (141) 7% (49) 6752016 Vote: Other 27% (39) 33% (47) 14% (20) 17% (24) 10% (14) 1442016 Vote: Didn’t Vote 19% (87) 27% (128) 17% (80) 10% (46) 27% (125) 466Voted in 2014: Yes 33% (432) 31% (405) 18% (233) 13% (172) 6% (80) 1322Voted in 2014: No 23% (150) 27% (180) 18% (123) 10% (65) 22% (148) 6662012 Vote: Barack Obama 44% (379) 32% (271) 11% (96) 7% (56) 6% (51) 8532012 Vote: Mitt Romney 15% (76) 32% (159) 27% (134) 21% (104) 5% (27) 5012012 Vote: Other 12% (10) 24% (20) 23% (19) 29% (24) 13% (10) 842012 Vote: Didn’t Vote 21% (116) 24% (135) 19% (107) 10% (53) 25% (139) 550
Continued on next page
Page 173
National Tracking Poll #2006102, June, 2020
173
Table POL6_9
Table POL6_9: How would you rate each of the following on their handling of the coronavirus?Dr. Anthony Fauci, Director of the National Institute of Allergy and Infectious Diseases
Demographic Excellent Good Just Fair PoorDon’t Know /No Opinion Total N
Registered Voters 29% (582) 29% (585) 18% (356) 12% (237) 11% (228) 19884-Region: Northeast 33% (119) 31% (110) 17% (59) 9% (33) 10% (34) 3554-Region: Midwest 27% (124) 32% (147) 19% (86) 10% (45) 12% (54) 4574-Region: South 26% (190) 28% (207) 20% (146) 15% (114) 12% (86) 7424-Region: West 34% (149) 28% (121) 15% (65) 10% (45) 13% (54) 434Party: Democrat/Leans Democrat 44% (401) 31% (285) 11% (97) 5% (47) 9% (82) 911Party: Republican/Leans Republican 16% (116) 30% (222) 27% (201) 19% (137) 9% (65) 741Parents 27% (237) 32% (273) 19% (163) 12% (100) 10% (90) 864Note: Row proportions may total to larger than one-hundred percent due to rounding. For more information visit MorningConsultIntelligence.com.
Page 174
174
Morning ConsultTable POL7
Table POL7: Generally speaking, would you say you are more concerned about...
Demographic
The economic impact ofcoronavirus including theeffect on the stock market
and increasedunemployment
The public health impactof coronavirus includingthe spread of the diseasewhich would cause more
deathsDon’t know / No
opinion Total N
Registered Voters 33% (661) 59% (1165) 8% (162) 1988Gender: Male 38% (358) 53% (492) 9% (80) 930Gender: Female 29% (303) 64% (673) 8% (82) 1058Age: 18-34 33% (163) 55% (277) 12% (60) 499Age: 35-44 39% (118) 52% (156) 9% (28) 302Age: 45-64 32% (229) 62% (449) 6% (46) 724Age: 65+ 33% (152) 61% (283) 6% (28) 463GenZers: 1997-2012 31% (70) 55% (122) 14% (32) 224Millennials: 1981-1996 33% (139) 56% (234) 11% (46) 419GenXers: 1965-1980 39% (201) 55% (282) 6% (28) 511Baby Boomers: 1946-1964 30% (225) 64% (483) 7% (52) 760PID: Dem (no lean) 19% (143) 76% (577) 5% (37) 757PID: Ind (no lean) 33% (210) 54% (343) 13% (85) 638PID: Rep (no lean) 52% (308) 41% (245) 7% (40) 593PID/Gender: DemMen 22% (72) 71% (235) 7% (22) 329PID/Gender: DemWomen 17% (71) 80% (343) 3% (15) 429PID/Gender: Ind Men 39% (116) 47% (138) 14% (41) 296PID/Gender: Ind Women 27% (94) 60% (204) 13% (44) 342PID/Gender: Rep Men 56% (170) 39% (119) 5% (17) 306PID/Gender: Rep Women 48% (138) 44% (126) 8% (23) 287Ideo: Liberal (1-3) 19% (118) 77% (467) 4% (24) 609Ideo: Moderate (4) 25% (133) 65% (341) 9% (48) 522Ideo: Conservative (5-7) 55% (371) 39% (267) 6% (41) 679Educ: < College 34% (421) 57% (712) 9% (117) 1250Educ: Bachelors degree 32% (150) 60% (282) 8% (38) 470Educ: Post-grad 33% (89) 64% (171) 3% (7) 267Income: Under 50k 31% (310) 59% (589) 10% (100) 998Income: 50k-100k 37% (243) 57% (373) 7% (44) 660Income: 100k+ 33% (108) 62% (203) 5% (18) 329
Continued on next page
Page 175
National Tracking Poll #2006102, June, 2020
175
Table POL7
Table POL7: Generally speaking, would you say you are more concerned about...
Demographic
The economic impact ofcoronavirus including theeffect on the stock market
and increasedunemployment
The public health impactof coronavirus includingthe spread of the diseasewhich would cause more
deathsDon’t know / No
opinion Total N
Registered Voters 33% (661) 59% (1165) 8% (162) 1988Ethnicity: White 36% (571) 57% (919) 7% (118) 1608Ethnicity: Hispanic 29% (56) 58% (112) 13% (24) 193Ethnicity: Afr. Am. 21% (54) 67% (168) 12% (30) 252Ethnicity: Other 28% (36) 61% (78) 11% (14) 128All Christian 38% (354) 56% (530) 6% (56) 941All Non-Christian 29% (29) 65% (64) 5% (5) 97Atheist 31% (39) 65% (83) 4% (5) 128Agnostic/Nothing in particular 27% (131) 61% (293) 11% (54) 478Something Else 31% (108) 57% (195) 12% (41) 344Religious Non-Protestant/Catholic 29% (34) 64% (77) 7% (8) 120Evangelical 40% (203) 52% (261) 8% (41) 505Non-Evangelical 34% (251) 60% (444) 7% (50) 746Community: Urban 32% (156) 60% (293) 8% (41) 490Community: Suburban 32% (317) 60% (593) 7% (71) 981Community: Rural 36% (189) 54% (279) 10% (50) 517Employ: Private Sector 36% (228) 59% (369) 5% (33) 631Employ: Government 35% (48) 58% (79) 6% (9) 136Employ: Self-Employed 29% (37) 55% (71) 16% (21) 130Employ: Homemaker 29% (33) 61% (70) 10% (12) 115Employ: Retired 33% (161) 61% (301) 6% (29) 492Employ: Unemployed 32% (73) 54% (125) 14% (31) 229Employ: Other 33% (50) 54% (83) 13% (19) 152Military HH: Yes 40% (124) 54% (164) 6% (18) 306Military HH: No 32% (537) 60% (1001) 9% (144) 1682RD/WT: Right Direction 52% (297) 39% (219) 9% (52) 567RD/WT: Wrong Track 26% (364) 67% (946) 8% (110) 1421Trump Job Approve 55% (425) 38% (292) 7% (56) 774Trump Job Disapprove 20% (226) 73% (847) 7% (80) 1153
Continued on next page
Page 176
176
Morning ConsultTable POL7
Table POL7: Generally speaking, would you say you are more concerned about...
Demographic
The economic impact ofcoronavirus including theeffect on the stock market
and increasedunemployment
The public health impactof coronavirus includingthe spread of the diseasewhich would cause more
deathsDon’t know / No
opinion Total N
Registered Voters 33% (661) 59% (1165) 8% (162) 1988Trump Job Strongly Approve 60% (250) 32% (132) 8% (33) 415Trump Job Somewhat Approve 49% (174) 45% (161) 7% (24) 359Trump Job Somewhat Disapprove 29% (66) 62% (141) 9% (20) 226Trump Job Strongly Disapprove 17% (160) 76% (706) 7% (61) 927Favorable of Trump 54% (427) 38% (300) 8% (60) 787Unfavorable of Trump 19% (221) 74% (840) 6% (72) 1132Very Favorable of Trump 60% (278) 32% (149) 8% (36) 462Somewhat Favorable of Trump 46% (149) 47% (152) 7% (24) 325Somewhat Unfavorable of Trump 34% (62) 58% (105) 9% (16) 182Very Unfavorable of Trump 17% (159) 77% (735) 6% (56) 950#1 Issue: Economy 48% (332) 45% (312) 6% (43) 688#1 Issue: Security 44% (112) 46% (116) 10% (26) 254#1 Issue: Health Care 17% (57) 77% (257) 6% (21) 335#1 Issue: Medicare / Social Security 21% (58) 71% (200) 9% (25) 283#1 Issue: Women’s Issues 21% (18) 71% (61) 8% (7) 86#1 Issue: Education 25% (27) 63% (67) 12% (12) 107#1 Issue: Energy 24% (19) 64% (51) 12% (9) 79#1 Issue: Other 24% (38) 64% (100) 12% (19) 1572018 House Vote: Democrat 17% (132) 79% (606) 4% (30) 7672018 House Vote: Republican 55% (346) 39% (247) 6% (36) 6292018 House Vote: Someone else 30% (22) 49% (36) 21% (15) 732016 Vote: Hillary Clinton 16% (115) 79% (551) 5% (34) 7002016 Vote: Donald Trump 53% (361) 40% (273) 6% (41) 6752016 Vote: Other 33% (48) 54% (78) 13% (18) 1442016 Vote: Didn’t Vote 30% (138) 56% (260) 15% (68) 466Voted in 2014: Yes 34% (454) 60% (792) 6% (76) 1322Voted in 2014: No 31% (207) 56% (373) 13% (86) 666
Continued on next page
Page 177
National Tracking Poll #2006102, June, 2020
177
Table POL7
Table POL7: Generally speaking, would you say you are more concerned about...
Demographic
The economic impact ofcoronavirus including theeffect on the stock market
and increasedunemployment
The public health impactof coronavirus includingthe spread of the diseasewhich would cause more
deathsDon’t know / No
opinion Total N
Registered Voters 33% (661) 59% (1165) 8% (162) 19882012 Vote: Barack Obama 21% (183) 74% (633) 4% (37) 8532012 Vote: Mitt Romney 53% (268) 40% (201) 6% (32) 5012012 Vote: Other 40% (33) 38% (32) 22% (18) 842012 Vote: Didn’t Vote 32% (176) 55% (300) 14% (74) 5504-Region: Northeast 31% (109) 62% (220) 7% (25) 3554-Region: Midwest 37% (171) 54% (245) 9% (41) 4574-Region: South 33% (246) 58% (432) 9% (65) 7424-Region: West 31% (135) 62% (269) 7% (31) 434Party: Democrat/Leans Democrat 19% (173) 76% (694) 5% (44) 911Party: Republican/Leans Republican 52% (388) 41% (303) 7% (50) 741Parents 37% (323) 56% (488) 6% (53) 864Note: Row proportions may total to larger than one-hundred percent due to rounding. For more information visit MorningConsultIntelligence.com.
Page 178
178
Morning ConsultTable POL8
Table POL8: Currently, do you believe it’s more important for the government to address the:
DemographicThe spread ofcoronavirus The economy
Don’t know / Noopinion Total N
Registered Voters 60% (1196) 33% (648) 7% (144) 1988Gender: Male 59% (550) 34% (320) 7% (61) 930Gender: Female 61% (647) 31% (328) 8% (83) 1058Age: 18-34 63% (314) 27% (135) 10% (51) 499Age: 35-44 56% (170) 35% (104) 9% (27) 302Age: 45-64 60% (435) 35% (251) 5% (37) 724Age: 65+ 60% (277) 34% (157) 6% (28) 463GenZers: 1997-2012 65% (145) 22% (50) 13% (29) 224Millennials: 1981-1996 59% (247) 32% (134) 9% (39) 419GenXers: 1965-1980 58% (299) 36% (185) 5% (28) 511Baby Boomers: 1946-1964 62% (468) 33% (248) 6% (44) 760PID: Dem (no lean) 80% (607) 15% (116) 4% (34) 757PID: Ind (no lean) 55% (352) 34% (216) 11% (69) 638PID: Rep (no lean) 40% (237) 53% (315) 7% (41) 593PID/Gender: DemMen 80% (262) 15% (49) 5% (18) 329PID/Gender: DemWomen 80% (345) 16% (68) 4% (16) 429PID/Gender: Ind Men 52% (152) 38% (113) 10% (31) 296PID/Gender: Ind Women 58% (200) 30% (103) 11% (39) 342PID/Gender: Rep Men 44% (135) 52% (159) 4% (12) 306PID/Gender: Rep Women 35% (102) 55% (156) 10% (29) 287Ideo: Liberal (1-3) 82% (498) 15% (91) 3% (20) 609Ideo: Moderate (4) 65% (341) 26% (133) 9% (48) 522Ideo: Conservative (5-7) 39% (264) 56% (380) 5% (35) 679Educ: < College 58% (722) 34% (428) 8% (100) 1250Educ: Bachelors degree 63% (297) 29% (138) 8% (36) 470Educ: Post-grad 66% (178) 31% (82) 3% (8) 267Income: Under 50k 59% (588) 32% (322) 9% (88) 998Income: 50k-100k 60% (397) 35% (230) 5% (34) 660Income: 100k+ 64% (211) 29% (96) 7% (22) 329Ethnicity: White 58% (932) 35% (563) 7% (113) 1608Ethnicity: Hispanic 69% (133) 25% (49) 6% (11) 193Ethnicity: Afr. Am. 71% (180) 21% (54) 7% (18) 252
Continued on next page
Page 179
National Tracking Poll #2006102, June, 2020
179
Table POL8
Table POL8: Currently, do you believe it’s more important for the government to address the:
DemographicThe spread ofcoronavirus The economy
Don’t know / Noopinion Total N
Registered Voters 60% (1196) 33% (648) 7% (144) 1988Ethnicity: Other 66% (85) 25% (31) 9% (12) 128All Christian 57% (532) 38% (355) 6% (53) 941All Non-Christian 69% (67) 28% (28) 3% (3) 97Atheist 72% (92) 24% (31) 4% (5) 128Agnostic/Nothing in particular 65% (311) 25% (121) 10% (46) 478Something Else 57% (194) 33% (113) 11% (36) 344Religious Non-Protestant/Catholic 66% (80) 29% (35) 4% (5) 120Evangelical 51% (257) 41% (208) 8% (41) 505Non-Evangelical 60% (450) 34% (250) 6% (46) 746Community: Urban 64% (315) 29% (143) 6% (31) 490Community: Suburban 63% (615) 30% (298) 7% (68) 981Community: Rural 52% (266) 40% (206) 9% (45) 517Employ: Private Sector 61% (386) 33% (211) 5% (34) 631Employ: Government 64% (86) 30% (41) 6% (9) 136Employ: Self-Employed 59% (77) 30% (39) 11% (14) 130Employ: Homemaker 60% (69) 33% (38) 7% (8) 115Employ: Retired 59% (290) 35% (170) 6% (32) 492Employ: Unemployed 57% (130) 34% (77) 10% (23) 229Employ: Other 57% (87) 33% (50) 10% (15) 152Military HH: Yes 55% (168) 41% (124) 4% (14) 306Military HH: No 61% (1028) 31% (524) 8% (130) 1682RD/WT: Right Direction 36% (207) 55% (312) 9% (49) 567RD/WT: Wrong Track 70% (990) 24% (335) 7% (95) 1421Trump Job Approve 37% (283) 56% (434) 7% (57) 774Trump Job Disapprove 77% (886) 18% (203) 6% (65) 1153Trump Job Strongly Approve 30% (123) 63% (262) 7% (30) 415Trump Job Somewhat Approve 45% (160) 48% (172) 7% (26) 359Trump Job Somewhat Disapprove 62% (140) 30% (69) 8% (17) 226Trump Job Strongly Disapprove 80% (746) 14% (134) 5% (47) 927Favorable of Trump 36% (285) 56% (441) 8% (62) 787Unfavorable of Trump 78% (882) 17% (190) 5% (61) 1132
Continued on next page
Page 180
180
Morning ConsultTable POL8
Table POL8: Currently, do you believe it’s more important for the government to address the:
DemographicThe spread ofcoronavirus The economy
Don’t know / Noopinion Total N
Registered Voters 60% (1196) 33% (648) 7% (144) 1988Very Favorable of Trump 29% (135) 64% (294) 7% (33) 462Somewhat Favorable of Trump 46% (150) 45% (146) 9% (28) 325Somewhat Unfavorable of Trump 58% (106) 33% (60) 9% (16) 182Very Unfavorable of Trump 82% (776) 14% (129) 5% (45) 950#1 Issue: Economy 53% (367) 42% (289) 5% (33) 688#1 Issue: Security 41% (105) 50% (127) 9% (22) 254#1 Issue: Health Care 76% (253) 17% (57) 7% (25) 335#1 Issue: Medicare / Social Security 64% (181) 27% (77) 9% (25) 283#1 Issue: Women’s Issues 66% (57) 23% (20) 10% (9) 86#1 Issue: Education 69% (73) 23% (25) 8% (9) 107#1 Issue: Energy 74% (59) 19% (15) 6% (5) 79#1 Issue: Other 65% (101) 25% (39) 11% (17) 1572018 House Vote: Democrat 81% (618) 15% (117) 4% (32) 7672018 House Vote: Republican 38% (239) 55% (349) 7% (41) 6292018 House Vote: Someone else 50% (37) 36% (26) 14% (10) 732016 Vote: Hillary Clinton 82% (574) 14% (99) 4% (28) 7002016 Vote: Donald Trump 38% (256) 55% (372) 7% (47) 6752016 Vote: Other 59% (86) 29% (42) 11% (16) 1442016 Vote: Didn’t Vote 60% (278) 29% (135) 11% (53) 466Voted in 2014: Yes 60% (793) 34% (455) 6% (73) 1322Voted in 2014: No 61% (403) 29% (193) 11% (70) 6662012 Vote: Barack Obama 76% (645) 20% (174) 4% (34) 8532012 Vote: Mitt Romney 38% (191) 56% (278) 6% (31) 5012012 Vote: Other 38% (32) 45% (38) 17% (14) 842012 Vote: Didn’t Vote 60% (327) 29% (157) 12% (65) 5504-Region: Northeast 60% (214) 32% (115) 7% (26) 3554-Region: Midwest 56% (258) 36% (163) 8% (36) 4574-Region: South 59% (441) 33% (244) 8% (57) 7424-Region: West 65% (284) 29% (126) 6% (24) 434Party: Democrat/Leans Democrat 80% (729) 16% (143) 4% (39) 911Party: Republican/Leans Republican 39% (292) 54% (398) 7% (51) 741
Continued on next page
Page 181
National Tracking Poll #2006102, June, 2020
181
Table POL8
Table POL8: Currently, do you believe it’s more important for the government to address the:
DemographicThe spread ofcoronavirus The economy
Don’t know / Noopinion Total N
Registered Voters 60% (1196) 33% (648) 7% (144) 1988Parents 57% (495) 36% (312) 7% (56) 864Note: Row proportions may total to larger than one-hundred percent due to rounding. For more information visit MorningConsultIntelligence.com.
Page 182
182
Morning ConsultTable POL9
Table POL9: Even if neither is exactly correct, which of the following comes closest to your opinion?
Demographic
Americans shouldcontinue to social
distance for as long as isneeded to curb the spreadof coronavirus even if itmeans continued damage
to the economy
Americans should stopsocial distancing to
stimulate the economyeven if it means
increasing the spread ofcoronavirus
Don’t know / Noopinion Total N
Registered Voters 71% (1414) 18% (357) 11% (217) 1988Gender: Male 68% (636) 21% (195) 11% (100) 930Gender: Female 74% (778) 15% (163) 11% (117) 1058Age: 18-34 69% (345) 15% (75) 16% (79) 499Age: 35-44 66% (200) 25% (74) 9% (28) 302Age: 45-64 75% (540) 17% (126) 8% (58) 724Age: 65+ 71% (329) 18% (82) 11% (52) 463GenZers: 1997-2012 73% (163) 10% (22) 17% (39) 224Millennials: 1981-1996 65% (274) 21% (90) 13% (55) 419GenXers: 1965-1980 71% (365) 20% (104) 8% (42) 511Baby Boomers: 1946-1964 73% (556) 17% (132) 10% (72) 760PID: Dem (no lean) 87% (660) 6% (43) 7% (55) 757PID: Ind (no lean) 68% (432) 18% (115) 14% (90) 638PID: Rep (no lean) 54% (322) 34% (199) 12% (72) 593PID/Gender: DemMen 86% (284) 6% (20) 8% (25) 329PID/Gender: DemWomen 88% (376) 5% (23) 7% (30) 429PID/Gender: Ind Men 63% (185) 21% (62) 16% (49) 296PID/Gender: Ind Women 72% (247) 16% (54) 12% (41) 342PID/Gender: Rep Men 55% (167) 37% (113) 8% (26) 306PID/Gender: Rep Women 54% (155) 30% (86) 16% (46) 287Ideo: Liberal (1-3) 88% (534) 7% (42) 5% (32) 609Ideo: Moderate (4) 78% (407) 11% (58) 11% (56) 522Ideo: Conservative (5-7) 54% (366) 36% (244) 10% (69) 679Educ: < College 68% (852) 18% (231) 13% (168) 1250Educ: Bachelors degree 76% (357) 16% (77) 8% (37) 470Educ: Post-grad 77% (205) 19% (50) 4% (12) 267
Continued on next page
Page 183
National Tracking Poll #2006102, June, 2020
183
Table POL9
Table POL9: Even if neither is exactly correct, which of the following comes closest to your opinion?
Demographic
Americans shouldcontinue to social
distance for as long as isneeded to curb the spreadof coronavirus even if itmeans continued damage
to the economy
Americans should stopsocial distancing to
stimulate the economyeven if it means
increasing the spread ofcoronavirus
Don’t know / Noopinion Total N
Registered Voters 71% (1414) 18% (357) 11% (217) 1988Income: Under 50k 70% (700) 16% (160) 14% (138) 998Income: 50k-100k 71% (470) 21% (139) 8% (52) 660Income: 100k+ 74% (244) 18% (58) 8% (27) 329Ethnicity: White 69% (1112) 20% (327) 11% (169) 1608Ethnicity: Hispanic 74% (142) 13% (25) 13% (25) 193Ethnicity: Afr. Am. 81% (205) 7% (17) 12% (31) 252Ethnicity: Other 76% (97) 11% (14) 13% (17) 128All Christian 70% (656) 21% (194) 10% (91) 941All Non-Christian 79% (77) 13% (13) 7% (7) 97Atheist 80% (102) 16% (20) 4% (6) 128Agnostic/Nothing in particular 72% (342) 15% (72) 13% (64) 478Something Else 69% (237) 17% (58) 14% (49) 344Religious Non-Protestant/Catholic 78% (93) 14% (17) 8% (10) 120Evangelical 64% (322) 24% (121) 12% (62) 505Non-Evangelical 73% (546) 17% (127) 10% (73) 746Community: Urban 74% (361) 17% (81) 10% (48) 490Community: Suburban 72% (709) 17% (169) 11% (103) 981Community: Rural 66% (344) 21% (108) 13% (66) 517Employ: Private Sector 75% (475) 18% (114) 7% (42) 631Employ: Government 70% (95) 21% (28) 9% (12) 136Employ: Self-Employed 73% (95) 15% (19) 12% (16) 130Employ: Homemaker 65% (74) 23% (26) 13% (14) 115Employ: Retired 71% (347) 20% (98) 9% (46) 492Employ: Unemployed 67% (154) 15% (33) 18% (41) 229Employ: Other 63% (96) 16% (24) 21% (32) 152
Continued on next page
Page 184
184
Morning ConsultTable POL9
Table POL9: Even if neither is exactly correct, which of the following comes closest to your opinion?
Demographic
Americans shouldcontinue to social
distance for as long as isneeded to curb the spreadof coronavirus even if itmeans continued damage
to the economy
Americans should stopsocial distancing to
stimulate the economyeven if it means
increasing the spread ofcoronavirus
Don’t know / Noopinion Total N
Registered Voters 71% (1414) 18% (357) 11% (217) 1988Military HH: Yes 65% (200) 22% (69) 12% (37) 306Military HH: No 72% (1213) 17% (289) 11% (180) 1682RD/WT: Right Direction 53% (303) 32% (183) 14% (81) 567RD/WT: Wrong Track 78% (1111) 12% (174) 10% (136) 1421Trump Job Approve 53% (413) 35% (269) 12% (91) 774Trump Job Disapprove 84% (972) 7% (82) 9% (99) 1153Trump Job Strongly Approve 44% (181) 43% (179) 13% (55) 415Trump Job Somewhat Approve 65% (232) 25% (90) 10% (36) 359Trump Job Somewhat Disapprove 74% (169) 13% (29) 13% (29) 226Trump Job Strongly Disapprove 87% (804) 6% (54) 8% (70) 927Favorable of Trump 53% (418) 35% (274) 12% (96) 787Unfavorable of Trump 85% (964) 6% (73) 8% (95) 1132Very Favorable of Trump 44% (203) 43% (199) 13% (60) 462Somewhat Favorable of Trump 66% (215) 23% (75) 11% (35) 325Somewhat Unfavorable of Trump 74% (134) 15% (27) 11% (21) 182Very Unfavorable of Trump 87% (830) 5% (46) 8% (74) 950#1 Issue: Economy 66% (456) 24% (164) 10% (68) 688#1 Issue: Security 59% (151) 30% (77) 10% (25) 254#1 Issue: Health Care 83% (278) 10% (33) 7% (25) 335#1 Issue: Medicare / Social Security 76% (215) 11% (31) 13% (37) 283#1 Issue: Women’s Issues 76% (65) 12% (10) 12% (11) 86#1 Issue: Education 66% (71) 17% (18) 16% (17) 107#1 Issue: Energy 89% (70) 3% (2) 9% (7) 79#1 Issue: Other 70% (109) 13% (21) 17% (26) 157
Continued on next page
Page 185
National Tracking Poll #2006102, June, 2020
185
Table POL9
Table POL9: Even if neither is exactly correct, which of the following comes closest to your opinion?
Demographic
Americans shouldcontinue to social
distance for as long as isneeded to curb the spreadof coronavirus even if itmeans continued damage
to the economy
Americans should stopsocial distancing to
stimulate the economyeven if it means
increasing the spread ofcoronavirus
Don’t know / Noopinion Total N
Registered Voters 71% (1414) 18% (357) 11% (217) 19882018 House Vote: Democrat 89% (686) 5% (42) 5% (39) 7672018 House Vote: Republican 54% (337) 35% (221) 11% (71) 6292018 House Vote: Someone else 64% (47) 18% (13) 18% (13) 732016 Vote: Hillary Clinton 89% (623) 5% (37) 6% (40) 7002016 Vote: Donald Trump 54% (365) 34% (232) 11% (77) 6752016 Vote: Other 76% (111) 15% (22) 8% (12) 1442016 Vote: Didn’t Vote 67% (314) 14% (65) 19% (88) 466Voted in 2014: Yes 72% (955) 19% (255) 8% (111) 1322Voted in 2014: No 69% (459) 15% (102) 16% (106) 6662012 Vote: Barack Obama 86% (731) 9% (77) 5% (45) 8532012 Vote: Mitt Romney 54% (269) 35% (174) 11% (57) 5012012 Vote: Other 51% (43) 30% (25) 19% (16) 842012 Vote: Didn’t Vote 67% (370) 15% (81) 18% (99) 5504-Region: Northeast 74% (262) 15% (55) 11% (38) 3554-Region: Midwest 68% (309) 20% (91) 12% (57) 4574-Region: South 70% (523) 18% (133) 12% (86) 7424-Region: West 74% (320) 18% (78) 8% (36) 434Party: Democrat/Leans Democrat 87% (791) 6% (56) 7% (64) 911Party: Republican/Leans Republican 55% (405) 34% (249) 12% (86) 741Parents 71% (613) 20% (176) 9% (75) 864Note: Row proportions may total to larger than one-hundred percent due to rounding. For more information visit MorningConsultIntelligence.com.
Page 186
186
Morning ConsultTable POL10
Table POL10: As you may know, in response to the coronavirus Americans have been encouraged to ’social distance’ with many states cancelingupcoming major events and closing schools,restaurants, and other public spaces. Based on what you know, when do you believe Americans will be ableto stop social distancing and return to public spaces?
DemographicIn the nexttwo weeks
In the nextmonth
In the nexttwo months
In the nextthreemonths
In the nextsix months
More thansix monthsfrom now
Don’t know /No opinion Total N
Registered Voters 7% (134) 8% (166) 11% (214) 9% (184) 18% (359) 34% (674) 13% (256) 1988Gender: Male 8% (76) 10% (94) 12% (114) 9% (85) 19% (179) 28% (265) 13% (117) 930Gender: Female 5% (58) 7% (72) 9% (100) 9% (99) 17% (180) 39% (409) 13% (140) 1058Age: 18-34 7% (37) 11% (54) 14% (72) 9% (45) 19% (94) 25% (124) 14% (72) 499Age: 35-44 9% (28) 8% (26) 10% (30) 9% (27) 22% (67) 30% (91) 11% (33) 302Age: 45-64 7% (48) 8% (57) 9% (67) 9% (62) 16% (118) 38% (274) 14% (99) 724Age: 65+ 5% (21) 6% (29) 10% (46) 11% (50) 17% (80) 40% (185) 11% (53) 463GenZers: 1997-2012 6% (13) 12% (27) 16% (36) 11% (26) 17% (39) 21% (48) 16% (36) 224Millennials: 1981-1996 9% (39) 9% (39) 11% (48) 8% (32) 22% (94) 29% (122) 11% (45) 419GenXers: 1965-1980 8% (39) 8% (40) 10% (54) 9% (46) 17% (86) 32% (162) 17% (85) 511Baby Boomers: 1946-1964 5% (41) 7% (54) 10% (73) 9% (66) 16% (125) 42% (317) 11% (84) 760PID: Dem (no lean) 3% (23) 6% (47) 10% (73) 7% (55) 21% (156) 42% (317) 11% (86) 757PID: Ind (no lean) 7% (42) 7% (47) 10% (65) 9% (60) 18% (113) 33% (211) 16% (101) 638PID: Rep (no lean) 12% (70) 12% (72) 13% (77) 12% (68) 15% (91) 25% (146) 12% (69) 593PID/Gender: DemMen 5% (15) 8% (25) 12% (40) 8% (27) 23% (76) 32% (107) 12% (39) 329PID/Gender: DemWomen 2% (7) 5% (22) 8% (32) 7% (28) 19% (80) 49% (211) 11% (47) 429PID/Gender: Ind Men 8% (22) 7% (20) 9% (28) 8% (24) 20% (59) 32% (95) 16% (47) 296PID/Gender: Ind Women 6% (19) 8% (26) 11% (37) 10% (36) 16% (54) 34% (115) 16% (54) 342PID/Gender: Rep Men 13% (39) 16% (49) 15% (46) 11% (33) 15% (45) 21% (63) 10% (31) 306PID/Gender: Rep Women 11% (31) 8% (23) 11% (31) 12% (35) 16% (46) 29% (83) 13% (38) 287Ideo: Liberal (1-3) 4% (26) 7% (45) 10% (62) 8% (48) 22% (132) 42% (253) 7% (43) 609Ideo: Moderate (4) 4% (18) 6% (31) 10% (54) 9% (48) 17% (90) 40% (210) 13% (70) 522Ideo: Conservative (5-7) 12% (81) 12% (80) 12% (80) 11% (75) 17% (116) 24% (162) 13% (85) 679Educ: < College 6% (81) 9% (112) 11% (138) 9% (115) 17% (216) 31% (391) 16% (198) 1250Educ: Bachelors degree 7% (35) 8% (36) 10% (48) 10% (47) 20% (94) 36% (171) 9% (40) 470Educ: Post-grad 7% (19) 7% (19) 11% (29) 8% (21) 18% (49) 42% (112) 7% (18) 267Income: Under 50k 6% (59) 8% (84) 10% (98) 9% (93) 18% (178) 33% (329) 16% (157) 998Income: 50k-100k 8% (52) 8% (53) 11% (70) 9% (60) 18% (121) 35% (233) 11% (72) 660Income: 100k+ 7% (23) 9% (30) 14% (46) 9% (31) 18% (60) 34% (113) 8% (27) 329
Continued on next page
Page 187
National Tracking Poll #2006102, June, 2020
187
Table POL10
Table POL10: As you may know, in response to the coronavirus Americans have been encouraged to ’social distance’ with many states cancelingupcoming major events and closing schools,restaurants, and other public spaces. Based on what you know, when do you believe Americans will be ableto stop social distancing and return to public spaces?
DemographicIn the nexttwo weeks
In the nextmonth
In the nexttwo months
In the nextthreemonths
In the nextsix months
More thansix monthsfrom now
Don’t know /No opinion Total N
Registered Voters 7% (134) 8% (166) 11% (214) 9% (184) 18% (359) 34% (674) 13% (256) 1988Ethnicity: White 7% (118) 9% (141) 11% (170) 10% (155) 18% (292) 34% (543) 12% (189) 1608Ethnicity: Hispanic 7% (13) 12% (23) 6% (12) 7% (13) 19% (36) 36% (69) 14% (27) 193Ethnicity: Afr. Am. 5% (13) 6% (15) 12% (31) 6% (14) 18% (46) 34% (86) 18% (46) 252Ethnicity: Other 3% (3) 8% (10) 10% (13) 11% (14) 17% (22) 35% (45) 16% (21) 128All Christian 7% (62) 9% (84) 12% (110) 10% (91) 19% (178) 33% (315) 11% (101) 941All Non-Christian 8% (8) 12% (11) 10% (10) 10% (10) 12% (11) 40% (39) 8% (8) 97Atheist 8% (10) 6% (8) 12% (15) 12% (15) 15% (19) 41% (52) 7% (9) 128Agnostic/Nothing in particular 5% (24) 7% (35) 8% (40) 8% (40) 22% (105) 35% (165) 14% (68) 478Something Else 9% (30) 8% (27) 11% (39) 8% (28) 13% (46) 30% (104) 21% (71) 344Religious Non-Protestant/Catholic 9% (11) 11% (13) 11% (13) 10% (12) 14% (16) 38% (46) 7% (9) 120Evangelical 9% (44) 9% (45) 13% (64) 11% (53) 14% (71) 28% (142) 17% (86) 505Non-Evangelical 6% (46) 8% (63) 11% (79) 8% (62) 19% (145) 36% (266) 11% (84) 746Community: Urban 7% (33) 10% (47) 11% (53) 9% (45) 20% (96) 29% (144) 15% (73) 490Community: Suburban 6% (58) 8% (80) 12% (114) 9% (91) 17% (169) 36% (349) 12% (120) 981Community: Rural 8% (44) 7% (39) 9% (48) 9% (47) 18% (95) 35% (181) 12% (64) 517Employ: Private Sector 7% (44) 9% (55) 10% (65) 11% (70) 21% (134) 33% (208) 9% (57) 631Employ: Government 9% (12) 8% (11) 10% (13) 5% (7) 20% (27) 36% (48) 13% (18) 136Employ: Self-Employed 5% (7) 3% (4) 10% (13) 11% (14) 20% (26) 37% (49) 14% (18) 130Employ: Homemaker 10% (11) 5% (6) 9% (10) 8% (9) 16% (19) 36% (41) 16% (19) 115Employ: Retired 5% (27) 8% (38) 11% (56) 10% (47) 17% (85) 38% (187) 11% (53) 492Employ: Unemployed 5% (11) 8% (18) 10% (23) 5% (12) 15% (34) 33% (76) 24% (55) 229Employ: Other 10% (15) 11% (17) 6% (9) 9% (13) 14% (21) 33% (50) 17% (26) 152Military HH: Yes 8% (26) 8% (24) 11% (32) 8% (24) 18% (54) 33% (103) 14% (44) 306Military HH: No 6% (108) 8% (143) 11% (182) 9% (159) 18% (306) 34% (572) 13% (213) 1682RD/WT: Right Direction 13% (75) 15% (83) 15% (85) 10% (56) 15% (86) 21% (117) 12% (65) 567RD/WT: Wrong Track 4% (59) 6% (83) 9% (130) 9% (128) 19% (273) 39% (557) 13% (191) 1421Trump Job Approve 13% (101) 12% (94) 13% (104) 12% (89) 16% (124) 22% (170) 12% (92) 774Trump Job Disapprove 3% (32) 6% (69) 9% (108) 8% (91) 20% (230) 42% (488) 12% (136) 1153
Continued on next page
Page 188
188
Morning ConsultTable POL10
Table POL10: As you may know, in response to the coronavirus Americans have been encouraged to ’social distance’ with many states cancelingupcoming major events and closing schools,restaurants, and other public spaces. Based on what you know, when do you believe Americans will be ableto stop social distancing and return to public spaces?
DemographicIn the nexttwo weeks
In the nextmonth
In the nexttwo months
In the nextthreemonths
In the nextsix months
More thansix monthsfrom now
Don’t know /No opinion Total N
Registered Voters 7% (134) 8% (166) 11% (214) 9% (184) 18% (359) 34% (674) 13% (256) 1988Trump Job Strongly Approve 18% (75) 16% (64) 12% (49) 9% (39) 14% (60) 17% (70) 14% (58) 415Trump Job Somewhat Approve 7% (26) 8% (30) 15% (55) 14% (50) 18% (64) 28% (100) 9% (34) 359Trump Job Somewhat Disapprove 4% (9) 9% (20) 11% (26) 12% (26) 20% (45) 31% (70) 14% (31) 226Trump Job Strongly Disapprove 2% (23) 5% (49) 9% (82) 7% (65) 20% (185) 45% (418) 11% (105) 927Favorable of Trump 12% (95) 12% (96) 13% (99) 11% (86) 16% (122) 23% (181) 14% (107) 787Unfavorable of Trump 3% (36) 6% (66) 9% (107) 8% (92) 20% (230) 42% (480) 11% (121) 1132Very Favorable of Trump 17% (77) 15% (71) 13% (61) 10% (45) 14% (65) 18% (82) 13% (61) 462Somewhat Favorable of Trump 6% (18) 8% (25) 12% (38) 13% (41) 18% (57) 31% (99) 14% (46) 325Somewhat Unfavorable of Trump 5% (9) 7% (12) 16% (28) 11% (21) 20% (36) 29% (52) 13% (23) 182Very Unfavorable of Trump 3% (26) 6% (54) 8% (78) 7% (71) 20% (194) 45% (428) 10% (98) 950#1 Issue: Economy 7% (48) 9% (62) 12% (80) 10% (70) 21% (146) 28% (192) 13% (88) 688#1 Issue: Security 12% (29) 14% (37) 11% (27) 8% (19) 17% (43) 26% (66) 12% (32) 254#1 Issue: Health Care 6% (19) 6% (19) 9% (29) 8% (26) 16% (53) 45% (149) 12% (40) 335#1 Issue: Medicare / Social Security 3% (7) 6% (18) 9% (26) 10% (29) 17% (48) 41% (116) 14% (39) 283#1 Issue: Women’s Issues 11% (9) 6% (5) 15% (13) 8% (7) 22% (19) 29% (25) 9% (8) 86#1 Issue: Education 7% (7) 11% (12) 17% (18) 11% (12) 10% (11) 27% (29) 17% (18) 107#1 Issue: Energy 2% (2) 8% (7) 14% (11) 6% (4) 24% (19) 39% (31) 6% (5) 79#1 Issue: Other 8% (12) 4% (7) 6% (10) 10% (15) 13% (21) 42% (66) 17% (26) 1572018 House Vote: Democrat 3% (22) 5% (38) 8% (58) 8% (63) 20% (156) 46% (354) 10% (76) 7672018 House Vote: Republican 13% (79) 12% (74) 11% (72) 12% (75) 17% (105) 25% (156) 11% (69) 6292018 House Vote: Someone else 7% (5) 10% (7) 13% (9) 10% (8) 14% (10) 32% (24) 14% (10) 732016 Vote: Hillary Clinton 3% (19) 6% (39) 8% (53) 6% (44) 21% (144) 46% (319) 12% (82) 7002016 Vote: Donald Trump 12% (81) 11% (74) 13% (86) 12% (80) 16% (109) 25% (170) 11% (75) 6752016 Vote: Other 5% (8) 5% (8) 10% (15) 12% (17) 21% (30) 40% (58) 7% (10) 1442016 Vote: Didn’t Vote 5% (25) 10% (45) 13% (61) 9% (42) 16% (76) 27% (128) 19% (89) 466Voted in 2014: Yes 7% (94) 8% (104) 9% (122) 9% (124) 19% (246) 36% (482) 11% (150) 1322Voted in 2014: No 6% (40) 9% (62) 14% (92) 9% (60) 17% (113) 29% (192) 16% (107) 666
Continued on next page
Page 189
National Tracking Poll #2006102, June, 2020
189
Table POL10
Table POL10: As you may know, in response to the coronavirus Americans have been encouraged to ’social distance’ with many states cancelingupcoming major events and closing schools,restaurants, and other public spaces. Based on what you know, when do you believe Americans will be ableto stop social distancing and return to public spaces?
DemographicIn the nexttwo weeks
In the nextmonth
In the nexttwo months
In the nextthreemonths
In the nextsix months
More thansix monthsfrom now
Don’t know /No opinion Total N
Registered Voters 7% (134) 8% (166) 11% (214) 9% (184) 18% (359) 34% (674) 13% (256) 19882012 Vote: Barack Obama 3% (23) 6% (47) 9% (75) 7% (62) 20% (169) 45% (388) 10% (89) 8532012 Vote: Mitt Romney 12% (62) 12% (58) 11% (54) 12% (62) 18% (88) 23% (116) 12% (60) 5012012 Vote: Other 14% (12) 4% (3) 14% (12) 12% (10) 6% (5) 30% (25) 20% (17) 842012 Vote: Didn’t Vote 7% (37) 10% (57) 13% (74) 9% (49) 18% (98) 26% (145) 16% (89) 5504-Region: Northeast 6% (23) 11% (38) 12% (43) 8% (27) 20% (69) 33% (116) 11% (40) 3554-Region: Midwest 8% (37) 7% (32) 12% (56) 9% (39) 14% (64) 36% (163) 14% (65) 4574-Region: South 6% (45) 8% (59) 10% (77) 10% (74) 20% (149) 31% (231) 14% (107) 7424-Region: West 7% (30) 9% (37) 9% (39) 10% (44) 18% (77) 38% (164) 10% (44) 434Party: Democrat/Leans Democrat 3% (29) 6% (56) 9% (87) 8% (73) 20% (183) 43% (388) 11% (96) 911Party: Republican/Leans Republican 12% (89) 12% (89) 13% (93) 11% (82) 16% (120) 24% (176) 12% (92) 741Parents 7% (59) 10% (85) 10% (89) 9% (77) 17% (150) 34% (294) 13% (109) 864Note: Row proportions may total to larger than one-hundred percent due to rounding. For more information visit MorningConsultIntelligence.com.
Page 190
190
Morning ConsultTable POL11_1
Table POL11_1: How comfortable would you be re-opening each of the following for the beginning of the 2020 school year?Daycare centers
DemographicVery
comfortableSomewhatcomfortable
Somewhatuncomfortable
Veryuncomfortable
Don’t Know /No Opinion Total N
Registered Voters 13% (265) 20% (402) 27% (534) 31% (610) 9% (177) 1988Gender: Male 15% (138) 20% (184) 27% (248) 30% (283) 8% (78) 930Gender: Female 12% (127) 21% (219) 27% (285) 31% (327) 9% (99) 1058Age: 18-34 11% (52) 17% (84) 29% (146) 34% (171) 9% (46) 499Age: 35-44 17% (52) 21% (63) 23% (69) 30% (90) 9% (27) 302Age: 45-64 14% (99) 19% (135) 25% (179) 33% (241) 10% (69) 724Age: 65+ 13% (61) 26% (120) 30% (139) 23% (109) 7% (34) 463GenZers: 1997-2012 10% (22) 15% (34) 30% (67) 33% (74) 12% (26) 224Millennials: 1981-1996 13% (54) 19% (80) 27% (112) 34% (144) 7% (30) 419GenXers: 1965-1980 15% (75) 20% (103) 24% (125) 30% (156) 10% (53) 511Baby Boomers: 1946-1964 14% (104) 21% (163) 28% (215) 29% (217) 8% (61) 760PID: Dem (no lean) 6% (45) 17% (132) 30% (225) 39% (298) 8% (58) 757PID: Ind (no lean) 11% (67) 21% (135) 28% (177) 29% (188) 11% (71) 638PID: Rep (no lean) 26% (153) 23% (135) 22% (131) 21% (125) 8% (48) 593PID/Gender: DemMen 6% (19) 18% (61) 30% (98) 39% (130) 7% (22) 329PID/Gender: DemWomen 6% (26) 17% (71) 30% (128) 39% (168) 8% (36) 429PID/Gender: Ind Men 11% (33) 22% (65) 27% (81) 28% (83) 11% (33) 296PID/Gender: Ind Women 10% (34) 20% (70) 28% (96) 31% (105) 11% (37) 342PID/Gender: Rep Men 28% (86) 19% (58) 23% (69) 23% (70) 7% (23) 306PID/Gender: Rep Women 23% (67) 27% (78) 21% (61) 19% (55) 9% (26) 287Ideo: Liberal (1-3) 7% (42) 16% (98) 34% (208) 36% (221) 7% (40) 609Ideo: Moderate (4) 6% (31) 20% (106) 27% (141) 35% (185) 11% (58) 522Ideo: Conservative (5-7) 27% (181) 25% (173) 21% (144) 21% (141) 6% (41) 679Educ: < College 14% (174) 19% (242) 24% (305) 32% (402) 10% (127) 1250Educ: Bachelors degree 11% (53) 21% (99) 30% (141) 30% (141) 7% (35) 470Educ: Post-grad 14% (38) 23% (60) 33% (87) 25% (66) 6% (15) 267Income: Under 50k 13% (125) 19% (189) 23% (233) 34% (341) 11% (110) 998Income: 50k-100k 13% (85) 21% (137) 31% (203) 29% (189) 7% (46) 660Income: 100k+ 17% (55) 23% (77) 30% (97) 24% (80) 6% (21) 329Ethnicity: White 15% (237) 22% (355) 27% (440) 27% (439) 9% (137) 1608Ethnicity: Hispanic 8% (15) 18% (34) 22% (42) 43% (84) 9% (17) 193
Continued on next page
Page 191
National Tracking Poll #2006102, June, 2020
191
Table POL11_1
Table POL11_1: How comfortable would you be re-opening each of the following for the beginning of the 2020 school year?Daycare centers
DemographicVery
comfortableSomewhatcomfortable
Somewhatuncomfortable
Veryuncomfortable
Don’t Know /No Opinion Total N
Registered Voters 13% (265) 20% (402) 27% (534) 31% (610) 9% (177) 1988Ethnicity: Afr. Am. 7% (18) 11% (28) 24% (60) 49% (122) 10% (25) 252Ethnicity: Other 8% (11) 16% (20) 26% (33) 38% (49) 12% (15) 128All Christian 16% (150) 23% (217) 29% (271) 25% (237) 7% (66) 941All Non-Christian 13% (13) 18% (18) 32% (31) 29% (28) 8% (7) 97Atheist 10% (13) 18% (23) 29% (37) 35% (44) 8% (10) 128Agnostic/Nothing in particular 10% (46) 16% (77) 27% (127) 36% (171) 12% (57) 478Something Else 13% (44) 20% (68) 20% (67) 37% (129) 10% (36) 344Religious Non-Protestant/Catholic 13% (16) 18% (22) 30% (36) 31% (37) 7% (9) 120Evangelical 18% (91) 23% (119) 26% (129) 26% (131) 7% (36) 505Non-Evangelical 13% (100) 22% (161) 27% (198) 30% (223) 9% (64) 746Community: Urban 12% (58) 20% (99) 25% (122) 33% (160) 10% (51) 490Community: Suburban 12% (118) 20% (193) 30% (296) 30% (298) 8% (77) 981Community: Rural 17% (90) 21% (111) 22% (116) 29% (153) 9% (49) 517Employ: Private Sector 12% (77) 24% (149) 28% (180) 29% (182) 7% (43) 631Employ: Government 14% (19) 16% (22) 31% (42) 34% (46) 5% (7) 136Employ: Self-Employed 10% (12) 14% (19) 30% (38) 33% (43) 13% (17) 130Employ: Homemaker 20% (23) 18% (20) 20% (23) 32% (36) 11% (13) 115Employ: Retired 16% (79) 23% (113) 26% (130) 27% (132) 8% (38) 492Employ: Unemployed 11% (26) 11% (25) 25% (58) 37% (86) 15% (35) 229Employ: Other 10% (15) 21% (32) 20% (30) 40% (61) 9% (14) 152Military HH: Yes 17% (51) 22% (67) 29% (88) 27% (82) 6% (19) 306Military HH: No 13% (215) 20% (335) 26% (445) 31% (528) 9% (159) 1682RD/WT: Right Direction 25% (142) 29% (162) 20% (115) 18% (103) 8% (46) 567RD/WT: Wrong Track 9% (123) 17% (240) 29% (418) 36% (507) 9% (131) 1421Trump Job Approve 25% (195) 27% (206) 22% (169) 19% (146) 7% (57) 774Trump Job Disapprove 6% (65) 16% (190) 30% (351) 39% (451) 8% (97) 1153Trump Job Strongly Approve 34% (143) 26% (107) 18% (75) 14% (57) 8% (33) 415Trump Job Somewhat Approve 14% (52) 28% (99) 26% (94) 25% (89) 7% (24) 359Trump Job Somewhat Disapprove 8% (17) 22% (50) 31% (69) 31% (71) 8% (19) 226Trump Job Strongly Disapprove 5% (47) 15% (140) 30% (281) 41% (380) 8% (78) 927
Continued on next page
Page 192
192
Morning ConsultTable POL11_1
Table POL11_1: How comfortable would you be re-opening each of the following for the beginning of the 2020 school year?Daycare centers
DemographicVery
comfortableSomewhatcomfortable
Somewhatuncomfortable
Veryuncomfortable
Don’t Know /No Opinion Total N
Registered Voters 13% (265) 20% (402) 27% (534) 31% (610) 9% (177) 1988Favorable of Trump 25% (199) 26% (203) 22% (169) 20% (156) 8% (60) 787Unfavorable of Trump 5% (61) 17% (190) 31% (353) 39% (437) 8% (91) 1132Very Favorable of Trump 33% (154) 26% (119) 18% (83) 15% (69) 8% (37) 462Somewhat Favorable of Trump 14% (44) 26% (84) 27% (86) 27% (88) 7% (23) 325Somewhat Unfavorable of Trump 8% (15) 27% (49) 31% (56) 26% (46) 8% (15) 182Very Unfavorable of Trump 5% (46) 15% (141) 31% (297) 41% (391) 8% (76) 950#1 Issue: Economy 17% (115) 20% (139) 26% (180) 29% (201) 8% (52) 688#1 Issue: Security 25% (62) 24% (62) 20% (51) 24% (61) 7% (17) 254#1 Issue: Health Care 7% (25) 20% (67) 30% (102) 34% (113) 8% (28) 335#1 Issue: Medicare / Social Security 10% (27) 19% (53) 26% (74) 35% (99) 11% (30) 283#1 Issue: Women’s Issues 4% (4) 18% (16) 39% (33) 34% (29) 5% (5) 86#1 Issue: Education 10% (11) 19% (20) 28% (30) 29% (31) 13% (14) 107#1 Issue: Energy 7% (6) 20% (16) 34% (27) 33% (26) 6% (5) 79#1 Issue: Other 10% (16) 19% (29) 23% (36) 32% (50) 17% (26) 1572018 House Vote: Democrat 5% (40) 16% (125) 32% (247) 38% (293) 8% (61) 7672018 House Vote: Republican 26% (162) 26% (164) 22% (138) 20% (126) 6% (40) 6292018 House Vote: Someone else 10% (8) 27% (19) 27% (20) 24% (18) 12% (9) 732016 Vote: Hillary Clinton 6% (40) 16% (115) 30% (210) 39% (272) 9% (63) 7002016 Vote: Donald Trump 25% (171) 26% (175) 23% (152) 19% (130) 7% (46) 6752016 Vote: Other 7% (10) 22% (31) 32% (47) 31% (45) 8% (12) 1442016 Vote: Didn’t Vote 9% (43) 17% (81) 27% (124) 35% (162) 12% (56) 466Voted in 2014: Yes 15% (199) 20% (263) 26% (348) 30% (403) 8% (109) 1322Voted in 2014: No 10% (66) 21% (139) 28% (185) 31% (207) 10% (68) 6662012 Vote: Barack Obama 7% (60) 17% (143) 31% (262) 38% (327) 7% (61) 8532012 Vote: Mitt Romney 26% (132) 27% (133) 21% (103) 19% (96) 7% (36) 5012012 Vote: Other 22% (18) 25% (21) 20% (17) 19% (16) 14% (12) 842012 Vote: Didn’t Vote 10% (55) 19% (105) 28% (151) 31% (170) 12% (68) 550
Continued on next page
Page 193
National Tracking Poll #2006102, June, 2020
193
Table POL11_1
Table POL11_1: How comfortable would you be re-opening each of the following for the beginning of the 2020 school year?Daycare centers
DemographicVery
comfortableSomewhatcomfortable
Somewhatuncomfortable
Veryuncomfortable
Don’t Know /No Opinion Total N
Registered Voters 13% (265) 20% (402) 27% (534) 31% (610) 9% (177) 19884-Region: Northeast 15% (52) 22% (79) 30% (106) 26% (91) 8% (27) 3554-Region: Midwest 15% (70) 23% (105) 24% (109) 29% (134) 8% (38) 4574-Region: South 13% (96) 19% (140) 26% (196) 33% (245) 9% (65) 7424-Region: West 11% (47) 18% (78) 28% (122) 32% (140) 11% (46) 434Party: Democrat/Leans Democrat 6% (54) 17% (151) 31% (280) 39% (358) 7% (68) 911Party: Republican/Leans Republican 25% (184) 24% (177) 22% (165) 22% (162) 7% (53) 741Parents 15% (132) 22% (188) 28% (239) 29% (248) 7% (57) 864Note: Row proportions may total to larger than one-hundred percent due to rounding. For more information visit MorningConsultIntelligence.com.
Page 194
194
Morning ConsultTable POL11_2
Table POL11_2: How comfortable would you be re-opening each of the following for the beginning of the 2020 school year?K-12 schools
DemographicVery
comfortableSomewhatcomfortable
Somewhatuncomfortable
Veryuncomfortable
Don’t Know /No Opinion Total N
Registered Voters 15% (304) 23% (463) 27% (530) 27% (534) 8% (157) 1988Gender: Male 17% (160) 22% (204) 28% (257) 25% (237) 8% (73) 930Gender: Female 14% (144) 24% (259) 26% (273) 28% (297) 8% (84) 1058Age: 18-34 13% (63) 21% (103) 30% (151) 28% (139) 9% (43) 499Age: 35-44 19% (56) 19% (57) 25% (76) 28% (85) 9% (28) 302Age: 45-64 16% (119) 21% (152) 24% (177) 30% (219) 8% (57) 724Age: 65+ 14% (65) 33% (151) 27% (126) 20% (91) 6% (29) 463GenZers: 1997-2012 13% (29) 23% (52) 29% (65) 24% (55) 11% (24) 224Millennials: 1981-1996 15% (62) 18% (76) 31% (130) 29% (123) 7% (29) 419GenXers: 1965-1980 16% (83) 23% (116) 21% (109) 30% (155) 10% (49) 511Baby Boomers: 1946-1964 16% (119) 26% (194) 28% (213) 24% (182) 7% (51) 760PID: Dem (no lean) 7% (51) 20% (149) 32% (243) 35% (265) 6% (49) 757PID: Ind (no lean) 14% (87) 24% (152) 27% (175) 25% (162) 10% (62) 638PID: Rep (no lean) 28% (166) 27% (162) 19% (112) 18% (107) 8% (46) 593PID/Gender: DemMen 7% (22) 21% (69) 33% (107) 34% (111) 6% (19) 329PID/Gender: DemWomen 7% (29) 19% (80) 32% (136) 36% (154) 7% (29) 429PID/Gender: Ind Men 16% (48) 23% (67) 30% (90) 21% (62) 10% (30) 296PID/Gender: Ind Women 12% (40) 25% (85) 25% (85) 29% (100) 9% (32) 342PID/Gender: Rep Men 29% (90) 22% (68) 20% (60) 21% (64) 8% (24) 306PID/Gender: Rep Women 26% (76) 33% (94) 18% (52) 15% (43) 8% (23) 287Ideo: Liberal (1-3) 7% (42) 19% (113) 37% (224) 33% (204) 4% (26) 609Ideo: Moderate (4) 8% (44) 22% (114) 27% (140) 33% (170) 10% (55) 522Ideo: Conservative (5-7) 30% (202) 29% (194) 19% (132) 16% (110) 6% (41) 679Educ: < College 15% (191) 23% (293) 24% (297) 28% (349) 10% (119) 1250Educ: Bachelors degree 14% (65) 22% (105) 32% (149) 26% (122) 6% (29) 470Educ: Post-grad 18% (47) 24% (64) 31% (84) 23% (62) 4% (9) 267Income: Under 50k 14% (142) 22% (218) 24% (239) 30% (299) 10% (100) 998Income: 50k-100k 15% (100) 23% (154) 30% (197) 25% (164) 7% (44) 660Income: 100k+ 19% (61) 28% (91) 29% (94) 21% (70) 4% (13) 329Ethnicity: White 17% (267) 25% (410) 26% (425) 24% (389) 7% (117) 1608Ethnicity: Hispanic 13% (25) 16% (32) 26% (51) 37% (71) 8% (15) 193
Continued on next page
Page 195
National Tracking Poll #2006102, June, 2020
195
Table POL11_2
Table POL11_2: How comfortable would you be re-opening each of the following for the beginning of the 2020 school year?K-12 schools
DemographicVery
comfortableSomewhatcomfortable
Somewhatuncomfortable
Veryuncomfortable
Don’t Know /No Opinion Total N
Registered Voters 15% (304) 23% (463) 27% (530) 27% (534) 8% (157) 1988Ethnicity: Afr. Am. 11% (27) 12% (30) 27% (68) 40% (101) 11% (27) 252Ethnicity: Other 8% (10) 18% (23) 29% (37) 34% (43) 11% (14) 128All Christian 19% (175) 26% (247) 28% (261) 22% (203) 6% (55) 941All Non-Christian 12% (12) 23% (22) 35% (34) 23% (23) 8% (7) 97Atheist 11% (15) 19% (25) 26% (34) 38% (48) 5% (7) 128Agnostic/Nothing in particular 11% (51) 22% (104) 25% (119) 32% (151) 11% (53) 478Something Else 15% (52) 19% (65) 24% (83) 32% (109) 10% (35) 344Religious Non-Protestant/Catholic 15% (19) 20% (25) 30% (36) 28% (33) 6% (7) 120Evangelical 21% (104) 26% (133) 23% (117) 23% (118) 6% (33) 505Non-Evangelical 15% (115) 23% (174) 29% (218) 24% (182) 8% (56) 746Community: Urban 14% (69) 20% (98) 25% (125) 30% (148) 10% (50) 490Community: Suburban 14% (137) 25% (242) 28% (274) 26% (258) 7% (70) 981Community: Rural 19% (98) 24% (123) 25% (131) 25% (128) 7% (37) 517Employ: Private Sector 15% (97) 24% (150) 28% (175) 28% (174) 6% (35) 631Employ: Government 13% (17) 23% (31) 29% (39) 32% (43) 4% (5) 136Employ: Self-Employed 13% (17) 18% (24) 26% (34) 32% (41) 11% (14) 130Employ: Homemaker 19% (22) 21% (24) 19% (22) 31% (36) 10% (12) 115Employ: Retired 18% (90) 27% (134) 25% (123) 22% (109) 7% (35) 492Employ: Unemployed 12% (27) 13% (31) 32% (72) 28% (64) 15% (35) 229Employ: Other 13% (20) 24% (36) 25% (38) 30% (45) 8% (12) 152Military HH: Yes 17% (52) 31% (93) 25% (78) 22% (67) 5% (15) 306Military HH: No 15% (252) 22% (370) 27% (452) 28% (466) 8% (142) 1682RD/WT: Right Direction 29% (164) 31% (175) 18% (100) 15% (85) 8% (43) 567RD/WT: Wrong Track 10% (140) 20% (288) 30% (430) 32% (448) 8% (114) 1421Trump Job Approve 28% (215) 31% (237) 20% (152) 16% (123) 6% (48) 774Trump Job Disapprove 7% (82) 19% (216) 32% (366) 35% (401) 8% (88) 1153Trump Job Strongly Approve 36% (150) 30% (125) 15% (62) 12% (49) 7% (28) 415Trump Job Somewhat Approve 18% (64) 31% (111) 25% (90) 21% (74) 5% (19) 359Trump Job Somewhat Disapprove 11% (25) 23% (51) 28% (64) 29% (66) 9% (20) 226Trump Job Strongly Disapprove 6% (58) 18% (165) 33% (301) 36% (335) 7% (68) 927
Continued on next page
Page 196
196
Morning ConsultTable POL11_2
Table POL11_2: How comfortable would you be re-opening each of the following for the beginning of the 2020 school year?K-12 schools
DemographicVery
comfortableSomewhatcomfortable
Somewhatuncomfortable
Veryuncomfortable
Don’t Know /No Opinion Total N
Registered Voters 15% (304) 23% (463) 27% (530) 27% (534) 8% (157) 1988Favorable of Trump 29% (225) 29% (229) 19% (151) 16% (126) 7% (56) 787Unfavorable of Trump 7% (75) 20% (221) 32% (367) 35% (392) 7% (76) 1132Very Favorable of Trump 37% (171) 30% (139) 14% (66) 11% (52) 8% (35) 462Somewhat Favorable of Trump 17% (54) 28% (91) 26% (85) 23% (74) 6% (21) 325Somewhat Unfavorable of Trump 12% (22) 26% (47) 28% (50) 26% (48) 8% (14) 182Very Unfavorable of Trump 6% (53) 18% (174) 33% (317) 36% (344) 7% (62) 950#1 Issue: Economy 18% (127) 24% (166) 26% (181) 25% (169) 6% (44) 688#1 Issue: Security 26% (65) 28% (70) 19% (48) 21% (53) 6% (16) 254#1 Issue: Health Care 9% (29) 23% (77) 30% (102) 30% (101) 8% (26) 335#1 Issue: Medicare / Social Security 12% (34) 20% (56) 27% (76) 31% (87) 11% (30) 283#1 Issue: Women’s Issues 4% (4) 24% (21) 36% (31) 29% (25) 6% (5) 86#1 Issue: Education 14% (14) 25% (27) 27% (29) 24% (26) 10% (11) 107#1 Issue: Energy 11% (9) 15% (12) 33% (26) 36% (28) 4% (3) 79#1 Issue: Other 14% (22) 21% (34) 23% (36) 28% (43) 14% (21) 1572018 House Vote: Democrat 7% (50) 19% (143) 35% (271) 34% (258) 6% (46) 7672018 House Vote: Republican 28% (175) 30% (190) 19% (118) 17% (108) 6% (38) 6292018 House Vote: Someone else 11% (8) 33% (24) 22% (16) 24% (17) 10% (7) 732016 Vote: Hillary Clinton 7% (47) 18% (126) 33% (233) 34% (238) 8% (56) 7002016 Vote: Donald Trump 28% (189) 30% (200) 19% (129) 17% (116) 6% (41) 6752016 Vote: Other 10% (15) 24% (35) 33% (48) 28% (40) 4% (6) 1442016 Vote: Didn’t Vote 11% (53) 22% (101) 26% (120) 30% (139) 11% (53) 466Voted in 2014: Yes 17% (224) 23% (310) 26% (345) 27% (350) 7% (92) 1322Voted in 2014: No 12% (81) 23% (153) 28% (184) 27% (183) 10% (65) 6662012 Vote: Barack Obama 8% (68) 20% (169) 31% (267) 35% (295) 6% (53) 8532012 Vote: Mitt Romney 29% (145) 30% (151) 19% (95) 15% (77) 7% (34) 5012012 Vote: Other 27% (23) 26% (22) 22% (19) 14% (12) 10% (8) 842012 Vote: Didn’t Vote 13% (69) 22% (121) 27% (149) 27% (148) 11% (62) 550
Continued on next page
Page 197
National Tracking Poll #2006102, June, 2020
197
Table POL11_2
Table POL11_2: How comfortable would you be re-opening each of the following for the beginning of the 2020 school year?K-12 schools
DemographicVery
comfortableSomewhatcomfortable
Somewhatuncomfortable
Veryuncomfortable
Don’t Know /No Opinion Total N
Registered Voters 15% (304) 23% (463) 27% (530) 27% (534) 8% (157) 19884-Region: Northeast 17% (59) 24% (86) 29% (101) 22% (80) 8% (28) 3554-Region: Midwest 18% (82) 27% (123) 22% (103) 26% (117) 7% (33) 4574-Region: South 14% (102) 22% (164) 27% (197) 29% (219) 8% (60) 7424-Region: West 14% (61) 21% (90) 30% (129) 27% (119) 8% (36) 434Party: Democrat/Leans Democrat 7% (61) 19% (176) 33% (296) 35% (322) 6% (55) 911Party: Republican/Leans Republican 27% (202) 28% (207) 20% (145) 18% (134) 7% (52) 741Parents 17% (148) 25% (214) 26% (227) 26% (222) 6% (52) 864Note: Row proportions may total to larger than one-hundred percent due to rounding. For more information visit MorningConsultIntelligence.com.
Page 198
198
Morning ConsultTable POL11_3
Table POL11_3: How comfortable would you be re-opening each of the following for the beginning of the 2020 school year?Colleges and universities
DemographicVery
comfortableSomewhatcomfortable
Somewhatuncomfortable
Veryuncomfortable
Don’t Know /No Opinion Total N
Registered Voters 16% (321) 27% (544) 26% (518) 22% (443) 8% (162) 1988Gender: Male 17% (161) 27% (248) 27% (251) 21% (200) 8% (71) 930Gender: Female 15% (160) 28% (296) 25% (267) 23% (244) 9% (91) 1058Age: 18-34 15% (77) 26% (130) 26% (131) 24% (122) 8% (38) 499Age: 35-44 19% (57) 22% (68) 25% (77) 25% (76) 8% (25) 302Age: 45-64 17% (123) 24% (176) 26% (188) 24% (171) 9% (67) 724Age: 65+ 14% (64) 37% (170) 26% (122) 16% (74) 7% (32) 463GenZers: 1997-2012 18% (39) 29% (66) 22% (49) 21% (48) 10% (22) 224Millennials: 1981-1996 15% (65) 23% (96) 30% (124) 26% (108) 6% (26) 419GenXers: 1965-1980 17% (87) 25% (130) 22% (115) 25% (127) 10% (52) 511Baby Boomers: 1946-1964 16% (121) 29% (221) 28% (214) 20% (148) 7% (56) 760PID: Dem (no lean) 7% (54) 24% (180) 32% (239) 31% (234) 7% (51) 757PID: Ind (no lean) 15% (93) 29% (185) 26% (165) 20% (130) 10% (64) 638PID: Rep (no lean) 29% (174) 30% (180) 19% (114) 13% (79) 8% (47) 593PID/Gender: DemMen 6% (20) 25% (83) 32% (104) 32% (104) 5% (17) 329PID/Gender: DemWomen 8% (34) 22% (96) 31% (135) 30% (130) 8% (34) 429PID/Gender: Ind Men 17% (50) 27% (81) 27% (81) 17% (51) 11% (34) 296PID/Gender: Ind Women 13% (43) 30% (104) 25% (85) 23% (80) 9% (30) 342PID/Gender: Rep Men 30% (90) 27% (84) 21% (66) 15% (45) 7% (21) 306PID/Gender: Rep Women 29% (83) 33% (96) 17% (48) 12% (34) 9% (26) 287Ideo: Liberal (1-3) 8% (49) 23% (141) 36% (216) 28% (171) 5% (31) 609Ideo: Moderate (4) 9% (49) 26% (138) 26% (135) 27% (141) 11% (58) 522Ideo: Conservative (5-7) 31% (208) 31% (213) 20% (136) 12% (84) 6% (38) 679Educ: < College 16% (203) 27% (339) 24% (295) 23% (293) 10% (121) 1250Educ: Bachelors degree 16% (74) 26% (123) 31% (144) 21% (100) 6% (30) 470Educ: Post-grad 16% (44) 31% (83) 30% (80) 19% (50) 4% (12) 267Income: Under 50k 14% (145) 25% (251) 24% (236) 26% (260) 11% (107) 998Income: 50k-100k 18% (116) 27% (180) 30% (195) 19% (126) 7% (43) 660Income: 100k+ 18% (60) 34% (113) 26% (87) 18% (58) 4% (12) 329Ethnicity: White 18% (289) 28% (456) 26% (421) 20% (315) 8% (126) 1608Ethnicity: Hispanic 11% (21) 20% (39) 28% (54) 33% (63) 8% (15) 193
Continued on next page
Page 199
National Tracking Poll #2006102, June, 2020
199
Table POL11_3
Table POL11_3: How comfortable would you be re-opening each of the following for the beginning of the 2020 school year?Colleges and universities
DemographicVery
comfortableSomewhatcomfortable
Somewhatuncomfortable
Veryuncomfortable
Don’t Know /No Opinion Total N
Registered Voters 16% (321) 27% (544) 26% (518) 22% (443) 8% (162) 1988Ethnicity: Afr. Am. 8% (21) 23% (57) 24% (61) 35% (87) 10% (25) 252Ethnicity: Other 8% (11) 24% (30) 27% (35) 32% (41) 8% (11) 128All Christian 19% (177) 31% (291) 26% (247) 17% (164) 6% (61) 941All Non-Christian 9% (9) 33% (32) 33% (32) 17% (17) 8% (8) 97Atheist 10% (13) 22% (28) 33% (42) 29% (37) 6% (8) 128Agnostic/Nothing in particular 13% (64) 22% (106) 26% (125) 28% (133) 10% (50) 478Something Else 17% (57) 25% (86) 21% (72) 27% (92) 10% (36) 344Religious Non-Protestant/Catholic 12% (14) 32% (39) 29% (35) 19% (23) 7% (9) 120Evangelical 20% (101) 33% (166) 21% (105) 19% (96) 7% (37) 505Non-Evangelical 17% (128) 27% (203) 28% (208) 20% (151) 8% (57) 746Community: Urban 13% (64) 26% (129) 27% (132) 25% (124) 8% (42) 490Community: Suburban 16% (152) 28% (273) 28% (272) 21% (208) 8% (76) 981Community: Rural 20% (105) 28% (142) 22% (114) 21% (111) 9% (45) 517Employ: Private Sector 15% (94) 29% (185) 26% (166) 23% (147) 6% (39) 631Employ: Government 18% (24) 21% (28) 31% (42) 26% (36) 4% (5) 136Employ: Self-Employed 11% (15) 21% (27) 30% (39) 25% (32) 13% (17) 130Employ: Homemaker 22% (25) 25% (29) 19% (21) 24% (28) 11% (12) 115Employ: Retired 18% (86) 31% (155) 25% (123) 19% (94) 7% (34) 492Employ: Unemployed 13% (29) 20% (46) 31% (70) 22% (50) 15% (34) 229Employ: Other 15% (23) 25% (38) 24% (36) 27% (41) 9% (14) 152Military HH: Yes 19% (57) 34% (105) 27% (81) 15% (47) 5% (15) 306Military HH: No 16% (263) 26% (439) 26% (437) 24% (396) 9% (147) 1682RD/WT: Right Direction 31% (176) 34% (191) 16% (91) 12% (66) 8% (44) 567RD/WT: Wrong Track 10% (145) 25% (353) 30% (427) 27% (378) 8% (118) 1421Trump Job Approve 29% (226) 34% (259) 19% (143) 12% (93) 7% (51) 774Trump Job Disapprove 8% (88) 24% (272) 31% (362) 30% (342) 8% (89) 1153Trump Job Strongly Approve 37% (155) 32% (134) 15% (61) 7% (30) 8% (35) 415Trump Job Somewhat Approve 20% (71) 35% (125) 23% (82) 18% (64) 5% (16) 359Trump Job Somewhat Disapprove 12% (26) 30% (68) 27% (61) 23% (51) 9% (20) 226Trump Job Strongly Disapprove 7% (61) 22% (204) 32% (301) 31% (291) 8% (70) 927
Continued on next page
Page 200
200
Morning ConsultTable POL11_3
Table POL11_3: How comfortable would you be re-opening each of the following for the beginning of the 2020 school year?Colleges and universities
DemographicVery
comfortableSomewhatcomfortable
Somewhatuncomfortable
Veryuncomfortable
Don’t Know /No Opinion Total N
Registered Voters 16% (321) 27% (544) 26% (518) 22% (443) 8% (162) 1988Favorable of Trump 29% (228) 32% (255) 19% (149) 13% (101) 7% (54) 787Unfavorable of Trump 8% (86) 24% (274) 32% (360) 29% (330) 7% (83) 1132Very Favorable of Trump 38% (175) 33% (154) 13% (61) 9% (40) 7% (33) 462Somewhat Favorable of Trump 16% (53) 31% (101) 27% (88) 19% (62) 7% (21) 325Somewhat Unfavorable of Trump 11% (21) 34% (62) 26% (47) 20% (37) 9% (16) 182Very Unfavorable of Trump 7% (65) 22% (212) 33% (313) 31% (293) 7% (67) 950#1 Issue: Economy 21% (141) 26% (180) 26% (179) 21% (146) 6% (42) 688#1 Issue: Security 26% (67) 33% (84) 17% (44) 18% (45) 6% (15) 254#1 Issue: Health Care 8% (26) 28% (92) 30% (100) 27% (90) 8% (27) 335#1 Issue: Medicare / Social Security 13% (36) 24% (69) 27% (77) 24% (69) 11% (32) 283#1 Issue: Women’s Issues 13% (11) 30% (26) 29% (25) 22% (19) 5% (5) 86#1 Issue: Education 14% (15) 28% (30) 29% (31) 16% (17) 13% (14) 107#1 Issue: Energy 10% (8) 24% (19) 34% (27) 29% (23) 3% (3) 79#1 Issue: Other 11% (17) 28% (45) 22% (35) 23% (36) 15% (24) 1572018 House Vote: Democrat 7% (56) 24% (184) 33% (256) 29% (221) 6% (49) 7672018 House Vote: Republican 28% (178) 34% (212) 19% (121) 13% (82) 6% (35) 6292018 House Vote: Someone else 10% (8) 32% (23) 26% (19) 18% (13) 14% (10) 732016 Vote: Hillary Clinton 7% (50) 22% (157) 33% (231) 29% (204) 8% (58) 7002016 Vote: Donald Trump 29% (194) 34% (227) 18% (125) 13% (89) 6% (41) 6752016 Vote: Other 10% (15) 28% (40) 37% (53) 19% (28) 6% (8) 1442016 Vote: Didn’t Vote 13% (60) 26% (120) 23% (109) 26% (122) 12% (55) 466Voted in 2014: Yes 17% (222) 28% (368) 26% (349) 22% (287) 7% (95) 1322Voted in 2014: No 15% (99) 26% (176) 25% (169) 23% (157) 10% (66) 6662012 Vote: Barack Obama 8% (70) 23% (197) 32% (276) 29% (251) 7% (59) 8532012 Vote: Mitt Romney 29% (146) 34% (171) 19% (95) 12% (59) 6% (31) 5012012 Vote: Other 26% (22) 29% (25) 22% (19) 10% (8) 12% (10) 842012 Vote: Didn’t Vote 15% (83) 28% (151) 23% (129) 23% (125) 11% (62) 550
Continued on next page
Page 201
National Tracking Poll #2006102, June, 2020
201
Table POL11_3
Table POL11_3: How comfortable would you be re-opening each of the following for the beginning of the 2020 school year?Colleges and universities
DemographicVery
comfortableSomewhatcomfortable
Somewhatuncomfortable
Veryuncomfortable
Don’t Know /No Opinion Total N
Registered Voters 16% (321) 27% (544) 26% (518) 22% (443) 8% (162) 19884-Region: Northeast 17% (59) 30% (106) 27% (96) 18% (63) 9% (31) 3554-Region: Midwest 16% (74) 32% (144) 22% (101) 22% (101) 8% (37) 4574-Region: South 16% (121) 25% (185) 27% (203) 24% (176) 8% (57) 7424-Region: West 16% (68) 25% (108) 27% (118) 24% (103) 9% (37) 434Party: Democrat/Leans Democrat 8% (69) 24% (215) 32% (294) 30% (276) 6% (57) 911Party: Republican/Leans Republican 28% (211) 32% (237) 19% (142) 13% (99) 7% (52) 741Parents 16% (141) 30% (261) 26% (224) 21% (180) 7% (58) 864Note: Row proportions may total to larger than one-hundred percent due to rounding. For more information visit MorningConsultIntelligence.com.
Page 202
202
Morning ConsultTable POL12_1
Table POL12_1: Generally speaking, do you wear a face mask in each of the following settings?Outside by yourself
DemographicYes, I wear it all the
time Yes, I wear it sometimesNo, I do not wear a face
mask Total N
Registered Voters 19% (377) 14% (284) 67% (1327) 1988Gender: Male 21% (196) 16% (149) 63% (585) 930Gender: Female 17% (181) 13% (135) 70% (742) 1058Age: 18-34 25% (124) 17% (82) 59% (293) 499Age: 35-44 24% (74) 11% (33) 65% (195) 302Age: 45-64 16% (117) 14% (102) 70% (505) 724Age: 65+ 14% (62) 14% (66) 72% (334) 463GenZers: 1997-2012 27% (61) 15% (34) 58% (129) 224Millennials: 1981-1996 24% (100) 15% (63) 61% (256) 419GenXers: 1965-1980 18% (92) 13% (69) 68% (350) 511Baby Boomers: 1946-1964 15% (112) 13% (101) 72% (547) 760PID: Dem (no lean) 25% (191) 17% (131) 57% (435) 757PID: Ind (no lean) 17% (111) 13% (86) 69% (441) 638PID: Rep (no lean) 13% (75) 11% (67) 76% (451) 593PID/Gender: DemMen 28% (91) 19% (62) 53% (175) 329PID/Gender: DemWomen 23% (100) 16% (69) 61% (260) 429PID/Gender: Ind Men 19% (58) 16% (47) 65% (191) 296PID/Gender: Ind Women 15% (53) 11% (39) 73% (250) 342PID/Gender: Rep Men 15% (47) 13% (40) 71% (218) 306PID/Gender: Rep Women 10% (28) 9% (27) 81% (232) 287Ideo: Liberal (1-3) 26% (160) 18% (107) 56% (342) 609Ideo: Moderate (4) 22% (113) 15% (78) 63% (331) 522Ideo: Conservative (5-7) 11% (75) 11% (76) 78% (528) 679Educ: < College 18% (221) 14% (179) 68% (850) 1250Educ: Bachelors degree 18% (85) 15% (70) 67% (315) 470Educ: Post-grad 26% (70) 13% (35) 61% (162) 267Income: Under 50k 20% (196) 15% (148) 66% (654) 998Income: 50k-100k 18% (118) 14% (90) 68% (452) 660Income: 100k+ 19% (63) 14% (45) 67% (221) 329Ethnicity: White 16% (249) 13% (211) 71% (1148) 1608Ethnicity: Hispanic 31% (61) 16% (30) 53% (102) 193
Continued on next page
Page 203
National Tracking Poll #2006102, June, 2020
203
Table POL12_1
Table POL12_1: Generally speaking, do you wear a face mask in each of the following settings?Outside by yourself
DemographicYes, I wear it all the
time Yes, I wear it sometimesNo, I do not wear a face
mask Total N
Registered Voters 19% (377) 14% (284) 67% (1327) 1988Ethnicity: Afr. Am. 31% (78) 17% (42) 53% (133) 252Ethnicity: Other 39% (50) 24% (31) 36% (47) 128All Christian 16% (151) 14% (135) 70% (656) 941All Non-Christian 40% (39) 17% (16) 44% (43) 97Atheist 22% (28) 17% (21) 62% (79) 128Agnostic/Nothing in particular 20% (94) 16% (75) 65% (309) 478Something Else 19% (66) 11% (37) 70% (241) 344Religious Non-Protestant/Catholic 35% (42) 15% (17) 51% (61) 120Evangelical 18% (89) 12% (59) 71% (357) 505Non-Evangelical 16% (122) 15% (109) 69% (514) 746Community: Urban 31% (150) 18% (90) 51% (250) 490Community: Suburban 18% (175) 15% (145) 67% (660) 981Community: Rural 10% (52) 9% (49) 81% (417) 517Employ: Private Sector 21% (132) 15% (97) 64% (402) 631Employ: Government 24% (33) 15% (21) 61% (82) 136Employ: Self-Employed 24% (31) 13% (17) 63% (82) 130Employ: Homemaker 13% (15) 4% (4) 84% (96) 115Employ: Retired 13% (64) 14% (68) 73% (359) 492Employ: Unemployed 22% (50) 15% (35) 63% (144) 229Employ: Other 14% (21) 18% (28) 68% (103) 152Military HH: Yes 13% (41) 15% (45) 72% (220) 306Military HH: No 20% (336) 14% (239) 66% (1107) 1682RD/WT: Right Direction 18% (104) 11% (64) 70% (399) 567RD/WT: Wrong Track 19% (273) 15% (220) 65% (928) 1421Trump Job Approve 15% (113) 10% (78) 75% (583) 774Trump Job Disapprove 22% (249) 17% (197) 61% (707) 1153Trump Job Strongly Approve 13% (55) 9% (37) 78% (323) 415Trump Job Somewhat Approve 16% (58) 11% (41) 72% (260) 359Trump Job Somewhat Disapprove 18% (40) 17% (38) 66% (148) 226Trump Job Strongly Disapprove 22% (208) 17% (160) 60% (559) 927
Continued on next page
Page 204
204
Morning ConsultTable POL12_1
Table POL12_1: Generally speaking, do you wear a face mask in each of the following settings?Outside by yourself
DemographicYes, I wear it all the
time Yes, I wear it sometimesNo, I do not wear a face
mask Total N
Registered Voters 19% (377) 14% (284) 67% (1327) 1988Favorable of Trump 15% (117) 10% (80) 75% (590) 787Unfavorable of Trump 22% (244) 17% (195) 61% (693) 1132Very Favorable of Trump 14% (65) 8% (39) 77% (358) 462Somewhat Favorable of Trump 16% (52) 13% (41) 72% (232) 325Somewhat Unfavorable of Trump 16% (29) 17% (31) 67% (122) 182Very Unfavorable of Trump 23% (215) 17% (164) 60% (572) 950#1 Issue: Economy 18% (127) 14% (96) 68% (465) 688#1 Issue: Security 16% (40) 7% (19) 77% (195) 254#1 Issue: Health Care 20% (66) 17% (57) 64% (213) 335#1 Issue: Medicare / Social Security 21% (59) 15% (42) 65% (183) 283#1 Issue: Women’s Issues 31% (27) 16% (14) 53% (46) 86#1 Issue: Education 19% (21) 15% (16) 66% (70) 107#1 Issue: Energy 19% (15) 15% (12) 67% (53) 79#1 Issue: Other 15% (24) 19% (30) 65% (102) 1572018 House Vote: Democrat 23% (175) 16% (125) 61% (468) 7672018 House Vote: Republican 13% (82) 10% (64) 77% (483) 6292018 House Vote: Someone else 20% (15) 17% (12) 63% (46) 732016 Vote: Hillary Clinton 23% (160) 18% (126) 59% (414) 7002016 Vote: Donald Trump 14% (91) 9% (64) 77% (520) 6752016 Vote: Other 16% (23) 15% (22) 69% (100) 1442016 Vote: Didn’t Vote 22% (103) 16% (72) 62% (291) 466Voted in 2014: Yes 17% (231) 14% (184) 69% (907) 1322Voted in 2014: No 22% (146) 15% (100) 63% (420) 6662012 Vote: Barack Obama 21% (181) 16% (136) 63% (536) 8532012 Vote: Mitt Romney 10% (52) 11% (55) 79% (393) 5012012 Vote: Other 17% (14) 8% (7) 75% (63) 842012 Vote: Didn’t Vote 23% (128) 16% (86) 61% (335) 550
Continued on next page
Page 205
National Tracking Poll #2006102, June, 2020
205
Table POL12_1
Table POL12_1: Generally speaking, do you wear a face mask in each of the following settings?Outside by yourself
DemographicYes, I wear it all the
time Yes, I wear it sometimesNo, I do not wear a face
mask Total N
Registered Voters 19% (377) 14% (284) 67% (1327) 19884-Region: Northeast 24% (86) 17% (59) 59% (209) 3554-Region: Midwest 12% (55) 10% (47) 78% (355) 4574-Region: South 17% (127) 13% (94) 70% (521) 7424-Region: West 25% (108) 19% (84) 56% (242) 434Party: Democrat/Leans Democrat 24% (222) 17% (154) 59% (535) 911Party: Republican/Leans Republican 12% (91) 10% (74) 78% (576) 741Parents 18% (152) 13% (114) 69% (598) 864Note: Row proportions may total to larger than one-hundred percent due to rounding. For more information visit MorningConsultIntelligence.com.
Page 206
206
Morning ConsultTable POL12_2
Table POL12_2: Generally speaking, do you wear a face mask in each of the following settings?Outside near people you don’t know
DemographicYes, I wear it all the
time Yes, I wear it sometimesNo, I do not wear a face
mask Total N
Registered Voters 55% (1088) 22% (445) 23% (455) 1988Gender: Male 51% (471) 24% (225) 25% (235) 930Gender: Female 58% (617) 21% (221) 21% (220) 1058Age: 18-34 55% (273) 25% (127) 20% (99) 499Age: 35-44 53% (160) 19% (59) 28% (84) 302Age: 45-64 57% (410) 20% (146) 23% (168) 724Age: 65+ 53% (245) 25% (114) 22% (103) 463GenZers: 1997-2012 57% (127) 24% (54) 19% (43) 224Millennials: 1981-1996 52% (218) 24% (103) 24% (99) 419GenXers: 1965-1980 56% (286) 19% (99) 25% (127) 511Baby Boomers: 1946-1964 55% (415) 22% (168) 23% (177) 760PID: Dem (no lean) 69% (520) 19% (141) 13% (96) 757PID: Ind (no lean) 50% (321) 25% (156) 25% (160) 638PID: Rep (no lean) 42% (247) 25% (147) 33% (198) 593PID/Gender: DemMen 62% (205) 22% (72) 16% (52) 329PID/Gender: DemWomen 73% (315) 16% (70) 10% (44) 429PID/Gender: Ind Men 47% (138) 25% (73) 28% (84) 296PID/Gender: Ind Women 54% (183) 24% (83) 22% (76) 342PID/Gender: Rep Men 42% (128) 26% (79) 32% (99) 306PID/Gender: Rep Women 42% (119) 24% (68) 35% (100) 287Ideo: Liberal (1-3) 69% (419) 20% (122) 11% (68) 609Ideo: Moderate (4) 60% (311) 19% (97) 22% (114) 522Ideo: Conservative (5-7) 39% (263) 27% (185) 34% (231) 679Educ: < College 52% (655) 22% (270) 26% (326) 1250Educ: Bachelors degree 57% (267) 24% (112) 19% (91) 470Educ: Post-grad 62% (166) 24% (64) 14% (38) 267Income: Under 50k 55% (552) 22% (224) 22% (222) 998Income: 50k-100k 53% (350) 21% (141) 26% (170) 660Income: 100k+ 57% (186) 24% (80) 19% (63) 329Ethnicity: White 51% (814) 23% (376) 26% (418) 1608Ethnicity: Hispanic 69% (133) 16% (31) 15% (28) 193
Continued on next page
Page 207
National Tracking Poll #2006102, June, 2020
207
Table POL12_2
Table POL12_2: Generally speaking, do you wear a face mask in each of the following settings?Outside near people you don’t know
DemographicYes, I wear it all the
time Yes, I wear it sometimesNo, I do not wear a face
mask Total N
Registered Voters 55% (1088) 22% (445) 23% (455) 1988Ethnicity: Afr. Am. 72% (181) 17% (44) 11% (27) 252Ethnicity: Other 73% (93) 20% (26) 7% (9) 128All Christian 53% (495) 24% (223) 24% (223) 941All Non-Christian 69% (67) 21% (20) 10% (10) 97Atheist 58% (75) 21% (27) 21% (26) 128Agnostic/Nothing in particular 55% (262) 23% (110) 22% (106) 478Something Else 55% (189) 19% (65) 26% (89) 344Religious Non-Protestant/Catholic 62% (75) 26% (31) 12% (14) 120Evangelical 48% (243) 26% (130) 26% (132) 505Non-Evangelical 57% (428) 19% (141) 24% (176) 746Community: Urban 66% (324) 20% (98) 14% (68) 490Community: Suburban 54% (530) 23% (230) 23% (221) 981Community: Rural 45% (234) 23% (118) 32% (166) 517Employ: Private Sector 56% (353) 22% (139) 22% (138) 631Employ: Government 51% (70) 28% (38) 20% (28) 136Employ: Self-Employed 55% (71) 18% (23) 27% (35) 130Employ: Homemaker 53% (60) 17% (20) 30% (35) 115Employ: Retired 54% (264) 23% (112) 24% (116) 492Employ: Unemployed 59% (136) 18% (40) 23% (52) 229Employ: Other 51% (77) 29% (44) 21% (31) 152Military HH: Yes 51% (156) 25% (77) 24% (73) 306Military HH: No 55% (932) 22% (368) 23% (382) 1682RD/WT: Right Direction 43% (245) 26% (150) 30% (172) 567RD/WT: Wrong Track 59% (843) 21% (295) 20% (282) 1421Trump Job Approve 40% (308) 26% (201) 34% (264) 774Trump Job Disapprove 65% (748) 20% (235) 15% (170) 1153Trump Job Strongly Approve 38% (157) 22% (92) 40% (166) 415Trump Job Somewhat Approve 42% (151) 30% (109) 28% (99) 359Trump Job Somewhat Disapprove 56% (126) 24% (54) 20% (46) 226Trump Job Strongly Disapprove 67% (623) 19% (180) 13% (124) 927
Continued on next page
Page 208
208
Morning ConsultTable POL12_2
Table POL12_2: Generally speaking, do you wear a face mask in each of the following settings?Outside near people you don’t know
DemographicYes, I wear it all the
time Yes, I wear it sometimesNo, I do not wear a face
mask Total N
Registered Voters 55% (1088) 22% (445) 23% (455) 1988Favorable of Trump 40% (313) 26% (206) 34% (268) 787Unfavorable of Trump 65% (741) 20% (226) 15% (165) 1132Very Favorable of Trump 38% (175) 24% (110) 38% (177) 462Somewhat Favorable of Trump 42% (138) 30% (96) 28% (91) 325Somewhat Unfavorable of Trump 52% (95) 24% (44) 23% (42) 182Very Unfavorable of Trump 68% (646) 19% (181) 13% (123) 950#1 Issue: Economy 52% (359) 23% (156) 25% (173) 688#1 Issue: Security 48% (122) 21% (53) 31% (79) 254#1 Issue: Health Care 61% (205) 22% (73) 17% (57) 335#1 Issue: Medicare / Social Security 57% (162) 24% (68) 19% (53) 283#1 Issue: Women’s Issues 66% (56) 19% (16) 16% (14) 86#1 Issue: Education 49% (53) 26% (28) 25% (26) 107#1 Issue: Energy 57% (45) 30% (23) 13% (11) 79#1 Issue: Other 55% (86) 18% (28) 27% (42) 1572018 House Vote: Democrat 69% (528) 19% (148) 12% (91) 7672018 House Vote: Republican 42% (267) 24% (150) 34% (212) 6292018 House Vote: Someone else 44% (32) 23% (17) 33% (24) 732016 Vote: Hillary Clinton 70% (490) 19% (131) 11% (79) 7002016 Vote: Donald Trump 43% (288) 23% (153) 35% (234) 6752016 Vote: Other 49% (71) 28% (41) 23% (33) 1442016 Vote: Didn’t Vote 51% (237) 26% (121) 23% (109) 466Voted in 2014: Yes 55% (730) 21% (281) 24% (311) 1322Voted in 2014: No 54% (358) 25% (164) 22% (144) 6662012 Vote: Barack Obama 65% (554) 21% (181) 14% (118) 8532012 Vote: Mitt Romney 40% (200) 25% (126) 35% (175) 5012012 Vote: Other 33% (28) 21% (17) 46% (39) 842012 Vote: Didn’t Vote 56% (305) 22% (122) 22% (123) 550
Continued on next page
Page 209
National Tracking Poll #2006102, June, 2020
209
Table POL12_2
Table POL12_2: Generally speaking, do you wear a face mask in each of the following settings?Outside near people you don’t know
DemographicYes, I wear it all the
time Yes, I wear it sometimesNo, I do not wear a face
mask Total N
Registered Voters 55% (1088) 22% (445) 23% (455) 19884-Region: Northeast 63% (225) 23% (80) 14% (50) 3554-Region: Midwest 46% (212) 23% (107) 30% (138) 4574-Region: South 52% (384) 22% (167) 26% (192) 7424-Region: West 62% (267) 21% (92) 17% (75) 434Party: Democrat/Leans Democrat 67% (612) 19% (177) 13% (123) 911Party: Republican/Leans Republican 41% (301) 26% (194) 33% (246) 741Parents 51% (444) 25% (212) 24% (208) 864Note: Row proportions may total to larger than one-hundred percent due to rounding. For more information visit MorningConsultIntelligence.com.
Page 210
210
Morning ConsultTable POL12_3
Table POL12_3: Generally speaking, do you wear a face mask in each of the following settings?Outside near people you know, but don’t live with
DemographicYes, I wear it all the
time Yes, I wear it sometimesNo, I do not wear a face
mask Total N
Registered Voters 37% (740) 27% (539) 36% (709) 1988Gender: Male 36% (336) 27% (254) 37% (340) 930Gender: Female 38% (404) 27% (285) 35% (369) 1058Age: 18-34 38% (188) 29% (147) 33% (164) 499Age: 35-44 34% (103) 29% (89) 37% (110) 302Age: 45-64 40% (288) 25% (178) 36% (257) 724Age: 65+ 35% (160) 27% (126) 38% (177) 463GenZers: 1997-2012 41% (91) 26% (57) 34% (75) 224Millennials: 1981-1996 34% (142) 31% (130) 35% (148) 419GenXers: 1965-1980 39% (200) 27% (139) 34% (173) 511Baby Boomers: 1946-1964 37% (279) 25% (193) 38% (287) 760PID: Dem (no lean) 50% (381) 27% (203) 23% (174) 757PID: Ind (no lean) 33% (208) 28% (180) 39% (250) 638PID: Rep (no lean) 26% (152) 26% (156) 48% (285) 593PID/Gender: DemMen 47% (154) 29% (96) 24% (79) 329PID/Gender: DemWomen 53% (227) 25% (107) 22% (95) 429PID/Gender: Ind Men 32% (94) 26% (77) 42% (124) 296PID/Gender: Ind Women 33% (114) 30% (103) 37% (125) 342PID/Gender: Rep Men 29% (88) 27% (81) 45% (136) 306PID/Gender: Rep Women 22% (64) 26% (75) 52% (148) 287Ideo: Liberal (1-3) 48% (293) 30% (180) 22% (136) 609Ideo: Moderate (4) 41% (216) 25% (129) 34% (177) 522Ideo: Conservative (5-7) 25% (171) 25% (173) 49% (335) 679Educ: < College 36% (449) 26% (324) 38% (478) 1250Educ: Bachelors degree 37% (176) 31% (146) 31% (148) 470Educ: Post-grad 43% (115) 26% (69) 31% (83) 267Income: Under 50k 39% (392) 26% (257) 35% (350) 998Income: 50k-100k 34% (224) 27% (181) 39% (255) 660Income: 100k+ 38% (124) 31% (101) 32% (104) 329Ethnicity: White 33% (528) 27% (437) 40% (643) 1608Ethnicity: Hispanic 43% (83) 33% (63) 24% (46) 193
Continued on next page
Page 211
National Tracking Poll #2006102, June, 2020
211
Table POL12_3
Table POL12_3: Generally speaking, do you wear a face mask in each of the following settings?Outside near people you know, but don’t live with
DemographicYes, I wear it all the
time Yes, I wear it sometimesNo, I do not wear a face
mask Total N
Registered Voters 37% (740) 27% (539) 36% (709) 1988Ethnicity: Afr. Am. 56% (140) 27% (68) 18% (44) 252Ethnicity: Other 56% (72) 27% (34) 17% (22) 128All Christian 33% (312) 29% (272) 38% (356) 941All Non-Christian 54% (52) 24% (23) 23% (22) 97Atheist 42% (54) 28% (35) 30% (39) 128Agnostic/Nothing in particular 39% (184) 26% (122) 36% (172) 478Something Else 40% (137) 25% (86) 35% (120) 344Religious Non-Protestant/Catholic 50% (59) 23% (28) 27% (32) 120Evangelical 34% (172) 27% (136) 39% (197) 505Non-Evangelical 35% (264) 29% (213) 36% (269) 746Community: Urban 48% (236) 28% (135) 24% (119) 490Community: Suburban 37% (366) 28% (277) 34% (338) 981Community: Rural 27% (138) 25% (127) 49% (252) 517Employ: Private Sector 38% (238) 31% (195) 31% (198) 631Employ: Government 40% (54) 28% (38) 32% (44) 136Employ: Self-Employed 50% (64) 14% (18) 36% (47) 130Employ: Homemaker 32% (37) 23% (27) 45% (52) 115Employ: Retired 35% (171) 25% (124) 40% (196) 492Employ: Unemployed 38% (86) 28% (65) 34% (78) 229Employ: Other 38% (57) 29% (44) 33% (51) 152Military HH: Yes 31% (95) 28% (86) 41% (125) 306Military HH: No 38% (645) 27% (453) 35% (584) 1682RD/WT: Right Direction 29% (162) 27% (151) 45% (255) 567RD/WT: Wrong Track 41% (578) 27% (389) 32% (454) 1421Trump Job Approve 26% (201) 25% (192) 49% (380) 774Trump Job Disapprove 45% (519) 29% (335) 26% (299) 1153Trump Job Strongly Approve 24% (98) 21% (86) 56% (230) 415Trump Job Somewhat Approve 29% (103) 30% (106) 42% (150) 359Trump Job Somewhat Disapprove 37% (84) 28% (63) 35% (79) 226Trump Job Strongly Disapprove 47% (435) 29% (272) 24% (220) 927
Continued on next page
Page 212
212
Morning ConsultTable POL12_3
Table POL12_3: Generally speaking, do you wear a face mask in each of the following settings?Outside near people you know, but don’t live with
DemographicYes, I wear it all the
time Yes, I wear it sometimesNo, I do not wear a face
mask Total N
Registered Voters 37% (740) 27% (539) 36% (709) 1988Favorable of Trump 27% (211) 24% (190) 49% (386) 787Unfavorable of Trump 45% (508) 29% (332) 26% (292) 1132Very Favorable of Trump 25% (113) 22% (100) 54% (249) 462Somewhat Favorable of Trump 30% (98) 28% (90) 42% (138) 325Somewhat Unfavorable of Trump 33% (61) 31% (57) 35% (64) 182Very Unfavorable of Trump 47% (447) 29% (275) 24% (228) 950#1 Issue: Economy 36% (248) 27% (189) 37% (251) 688#1 Issue: Security 32% (80) 21% (53) 47% (120) 254#1 Issue: Health Care 41% (138) 31% (104) 28% (94) 335#1 Issue: Medicare / Social Security 43% (121) 26% (75) 31% (87) 283#1 Issue: Women’s Issues 33% (29) 35% (30) 32% (27) 86#1 Issue: Education 31% (33) 28% (29) 42% (44) 107#1 Issue: Energy 37% (29) 31% (25) 32% (25) 79#1 Issue: Other 40% (63) 22% (35) 38% (59) 1572018 House Vote: Democrat 49% (374) 28% (213) 24% (180) 7672018 House Vote: Republican 27% (169) 25% (158) 48% (303) 6292018 House Vote: Someone else 29% (21) 29% (21) 42% (31) 732016 Vote: Hillary Clinton 49% (341) 28% (195) 23% (164) 7002016 Vote: Donald Trump 25% (171) 25% (169) 50% (335) 6752016 Vote: Other 38% (55) 28% (40) 34% (49) 1442016 Vote: Didn’t Vote 37% (171) 29% (134) 34% (161) 466Voted in 2014: Yes 37% (491) 27% (354) 36% (476) 1322Voted in 2014: No 37% (249) 28% (185) 35% (233) 6662012 Vote: Barack Obama 45% (387) 28% (242) 26% (225) 8532012 Vote: Mitt Romney 24% (121) 25% (126) 51% (254) 5012012 Vote: Other 27% (23) 20% (17) 52% (44) 842012 Vote: Didn’t Vote 38% (208) 28% (154) 34% (187) 550
Continued on next page
Page 213
National Tracking Poll #2006102, June, 2020
213
Table POL12_3
Table POL12_3: Generally speaking, do you wear a face mask in each of the following settings?Outside near people you know, but don’t live with
DemographicYes, I wear it all the
time Yes, I wear it sometimesNo, I do not wear a face
mask Total N
Registered Voters 37% (740) 27% (539) 36% (709) 19884-Region: Northeast 45% (160) 27% (98) 27% (97) 3554-Region: Midwest 29% (132) 27% (124) 44% (201) 4574-Region: South 35% (260) 27% (197) 38% (285) 7424-Region: West 43% (189) 28% (121) 29% (125) 434Party: Democrat/Leans Democrat 49% (444) 27% (249) 24% (218) 911Party: Republican/Leans Republican 25% (184) 26% (191) 49% (366) 741Parents 35% (305) 26% (228) 38% (330) 864Note: Row proportions may total to larger than one-hundred percent due to rounding. For more information visit MorningConsultIntelligence.com.
Page 214
214
Morning ConsultTable POL12_4
Table POL12_4: Generally speaking, do you wear a face mask in each of the following settings?Inside with people you don’t know
DemographicYes, I wear it all the
time Yes, I wear it sometimesNo, I do not wear a face
mask Total N
Registered Voters 55% (1088) 23% (451) 23% (448) 1988Gender: Male 51% (473) 24% (225) 25% (233) 930Gender: Female 58% (615) 21% (227) 20% (216) 1058Age: 18-34 50% (250) 27% (134) 23% (115) 499Age: 35-44 53% (159) 22% (65) 26% (78) 302Age: 45-64 59% (429) 19% (141) 21% (154) 724Age: 65+ 54% (251) 24% (111) 22% (101) 463GenZers: 1997-2012 47% (105) 31% (69) 22% (49) 224Millennials: 1981-1996 52% (218) 23% (96) 25% (106) 419GenXers: 1965-1980 57% (293) 20% (104) 22% (114) 511Baby Boomers: 1946-1964 56% (427) 22% (169) 22% (164) 760PID: Dem (no lean) 64% (484) 20% (148) 17% (126) 757PID: Ind (no lean) 53% (340) 23% (148) 23% (150) 638PID: Rep (no lean) 45% (265) 26% (155) 29% (173) 593PID/Gender: DemMen 57% (188) 25% (81) 18% (60) 329PID/Gender: DemWomen 69% (296) 16% (67) 15% (66) 429PID/Gender: Ind Men 51% (151) 23% (68) 26% (77) 296PID/Gender: Ind Women 55% (189) 23% (80) 21% (73) 342PID/Gender: Rep Men 44% (134) 25% (76) 31% (96) 306PID/Gender: Rep Women 45% (130) 28% (79) 27% (77) 287Ideo: Liberal (1-3) 67% (410) 19% (114) 14% (84) 609Ideo: Moderate (4) 56% (294) 22% (113) 22% (115) 522Ideo: Conservative (5-7) 42% (288) 27% (184) 30% (207) 679Educ: < College 51% (642) 23% (284) 26% (323) 1250Educ: Bachelors degree 57% (268) 24% (113) 19% (89) 470Educ: Post-grad 67% (178) 20% (54) 13% (36) 267Income: Under 50k 54% (540) 23% (227) 23% (232) 998Income: 50k-100k 52% (341) 24% (156) 25% (163) 660Income: 100k+ 63% (207) 21% (68) 16% (53) 329Ethnicity: White 54% (863) 23% (365) 24% (380) 1608Ethnicity: Hispanic 56% (107) 23% (45) 21% (40) 193
Continued on next page
Page 215
National Tracking Poll #2006102, June, 2020
215
Table POL12_4
Table POL12_4: Generally speaking, do you wear a face mask in each of the following settings?Inside with people you don’t know
DemographicYes, I wear it all the
time Yes, I wear it sometimesNo, I do not wear a face
mask Total N
Registered Voters 55% (1088) 23% (451) 23% (448) 1988Ethnicity: Afr. Am. 58% (145) 24% (60) 19% (47) 252Ethnicity: Other 62% (80) 21% (27) 17% (21) 128All Christian 54% (509) 23% (215) 23% (216) 941All Non-Christian 63% (62) 20% (20) 17% (16) 97Atheist 63% (81) 20% (26) 17% (21) 128Agnostic/Nothing in particular 55% (261) 22% (104) 24% (113) 478Something Else 51% (175) 25% (87) 24% (82) 344Religious Non-Protestant/Catholic 61% (73) 21% (25) 18% (22) 120Evangelical 49% (247) 27% (135) 24% (123) 505Non-Evangelical 56% (419) 21% (159) 23% (168) 746Community: Urban 60% (292) 23% (112) 17% (85) 490Community: Suburban 55% (544) 23% (225) 22% (212) 981Community: Rural 49% (252) 22% (114) 29% (151) 517Employ: Private Sector 59% (370) 22% (137) 20% (124) 631Employ: Government 58% (78) 24% (32) 18% (25) 136Employ: Self-Employed 58% (76) 19% (25) 22% (29) 130Employ: Homemaker 50% (58) 18% (21) 32% (36) 115Employ: Retired 54% (266) 23% (114) 23% (112) 492Employ: Unemployed 53% (122) 20% (47) 26% (60) 229Employ: Other 50% (76) 28% (42) 22% (34) 152Military HH: Yes 46% (140) 29% (90) 25% (77) 306Military HH: No 56% (949) 21% (361) 22% (372) 1682RD/WT: Right Direction 42% (241) 26% (150) 31% (176) 567RD/WT: Wrong Track 60% (847) 21% (301) 19% (272) 1421Trump Job Approve 42% (322) 28% (215) 31% (236) 774Trump Job Disapprove 64% (736) 19% (220) 17% (197) 1153Trump Job Strongly Approve 37% (155) 26% (109) 36% (151) 415Trump Job Somewhat Approve 47% (167) 29% (106) 24% (86) 359Trump Job Somewhat Disapprove 54% (123) 21% (48) 25% (56) 226Trump Job Strongly Disapprove 66% (613) 19% (172) 15% (141) 927
Continued on next page
Page 216
216
Morning ConsultTable POL12_4
Table POL12_4: Generally speaking, do you wear a face mask in each of the following settings?Inside with people you don’t know
DemographicYes, I wear it all the
time Yes, I wear it sometimesNo, I do not wear a face
mask Total N
Registered Voters 55% (1088) 23% (451) 23% (448) 1988Favorable of Trump 42% (328) 28% (219) 30% (240) 787Unfavorable of Trump 64% (725) 19% (218) 17% (188) 1132Very Favorable of Trump 38% (176) 27% (123) 35% (163) 462Somewhat Favorable of Trump 47% (152) 30% (97) 23% (76) 325Somewhat Unfavorable of Trump 57% (104) 23% (42) 20% (36) 182Very Unfavorable of Trump 65% (621) 19% (177) 16% (152) 950#1 Issue: Economy 50% (341) 27% (184) 24% (163) 688#1 Issue: Security 44% (112) 26% (65) 30% (77) 254#1 Issue: Health Care 64% (215) 19% (63) 17% (57) 335#1 Issue: Medicare / Social Security 59% (168) 19% (55) 21% (61) 283#1 Issue: Women’s Issues 56% (48) 24% (21) 20% (17) 86#1 Issue: Education 58% (62) 21% (23) 20% (22) 107#1 Issue: Energy 63% (50) 21% (17) 16% (13) 79#1 Issue: Other 60% (93) 16% (24) 25% (39) 1572018 House Vote: Democrat 66% (506) 20% (153) 14% (108) 7672018 House Vote: Republican 44% (280) 25% (157) 31% (193) 6292018 House Vote: Someone else 51% (37) 28% (21) 21% (16) 732016 Vote: Hillary Clinton 68% (474) 18% (126) 14% (100) 7002016 Vote: Donald Trump 43% (292) 27% (180) 30% (203) 6752016 Vote: Other 55% (80) 25% (36) 19% (28) 1442016 Vote: Didn’t Vote 52% (241) 23% (109) 25% (116) 466Voted in 2014: Yes 56% (744) 21% (278) 23% (299) 1322Voted in 2014: No 52% (344) 26% (173) 22% (149) 6662012 Vote: Barack Obama 64% (547) 20% (168) 16% (138) 8532012 Vote: Mitt Romney 45% (227) 23% (117) 31% (157) 5012012 Vote: Other 40% (34) 30% (25) 30% (25) 842012 Vote: Didn’t Vote 51% (279) 26% (142) 23% (128) 550
Continued on next page
Page 217
National Tracking Poll #2006102, June, 2020
217
Table POL12_4
Table POL12_4: Generally speaking, do you wear a face mask in each of the following settings?Inside with people you don’t know
DemographicYes, I wear it all the
time Yes, I wear it sometimesNo, I do not wear a face
mask Total N
Registered Voters 55% (1088) 23% (451) 23% (448) 19884-Region: Northeast 66% (232) 17% (61) 17% (62) 3554-Region: Midwest 49% (223) 27% (125) 24% (109) 4574-Region: South 50% (374) 25% (185) 25% (184) 7424-Region: West 60% (259) 19% (81) 22% (94) 434Party: Democrat/Leans Democrat 64% (587) 19% (177) 16% (147) 911Party: Republican/Leans Republican 44% (328) 27% (197) 29% (216) 741Parents 53% (457) 24% (210) 23% (197) 864Note: Row proportions may total to larger than one-hundred percent due to rounding. For more information visit MorningConsultIntelligence.com.
Page 218
218
Morning ConsultTable POL12_5
Table POL12_5: Generally speaking, do you wear a face mask in each of the following settings?Inside with people you know, but don’t live with
DemographicYes, I wear it all the
time Yes, I wear it sometimesNo, I do not wear a face
mask Total N
Registered Voters 29% (585) 25% (506) 45% (897) 1988Gender: Male 29% (273) 26% (241) 45% (417) 930Gender: Female 29% (312) 25% (265) 45% (481) 1058Age: 18-34 28% (139) 27% (136) 45% (225) 499Age: 35-44 28% (86) 24% (73) 47% (143) 302Age: 45-64 32% (230) 25% (181) 43% (313) 724Age: 65+ 28% (130) 25% (116) 47% (217) 463GenZers: 1997-2012 29% (65) 25% (57) 46% (102) 224Millennials: 1981-1996 27% (112) 27% (113) 46% (194) 419GenXers: 1965-1980 32% (162) 26% (135) 42% (214) 511Baby Boomers: 1946-1964 29% (223) 24% (185) 46% (352) 760PID: Dem (no lean) 39% (292) 25% (187) 37% (279) 757PID: Ind (no lean) 27% (174) 25% (159) 48% (305) 638PID: Rep (no lean) 20% (119) 27% (160) 53% (313) 593PID/Gender: DemMen 37% (123) 26% (86) 37% (120) 329PID/Gender: DemWomen 39% (169) 24% (101) 37% (158) 429PID/Gender: Ind Men 28% (82) 23% (69) 49% (145) 296PID/Gender: Ind Women 27% (92) 26% (90) 47% (161) 342PID/Gender: Rep Men 22% (68) 28% (86) 50% (152) 306PID/Gender: Rep Women 18% (51) 26% (74) 56% (161) 287Ideo: Liberal (1-3) 38% (233) 28% (171) 34% (204) 609Ideo: Moderate (4) 33% (170) 22% (116) 45% (236) 522Ideo: Conservative (5-7) 20% (134) 26% (173) 55% (372) 679Educ: < College 27% (334) 24% (302) 49% (615) 1250Educ: Bachelors degree 31% (145) 28% (131) 41% (195) 470Educ: Post-grad 40% (106) 27% (73) 33% (88) 267Income: Under 50k 30% (299) 24% (238) 46% (462) 998Income: 50k-100k 26% (172) 27% (178) 47% (310) 660Income: 100k+ 35% (114) 27% (89) 38% (126) 329Ethnicity: White 28% (443) 25% (407) 47% (757) 1608Ethnicity: Hispanic 34% (66) 24% (46) 42% (80) 193
Continued on next page
Page 219
National Tracking Poll #2006102, June, 2020
219
Table POL12_5
Table POL12_5: Generally speaking, do you wear a face mask in each of the following settings?Inside with people you know, but don’t live with
DemographicYes, I wear it all the
time Yes, I wear it sometimesNo, I do not wear a face
mask Total N
Registered Voters 29% (585) 25% (506) 45% (897) 1988Ethnicity: Afr. Am. 38% (97) 24% (60) 38% (95) 252Ethnicity: Other 35% (44) 30% (38) 36% (46) 128All Christian 27% (253) 27% (250) 47% (439) 941All Non-Christian 43% (41) 20% (20) 37% (36) 97Atheist 37% (47) 30% (38) 33% (43) 128Agnostic/Nothing in particular 30% (142) 23% (111) 47% (226) 478Something Else 30% (102) 26% (88) 45% (154) 344Religious Non-Protestant/Catholic 38% (45) 23% (27) 39% (47) 120Evangelical 26% (130) 24% (123) 50% (251) 505Non-Evangelical 29% (218) 27% (205) 43% (323) 746Community: Urban 36% (178) 27% (133) 37% (179) 490Community: Suburban 28% (279) 27% (265) 45% (437) 981Community: Rural 25% (128) 21% (108) 54% (281) 517Employ: Private Sector 31% (193) 30% (186) 40% (251) 631Employ: Government 33% (45) 26% (36) 41% (55) 136Employ: Self-Employed 39% (51) 19% (25) 41% (54) 130Employ: Homemaker 31% (36) 20% (23) 49% (57) 115Employ: Retired 27% (131) 25% (121) 49% (239) 492Employ: Unemployed 30% (69) 21% (49) 48% (111) 229Employ: Other 26% (39) 26% (39) 48% (73) 152Military HH: Yes 27% (83) 29% (88) 44% (135) 306Military HH: No 30% (501) 25% (418) 45% (762) 1682RD/WT: Right Direction 24% (136) 25% (142) 51% (290) 567RD/WT: Wrong Track 32% (449) 26% (363) 43% (608) 1421Trump Job Approve 22% (167) 25% (194) 53% (413) 774Trump Job Disapprove 34% (397) 26% (298) 40% (458) 1153Trump Job Strongly Approve 18% (74) 25% (104) 57% (237) 415Trump Job Somewhat Approve 26% (92) 25% (90) 49% (177) 359Trump Job Somewhat Disapprove 28% (63) 23% (52) 50% (112) 226Trump Job Strongly Disapprove 36% (335) 27% (246) 37% (346) 927
Continued on next page
Page 220
220
Morning ConsultTable POL12_5
Table POL12_5: Generally speaking, do you wear a face mask in each of the following settings?Inside with people you know, but don’t live with
DemographicYes, I wear it all the
time Yes, I wear it sometimesNo, I do not wear a face
mask Total N
Registered Voters 29% (585) 25% (506) 45% (897) 1988Favorable of Trump 21% (165) 25% (198) 54% (424) 787Unfavorable of Trump 35% (400) 26% (291) 39% (441) 1132Very Favorable of Trump 18% (82) 24% (112) 58% (268) 462Somewhat Favorable of Trump 26% (83) 26% (85) 48% (156) 325Somewhat Unfavorable of Trump 30% (55) 23% (41) 47% (86) 182Very Unfavorable of Trump 36% (345) 26% (250) 37% (355) 950#1 Issue: Economy 29% (200) 24% (168) 47% (320) 688#1 Issue: Security 21% (54) 24% (62) 54% (138) 254#1 Issue: Health Care 32% (108) 31% (104) 37% (124) 335#1 Issue: Medicare / Social Security 31% (87) 22% (62) 47% (134) 283#1 Issue: Women’s Issues 24% (20) 35% (30) 41% (35) 86#1 Issue: Education 23% (25) 30% (32) 47% (50) 107#1 Issue: Energy 41% (33) 26% (20) 33% (26) 79#1 Issue: Other 37% (59) 18% (28) 45% (70) 1572018 House Vote: Democrat 40% (307) 24% (184) 36% (276) 7672018 House Vote: Republican 20% (128) 25% (158) 55% (343) 6292018 House Vote: Someone else 28% (20) 24% (18) 48% (35) 732016 Vote: Hillary Clinton 40% (283) 25% (173) 35% (245) 7002016 Vote: Donald Trump 21% (141) 25% (170) 54% (364) 6752016 Vote: Other 32% (46) 26% (38) 42% (60) 1442016 Vote: Didn’t Vote 24% (114) 27% (125) 49% (228) 466Voted in 2014: Yes 30% (397) 25% (325) 45% (600) 1322Voted in 2014: No 28% (188) 27% (181) 45% (297) 6662012 Vote: Barack Obama 36% (309) 25% (214) 39% (330) 8532012 Vote: Mitt Romney 19% (97) 26% (129) 55% (276) 5012012 Vote: Other 22% (19) 24% (20) 54% (45) 842012 Vote: Didn’t Vote 29% (159) 26% (144) 45% (247) 550
Continued on next page
Page 221
National Tracking Poll #2006102, June, 2020
221
Table POL12_5
Table POL12_5: Generally speaking, do you wear a face mask in each of the following settings?Inside with people you know, but don’t live with
DemographicYes, I wear it all the
time Yes, I wear it sometimesNo, I do not wear a face
mask Total N
Registered Voters 29% (585) 25% (506) 45% (897) 19884-Region: Northeast 35% (123) 27% (94) 39% (138) 3554-Region: Midwest 23% (103) 28% (126) 50% (228) 4574-Region: South 29% (217) 23% (174) 47% (351) 7424-Region: West 33% (142) 26% (111) 42% (181) 434Party: Democrat/Leans Democrat 37% (342) 26% (234) 37% (336) 911Party: Republican/Leans Republican 20% (149) 26% (191) 54% (400) 741Parents 27% (233) 27% (237) 46% (393) 864Note: Row proportions may total to larger than one-hundred percent due to rounding. For more information visit MorningConsultIntelligence.com.
Page 222
222
Morning ConsultTable POL12_6
Table POL12_6: Generally speaking, do you wear a face mask in each of the following settings?In your house
DemographicYes, I wear it all the
time Yes, I wear it sometimesNo, I do not wear a face
mask Total N
Registered Voters 4% (88) 5% (94) 91% (1806) 1988Gender: Male 6% (56) 6% (55) 88% (819) 930Gender: Female 3% (32) 4% (39) 93% (987) 1058Age: 18-34 7% (35) 8% (39) 85% (425) 499Age: 35-44 5% (14) 6% (19) 89% (269) 302Age: 45-64 4% (32) 3% (22) 93% (670) 724Age: 65+ 1% (7) 3% (14) 96% (442) 463GenZers: 1997-2012 6% (14) 9% (20) 85% (189) 224Millennials: 1981-1996 6% (25) 7% (30) 87% (365) 419GenXers: 1965-1980 6% (28) 4% (19) 91% (465) 511Baby Boomers: 1946-1964 3% (21) 3% (23) 94% (716) 760PID: Dem (no lean) 5% (36) 4% (34) 91% (688) 757PID: Ind (no lean) 3% (19) 5% (35) 91% (583) 638PID: Rep (no lean) 6% (33) 4% (25) 90% (534) 593PID/Gender: DemMen 7% (22) 6% (21) 87% (286) 329PID/Gender: DemWomen 3% (14) 3% (13) 94% (402) 429PID/Gender: Ind Men 4% (13) 6% (17) 90% (266) 296PID/Gender: Ind Women 2% (7) 5% (18) 93% (317) 342PID/Gender: Rep Men 7% (22) 6% (17) 87% (267) 306PID/Gender: Rep Women 4% (11) 3% (8) 93% (267) 287Ideo: Liberal (1-3) 6% (34) 5% (33) 89% (542) 609Ideo: Moderate (4) 5% (27) 6% (29) 89% (466) 522Ideo: Conservative (5-7) 3% (23) 3% (18) 94% (638) 679Educ: < College 4% (51) 5% (63) 91% (1136) 1250Educ: Bachelors degree 5% (23) 4% (18) 91% (429) 470Educ: Post-grad 5% (14) 5% (13) 90% (240) 267Income: Under 50k 5% (53) 5% (51) 90% (895) 998Income: 50k-100k 3% (21) 4% (29) 92% (610) 660Income: 100k+ 5% (15) 4% (14) 91% (300) 329Ethnicity: White 4% (58) 4% (62) 93% (1488) 1608Ethnicity: Hispanic 7% (13) 11% (20) 83% (159) 193
Continued on next page
Page 223
National Tracking Poll #2006102, June, 2020
223
Table POL12_6
Table POL12_6: Generally speaking, do you wear a face mask in each of the following settings?In your house
DemographicYes, I wear it all the
time Yes, I wear it sometimesNo, I do not wear a face
mask Total N
Registered Voters 4% (88) 5% (94) 91% (1806) 1988Ethnicity: Afr. Am. 8% (21) 9% (24) 82% (207) 252Ethnicity: Other 7% (9) 6% (8) 87% (111) 128All Christian 3% (32) 4% (41) 92% (868) 941All Non-Christian 9% (9) 9% (9) 81% (79) 97Atheist 3% (4) 9% (12) 88% (112) 128Agnostic/Nothing in particular 5% (25) 4% (19) 91% (434) 478Something Else 5% (17) 4% (14) 91% (313) 344Religious Non-Protestant/Catholic 8% (10) 8% (10) 84% (100) 120Evangelical 5% (23) 5% (24) 91% (458) 505Non-Evangelical 3% (25) 4% (29) 93% (691) 746Community: Urban 7% (33) 7% (34) 86% (423) 490Community: Suburban 4% (37) 4% (43) 92% (900) 981Community: Rural 3% (18) 3% (17) 93% (483) 517Employ: Private Sector 6% (38) 5% (29) 89% (563) 631Employ: Government 4% (6) 7% (9) 89% (121) 136Employ: Self-Employed 9% (12) 9% (12) 82% (106) 130Employ: Homemaker 3% (4) 3% (4) 94% (108) 115Employ: Retired 2% (11) 3% (15) 95% (466) 492Employ: Unemployed 5% (11) 7% (16) 88% (201) 229Employ: Other 3% (4) 4% (5) 94% (143) 152Military HH: Yes 2% (7) 4% (12) 94% (287) 306Military HH: No 5% (82) 5% (82) 90% (1518) 1682RD/WT: Right Direction 7% (40) 5% (31) 88% (497) 567RD/WT: Wrong Track 3% (49) 4% (63) 92% (1309) 1421Trump Job Approve 5% (42) 4% (33) 90% (699) 774Trump Job Disapprove 4% (45) 4% (51) 92% (1057) 1153Trump Job Strongly Approve 6% (25) 4% (16) 90% (374) 415Trump Job Somewhat Approve 5% (17) 5% (16) 91% (325) 359Trump Job Somewhat Disapprove 5% (11) 6% (14) 89% (201) 226Trump Job Strongly Disapprove 4% (34) 4% (37) 92% (855) 927
Continued on next page
Page 224
224
Morning ConsultTable POL12_6
Table POL12_6: Generally speaking, do you wear a face mask in each of the following settings?In your house
DemographicYes, I wear it all the
time Yes, I wear it sometimesNo, I do not wear a face
mask Total N
Registered Voters 4% (88) 5% (94) 91% (1806) 1988Favorable of Trump 6% (44) 4% (33) 90% (710) 787Unfavorable of Trump 3% (39) 5% (55) 92% (1038) 1132Very Favorable of Trump 6% (27) 3% (15) 91% (419) 462Somewhat Favorable of Trump 5% (17) 5% (17) 89% (290) 325Somewhat Unfavorable of Trump 4% (7) 9% (16) 88% (159) 182Very Unfavorable of Trump 3% (33) 4% (39) 92% (878) 950#1 Issue: Economy 6% (39) 5% (33) 90% (616) 688#1 Issue: Security 4% (9) 5% (13) 91% (232) 254#1 Issue: Health Care 5% (16) 5% (18) 90% (302) 335#1 Issue: Medicare / Social Security 3% (9) 4% (12) 92% (262) 283#1 Issue: Women’s Issues 5% (4) 6% (5) 89% (77) 86#1 Issue: Education 5% (5) 5% (5) 90% (96) 107#1 Issue: Energy 6% (5) 6% (5) 88% (69) 79#1 Issue: Other 1% (1) 2% (3) 97% (152) 1572018 House Vote: Democrat 4% (33) 4% (33) 91% (701) 7672018 House Vote: Republican 4% (27) 4% (22) 92% (580) 6292018 House Vote: Someone else 3% (2) 7% (5) 90% (66) 732016 Vote: Hillary Clinton 4% (29) 4% (26) 92% (646) 7002016 Vote: Donald Trump 4% (29) 5% (34) 91% (613) 6752016 Vote: Other 4% (5) 3% (5) 93% (134) 1442016 Vote: Didn’t Vote 6% (26) 6% (30) 88% (410) 466Voted in 2014: Yes 4% (48) 4% (53) 92% (1221) 1322Voted in 2014: No 6% (40) 6% (41) 88% (585) 6662012 Vote: Barack Obama 4% (37) 5% (42) 91% (774) 8532012 Vote: Mitt Romney 3% (14) 2% (11) 95% (476) 5012012 Vote: Other 5% (4) 4% (4) 91% (76) 842012 Vote: Didn’t Vote 6% (33) 7% (37) 87% (479) 550
Continued on next page
Page 225
National Tracking Poll #2006102, June, 2020
225
Table POL12_6
Table POL12_6: Generally speaking, do you wear a face mask in each of the following settings?In your house
DemographicYes, I wear it all the
time Yes, I wear it sometimesNo, I do not wear a face
mask Total N
Registered Voters 4% (88) 5% (94) 91% (1806) 19884-Region: Northeast 5% (18) 5% (18) 90% (318) 3554-Region: Midwest 2% (11) 4% (18) 94% (428) 4574-Region: South 5% (34) 5% (40) 90% (669) 7424-Region: West 6% (26) 4% (18) 90% (391) 434Party: Democrat/Leans Democrat 5% (43) 4% (38) 91% (830) 911Party: Republican/Leans Republican 5% (35) 4% (29) 91% (677) 741Parents 5% (40) 5% (41) 91% (783) 864Note: Row proportions may total to larger than one-hundred percent due to rounding. For more information visit MorningConsultIntelligence.com.
Page 226
226
Morning ConsultTable POL13
Table POL13: Based on what you know, would you say that wearing face masks helps prevent the spread of coronavirus:
Demographic A lot Some Not much Not at allDon’t know /No opinion Total N
Registered Voters 42% (826) 36% (718) 12% (232) 7% (133) 4% (79) 1988Gender: Male 40% (368) 38% (351) 12% (110) 6% (59) 5% (42) 930Gender: Female 43% (458) 35% (367) 11% (122) 7% (74) 3% (37) 1058Age: 18-34 37% (185) 38% (189) 12% (59) 8% (39) 5% (27) 499Age: 35-44 38% (115) 38% (115) 11% (34) 9% (26) 4% (12) 302Age: 45-64 44% (319) 35% (250) 10% (70) 8% (55) 4% (30) 724Age: 65+ 45% (207) 35% (164) 15% (69) 3% (13) 2% (10) 463GenZers: 1997-2012 33% (74) 39% (88) 10% (22) 9% (21) 8% (18) 224Millennials: 1981-1996 37% (156) 39% (164) 13% (56) 7% (30) 3% (14) 419GenXers: 1965-1980 45% (229) 34% (172) 9% (46) 9% (44) 4% (20) 511Baby Boomers: 1946-1964 44% (332) 35% (266) 13% (101) 5% (36) 3% (25) 760PID: Dem (no lean) 58% (442) 32% (242) 4% (33) 2% (17) 3% (24) 757PID: Ind (no lean) 32% (207) 41% (259) 14% (90) 8% (51) 5% (31) 638PID: Rep (no lean) 30% (178) 37% (217) 18% (109) 11% (65) 4% (25) 593PID/Gender: DemMen 52% (172) 36% (119) 4% (15) 2% (7) 5% (16) 329PID/Gender: DemWomen 63% (270) 29% (122) 4% (18) 2% (10) 2% (8) 429PID/Gender: Ind Men 31% (93) 41% (120) 15% (45) 7% (21) 6% (16) 296PID/Gender: Ind Women 33% (114) 41% (139) 13% (45) 9% (30) 4% (15) 342PID/Gender: Rep Men 34% (103) 36% (111) 17% (51) 10% (31) 3% (10) 306PID/Gender: Rep Women 26% (74) 37% (106) 20% (58) 12% (34) 5% (14) 287Ideo: Liberal (1-3) 58% (353) 34% (204) 4% (22) 3% (16) 2% (13) 609Ideo: Moderate (4) 42% (218) 38% (197) 11% (60) 4% (23) 5% (25) 522Ideo: Conservative (5-7) 29% (199) 38% (259) 19% (129) 11% (77) 2% (16) 679Educ: < College 36% (456) 37% (461) 14% (175) 8% (96) 5% (63) 1250Educ: Bachelors degree 49% (230) 35% (163) 8% (37) 6% (26) 3% (14) 470Educ: Post-grad 53% (141) 35% (94) 7% (20) 4% (11) 1% (2) 267Income: Under 50k 40% (404) 34% (337) 13% (131) 8% (76) 5% (50) 998Income: 50k-100k 39% (259) 40% (264) 12% (77) 6% (41) 3% (20) 660Income: 100k+ 50% (163) 35% (117) 7% (24) 5% (16) 3% (9) 329Ethnicity: White 39% (621) 38% (609) 13% (206) 7% (110) 4% (62) 1608Ethnicity: Hispanic 52% (100) 31% (61) 5% (9) 5% (9) 7% (14) 193Ethnicity: Afr. Am. 52% (132) 29% (74) 6% (16) 7% (19) 4% (11) 252
Continued on next page
Page 227
National Tracking Poll #2006102, June, 2020
227
Table POL13
Table POL13: Based on what you know, would you say that wearing face masks helps prevent the spread of coronavirus:
Demographic A lot Some Not much Not at allDon’t know /No opinion Total N
Registered Voters 42% (826) 36% (718) 12% (232) 7% (133) 4% (79) 1988Ethnicity: Other 57% (73) 27% (35) 7% (9) 4% (5) 5% (6) 128All Christian 41% (389) 38% (356) 13% (118) 6% (54) 3% (24) 941All Non-Christian 64% (62) 27% (26) 6% (6) 1% (1) 3% (3) 97Atheist 53% (68) 31% (40) 6% (7) 8% (10) 3% (3) 128Agnostic/Nothing in particular 39% (186) 36% (170) 12% (57) 6% (30) 7% (35) 478Something Else 35% (120) 37% (127) 13% (44) 11% (39) 4% (14) 344Religious Non-Protestant/Catholic 57% (69) 31% (37) 7% (8) 3% (3) 3% (3) 120Evangelical 37% (189) 34% (173) 16% (80) 8% (41) 4% (23) 505Non-Evangelical 42% (312) 39% (292) 10% (76) 7% (50) 2% (15) 746Community: Urban 46% (225) 35% (171) 10% (47) 6% (30) 4% (18) 490Community: Suburban 43% (426) 35% (342) 12% (116) 7% (64) 3% (34) 981Community: Rural 34% (176) 40% (205) 13% (69) 8% (40) 5% (28) 517Employ: Private Sector 41% (262) 40% (249) 11% (70) 6% (37) 2% (12) 631Employ: Government 43% (58) 43% (58) 6% (8) 6% (9) 2% (3) 136Employ: Self-Employed 44% (58) 30% (38) 13% (16) 8% (10) 6% (7) 130Employ: Homemaker 33% (38) 34% (39) 12% (14) 13% (15) 8% (9) 115Employ: Retired 46% (227) 32% (159) 15% (75) 4% (18) 3% (14) 492Employ: Unemployed 37% (85) 38% (86) 8% (19) 10% (22) 8% (17) 229Employ: Other 39% (60) 32% (48) 13% (20) 10% (15) 6% (10) 152Military HH: Yes 40% (121) 37% (114) 15% (47) 5% (16) 3% (8) 306Military HH: No 42% (705) 36% (603) 11% (185) 7% (118) 4% (71) 1682RD/WT: Right Direction 28% (158) 39% (222) 19% (106) 10% (57) 4% (25) 567RD/WT: Wrong Track 47% (668) 35% (495) 9% (126) 5% (77) 4% (54) 1421Trump Job Approve 26% (202) 40% (306) 19% (147) 12% (91) 4% (28) 774Trump Job Disapprove 53% (611) 34% (389) 7% (79) 3% (35) 3% (39) 1153Trump Job Strongly Approve 26% (109) 34% (139) 22% (91) 15% (61) 4% (15) 415Trump Job Somewhat Approve 26% (93) 47% (167) 16% (56) 8% (30) 4% (13) 359Trump Job Somewhat Disapprove 36% (82) 44% (99) 12% (26) 4% (10) 4% (9) 226Trump Job Strongly Disapprove 57% (529) 31% (290) 6% (53) 3% (25) 3% (30) 927Favorable of Trump 26% (206) 39% (307) 19% (148) 12% (96) 4% (29) 787Unfavorable of Trump 53% (601) 34% (388) 7% (76) 3% (32) 3% (36) 1132
Continued on next page
Page 228
228
Morning ConsultTable POL13
Table POL13: Based on what you know, would you say that wearing face masks helps prevent the spread of coronavirus:
Demographic A lot Some Not much Not at allDon’t know /No opinion Total N
Registered Voters 42% (826) 36% (718) 12% (232) 7% (133) 4% (79) 1988Very Favorable of Trump 27% (126) 33% (151) 22% (101) 15% (68) 4% (17) 462Somewhat Favorable of Trump 25% (80) 48% (155) 15% (48) 9% (29) 4% (13) 325Somewhat Unfavorable of Trump 32% (58) 48% (87) 13% (24) 3% (5) 4% (8) 182Very Unfavorable of Trump 57% (543) 32% (301) 5% (52) 3% (27) 3% (28) 950#1 Issue: Economy 36% (248) 39% (268) 13% (89) 8% (55) 4% (28) 688#1 Issue: Security 31% (79) 37% (93) 19% (48) 11% (27) 3% (6) 254#1 Issue: Health Care 51% (172) 33% (111) 10% (33) 4% (12) 2% (7) 335#1 Issue: Medicare / Social Security 47% (134) 32% (90) 10% (28) 4% (11) 7% (21) 283#1 Issue: Women’s Issues 43% (37) 43% (37) 8% (7) 4% (3) 2% (2) 86#1 Issue: Education 39% (41) 41% (43) 8% (9) 6% (6) 7% (7) 107#1 Issue: Energy 61% (48) 27% (21) 5% (4) 4% (3) 3% (2) 79#1 Issue: Other 42% (66) 34% (53) 9% (14) 11% (17) 4% (6) 1572018 House Vote: Democrat 60% (459) 31% (238) 6% (44) 2% (12) 2% (14) 7672018 House Vote: Republican 30% (189) 39% (244) 18% (111) 10% (64) 3% (22) 6292018 House Vote: Someone else 38% (28) 32% (23) 11% (8) 13% (10) 6% (4) 732016 Vote: Hillary Clinton 60% (417) 33% (229) 5% (32) 1% (6) 2% (15) 7002016 Vote: Donald Trump 28% (187) 39% (265) 19% (128) 10% (71) 4% (24) 6752016 Vote: Other 49% (71) 29% (42) 12% (18) 6% (8) 4% (5) 1442016 Vote: Didn’t Vote 32% (149) 39% (181) 11% (54) 10% (48) 7% (34) 466Voted in 2014: Yes 45% (593) 34% (456) 12% (153) 6% (78) 3% (42) 1322Voted in 2014: No 35% (233) 39% (262) 12% (78) 8% (55) 6% (37) 6662012 Vote: Barack Obama 55% (471) 33% (284) 6% (53) 3% (22) 3% (22) 8532012 Vote: Mitt Romney 31% (153) 38% (188) 19% (95) 10% (49) 3% (16) 5012012 Vote: Other 24% (20) 31% (26) 20% (17) 18% (15) 6% (5) 842012 Vote: Didn’t Vote 33% (181) 40% (219) 12% (65) 9% (48) 7% (36) 5504-Region: Northeast 45% (161) 38% (134) 10% (36) 4% (14) 3% (11) 3554-Region: Midwest 35% (161) 39% (178) 12% (53) 10% (48) 3% (16) 4574-Region: South 40% (294) 34% (255) 14% (106) 7% (52) 5% (35) 7424-Region: West 48% (210) 35% (150) 8% (37) 5% (20) 4% (18) 434Party: Democrat/Leans Democrat 57% (523) 33% (298) 5% (42) 2% (20) 3% (27) 911Party: Republican/Leans Republican 28% (210) 39% (291) 18% (136) 10% (77) 4% (26) 741
Continued on next page
Page 229
National Tracking Poll #2006102, June, 2020
229
Table POL13
Table POL13: Based on what you know, would you say that wearing face masks helps prevent the spread of coronavirus:
Demographic A lot Some Not much Not at allDon’t know /No opinion Total N
Registered Voters 42% (826) 36% (718) 12% (232) 7% (133) 4% (79) 1988Parents 40% (349) 37% (317) 12% (107) 7% (61) 3% (29) 864Note: Row proportions may total to larger than one-hundred percent due to rounding. For more information visit MorningConsultIntelligence.com.
Page 230
230
Morning ConsultTable POL14_1
Table POL14_1: As you may know, the federal government’s CARES Act provides about $2 trillion to help workers and businesses cope with thecoronavirus pandemic (including the Paycheck Protection Program, which provides funds to businesses with fewer than 500 employees to keep workerson their payroll). In your view, to what degree has the CARES Act helped the following?Small businesses
Demographic Helped a lot Helped a little Did not helpDon’t Know / No
Opinion Total N
Registered Voters 22% (428) 44% (883) 15% (300) 19% (376) 1988Gender: Male 23% (213) 44% (413) 16% (149) 17% (155) 930Gender: Female 20% (215) 44% (470) 14% (151) 21% (221) 1058Age: 18-34 24% (119) 36% (178) 16% (81) 24% (121) 499Age: 35-44 20% (62) 46% (140) 15% (45) 19% (56) 302Age: 45-64 22% (162) 44% (316) 15% (110) 19% (136) 724Age: 65+ 19% (86) 54% (249) 14% (64) 14% (64) 463GenZers: 1997-2012 23% (52) 30% (67) 16% (37) 30% (68) 224Millennials: 1981-1996 22% (91) 45% (189) 15% (63) 18% (76) 419GenXers: 1965-1980 24% (123) 40% (206) 16% (80) 20% (102) 511Baby Boomers: 1946-1964 19% (145) 51% (385) 15% (112) 16% (118) 760PID: Dem (no lean) 17% (132) 48% (366) 18% (137) 16% (122) 757PID: Ind (no lean) 18% (117) 42% (270) 15% (97) 24% (154) 638PID: Rep (no lean) 30% (179) 42% (247) 11% (66) 17% (101) 593PID/Gender: DemMen 18% (59) 49% (160) 18% (59) 15% (50) 329PID/Gender: DemWomen 17% (73) 48% (206) 18% (78) 17% (72) 429PID/Gender: Ind Men 21% (61) 43% (127) 15% (44) 21% (64) 296PID/Gender: Ind Women 16% (56) 42% (143) 15% (53) 26% (90) 342PID/Gender: Rep Men 30% (93) 41% (126) 15% (46) 14% (41) 306PID/Gender: Rep Women 30% (86) 42% (121) 7% (21) 21% (59) 287Ideo: Liberal (1-3) 17% (103) 50% (303) 20% (121) 13% (81) 609Ideo: Moderate (4) 19% (102) 46% (238) 14% (74) 21% (108) 522Ideo: Conservative (5-7) 28% (189) 45% (303) 12% (83) 15% (103) 679Educ: < College 23% (286) 41% (517) 14% (175) 22% (272) 1250Educ: Bachelors degree 18% (84) 49% (232) 17% (80) 16% (75) 470Educ: Post-grad 22% (58) 50% (134) 17% (46) 11% (29) 267Income: Under 50k 21% (207) 42% (419) 14% (143) 23% (230) 998Income: 50k-100k 21% (137) 47% (308) 18% (116) 15% (100) 660Income: 100k+ 26% (85) 48% (157) 13% (42) 14% (46) 329
Continued on next page
Page 231
National Tracking Poll #2006102, June, 2020
231
Table POL14_1
Table POL14_1: As you may know, the federal government’s CARES Act provides about $2 trillion to help workers and businesses cope with thecoronavirus pandemic (including the Paycheck Protection Program, which provides funds to businesses with fewer than 500 employees to keep workerson their payroll). In your view, to what degree has the CARES Act helped the following?Small businesses
Demographic Helped a lot Helped a little Did not helpDon’t Know / No
Opinion Total N
Registered Voters 22% (428) 44% (883) 15% (300) 19% (376) 1988Ethnicity: White 21% (345) 45% (726) 14% (232) 19% (305) 1608Ethnicity: Hispanic 26% (50) 34% (66) 19% (37) 21% (40) 193Ethnicity: Afr. Am. 22% (55) 42% (105) 20% (51) 16% (41) 252Ethnicity: Other 22% (28) 40% (52) 14% (18) 24% (30) 128All Christian 24% (224) 48% (450) 12% (113) 16% (154) 941All Non-Christian 18% (18) 49% (48) 20% (19) 13% (13) 97Atheist 14% (17) 51% (65) 25% (31) 11% (14) 128Agnostic/Nothing in particular 19% (91) 41% (194) 16% (77) 24% (115) 478Something Else 23% (78) 37% (126) 17% (59) 23% (80) 344Religious Non-Protestant/Catholic 18% (22) 52% (62) 17% (20) 13% (15) 120Evangelical 26% (129) 42% (213) 14% (70) 19% (94) 505Non-Evangelical 22% (166) 46% (344) 13% (99) 18% (137) 746Community: Urban 21% (104) 44% (215) 15% (76) 19% (95) 490Community: Suburban 21% (210) 45% (445) 15% (147) 18% (178) 981Community: Rural 22% (114) 43% (224) 15% (77) 20% (103) 517Employ: Private Sector 24% (151) 47% (299) 15% (93) 14% (87) 631Employ: Government 26% (35) 42% (57) 19% (25) 13% (18) 136Employ: Self-Employed 16% (21) 42% (54) 22% (28) 20% (26) 130Employ: Homemaker 18% (21) 35% (40) 11% (13) 35% (41) 115Employ: Retired 21% (102) 53% (259) 13% (62) 14% (70) 492Employ: Unemployed 22% (51) 33% (75) 19% (45) 25% (58) 229Employ: Other 16% (24) 40% (61) 14% (22) 30% (45) 152Military HH: Yes 25% (77) 46% (142) 15% (46) 14% (42) 306Military HH: No 21% (352) 44% (742) 15% (255) 20% (334) 1682RD/WT: Right Direction 34% (191) 38% (217) 9% (50) 19% (109) 567RD/WT: Wrong Track 17% (237) 47% (666) 18% (250) 19% (267) 1421Trump Job Approve 30% (233) 42% (321) 11% (86) 17% (133) 774Trump Job Disapprove 16% (188) 48% (549) 18% (210) 18% (206) 1153
Continued on next page
Page 232
232
Morning ConsultTable POL14_1
Table POL14_1: As you may know, the federal government’s CARES Act provides about $2 trillion to help workers and businesses cope with thecoronavirus pandemic (including the Paycheck Protection Program, which provides funds to businesses with fewer than 500 employees to keep workerson their payroll). In your view, to what degree has the CARES Act helped the following?Small businesses
Demographic Helped a lot Helped a little Did not helpDon’t Know / No
Opinion Total N
Registered Voters 22% (428) 44% (883) 15% (300) 19% (376) 1988Trump Job Strongly Approve 34% (142) 40% (165) 9% (38) 17% (69) 415Trump Job Somewhat Approve 26% (92) 44% (156) 13% (47) 18% (64) 359Trump Job Somewhat Disapprove 23% (53) 41% (93) 12% (28) 23% (52) 226Trump Job Strongly Disapprove 15% (135) 49% (456) 20% (182) 17% (154) 927Favorable of Trump 30% (237) 41% (322) 10% (83) 19% (146) 787Unfavorable of Trump 16% (182) 48% (547) 18% (208) 17% (195) 1132Very Favorable of Trump 34% (158) 40% (185) 10% (44) 16% (75) 462Somewhat Favorable of Trump 24% (79) 42% (137) 12% (38) 22% (71) 325Somewhat Unfavorable of Trump 20% (36) 45% (82) 15% (27) 20% (37) 182Very Unfavorable of Trump 15% (145) 49% (465) 19% (182) 17% (158) 950#1 Issue: Economy 24% (166) 45% (310) 16% (109) 15% (103) 688#1 Issue: Security 33% (84) 37% (95) 7% (19) 22% (56) 254#1 Issue: Health Care 16% (55) 48% (160) 16% (53) 20% (68) 335#1 Issue: Medicare / Social Security 18% (50) 51% (146) 13% (36) 18% (51) 283#1 Issue: Women’s Issues 17% (15) 40% (34) 26% (22) 17% (15) 86#1 Issue: Education 27% (29) 36% (38) 12% (13) 24% (26) 107#1 Issue: Energy 22% (17) 37% (29) 20% (16) 22% (17) 79#1 Issue: Other 8% (12) 46% (72) 21% (32) 26% (40) 1572018 House Vote: Democrat 15% (119) 51% (393) 20% (154) 13% (102) 7672018 House Vote: Republican 29% (182) 46% (286) 11% (68) 15% (93) 6292018 House Vote: Someone else 9% (6) 39% (28) 19% (14) 33% (24) 732016 Vote: Hillary Clinton 16% (112) 52% (363) 19% (131) 13% (94) 7002016 Vote: Donald Trump 29% (195) 43% (289) 12% (83) 16% (108) 6752016 Vote: Other 14% (20) 48% (70) 17% (25) 20% (29) 1442016 Vote: Didn’t Vote 21% (99) 34% (160) 13% (61) 31% (146) 466Voted in 2014: Yes 21% (277) 49% (643) 16% (209) 15% (193) 1322Voted in 2014: No 23% (152) 36% (240) 14% (91) 28% (184) 666
Continued on next page
Page 233
National Tracking Poll #2006102, June, 2020
233
Table POL14_1
Table POL14_1: As you may know, the federal government’s CARES Act provides about $2 trillion to help workers and businesses cope with thecoronavirus pandemic (including the Paycheck Protection Program, which provides funds to businesses with fewer than 500 employees to keep workerson their payroll). In your view, to what degree has the CARES Act helped the following?Small businesses
Demographic Helped a lot Helped a little Did not helpDon’t Know / No
Opinion Total N
Registered Voters 22% (428) 44% (883) 15% (300) 19% (376) 19882012 Vote: Barack Obama 17% (143) 51% (432) 19% (161) 14% (116) 8532012 Vote: Mitt Romney 28% (139) 46% (232) 10% (49) 16% (80) 5012012 Vote: Other 13% (11) 46% (38) 11% (9) 30% (25) 842012 Vote: Didn’t Vote 25% (135) 33% (181) 14% (79) 28% (154) 5504-Region: Northeast 24% (86) 43% (154) 14% (51) 18% (64) 3554-Region: Midwest 20% (93) 43% (196) 14% (66) 22% (101) 4574-Region: South 22% (161) 46% (341) 15% (114) 17% (127) 7424-Region: West 20% (88) 44% (192) 16% (70) 20% (85) 434Party: Democrat/Leans Democrat 17% (158) 49% (443) 18% (166) 16% (143) 911Party: Republican/Leans Republican 29% (215) 43% (319) 11% (80) 17% (127) 741Parents 26% (220) 44% (383) 14% (121) 16% (140) 864Note: Row proportions may total to larger than one-hundred percent due to rounding. For more information visit MorningConsultIntelligence.com.
Page 234
234
Morning ConsultTable POL14_2
Table POL14_2: As you may know, the federal government’s CARES Act provides about $2 trillion to help workers and businesses cope with thecoronavirus pandemic (including the Paycheck Protection Program, which provides funds to businesses with fewer than 500 employees to keep workerson their payroll). In your view, to what degree has the CARES Act helped the following?Large businesses
Demographic Helped a lot Helped a little Did not helpDon’t Know / No
Opinion Total N
Registered Voters 31% (612) 25% (496) 15% (289) 30% (591) 1988Gender: Male 33% (307) 27% (254) 15% (137) 25% (233) 930Gender: Female 29% (306) 23% (243) 14% (152) 34% (358) 1058Age: 18-34 28% (138) 23% (113) 20% (98) 30% (151) 499Age: 35-44 33% (99) 28% (83) 13% (40) 27% (81) 302Age: 45-64 33% (242) 26% (186) 11% (82) 29% (214) 724Age: 65+ 29% (133) 25% (114) 15% (70) 32% (146) 463GenZers: 1997-2012 23% (51) 20% (45) 20% (44) 37% (84) 224Millennials: 1981-1996 31% (132) 27% (113) 17% (72) 25% (103) 419GenXers: 1965-1980 33% (171) 25% (126) 13% (64) 29% (150) 511Baby Boomers: 1946-1964 32% (244) 25% (192) 13% (96) 30% (228) 760PID: Dem (no lean) 38% (287) 23% (172) 14% (107) 25% (191) 757PID: Ind (no lean) 29% (188) 25% (158) 12% (78) 34% (214) 638PID: Rep (no lean) 23% (137) 28% (167) 18% (104) 31% (185) 593PID/Gender: DemMen 41% (133) 22% (74) 13% (44) 24% (78) 329PID/Gender: DemWomen 36% (154) 23% (99) 15% (63) 26% (113) 429PID/Gender: Ind Men 31% (91) 31% (92) 12% (35) 27% (79) 296PID/Gender: Ind Women 28% (97) 19% (66) 13% (44) 40% (136) 342PID/Gender: Rep Men 27% (82) 29% (88) 19% (59) 25% (76) 306PID/Gender: Rep Women 19% (55) 27% (78) 16% (45) 38% (109) 287Ideo: Liberal (1-3) 44% (269) 23% (141) 12% (71) 21% (128) 609Ideo: Moderate (4) 28% (147) 23% (121) 16% (81) 33% (173) 522Ideo: Conservative (5-7) 26% (177) 30% (200) 16% (111) 28% (190) 679Educ: < College 27% (340) 24% (298) 15% (183) 34% (429) 1250Educ: Bachelors degree 34% (161) 27% (127) 14% (65) 25% (117) 470Educ: Post-grad 41% (111) 27% (71) 16% (41) 17% (44) 267Income: Under 50k 29% (285) 22% (224) 13% (132) 36% (358) 998Income: 50k-100k 33% (218) 27% (180) 15% (102) 24% (161) 660Income: 100k+ 33% (109) 28% (92) 17% (55) 22% (72) 329
Continued on next page
Page 235
National Tracking Poll #2006102, June, 2020
235
Table POL14_2
Table POL14_2: As you may know, the federal government’s CARES Act provides about $2 trillion to help workers and businesses cope with thecoronavirus pandemic (including the Paycheck Protection Program, which provides funds to businesses with fewer than 500 employees to keep workerson their payroll). In your view, to what degree has the CARES Act helped the following?Large businesses
Demographic Helped a lot Helped a little Did not helpDon’t Know / No
Opinion Total N
Registered Voters 31% (612) 25% (496) 15% (289) 30% (591) 1988Ethnicity: White 30% (490) 25% (406) 14% (226) 30% (486) 1608Ethnicity: Hispanic 39% (75) 19% (37) 13% (25) 29% (56) 193Ethnicity: Afr. Am. 33% (84) 25% (63) 17% (43) 25% (62) 252Ethnicity: Other 30% (39) 22% (28) 16% (20) 33% (42) 128All Christian 30% (282) 27% (250) 16% (149) 28% (259) 941All Non-Christian 36% (35) 26% (25) 15% (14) 23% (23) 97Atheist 42% (54) 25% (32) 11% (14) 22% (28) 128Agnostic/Nothing in particular 30% (143) 23% (112) 13% (61) 34% (162) 478Something Else 28% (97) 23% (78) 15% (50) 35% (119) 344Religious Non-Protestant/Catholic 38% (45) 27% (32) 13% (16) 22% (26) 120Evangelical 27% (136) 26% (132) 15% (77) 32% (160) 505Non-Evangelical 31% (230) 25% (184) 16% (121) 28% (211) 746Community: Urban 32% (156) 27% (130) 13% (66) 28% (137) 490Community: Suburban 31% (300) 25% (248) 14% (139) 30% (294) 981Community: Rural 30% (155) 23% (118) 16% (84) 31% (160) 517Employ: Private Sector 35% (220) 29% (185) 15% (95) 21% (131) 631Employ: Government 33% (44) 29% (39) 12% (17) 26% (36) 136Employ: Self-Employed 34% (44) 25% (33) 12% (15) 29% (38) 130Employ: Homemaker 28% (32) 21% (25) 6% (6) 45% (52) 115Employ: Retired 30% (148) 24% (118) 15% (74) 31% (151) 492Employ: Unemployed 33% (76) 18% (42) 14% (33) 34% (78) 229Employ: Other 17% (26) 24% (37) 15% (22) 44% (67) 152Military HH: Yes 30% (91) 27% (81) 15% (46) 29% (89) 306Military HH: No 31% (522) 25% (415) 14% (243) 30% (502) 1682RD/WT: Right Direction 24% (137) 30% (168) 16% (90) 30% (172) 567RD/WT: Wrong Track 33% (475) 23% (328) 14% (199) 29% (419) 1421Trump Job Approve 22% (168) 31% (237) 18% (136) 30% (231) 774Trump Job Disapprove 38% (438) 22% (250) 13% (148) 28% (317) 1153
Continued on next page
Page 236
236
Morning ConsultTable POL14_2
Table POL14_2: As you may know, the federal government’s CARES Act provides about $2 trillion to help workers and businesses cope with thecoronavirus pandemic (including the Paycheck Protection Program, which provides funds to businesses with fewer than 500 employees to keep workerson their payroll). In your view, to what degree has the CARES Act helped the following?Large businesses
Demographic Helped a lot Helped a little Did not helpDon’t Know / No
Opinion Total N
Registered Voters 31% (612) 25% (496) 15% (289) 30% (591) 1988Trump Job Strongly Approve 22% (91) 32% (135) 17% (69) 29% (121) 415Trump Job Somewhat Approve 22% (78) 29% (103) 19% (68) 31% (110) 359Trump Job Somewhat Disapprove 25% (57) 29% (66) 14% (32) 31% (71) 226Trump Job Strongly Disapprove 41% (381) 20% (184) 12% (116) 27% (246) 927Favorable of Trump 22% (174) 31% (243) 17% (130) 30% (239) 787Unfavorable of Trump 38% (429) 21% (242) 13% (150) 27% (310) 1132Very Favorable of Trump 23% (104) 32% (150) 17% (78) 28% (130) 462Somewhat Favorable of Trump 21% (70) 29% (93) 16% (53) 34% (109) 325Somewhat Unfavorable of Trump 23% (42) 28% (51) 15% (28) 34% (61) 182Very Unfavorable of Trump 41% (387) 20% (192) 13% (122) 26% (249) 950#1 Issue: Economy 31% (214) 30% (205) 16% (110) 23% (159) 688#1 Issue: Security 21% (53) 27% (68) 15% (38) 37% (95) 254#1 Issue: Health Care 33% (112) 21% (72) 15% (50) 30% (101) 335#1 Issue: Medicare / Social Security 33% (94) 21% (61) 10% (30) 35% (99) 283#1 Issue: Women’s Issues 31% (26) 26% (22) 15% (13) 29% (25) 86#1 Issue: Education 35% (37) 17% (18) 15% (16) 33% (35) 107#1 Issue: Energy 33% (26) 19% (15) 23% (18) 26% (21) 79#1 Issue: Other 32% (50) 23% (36) 10% (15) 35% (55) 1572018 House Vote: Democrat 43% (328) 22% (170) 13% (103) 22% (166) 7672018 House Vote: Republican 25% (156) 31% (196) 16% (101) 28% (176) 6292018 House Vote: Someone else 21% (16) 22% (16) 11% (8) 46% (34) 732016 Vote: Hillary Clinton 42% (291) 23% (162) 13% (94) 22% (154) 7002016 Vote: Donald Trump 24% (163) 30% (204) 16% (110) 29% (198) 6752016 Vote: Other 33% (47) 22% (32) 11% (15) 35% (50) 1442016 Vote: Didn’t Vote 24% (111) 21% (99) 15% (70) 40% (186) 466Voted in 2014: Yes 34% (453) 26% (343) 14% (188) 26% (338) 1322Voted in 2014: No 24% (159) 23% (154) 15% (101) 38% (253) 666
Continued on next page
Page 237
National Tracking Poll #2006102, June, 2020
237
Table POL14_2
Table POL14_2: As you may know, the federal government’s CARES Act provides about $2 trillion to help workers and businesses cope with thecoronavirus pandemic (including the Paycheck Protection Program, which provides funds to businesses with fewer than 500 employees to keep workerson their payroll). In your view, to what degree has the CARES Act helped the following?Large businesses
Demographic Helped a lot Helped a little Did not helpDon’t Know / No
Opinion Total N
Registered Voters 31% (612) 25% (496) 15% (289) 30% (591) 19882012 Vote: Barack Obama 42% (354) 23% (197) 13% (107) 23% (194) 8532012 Vote: Mitt Romney 22% (110) 30% (152) 18% (90) 30% (149) 5012012 Vote: Other 24% (20) 23% (19) 6% (5) 46% (39) 842012 Vote: Didn’t Vote 23% (127) 23% (128) 16% (85) 38% (209) 5504-Region: Northeast 33% (116) 24% (84) 15% (53) 29% (103) 3554-Region: Midwest 28% (129) 25% (115) 15% (69) 31% (143) 4574-Region: South 30% (219) 27% (200) 15% (114) 28% (209) 7424-Region: West 34% (148) 22% (97) 12% (54) 31% (136) 434Party: Democrat/Leans Democrat 40% (361) 22% (198) 14% (127) 25% (226) 911Party: Republican/Leans Republican 23% (167) 30% (220) 17% (127) 31% (227) 741Parents 30% (263) 26% (228) 15% (127) 28% (245) 864Note: Row proportions may total to larger than one-hundred percent due to rounding. For more information visit MorningConsultIntelligence.com.
Page 238
238
Morning ConsultTable POL14_3
Table POL14_3: As you may know, the federal government’s CARES Act provides about $2 trillion to help workers and businesses cope with thecoronavirus pandemic (including the Paycheck Protection Program, which provides funds to businesses with fewer than 500 employees to keep workerson their payroll). In your view, to what degree has the CARES Act helped the following?Banks
Demographic Helped a lot Helped a little Did not helpDon’t Know / No
Opinion Total N
Registered Voters 26% (508) 26% (523) 12% (240) 36% (717) 1988Gender: Male 30% (279) 28% (263) 13% (124) 28% (265) 930Gender: Female 22% (229) 25% (259) 11% (116) 43% (453) 1058Age: 18-34 26% (130) 23% (115) 12% (62) 38% (192) 499Age: 35-44 28% (86) 31% (93) 10% (30) 31% (93) 302Age: 45-64 28% (202) 27% (192) 11% (78) 35% (252) 724Age: 65+ 19% (90) 27% (123) 15% (70) 39% (180) 463GenZers: 1997-2012 26% (58) 18% (39) 14% (31) 43% (96) 224Millennials: 1981-1996 27% (114) 29% (120) 12% (50) 32% (135) 419GenXers: 1965-1980 28% (142) 28% (142) 10% (51) 34% (176) 511Baby Boomers: 1946-1964 24% (181) 27% (206) 13% (98) 36% (274) 760PID: Dem (no lean) 30% (230) 25% (187) 11% (82) 34% (259) 757PID: Ind (no lean) 25% (159) 24% (156) 13% (81) 38% (243) 638PID: Rep (no lean) 20% (120) 30% (180) 13% (77) 36% (215) 593PID/Gender: DemMen 36% (119) 28% (91) 11% (36) 25% (83) 329PID/Gender: DemWomen 26% (111) 22% (96) 11% (46) 41% (177) 429PID/Gender: Ind Men 29% (87) 25% (74) 14% (41) 32% (94) 296PID/Gender: Ind Women 21% (72) 24% (82) 12% (39) 44% (149) 342PID/Gender: Rep Men 24% (73) 32% (98) 15% (46) 29% (88) 306PID/Gender: Rep Women 16% (47) 28% (82) 11% (31) 44% (127) 287Ideo: Liberal (1-3) 36% (216) 25% (153) 8% (51) 31% (188) 609Ideo: Moderate (4) 25% (129) 28% (145) 13% (68) 35% (180) 522Ideo: Conservative (5-7) 21% (142) 29% (197) 15% (102) 35% (237) 679Educ: < College 23% (285) 26% (320) 12% (148) 40% (498) 1250Educ: Bachelors degree 27% (125) 28% (131) 13% (61) 33% (153) 470Educ: Post-grad 37% (98) 27% (72) 12% (31) 25% (67) 267Income: Under 50k 23% (232) 25% (250) 10% (103) 41% (414) 998Income: 50k-100k 28% (187) 28% (184) 12% (80) 32% (209) 660Income: 100k+ 27% (89) 27% (89) 17% (57) 29% (95) 329
Continued on next page
Page 239
National Tracking Poll #2006102, June, 2020
239
Table POL14_3
Table POL14_3: As you may know, the federal government’s CARES Act provides about $2 trillion to help workers and businesses cope with thecoronavirus pandemic (including the Paycheck Protection Program, which provides funds to businesses with fewer than 500 employees to keep workerson their payroll). In your view, to what degree has the CARES Act helped the following?Banks
Demographic Helped a lot Helped a little Did not helpDon’t Know / No
Opinion Total N
Registered Voters 26% (508) 26% (523) 12% (240) 36% (717) 1988Ethnicity: White 25% (396) 26% (422) 12% (185) 38% (604) 1608Ethnicity: Hispanic 32% (62) 25% (48) 7% (13) 36% (69) 193Ethnicity: Afr. Am. 35% (87) 26% (67) 14% (35) 25% (64) 252Ethnicity: Other 20% (25) 26% (34) 15% (20) 39% (50) 128All Christian 23% (217) 29% (277) 13% (122) 35% (325) 941All Non-Christian 33% (32) 28% (27) 12% (12) 27% (26) 97Atheist 37% (47) 22% (28) 12% (15) 29% (37) 128Agnostic/Nothing in particular 26% (125) 23% (112) 10% (48) 40% (193) 478Something Else 25% (87) 23% (78) 13% (43) 39% (136) 344Religious Non-Protestant/Catholic 30% (36) 28% (34) 13% (16) 28% (34) 120Evangelical 21% (105) 31% (158) 13% (67) 35% (175) 505Non-Evangelical 26% (192) 25% (188) 12% (92) 37% (273) 746Community: Urban 30% (147) 28% (139) 8% (40) 33% (163) 490Community: Suburban 25% (244) 25% (246) 14% (134) 36% (358) 981Community: Rural 23% (117) 27% (138) 13% (66) 38% (197) 517Employ: Private Sector 30% (189) 30% (187) 12% (76) 28% (178) 631Employ: Government 30% (40) 28% (38) 15% (20) 27% (37) 136Employ: Self-Employed 30% (39) 25% (33) 12% (16) 32% (42) 130Employ: Homemaker 25% (29) 17% (19) 4% (5) 54% (62) 115Employ: Retired 22% (108) 25% (125) 14% (70) 38% (189) 492Employ: Unemployed 27% (62) 23% (53) 9% (20) 41% (94) 229Employ: Other 14% (22) 28% (43) 13% (20) 45% (68) 152Military HH: Yes 25% (76) 30% (93) 12% (36) 33% (102) 306Military HH: No 26% (432) 26% (430) 12% (204) 37% (615) 1682RD/WT: Right Direction 23% (128) 29% (162) 14% (79) 35% (198) 567RD/WT: Wrong Track 27% (380) 25% (360) 11% (161) 37% (519) 1421Trump Job Approve 20% (158) 31% (237) 14% (108) 35% (270) 774Trump Job Disapprove 30% (343) 24% (281) 11% (127) 35% (403) 1153
Continued on next page
Page 240
240
Morning ConsultTable POL14_3
Table POL14_3: As you may know, the federal government’s CARES Act provides about $2 trillion to help workers and businesses cope with thecoronavirus pandemic (including the Paycheck Protection Program, which provides funds to businesses with fewer than 500 employees to keep workerson their payroll). In your view, to what degree has the CARES Act helped the following?Banks
Demographic Helped a lot Helped a little Did not helpDon’t Know / No
Opinion Total N
Registered Voters 26% (508) 26% (523) 12% (240) 36% (717) 1988Trump Job Strongly Approve 22% (92) 28% (114) 15% (61) 35% (147) 415Trump Job Somewhat Approve 18% (66) 34% (122) 13% (47) 34% (123) 359Trump Job Somewhat Disapprove 23% (51) 29% (66) 12% (27) 36% (82) 226Trump Job Strongly Disapprove 31% (292) 23% (214) 11% (100) 35% (321) 927Favorable of Trump 21% (166) 29% (232) 15% (114) 35% (275) 787Unfavorable of Trump 29% (332) 25% (281) 11% (123) 35% (396) 1132Very Favorable of Trump 23% (106) 29% (134) 14% (64) 34% (158) 462Somewhat Favorable of Trump 18% (60) 30% (98) 16% (51) 36% (117) 325Somewhat Unfavorable of Trump 22% (41) 27% (50) 13% (23) 38% (68) 182Very Unfavorable of Trump 31% (291) 24% (232) 11% (100) 34% (327) 950#1 Issue: Economy 28% (195) 28% (191) 14% (95) 30% (207) 688#1 Issue: Security 20% (50) 27% (67) 11% (29) 43% (108) 254#1 Issue: Health Care 26% (87) 28% (95) 11% (38) 34% (114) 335#1 Issue: Medicare / Social Security 22% (63) 26% (73) 12% (33) 41% (115) 283#1 Issue: Women’s Issues 23% (20) 25% (22) 11% (9) 41% (35) 86#1 Issue: Education 29% (31) 21% (22) 13% (14) 37% (40) 107#1 Issue: Energy 26% (21) 26% (21) 11% (9) 37% (29) 79#1 Issue: Other 26% (41) 20% (32) 9% (14) 45% (70) 1572018 House Vote: Democrat 32% (247) 27% (207) 11% (81) 30% (232) 7672018 House Vote: Republican 21% (133) 31% (196) 14% (90) 33% (210) 6292018 House Vote: Someone else 22% (16) 18% (13) 19% (14) 40% (30) 732016 Vote: Hillary Clinton 32% (225) 27% (189) 10% (69) 31% (217) 7002016 Vote: Donald Trump 21% (139) 32% (216) 14% (97) 33% (223) 6752016 Vote: Other 27% (39) 22% (31) 12% (18) 40% (57) 1442016 Vote: Didn’t Vote 23% (106) 18% (86) 12% (56) 47% (218) 466Voted in 2014: Yes 27% (357) 28% (365) 13% (172) 32% (428) 1322Voted in 2014: No 23% (151) 24% (158) 10% (68) 43% (289) 666
Continued on next page
Page 241
National Tracking Poll #2006102, June, 2020
241
Table POL14_3
Table POL14_3: As you may know, the federal government’s CARES Act provides about $2 trillion to help workers and businesses cope with thecoronavirus pandemic (including the Paycheck Protection Program, which provides funds to businesses with fewer than 500 employees to keep workerson their payroll). In your view, to what degree has the CARES Act helped the following?Banks
Demographic Helped a lot Helped a little Did not helpDon’t Know / No
Opinion Total N
Registered Voters 26% (508) 26% (523) 12% (240) 36% (717) 19882012 Vote: Barack Obama 31% (269) 26% (219) 11% (95) 32% (270) 8532012 Vote: Mitt Romney 17% (83) 32% (162) 16% (82) 35% (173) 5012012 Vote: Other 27% (23) 19% (16) 5% (5) 48% (41) 842012 Vote: Didn’t Vote 24% (133) 23% (126) 10% (57) 43% (234) 5504-Region: Northeast 33% (117) 21% (74) 12% (44) 34% (120) 3554-Region: Midwest 23% (105) 25% (116) 12% (56) 39% (180) 4574-Region: South 24% (177) 30% (224) 13% (97) 33% (244) 7424-Region: West 25% (109) 25% (109) 10% (43) 40% (173) 434Party: Democrat/Leans Democrat 31% (287) 25% (224) 11% (99) 33% (302) 911Party: Republican/Leans Republican 20% (148) 30% (225) 14% (103) 36% (265) 741Parents 26% (222) 28% (241) 14% (120) 33% (281) 864Note: Row proportions may total to larger than one-hundred percent due to rounding. For more information visit MorningConsultIntelligence.com.
Page 242
242
Morning ConsultTable POL14_4
Table POL14_4: As you may know, the federal government’s CARES Act provides about $2 trillion to help workers and businesses cope with thecoronavirus pandemic (including the Paycheck Protection Program, which provides funds to businesses with fewer than 500 employees to keep workerson their payroll). In your view, to what degree has the CARES Act helped the following?The U.S. economy
Demographic Helped a lot Helped a little Did not helpDon’t Know / No
Opinion Total N
Registered Voters 16% (317) 47% (930) 18% (349) 20% (392) 1988Gender: Male 19% (175) 49% (457) 15% (144) 17% (155) 930Gender: Female 13% (142) 45% (474) 19% (205) 22% (237) 1058Age: 18-34 18% (90) 38% (191) 17% (84) 27% (135) 499Age: 35-44 18% (55) 50% (152) 15% (45) 16% (49) 302Age: 45-64 17% (120) 46% (335) 20% (148) 17% (120) 724Age: 65+ 11% (52) 54% (252) 15% (71) 19% (87) 463GenZers: 1997-2012 18% (40) 32% (72) 16% (35) 35% (77) 224Millennials: 1981-1996 17% (73) 47% (197) 16% (68) 19% (81) 419GenXers: 1965-1980 18% (93) 45% (229) 21% (107) 16% (82) 511Baby Boomers: 1946-1964 14% (105) 52% (394) 17% (130) 17% (132) 760PID: Dem (no lean) 14% (103) 49% (368) 19% (143) 19% (143) 757PID: Ind (no lean) 12% (79) 45% (288) 20% (125) 23% (145) 638PID: Rep (no lean) 23% (135) 46% (274) 14% (80) 17% (103) 593PID/Gender: DemMen 18% (58) 51% (169) 14% (45) 17% (57) 329PID/Gender: DemWomen 11% (45) 46% (199) 23% (98) 20% (87) 429PID/Gender: Ind Men 14% (43) 48% (144) 18% (53) 19% (57) 296PID/Gender: Ind Women 11% (36) 42% (145) 21% (72) 26% (89) 342PID/Gender: Rep Men 24% (75) 47% (144) 15% (46) 14% (42) 306PID/Gender: Rep Women 21% (60) 45% (130) 12% (35) 21% (62) 287Ideo: Liberal (1-3) 15% (94) 49% (297) 20% (122) 16% (96) 609Ideo: Moderate (4) 11% (58) 50% (262) 18% (96) 20% (106) 522Ideo: Conservative (5-7) 21% (141) 48% (323) 16% (106) 16% (109) 679Educ: < College 17% (207) 42% (528) 18% (225) 23% (291) 1250Educ: Bachelors degree 14% (67) 54% (253) 17% (82) 15% (69) 470Educ: Post-grad 16% (43) 56% (150) 16% (42) 12% (31) 267Income: Under 50k 16% (160) 42% (417) 18% (176) 25% (246) 998Income: 50k-100k 15% (100) 53% (348) 17% (112) 15% (100) 660Income: 100k+ 17% (57) 50% (166) 18% (61) 14% (45) 329
Continued on next page
Page 243
National Tracking Poll #2006102, June, 2020
243
Table POL14_4
Table POL14_4: As you may know, the federal government’s CARES Act provides about $2 trillion to help workers and businesses cope with thecoronavirus pandemic (including the Paycheck Protection Program, which provides funds to businesses with fewer than 500 employees to keep workerson their payroll). In your view, to what degree has the CARES Act helped the following?The U.S. economy
Demographic Helped a lot Helped a little Did not helpDon’t Know / No
Opinion Total N
Registered Voters 16% (317) 47% (930) 18% (349) 20% (392) 1988Ethnicity: White 16% (252) 48% (771) 17% (279) 19% (306) 1608Ethnicity: Hispanic 24% (46) 36% (70) 16% (31) 24% (46) 193Ethnicity: Afr. Am. 18% (44) 45% (114) 19% (47) 19% (47) 252Ethnicity: Other 16% (21) 36% (46) 18% (23) 30% (39) 128All Christian 17% (161) 50% (472) 15% (146) 17% (161) 941All Non-Christian 19% (19) 51% (50) 15% (15) 15% (15) 97Atheist 10% (13) 43% (54) 31% (39) 17% (22) 128Agnostic/Nothing in particular 13% (61) 44% (208) 20% (94) 24% (115) 478Something Else 18% (63) 42% (146) 16% (56) 23% (79) 344Religious Non-Protestant/Catholic 18% (22) 49% (58) 16% (19) 17% (20) 120Evangelical 22% (112) 47% (237) 12% (61) 19% (95) 505Non-Evangelical 14% (106) 49% (366) 18% (135) 19% (139) 746Community: Urban 17% (83) 44% (217) 16% (79) 22% (110) 490Community: Suburban 15% (144) 49% (485) 18% (174) 18% (178) 981Community: Rural 17% (90) 44% (228) 18% (96) 20% (104) 517Employ: Private Sector 19% (117) 48% (302) 21% (131) 13% (81) 631Employ: Government 17% (24) 51% (69) 19% (26) 12% (17) 136Employ: Self-Employed 18% (23) 48% (63) 14% (18) 20% (26) 130Employ: Homemaker 15% (17) 34% (40) 20% (23) 30% (35) 115Employ: Retired 13% (66) 52% (258) 15% (75) 19% (92) 492Employ: Unemployed 16% (36) 41% (94) 17% (39) 26% (61) 229Employ: Other 13% (19) 44% (67) 13% (20) 30% (46) 152Military HH: Yes 16% (50) 53% (161) 14% (44) 17% (51) 306Military HH: No 16% (267) 46% (770) 18% (304) 20% (341) 1682RD/WT: Right Direction 26% (145) 45% (258) 11% (60) 19% (105) 567RD/WT: Wrong Track 12% (172) 47% (673) 20% (289) 20% (287) 1421Trump Job Approve 22% (173) 47% (363) 14% (107) 17% (131) 774Trump Job Disapprove 12% (141) 48% (555) 20% (233) 19% (224) 1153
Continued on next page
Page 244
244
Morning ConsultTable POL14_4
Table POL14_4: As you may know, the federal government’s CARES Act provides about $2 trillion to help workers and businesses cope with thecoronavirus pandemic (including the Paycheck Protection Program, which provides funds to businesses with fewer than 500 employees to keep workerson their payroll). In your view, to what degree has the CARES Act helped the following?The U.S. economy
Demographic Helped a lot Helped a little Did not helpDon’t Know / No
Opinion Total N
Registered Voters 16% (317) 47% (930) 18% (349) 20% (392) 1988Trump Job Strongly Approve 28% (116) 42% (175) 12% (49) 18% (75) 415Trump Job Somewhat Approve 16% (57) 52% (188) 16% (58) 16% (56) 359Trump Job Somewhat Disapprove 17% (38) 43% (98) 16% (36) 24% (54) 226Trump Job Strongly Disapprove 11% (103) 49% (457) 21% (197) 18% (170) 927Favorable of Trump 23% (178) 46% (360) 15% (115) 17% (134) 787Unfavorable of Trump 12% (134) 49% (557) 20% (227) 19% (214) 1132Very Favorable of Trump 26% (121) 43% (199) 13% (58) 18% (84) 462Somewhat Favorable of Trump 17% (56) 50% (162) 17% (56) 15% (50) 325Somewhat Unfavorable of Trump 12% (21) 48% (88) 15% (26) 25% (46) 182Very Unfavorable of Trump 12% (113) 49% (469) 21% (200) 18% (168) 950#1 Issue: Economy 19% (127) 48% (332) 19% (130) 14% (99) 688#1 Issue: Security 25% (64) 38% (98) 13% (32) 24% (60) 254#1 Issue: Health Care 12% (41) 49% (164) 19% (65) 20% (65) 335#1 Issue: Medicare / Social Security 10% (28) 50% (141) 17% (49) 23% (66) 283#1 Issue: Women’s Issues 12% (11) 44% (38) 19% (16) 25% (22) 86#1 Issue: Education 14% (15) 47% (50) 16% (17) 23% (25) 107#1 Issue: Energy 19% (15) 40% (32) 23% (18) 18% (14) 79#1 Issue: Other 11% (17) 49% (77) 14% (22) 27% (42) 1572018 House Vote: Democrat 11% (86) 51% (394) 22% (166) 16% (121) 7672018 House Vote: Republican 22% (139) 48% (304) 14% (91) 15% (94) 6292018 House Vote: Someone else 7% (5) 40% (29) 18% (13) 34% (25) 732016 Vote: Hillary Clinton 12% (81) 53% (368) 21% (144) 15% (108) 7002016 Vote: Donald Trump 22% (145) 48% (324) 14% (97) 16% (109) 6752016 Vote: Other 9% (13) 49% (71) 22% (32) 20% (29) 1442016 Vote: Didn’t Vote 16% (76) 36% (167) 16% (76) 31% (146) 466Voted in 2014: Yes 16% (209) 50% (662) 18% (234) 16% (216) 1322Voted in 2014: No 16% (108) 40% (268) 17% (115) 26% (175) 666
Continued on next page
Page 245
National Tracking Poll #2006102, June, 2020
245
Table POL14_4
Table POL14_4: As you may know, the federal government’s CARES Act provides about $2 trillion to help workers and businesses cope with thecoronavirus pandemic (including the Paycheck Protection Program, which provides funds to businesses with fewer than 500 employees to keep workerson their payroll). In your view, to what degree has the CARES Act helped the following?The U.S. economy
Demographic Helped a lot Helped a little Did not helpDon’t Know / No
Opinion Total N
Registered Voters 16% (317) 47% (930) 18% (349) 20% (392) 19882012 Vote: Barack Obama 13% (112) 50% (431) 21% (180) 15% (131) 8532012 Vote: Mitt Romney 20% (99) 51% (254) 14% (69) 16% (79) 5012012 Vote: Other 14% (12) 39% (32) 13% (11) 34% (28) 842012 Vote: Didn’t Vote 17% (95) 39% (212) 16% (88) 28% (154) 5504-Region: Northeast 16% (56) 45% (158) 20% (72) 19% (68) 3554-Region: Midwest 15% (70) 48% (218) 15% (70) 22% (100) 4574-Region: South 17% (128) 48% (354) 17% (130) 18% (131) 7424-Region: West 15% (64) 46% (201) 18% (77) 21% (93) 434Party: Democrat/Leans Democrat 14% (124) 49% (449) 19% (173) 18% (165) 911Party: Republican/Leans Republican 21% (156) 47% (350) 15% (111) 17% (124) 741Parents 17% (150) 49% (422) 16% (140) 18% (152) 864Note: Row proportions may total to larger than one-hundred percent due to rounding. For more information visit MorningConsultIntelligence.com.
Page 246
246
Morning ConsultTable POL14_5
Table POL14_5: As you may know, the federal government’s CARES Act provides about $2 trillion to help workers and businesses cope with thecoronavirus pandemic (including the Paycheck Protection Program, which provides funds to businesses with fewer than 500 employees to keep workerson their payroll). In your view, to what degree has the CARES Act helped the following?Low-income Americans
Demographic Helped a lot Helped a little Did not helpDon’t Know / No
Opinion Total N
Registered Voters 24% (469) 40% (802) 17% (344) 19% (373) 1988Gender: Male 26% (241) 39% (366) 18% (169) 17% (154) 930Gender: Female 22% (228) 41% (436) 17% (175) 21% (218) 1058Age: 18-34 26% (128) 34% (168) 17% (86) 23% (117) 499Age: 35-44 26% (78) 40% (121) 19% (56) 16% (48) 302Age: 45-64 23% (166) 41% (295) 18% (132) 18% (130) 724Age: 65+ 21% (98) 47% (218) 15% (69) 17% (77) 463GenZers: 1997-2012 24% (53) 32% (72) 17% (37) 27% (61) 224Millennials: 1981-1996 26% (110) 38% (160) 17% (73) 18% (77) 419GenXers: 1965-1980 25% (129) 37% (190) 19% (97) 19% (96) 511Baby Boomers: 1946-1964 21% (160) 45% (343) 18% (134) 16% (124) 760PID: Dem (no lean) 20% (153) 42% (315) 22% (170) 16% (119) 757PID: Ind (no lean) 20% (126) 40% (255) 18% (112) 23% (144) 638PID: Rep (no lean) 32% (190) 39% (231) 11% (62) 18% (109) 593PID/Gender: DemMen 22% (73) 40% (132) 22% (74) 15% (49) 329PID/Gender: DemWomen 18% (79) 43% (183) 22% (96) 16% (70) 429PID/Gender: Ind Men 23% (68) 39% (115) 19% (56) 20% (58) 296PID/Gender: Ind Women 17% (59) 41% (141) 16% (56) 25% (86) 342PID/Gender: Rep Men 33% (100) 39% (119) 13% (39) 16% (48) 306PID/Gender: Rep Women 31% (90) 39% (112) 8% (23) 22% (62) 287Ideo: Liberal (1-3) 18% (108) 43% (263) 26% (159) 13% (79) 609Ideo: Moderate (4) 23% (118) 40% (210) 17% (91) 20% (104) 522Ideo: Conservative (5-7) 32% (218) 41% (280) 10% (69) 16% (112) 679Educ: < College 24% (301) 38% (480) 16% (196) 22% (274) 1250Educ: Bachelors degree 24% (113) 41% (195) 19% (91) 15% (71) 470Educ: Post-grad 21% (56) 47% (127) 21% (57) 10% (28) 267Income: Under 50k 24% (241) 38% (376) 17% (168) 21% (213) 998Income: 50k-100k 22% (147) 42% (280) 19% (128) 16% (106) 660Income: 100k+ 25% (81) 44% (146) 15% (49) 16% (53) 329
Continued on next page
Page 247
National Tracking Poll #2006102, June, 2020
247
Table POL14_5
Table POL14_5: As you may know, the federal government’s CARES Act provides about $2 trillion to help workers and businesses cope with thecoronavirus pandemic (including the Paycheck Protection Program, which provides funds to businesses with fewer than 500 employees to keep workerson their payroll). In your view, to what degree has the CARES Act helped the following?Low-income Americans
Demographic Helped a lot Helped a little Did not helpDon’t Know / No
Opinion Total N
Registered Voters 24% (469) 40% (802) 17% (344) 19% (373) 1988Ethnicity: White 23% (377) 41% (661) 16% (257) 19% (312) 1608Ethnicity: Hispanic 26% (50) 35% (66) 21% (41) 18% (35) 193Ethnicity: Afr. Am. 23% (57) 39% (99) 25% (63) 13% (33) 252Ethnicity: Other 27% (35) 32% (41) 19% (24) 22% (28) 128All Christian 25% (239) 44% (415) 14% (127) 17% (159) 941All Non-Christian 26% (26) 41% (40) 24% (24) 8% (8) 97Atheist 18% (23) 45% (58) 26% (33) 11% (14) 128Agnostic/Nothing in particular 21% (100) 35% (166) 19% (89) 26% (123) 478Something Else 24% (81) 36% (123) 21% (71) 20% (68) 344Religious Non-Protestant/Catholic 26% (32) 41% (50) 22% (26) 10% (13) 120Evangelical 28% (139) 41% (205) 14% (70) 18% (90) 505Non-Evangelical 23% (172) 43% (319) 17% (125) 17% (130) 746Community: Urban 26% (128) 38% (185) 19% (92) 17% (85) 490Community: Suburban 21% (209) 43% (420) 17% (163) 19% (189) 981Community: Rural 26% (132) 38% (197) 17% (89) 19% (99) 517Employ: Private Sector 26% (166) 38% (241) 21% (134) 14% (90) 631Employ: Government 22% (30) 45% (61) 18% (24) 16% (21) 136Employ: Self-Employed 20% (26) 41% (54) 20% (25) 19% (25) 130Employ: Homemaker 23% (26) 33% (38) 16% (19) 28% (32) 115Employ: Retired 23% (115) 45% (223) 14% (67) 18% (87) 492Employ: Unemployed 23% (52) 38% (86) 19% (43) 21% (48) 229Employ: Other 19% (29) 39% (60) 14% (21) 28% (42) 152Military HH: Yes 26% (79) 42% (129) 15% (45) 17% (53) 306Military HH: No 23% (390) 40% (672) 18% (299) 19% (320) 1682RD/WT: Right Direction 35% (197) 37% (211) 9% (53) 19% (106) 567RD/WT: Wrong Track 19% (272) 42% (591) 20% (291) 19% (267) 1421Trump Job Approve 33% (258) 39% (301) 9% (71) 18% (143) 774Trump Job Disapprove 17% (200) 43% (495) 23% (266) 17% (192) 1153
Continued on next page
Page 248
248
Morning ConsultTable POL14_5
Table POL14_5: As you may know, the federal government’s CARES Act provides about $2 trillion to help workers and businesses cope with thecoronavirus pandemic (including the Paycheck Protection Program, which provides funds to businesses with fewer than 500 employees to keep workerson their payroll). In your view, to what degree has the CARES Act helped the following?Low-income Americans
Demographic Helped a lot Helped a little Did not helpDon’t Know / No
Opinion Total N
Registered Voters 24% (469) 40% (802) 17% (344) 19% (373) 1988Trump Job Strongly Approve 39% (164) 34% (142) 7% (29) 19% (79) 415Trump Job Somewhat Approve 26% (94) 44% (159) 12% (42) 18% (64) 359Trump Job Somewhat Disapprove 27% (61) 39% (89) 13% (30) 20% (46) 226Trump Job Strongly Disapprove 15% (139) 44% (406) 25% (236) 16% (146) 927Favorable of Trump 34% (264) 39% (304) 9% (73) 19% (146) 787Unfavorable of Trump 17% (195) 43% (489) 23% (263) 16% (185) 1132Very Favorable of Trump 38% (177) 37% (169) 8% (35) 17% (80) 462Somewhat Favorable of Trump 27% (87) 41% (135) 12% (37) 20% (66) 325Somewhat Unfavorable of Trump 24% (43) 42% (76) 13% (23) 22% (40) 182Very Unfavorable of Trump 16% (152) 43% (413) 25% (241) 15% (145) 950#1 Issue: Economy 28% (192) 43% (296) 16% (110) 13% (89) 688#1 Issue: Security 30% (76) 36% (92) 9% (23) 25% (63) 254#1 Issue: Health Care 19% (65) 41% (137) 20% (66) 20% (67) 335#1 Issue: Medicare / Social Security 20% (55) 42% (120) 17% (48) 21% (60) 283#1 Issue: Women’s Issues 15% (13) 41% (36) 20% (17) 24% (20) 86#1 Issue: Education 19% (21) 36% (39) 21% (23) 23% (25) 107#1 Issue: Energy 28% (22) 27% (21) 27% (21) 18% (14) 79#1 Issue: Other 16% (25) 39% (61) 23% (36) 22% (34) 1572018 House Vote: Democrat 17% (131) 44% (340) 25% (193) 14% (104) 7672018 House Vote: Republican 32% (199) 42% (264) 10% (61) 17% (105) 6292018 House Vote: Someone else 12% (9) 36% (26) 21% (16) 30% (22) 732016 Vote: Hillary Clinton 17% (120) 46% (320) 24% (171) 13% (90) 7002016 Vote: Donald Trump 32% (216) 40% (273) 10% (67) 18% (119) 6752016 Vote: Other 16% (24) 40% (58) 24% (34) 19% (28) 1442016 Vote: Didn’t Vote 24% (110) 32% (151) 15% (71) 29% (134) 466Voted in 2014: Yes 22% (297) 43% (570) 19% (250) 15% (205) 1322Voted in 2014: No 26% (173) 35% (232) 14% (94) 25% (168) 666
Continued on next page
Page 249
National Tracking Poll #2006102, June, 2020
249
Table POL14_5
Table POL14_5: As you may know, the federal government’s CARES Act provides about $2 trillion to help workers and businesses cope with thecoronavirus pandemic (including the Paycheck Protection Program, which provides funds to businesses with fewer than 500 employees to keep workerson their payroll). In your view, to what degree has the CARES Act helped the following?Low-income Americans
Demographic Helped a lot Helped a little Did not helpDon’t Know / No
Opinion Total N
Registered Voters 24% (469) 40% (802) 17% (344) 19% (373) 19882012 Vote: Barack Obama 18% (154) 44% (375) 25% (210) 13% (114) 8532012 Vote: Mitt Romney 30% (152) 44% (222) 8% (40) 17% (87) 5012012 Vote: Other 23% (19) 33% (27) 15% (12) 30% (25) 842012 Vote: Didn’t Vote 26% (144) 32% (177) 15% (82) 27% (147) 5504-Region: Northeast 27% (95) 41% (144) 15% (55) 17% (60) 3554-Region: Midwest 19% (86) 43% (197) 16% (74) 22% (98) 4574-Region: South 26% (193) 40% (295) 17% (125) 17% (130) 7424-Region: West 22% (95) 38% (165) 21% (90) 19% (84) 434Party: Democrat/Leans Democrat 19% (176) 42% (386) 23% (209) 15% (140) 911Party: Republican/Leans Republican 31% (233) 39% (290) 11% (81) 18% (137) 741Parents 26% (226) 41% (356) 16% (140) 16% (141) 864Note: Row proportions may total to larger than one-hundred percent due to rounding. For more information visit MorningConsultIntelligence.com.
Page 250
250
Morning ConsultTable POL14_6
Table POL14_6: As you may know, the federal government’s CARES Act provides about $2 trillion to help workers and businesses cope with thecoronavirus pandemic (including the Paycheck Protection Program, which provides funds to businesses with fewer than 500 employees to keep workerson their payroll). In your view, to what degree has the CARES Act helped the following?Middle-income Americans
Demographic Helped a lot Helped a little Did not helpDon’t Know / No
Opinion Total N
Registered Voters 18% (352) 48% (963) 14% (279) 20% (394) 1988Gender: Male 20% (191) 49% (455) 14% (126) 17% (159) 930Gender: Female 15% (161) 48% (508) 14% (153) 22% (235) 1058Age: 18-34 20% (102) 40% (201) 14% (71) 25% (126) 499Age: 35-44 21% (62) 46% (138) 14% (43) 19% (58) 302Age: 45-64 18% (133) 47% (343) 16% (113) 19% (135) 724Age: 65+ 12% (55) 61% (281) 11% (52) 16% (74) 463GenZers: 1997-2012 17% (39) 36% (81) 15% (33) 32% (71) 224Millennials: 1981-1996 23% (95) 43% (182) 15% (63) 19% (80) 419GenXers: 1965-1980 18% (93) 47% (239) 16% (80) 19% (100) 511Baby Boomers: 1946-1964 15% (115) 55% (418) 13% (98) 17% (130) 760PID: Dem (no lean) 17% (126) 49% (374) 16% (120) 18% (138) 757PID: Ind (no lean) 14% (88) 48% (307) 14% (90) 24% (152) 638PID: Rep (no lean) 23% (138) 48% (282) 12% (69) 17% (104) 593PID/Gender: DemMen 21% (68) 47% (153) 16% (52) 17% (56) 329PID/Gender: DemWomen 14% (58) 51% (221) 16% (68) 19% (82) 429PID/Gender: Ind Men 14% (41) 51% (151) 14% (43) 21% (61) 296PID/Gender: Ind Women 14% (47) 46% (157) 14% (48) 27% (91) 342PID/Gender: Rep Men 27% (81) 49% (151) 10% (32) 14% (42) 306PID/Gender: Rep Women 20% (56) 46% (131) 13% (37) 22% (62) 287Ideo: Liberal (1-3) 17% (104) 51% (311) 17% (102) 15% (92) 609Ideo: Moderate (4) 15% (79) 48% (253) 16% (82) 21% (108) 522Ideo: Conservative (5-7) 23% (156) 50% (343) 11% (73) 16% (109) 679Educ: < College 18% (230) 45% (563) 13% (167) 23% (290) 1250Educ: Bachelors degree 16% (74) 54% (253) 15% (71) 15% (73) 470Educ: Post-grad 18% (48) 55% (147) 15% (41) 12% (31) 267Income: Under 50k 18% (179) 44% (442) 14% (138) 24% (239) 998Income: 50k-100k 18% (121) 52% (344) 14% (92) 16% (104) 660Income: 100k+ 16% (52) 54% (178) 15% (49) 16% (51) 329
Continued on next page
Page 251
National Tracking Poll #2006102, June, 2020
251
Table POL14_6
Table POL14_6: As you may know, the federal government’s CARES Act provides about $2 trillion to help workers and businesses cope with thecoronavirus pandemic (including the Paycheck Protection Program, which provides funds to businesses with fewer than 500 employees to keep workerson their payroll). In your view, to what degree has the CARES Act helped the following?Middle-income Americans
Demographic Helped a lot Helped a little Did not helpDon’t Know / No
Opinion Total N
Registered Voters 18% (352) 48% (963) 14% (279) 20% (394) 1988Ethnicity: White 18% (283) 50% (804) 13% (211) 19% (310) 1608Ethnicity: Hispanic 24% (47) 38% (74) 17% (33) 20% (39) 193Ethnicity: Afr. Am. 18% (44) 44% (110) 19% (48) 20% (50) 252Ethnicity: Other 19% (24) 39% (50) 16% (20) 26% (34) 128All Christian 19% (182) 52% (486) 12% (115) 17% (158) 941All Non-Christian 21% (20) 55% (54) 15% (14) 10% (9) 97Atheist 14% (17) 56% (72) 19% (24) 11% (14) 128Agnostic/Nothing in particular 14% (69) 43% (207) 15% (73) 27% (129) 478Something Else 18% (64) 42% (144) 15% (52) 24% (84) 344Religious Non-Protestant/Catholic 22% (26) 55% (66) 14% (16) 9% (11) 120Evangelical 22% (109) 48% (241) 11% (56) 20% (99) 505Non-Evangelical 17% (127) 50% (372) 15% (110) 18% (138) 746Community: Urban 19% (92) 47% (233) 13% (64) 21% (101) 490Community: Suburban 17% (167) 49% (482) 15% (145) 19% (186) 981Community: Rural 18% (93) 48% (249) 13% (69) 21% (106) 517Employ: Private Sector 21% (131) 49% (307) 16% (103) 14% (90) 631Employ: Government 21% (28) 47% (64) 18% (25) 14% (19) 136Employ: Self-Employed 12% (16) 44% (57) 19% (24) 25% (33) 130Employ: Homemaker 20% (23) 34% (40) 16% (19) 30% (34) 115Employ: Retired 16% (77) 58% (283) 10% (48) 17% (83) 492Employ: Unemployed 16% (36) 47% (107) 15% (34) 22% (52) 229Employ: Other 14% (21) 43% (65) 10% (16) 33% (51) 152Military HH: Yes 20% (62) 52% (158) 13% (39) 16% (48) 306Military HH: No 17% (290) 48% (805) 14% (240) 21% (346) 1682RD/WT: Right Direction 26% (150) 45% (255) 10% (58) 18% (104) 567RD/WT: Wrong Track 14% (202) 50% (708) 16% (221) 20% (289) 1421Trump Job Approve 24% (185) 48% (367) 11% (83) 18% (138) 774Trump Job Disapprove 14% (163) 51% (585) 16% (190) 19% (216) 1153
Continued on next page
Page 252
252
Morning ConsultTable POL14_6
Table POL14_6: As you may know, the federal government’s CARES Act provides about $2 trillion to help workers and businesses cope with thecoronavirus pandemic (including the Paycheck Protection Program, which provides funds to businesses with fewer than 500 employees to keep workerson their payroll). In your view, to what degree has the CARES Act helped the following?Middle-income Americans
Demographic Helped a lot Helped a little Did not helpDon’t Know / No
Opinion Total N
Registered Voters 18% (352) 48% (963) 14% (279) 20% (394) 1988Trump Job Strongly Approve 31% (128) 41% (171) 10% (40) 18% (76) 415Trump Job Somewhat Approve 16% (57) 55% (197) 12% (44) 17% (62) 359Trump Job Somewhat Disapprove 17% (38) 49% (110) 14% (32) 20% (46) 226Trump Job Strongly Disapprove 13% (124) 51% (475) 17% (158) 18% (170) 927Favorable of Trump 23% (182) 48% (376) 11% (87) 18% (141) 787Unfavorable of Trump 14% (161) 51% (573) 16% (185) 19% (213) 1132Very Favorable of Trump 28% (130) 45% (208) 10% (48) 17% (76) 462Somewhat Favorable of Trump 16% (52) 52% (168) 12% (40) 20% (64) 325Somewhat Unfavorable of Trump 15% (27) 53% (96) 13% (24) 19% (35) 182Very Unfavorable of Trump 14% (133) 50% (478) 17% (162) 19% (178) 950#1 Issue: Economy 19% (132) 51% (348) 15% (101) 15% (106) 688#1 Issue: Security 21% (53) 44% (113) 9% (24) 25% (64) 254#1 Issue: Health Care 18% (61) 47% (158) 15% (50) 20% (67) 335#1 Issue: Medicare / Social Security 14% (40) 53% (149) 12% (35) 21% (58) 283#1 Issue: Women’s Issues 16% (14) 45% (38) 15% (13) 24% (21) 86#1 Issue: Education 20% (21) 40% (42) 18% (20) 22% (23) 107#1 Issue: Energy 15% (12) 50% (39) 16% (13) 19% (15) 79#1 Issue: Other 12% (19) 48% (76) 15% (24) 25% (39) 1572018 House Vote: Democrat 14% (110) 53% (410) 17% (127) 16% (119) 7672018 House Vote: Republican 24% (150) 50% (315) 11% (69) 15% (96) 6292018 House Vote: Someone else 10% (7) 44% (32) 13% (10) 33% (24) 732016 Vote: Hillary Clinton 14% (97) 54% (381) 17% (117) 15% (106) 7002016 Vote: Donald Trump 23% (152) 49% (332) 12% (81) 16% (110) 6752016 Vote: Other 14% (20) 54% (78) 13% (19) 20% (29) 1442016 Vote: Didn’t Vote 17% (81) 37% (173) 13% (62) 32% (149) 466Voted in 2014: Yes 19% (245) 51% (671) 14% (189) 16% (216) 1322Voted in 2014: No 16% (107) 44% (293) 13% (90) 27% (177) 666
Continued on next page
Page 253
National Tracking Poll #2006102, June, 2020
253
Table POL14_6
Table POL14_6: As you may know, the federal government’s CARES Act provides about $2 trillion to help workers and businesses cope with thecoronavirus pandemic (including the Paycheck Protection Program, which provides funds to businesses with fewer than 500 employees to keep workerson their payroll). In your view, to what degree has the CARES Act helped the following?Middle-income Americans
Demographic Helped a lot Helped a little Did not helpDon’t Know / No
Opinion Total N
Registered Voters 18% (352) 48% (963) 14% (279) 20% (394) 19882012 Vote: Barack Obama 15% (129) 52% (442) 17% (145) 16% (136) 8532012 Vote: Mitt Romney 22% (111) 52% (260) 10% (51) 16% (79) 5012012 Vote: Other 17% (14) 41% (34) 10% (8) 33% (28) 842012 Vote: Didn’t Vote 18% (98) 41% (226) 14% (75) 27% (150) 5504-Region: Northeast 21% (74) 51% (180) 11% (40) 17% (61) 3554-Region: Midwest 15% (68) 47% (216) 14% (63) 24% (110) 4574-Region: South 19% (143) 48% (358) 14% (106) 18% (136) 7424-Region: West 16% (67) 48% (210) 16% (70) 20% (87) 434Party: Democrat/Leans Democrat 15% (141) 50% (460) 16% (146) 18% (164) 911Party: Republican/Leans Republican 22% (164) 49% (363) 12% (88) 17% (126) 741Parents 20% (174) 50% (429) 14% (121) 16% (140) 864Note: Row proportions may total to larger than one-hundred percent due to rounding. For more information visit MorningConsultIntelligence.com.
Page 254
254
Morning ConsultTable POL14_7
Table POL14_7: As you may know, the federal government’s CARES Act provides about $2 trillion to help workers and businesses cope with thecoronavirus pandemic (including the Paycheck Protection Program, which provides funds to businesses with fewer than 500 employees to keep workerson their payroll). In your view, to what degree has the CARES Act helped the following?Wealthy Americans
Demographic Helped a lot Helped a little Did not helpDon’t Know / No
Opinion Total N
Registered Voters 26% (508) 19% (371) 23% (465) 32% (645) 1988Gender: Male 27% (252) 21% (194) 26% (239) 26% (245) 930Gender: Female 24% (256) 17% (177) 21% (226) 38% (399) 1058Age: 18-34 25% (126) 20% (100) 22% (111) 33% (162) 499Age: 35-44 26% (79) 26% (80) 18% (55) 29% (88) 302Age: 45-64 27% (196) 16% (115) 23% (165) 34% (248) 724Age: 65+ 23% (106) 16% (75) 29% (135) 32% (146) 463GenZers: 1997-2012 23% (51) 19% (42) 21% (48) 37% (83) 224Millennials: 1981-1996 26% (108) 26% (107) 22% (91) 27% (114) 419GenXers: 1965-1980 27% (136) 17% (89) 22% (111) 34% (175) 511Baby Boomers: 1946-1964 27% (202) 15% (118) 26% (196) 32% (244) 760PID: Dem (no lean) 35% (264) 17% (132) 20% (149) 28% (212) 757PID: Ind (no lean) 24% (156) 17% (110) 21% (136) 37% (236) 638PID: Rep (no lean) 15% (88) 22% (128) 30% (180) 33% (196) 593PID/Gender: DemMen 38% (123) 21% (70) 16% (53) 25% (82) 329PID/Gender: DemWomen 33% (140) 15% (62) 22% (96) 30% (130) 429PID/Gender: Ind Men 25% (73) 19% (56) 27% (79) 30% (88) 296PID/Gender: Ind Women 24% (83) 16% (53) 17% (57) 43% (149) 342PID/Gender: Rep Men 18% (56) 22% (67) 35% (107) 25% (76) 306PID/Gender: Rep Women 11% (32) 21% (61) 25% (73) 42% (120) 287Ideo: Liberal (1-3) 40% (246) 19% (115) 18% (110) 23% (138) 609Ideo: Moderate (4) 23% (120) 18% (92) 24% (126) 35% (183) 522Ideo: Conservative (5-7) 18% (120) 21% (142) 30% (202) 32% (215) 679Educ: < College 23% (282) 18% (227) 23% (284) 37% (458) 1250Educ: Bachelors degree 27% (127) 20% (95) 24% (112) 29% (136) 470Educ: Post-grad 37% (99) 18% (49) 26% (69) 19% (51) 267Income: Under 50k 24% (236) 16% (161) 22% (221) 38% (380) 998Income: 50k-100k 28% (182) 21% (141) 24% (158) 27% (180) 660Income: 100k+ 27% (90) 21% (68) 26% (86) 26% (85) 329
Continued on next page
Page 255
National Tracking Poll #2006102, June, 2020
255
Table POL14_7
Table POL14_7: As you may know, the federal government’s CARES Act provides about $2 trillion to help workers and businesses cope with thecoronavirus pandemic (including the Paycheck Protection Program, which provides funds to businesses with fewer than 500 employees to keep workerson their payroll). In your view, to what degree has the CARES Act helped the following?Wealthy Americans
Demographic Helped a lot Helped a little Did not helpDon’t Know / No
Opinion Total N
Registered Voters 26% (508) 19% (371) 23% (465) 32% (645) 1988Ethnicity: White 25% (400) 19% (302) 24% (382) 33% (524) 1608Ethnicity: Hispanic 31% (59) 23% (43) 12% (23) 35% (67) 193Ethnicity: Afr. Am. 30% (77) 20% (50) 21% (52) 29% (72) 252Ethnicity: Other 24% (31) 14% (18) 24% (31) 38% (49) 128All Christian 23% (215) 21% (195) 26% (243) 31% (288) 941All Non-Christian 32% (31) 17% (16) 28% (27) 23% (23) 97Atheist 38% (48) 19% (24) 21% (27) 22% (29) 128Agnostic/Nothing in particular 27% (127) 17% (81) 20% (95) 37% (176) 478Something Else 25% (86) 16% (54) 21% (73) 38% (130) 344Religious Non-Protestant/Catholic 32% (38) 19% (22) 24% (29) 26% (31) 120Evangelical 20% (99) 19% (97) 26% (133) 35% (176) 505Non-Evangelical 26% (192) 19% (141) 24% (182) 31% (230) 746Community: Urban 29% (140) 21% (105) 21% (105) 28% (139) 490Community: Suburban 26% (252) 17% (169) 23% (223) 34% (338) 981Community: Rural 22% (116) 19% (97) 27% (137) 32% (168) 517Employ: Private Sector 29% (185) 21% (133) 24% (150) 26% (162) 631Employ: Government 29% (39) 19% (26) 28% (37) 24% (33) 136Employ: Self-Employed 28% (36) 21% (27) 20% (26) 32% (42) 130Employ: Homemaker 26% (30) 14% (16) 14% (17) 46% (53) 115Employ: Retired 23% (115) 16% (81) 28% (137) 32% (158) 492Employ: Unemployed 26% (61) 22% (49) 13% (31) 39% (88) 229Employ: Other 13% (20) 15% (23) 26% (40) 45% (69) 152Military HH: Yes 24% (72) 20% (61) 24% (73) 33% (100) 306Military HH: No 26% (435) 18% (310) 23% (392) 32% (545) 1682RD/WT: Right Direction 18% (104) 21% (120) 28% (157) 33% (187) 567RD/WT: Wrong Track 28% (404) 18% (251) 22% (308) 32% (458) 1421Trump Job Approve 14% (109) 22% (174) 30% (234) 33% (257) 774Trump Job Disapprove 34% (395) 16% (189) 19% (225) 30% (345) 1153
Continued on next page
Page 256
256
Morning ConsultTable POL14_7
Table POL14_7: As you may know, the federal government’s CARES Act provides about $2 trillion to help workers and businesses cope with thecoronavirus pandemic (including the Paycheck Protection Program, which provides funds to businesses with fewer than 500 employees to keep workerson their payroll). In your view, to what degree has the CARES Act helped the following?Wealthy Americans
Demographic Helped a lot Helped a little Did not helpDon’t Know / No
Opinion Total N
Registered Voters 26% (508) 19% (371) 23% (465) 32% (645) 1988Trump Job Strongly Approve 15% (63) 21% (89) 31% (128) 33% (135) 415Trump Job Somewhat Approve 13% (46) 24% (85) 30% (106) 34% (122) 359Trump Job Somewhat Disapprove 18% (41) 19% (44) 25% (56) 38% (85) 226Trump Job Strongly Disapprove 38% (353) 16% (145) 18% (169) 28% (259) 927Favorable of Trump 14% (112) 23% (179) 29% (229) 34% (268) 787Unfavorable of Trump 34% (389) 16% (184) 20% (226) 29% (333) 1132Very Favorable of Trump 15% (71) 20% (94) 33% (154) 31% (143) 462Somewhat Favorable of Trump 12% (41) 26% (85) 23% (75) 38% (125) 325Somewhat Unfavorable of Trump 15% (28) 20% (37) 25% (46) 39% (71) 182Very Unfavorable of Trump 38% (361) 15% (147) 19% (181) 28% (262) 950#1 Issue: Economy 24% (168) 21% (146) 26% (176) 29% (198) 688#1 Issue: Security 14% (36) 18% (46) 27% (69) 40% (102) 254#1 Issue: Health Care 28% (94) 20% (66) 22% (74) 30% (101) 335#1 Issue: Medicare / Social Security 28% (80) 12% (34) 23% (64) 37% (104) 283#1 Issue: Women’s Issues 25% (22) 27% (23) 22% (19) 25% (22) 86#1 Issue: Education 34% (36) 18% (19) 17% (18) 32% (34) 107#1 Issue: Energy 30% (24) 18% (14) 19% (15) 33% (26) 79#1 Issue: Other 31% (48) 14% (22) 19% (29) 37% (58) 1572018 House Vote: Democrat 39% (302) 17% (129) 19% (146) 25% (190) 7672018 House Vote: Republican 16% (98) 21% (135) 31% (197) 32% (199) 6292018 House Vote: Someone else 25% (18) 15% (11) 15% (11) 44% (33) 732016 Vote: Hillary Clinton 39% (273) 18% (125) 18% (126) 25% (175) 7002016 Vote: Donald Trump 15% (103) 21% (141) 31% (212) 33% (220) 6752016 Vote: Other 30% (43) 18% (26) 21% (30) 32% (46) 1442016 Vote: Didn’t Vote 19% (87) 17% (79) 21% (97) 43% (202) 466Voted in 2014: Yes 28% (376) 19% (245) 24% (319) 29% (382) 1322Voted in 2014: No 20% (132) 19% (126) 22% (146) 39% (263) 666
Continued on next page
Page 257
National Tracking Poll #2006102, June, 2020
257
Table POL14_7
Table POL14_7: As you may know, the federal government’s CARES Act provides about $2 trillion to help workers and businesses cope with thecoronavirus pandemic (including the Paycheck Protection Program, which provides funds to businesses with fewer than 500 employees to keep workerson their payroll). In your view, to what degree has the CARES Act helped the following?Wealthy Americans
Demographic Helped a lot Helped a little Did not helpDon’t Know / No
Opinion Total N
Registered Voters 26% (508) 19% (371) 23% (465) 32% (645) 19882012 Vote: Barack Obama 37% (315) 16% (138) 20% (171) 27% (229) 8532012 Vote: Mitt Romney 13% (65) 22% (108) 33% (163) 33% (165) 5012012 Vote: Other 22% (18) 22% (18) 16% (14) 40% (34) 842012 Vote: Didn’t Vote 20% (110) 19% (107) 21% (117) 39% (217) 5504-Region: Northeast 25% (90) 20% (70) 24% (86) 31% (108) 3554-Region: Midwest 27% (121) 16% (74) 23% (104) 34% (157) 4574-Region: South 25% (182) 19% (140) 26% (190) 31% (230) 7424-Region: West 26% (114) 20% (87) 19% (85) 34% (149) 434Party: Democrat/Leans Democrat 36% (327) 17% (156) 20% (179) 27% (248) 911Party: Republican/Leans Republican 15% (111) 21% (157) 30% (223) 34% (250) 741Parents 25% (214) 20% (172) 25% (217) 30% (260) 864Note: Row proportions may total to larger than one-hundred percent due to rounding. For more information visit MorningConsultIntelligence.com.
Page 258
258
Morning ConsultTable POL14_8
Table POL14_8: As you may know, the federal government’s CARES Act provides about $2 trillion to help workers and businesses cope with thecoronavirus pandemic (including the Paycheck Protection Program, which provides funds to businesses with fewer than 500 employees to keep workerson their payroll). In your view, to what degree has the CARES Act helped the following?Black Americans
Demographic Helped a lot Helped a little Did not helpDon’t Know / No
Opinion Total N
Registered Voters 20% (404) 38% (763) 15% (294) 27% (527) 1988Gender: Male 23% (214) 39% (366) 15% (140) 23% (210) 930Gender: Female 18% (190) 38% (397) 15% (154) 30% (317) 1058Age: 18-34 25% (123) 29% (147) 15% (73) 31% (157) 499Age: 35-44 20% (62) 38% (115) 16% (48) 26% (78) 302Age: 45-64 18% (133) 40% (288) 15% (108) 27% (195) 724Age: 65+ 19% (86) 46% (213) 14% (65) 21% (98) 463GenZers: 1997-2012 22% (50) 25% (56) 15% (34) 38% (84) 224Millennials: 1981-1996 24% (101) 36% (150) 15% (63) 25% (106) 419GenXers: 1965-1980 19% (97) 38% (194) 15% (79) 28% (141) 511Baby Boomers: 1946-1964 18% (138) 43% (327) 15% (115) 24% (179) 760PID: Dem (no lean) 18% (136) 39% (296) 21% (161) 22% (165) 757PID: Ind (no lean) 16% (101) 38% (243) 15% (93) 31% (201) 638PID: Rep (no lean) 28% (167) 38% (223) 7% (41) 27% (162) 593PID/Gender: DemMen 20% (66) 40% (132) 20% (66) 20% (66) 329PID/Gender: DemWomen 16% (70) 38% (165) 22% (95) 23% (99) 429PID/Gender: Ind Men 19% (58) 39% (115) 16% (48) 25% (75) 296PID/Gender: Ind Women 13% (44) 37% (128) 13% (45) 37% (126) 342PID/Gender: Rep Men 30% (91) 39% (119) 9% (27) 23% (69) 306PID/Gender: Rep Women 27% (76) 36% (104) 5% (14) 32% (93) 287Ideo: Liberal (1-3) 16% (95) 42% (258) 22% (135) 20% (121) 609Ideo: Moderate (4) 18% (94) 36% (189) 17% (91) 28% (148) 522Ideo: Conservative (5-7) 27% (181) 42% (286) 7% (49) 24% (163) 679Educ: < College 22% (276) 34% (430) 13% (164) 30% (381) 1250Educ: Bachelors degree 17% (81) 43% (202) 18% (84) 22% (103) 470Educ: Post-grad 18% (47) 49% (131) 17% (46) 16% (44) 267Income: Under 50k 22% (215) 35% (345) 14% (142) 30% (296) 998Income: 50k-100k 18% (117) 41% (273) 16% (109) 24% (161) 660Income: 100k+ 22% (71) 44% (144) 13% (44) 21% (71) 329
Continued on next page
Page 259
National Tracking Poll #2006102, June, 2020
259
Table POL14_8
Table POL14_8: As you may know, the federal government’s CARES Act provides about $2 trillion to help workers and businesses cope with thecoronavirus pandemic (including the Paycheck Protection Program, which provides funds to businesses with fewer than 500 employees to keep workerson their payroll). In your view, to what degree has the CARES Act helped the following?Black Americans
Demographic Helped a lot Helped a little Did not helpDon’t Know / No
Opinion Total N
Registered Voters 20% (404) 38% (763) 15% (294) 27% (527) 1988Ethnicity: White 20% (315) 39% (633) 14% (218) 28% (442) 1608Ethnicity: Hispanic 22% (41) 31% (60) 17% (32) 30% (58) 193Ethnicity: Afr. Am. 24% (61) 36% (90) 21% (54) 19% (47) 252Ethnicity: Other 22% (28) 31% (40) 17% (22) 30% (38) 128All Christian 22% (211) 43% (405) 10% (97) 24% (228) 941All Non-Christian 23% (22) 39% (38) 21% (20) 17% (17) 97Atheist 15% (20) 44% (56) 23% (29) 18% (23) 128Agnostic/Nothing in particular 18% (84) 34% (163) 18% (87) 30% (144) 478Something Else 20% (67) 29% (100) 18% (61) 34% (115) 344Religious Non-Protestant/Catholic 21% (25) 39% (47) 18% (22) 21% (25) 120Evangelical 24% (121) 38% (194) 12% (60) 26% (130) 505Non-Evangelical 20% (151) 40% (297) 13% (96) 27% (202) 746Community: Urban 21% (105) 38% (187) 14% (68) 27% (130) 490Community: Suburban 19% (184) 39% (379) 15% (152) 27% (266) 981Community: Rural 22% (115) 38% (197) 14% (75) 25% (131) 517Employ: Private Sector 21% (133) 40% (251) 16% (102) 23% (144) 631Employ: Government 24% (32) 39% (53) 16% (21) 22% (29) 136Employ: Self-Employed 17% (22) 39% (50) 19% (25) 25% (33) 130Employ: Homemaker 18% (21) 26% (30) 13% (15) 42% (48) 115Employ: Retired 22% (107) 44% (216) 13% (63) 21% (106) 492Employ: Unemployed 18% (40) 35% (80) 15% (35) 32% (74) 229Employ: Other 18% (28) 34% (51) 11% (17) 37% (56) 152Military HH: Yes 22% (68) 41% (126) 15% (45) 22% (67) 306Military HH: No 20% (336) 38% (636) 15% (249) 27% (460) 1682RD/WT: Right Direction 32% (184) 35% (199) 7% (37) 26% (148) 567RD/WT: Wrong Track 15% (220) 40% (564) 18% (257) 27% (380) 1421Trump Job Approve 29% (224) 38% (294) 6% (50) 27% (205) 774Trump Job Disapprove 15% (175) 40% (461) 21% (238) 24% (279) 1153
Continued on next page
Page 260
260
Morning ConsultTable POL14_8
Table POL14_8: As you may know, the federal government’s CARES Act provides about $2 trillion to help workers and businesses cope with thecoronavirus pandemic (including the Paycheck Protection Program, which provides funds to businesses with fewer than 500 employees to keep workerson their payroll). In your view, to what degree has the CARES Act helped the following?Black Americans
Demographic Helped a lot Helped a little Did not helpDon’t Know / No
Opinion Total N
Registered Voters 20% (404) 38% (763) 15% (294) 27% (527) 1988Trump Job Strongly Approve 37% (152) 32% (131) 5% (21) 27% (111) 415Trump Job Somewhat Approve 20% (72) 45% (163) 8% (29) 26% (94) 359Trump Job Somewhat Disapprove 22% (50) 40% (90) 11% (26) 27% (61) 226Trump Job Strongly Disapprove 14% (125) 40% (372) 23% (213) 23% (217) 927Favorable of Trump 30% (236) 37% (292) 6% (48) 27% (212) 787Unfavorable of Trump 14% (161) 41% (460) 21% (239) 24% (272) 1132Very Favorable of Trump 35% (164) 33% (154) 6% (27) 25% (117) 462Somewhat Favorable of Trump 22% (72) 42% (138) 6% (21) 29% (94) 325Somewhat Unfavorable of Trump 15% (28) 43% (78) 13% (23) 29% (53) 182Very Unfavorable of Trump 14% (133) 40% (382) 23% (216) 23% (219) 950#1 Issue: Economy 23% (161) 41% (281) 13% (92) 22% (154) 688#1 Issue: Security 31% (78) 30% (77) 7% (18) 32% (81) 254#1 Issue: Health Care 18% (59) 39% (132) 16% (55) 27% (89) 335#1 Issue: Medicare / Social Security 13% (38) 41% (117) 16% (46) 29% (82) 283#1 Issue: Women’s Issues 18% (15) 33% (28) 19% (16) 30% (26) 86#1 Issue: Education 18% (19) 31% (33) 19% (21) 32% (34) 107#1 Issue: Energy 12% (10) 41% (32) 19% (15) 28% (22) 79#1 Issue: Other 15% (23) 40% (63) 20% (31) 25% (39) 1572018 House Vote: Democrat 14% (110) 43% (334) 23% (178) 19% (146) 7672018 House Vote: Republican 28% (178) 41% (259) 7% (46) 23% (147) 6292018 House Vote: Someone else 5% (4) 33% (24) 17% (12) 45% (33) 732016 Vote: Hillary Clinton 15% (106) 43% (300) 23% (160) 19% (135) 7002016 Vote: Donald Trump 27% (184) 40% (271) 8% (53) 25% (166) 6752016 Vote: Other 9% (13) 41% (59) 17% (24) 33% (48) 1442016 Vote: Didn’t Vote 21% (99) 28% (132) 12% (56) 38% (179) 466Voted in 2014: Yes 20% (259) 41% (545) 17% (219) 23% (299) 1322Voted in 2014: No 22% (144) 33% (218) 11% (75) 34% (229) 666
Continued on next page
Page 261
National Tracking Poll #2006102, June, 2020
261
Table POL14_8
Table POL14_8: As you may know, the federal government’s CARES Act provides about $2 trillion to help workers and businesses cope with thecoronavirus pandemic (including the Paycheck Protection Program, which provides funds to businesses with fewer than 500 employees to keep workerson their payroll). In your view, to what degree has the CARES Act helped the following?Black Americans
Demographic Helped a lot Helped a little Did not helpDon’t Know / No
Opinion Total N
Registered Voters 20% (404) 38% (763) 15% (294) 27% (527) 19882012 Vote: Barack Obama 15% (131) 42% (358) 22% (184) 21% (179) 8532012 Vote: Mitt Romney 27% (133) 42% (210) 7% (37) 24% (121) 5012012 Vote: Other 16% (14) 36% (30) 8% (7) 40% (33) 842012 Vote: Didn’t Vote 23% (126) 30% (165) 12% (66) 35% (193) 5504-Region: Northeast 21% (76) 41% (145) 13% (45) 25% (88) 3554-Region: Midwest 16% (74) 41% (186) 13% (57) 31% (139) 4574-Region: South 24% (177) 36% (269) 16% (116) 24% (180) 7424-Region: West 18% (76) 38% (163) 17% (75) 28% (120) 434Party: Democrat/Leans Democrat 17% (157) 39% (359) 21% (194) 22% (201) 911Party: Republican/Leans Republican 27% (200) 39% (291) 7% (52) 27% (198) 741Parents 23% (195) 39% (335) 15% (127) 24% (206) 864Note: Row proportions may total to larger than one-hundred percent due to rounding. For more information visit MorningConsultIntelligence.com.
Page 262
262
Morning ConsultTable POL14_9
Table POL14_9: As you may know, the federal government’s CARES Act provides about $2 trillion to help workers and businesses cope with thecoronavirus pandemic (including the Paycheck Protection Program, which provides funds to businesses with fewer than 500 employees to keep workerson their payroll). In your view, to what degree has the CARES Act helped the following?White Americans
Demographic Helped a lot Helped a little Did not helpDon’t Know / No
Opinion Total N
Registered Voters 23% (463) 42% (827) 9% (173) 26% (526) 1988Gender: Male 25% (236) 44% (410) 9% (83) 22% (202) 930Gender: Female 21% (227) 39% (417) 8% (90) 31% (323) 1058Age: 18-34 26% (131) 30% (150) 12% (61) 32% (158) 499Age: 35-44 25% (75) 43% (130) 6% (19) 26% (78) 302Age: 45-64 25% (180) 41% (299) 8% (59) 26% (186) 724Age: 65+ 17% (77) 53% (247) 7% (33) 23% (105) 463GenZers: 1997-2012 25% (56) 24% (55) 14% (31) 37% (82) 224Millennials: 1981-1996 26% (108) 40% (167) 9% (38) 25% (107) 419GenXers: 1965-1980 26% (135) 39% (198) 8% (42) 27% (137) 511Baby Boomers: 1946-1964 20% (149) 49% (370) 8% (59) 24% (182) 760PID: Dem (no lean) 27% (202) 42% (318) 9% (68) 22% (168) 757PID: Ind (no lean) 17% (107) 43% (272) 9% (55) 32% (204) 638PID: Rep (no lean) 26% (153) 40% (236) 8% (49) 26% (154) 593PID/Gender: DemMen 28% (91) 47% (153) 6% (20) 20% (65) 329PID/Gender: DemWomen 26% (112) 39% (166) 11% (48) 24% (104) 429PID/Gender: Ind Men 21% (62) 43% (128) 9% (26) 27% (80) 296PID/Gender: Ind Women 13% (45) 42% (144) 9% (29) 36% (124) 342PID/Gender: Rep Men 27% (83) 42% (129) 12% (36) 19% (58) 306PID/Gender: Rep Women 25% (70) 38% (108) 5% (13) 33% (96) 287Ideo: Liberal (1-3) 27% (164) 44% (270) 10% (61) 19% (113) 609Ideo: Moderate (4) 20% (104) 43% (226) 7% (36) 30% (155) 522Ideo: Conservative (5-7) 25% (170) 44% (300) 8% (53) 23% (156) 679Educ: < College 22% (279) 39% (484) 9% (115) 30% (372) 1250Educ: Bachelors degree 23% (108) 46% (216) 8% (36) 23% (110) 470Educ: Post-grad 28% (75) 47% (127) 8% (22) 16% (44) 267Income: Under 50k 23% (233) 37% (372) 9% (92) 30% (301) 998Income: 50k-100k 22% (148) 45% (300) 9% (57) 23% (155) 660Income: 100k+ 25% (82) 47% (155) 7% (24) 21% (69) 329
Continued on next page
Page 263
National Tracking Poll #2006102, June, 2020
263
Table POL14_9
Table POL14_9: As you may know, the federal government’s CARES Act provides about $2 trillion to help workers and businesses cope with thecoronavirus pandemic (including the Paycheck Protection Program, which provides funds to businesses with fewer than 500 employees to keep workerson their payroll). In your view, to what degree has the CARES Act helped the following?White Americans
Demographic Helped a lot Helped a little Did not helpDon’t Know / No
Opinion Total N
Registered Voters 23% (463) 42% (827) 9% (173) 26% (526) 1988Ethnicity: White 22% (354) 45% (717) 8% (126) 26% (411) 1608Ethnicity: Hispanic 28% (54) 27% (52) 14% (27) 31% (60) 193Ethnicity: Afr. Am. 31% (79) 27% (68) 15% (38) 27% (67) 252Ethnicity: Other 23% (30) 33% (42) 7% (9) 37% (48) 128All Christian 23% (215) 46% (436) 7% (70) 23% (220) 941All Non-Christian 25% (25) 44% (43) 9% (9) 21% (21) 97Atheist 22% (28) 46% (59) 15% (19) 17% (22) 128Agnostic/Nothing in particular 23% (108) 38% (182) 9% (42) 31% (146) 478Something Else 25% (87) 31% (106) 10% (33) 34% (117) 344Religious Non-Protestant/Catholic 23% (28) 46% (55) 10% (12) 21% (25) 120Evangelical 26% (130) 39% (198) 8% (42) 27% (135) 505Non-Evangelical 22% (166) 44% (327) 8% (58) 26% (194) 746Community: Urban 27% (131) 39% (191) 9% (42) 26% (125) 490Community: Suburban 20% (200) 42% (412) 10% (98) 28% (271) 981Community: Rural 25% (131) 43% (223) 6% (33) 25% (130) 517Employ: Private Sector 27% (168) 43% (269) 9% (59) 21% (136) 631Employ: Government 22% (30) 45% (61) 9% (12) 24% (33) 136Employ: Self-Employed 16% (21) 48% (63) 11% (14) 25% (32) 130Employ: Homemaker 24% (27) 27% (31) 9% (11) 40% (45) 115Employ: Retired 21% (105) 49% (242) 7% (34) 23% (111) 492Employ: Unemployed 24% (56) 31% (70) 11% (26) 34% (77) 229Employ: Other 23% (35) 37% (56) 6% (8) 35% (53) 152Military HH: Yes 22% (67) 47% (143) 9% (26) 23% (70) 306Military HH: No 24% (396) 41% (684) 9% (146) 27% (456) 1682RD/WT: Right Direction 27% (153) 39% (223) 8% (45) 26% (146) 567RD/WT: Wrong Track 22% (310) 42% (603) 9% (127) 27% (380) 1421Trump Job Approve 25% (197) 42% (322) 8% (61) 25% (194) 774Trump Job Disapprove 22% (259) 43% (496) 9% (109) 25% (290) 1153
Continued on next page
Page 264
264
Morning ConsultTable POL14_9
Table POL14_9: As you may know, the federal government’s CARES Act provides about $2 trillion to help workers and businesses cope with thecoronavirus pandemic (including the Paycheck Protection Program, which provides funds to businesses with fewer than 500 employees to keep workerson their payroll). In your view, to what degree has the CARES Act helped the following?White Americans
Demographic Helped a lot Helped a little Did not helpDon’t Know / No
Opinion Total N
Registered Voters 23% (463) 42% (827) 9% (173) 26% (526) 1988Trump Job Strongly Approve 30% (125) 37% (153) 9% (36) 24% (101) 415Trump Job Somewhat Approve 20% (72) 47% (169) 7% (25) 26% (93) 359Trump Job Somewhat Disapprove 17% (39) 47% (107) 6% (14) 29% (66) 226Trump Job Strongly Disapprove 24% (220) 42% (389) 10% (94) 24% (224) 927Favorable of Trump 26% (206) 41% (322) 8% (63) 25% (197) 787Unfavorable of Trump 22% (249) 43% (491) 9% (107) 25% (284) 1132Very Favorable of Trump 30% (139) 38% (175) 9% (41) 23% (107) 462Somewhat Favorable of Trump 20% (66) 45% (147) 7% (22) 28% (90) 325Somewhat Unfavorable of Trump 15% (28) 46% (84) 7% (12) 32% (58) 182Very Unfavorable of Trump 23% (221) 43% (408) 10% (95) 24% (226) 950#1 Issue: Economy 27% (187) 43% (296) 8% (55) 22% (150) 688#1 Issue: Security 25% (63) 36% (92) 7% (18) 32% (81) 254#1 Issue: Health Care 21% (70) 45% (149) 8% (28) 26% (88) 335#1 Issue: Medicare / Social Security 17% (48) 46% (131) 8% (24) 28% (81) 283#1 Issue: Women’s Issues 24% (21) 34% (29) 10% (8) 32% (27) 86#1 Issue: Education 27% (28) 34% (36) 9% (9) 31% (33) 107#1 Issue: Energy 19% (15) 37% (29) 18% (14) 26% (20) 79#1 Issue: Other 19% (30) 41% (64) 11% (17) 29% (45) 1572018 House Vote: Democrat 24% (181) 48% (367) 9% (73) 19% (146) 7672018 House Vote: Republican 25% (154) 45% (282) 8% (50) 23% (144) 6292018 House Vote: Someone else 10% (7) 35% (25) 7% (5) 48% (35) 732016 Vote: Hillary Clinton 24% (167) 47% (331) 9% (64) 20% (137) 7002016 Vote: Donald Trump 25% (166) 43% (293) 9% (59) 23% (158) 6752016 Vote: Other 13% (18) 45% (64) 7% (10) 36% (52) 1442016 Vote: Didn’t Vote 24% (110) 30% (138) 8% (39) 38% (179) 466Voted in 2014: Yes 23% (305) 46% (611) 8% (109) 22% (297) 1322Voted in 2014: No 24% (158) 32% (215) 10% (64) 34% (229) 666
Continued on next page
Page 265
National Tracking Poll #2006102, June, 2020
265
Table POL14_9
Table POL14_9: As you may know, the federal government’s CARES Act provides about $2 trillion to help workers and businesses cope with thecoronavirus pandemic (including the Paycheck Protection Program, which provides funds to businesses with fewer than 500 employees to keep workerson their payroll). In your view, to what degree has the CARES Act helped the following?White Americans
Demographic Helped a lot Helped a little Did not helpDon’t Know / No
Opinion Total N
Registered Voters 23% (463) 42% (827) 9% (173) 26% (526) 19882012 Vote: Barack Obama 24% (203) 47% (399) 8% (68) 21% (183) 8532012 Vote: Mitt Romney 24% (120) 46% (229) 7% (36) 23% (116) 5012012 Vote: Other 7% (6) 44% (37) 9% (7) 40% (33) 842012 Vote: Didn’t Vote 24% (134) 29% (162) 11% (60) 35% (194) 5504-Region: Northeast 27% (95) 41% (146) 8% (28) 24% (86) 3554-Region: Midwest 20% (91) 45% (204) 8% (36) 27% (125) 4574-Region: South 25% (185) 40% (296) 9% (68) 26% (193) 7424-Region: West 21% (92) 42% (181) 9% (40) 28% (121) 434Party: Democrat/Leans Democrat 25% (231) 43% (393) 9% (84) 22% (203) 911Party: Republican/Leans Republican 23% (174) 43% (320) 8% (59) 25% (189) 741Parents 26% (222) 43% (368) 8% (67) 24% (207) 864Note: Row proportions may total to larger than one-hundred percent due to rounding. For more information visit MorningConsultIntelligence.com.
Page 266
266
Morning ConsultTable POL14_10
Table POL14_10: As you may know, the federal government’s CARES Act provides about $2 trillion to help workers and businesses cope with thecoronavirus pandemic (including the Paycheck Protection Program, which provides funds to businesses with fewer than 500 employees to keep workerson their payroll). In your view, to what degree has the CARES Act helped the following?Hispanic Americans
Demographic Helped a lot Helped a little Did not helpDon’t Know / No
Opinion Total N
Registered Voters 17% (340) 37% (743) 15% (300) 30% (605) 1988Gender: Male 19% (179) 38% (357) 16% (152) 26% (243) 930Gender: Female 15% (161) 37% (386) 14% (149) 34% (362) 1058Age: 18-34 19% (93) 31% (153) 17% (82) 34% (171) 499Age: 35-44 19% (58) 37% (111) 15% (44) 30% (90) 302Age: 45-64 17% (126) 38% (276) 15% (111) 29% (211) 724Age: 65+ 14% (63) 44% (204) 14% (63) 29% (133) 463GenZers: 1997-2012 16% (36) 28% (64) 16% (36) 39% (88) 224Millennials: 1981-1996 20% (82) 36% (151) 16% (66) 29% (121) 419GenXers: 1965-1980 19% (96) 34% (173) 17% (85) 31% (158) 511Baby Boomers: 1946-1964 15% (114) 42% (321) 15% (111) 28% (214) 760PID: Dem (no lean) 16% (120) 37% (280) 20% (152) 27% (205) 757PID: Ind (no lean) 12% (79) 38% (243) 16% (99) 34% (217) 638PID: Rep (no lean) 24% (141) 37% (220) 8% (50) 31% (182) 593PID/Gender: DemMen 17% (57) 40% (131) 18% (60) 25% (81) 329PID/Gender: DemWomen 15% (63) 35% (149) 21% (92) 29% (125) 429PID/Gender: Ind Men 16% (47) 37% (110) 18% (52) 29% (86) 296PID/Gender: Ind Women 9% (32) 39% (133) 14% (46) 38% (131) 342PID/Gender: Rep Men 25% (75) 38% (115) 13% (39) 25% (76) 306PID/Gender: Rep Women 23% (66) 36% (104) 4% (10) 37% (106) 287Ideo: Liberal (1-3) 12% (72) 42% (254) 22% (134) 24% (148) 609Ideo: Moderate (4) 17% (88) 36% (189) 17% (89) 30% (156) 522Ideo: Conservative (5-7) 23% (156) 39% (267) 8% (58) 29% (198) 679Educ: < College 18% (230) 34% (425) 14% (179) 33% (417) 1250Educ: Bachelors degree 15% (69) 42% (199) 16% (76) 27% (127) 470Educ: Post-grad 15% (41) 45% (119) 17% (46) 23% (61) 267Income: Under 50k 18% (178) 32% (322) 15% (154) 35% (345) 998Income: 50k-100k 15% (102) 42% (278) 15% (102) 27% (178) 660Income: 100k+ 18% (60) 43% (143) 13% (44) 25% (82) 329
Continued on next page
Page 267
National Tracking Poll #2006102, June, 2020
267
Table POL14_10
Table POL14_10: As you may know, the federal government’s CARES Act provides about $2 trillion to help workers and businesses cope with thecoronavirus pandemic (including the Paycheck Protection Program, which provides funds to businesses with fewer than 500 employees to keep workerson their payroll). In your view, to what degree has the CARES Act helped the following?Hispanic Americans
Demographic Helped a lot Helped a little Did not helpDon’t Know / No
Opinion Total N
Registered Voters 17% (340) 37% (743) 15% (300) 30% (605) 1988Ethnicity: White 17% (270) 39% (620) 14% (227) 31% (491) 1608Ethnicity: Hispanic 21% (40) 34% (65) 19% (36) 27% (52) 193Ethnicity: Afr. Am. 18% (44) 33% (83) 21% (53) 28% (71) 252Ethnicity: Other 20% (25) 31% (40) 16% (21) 33% (42) 128All Christian 19% (179) 42% (399) 11% (103) 28% (260) 941All Non-Christian 18% (18) 40% (39) 16% (16) 25% (25) 97Atheist 13% (16) 41% (52) 25% (32) 21% (27) 128Agnostic/Nothing in particular 14% (69) 32% (155) 18% (88) 35% (167) 478Something Else 17% (58) 28% (98) 18% (62) 37% (126) 344Religious Non-Protestant/Catholic 19% (23) 38% (45) 15% (18) 28% (33) 120Evangelical 21% (107) 36% (181) 13% (66) 30% (152) 505Non-Evangelical 17% (123) 41% (304) 13% (97) 30% (222) 746Community: Urban 17% (86) 38% (187) 16% (77) 29% (140) 490Community: Suburban 17% (163) 37% (360) 15% (149) 32% (309) 981Community: Rural 18% (91) 38% (196) 14% (74) 30% (155) 517Employ: Private Sector 19% (122) 39% (243) 16% (103) 26% (163) 631Employ: Government 19% (25) 36% (49) 20% (27) 26% (35) 136Employ: Self-Employed 12% (16) 35% (46) 22% (29) 30% (39) 130Employ: Homemaker 19% (22) 29% (33) 11% (12) 42% (48) 115Employ: Retired 16% (81) 42% (207) 12% (60) 29% (144) 492Employ: Unemployed 15% (35) 34% (77) 17% (38) 35% (79) 229Employ: Other 16% (24) 34% (51) 12% (18) 39% (59) 152Military HH: Yes 20% (61) 39% (119) 15% (45) 26% (81) 306Military HH: No 17% (279) 37% (624) 15% (255) 31% (524) 1682RD/WT: Right Direction 26% (149) 36% (206) 7% (41) 30% (172) 567RD/WT: Wrong Track 13% (191) 38% (537) 18% (259) 30% (433) 1421Trump Job Approve 24% (189) 37% (285) 8% (60) 31% (240) 774Trump Job Disapprove 13% (146) 39% (452) 20% (233) 28% (323) 1153
Continued on next page
Page 268
268
Morning ConsultTable POL14_10
Table POL14_10: As you may know, the federal government’s CARES Act provides about $2 trillion to help workers and businesses cope with thecoronavirus pandemic (including the Paycheck Protection Program, which provides funds to businesses with fewer than 500 employees to keep workerson their payroll). In your view, to what degree has the CARES Act helped the following?Hispanic Americans
Demographic Helped a lot Helped a little Did not helpDon’t Know / No
Opinion Total N
Registered Voters 17% (340) 37% (743) 15% (300) 30% (605) 1988Trump Job Strongly Approve 31% (129) 32% (134) 7% (27) 30% (125) 415Trump Job Somewhat Approve 17% (60) 42% (151) 9% (33) 32% (115) 359Trump Job Somewhat Disapprove 17% (39) 39% (88) 12% (28) 32% (72) 226Trump Job Strongly Disapprove 12% (107) 39% (364) 22% (205) 27% (251) 927Favorable of Trump 25% (193) 37% (289) 8% (59) 31% (246) 787Unfavorable of Trump 12% (138) 39% (446) 21% (235) 28% (313) 1132Very Favorable of Trump 29% (135) 34% (159) 7% (33) 29% (135) 462Somewhat Favorable of Trump 18% (58) 40% (131) 8% (26) 34% (110) 325Somewhat Unfavorable of Trump 14% (26) 41% (74) 14% (26) 31% (56) 182Very Unfavorable of Trump 12% (112) 39% (372) 22% (209) 27% (257) 950#1 Issue: Economy 21% (143) 38% (263) 15% (101) 26% (181) 688#1 Issue: Security 23% (59) 33% (83) 7% (17) 37% (95) 254#1 Issue: Health Care 13% (45) 39% (132) 16% (54) 31% (105) 335#1 Issue: Medicare / Social Security 13% (37) 42% (118) 13% (36) 32% (92) 283#1 Issue: Women’s Issues 12% (10) 36% (31) 16% (14) 37% (31) 86#1 Issue: Education 14% (15) 33% (35) 22% (24) 30% (32) 107#1 Issue: Energy 15% (12) 29% (23) 26% (21) 30% (24) 79#1 Issue: Other 12% (19) 37% (58) 22% (34) 29% (46) 1572018 House Vote: Democrat 12% (95) 41% (314) 22% (171) 24% (188) 7672018 House Vote: Republican 24% (149) 40% (251) 9% (54) 28% (175) 6292018 House Vote: Someone else 7% (5) 28% (21) 19% (14) 46% (33) 732016 Vote: Hillary Clinton 12% (82) 43% (301) 22% (151) 24% (167) 7002016 Vote: Donald Trump 24% (159) 40% (268) 9% (61) 28% (187) 6752016 Vote: Other 10% (15) 34% (49) 16% (24) 40% (57) 1442016 Vote: Didn’t Vote 18% (83) 27% (124) 14% (65) 42% (194) 466Voted in 2014: Yes 17% (223) 40% (527) 16% (218) 27% (355) 1322Voted in 2014: No 18% (117) 32% (216) 12% (83) 38% (250) 666
Continued on next page
Page 269
National Tracking Poll #2006102, June, 2020
269
Table POL14_10
Table POL14_10: As you may know, the federal government’s CARES Act provides about $2 trillion to help workers and businesses cope with thecoronavirus pandemic (including the Paycheck Protection Program, which provides funds to businesses with fewer than 500 employees to keep workerson their payroll). In your view, to what degree has the CARES Act helped the following?Hispanic Americans
Demographic Helped a lot Helped a little Did not helpDon’t Know / No
Opinion Total N
Registered Voters 17% (340) 37% (743) 15% (300) 30% (605) 19882012 Vote: Barack Obama 14% (119) 41% (346) 21% (179) 24% (209) 8532012 Vote: Mitt Romney 21% (107) 42% (210) 8% (39) 29% (145) 5012012 Vote: Other 17% (14) 29% (24) 8% (7) 46% (39) 842012 Vote: Didn’t Vote 18% (100) 30% (163) 14% (75) 39% (213) 5504-Region: Northeast 21% (75) 40% (141) 12% (42) 27% (96) 3554-Region: Midwest 13% (61) 38% (172) 14% (62) 36% (162) 4574-Region: South 18% (136) 37% (272) 16% (117) 29% (217) 7424-Region: West 15% (67) 36% (158) 18% (79) 30% (130) 434Party: Democrat/Leans Democrat 15% (132) 38% (343) 21% (191) 27% (245) 911Party: Republican/Leans Republican 23% (169) 38% (285) 8% (60) 31% (227) 741Parents 18% (160) 38% (330) 15% (127) 29% (247) 864Note: Row proportions may total to larger than one-hundred percent due to rounding. For more information visit MorningConsultIntelligence.com.
Page 270
270
Morning ConsultTable POL16_1
Table POL16_1: How much do you trust the following to oversee the proper distribution of CARES Act Funds?President Donald Trump
Demographic A lot Some Not much Not at allDon’t know/No
opinion Total N
Registered Voters 19% (372) 18% (358) 11% (226) 41% (806) 11% (226) 1988Gender: Male 21% (197) 19% (179) 11% (107) 38% (355) 10% (93) 930Gender: Female 17% (175) 17% (180) 11% (120) 43% (451) 13% (133) 1058Age: 18-34 10% (50) 14% (71) 13% (64) 45% (227) 18% (89) 499Age: 35-44 18% (54) 20% (59) 12% (37) 38% (115) 12% (37) 302Age: 45-64 22% (159) 20% (148) 10% (72) 39% (282) 9% (62) 724Age: 65+ 23% (108) 17% (80) 12% (54) 39% (182) 8% (38) 463GenZers: 1997-2012 8% (17) 12% (26) 11% (25) 45% (102) 24% (53) 224Millennials: 1981-1996 13% (55) 17% (73) 14% (57) 44% (183) 12% (52) 419GenXers: 1965-1980 22% (110) 20% (103) 10% (50) 39% (201) 9% (47) 511Baby Boomers: 1946-1964 21% (159) 19% (142) 12% (88) 40% (301) 9% (69) 760PID: Dem (no lean) 3% (23) 7% (56) 12% (91) 69% (526) 8% (61) 757PID: Ind (no lean) 11% (71) 21% (131) 14% (89) 37% (234) 18% (112) 638PID: Rep (no lean) 47% (278) 29% (171) 8% (46) 8% (46) 9% (53) 593PID/Gender: DemMen 4% (14) 9% (30) 11% (36) 69% (226) 7% (23) 329PID/Gender: DemWomen 2% (9) 6% (27) 13% (55) 70% (301) 9% (38) 429PID/Gender: Ind Men 13% (37) 22% (64) 15% (46) 34% (101) 16% (48) 296PID/Gender: Ind Women 10% (34) 19% (67) 13% (44) 39% (133) 19% (65) 342PID/Gender: Rep Men 48% (146) 28% (85) 8% (25) 9% (28) 7% (22) 306PID/Gender: Rep Women 46% (132) 30% (86) 7% (21) 6% (17) 11% (31) 287Ideo: Liberal (1-3) 4% (23) 6% (38) 11% (69) 73% (444) 5% (33) 609Ideo: Moderate (4) 10% (54) 18% (91) 16% (83) 44% (228) 13% (66) 522Ideo: Conservative (5-7) 41% (277) 30% (206) 9% (58) 11% (78) 9% (60) 679Educ: < College 21% (259) 19% (233) 11% (134) 36% (444) 14% (179) 1250Educ: Bachelors degree 15% (70) 16% (76) 14% (65) 47% (220) 8% (39) 470Educ: Post-grad 16% (43) 18% (48) 10% (27) 53% (141) 3% (8) 267Income: Under 50k 18% (182) 18% (180) 12% (121) 38% (381) 13% (134) 998Income: 50k-100k 19% (125) 19% (129) 11% (70) 42% (278) 9% (59) 660Income: 100k+ 20% (64) 15% (49) 11% (36) 45% (147) 10% (33) 329Ethnicity: White 22% (351) 20% (315) 11% (170) 37% (595) 11% (177) 1608Ethnicity: Hispanic 8% (15) 20% (38) 15% (30) 43% (83) 14% (27) 193
Continued on next page
Page 271
National Tracking Poll #2006102, June, 2020
271
Table POL16_1
Table POL16_1: How much do you trust the following to oversee the proper distribution of CARES Act Funds?President Donald Trump
Demographic A lot Some Not much Not at allDon’t know/No
opinion Total N
Registered Voters 19% (372) 18% (358) 11% (226) 41% (806) 11% (226) 1988Ethnicity: Afr. Am. 2% (5) 11% (27) 14% (36) 61% (154) 12% (31) 252Ethnicity: Other 12% (16) 13% (16) 16% (20) 45% (57) 15% (19) 128All Christian 23% (212) 22% (209) 13% (124) 33% (312) 9% (84) 941All Non-Christian 14% (14) 14% (14) 9% (9) 52% (51) 11% (10) 97Atheist 8% (11) 11% (14) 6% (8) 69% (88) 5% (7) 128Agnostic/Nothing in particular 13% (62) 14% (65) 11% (53) 46% (221) 16% (76) 478Something Else 21% (73) 17% (57) 10% (33) 39% (133) 14% (48) 344Religious Non-Protestant/Catholic 16% (19) 15% (18) 9% (11) 50% (59) 11% (13) 120Evangelical 27% (135) 23% (115) 15% (75) 24% (123) 11% (58) 505Non-Evangelical 19% (144) 19% (142) 10% (77) 42% (312) 10% (72) 746Community: Urban 16% (77) 15% (75) 11% (55) 45% (222) 12% (60) 490Community: Suburban 17% (164) 17% (169) 12% (117) 42% (416) 12% (115) 981Community: Rural 25% (130) 22% (114) 11% (55) 32% (167) 10% (50) 517Employ: Private Sector 19% (118) 19% (120) 14% (85) 40% (254) 8% (53) 631Employ: Government 10% (14) 21% (28) 13% (17) 47% (64) 9% (12) 136Employ: Self-Employed 16% (21) 17% (22) 10% (14) 42% (55) 14% (19) 130Employ: Homemaker 19% (22) 19% (21) 9% (10) 35% (41) 18% (20) 115Employ: Retired 26% (128) 16% (80) 10% (51) 39% (190) 9% (42) 492Employ: Unemployed 13% (29) 19% (43) 9% (21) 44% (101) 15% (35) 229Employ: Other 21% (33) 18% (27) 8% (13) 38% (57) 15% (23) 152Military HH: Yes 24% (73) 22% (66) 9% (29) 37% (114) 8% (24) 306Military HH: No 18% (298) 17% (292) 12% (198) 41% (692) 12% (202) 1682RD/WT: Right Direction 46% (259) 28% (158) 7% (42) 8% (45) 11% (64) 567RD/WT: Wrong Track 8% (113) 14% (200) 13% (185) 54% (760) 11% (162) 1421Trump Job Approve 45% (349) 36% (280) 6% (47) 2% (18) 10% (79) 774Trump Job Disapprove 2% (23) 6% (69) 15% (176) 68% (781) 9% (105) 1153Trump Job Strongly Approve 69% (286) 21% (88) 2% (7) 1% (3) 7% (31) 415Trump Job Somewhat Approve 18% (63) 54% (193) 11% (39) 4% (15) 13% (48) 359Trump Job Somewhat Disapprove 3% (6) 18% (41) 41% (92) 21% (48) 17% (39) 226Trump Job Strongly Disapprove 2% (17) 3% (28) 9% (84) 79% (733) 7% (66) 927
Continued on next page
Page 272
272
Morning ConsultTable POL16_1
Table POL16_1: How much do you trust the following to oversee the proper distribution of CARES Act Funds?President Donald Trump
Demographic A lot Some Not much Not at allDon’t know/No
opinion Total N
Registered Voters 19% (372) 18% (358) 11% (226) 41% (806) 11% (226) 1988Favorable of Trump 46% (360) 36% (285) 6% (44) 2% (19) 10% (79) 787Unfavorable of Trump 1% (11) 6% (65) 16% (180) 68% (773) 9% (103) 1132Very Favorable of Trump 67% (310) 22% (103) 2% (9) 2% (7) 7% (33) 462Somewhat Favorable of Trump 15% (50) 56% (182) 11% (34) 4% (12) 14% (46) 325Somewhat Unfavorable of Trump 1% (2) 18% (34) 46% (84) 16% (30) 18% (32) 182Very Unfavorable of Trump 1% (8) 3% (32) 10% (96) 78% (743) 7% (71) 950#1 Issue: Economy 19% (133) 24% (162) 15% (101) 34% (231) 9% (61) 688#1 Issue: Security 46% (117) 22% (55) 10% (25) 13% (33) 9% (24) 254#1 Issue: Health Care 10% (35) 15% (50) 8% (26) 55% (184) 12% (40) 335#1 Issue: Medicare / Social Security 17% (47) 15% (41) 10% (29) 45% (128) 13% (37) 283#1 Issue: Women’s Issues 7% (6) 5% (4) 10% (8) 64% (55) 14% (12) 86#1 Issue: Education 12% (13) 22% (23) 8% (8) 43% (46) 16% (17) 107#1 Issue: Energy 4% (3) 9% (7) 18% (14) 53% (42) 16% (12) 79#1 Issue: Other 11% (18) 10% (15) 9% (15) 55% (86) 14% (23) 1572018 House Vote: Democrat 2% (17) 7% (52) 12% (93) 74% (567) 5% (39) 7672018 House Vote: Republican 44% (279) 31% (192) 8% (51) 9% (56) 8% (52) 6292018 House Vote: Someone else 6% (4) 10% (7) 18% (13) 34% (25) 32% (23) 732016 Vote: Hillary Clinton 2% (13) 7% (51) 12% (84) 74% (519) 5% (35) 7002016 Vote: Donald Trump 44% (294) 29% (197) 9% (59) 9% (64) 9% (61) 6752016 Vote: Other 5% (7) 12% (17) 21% (31) 46% (67) 16% (23) 1442016 Vote: Didn’t Vote 13% (58) 20% (94) 11% (53) 33% (156) 23% (105) 466Voted in 2014: Yes 21% (277) 17% (222) 11% (145) 44% (576) 8% (102) 1322Voted in 2014: No 14% (95) 20% (136) 12% (81) 35% (230) 19% (124) 6662012 Vote: Barack Obama 6% (53) 11% (92) 14% (117) 63% (538) 6% (54) 8532012 Vote: Mitt Romney 42% (212) 28% (142) 8% (42) 12% (62) 9% (44) 5012012 Vote: Other 28% (23) 20% (17) 13% (11) 21% (17) 19% (16) 842012 Vote: Didn’t Vote 15% (83) 20% (108) 10% (57) 34% (188) 21% (113) 550
Continued on next page
Page 273
National Tracking Poll #2006102, June, 2020
273
Table POL16_1
Table POL16_1: How much do you trust the following to oversee the proper distribution of CARES Act Funds?President Donald Trump
Demographic A lot Some Not much Not at allDon’t know/No
opinion Total N
Registered Voters 19% (372) 18% (358) 11% (226) 41% (806) 11% (226) 19884-Region: Northeast 19% (67) 20% (72) 11% (39) 42% (148) 8% (29) 3554-Region: Midwest 18% (80) 17% (80) 11% (51) 42% (190) 12% (56) 4574-Region: South 21% (153) 19% (141) 13% (97) 35% (263) 12% (88) 7424-Region: West 16% (72) 15% (66) 9% (39) 47% (205) 12% (53) 434Party: Democrat/Leans Democrat 3% (26) 8% (69) 13% (117) 70% (634) 7% (66) 911Party: Republican/Leans Republican 43% (318) 32% (240) 8% (57) 7% (53) 10% (73) 741Parents 23% (195) 20% (171) 12% (105) 36% (307) 10% (85) 864Note: Row proportions may total to larger than one-hundred percent due to rounding. For more information visit MorningConsultIntelligence.com.
Page 274
274
Morning ConsultTable POL16_2
Table POL16_2: How much do you trust the following to oversee the proper distribution of CARES Act Funds?Republicans in Congress
Demographic A lot Some Not much Not at allDon’t know/No
opinion Total N
Registered Voters 14% (274) 24% (478) 19% (385) 29% (580) 14% (271) 1988Gender: Male 16% (150) 25% (233) 19% (177) 29% (267) 11% (103) 930Gender: Female 12% (124) 23% (245) 20% (208) 30% (312) 16% (168) 1058Age: 18-34 10% (48) 21% (104) 20% (100) 28% (140) 21% (107) 499Age: 35-44 16% (47) 22% (65) 21% (63) 27% (81) 15% (46) 302Age: 45-64 14% (104) 26% (185) 18% (128) 32% (228) 11% (79) 724Age: 65+ 16% (75) 27% (123) 21% (95) 28% (130) 8% (39) 463GenZers: 1997-2012 9% (20) 18% (40) 20% (44) 23% (52) 31% (69) 224Millennials: 1981-1996 11% (46) 24% (100) 21% (87) 31% (129) 14% (57) 419GenXers: 1965-1980 15% (77) 23% (117) 19% (95) 30% (153) 13% (69) 511Baby Boomers: 1946-1964 15% (111) 26% (196) 19% (147) 31% (234) 9% (71) 760PID: Dem (no lean) 3% (24) 11% (86) 25% (190) 50% (382) 10% (76) 757PID: Ind (no lean) 6% (38) 28% (179) 20% (129) 25% (158) 21% (133) 638PID: Rep (no lean) 36% (212) 36% (213) 11% (66) 7% (39) 11% (62) 593PID/Gender: DemMen 4% (14) 13% (42) 23% (76) 51% (169) 8% (27) 329PID/Gender: DemWomen 2% (10) 10% (44) 27% (114) 50% (213) 11% (49) 429PID/Gender: Ind Men 7% (22) 30% (88) 21% (61) 24% (72) 18% (54) 296PID/Gender: Ind Women 5% (17) 27% (92) 20% (68) 25% (86) 23% (79) 342PID/Gender: Rep Men 38% (115) 34% (103) 13% (39) 9% (26) 7% (22) 306PID/Gender: Rep Women 34% (97) 38% (109) 9% (27) 5% (13) 14% (40) 287Ideo: Liberal (1-3) 4% (27) 9% (55) 25% (150) 54% (330) 8% (46) 609Ideo: Moderate (4) 8% (40) 26% (134) 22% (116) 29% (153) 15% (81) 522Ideo: Conservative (5-7) 28% (192) 38% (261) 14% (93) 10% (65) 10% (69) 679Educ: < College 16% (198) 24% (305) 16% (200) 27% (332) 17% (216) 1250Educ: Bachelors degree 9% (41) 24% (112) 27% (125) 31% (148) 9% (44) 470Educ: Post-grad 13% (36) 23% (60) 22% (60) 37% (100) 4% (11) 267Income: Under 50k 14% (136) 24% (236) 18% (180) 28% (283) 16% (164) 998Income: 50k-100k 13% (85) 26% (170) 21% (137) 30% (195) 11% (73) 660Income: 100k+ 16% (53) 22% (72) 21% (69) 31% (102) 10% (33) 329Ethnicity: White 16% (250) 26% (418) 18% (293) 28% (447) 12% (200) 1608Ethnicity: Hispanic 9% (17) 20% (39) 21% (41) 31% (59) 19% (37) 193
Continued on next page
Page 275
National Tracking Poll #2006102, June, 2020
275
Table POL16_2
Table POL16_2: How much do you trust the following to oversee the proper distribution of CARES Act Funds?Republicans in Congress
Demographic A lot Some Not much Not at allDon’t know/No
opinion Total N
Registered Voters 14% (274) 24% (478) 19% (385) 29% (580) 14% (271) 1988Ethnicity: Afr. Am. 5% (12) 15% (37) 26% (66) 36% (92) 18% (45) 252Ethnicity: Other 9% (12) 18% (23) 21% (27) 31% (40) 20% (26) 128All Christian 16% (151) 30% (280) 21% (196) 23% (216) 10% (98) 941All Non-Christian 11% (11) 17% (17) 20% (19) 41% (40) 11% (11) 97Atheist 10% (12) 9% (11) 19% (24) 52% (67) 11% (14) 128Agnostic/Nothing in particular 9% (45) 20% (95) 17% (81) 35% (167) 19% (90) 478Something Else 16% (55) 22% (76) 19% (65) 26% (89) 17% (59) 344Religious Non-Protestant/Catholic 10% (12) 20% (24) 23% (27) 34% (41) 13% (16) 120Evangelical 20% (99) 30% (152) 21% (105) 16% (83) 13% (66) 505Non-Evangelical 14% (106) 25% (188) 20% (146) 30% (220) 11% (85) 746Community: Urban 14% (66) 19% (91) 22% (106) 31% (152) 15% (74) 490Community: Suburban 12% (116) 24% (233) 20% (200) 31% (302) 13% (130) 981Community: Rural 18% (92) 30% (153) 15% (79) 24% (125) 13% (68) 517Employ: Private Sector 16% (100) 24% (154) 21% (134) 30% (188) 9% (56) 631Employ: Government 9% (13) 19% (26) 21% (29) 38% (52) 12% (16) 136Employ: Self-Employed 8% (11) 26% (33) 15% (19) 35% (46) 16% (21) 130Employ: Homemaker 8% (9) 27% (31) 19% (22) 26% (30) 20% (23) 115Employ: Retired 19% (92) 25% (125) 19% (95) 27% (135) 9% (45) 492Employ: Unemployed 12% (27) 19% (44) 19% (43) 28% (65) 22% (50) 229Employ: Other 11% (16) 28% (42) 14% (21) 28% (43) 20% (30) 152Military HH: Yes 17% (51) 28% (85) 17% (52) 31% (96) 7% (23) 306Military HH: No 13% (224) 23% (393) 20% (333) 29% (483) 15% (249) 1682RD/WT: Right Direction 34% (195) 36% (207) 10% (59) 6% (37) 12% (70) 567RD/WT: Wrong Track 6% (79) 19% (271) 23% (326) 38% (543) 14% (201) 1421Trump Job Approve 32% (249) 41% (319) 11% (81) 5% (38) 11% (87) 774Trump Job Disapprove 2% (24) 13% (150) 26% (299) 47% (538) 12% (142) 1153Trump Job Strongly Approve 47% (193) 36% (148) 5% (21) 4% (16) 9% (36) 415Trump Job Somewhat Approve 15% (55) 48% (171) 17% (60) 6% (21) 14% (51) 359Trump Job Somewhat Disapprove 2% (4) 27% (62) 37% (84) 17% (39) 17% (38) 226Trump Job Strongly Disapprove 2% (20) 10% (88) 23% (215) 54% (499) 11% (105) 927
Continued on next page
Page 276
276
Morning ConsultTable POL16_2
Table POL16_2: How much do you trust the following to oversee the proper distribution of CARES Act Funds?Republicans in Congress
Demographic A lot Some Not much Not at allDon’t know/No
opinion Total N
Registered Voters 14% (274) 24% (478) 19% (385) 29% (580) 14% (271) 1988Favorable of Trump 32% (250) 42% (334) 10% (77) 5% (36) 11% (90) 787Unfavorable of Trump 2% (20) 12% (138) 27% (302) 47% (536) 12% (136) 1132Very Favorable of Trump 45% (208) 35% (164) 7% (30) 4% (18) 9% (42) 462Somewhat Favorable of Trump 13% (42) 53% (171) 14% (47) 6% (19) 15% (47) 325Somewhat Unfavorable of Trump 2% (4) 27% (49) 39% (71) 14% (26) 17% (31) 182Very Unfavorable of Trump 2% (16) 9% (89) 24% (231) 54% (509) 11% (105) 950#1 Issue: Economy 14% (97) 29% (202) 21% (145) 24% (168) 11% (75) 688#1 Issue: Security 33% (83) 34% (86) 12% (30) 11% (27) 11% (28) 254#1 Issue: Health Care 10% (33) 18% (60) 21% (72) 37% (124) 14% (46) 335#1 Issue: Medicare / Social Security 13% (36) 19% (55) 18% (51) 35% (98) 15% (43) 283#1 Issue: Women’s Issues 8% (7) 16% (14) 21% (18) 39% (34) 16% (14) 86#1 Issue: Education 7% (7) 24% (25) 21% (22) 30% (32) 19% (20) 107#1 Issue: Energy 6% (5) 13% (10) 25% (19) 37% (29) 19% (15) 79#1 Issue: Other 3% (5) 16% (26) 18% (28) 43% (67) 19% (30) 1572018 House Vote: Democrat 2% (18) 12% (92) 25% (195) 54% (411) 7% (52) 7672018 House Vote: Republican 32% (200) 39% (245) 12% (77) 8% (52) 9% (56) 6292018 House Vote: Someone else 1% (1) 21% (15) 28% (20) 23% (17) 28% (20) 732016 Vote: Hillary Clinton 2% (17) 13% (88) 25% (175) 53% (370) 7% (51) 7002016 Vote: Donald Trump 30% (203) 37% (249) 14% (91) 10% (64) 10% (67) 6752016 Vote: Other 2% (3) 21% (31) 28% (41) 32% (47) 16% (23) 1442016 Vote: Didn’t Vote 11% (50) 24% (110) 17% (79) 21% (98) 28% (130) 466Voted in 2014: Yes 15% (198) 24% (311) 20% (260) 33% (434) 9% (118) 1322Voted in 2014: No 11% (76) 25% (167) 19% (125) 22% (145) 23% (153) 6662012 Vote: Barack Obama 5% (40) 16% (138) 24% (207) 46% (395) 9% (73) 8532012 Vote: Mitt Romney 31% (157) 36% (180) 13% (67) 10% (51) 9% (46) 5012012 Vote: Other 13% (11) 27% (22) 21% (18) 22% (18) 18% (15) 842012 Vote: Didn’t Vote 12% (67) 25% (137) 17% (94) 21% (114) 25% (138) 550
Continued on next page
Page 277
National Tracking Poll #2006102, June, 2020
277
Table POL16_2
Table POL16_2: How much do you trust the following to oversee the proper distribution of CARES Act Funds?Republicans in Congress
Demographic A lot Some Not much Not at allDon’t know/No
opinion Total N
Registered Voters 14% (274) 24% (478) 19% (385) 29% (580) 14% (271) 19884-Region: Northeast 14% (50) 26% (94) 18% (62) 30% (107) 12% (42) 3554-Region: Midwest 12% (56) 25% (114) 19% (85) 29% (134) 15% (67) 4574-Region: South 15% (115) 25% (189) 18% (136) 28% (204) 13% (98) 7424-Region: West 12% (54) 19% (81) 23% (101) 31% (134) 15% (64) 434Party: Democrat/Leans Democrat 3% (25) 13% (118) 25% (229) 50% (456) 9% (83) 911Party: Republican/Leans Republican 31% (232) 38% (285) 12% (92) 7% (49) 11% (83) 741Parents 17% (146) 26% (224) 20% (170) 26% (221) 12% (103) 864Note: Row proportions may total to larger than one-hundred percent due to rounding. For more information visit MorningConsultIntelligence.com.
Page 278
278
Morning ConsultTable POL16_3
Table POL16_3: How much do you trust the following to oversee the proper distribution of CARES Act Funds?Democrats in Congress
Demographic A lot Some Not much Not at allDon’t know/No
opinion Total N
Registered Voters 17% (340) 30% (587) 15% (300) 24% (481) 14% (280) 1988Gender: Male 18% (165) 28% (259) 17% (158) 26% (241) 12% (108) 930Gender: Female 17% (175) 31% (328) 13% (142) 23% (241) 16% (172) 1058Age: 18-34 17% (87) 34% (169) 13% (66) 13% (64) 23% (114) 499Age: 35-44 17% (50) 35% (106) 15% (45) 19% (58) 14% (42) 302Age: 45-64 17% (123) 27% (195) 17% (124) 27% (197) 12% (85) 724Age: 65+ 17% (79) 25% (117) 14% (65) 35% (162) 8% (39) 463GenZers: 1997-2012 16% (37) 29% (65) 10% (23) 12% (27) 32% (71) 224Millennials: 1981-1996 17% (73) 36% (151) 15% (62) 17% (72) 15% (62) 419GenXers: 1965-1980 17% (89) 31% (158) 16% (81) 23% (118) 13% (65) 511Baby Boomers: 1946-1964 17% (131) 26% (198) 17% (127) 30% (228) 10% (77) 760PID: Dem (no lean) 36% (270) 41% (313) 9% (70) 3% (21) 11% (83) 757PID: Ind (no lean) 7% (41) 28% (178) 19% (124) 25% (161) 21% (133) 638PID: Rep (no lean) 5% (28) 16% (95) 18% (106) 50% (299) 11% (64) 593PID/Gender: DemMen 38% (124) 40% (131) 9% (31) 3% (11) 10% (32) 329PID/Gender: DemWomen 34% (147) 42% (182) 9% (39) 2% (10) 12% (51) 429PID/Gender: Ind Men 7% (22) 26% (76) 24% (71) 25% (75) 18% (52) 296PID/Gender: Ind Women 6% (20) 30% (102) 16% (53) 25% (86) 24% (81) 342PID/Gender: Rep Men 6% (19) 17% (52) 18% (56) 50% (154) 8% (24) 306PID/Gender: Rep Women 3% (9) 15% (44) 17% (50) 50% (144) 14% (40) 287Ideo: Liberal (1-3) 32% (192) 45% (275) 11% (67) 5% (32) 7% (43) 609Ideo: Moderate (4) 16% (86) 33% (170) 15% (81) 18% (96) 17% (90) 522Ideo: Conservative (5-7) 6% (42) 16% (108) 20% (133) 48% (329) 10% (68) 679Educ: < College 16% (202) 26% (326) 14% (171) 26% (327) 18% (224) 1250Educ: Bachelors degree 18% (83) 34% (158) 18% (84) 21% (101) 9% (44) 470Educ: Post-grad 20% (55) 38% (103) 17% (44) 20% (53) 5% (13) 267Income: Under 50k 19% (187) 27% (266) 13% (130) 24% (242) 17% (173) 998Income: 50k-100k 15% (98) 31% (203) 18% (119) 26% (171) 11% (70) 660Income: 100k+ 17% (55) 36% (118) 16% (51) 21% (68) 11% (37) 329Ethnicity: White 15% (240) 28% (453) 16% (263) 28% (444) 13% (208) 1608Ethnicity: Hispanic 23% (43) 33% (64) 7% (14) 15% (29) 22% (42) 193
Continued on next page
Page 279
National Tracking Poll #2006102, June, 2020
279
Table POL16_3
Table POL16_3: How much do you trust the following to oversee the proper distribution of CARES Act Funds?Democrats in Congress
Demographic A lot Some Not much Not at allDon’t know/No
opinion Total N
Registered Voters 17% (340) 30% (587) 15% (300) 24% (481) 14% (280) 1988Ethnicity: Afr. Am. 32% (81) 34% (87) 9% (23) 7% (18) 17% (44) 252Ethnicity: Other 15% (19) 37% (47) 10% (13) 15% (20) 22% (29) 128All Christian 15% (144) 27% (254) 18% (168) 29% (276) 11% (100) 941All Non-Christian 28% (28) 35% (34) 15% (15) 11% (11) 11% (10) 97Atheist 22% (29) 38% (48) 15% (19) 16% (21) 9% (11) 128Agnostic/Nothing in particular 19% (90) 31% (146) 13% (60) 19% (92) 19% (91) 478Something Else 15% (50) 31% (105) 11% (39) 24% (82) 20% (68) 344Religious Non-Protestant/Catholic 24% (29) 33% (40) 16% (19) 13% (15) 13% (16) 120Evangelical 12% (62) 26% (131) 15% (77) 33% (165) 14% (71) 505Non-Evangelical 17% (127) 29% (217) 16% (123) 25% (188) 12% (91) 746Community: Urban 23% (111) 33% (163) 10% (47) 19% (93) 15% (74) 490Community: Suburban 17% (167) 30% (294) 16% (160) 23% (224) 14% (135) 981Community: Rural 12% (61) 25% (129) 18% (92) 32% (164) 14% (71) 517Employ: Private Sector 19% (118) 32% (202) 18% (113) 22% (139) 9% (59) 631Employ: Government 16% (22) 36% (48) 17% (23) 20% (27) 12% (16) 136Employ: Self-Employed 15% (20) 30% (39) 14% (18) 23% (30) 18% (23) 130Employ: Homemaker 12% (14) 21% (24) 20% (23) 24% (27) 23% (27) 115Employ: Retired 18% (86) 24% (120) 14% (68) 35% (170) 10% (48) 492Employ: Unemployed 21% (47) 31% (71) 12% (27) 17% (39) 20% (45) 229Employ: Other 13% (19) 29% (44) 11% (17) 26% (40) 21% (32) 152Military HH: Yes 14% (43) 26% (80) 13% (41) 37% (114) 9% (28) 306Military HH: No 18% (297) 30% (506) 15% (259) 22% (367) 15% (253) 1682RD/WT: Right Direction 9% (51) 17% (95) 17% (96) 45% (256) 12% (69) 567RD/WT: Wrong Track 20% (289) 35% (492) 14% (204) 16% (225) 15% (211) 1421Trump Job Approve 6% (44) 16% (122) 19% (149) 48% (369) 12% (90) 774Trump Job Disapprove 26% (296) 40% (459) 13% (145) 9% (105) 13% (148) 1153Trump Job Strongly Approve 6% (25) 8% (32) 13% (56) 64% (265) 9% (36) 415Trump Job Somewhat Approve 5% (19) 25% (90) 26% (93) 29% (103) 15% (54) 359Trump Job Somewhat Disapprove 13% (29) 37% (84) 18% (40) 15% (35) 17% (39) 226Trump Job Strongly Disapprove 29% (267) 40% (375) 11% (105) 8% (70) 12% (109) 927
Continued on next page
Page 280
280
Morning ConsultTable POL16_3
Table POL16_3: How much do you trust the following to oversee the proper distribution of CARES Act Funds?Democrats in Congress
Demographic A lot Some Not much Not at allDon’t know/No
opinion Total N
Registered Voters 17% (340) 30% (587) 15% (300) 24% (481) 14% (280) 1988Favorable of Trump 5% (43) 16% (125) 19% (146) 48% (381) 12% (92) 787Unfavorable of Trump 26% (293) 40% (453) 13% (149) 8% (93) 13% (144) 1132Very Favorable of Trump 6% (26) 9% (42) 13% (59) 63% (292) 9% (44) 462Somewhat Favorable of Trump 5% (17) 26% (83) 27% (87) 27% (89) 15% (48) 325Somewhat Unfavorable of Trump 10% (18) 37% (67) 21% (37) 14% (26) 19% (34) 182Very Unfavorable of Trump 29% (275) 41% (387) 12% (112) 7% (67) 12% (110) 950#1 Issue: Economy 15% (103) 30% (204) 19% (134) 24% (168) 11% (79) 688#1 Issue: Security 7% (17) 14% (36) 13% (33) 56% (141) 10% (27) 254#1 Issue: Health Care 24% (82) 36% (120) 13% (42) 13% (42) 15% (49) 335#1 Issue: Medicare / Social Security 22% (61) 27% (76) 13% (37) 22% (61) 17% (48) 283#1 Issue: Women’s Issues 22% (19) 38% (32) 12% (10) 13% (11) 16% (14) 86#1 Issue: Education 16% (17) 35% (37) 15% (16) 16% (17) 19% (20) 107#1 Issue: Energy 15% (12) 40% (32) 17% (13) 9% (7) 19% (15) 79#1 Issue: Other 18% (29) 32% (50) 9% (15) 22% (34) 19% (29) 1572018 House Vote: Democrat 32% (248) 44% (341) 11% (88) 5% (37) 7% (54) 7672018 House Vote: Republican 5% (31) 15% (93) 19% (117) 53% (332) 9% (56) 6292018 House Vote: Someone else 3% (2) 18% (13) 21% (16) 25% (18) 33% (24) 732016 Vote: Hillary Clinton 35% (242) 45% (313) 11% (76) 3% (21) 7% (49) 7002016 Vote: Donald Trump 5% (32) 13% (89) 21% (139) 51% (345) 10% (70) 6752016 Vote: Other 4% (6) 33% (48) 21% (31) 25% (35) 17% (24) 1442016 Vote: Didn’t Vote 12% (57) 29% (137) 12% (54) 17% (80) 30% (138) 466Voted in 2014: Yes 19% (250) 29% (386) 15% (205) 27% (362) 9% (119) 1322Voted in 2014: No 13% (90) 30% (200) 14% (95) 18% (119) 24% (161) 6662012 Vote: Barack Obama 29% (245) 39% (332) 15% (127) 8% (72) 9% (77) 8532012 Vote: Mitt Romney 3% (17) 14% (73) 19% (97) 55% (273) 8% (41) 5012012 Vote: Other 3% (3) 17% (15) 15% (12) 46% (38) 19% (16) 842012 Vote: Didn’t Vote 13% (74) 31% (168) 12% (64) 18% (98) 27% (146) 550
Continued on next page
Page 281
National Tracking Poll #2006102, June, 2020
281
Table POL16_3
Table POL16_3: How much do you trust the following to oversee the proper distribution of CARES Act Funds?Democrats in Congress
Demographic A lot Some Not much Not at allDon’t know/No
opinion Total N
Registered Voters 17% (340) 30% (587) 15% (300) 24% (481) 14% (280) 19884-Region: Northeast 20% (70) 32% (113) 15% (52) 21% (75) 12% (44) 3554-Region: Midwest 16% (71) 26% (121) 17% (78) 26% (116) 15% (70) 4574-Region: South 16% (116) 29% (215) 16% (117) 27% (197) 13% (98) 7424-Region: West 19% (83) 32% (138) 12% (53) 21% (93) 16% (69) 434Party: Democrat/Leans Democrat 32% (294) 45% (408) 10% (91) 3% (30) 10% (88) 911Party: Republican/Leans Republican 5% (34) 15% (115) 19% (140) 49% (367) 12% (85) 741Parents 15% (125) 28% (245) 18% (153) 27% (231) 13% (109) 864Note: Row proportions may total to larger than one-hundred percent due to rounding. For more information visit MorningConsultIntelligence.com.
Page 282
282
Morning ConsultTable POL17
Table POL17: Would you say the Supreme Court is liberal, moderate, or conservative?
Demographic Liberal Moderate ConservativeDon’t know / No
opinion Total N
Registered Voters 13% (268) 37% (741) 28% (551) 22% (428) 1988Gender: Male 16% (145) 38% (356) 30% (275) 17% (154) 930Gender: Female 12% (123) 36% (385) 26% (276) 26% (273) 1058Age: 18-34 12% (62) 35% (173) 23% (115) 30% (150) 499Age: 35-44 16% (50) 38% (114) 27% (82) 19% (56) 302Age: 45-64 14% (102) 36% (257) 30% (216) 21% (148) 724Age: 65+ 12% (54) 43% (197) 30% (138) 16% (73) 463GenZers: 1997-2012 12% (27) 30% (68) 22% (50) 35% (79) 224Millennials: 1981-1996 15% (62) 37% (155) 24% (100) 24% (102) 419GenXers: 1965-1980 14% (72) 38% (195) 29% (149) 19% (95) 511Baby Boomers: 1946-1964 12% (93) 39% (294) 30% (231) 19% (142) 760PID: Dem (no lean) 13% (100) 35% (267) 33% (247) 19% (143) 757PID: Ind (no lean) 11% (69) 38% (239) 25% (156) 27% (173) 638PID: Rep (no lean) 17% (98) 40% (235) 25% (148) 19% (111) 593PID/Gender: DemMen 19% (62) 33% (108) 34% (112) 15% (48) 329PID/Gender: DemWomen 9% (39) 37% (159) 32% (135) 22% (96) 429PID/Gender: Ind Men 11% (34) 43% (128) 23% (69) 22% (64) 296PID/Gender: Ind Women 10% (35) 33% (111) 25% (87) 32% (108) 342PID/Gender: Rep Men 16% (49) 39% (120) 31% (94) 14% (42) 306PID/Gender: Rep Women 17% (49) 40% (115) 19% (54) 24% (70) 287Ideo: Liberal (1-3) 16% (100) 31% (189) 40% (245) 12% (74) 609Ideo: Moderate (4) 7% (38) 50% (259) 20% (104) 23% (121) 522Ideo: Conservative (5-7) 18% (122) 39% (264) 29% (195) 15% (99) 679Educ: < College 14% (170) 36% (446) 24% (302) 26% (331) 1250Educ: Bachelors degree 13% (63) 39% (185) 32% (151) 15% (71) 470Educ: Post-grad 13% (34) 41% (110) 37% (98) 10% (26) 267Income: Under 50k 13% (134) 35% (350) 26% (256) 26% (258) 998Income: 50k-100k 12% (81) 39% (258) 31% (202) 18% (119) 660Income: 100k+ 16% (52) 41% (134) 28% (93) 15% (51) 329Ethnicity: White 13% (213) 39% (627) 28% (449) 20% (319) 1608Ethnicity: Hispanic 12% (24) 38% (73) 28% (54) 21% (41) 193Ethnicity: Afr. Am. 16% (40) 31% (78) 25% (63) 28% (71) 252
Continued on next page
Page 283
National Tracking Poll #2006102, June, 2020
283
Table POL17
Table POL17: Would you say the Supreme Court is liberal, moderate, or conservative?
Demographic Liberal Moderate ConservativeDon’t know / No
opinion Total N
Registered Voters 13% (268) 37% (741) 28% (551) 22% (428) 1988Ethnicity: Other 12% (15) 28% (36) 30% (39) 30% (38) 128All Christian 15% (144) 40% (375) 26% (245) 19% (176) 941All Non-Christian 12% (12) 38% (37) 41% (40) 9% (9) 97Atheist 17% (22) 31% (40) 40% (51) 12% (15) 128Agnostic/Nothing in particular 10% (46) 35% (168) 29% (139) 26% (125) 478Something Else 13% (44) 35% (122) 22% (75) 30% (103) 344Religious Non-Protestant/Catholic 13% (16) 37% (44) 37% (45) 13% (15) 120Evangelical 17% (84) 39% (199) 22% (112) 22% (110) 505Non-Evangelical 13% (100) 38% (285) 27% (199) 22% (162) 746Community: Urban 17% (82) 34% (164) 28% (139) 21% (104) 490Community: Suburban 14% (133) 37% (367) 29% (280) 20% (200) 981Community: Rural 10% (53) 40% (209) 25% (132) 24% (123) 517Employ: Private Sector 16% (100) 38% (237) 30% (187) 17% (106) 631Employ: Government 19% (25) 42% (57) 24% (32) 16% (22) 136Employ: Self-Employed 10% (14) 36% (47) 29% (37) 25% (33) 130Employ: Homemaker 11% (13) 33% (38) 24% (28) 32% (36) 115Employ: Retired 12% (59) 42% (207) 30% (149) 16% (77) 492Employ: Unemployed 14% (32) 33% (75) 24% (55) 29% (67) 229Employ: Other 9% (14) 31% (47) 27% (40) 33% (50) 152Military HH: Yes 15% (47) 37% (113) 31% (96) 17% (51) 306Military HH: No 13% (221) 37% (629) 27% (456) 22% (377) 1682RD/WT: Right Direction 18% (100) 42% (237) 21% (122) 19% (109) 567RD/WT: Wrong Track 12% (168) 36% (505) 30% (430) 22% (318) 1421Trump Job Approve 17% (134) 41% (318) 23% (175) 19% (146) 774Trump Job Disapprove 11% (130) 35% (407) 32% (372) 21% (244) 1153Trump Job Strongly Approve 19% (77) 40% (164) 23% (96) 19% (77) 415Trump Job Somewhat Approve 16% (57) 43% (154) 22% (78) 19% (69) 359Trump Job Somewhat Disapprove 16% (37) 38% (87) 23% (51) 23% (52) 226Trump Job Strongly Disapprove 10% (93) 35% (320) 35% (321) 21% (192) 927Favorable of Trump 18% (143) 41% (320) 22% (176) 19% (148) 787Unfavorable of Trump 11% (119) 36% (405) 32% (366) 21% (242) 1132
Continued on next page
Page 284
284
Morning ConsultTable POL17
Table POL17: Would you say the Supreme Court is liberal, moderate, or conservative?
Demographic Liberal Moderate ConservativeDon’t know / No
opinion Total N
Registered Voters 13% (268) 37% (741) 28% (551) 22% (428) 1988Very Favorable of Trump 20% (92) 39% (182) 22% (104) 18% (85) 462Somewhat Favorable of Trump 16% (52) 42% (138) 22% (72) 19% (63) 325Somewhat Unfavorable of Trump 15% (26) 41% (75) 22% (40) 22% (41) 182Very Unfavorable of Trump 10% (93) 35% (330) 34% (326) 21% (201) 950#1 Issue: Economy 15% (102) 39% (265) 27% (187) 20% (134) 688#1 Issue: Security 18% (46) 45% (113) 18% (45) 20% (50) 254#1 Issue: Health Care 14% (45) 34% (115) 29% (97) 23% (78) 335#1 Issue: Medicare / Social Security 9% (26) 36% (103) 32% (89) 23% (65) 283#1 Issue: Women’s Issues 14% (12) 32% (28) 37% (32) 17% (14) 86#1 Issue: Education 9% (9) 33% (35) 29% (31) 29% (31) 107#1 Issue: Energy 11% (9) 44% (35) 30% (24) 15% (12) 79#1 Issue: Other 12% (19) 30% (48) 29% (46) 28% (44) 1572018 House Vote: Democrat 11% (88) 36% (274) 37% (286) 15% (119) 7672018 House Vote: Republican 18% (114) 45% (284) 23% (142) 14% (90) 6292018 House Vote: Someone else 13% (10) 21% (15) 28% (21) 37% (27) 732016 Vote: Hillary Clinton 12% (84) 36% (250) 37% (260) 15% (105) 7002016 Vote: Donald Trump 18% (118) 42% (284) 23% (155) 17% (118) 6752016 Vote: Other 10% (14) 40% (58) 26% (38) 23% (34) 1442016 Vote: Didn’t Vote 11% (50) 32% (148) 21% (96) 37% (171) 466Voted in 2014: Yes 15% (199) 40% (528) 30% (399) 15% (196) 1322Voted in 2014: No 10% (69) 32% (213) 23% (152) 35% (232) 6662012 Vote: Barack Obama 12% (106) 37% (313) 34% (294) 16% (140) 8532012 Vote: Mitt Romney 18% (91) 45% (227) 24% (118) 13% (65) 5012012 Vote: Other 14% (12) 37% (31) 19% (16) 30% (25) 842012 Vote: Didn’t Vote 10% (57) 31% (171) 22% (123) 36% (198) 5504-Region: Northeast 15% (51) 35% (125) 28% (98) 23% (80) 3554-Region: Midwest 11% (52) 37% (168) 28% (129) 24% (108) 4574-Region: South 15% (112) 41% (304) 25% (183) 19% (143) 7424-Region: West 12% (53) 33% (144) 32% (141) 22% (96) 434Party: Democrat/Leans Democrat 12% (113) 36% (328) 33% (304) 18% (166) 911Party: Republican/Leans Republican 16% (122) 42% (308) 23% (173) 19% (138) 741
Continued on next page
Page 285
National Tracking Poll #2006102, June, 2020
285
Table POL17
Table POL17: Would you say the Supreme Court is liberal, moderate, or conservative?
Demographic Liberal Moderate ConservativeDon’t know / No
opinion Total N
Registered Voters 13% (268) 37% (741) 28% (551) 22% (428) 1988Parents 13% (115) 39% (334) 28% (241) 20% (174) 864Note: Row proportions may total to larger than one-hundred percent due to rounding. For more information visit MorningConsultIntelligence.com.
Page 286
286
Morning ConsultTable POL18_1
Table POL18_1: How much have you seen, read, or heard about the following?The Supreme Court blocking the Trump administration’s attempt to end the DACA program that protects undocumented immigrants who were broughtinto the United States illegally as children from being deported
Demographic A lot Some Not Much Nothing at all Total N
Registered Voters 31% (612) 36% (718) 16% (320) 17% (338) 1988Gender: Male 33% (311) 37% (345) 13% (122) 16% (153) 930Gender: Female 28% (301) 35% (373) 19% (198) 18% (186) 1058Age: 18-34 26% (131) 30% (152) 20% (100) 23% (117) 499Age: 35-44 27% (80) 40% (122) 15% (45) 18% (55) 302Age: 45-64 30% (220) 37% (265) 15% (109) 18% (130) 724Age: 65+ 39% (181) 39% (179) 14% (66) 8% (37) 463GenZers: 1997-2012 26% (58) 25% (56) 20% (44) 29% (65) 224Millennials: 1981-1996 24% (102) 37% (154) 19% (81) 20% (83) 419GenXers: 1965-1980 31% (157) 39% (198) 14% (71) 17% (86) 511Baby Boomers: 1946-1964 35% (266) 37% (279) 15% (114) 13% (102) 760PID: Dem (no lean) 42% (319) 33% (249) 12% (91) 13% (99) 757PID: Ind (no lean) 24% (151) 36% (230) 20% (125) 21% (132) 638PID: Rep (no lean) 24% (143) 40% (238) 18% (105) 18% (107) 593PID/Gender: DemMen 43% (142) 32% (106) 11% (37) 13% (44) 329PID/Gender: DemWomen 41% (177) 34% (144) 13% (54) 13% (54) 429PID/Gender: Ind Men 27% (80) 36% (108) 15% (44) 22% (64) 296PID/Gender: Ind Women 21% (71) 36% (122) 23% (80) 20% (68) 342PID/Gender: Rep Men 29% (89) 43% (131) 14% (41) 15% (44) 306PID/Gender: Rep Women 19% (54) 37% (107) 22% (63) 22% (63) 287Ideo: Liberal (1-3) 45% (273) 33% (203) 12% (74) 10% (58) 609Ideo: Moderate (4) 28% (146) 35% (182) 18% (92) 20% (102) 522Ideo: Conservative (5-7) 26% (174) 42% (287) 17% (114) 15% (105) 679Educ: < College 25% (316) 35% (444) 17% (217) 22% (273) 1250Educ: Bachelors degree 38% (177) 36% (170) 15% (71) 11% (52) 470Educ: Post-grad 45% (119) 39% (104) 12% (31) 5% (13) 267Income: Under 50k 27% (266) 34% (337) 18% (175) 22% (221) 998Income: 50k-100k 33% (218) 39% (258) 15% (99) 13% (85) 660Income: 100k+ 39% (129) 37% (123) 14% (46) 10% (32) 329Ethnicity: White 30% (486) 37% (601) 16% (261) 16% (259) 1608Ethnicity: Hispanic 31% (59) 36% (70) 16% (30) 18% (34) 193
Continued on next page
Page 287
National Tracking Poll #2006102, June, 2020
287
Table POL18_1
Table POL18_1: How much have you seen, read, or heard about the following?The Supreme Court blocking the Trump administration’s attempt to end the DACA program that protects undocumented immigrants who were broughtinto the United States illegally as children from being deported
Demographic A lot Some Not Much Nothing at all Total N
Registered Voters 31% (612) 36% (718) 16% (320) 17% (338) 1988Ethnicity: Afr. Am. 32% (80) 29% (73) 16% (41) 23% (58) 252Ethnicity: Other 36% (46) 34% (44) 13% (17) 16% (21) 128All Christian 31% (292) 40% (376) 14% (136) 15% (137) 941All Non-Christian 43% (42) 32% (32) 17% (16) 8% (7) 97Atheist 40% (51) 29% (37) 15% (19) 16% (21) 128Agnostic/Nothing in particular 28% (133) 35% (166) 17% (79) 21% (100) 478Something Else 27% (93) 31% (108) 20% (69) 21% (73) 344Religious Non-Protestant/Catholic 40% (48) 31% (38) 16% (19) 13% (15) 120Evangelical 24% (123) 38% (192) 21% (106) 17% (83) 505Non-Evangelical 34% (255) 38% (281) 13% (95) 15% (115) 746Community: Urban 32% (155) 36% (176) 15% (73) 18% (87) 490Community: Suburban 34% (329) 36% (356) 15% (150) 15% (146) 981Community: Rural 25% (129) 36% (186) 19% (97) 20% (106) 517Employ: Private Sector 33% (209) 38% (238) 15% (92) 15% (92) 631Employ: Government 28% (38) 41% (55) 18% (24) 13% (18) 136Employ: Self-Employed 27% (35) 39% (50) 15% (19) 20% (25) 130Employ: Homemaker 22% (25) 29% (33) 23% (27) 26% (30) 115Employ: Retired 37% (183) 38% (185) 15% (74) 10% (50) 492Employ: Unemployed 22% (50) 34% (79) 16% (36) 28% (65) 229Employ: Other 24% (37) 33% (50) 19% (29) 24% (36) 152Military HH: Yes 33% (103) 37% (112) 20% (62) 10% (29) 306Military HH: No 30% (509) 36% (606) 15% (258) 18% (309) 1682RD/WT: Right Direction 23% (132) 39% (219) 20% (114) 18% (102) 567RD/WT: Wrong Track 34% (480) 35% (499) 14% (206) 17% (236) 1421Trump Job Approve 23% (179) 39% (300) 20% (151) 19% (144) 774Trump Job Disapprove 37% (429) 35% (401) 14% (157) 14% (167) 1153Trump Job Strongly Approve 28% (117) 40% (165) 16% (68) 16% (65) 415Trump Job Somewhat Approve 17% (62) 38% (135) 23% (83) 22% (78) 359Trump Job Somewhat Disapprove 18% (42) 40% (91) 22% (49) 20% (44) 226Trump Job Strongly Disapprove 42% (387) 33% (309) 12% (108) 13% (122) 927
Continued on next page
Page 288
288
Morning ConsultTable POL18_1
Table POL18_1: How much have you seen, read, or heard about the following?The Supreme Court blocking the Trump administration’s attempt to end the DACA program that protects undocumented immigrants who were broughtinto the United States illegally as children from being deported
Demographic A lot Some Not Much Nothing at all Total N
Registered Voters 31% (612) 36% (718) 16% (320) 17% (338) 1988Favorable of Trump 22% (174) 40% (315) 19% (149) 19% (149) 787Unfavorable of Trump 38% (431) 34% (387) 14% (157) 14% (157) 1132Very Favorable of Trump 25% (117) 40% (184) 17% (78) 18% (83) 462Somewhat Favorable of Trump 18% (57) 40% (131) 22% (71) 20% (66) 325Somewhat Unfavorable of Trump 19% (34) 37% (67) 25% (45) 20% (36) 182Very Unfavorable of Trump 42% (397) 34% (320) 12% (112) 13% (121) 950#1 Issue: Economy 29% (197) 37% (258) 19% (129) 15% (105) 688#1 Issue: Security 25% (64) 41% (105) 18% (47) 15% (37) 254#1 Issue: Health Care 36% (121) 37% (122) 10% (33) 18% (59) 335#1 Issue: Medicare / Social Security 31% (89) 35% (98) 19% (54) 15% (42) 283#1 Issue: Women’s Issues 30% (26) 31% (26) 16% (14) 24% (20) 86#1 Issue: Education 31% (33) 31% (33) 14% (15) 24% (26) 107#1 Issue: Energy 30% (24) 36% (29) 16% (13) 17% (14) 79#1 Issue: Other 38% (59) 29% (46) 11% (17) 22% (35) 1572018 House Vote: Democrat 45% (343) 34% (261) 12% (88) 10% (74) 7672018 House Vote: Republican 27% (171) 40% (253) 19% (117) 14% (88) 6292018 House Vote: Someone else 21% (15) 33% (24) 24% (18) 22% (16) 732016 Vote: Hillary Clinton 46% (322) 32% (225) 11% (76) 11% (78) 7002016 Vote: Donald Trump 26% (175) 40% (272) 19% (129) 15% (100) 6752016 Vote: Other 24% (35) 47% (68) 20% (29) 9% (13) 1442016 Vote: Didn’t Vote 17% (78) 33% (154) 19% (87) 32% (147) 466Voted in 2014: Yes 37% (484) 37% (492) 15% (196) 11% (150) 1322Voted in 2014: No 19% (128) 34% (226) 19% (124) 28% (188) 6662012 Vote: Barack Obama 39% (334) 37% (319) 13% (111) 10% (88) 8532012 Vote: Mitt Romney 28% (141) 42% (208) 18% (89) 13% (63) 5012012 Vote: Other 26% (21) 40% (33) 18% (15) 17% (14) 842012 Vote: Didn’t Vote 21% (114) 29% (157) 19% (105) 32% (173) 550
Continued on next page
Page 289
National Tracking Poll #2006102, June, 2020
289
Table POL18_1
Table POL18_1: How much have you seen, read, or heard about the following?The Supreme Court blocking the Trump administration’s attempt to end the DACA program that protects undocumented immigrants who were broughtinto the United States illegally as children from being deported
Demographic A lot Some Not Much Nothing at all Total N
Registered Voters 31% (612) 36% (718) 16% (320) 17% (338) 19884-Region: Northeast 35% (124) 36% (129) 13% (44) 16% (57) 3554-Region: Midwest 29% (134) 36% (164) 17% (79) 17% (79) 4574-Region: South 26% (194) 37% (275) 19% (145) 17% (128) 7424-Region: West 37% (160) 34% (150) 12% (52) 17% (74) 434Party: Democrat/Leans Democrat 42% (378) 34% (307) 12% (113) 12% (113) 911Party: Republican/Leans Republican 23% (174) 40% (298) 19% (140) 17% (129) 741Parents 31% (272) 36% (312) 17% (146) 15% (134) 864Note: Row proportions may total to larger than one-hundred percent due to rounding. For more information visit MorningConsultIntelligence.com.
Page 290
290
Morning ConsultTable POL18_2
Table POL18_2: How much have you seen, read, or heard about the following?The Supreme Court banning workplace discrimination based on sexual orientation and gender identity
Demographic A lot Some Not Much Nothing at all Total N
Registered Voters 29% (567) 36% (709) 17% (344) 18% (368) 1988Gender: Male 30% (283) 37% (348) 15% (136) 18% (163) 930Gender: Female 27% (284) 34% (361) 20% (208) 19% (205) 1058Age: 18-34 26% (132) 33% (166) 16% (81) 24% (120) 499Age: 35-44 31% (93) 36% (109) 17% (51) 16% (50) 302Age: 45-64 26% (191) 36% (263) 19% (136) 18% (133) 724Age: 65+ 33% (151) 37% (170) 16% (76) 14% (65) 463GenZers: 1997-2012 29% (64) 28% (62) 15% (33) 29% (64) 224Millennials: 1981-1996 26% (108) 37% (154) 18% (77) 19% (79) 419GenXers: 1965-1980 28% (141) 38% (194) 17% (89) 17% (89) 511Baby Boomers: 1946-1964 31% (237) 36% (272) 17% (128) 16% (123) 760PID: Dem (no lean) 37% (281) 32% (240) 16% (123) 15% (114) 757PID: Ind (no lean) 24% (154) 38% (243) 17% (112) 20% (130) 638PID: Rep (no lean) 22% (133) 38% (226) 19% (110) 21% (124) 593PID/Gender: DemMen 41% (134) 30% (100) 15% (48) 14% (47) 329PID/Gender: DemWomen 34% (147) 33% (140) 18% (75) 16% (67) 429PID/Gender: Ind Men 25% (75) 39% (117) 14% (43) 21% (62) 296PID/Gender: Ind Women 23% (79) 37% (126) 20% (69) 20% (69) 342PID/Gender: Rep Men 24% (75) 43% (131) 15% (45) 18% (54) 306PID/Gender: Rep Women 20% (58) 33% (95) 22% (64) 24% (69) 287Ideo: Liberal (1-3) 44% (265) 32% (197) 14% (86) 10% (61) 609Ideo: Moderate (4) 26% (135) 33% (173) 20% (102) 21% (112) 522Ideo: Conservative (5-7) 22% (150) 42% (288) 18% (124) 17% (118) 679Educ: < College 23% (293) 34% (421) 19% (242) 23% (293) 1250Educ: Bachelors degree 35% (163) 37% (176) 17% (80) 11% (51) 470Educ: Post-grad 41% (111) 42% (111) 8% (23) 8% (23) 267Income: Under 50k 23% (227) 34% (336) 22% (217) 22% (218) 998Income: 50k-100k 32% (213) 36% (238) 15% (99) 17% (110) 660Income: 100k+ 39% (127) 41% (134) 9% (29) 12% (39) 329Ethnicity: White 29% (465) 36% (582) 17% (279) 18% (282) 1608Ethnicity: Hispanic 26% (49) 27% (52) 23% (45) 25% (47) 193Ethnicity: Afr. Am. 25% (63) 34% (85) 19% (47) 23% (57) 252
Continued on next page
Page 291
National Tracking Poll #2006102, June, 2020
291
Table POL18_2
Table POL18_2: How much have you seen, read, or heard about the following?The Supreme Court banning workplace discrimination based on sexual orientation and gender identity
Demographic A lot Some Not Much Nothing at all Total N
Registered Voters 29% (567) 36% (709) 17% (344) 18% (368) 1988Ethnicity: Other 31% (40) 32% (41) 15% (19) 22% (28) 128All Christian 27% (253) 38% (360) 19% (181) 16% (146) 941All Non-Christian 49% (48) 29% (28) 11% (11) 11% (10) 97Atheist 43% (54) 33% (43) 11% (15) 13% (16) 128Agnostic/Nothing in particular 28% (135) 35% (168) 15% (71) 22% (105) 478Something Else 22% (77) 32% (110) 20% (67) 26% (90) 344Religious Non-Protestant/Catholic 44% (53) 28% (34) 14% (17) 14% (17) 120Evangelical 22% (109) 35% (177) 24% (120) 20% (99) 505Non-Evangelical 29% (213) 38% (285) 16% (121) 17% (127) 746Community: Urban 29% (143) 36% (174) 15% (71) 21% (102) 490Community: Suburban 30% (297) 37% (361) 17% (169) 16% (154) 981Community: Rural 25% (128) 34% (174) 20% (104) 22% (112) 517Employ: Private Sector 32% (200) 34% (215) 17% (109) 17% (107) 631Employ: Government 30% (41) 37% (50) 17% (23) 16% (21) 136Employ: Self-Employed 31% (40) 34% (44) 16% (21) 19% (25) 130Employ: Homemaker 25% (28) 38% (44) 14% (16) 23% (27) 115Employ: Retired 29% (143) 39% (190) 17% (86) 15% (73) 492Employ: Unemployed 21% (49) 35% (81) 18% (40) 25% (58) 229Employ: Other 21% (32) 36% (54) 21% (32) 22% (33) 152Military HH: Yes 27% (82) 43% (131) 14% (43) 16% (50) 306Military HH: No 29% (485) 34% (578) 18% (301) 19% (318) 1682RD/WT: Right Direction 20% (111) 41% (234) 20% (113) 19% (110) 567RD/WT: Wrong Track 32% (457) 33% (474) 16% (232) 18% (258) 1421Trump Job Approve 21% (162) 39% (302) 20% (153) 20% (156) 774Trump Job Disapprove 34% (393) 34% (392) 16% (179) 16% (188) 1153Trump Job Strongly Approve 24% (101) 37% (152) 19% (80) 19% (81) 415Trump Job Somewhat Approve 17% (61) 42% (149) 20% (73) 21% (76) 359Trump Job Somewhat Disapprove 19% (43) 39% (88) 21% (48) 21% (47) 226Trump Job Strongly Disapprove 38% (350) 33% (304) 14% (131) 15% (142) 927Favorable of Trump 21% (167) 39% (306) 19% (151) 21% (163) 787Unfavorable of Trump 35% (391) 34% (386) 16% (177) 16% (178) 1132
Continued on next page
Page 292
292
Morning ConsultTable POL18_2
Table POL18_2: How much have you seen, read, or heard about the following?The Supreme Court banning workplace discrimination based on sexual orientation and gender identity
Demographic A lot Some Not Much Nothing at all Total N
Registered Voters 29% (567) 36% (709) 17% (344) 18% (368) 1988Very Favorable of Trump 22% (104) 39% (180) 20% (91) 19% (88) 462Somewhat Favorable of Trump 20% (63) 39% (126) 19% (61) 23% (75) 325Somewhat Unfavorable of Trump 21% (38) 38% (69) 23% (42) 18% (33) 182Very Unfavorable of Trump 37% (354) 33% (316) 14% (135) 15% (145) 950#1 Issue: Economy 28% (190) 37% (254) 19% (127) 17% (117) 688#1 Issue: Security 21% (54) 35% (90) 21% (54) 22% (55) 254#1 Issue: Health Care 34% (116) 36% (119) 14% (47) 16% (53) 335#1 Issue: Medicare / Social Security 25% (71) 31% (88) 23% (64) 21% (60) 283#1 Issue: Women’s Issues 31% (27) 34% (29) 14% (12) 21% (18) 86#1 Issue: Education 29% (31) 34% (36) 11% (12) 26% (28) 107#1 Issue: Energy 29% (23) 44% (35) 16% (13) 11% (8) 79#1 Issue: Other 36% (56) 37% (58) 9% (15) 18% (28) 1572018 House Vote: Democrat 39% (300) 33% (254) 16% (122) 12% (91) 7672018 House Vote: Republican 25% (156) 41% (260) 16% (103) 18% (111) 6292018 House Vote: Someone else 17% (12) 44% (32) 13% (9) 27% (20) 732016 Vote: Hillary Clinton 41% (285) 34% (237) 13% (93) 12% (85) 7002016 Vote: Donald Trump 23% (153) 39% (266) 20% (137) 17% (118) 6752016 Vote: Other 28% (40) 43% (62) 12% (18) 17% (25) 1442016 Vote: Didn’t Vote 19% (89) 31% (143) 21% (96) 30% (138) 466Voted in 2014: Yes 32% (424) 37% (483) 17% (222) 15% (192) 1322Voted in 2014: No 21% (143) 34% (226) 18% (122) 26% (175) 6662012 Vote: Barack Obama 36% (304) 35% (302) 15% (124) 14% (122) 8532012 Vote: Mitt Romney 26% (128) 39% (196) 20% (101) 15% (77) 5012012 Vote: Other 21% (17) 44% (36) 11% (9) 25% (21) 842012 Vote: Didn’t Vote 21% (118) 32% (175) 20% (109) 27% (148) 5504-Region: Northeast 29% (102) 39% (139) 17% (61) 15% (53) 3554-Region: Midwest 30% (138) 35% (160) 13% (61) 21% (97) 4574-Region: South 26% (193) 36% (265) 21% (154) 18% (130) 7424-Region: West 31% (134) 33% (144) 16% (68) 20% (88) 434Party: Democrat/Leans Democrat 37% (338) 32% (295) 17% (151) 14% (127) 911Party: Republican/Leans Republican 22% (166) 39% (289) 18% (136) 20% (150) 741
Continued on next page
Page 293
National Tracking Poll #2006102, June, 2020
293
Table POL18_2
Table POL18_2: How much have you seen, read, or heard about the following?The Supreme Court banning workplace discrimination based on sexual orientation and gender identity
Demographic A lot Some Not Much Nothing at all Total N
Registered Voters 29% (567) 36% (709) 17% (344) 18% (368) 1988Parents 28% (242) 38% (331) 15% (132) 18% (158) 864Note: Row proportions may total to larger than one-hundred percent due to rounding. For more information visit MorningConsultIntelligence.com.
Page 294
294
Morning ConsultTable POL18_3
Table POL18_3: How much have you seen, read, or heard about the following?The upcoming release of former national security adviser John Bolton’s book about his tenure at the White House under President Trump
Demographic A lot Some Not Much Nothing at all Total N
Registered Voters 29% (583) 31% (625) 17% (342) 22% (439) 1988Gender: Male 33% (306) 33% (306) 16% (152) 18% (167) 930Gender: Female 26% (277) 30% (319) 18% (189) 26% (272) 1058Age: 18-34 18% (91) 23% (116) 23% (113) 36% (179) 499Age: 35-44 24% (74) 32% (98) 19% (57) 24% (73) 302Age: 45-64 31% (222) 35% (251) 15% (111) 19% (140) 724Age: 65+ 42% (195) 35% (160) 13% (61) 10% (47) 463GenZers: 1997-2012 14% (31) 16% (37) 25% (56) 45% (100) 224Millennials: 1981-1996 21% (90) 30% (125) 21% (86) 28% (118) 419GenXers: 1965-1980 26% (135) 36% (182) 17% (86) 21% (108) 511Baby Boomers: 1946-1964 39% (297) 34% (255) 13% (100) 14% (108) 760PID: Dem (no lean) 41% (307) 27% (202) 15% (116) 17% (132) 757PID: Ind (no lean) 21% (136) 33% (210) 20% (125) 26% (167) 638PID: Rep (no lean) 23% (139) 36% (213) 17% (101) 24% (140) 593PID/Gender: DemMen 46% (152) 24% (80) 14% (47) 15% (50) 329PID/Gender: DemWomen 36% (156) 28% (122) 16% (69) 19% (82) 429PID/Gender: Ind Men 23% (67) 37% (109) 19% (55) 22% (65) 296PID/Gender: Ind Women 20% (69) 30% (101) 21% (70) 30% (101) 342PID/Gender: Rep Men 29% (87) 38% (116) 17% (51) 17% (51) 306PID/Gender: Rep Women 18% (52) 34% (96) 17% (50) 31% (89) 287Ideo: Liberal (1-3) 39% (239) 30% (184) 16% (97) 15% (89) 609Ideo: Moderate (4) 29% (149) 30% (156) 18% (95) 23% (123) 522Ideo: Conservative (5-7) 26% (179) 36% (246) 18% (119) 20% (135) 679Educ: < College 24% (305) 30% (374) 19% (239) 27% (332) 1250Educ: Bachelors degree 34% (162) 33% (154) 16% (74) 17% (81) 470Educ: Post-grad 43% (116) 36% (97) 11% (29) 10% (26) 267Income: Under 50k 25% (253) 28% (283) 20% (202) 26% (260) 998Income: 50k-100k 32% (213) 35% (234) 14% (93) 18% (121) 660Income: 100k+ 35% (117) 33% (108) 14% (47) 18% (58) 329Ethnicity: White 30% (481) 33% (523) 17% (272) 21% (332) 1608Ethnicity: Hispanic 26% (49) 28% (55) 15% (29) 31% (59) 193Ethnicity: Afr. Am. 27% (69) 25% (63) 21% (53) 27% (67) 252
Continued on next page
Page 295
National Tracking Poll #2006102, June, 2020
295
Table POL18_3
Table POL18_3: How much have you seen, read, or heard about the following?The upcoming release of former national security adviser John Bolton’s book about his tenure at the White House under President Trump
Demographic A lot Some Not Much Nothing at all Total N
Registered Voters 29% (583) 31% (625) 17% (342) 22% (439) 1988Ethnicity: Other 26% (33) 30% (39) 13% (17) 31% (39) 128All Christian 31% (289) 36% (334) 16% (151) 18% (167) 941All Non-Christian 45% (44) 28% (28) 12% (12) 15% (14) 97Atheist 36% (47) 29% (37) 13% (17) 22% (28) 128Agnostic/Nothing in particular 26% (123) 29% (137) 20% (95) 26% (123) 478Something Else 23% (80) 26% (89) 20% (68) 31% (107) 344Religious Non-Protestant/Catholic 41% (49) 31% (37) 13% (15) 16% (19) 120Evangelical 24% (119) 35% (177) 18% (92) 23% (116) 505Non-Evangelical 33% (243) 31% (232) 16% (121) 20% (150) 746Community: Urban 29% (141) 31% (153) 17% (82) 23% (115) 490Community: Suburban 30% (298) 32% (316) 18% (175) 20% (192) 981Community: Rural 28% (144) 30% (157) 16% (85) 26% (132) 517Employ: Private Sector 31% (196) 34% (213) 16% (100) 19% (122) 631Employ: Government 30% (41) 32% (43) 19% (26) 19% (25) 136Employ: Self-Employed 27% (35) 32% (42) 22% (29) 19% (24) 130Employ: Homemaker 19% (22) 26% (30) 19% (21) 36% (41) 115Employ: Retired 41% (200) 34% (167) 15% (74) 11% (52) 492Employ: Unemployed 18% (40) 30% (70) 14% (31) 38% (88) 229Employ: Other 19% (29) 27% (42) 22% (34) 31% (47) 152Military HH: Yes 38% (116) 34% (104) 12% (37) 16% (49) 306Military HH: No 28% (466) 31% (521) 18% (305) 23% (390) 1682RD/WT: Right Direction 21% (119) 36% (206) 18% (103) 24% (139) 567RD/WT: Wrong Track 33% (464) 29% (419) 17% (238) 21% (300) 1421Trump Job Approve 22% (173) 35% (271) 19% (150) 23% (179) 774Trump Job Disapprove 35% (405) 30% (344) 16% (184) 19% (221) 1153Trump Job Strongly Approve 28% (116) 36% (150) 16% (67) 20% (82) 415Trump Job Somewhat Approve 16% (58) 34% (120) 23% (84) 27% (97) 359Trump Job Somewhat Disapprove 15% (35) 34% (77) 23% (52) 28% (63) 226Trump Job Strongly Disapprove 40% (370) 29% (267) 14% (131) 17% (158) 927Favorable of Trump 23% (179) 35% (272) 19% (149) 24% (187) 787Unfavorable of Trump 35% (398) 30% (340) 16% (181) 19% (213) 1132
Continued on next page
Page 296
296
Morning ConsultTable POL18_3
Table POL18_3: How much have you seen, read, or heard about the following?The upcoming release of former national security adviser John Bolton’s book about his tenure at the White House under President Trump
Demographic A lot Some Not Much Nothing at all Total N
Registered Voters 29% (583) 31% (625) 17% (342) 22% (439) 1988Very Favorable of Trump 26% (119) 36% (164) 18% (82) 21% (97) 462Somewhat Favorable of Trump 18% (60) 33% (108) 21% (67) 28% (90) 325Somewhat Unfavorable of Trump 12% (22) 35% (63) 26% (47) 28% (50) 182Very Unfavorable of Trump 40% (376) 29% (277) 14% (135) 17% (163) 950#1 Issue: Economy 29% (199) 31% (212) 19% (128) 22% (149) 688#1 Issue: Security 21% (54) 35% (89) 21% (54) 23% (58) 254#1 Issue: Health Care 36% (120) 31% (103) 14% (46) 20% (66) 335#1 Issue: Medicare / Social Security 34% (97) 33% (95) 16% (44) 16% (47) 283#1 Issue: Women’s Issues 26% (22) 18% (16) 20% (17) 36% (31) 86#1 Issue: Education 17% (18) 33% (35) 15% (16) 35% (37) 107#1 Issue: Energy 21% (17) 38% (30) 18% (14) 22% (17) 79#1 Issue: Other 35% (55) 29% (46) 14% (22) 22% (34) 1572018 House Vote: Democrat 44% (341) 29% (220) 14% (111) 12% (95) 7672018 House Vote: Republican 26% (163) 38% (242) 17% (106) 19% (119) 6292018 House Vote: Someone else 16% (12) 34% (25) 28% (20) 22% (16) 732016 Vote: Hillary Clinton 44% (307) 30% (211) 13% (90) 13% (92) 7002016 Vote: Donald Trump 26% (176) 36% (243) 18% (122) 20% (135) 6752016 Vote: Other 26% (37) 44% (64) 16% (23) 14% (20) 1442016 Vote: Didn’t Vote 13% (62) 23% (106) 23% (106) 41% (192) 466Voted in 2014: Yes 36% (478) 33% (441) 16% (207) 15% (195) 1322Voted in 2014: No 16% (104) 28% (184) 20% (135) 37% (244) 6662012 Vote: Barack Obama 40% (344) 31% (262) 14% (118) 15% (129) 8532012 Vote: Mitt Romney 28% (140) 38% (188) 18% (90) 17% (83) 5012012 Vote: Other 25% (21) 44% (37) 12% (10) 19% (16) 842012 Vote: Didn’t Vote 14% (79) 25% (137) 22% (123) 38% (211) 5504-Region: Northeast 32% (114) 33% (116) 15% (53) 20% (72) 3554-Region: Midwest 31% (142) 34% (153) 14% (65) 21% (96) 4574-Region: South 26% (192) 30% (220) 21% (158) 23% (173) 7424-Region: West 31% (135) 31% (136) 15% (66) 22% (97) 434Party: Democrat/Leans Democrat 40% (362) 28% (253) 15% (138) 17% (157) 911Party: Republican/Leans Republican 22% (166) 37% (278) 17% (128) 23% (169) 741
Continued on next page
Page 297
National Tracking Poll #2006102, June, 2020
297
Table POL18_3
Table POL18_3: How much have you seen, read, or heard about the following?The upcoming release of former national security adviser John Bolton’s book about his tenure at the White House under President Trump
Demographic A lot Some Not Much Nothing at all Total N
Registered Voters 29% (583) 31% (625) 17% (342) 22% (439) 1988Parents 31% (265) 32% (279) 15% (132) 22% (188) 864Note: Row proportions may total to larger than one-hundred percent due to rounding. For more information visit MorningConsultIntelligence.com.
Page 298
298
Morning ConsultTable POL18_4
Table POL18_4: How much have you seen, read, or heard about the following?The Senate confirmation of Justin Walker, President Trump’s nominee to the D.C. Circuit Court of Appeals
Demographic A lot Some Not Much Nothing at all Total N
Registered Voters 6% (115) 16% (323) 31% (621) 47% (929) 1988Gender: Male 9% (81) 19% (179) 31% (285) 41% (385) 930Gender: Female 3% (34) 14% (144) 32% (336) 51% (544) 1058Age: 18-34 7% (37) 13% (64) 32% (159) 48% (239) 499Age: 35-44 7% (22) 20% (59) 28% (86) 45% (135) 302Age: 45-64 5% (40) 16% (113) 32% (235) 47% (337) 724Age: 65+ 4% (16) 19% (87) 31% (141) 47% (218) 463GenZers: 1997-2012 7% (15) 11% (26) 29% (65) 53% (118) 224Millennials: 1981-1996 7% (31) 15% (64) 32% (135) 45% (189) 419GenXers: 1965-1980 8% (41) 18% (93) 32% (162) 42% (215) 511Baby Boomers: 1946-1964 3% (26) 16% (125) 30% (232) 50% (378) 760PID: Dem (no lean) 7% (55) 18% (134) 33% (250) 42% (318) 757PID: Ind (no lean) 4% (24) 12% (77) 30% (191) 54% (346) 638PID: Rep (no lean) 6% (36) 19% (112) 30% (180) 45% (265) 593PID/Gender: DemMen 11% (36) 22% (72) 32% (105) 35% (115) 329PID/Gender: DemWomen 4% (19) 14% (62) 34% (145) 47% (203) 429PID/Gender: Ind Men 5% (16) 15% (44) 28% (82) 52% (155) 296PID/Gender: Ind Women 2% (8) 10% (33) 32% (109) 56% (191) 342PID/Gender: Rep Men 10% (30) 20% (63) 32% (98) 38% (116) 306PID/Gender: Rep Women 2% (7) 17% (49) 29% (82) 52% (149) 287Ideo: Liberal (1-3) 7% (42) 21% (130) 32% (198) 39% (238) 609Ideo: Moderate (4) 6% (32) 13% (69) 34% (176) 47% (245) 522Ideo: Conservative (5-7) 6% (39) 16% (110) 31% (213) 47% (318) 679Educ: < College 6% (70) 14% (175) 30% (373) 51% (632) 1250Educ: Bachelors degree 5% (23) 18% (86) 36% (167) 41% (193) 470Educ: Post-grad 8% (22) 23% (61) 30% (80) 39% (104) 267Income: Under 50k 6% (61) 13% (130) 30% (295) 51% (513) 998Income: 50k-100k 5% (30) 18% (122) 34% (225) 43% (284) 660Income: 100k+ 7% (25) 22% (72) 31% (101) 40% (132) 329Ethnicity: White 5% (80) 17% (266) 32% (507) 47% (755) 1608Ethnicity: Hispanic 7% (13) 17% (33) 34% (65) 42% (81) 193Ethnicity: Afr. Am. 10% (26) 12% (30) 33% (84) 45% (113) 252
Continued on next page
Page 299
National Tracking Poll #2006102, June, 2020
299
Table POL18_4
Table POL18_4: How much have you seen, read, or heard about the following?The Senate confirmation of Justin Walker, President Trump’s nominee to the D.C. Circuit Court of Appeals
Demographic A lot Some Not Much Nothing at all Total N
Registered Voters 6% (115) 16% (323) 31% (621) 47% (929) 1988Ethnicity: Other 7% (9) 21% (27) 24% (30) 48% (61) 128All Christian 5% (51) 17% (164) 30% (286) 47% (440) 941All Non-Christian 13% (12) 20% (19) 33% (32) 35% (34) 97Atheist 4% (5) 22% (28) 33% (42) 41% (53) 128Agnostic/Nothing in particular 6% (27) 14% (69) 32% (152) 48% (230) 478Something Else 6% (20) 13% (44) 31% (108) 50% (173) 344Religious Non-Protestant/Catholic 10% (12) 17% (20) 35% (41) 39% (46) 120Evangelical 7% (33) 17% (85) 31% (154) 46% (232) 505Non-Evangelical 5% (35) 16% (119) 31% (228) 49% (363) 746Community: Urban 8% (39) 16% (79) 32% (157) 44% (214) 490Community: Suburban 5% (51) 18% (178) 32% (317) 44% (435) 981Community: Rural 5% (25) 13% (66) 28% (146) 54% (280) 517Employ: Private Sector 8% (49) 20% (126) 34% (213) 39% (243) 631Employ: Government 6% (8) 19% (26) 34% (46) 41% (56) 136Employ: Self-Employed 8% (10) 17% (22) 31% (40) 44% (57) 130Employ: Homemaker 2% (2) 14% (16) 22% (26) 62% (71) 115Employ: Retired 5% (23) 17% (85) 28% (139) 50% (245) 492Employ: Unemployed 5% (12) 10% (22) 32% (73) 53% (122) 229Employ: Other 3% (4) 11% (16) 34% (51) 53% (81) 152Military HH: Yes 5% (15) 20% (62) 31% (96) 44% (134) 306Military HH: No 6% (100) 16% (261) 31% (525) 47% (795) 1682RD/WT: Right Direction 9% (52) 17% (99) 31% (176) 42% (240) 567RD/WT: Wrong Track 4% (63) 16% (224) 31% (445) 49% (689) 1421Trump Job Approve 7% (51) 17% (133) 31% (239) 45% (350) 774Trump Job Disapprove 5% (63) 16% (183) 32% (371) 47% (536) 1153Trump Job Strongly Approve 10% (41) 22% (92) 29% (120) 39% (162) 415Trump Job Somewhat Approve 3% (11) 12% (41) 33% (118) 53% (188) 359Trump Job Somewhat Disapprove 6% (14) 11% (26) 36% (82) 46% (104) 226Trump Job Strongly Disapprove 5% (49) 17% (157) 31% (289) 47% (432) 927Favorable of Trump 7% (52) 17% (137) 30% (238) 46% (361) 787Unfavorable of Trump 5% (60) 16% (178) 33% (369) 46% (525) 1132
Continued on next page
Page 300
300
Morning ConsultTable POL18_4
Table POL18_4: How much have you seen, read, or heard about the following?The Senate confirmation of Justin Walker, President Trump’s nominee to the D.C. Circuit Court of Appeals
Demographic A lot Some Not Much Nothing at all Total N
Registered Voters 6% (115) 16% (323) 31% (621) 47% (929) 1988Very Favorable of Trump 8% (38) 20% (93) 31% (142) 41% (189) 462Somewhat Favorable of Trump 4% (13) 14% (44) 29% (95) 53% (172) 325Somewhat Unfavorable of Trump 5% (8) 10% (19) 39% (70) 47% (85) 182Very Unfavorable of Trump 5% (52) 17% (159) 31% (299) 46% (440) 950#1 Issue: Economy 5% (34) 17% (115) 36% (249) 42% (290) 688#1 Issue: Security 4% (11) 16% (40) 36% (91) 44% (111) 254#1 Issue: Health Care 8% (25) 17% (58) 27% (90) 48% (162) 335#1 Issue: Medicare / Social Security 5% (13) 18% (50) 26% (75) 51% (145) 283#1 Issue: Women’s Issues 2% (2) 19% (17) 29% (25) 49% (42) 86#1 Issue: Education 11% (12) 14% (15) 20% (21) 55% (59) 107#1 Issue: Energy 8% (7) 15% (12) 34% (27) 43% (34) 79#1 Issue: Other 7% (11) 11% (17) 29% (45) 54% (84) 1572018 House Vote: Democrat 7% (52) 19% (146) 33% (251) 42% (319) 7672018 House Vote: Republican 6% (38) 19% (121) 33% (206) 42% (265) 6292018 House Vote: Someone else 5% (4) 16% (12) 33% (24) 46% (34) 732016 Vote: Hillary Clinton 8% (53) 19% (134) 33% (231) 40% (282) 7002016 Vote: Donald Trump 6% (39) 18% (124) 31% (208) 45% (303) 6752016 Vote: Other 3% (5) 14% (20) 33% (48) 49% (71) 1442016 Vote: Didn’t Vote 4% (18) 9% (43) 29% (134) 58% (270) 466Voted in 2014: Yes 7% (87) 18% (244) 33% (433) 42% (558) 1322Voted in 2014: No 4% (28) 12% (79) 28% (188) 56% (371) 6662012 Vote: Barack Obama 7% (63) 18% (155) 31% (265) 43% (370) 8532012 Vote: Mitt Romney 5% (23) 16% (80) 34% (168) 46% (230) 5012012 Vote: Other 5% (4) 21% (18) 23% (19) 51% (43) 842012 Vote: Didn’t Vote 4% (25) 13% (71) 31% (168) 52% (286) 5504-Region: Northeast 7% (24) 18% (65) 31% (111) 43% (154) 3554-Region: Midwest 4% (19) 14% (66) 29% (132) 53% (240) 4574-Region: South 5% (40) 16% (122) 33% (245) 45% (335) 7424-Region: West 7% (32) 16% (70) 31% (133) 46% (200) 434Party: Democrat/Leans Democrat 7% (61) 17% (157) 33% (301) 43% (392) 911Party: Republican/Leans Republican 6% (42) 17% (128) 31% (227) 46% (344) 741
Continued on next page
Page 301
National Tracking Poll #2006102, June, 2020
301
Table POL18_4
Table POL18_4: How much have you seen, read, or heard about the following?The Senate confirmation of Justin Walker, President Trump’s nominee to the D.C. Circuit Court of Appeals
Demographic A lot Some Not Much Nothing at all Total N
Registered Voters 6% (115) 16% (323) 31% (621) 47% (929) 1988Parents 6% (52) 18% (157) 32% (273) 44% (382) 864Note: Row proportions may total to larger than one-hundred percent due to rounding. For more information visit MorningConsultIntelligence.com.
Page 302
302
Morning ConsultTable POL19_1
Table POL19_1: As you may know, this week the Supreme Court made several rulings. Do you support or oppose each of the Supreme Court’s recentrulings?The Supreme Court blocking the Trump administration’s attempt to end the DACA program that protects undocumented immigrants who were broughtinto the United States illegally as children from being deported
DemographicStronglysupport
Somewhatsupport
Somewhatoppose
Stronglyoppose
Don’t Know /No Opinion Total N
Registered Voters 40% (799) 15% (299) 12% (239) 16% (323) 17% (328) 1988Gender: Male 38% (351) 15% (136) 13% (123) 19% (179) 15% (141) 930Gender: Female 42% (448) 15% (163) 11% (116) 14% (144) 18% (187) 1058Age: 18-34 41% (203) 14% (69) 14% (68) 9% (45) 23% (116) 499Age: 35-44 38% (115) 20% (60) 12% (36) 12% (36) 18% (55) 302Age: 45-64 39% (286) 15% (109) 10% (71) 20% (143) 16% (116) 724Age: 65+ 42% (195) 13% (61) 14% (65) 21% (99) 9% (42) 463GenZers: 1997-2012 39% (87) 12% (27) 12% (27) 7% (16) 29% (66) 224Millennials: 1981-1996 41% (172) 17% (72) 13% (55) 11% (45) 18% (76) 419GenXers: 1965-1980 39% (200) 18% (92) 11% (57) 17% (89) 14% (74) 511Baby Boomers: 1946-1964 42% (321) 12% (94) 12% (89) 20% (153) 13% (103) 760PID: Dem (no lean) 68% (515) 13% (102) 5% (37) 4% (29) 10% (75) 757PID: Ind (no lean) 35% (220) 14% (90) 12% (79) 15% (95) 24% (154) 638PID: Rep (no lean) 11% (64) 18% (107) 21% (123) 34% (199) 17% (100) 593PID/Gender: DemMen 65% (215) 14% (47) 5% (18) 5% (15) 10% (33) 329PID/Gender: DemWomen 70% (300) 13% (55) 4% (19) 3% (13) 10% (42) 429PID/Gender: Ind Men 34% (102) 11% (34) 15% (43) 18% (53) 22% (64) 296PID/Gender: Ind Women 35% (119) 16% (56) 10% (36) 12% (42) 26% (90) 342PID/Gender: Rep Men 11% (34) 18% (55) 20% (62) 36% (111) 14% (44) 306PID/Gender: Rep Women 10% (30) 18% (52) 21% (62) 31% (88) 19% (55) 287Ideo: Liberal (1-3) 74% (452) 13% (78) 4% (24) 3% (21) 5% (33) 609Ideo: Moderate (4) 42% (220) 18% (92) 13% (70) 8% (42) 19% (99) 522Ideo: Conservative (5-7) 14% (93) 16% (109) 19% (131) 36% (245) 15% (101) 679Educ: < College 34% (426) 14% (180) 14% (169) 18% (222) 20% (253) 1250Educ: Bachelors degree 49% (230) 15% (72) 9% (43) 15% (70) 12% (55) 470Educ: Post-grad 53% (143) 17% (46) 10% (27) 12% (31) 8% (20) 267Income: Under 50k 38% (376) 15% (151) 12% (123) 16% (156) 19% (193) 998Income: 50k-100k 40% (266) 14% (90) 12% (77) 19% (128) 15% (99) 660Income: 100k+ 48% (157) 17% (58) 12% (39) 12% (39) 11% (37) 329
Continued on next page
Page 303
National Tracking Poll #2006102, June, 2020
303
Table POL19_1
Table POL19_1: As you may know, this week the Supreme Court made several rulings. Do you support or oppose each of the Supreme Court’s recentrulings?The Supreme Court blocking the Trump administration’s attempt to end the DACA program that protects undocumented immigrants who were broughtinto the United States illegally as children from being deported
DemographicStronglysupport
Somewhatsupport
Somewhatoppose
Stronglyoppose
Don’t Know /No Opinion Total N
Registered Voters 40% (799) 15% (299) 12% (239) 16% (323) 17% (328) 1988Ethnicity: White 38% (617) 16% (253) 12% (199) 18% (289) 16% (250) 1608Ethnicity: Hispanic 40% (76) 17% (33) 10% (20) 7% (13) 26% (49) 193Ethnicity: Afr. Am. 46% (116) 13% (33) 12% (30) 7% (19) 21% (54) 252Ethnicity: Other 52% (66) 10% (12) 8% (10) 12% (15) 19% (25) 128All Christian 35% (334) 15% (144) 14% (130) 20% (191) 15% (142) 941All Non-Christian 59% (57) 16% (15) 9% (8) 11% (11) 6% (6) 97Atheist 58% (75) 13% (17) 8% (10) 7% (9) 13% (17) 128Agnostic/Nothing in particular 43% (207) 14% (66) 11% (54) 12% (57) 20% (95) 478Something Else 37% (127) 16% (56) 11% (37) 16% (54) 20% (69) 344Religious Non-Protestant/Catholic 55% (66) 17% (21) 7% (8) 14% (17) 6% (8) 120Evangelical 28% (139) 16% (83) 16% (82) 22% (112) 18% (89) 505Non-Evangelical 42% (310) 15% (111) 11% (84) 17% (126) 15% (115) 746Community: Urban 43% (210) 17% (81) 9% (42) 13% (64) 19% (93) 490Community: Suburban 42% (410) 16% (154) 12% (118) 15% (147) 16% (152) 981Community: Rural 35% (180) 12% (64) 15% (79) 22% (112) 16% (83) 517Employ: Private Sector 41% (257) 17% (109) 12% (77) 15% (92) 15% (96) 631Employ: Government 39% (52) 19% (26) 14% (19) 15% (21) 12% (17) 136Employ: Self-Employed 43% (56) 14% (18) 13% (18) 15% (19) 15% (19) 130Employ: Homemaker 33% (38) 13% (15) 13% (14) 14% (16) 26% (30) 115Employ: Retired 42% (204) 14% (67) 11% (55) 23% (111) 11% (55) 492Employ: Unemployed 35% (79) 11% (26) 13% (30) 14% (32) 27% (62) 229Employ: Other 39% (59) 15% (22) 13% (20) 17% (26) 16% (25) 152Military HH: Yes 41% (126) 11% (34) 14% (42) 23% (69) 11% (34) 306Military HH: No 40% (673) 16% (264) 12% (197) 15% (253) 17% (294) 1682RD/WT: Right Direction 15% (85) 16% (93) 20% (111) 31% (175) 18% (104) 567RD/WT: Wrong Track 50% (714) 14% (205) 9% (128) 10% (148) 16% (225) 1421Trump Job Approve 10% (77) 18% (140) 21% (163) 33% (259) 18% (136) 774Trump Job Disapprove 62% (719) 13% (152) 6% (75) 5% (59) 13% (149) 1153
Continued on next page
Page 304
304
Morning ConsultTable POL19_1
Table POL19_1: As you may know, this week the Supreme Court made several rulings. Do you support or oppose each of the Supreme Court’s recentrulings?The Supreme Court blocking the Trump administration’s attempt to end the DACA program that protects undocumented immigrants who were broughtinto the United States illegally as children from being deported
DemographicStronglysupport
Somewhatsupport
Somewhatoppose
Stronglyoppose
Don’t Know /No Opinion Total N
Registered Voters 40% (799) 15% (299) 12% (239) 16% (323) 17% (328) 1988Trump Job Strongly Approve 8% (33) 11% (46) 18% (76) 49% (202) 14% (57) 415Trump Job Somewhat Approve 12% (43) 26% (93) 24% (87) 16% (57) 22% (78) 359Trump Job Somewhat Disapprove 33% (76) 25% (57) 11% (26) 6% (13) 24% (55) 226Trump Job Strongly Disapprove 69% (643) 10% (95) 5% (49) 5% (45) 10% (95) 927Favorable of Trump 10% (77) 17% (135) 20% (159) 34% (269) 19% (147) 787Unfavorable of Trump 63% (712) 14% (157) 7% (75) 5% (52) 12% (136) 1132Very Favorable of Trump 8% (37) 13% (60) 18% (81) 47% (216) 15% (69) 462Somewhat Favorable of Trump 12% (40) 23% (76) 24% (78) 16% (53) 24% (79) 325Somewhat Unfavorable of Trump 32% (59) 24% (43) 15% (28) 6% (11) 22% (40) 182Very Unfavorable of Trump 69% (654) 12% (114) 5% (47) 4% (40) 10% (96) 950#1 Issue: Economy 33% (230) 15% (104) 16% (111) 18% (124) 17% (120) 688#1 Issue: Security 12% (31) 14% (34) 15% (37) 40% (100) 20% (51) 254#1 Issue: Health Care 55% (185) 16% (55) 7% (25) 8% (26) 13% (44) 335#1 Issue: Medicare / Social Security 48% (135) 17% (47) 9% (27) 11% (32) 15% (42) 283#1 Issue: Women’s Issues 56% (48) 13% (11) 13% (11) 6% (5) 12% (11) 86#1 Issue: Education 47% (50) 16% (17) 10% (11) 6% (6) 21% (22) 107#1 Issue: Energy 60% (48) 13% (10) 7% (6) 5% (4) 14% (11) 79#1 Issue: Other 47% (73) 13% (20) 8% (13) 15% (24) 17% (27) 1572018 House Vote: Democrat 71% (548) 11% (87) 5% (39) 3% (23) 9% (70) 7672018 House Vote: Republican 12% (74) 16% (102) 20% (128) 38% (237) 14% (88) 6292018 House Vote: Someone else 24% (17) 23% (17) 16% (12) 10% (8) 27% (20) 732016 Vote: Hillary Clinton 72% (504) 13% (89) 4% (28) 3% (20) 9% (60) 7002016 Vote: Donald Trump 11% (74) 17% (115) 20% (137) 36% (244) 15% (104) 6752016 Vote: Other 47% (69) 17% (24) 12% (17) 8% (11) 16% (24) 1442016 Vote: Didn’t Vote 32% (150) 15% (70) 12% (57) 10% (48) 30% (141) 466Voted in 2014: Yes 43% (571) 14% (188) 12% (163) 19% (251) 11% (148) 1322Voted in 2014: No 34% (228) 17% (111) 11% (76) 11% (71) 27% (180) 666
Continued on next page
Page 305
National Tracking Poll #2006102, June, 2020
305
Table POL19_1
Table POL19_1: As you may know, this week the Supreme Court made several rulings. Do you support or oppose each of the Supreme Court’s recentrulings?The Supreme Court blocking the Trump administration’s attempt to end the DACA program that protects undocumented immigrants who were broughtinto the United States illegally as children from being deported
DemographicStronglysupport
Somewhatsupport
Somewhatoppose
Stronglyoppose
Don’t Know /No Opinion Total N
Registered Voters 40% (799) 15% (299) 12% (239) 16% (323) 17% (328) 19882012 Vote: Barack Obama 63% (538) 15% (125) 7% (64) 6% (53) 9% (73) 8532012 Vote: Mitt Romney 12% (62) 16% (81) 20% (102) 38% (188) 14% (68) 5012012 Vote: Other 19% (16) 11% (9) 17% (15) 26% (22) 26% (22) 842012 Vote: Didn’t Vote 33% (182) 15% (83) 11% (59) 11% (60) 30% (165) 5504-Region: Northeast 41% (144) 17% (60) 10% (35) 18% (62) 15% (53) 3554-Region: Midwest 37% (170) 14% (64) 13% (57) 18% (84) 18% (82) 4574-Region: South 37% (272) 15% (114) 15% (110) 16% (118) 17% (128) 7424-Region: West 49% (213) 14% (60) 9% (37) 13% (58) 15% (66) 434Party: Democrat/Leans Democrat 68% (620) 14% (125) 5% (42) 4% (36) 10% (89) 911Party: Republican/Leans Republican 12% (88) 17% (124) 21% (154) 34% (250) 17% (125) 741Parents 38% (325) 18% (154) 13% (111) 17% (143) 15% (131) 864Note: Row proportions may total to larger than one-hundred percent due to rounding. For more information visit MorningConsultIntelligence.com.
Page 306
306
Morning ConsultTable POL19_2
Table POL19_2: As you may know, this week the Supreme Court made several rulings. Do you support or oppose each of the Supreme Court’s recentrulings?The Supreme Court banning workplace discrimination based on sexual orientation and gender identity
DemographicStronglysupport
Somewhatsupport
Somewhatoppose
Stronglyoppose
Don’t Know /No Opinion Total N
Registered Voters 52% (1030) 19% (368) 7% (142) 7% (140) 15% (308) 1988Gender: Male 47% (436) 20% (188) 8% (75) 9% (87) 15% (144) 930Gender: Female 56% (593) 17% (180) 6% (67) 5% (54) 16% (164) 1058Age: 18-34 52% (261) 13% (66) 9% (45) 4% (21) 21% (106) 499Age: 35-44 52% (158) 17% (52) 6% (18) 6% (19) 18% (55) 302Age: 45-64 53% (381) 19% (141) 7% (49) 9% (62) 13% (91) 724Age: 65+ 50% (229) 24% (109) 6% (30) 8% (38) 12% (56) 463GenZers: 1997-2012 53% (119) 10% (22) 7% (16) 3% (6) 27% (61) 224Millennials: 1981-1996 53% (220) 16% (67) 9% (38) 5% (23) 17% (71) 419GenXers: 1965-1980 51% (263) 20% (100) 7% (34) 8% (42) 14% (71) 511Baby Boomers: 1946-1964 53% (403) 21% (159) 6% (47) 8% (60) 12% (90) 760PID: Dem (no lean) 71% (538) 12% (87) 5% (40) 3% (23) 9% (69) 757PID: Ind (no lean) 51% (324) 17% (109) 6% (38) 7% (41) 20% (125) 638PID: Rep (no lean) 28% (168) 29% (172) 11% (63) 13% (76) 19% (114) 593PID/Gender: DemMen 66% (218) 13% (44) 6% (19) 4% (13) 10% (34) 329PID/Gender: DemWomen 74% (319) 10% (43) 5% (21) 2% (10) 8% (36) 429PID/Gender: Ind Men 44% (130) 19% (57) 8% (24) 8% (25) 21% (61) 296PID/Gender: Ind Women 57% (194) 15% (53) 4% (14) 5% (17) 19% (64) 342PID/Gender: Rep Men 29% (88) 29% (87) 11% (32) 16% (48) 16% (49) 306PID/Gender: Rep Women 28% (80) 29% (84) 11% (31) 10% (27) 23% (65) 287Ideo: Liberal (1-3) 79% (483) 8% (46) 4% (25) 3% (17) 6% (37) 609Ideo: Moderate (4) 56% (294) 20% (102) 5% (24) 5% (26) 14% (75) 522Ideo: Conservative (5-7) 28% (192) 30% (204) 11% (77) 13% (90) 17% (116) 679Educ: < College 47% (585) 19% (232) 8% (103) 7% (93) 19% (237) 1250Educ: Bachelors degree 59% (279) 18% (83) 5% (23) 7% (32) 11% (54) 470Educ: Post-grad 62% (165) 20% (53) 6% (16) 6% (16) 6% (17) 267Income: Under 50k 50% (496) 17% (167) 8% (83) 8% (77) 18% (176) 998Income: 50k-100k 52% (345) 20% (129) 6% (41) 7% (47) 15% (98) 660Income: 100k+ 57% (188) 22% (73) 5% (18) 5% (16) 10% (34) 329Ethnicity: White 52% (832) 20% (316) 7% (117) 7% (113) 14% (230) 1608
Continued on next page
Page 307
National Tracking Poll #2006102, June, 2020
307
Table POL19_2
Table POL19_2: As you may know, this week the Supreme Court made several rulings. Do you support or oppose each of the Supreme Court’s recentrulings?The Supreme Court banning workplace discrimination based on sexual orientation and gender identity
DemographicStronglysupport
Somewhatsupport
Somewhatoppose
Stronglyoppose
Don’t Know /No Opinion Total N
Registered Voters 52% (1030) 19% (368) 7% (142) 7% (140) 15% (308) 1988Ethnicity: Hispanic 58% (111) 9% (18) 7% (13) 4% (7) 22% (43) 193Ethnicity: Afr. Am. 50% (125) 14% (36) 7% (18) 9% (22) 20% (51) 252Ethnicity: Other 57% (73) 13% (16) 6% (7) 4% (5) 21% (27) 128All Christian 47% (446) 23% (213) 7% (69) 9% (88) 13% (125) 941All Non-Christian 66% (64) 15% (15) 6% (6) 5% (4) 8% (8) 97Atheist 68% (87) 10% (13) 6% (8) 2% (2) 14% (17) 128Agnostic/Nothing in particular 56% (266) 15% (73) 6% (30) 5% (26) 17% (84) 478Something Else 48% (166) 16% (54) 9% (29) 6% (19) 22% (74) 344Religious Non-Protestant/Catholic 62% (75) 15% (18) 7% (8) 5% (6) 11% (13) 120Evangelical 35% (178) 23% (116) 10% (52) 12% (62) 19% (98) 505Non-Evangelical 56% (420) 20% (147) 6% (44) 6% (41) 13% (94) 746Community: Urban 52% (255) 17% (83) 6% (31) 6% (28) 19% (93) 490Community: Suburban 54% (530) 19% (186) 7% (66) 8% (75) 13% (124) 981Community: Rural 47% (245) 19% (100) 9% (45) 7% (37) 18% (91) 517Employ: Private Sector 53% (335) 21% (132) 7% (47) 5% (31) 14% (86) 631Employ: Government 54% (73) 19% (25) 10% (14) 7% (10) 10% (14) 136Employ: Self-Employed 48% (63) 17% (22) 9% (12) 8% (10) 18% (23) 130Employ: Homemaker 50% (58) 16% (18) 4% (5) 9% (11) 21% (24) 115Employ: Retired 50% (247) 22% (108) 7% (33) 9% (45) 12% (58) 492Employ: Unemployed 51% (117) 12% (27) 5% (11) 10% (22) 23% (52) 229Employ: Other 50% (77) 16% (25) 11% (16) 6% (9) 17% (26) 152Military HH: Yes 47% (144) 23% (70) 10% (30) 9% (27) 11% (35) 306Military HH: No 53% (885) 18% (298) 7% (112) 7% (113) 16% (273) 1682RD/WT: Right Direction 32% (182) 29% (162) 10% (56) 11% (60) 19% (108) 567RD/WT: Wrong Track 60% (848) 15% (207) 6% (86) 6% (80) 14% (200) 1421Trump Job Approve 30% (230) 28% (220) 12% (90) 13% (97) 18% (137) 774Trump Job Disapprove 68% (784) 13% (147) 4% (50) 3% (38) 12% (135) 1153
Continued on next page
Page 308
308
Morning ConsultTable POL19_2
Table POL19_2: As you may know, this week the Supreme Court made several rulings. Do you support or oppose each of the Supreme Court’s recentrulings?The Supreme Court banning workplace discrimination based on sexual orientation and gender identity
DemographicStronglysupport
Somewhatsupport
Somewhatoppose
Stronglyoppose
Don’t Know /No Opinion Total N
Registered Voters 52% (1030) 19% (368) 7% (142) 7% (140) 15% (308) 1988Trump Job Strongly Approve 25% (105) 28% (115) 12% (48) 19% (79) 16% (68) 415Trump Job Somewhat Approve 35% (125) 29% (105) 12% (42) 5% (19) 19% (69) 359Trump Job Somewhat Disapprove 49% (112) 27% (60) 4% (8) 3% (6) 17% (40) 226Trump Job Strongly Disapprove 72% (672) 9% (86) 5% (42) 3% (32) 10% (95) 927Favorable of Trump 30% (235) 28% (217) 11% (88) 13% (101) 18% (145) 787Unfavorable of Trump 69% (778) 13% (147) 4% (50) 3% (36) 11% (121) 1132Very Favorable of Trump 26% (118) 27% (125) 13% (58) 18% (82) 17% (80) 462Somewhat Favorable of Trump 36% (117) 29% (93) 9% (30) 6% (20) 20% (66) 325Somewhat Unfavorable of Trump 49% (89) 27% (48) 7% (12) 4% (7) 14% (26) 182Very Unfavorable of Trump 73% (689) 10% (98) 4% (38) 3% (29) 10% (96) 950#1 Issue: Economy 49% (334) 23% (156) 6% (44) 8% (54) 14% (98) 688#1 Issue: Security 26% (67) 26% (67) 13% (32) 16% (40) 19% (48) 254#1 Issue: Health Care 65% (218) 13% (42) 6% (19) 4% (15) 13% (42) 335#1 Issue: Medicare / Social Security 54% (152) 17% (48) 6% (17) 6% (16) 18% (51) 283#1 Issue: Women’s Issues 60% (52) 15% (13) 9% (8) 3% (3) 12% (10) 86#1 Issue: Education 55% (58) 19% (20) 5% (6) 1% (1) 20% (22) 107#1 Issue: Energy 65% (51) 9% (7) 9% (7) 3% (2) 14% (11) 79#1 Issue: Other 62% (97) 10% (15) 5% (9) 6% (10) 17% (26) 1572018 House Vote: Democrat 75% (576) 11% (84) 5% (35) 2% (19) 7% (54) 7672018 House Vote: Republican 30% (189) 28% (179) 10% (66) 16% (99) 15% (97) 6292018 House Vote: Someone else 43% (31) 17% (13) 8% (6) 2% (2) 29% (21) 732016 Vote: Hillary Clinton 74% (520) 12% (84) 4% (28) 3% (18) 7% (49) 7002016 Vote: Donald Trump 30% (202) 29% (195) 11% (73) 14% (97) 16% (108) 6752016 Vote: Other 60% (87) 17% (24) 6% (9) 3% (4) 14% (20) 1442016 Vote: Didn’t Vote 47% (220) 14% (65) 7% (31) 4% (21) 28% (129) 466Voted in 2014: Yes 54% (718) 19% (249) 7% (92) 8% (112) 11% (152) 1322Voted in 2014: No 47% (312) 18% (119) 8% (50) 4% (28) 23% (157) 666
Continued on next page
Page 309
National Tracking Poll #2006102, June, 2020
309
Table POL19_2
Table POL19_2: As you may know, this week the Supreme Court made several rulings. Do you support or oppose each of the Supreme Court’s recentrulings?The Supreme Court banning workplace discrimination based on sexual orientation and gender identity
DemographicStronglysupport
Somewhatsupport
Somewhatoppose
Stronglyoppose
Don’t Know /No Opinion Total N
Registered Voters 52% (1030) 19% (368) 7% (142) 7% (140) 15% (308) 19882012 Vote: Barack Obama 69% (591) 14% (123) 4% (36) 4% (32) 8% (71) 8532012 Vote: Mitt Romney 31% (153) 30% (148) 10% (49) 16% (79) 14% (72) 5012012 Vote: Other 37% (31) 17% (14) 12% (10) 8% (7) 26% (22) 842012 Vote: Didn’t Vote 46% (254) 15% (84) 9% (47) 4% (22) 26% (142) 5504-Region: Northeast 56% (198) 19% (68) 4% (16) 6% (22) 14% (51) 3554-Region: Midwest 50% (230) 19% (87) 5% (25) 8% (38) 17% (77) 4574-Region: South 48% (358) 18% (136) 9% (69) 8% (62) 16% (117) 7424-Region: West 56% (244) 18% (77) 7% (32) 4% (19) 14% (63) 434Party: Democrat/Leans Democrat 73% (662) 11% (102) 5% (43) 3% (27) 8% (77) 911Party: Republican/Leans Republican 30% (224) 28% (206) 11% (82) 13% (99) 18% (130) 741Parents 51% (444) 21% (185) 7% (60) 6% (54) 14% (121) 864Note: Row proportions may total to larger than one-hundred percent due to rounding. For more information visit MorningConsultIntelligence.com.
Page 310
310
Morning ConsultTable POL20_1
Table POL20_1: Do you support or oppose each of the following proposed police reforms?A ban on placing individuals in chokeholds
DemographicStronglysupport
Somewhatsupport
Somewhatoppose
Stronglyoppose
Don’t Know /No Opinion Total N
Registered Voters 54% (1083) 19% (374) 10% (208) 5% (106) 11% (217) 1988Gender: Male 50% (469) 20% (185) 12% (111) 6% (60) 11% (105) 930Gender: Female 58% (614) 18% (189) 9% (97) 4% (46) 11% (112) 1058Age: 18-34 52% (259) 15% (75) 11% (57) 5% (26) 17% (82) 499Age: 35-44 51% (153) 20% (62) 10% (31) 6% (18) 12% (37) 302Age: 45-64 56% (408) 19% (138) 10% (70) 6% (42) 9% (67) 724Age: 65+ 57% (264) 21% (99) 11% (49) 4% (21) 7% (30) 463GenZers: 1997-2012 47% (105) 13% (30) 10% (22) 8% (19) 21% (47) 224Millennials: 1981-1996 53% (221) 17% (73) 12% (49) 4% (19) 14% (57) 419GenXers: 1965-1980 53% (274) 20% (101) 12% (60) 5% (26) 10% (50) 511Baby Boomers: 1946-1964 58% (440) 21% (159) 9% (66) 5% (37) 8% (57) 760PID: Dem (no lean) 72% (548) 13% (95) 5% (37) 2% (19) 8% (58) 757PID: Ind (no lean) 51% (326) 20% (128) 9% (59) 6% (35) 14% (90) 638PID: Rep (no lean) 35% (210) 25% (151) 19% (111) 9% (52) 12% (69) 593PID/Gender: DemMen 68% (223) 14% (46) 6% (20) 2% (7) 10% (33) 329PID/Gender: DemWomen 76% (325) 12% (49) 4% (17) 3% (12) 6% (26) 429PID/Gender: Ind Men 47% (139) 21% (63) 10% (29) 7% (22) 15% (43) 296PID/Gender: Ind Women 55% (187) 19% (65) 9% (30) 4% (14) 14% (47) 342PID/Gender: Rep Men 35% (107) 25% (76) 20% (62) 10% (31) 10% (29) 306PID/Gender: Rep Women 36% (102) 26% (75) 17% (49) 7% (21) 14% (40) 287Ideo: Liberal (1-3) 75% (458) 13% (76) 5% (32) 2% (15) 5% (27) 609Ideo: Moderate (4) 55% (286) 22% (116) 6% (34) 5% (24) 12% (62) 522Ideo: Conservative (5-7) 39% (263) 25% (167) 18% (122) 9% (59) 10% (69) 679Educ: < College 51% (639) 19% (232) 12% (147) 6% (72) 13% (161) 1250Educ: Bachelors degree 60% (281) 18% (87) 8% (38) 4% (19) 10% (45) 470Educ: Post-grad 61% (163) 21% (55) 8% (23) 6% (15) 4% (11) 267Income: Under 50k 54% (539) 17% (175) 10% (104) 5% (50) 13% (131) 998Income: 50k-100k 54% (360) 19% (127) 11% (71) 6% (39) 10% (64) 660Income: 100k+ 56% (184) 22% (73) 10% (32) 5% (17) 7% (22) 329Ethnicity: White 52% (838) 20% (325) 12% (187) 6% (90) 10% (168) 1608Ethnicity: Hispanic 56% (107) 13% (25) 10% (18) 5% (10) 17% (33) 193
Continued on next page
Page 311
National Tracking Poll #2006102, June, 2020
311
Table POL20_1
Table POL20_1: Do you support or oppose each of the following proposed police reforms?A ban on placing individuals in chokeholds
DemographicStronglysupport
Somewhatsupport
Somewhatoppose
Stronglyoppose
Don’t Know /No Opinion Total N
Registered Voters 54% (1083) 19% (374) 10% (208) 5% (106) 11% (217) 1988Ethnicity: Afr. Am. 70% (176) 9% (23) 5% (12) 4% (9) 12% (31) 252Ethnicity: Other 54% (69) 20% (26) 6% (8) 6% (7) 14% (18) 128All Christian 50% (467) 22% (211) 12% (113) 6% (57) 10% (94) 941All Non-Christian 65% (63) 20% (20) 8% (8) 5% (4) 3% (3) 97Atheist 64% (82) 14% (17) 11% (14) 5% (7) 6% (8) 128Agnostic/Nothing in particular 57% (271) 15% (74) 8% (39) 5% (23) 15% (71) 478Something Else 58% (200) 15% (52) 10% (34) 4% (15) 12% (42) 344Religious Non-Protestant/Catholic 60% (72) 20% (24) 10% (12) 6% (7) 3% (4) 120Evangelical 49% (250) 22% (109) 10% (51) 7% (36) 12% (60) 505Non-Evangelical 54% (403) 20% (146) 12% (89) 5% (34) 10% (74) 746Community: Urban 60% (292) 15% (75) 8% (37) 3% (17) 14% (69) 490Community: Suburban 55% (542) 19% (186) 10% (101) 5% (53) 10% (98) 981Community: Rural 48% (248) 22% (113) 13% (69) 7% (37) 10% (50) 517Employ: Private Sector 55% (350) 20% (127) 10% (65) 5% (34) 9% (56) 631Employ: Government 54% (74) 22% (30) 9% (12) 9% (12) 6% (8) 136Employ: Self-Employed 50% (64) 19% (25) 10% (13) 7% (10) 14% (19) 130Employ: Homemaker 52% (60) 17% (20) 6% (7) 4% (5) 20% (23) 115Employ: Retired 58% (284) 20% (99) 11% (55) 5% (24) 6% (30) 492Employ: Unemployed 53% (122) 16% (37) 11% (26) 4% (10) 15% (35) 229Employ: Other 49% (74) 14% (21) 14% (22) 4% (6) 19% (29) 152Military HH: Yes 55% (168) 17% (53) 13% (40) 7% (20) 8% (24) 306Military HH: No 54% (915) 19% (321) 10% (167) 5% (86) 11% (193) 1682RD/WT: Right Direction 34% (192) 26% (150) 15% (86) 10% (58) 14% (81) 567RD/WT: Wrong Track 63% (891) 16% (224) 9% (121) 3% (49) 10% (136) 1421Trump Job Approve 34% (262) 26% (198) 18% (141) 10% (78) 12% (94) 774Trump Job Disapprove 70% (806) 15% (168) 5% (63) 2% (26) 8% (90) 1153Trump Job Strongly Approve 31% (127) 25% (102) 21% (85) 13% (54) 11% (46) 415Trump Job Somewhat Approve 38% (135) 27% (96) 15% (55) 7% (24) 13% (48) 359Trump Job Somewhat Disapprove 50% (113) 26% (59) 10% (22) 2% (5) 12% (27) 226Trump Job Strongly Disapprove 75% (693) 12% (108) 4% (42) 2% (21) 7% (63) 927
Continued on next page
Page 312
312
Morning ConsultTable POL20_1
Table POL20_1: Do you support or oppose each of the following proposed police reforms?A ban on placing individuals in chokeholds
DemographicStronglysupport
Somewhatsupport
Somewhatoppose
Stronglyoppose
Don’t Know /No Opinion Total N
Registered Voters 54% (1083) 19% (374) 10% (208) 5% (106) 11% (217) 1988Favorable of Trump 34% (268) 25% (195) 18% (142) 10% (81) 13% (102) 787Unfavorable of Trump 70% (798) 15% (170) 5% (59) 2% (25) 7% (80) 1132Very Favorable of Trump 31% (142) 24% (110) 21% (98) 12% (56) 12% (56) 462Somewhat Favorable of Trump 39% (126) 26% (85) 13% (43) 8% (25) 14% (46) 325Somewhat Unfavorable of Trump 47% (85) 28% (52) 12% (21) 2% (3) 11% (20) 182Very Unfavorable of Trump 75% (713) 12% (118) 4% (37) 2% (22) 6% (60) 950#1 Issue: Economy 51% (348) 20% (138) 13% (89) 7% (46) 10% (67) 688#1 Issue: Security 34% (87) 27% (68) 15% (39) 11% (27) 13% (33) 254#1 Issue: Health Care 64% (216) 15% (51) 6% (22) 3% (10) 11% (37) 335#1 Issue: Medicare / Social Security 63% (178) 18% (52) 6% (18) 4% (12) 8% (23) 283#1 Issue: Women’s Issues 64% (55) 13% (11) 4% (4) 3% (2) 16% (13) 86#1 Issue: Education 54% (58) 10% (10) 13% (14) 5% (5) 18% (19) 107#1 Issue: Energy 58% (46) 18% (14) 14% (11) 1% (1) 9% (7) 79#1 Issue: Other 61% (95) 19% (30) 7% (11) 2% (3) 11% (17) 1572018 House Vote: Democrat 76% (582) 13% (100) 4% (29) 2% (14) 6% (43) 7672018 House Vote: Republican 36% (229) 27% (172) 17% (109) 9% (57) 10% (61) 6292018 House Vote: Someone else 49% (36) 19% (14) 7% (5) 7% (5) 18% (13) 732016 Vote: Hillary Clinton 76% (535) 12% (86) 4% (27) 2% (14) 5% (38) 7002016 Vote: Donald Trump 37% (251) 27% (184) 16% (109) 9% (59) 11% (72) 6752016 Vote: Other 54% (78) 25% (36) 8% (12) 2% (4) 11% (15) 1442016 Vote: Didn’t Vote 47% (218) 15% (69) 13% (59) 6% (29) 19% (90) 466Voted in 2014: Yes 58% (771) 19% (257) 9% (123) 5% (68) 8% (102) 1322Voted in 2014: No 47% (312) 18% (117) 13% (84) 6% (38) 17% (115) 6662012 Vote: Barack Obama 70% (599) 15% (130) 7% (58) 2% (17) 6% (49) 8532012 Vote: Mitt Romney 38% (190) 28% (138) 16% (80) 8% (42) 10% (50) 5012012 Vote: Other 42% (35) 25% (21) 8% (7) 12% (10) 13% (11) 842012 Vote: Didn’t Vote 47% (258) 16% (86) 11% (63) 7% (37) 19% (106) 550
Continued on next page
Page 313
National Tracking Poll #2006102, June, 2020
313
Table POL20_1
Table POL20_1: Do you support or oppose each of the following proposed police reforms?A ban on placing individuals in chokeholds
DemographicStronglysupport
Somewhatsupport
Somewhatoppose
Stronglyoppose
Don’t Know /No Opinion Total N
Registered Voters 54% (1083) 19% (374) 10% (208) 5% (106) 11% (217) 19884-Region: Northeast 58% (205) 17% (60) 8% (29) 6% (23) 11% (38) 3554-Region: Midwest 50% (226) 21% (94) 12% (56) 6% (28) 12% (53) 4574-Region: South 54% (399) 20% (148) 12% (86) 5% (37) 10% (73) 7424-Region: West 58% (253) 17% (73) 9% (37) 4% (18) 12% (53) 434Party: Democrat/Leans Democrat 72% (658) 13% (122) 5% (45) 3% (23) 7% (64) 911Party: Republican/Leans Republican 35% (263) 26% (190) 18% (136) 9% (67) 12% (85) 741Parents 53% (459) 21% (178) 11% (96) 5% (41) 10% (89) 864Note: Row proportions may total to larger than one-hundred percent due to rounding. For more information visit MorningConsultIntelligence.com.
Page 314
314
Morning ConsultTable POL20_2
Table POL20_2: Do you support or oppose each of the following proposed police reforms?Measures to prevent, but not ban, placing individuals in chokeholds
DemographicStronglysupport
Somewhatsupport
Somewhatoppose
Stronglyoppose
Don’t Know /No Opinion Total N
Registered Voters 27% (528) 30% (594) 14% (270) 17% (341) 13% (256) 1988Gender: Male 26% (242) 31% (288) 15% (139) 16% (150) 12% (112) 930Gender: Female 27% (286) 29% (306) 12% (131) 18% (191) 14% (144) 1058Age: 18-34 24% (118) 24% (122) 14% (68) 18% (91) 20% (100) 499Age: 35-44 28% (84) 30% (91) 14% (42) 15% (46) 13% (39) 302Age: 45-64 28% (205) 27% (198) 14% (105) 18% (131) 12% (85) 724Age: 65+ 26% (121) 39% (182) 12% (55) 16% (72) 7% (32) 463GenZers: 1997-2012 24% (53) 24% (54) 12% (27) 16% (36) 24% (54) 224Millennials: 1981-1996 23% (98) 27% (112) 16% (66) 18% (76) 16% (67) 419GenXers: 1965-1980 33% (167) 26% (132) 12% (63) 17% (89) 12% (60) 511Baby Boomers: 1946-1964 26% (196) 35% (264) 14% (104) 17% (126) 9% (70) 760PID: Dem (no lean) 27% (207) 25% (188) 14% (108) 24% (178) 10% (76) 757PID: Ind (no lean) 26% (164) 28% (179) 13% (80) 16% (103) 18% (112) 638PID: Rep (no lean) 26% (157) 38% (227) 14% (81) 10% (60) 12% (69) 593PID/Gender: DemMen 29% (96) 26% (84) 15% (49) 20% (65) 10% (33) 329PID/Gender: DemWomen 26% (111) 24% (104) 14% (59) 26% (113) 10% (42) 429PID/Gender: Ind Men 23% (68) 29% (85) 14% (43) 17% (50) 17% (50) 296PID/Gender: Ind Women 28% (96) 27% (94) 11% (37) 16% (53) 18% (62) 342PID/Gender: Rep Men 25% (77) 39% (119) 15% (47) 11% (34) 9% (29) 306PID/Gender: Rep Women 28% (79) 38% (108) 12% (34) 9% (25) 14% (40) 287Ideo: Liberal (1-3) 27% (164) 25% (149) 17% (104) 24% (147) 7% (45) 609Ideo: Moderate (4) 26% (137) 29% (149) 11% (59) 19% (100) 15% (78) 522Ideo: Conservative (5-7) 27% (186) 40% (272) 14% (92) 9% (60) 10% (68) 679Educ: < College 27% (339) 28% (352) 12% (156) 17% (211) 15% (191) 1250Educ: Bachelors degree 27% (127) 31% (145) 15% (72) 17% (78) 10% (49) 470Educ: Post-grad 23% (61) 36% (97) 16% (42) 19% (52) 6% (16) 267Income: Under 50k 26% (263) 27% (270) 14% (142) 18% (182) 14% (142) 998Income: 50k-100k 26% (172) 32% (209) 12% (82) 17% (115) 13% (83) 660Income: 100k+ 28% (94) 35% (114) 14% (46) 13% (44) 10% (32) 329Ethnicity: White 26% (425) 33% (526) 14% (226) 15% (235) 12% (196) 1608Ethnicity: Hispanic 26% (50) 18% (34) 13% (25) 25% (48) 18% (35) 193
Continued on next page
Page 315
National Tracking Poll #2006102, June, 2020
315
Table POL20_2
Table POL20_2: Do you support or oppose each of the following proposed police reforms?Measures to prevent, but not ban, placing individuals in chokeholds
DemographicStronglysupport
Somewhatsupport
Somewhatoppose
Stronglyoppose
Don’t Know /No Opinion Total N
Registered Voters 27% (528) 30% (594) 14% (270) 17% (341) 13% (256) 1988Ethnicity: Afr. Am. 26% (65) 15% (38) 13% (32) 30% (76) 16% (41) 252Ethnicity: Other 29% (38) 23% (30) 9% (12) 24% (30) 14% (19) 128All Christian 27% (256) 33% (313) 14% (127) 14% (127) 13% (118) 941All Non-Christian 28% (27) 27% (27) 18% (17) 23% (22) 4% (4) 97Atheist 21% (27) 34% (43) 19% (24) 21% (27) 5% (7) 128Agnostic/Nothing in particular 24% (113) 27% (130) 13% (63) 19% (93) 16% (78) 478Something Else 31% (105) 23% (81) 11% (38) 21% (71) 14% (49) 344Religious Non-Protestant/Catholic 26% (31) 30% (36) 15% (18) 20% (24) 9% (10) 120Evangelical 27% (136) 32% (164) 13% (65) 16% (82) 12% (59) 505Non-Evangelical 30% (220) 29% (215) 13% (99) 15% (113) 13% (98) 746Community: Urban 27% (131) 23% (114) 13% (66) 19% (95) 17% (85) 490Community: Suburban 27% (263) 30% (299) 14% (139) 17% (164) 12% (116) 981Community: Rural 26% (134) 35% (180) 13% (65) 16% (82) 11% (55) 517Employ: Private Sector 27% (170) 31% (196) 13% (83) 18% (112) 11% (69) 631Employ: Government 28% (38) 28% (38) 14% (19) 18% (24) 12% (17) 136Employ: Self-Employed 23% (30) 26% (33) 15% (19) 21% (27) 16% (20) 130Employ: Homemaker 24% (28) 33% (38) 13% (15) 9% (11) 20% (23) 115Employ: Retired 29% (142) 37% (181) 12% (57) 17% (82) 6% (30) 492Employ: Unemployed 23% (54) 25% (57) 15% (34) 18% (40) 19% (44) 229Employ: Other 25% (37) 16% (24) 20% (31) 18% (28) 21% (32) 152Military HH: Yes 28% (85) 32% (99) 12% (36) 19% (58) 9% (28) 306Military HH: No 26% (443) 29% (495) 14% (234) 17% (282) 14% (228) 1682RD/WT: Right Direction 28% (160) 34% (196) 15% (82) 10% (57) 13% (72) 567RD/WT: Wrong Track 26% (368) 28% (398) 13% (187) 20% (284) 13% (184) 1421Trump Job Approve 27% (208) 36% (281) 14% (109) 11% (84) 12% (92) 774Trump Job Disapprove 27% (311) 26% (303) 14% (158) 22% (251) 11% (130) 1153Trump Job Strongly Approve 27% (112) 38% (157) 12% (49) 11% (45) 12% (51) 415Trump Job Somewhat Approve 27% (95) 35% (124) 16% (59) 11% (39) 11% (41) 359Trump Job Somewhat Disapprove 31% (70) 35% (80) 10% (23) 10% (23) 13% (30) 226Trump Job Strongly Disapprove 26% (240) 24% (223) 15% (135) 25% (228) 11% (101) 927
Continued on next page
Page 316
316
Morning ConsultTable POL20_2
Table POL20_2: Do you support or oppose each of the following proposed police reforms?Measures to prevent, but not ban, placing individuals in chokeholds
DemographicStronglysupport
Somewhatsupport
Somewhatoppose
Stronglyoppose
Don’t Know /No Opinion Total N
Registered Voters 27% (528) 30% (594) 14% (270) 17% (341) 13% (256) 1988Favorable of Trump 26% (206) 37% (292) 13% (106) 11% (83) 13% (100) 787Unfavorable of Trump 27% (307) 26% (298) 14% (159) 22% (248) 11% (120) 1132Very Favorable of Trump 26% (122) 37% (171) 13% (62) 11% (51) 12% (57) 462Somewhat Favorable of Trump 26% (84) 37% (121) 14% (45) 10% (33) 13% (43) 325Somewhat Unfavorable of Trump 32% (58) 33% (59) 11% (19) 13% (24) 11% (21) 182Very Unfavorable of Trump 26% (249) 25% (238) 15% (139) 24% (224) 10% (100) 950#1 Issue: Economy 27% (184) 32% (223) 13% (90) 16% (113) 11% (77) 688#1 Issue: Security 28% (72) 36% (91) 12% (31) 11% (28) 12% (31) 254#1 Issue: Health Care 28% (95) 25% (85) 14% (47) 21% (70) 12% (39) 335#1 Issue: Medicare / Social Security 26% (73) 30% (86) 13% (37) 18% (52) 12% (35) 283#1 Issue: Women’s Issues 23% (20) 24% (21) 13% (12) 21% (18) 18% (16) 86#1 Issue: Education 30% (32) 20% (22) 11% (12) 17% (19) 21% (23) 107#1 Issue: Energy 27% (21) 32% (25) 16% (13) 18% (14) 8% (6) 79#1 Issue: Other 20% (31) 26% (41) 18% (29) 18% (28) 18% (28) 1572018 House Vote: Democrat 26% (201) 27% (210) 14% (108) 24% (181) 9% (67) 7672018 House Vote: Republican 28% (179) 38% (240) 13% (82) 10% (62) 10% (65) 6292018 House Vote: Someone else 19% (14) 32% (23) 8% (6) 22% (16) 19% (14) 732016 Vote: Hillary Clinton 27% (191) 26% (181) 14% (100) 24% (168) 9% (60) 7002016 Vote: Donald Trump 27% (186) 38% (256) 12% (82) 11% (76) 11% (75) 6752016 Vote: Other 27% (39) 37% (53) 11% (15) 14% (20) 12% (17) 1442016 Vote: Didn’t Vote 24% (111) 22% (103) 16% (72) 16% (76) 22% (104) 466Voted in 2014: Yes 27% (360) 32% (424) 13% (172) 18% (238) 10% (127) 1322Voted in 2014: No 25% (168) 25% (169) 15% (98) 15% (103) 19% (129) 6662012 Vote: Barack Obama 28% (237) 27% (234) 14% (119) 22% (189) 9% (73) 8532012 Vote: Mitt Romney 26% (128) 42% (208) 13% (66) 10% (48) 10% (51) 5012012 Vote: Other 24% (20) 35% (29) 8% (7) 15% (12) 18% (15) 842012 Vote: Didn’t Vote 26% (142) 22% (122) 14% (78) 16% (90) 21% (117) 550
Continued on next page
Page 317
National Tracking Poll #2006102, June, 2020
317
Table POL20_2
Table POL20_2: Do you support or oppose each of the following proposed police reforms?Measures to prevent, but not ban, placing individuals in chokeholds
DemographicStronglysupport
Somewhatsupport
Somewhatoppose
Stronglyoppose
Don’t Know /No Opinion Total N
Registered Voters 27% (528) 30% (594) 14% (270) 17% (341) 13% (256) 19884-Region: Northeast 28% (99) 26% (92) 16% (57) 17% (61) 13% (46) 3554-Region: Midwest 26% (118) 32% (148) 13% (61) 13% (60) 15% (69) 4574-Region: South 26% (192) 30% (221) 13% (96) 20% (148) 11% (85) 7424-Region: West 27% (118) 30% (132) 13% (56) 17% (72) 13% (56) 434Party: Democrat/Leans Democrat 27% (249) 25% (231) 14% (130) 23% (211) 10% (90) 911Party: Republican/Leans Republican 26% (195) 38% (279) 14% (101) 10% (75) 12% (91) 741Parents 29% (250) 32% (278) 13% (112) 15% (128) 11% (95) 864Note: Row proportions may total to larger than one-hundred percent due to rounding. For more information visit MorningConsultIntelligence.com.
Page 318
318
Morning ConsultTable POL20_3
Table POL20_3: Do you support or oppose each of the following proposed police reforms?Creating a national database of police disciplinary records for police departments to refer to when hiring officers
DemographicStronglysupport
Somewhatsupport
Somewhatoppose
Stronglyoppose
Don’t Know /No Opinion Total N
Registered Voters 61% (1219) 21% (419) 4% (87) 2% (49) 11% (215) 1988Gender: Male 56% (525) 24% (222) 5% (49) 4% (35) 11% (100) 930Gender: Female 66% (695) 19% (196) 4% (37) 1% (14) 11% (115) 1058Age: 18-34 60% (298) 16% (78) 6% (29) 2% (9) 17% (85) 499Age: 35-44 61% (183) 23% (69) 2% (7) 3% (8) 11% (35) 302Age: 45-64 62% (450) 22% (160) 4% (32) 2% (17) 9% (65) 724Age: 65+ 62% (288) 24% (111) 4% (18) 3% (15) 6% (30) 463GenZers: 1997-2012 57% (127) 15% (34) 5% (11) 2% (4) 22% (49) 224Millennials: 1981-1996 60% (252) 18% (77) 5% (23) 2% (10) 14% (57) 419GenXers: 1965-1980 63% (324) 22% (113) 4% (23) 2% (12) 8% (40) 511Baby Boomers: 1946-1964 62% (474) 24% (179) 3% (25) 3% (21) 8% (61) 760PID: Dem (no lean) 73% (555) 15% (113) 3% (24) 1% (5) 8% (61) 757PID: Ind (no lean) 59% (375) 20% (128) 5% (30) 3% (20) 13% (86) 638PID: Rep (no lean) 49% (290) 30% (178) 5% (32) 4% (25) 12% (68) 593PID/Gender: DemMen 68% (225) 17% (57) 3% (10) 1% (3) 10% (33) 329PID/Gender: DemWomen 77% (330) 13% (56) 3% (14) — (1) 7% (28) 429PID/Gender: Ind Men 54% (160) 23% (67) 7% (19) 3% (9) 14% (41) 296PID/Gender: Ind Women 63% (215) 18% (61) 3% (11) 3% (10) 13% (45) 342PID/Gender: Rep Men 46% (140) 32% (98) 6% (19) 7% (22) 9% (26) 306PID/Gender: Rep Women 52% (150) 28% (80) 4% (13) 1% (2) 15% (42) 287Ideo: Liberal (1-3) 75% (457) 15% (93) 3% (20) 2% (11) 5% (28) 609Ideo: Moderate (4) 62% (324) 20% (104) 3% (17) 2% (13) 12% (64) 522Ideo: Conservative (5-7) 52% (356) 29% (200) 6% (42) 3% (21) 9% (61) 679Educ: < College 59% (741) 20% (251) 5% (61) 2% (31) 13% (166) 1250Educ: Bachelors degree 64% (301) 23% (110) 2% (11) 2% (10) 8% (38) 470Educ: Post-grad 66% (177) 22% (58) 5% (14) 3% (8) 4% (11) 267Income: Under 50k 60% (595) 20% (199) 5% (50) 2% (24) 13% (130) 998Income: 50k-100k 62% (411) 22% (144) 3% (22) 3% (18) 10% (66) 660Income: 100k+ 65% (213) 23% (76) 4% (14) 2% (7) 6% (20) 329Ethnicity: White 60% (964) 23% (364) 4% (70) 3% (45) 10% (165) 1608Ethnicity: Hispanic 62% (119) 15% (29) 3% (6) 3% (6) 17% (32) 193
Continued on next page
Page 319
National Tracking Poll #2006102, June, 2020
319
Table POL20_3
Table POL20_3: Do you support or oppose each of the following proposed police reforms?Creating a national database of police disciplinary records for police departments to refer to when hiring officers
DemographicStronglysupport
Somewhatsupport
Somewhatoppose
Stronglyoppose
Don’t Know /No Opinion Total N
Registered Voters 61% (1219) 21% (419) 4% (87) 2% (49) 11% (215) 1988Ethnicity: Afr. Am. 69% (175) 12% (30) 5% (13) — (1) 13% (33) 252Ethnicity: Other 63% (81) 19% (24) 3% (3) 2% (3) 13% (17) 128All Christian 57% (533) 26% (241) 4% (41) 4% (35) 10% (91) 941All Non-Christian 66% (64) 21% (20) 4% (4) 4% (4) 5% (5) 97Atheist 79% (101) 14% (18) 3% (4) 2% (2) 1% (2) 128Agnostic/Nothing in particular 62% (296) 17% (84) 5% (25) 1% (7) 14% (67) 478Something Else 65% (225) 16% (55) 3% (12) — (1) 15% (51) 344Religious Non-Protestant/Catholic 64% (76) 22% (27) 4% (4) 4% (4) 7% (8) 120Evangelical 56% (282) 25% (129) 3% (17) 4% (19) 12% (58) 505Non-Evangelical 61% (457) 21% (158) 5% (36) 2% (17) 10% (78) 746Community: Urban 62% (302) 19% (94) 3% (15) 2% (11) 14% (68) 490Community: Suburban 63% (614) 21% (208) 5% (48) 2% (20) 9% (90) 981Community: Rural 59% (304) 23% (116) 4% (23) 3% (17) 11% (57) 517Employ: Private Sector 65% (408) 22% (141) 3% (19) 3% (16) 7% (46) 631Employ: Government 56% (76) 26% (35) 6% (9) 4% (6) 8% (11) 136Employ: Self-Employed 58% (75) 19% (25) 4% (5) 4% (5) 15% (20) 130Employ: Homemaker 58% (67) 18% (21) 6% (7) — (0) 17% (20) 115Employ: Retired 63% (310) 23% (113) 4% (20) 3% (16) 7% (33) 492Employ: Unemployed 58% (133) 18% (42) 5% (11) 2% (4) 17% (39) 229Employ: Other 56% (85) 16% (24) 9% (14) — (1) 18% (28) 152Military HH: Yes 59% (179) 25% (77) 7% (22) 2% (7) 7% (21) 306Military HH: No 62% (1040) 20% (342) 4% (64) 2% (42) 12% (194) 1682RD/WT: Right Direction 48% (274) 28% (156) 8% (48) 4% (25) 11% (65) 567RD/WT: Wrong Track 67% (945) 18% (262) 3% (39) 2% (24) 11% (150) 1421Trump Job Approve 47% (365) 30% (236) 7% (52) 5% (38) 11% (83) 774Trump Job Disapprove 72% (833) 16% (179) 3% (33) 1% (11) 8% (97) 1153Trump Job Strongly Approve 46% (190) 29% (120) 7% (30) 7% (28) 11% (46) 415Trump Job Somewhat Approve 49% (175) 32% (115) 6% (23) 3% (9) 10% (37) 359Trump Job Somewhat Disapprove 57% (129) 26% (60) 3% (6) 2% (5) 12% (27) 226Trump Job Strongly Disapprove 76% (704) 13% (119) 3% (28) 1% (6) 8% (71) 927
Continued on next page
Page 320
320
Morning ConsultTable POL20_3
Table POL20_3: Do you support or oppose each of the following proposed police reforms?Creating a national database of police disciplinary records for police departments to refer to when hiring officers
DemographicStronglysupport
Somewhatsupport
Somewhatoppose
Stronglyoppose
Don’t Know /No Opinion Total N
Registered Voters 61% (1219) 21% (419) 4% (87) 2% (49) 11% (215) 1988Favorable of Trump 47% (371) 30% (236) 7% (53) 5% (37) 12% (91) 787Unfavorable of Trump 73% (827) 15% (174) 3% (32) 1% (11) 8% (88) 1132Very Favorable of Trump 45% (209) 28% (129) 9% (40) 6% (29) 12% (56) 462Somewhat Favorable of Trump 50% (162) 33% (107) 4% (13) 2% (8) 11% (35) 325Somewhat Unfavorable of Trump 59% (108) 23% (42) 4% (7) 4% (8) 9% (17) 182Very Unfavorable of Trump 76% (719) 14% (132) 3% (25) — (3) 7% (71) 950#1 Issue: Economy 59% (404) 24% (165) 4% (30) 3% (23) 10% (66) 688#1 Issue: Security 49% (123) 24% (61) 10% (26) 5% (13) 12% (30) 254#1 Issue: Health Care 66% (222) 21% (70) 3% (9) 1% (4) 9% (30) 335#1 Issue: Medicare / Social Security 65% (183) 21% (59) 2% (6) 2% (5) 11% (30) 283#1 Issue: Women’s Issues 67% (58) 11% (9) 5% (4) 2% (2) 15% (13) 86#1 Issue: Education 67% (71) 16% (17) 3% (3) — (0) 15% (16) 107#1 Issue: Energy 76% (60) 11% (9) 3% (2) 1% (1) 9% (7) 79#1 Issue: Other 62% (98) 18% (29) 4% (6) 1% (1) 15% (23) 1572018 House Vote: Democrat 76% (584) 15% (115) 2% (16) 1% (5) 6% (46) 7672018 House Vote: Republican 49% (308) 31% (195) 6% (41) 5% (33) 8% (52) 6292018 House Vote: Someone else 55% (40) 23% (17) 5% (3) 3% (2) 15% (11) 732016 Vote: Hillary Clinton 75% (528) 16% (112) 3% (19) — (2) 6% (39) 7002016 Vote: Donald Trump 49% (331) 30% (203) 6% (39) 6% (39) 9% (63) 6752016 Vote: Other 71% (102) 17% (24) 2% (3) — (1) 10% (14) 1442016 Vote: Didn’t Vote 55% (256) 17% (79) 6% (26) 2% (7) 21% (98) 466Voted in 2014: Yes 64% (843) 22% (294) 4% (56) 3% (34) 7% (94) 1322Voted in 2014: No 56% (376) 19% (125) 5% (30) 2% (15) 18% (121) 6662012 Vote: Barack Obama 74% (635) 17% (145) 2% (19) 1% (9) 5% (45) 8532012 Vote: Mitt Romney 49% (245) 30% (150) 7% (34) 6% (28) 9% (44) 5012012 Vote: Other 52% (44) 24% (20) 5% (4) 3% (2) 15% (13) 842012 Vote: Didn’t Vote 54% (295) 19% (104) 5% (28) 2% (10) 20% (112) 550
Continued on next page
Page 321
National Tracking Poll #2006102, June, 2020
321
Table POL20_3
Table POL20_3: Do you support or oppose each of the following proposed police reforms?Creating a national database of police disciplinary records for police departments to refer to when hiring officers
DemographicStronglysupport
Somewhatsupport
Somewhatoppose
Stronglyoppose
Don’t Know /No Opinion Total N
Registered Voters 61% (1219) 21% (419) 4% (87) 2% (49) 11% (215) 19884-Region: Northeast 64% (227) 20% (71) 4% (15) 3% (10) 9% (32) 3554-Region: Midwest 60% (275) 22% (102) 4% (16) 2% (10) 12% (53) 4574-Region: South 59% (437) 22% (163) 6% (42) 3% (22) 11% (78) 7424-Region: West 64% (280) 19% (82) 3% (14) 2% (7) 12% (52) 434Party: Democrat/Leans Democrat 75% (679) 15% (134) 3% (25) 1% (6) 7% (67) 911Party: Republican/Leans Republican 49% (365) 30% (220) 6% (46) 4% (33) 11% (78) 741Parents 63% (547) 22% (188) 4% (32) 2% (21) 9% (76) 864Note: Row proportions may total to larger than one-hundred percent due to rounding. For more information visit MorningConsultIntelligence.com.
Page 322
322
Morning ConsultTable POL20_4
Table POL20_4: Do you support or oppose each of the following proposed police reforms?Developing training programs on de-escalation and intervention for police officers
DemographicStronglysupport
Somewhatsupport
Somewhatoppose
Stronglyoppose
Don’t Know /No Opinion Total N
Registered Voters 61% (1204) 23% (459) 3% (67) 2% (44) 11% (213) 1988Gender: Male 55% (509) 27% (252) 4% (39) 3% (29) 11% (100) 930Gender: Female 66% (695) 20% (207) 3% (27) 1% (15) 11% (113) 1058Age: 18-34 56% (282) 18% (90) 5% (26) 2% (12) 18% (89) 499Age: 35-44 63% (190) 21% (63) 3% (10) 2% (5) 11% (34) 302Age: 45-64 62% (448) 25% (181) 3% (25) 2% (17) 7% (53) 724Age: 65+ 61% (284) 27% (126) 1% (6) 2% (10) 8% (37) 463GenZers: 1997-2012 53% (119) 17% (39) 4% (9) 3% (7) 23% (50) 224Millennials: 1981-1996 61% (254) 19% (78) 5% (22) 2% (9) 14% (57) 419GenXers: 1965-1980 63% (320) 23% (117) 3% (15) 2% (13) 9% (46) 511Baby Boomers: 1946-1964 62% (472) 27% (202) 3% (20) 2% (14) 7% (51) 760PID: Dem (no lean) 71% (540) 16% (118) 3% (20) 1% (8) 9% (72) 757PID: Ind (no lean) 60% (384) 20% (130) 3% (18) 3% (17) 14% (88) 638PID: Rep (no lean) 47% (280) 36% (211) 5% (29) 3% (19) 9% (53) 593PID/Gender: DemMen 65% (214) 19% (62) 3% (10) 1% (5) 12% (38) 329PID/Gender: DemWomen 76% (325) 13% (57) 2% (10) 1% (4) 8% (34) 429PID/Gender: Ind Men 55% (163) 25% (74) 4% (10) 4% (11) 13% (38) 296PID/Gender: Ind Women 65% (221) 17% (57) 2% (8) 2% (5) 15% (51) 342PID/Gender: Rep Men 43% (132) 38% (117) 6% (19) 4% (13) 8% (25) 306PID/Gender: Rep Women 52% (149) 33% (94) 3% (10) 2% (6) 10% (29) 287Ideo: Liberal (1-3) 77% (466) 14% (85) 2% (13) 2% (9) 6% (36) 609Ideo: Moderate (4) 62% (321) 23% (118) 2% (13) 2% (10) 11% (60) 522Ideo: Conservative (5-7) 50% (342) 34% (231) 5% (33) 3% (20) 8% (54) 679Educ: < College 56% (698) 25% (311) 4% (46) 3% (32) 13% (163) 1250Educ: Bachelors degree 68% (317) 20% (92) 3% (12) 1% (6) 9% (42) 470Educ: Post-grad 71% (189) 21% (56) 3% (9) 2% (6) 3% (8) 267Income: Under 50k 58% (582) 22% (222) 4% (39) 3% (28) 13% (127) 998Income: 50k-100k 61% (400) 25% (164) 3% (19) 2% (12) 10% (66) 660Income: 100k+ 68% (223) 22% (73) 3% (9) 2% (5) 6% (20) 329Ethnicity: White 60% (964) 25% (399) 3% (53) 2% (36) 10% (156) 1608Ethnicity: Hispanic 64% (123) 14% (26) 2% (4) 2% (3) 19% (36) 193
Continued on next page
Page 323
National Tracking Poll #2006102, June, 2020
323
Table POL20_4
Table POL20_4: Do you support or oppose each of the following proposed police reforms?Developing training programs on de-escalation and intervention for police officers
DemographicStronglysupport
Somewhatsupport
Somewhatoppose
Stronglyoppose
Don’t Know /No Opinion Total N
Registered Voters 61% (1204) 23% (459) 3% (67) 2% (44) 11% (213) 1988Ethnicity: Afr. Am. 65% (163) 14% (35) 5% (12) 1% (3) 16% (39) 252Ethnicity: Other 61% (78) 20% (26) 1% (2) 4% (5) 14% (18) 128All Christian 58% (549) 27% (251) 4% (36) 2% (20) 9% (86) 941All Non-Christian 60% (59) 31% (30) 2% (2) 2% (2) 5% (5) 97Atheist 72% (92) 18% (23) 1% (1) 3% (4) 6% (8) 128Agnostic/Nothing in particular 59% (284) 20% (97) 4% (17) 3% (14) 14% (67) 478Something Else 64% (222) 17% (58) 3% (11) 1% (5) 14% (48) 344Religious Non-Protestant/Catholic 58% (70) 32% (38) 3% (4) 2% (2) 5% (6) 120Evangelical 56% (283) 24% (122) 5% (24) 3% (13) 13% (64) 505Non-Evangelical 63% (472) 23% (173) 3% (22) 2% (11) 9% (68) 746Community: Urban 62% (305) 19% (93) 2% (11) 3% (13) 14% (68) 490Community: Suburban 62% (612) 23% (222) 4% (35) 2% (17) 10% (95) 981Community: Rural 56% (288) 28% (145) 4% (21) 3% (14) 10% (50) 517Employ: Private Sector 62% (393) 25% (157) 4% (22) 2% (10) 8% (48) 631Employ: Government 64% (86) 21% (28) 3% (5) 7% (9) 5% (7) 136Employ: Self-Employed 61% (80) 19% (24) 3% (3) 2% (3) 15% (19) 130Employ: Homemaker 59% (68) 20% (23) 2% (2) 2% (3) 16% (19) 115Employ: Retired 62% (306) 27% (131) 2% (10) 3% (13) 6% (31) 492Employ: Unemployed 53% (121) 22% (50) 4% (9) 2% (4) 20% (45) 229Employ: Other 58% (88) 17% (26) 8% (12) 1% (1) 17% (25) 152Military HH: Yes 60% (183) 25% (78) 4% (12) 2% (7) 9% (26) 306Military HH: No 61% (1022) 23% (381) 3% (55) 2% (37) 11% (187) 1682RD/WT: Right Direction 47% (265) 33% (188) 6% (34) 3% (16) 11% (63) 567RD/WT: Wrong Track 66% (939) 19% (271) 2% (33) 2% (28) 11% (150) 1421Trump Job Approve 47% (363) 34% (266) 5% (38) 4% (30) 10% (77) 774Trump Job Disapprove 72% (825) 16% (185) 2% (26) 1% (13) 9% (105) 1153Trump Job Strongly Approve 42% (175) 36% (149) 4% (15) 6% (25) 12% (49) 415Trump Job Somewhat Approve 52% (187) 33% (117) 6% (23) 1% (5) 8% (28) 359Trump Job Somewhat Disapprove 57% (129) 27% (61) 3% (7) 2% (3) 11% (26) 226Trump Job Strongly Disapprove 75% (696) 13% (123) 2% (19) 1% (9) 9% (79) 927
Continued on next page
Page 324
324
Morning ConsultTable POL20_4
Table POL20_4: Do you support or oppose each of the following proposed police reforms?Developing training programs on de-escalation and intervention for police officers
DemographicStronglysupport
Somewhatsupport
Somewhatoppose
Stronglyoppose
Don’t Know /No Opinion Total N
Registered Voters 61% (1204) 23% (459) 3% (67) 2% (44) 11% (213) 1988Favorable of Trump 46% (363) 34% (267) 6% (43) 4% (31) 10% (82) 787Unfavorable of Trump 72% (819) 16% (182) 2% (20) 1% (13) 9% (97) 1132Very Favorable of Trump 42% (195) 36% (167) 5% (23) 5% (24) 12% (54) 462Somewhat Favorable of Trump 52% (168) 31% (100) 6% (21) 2% (7) 9% (28) 325Somewhat Unfavorable of Trump 57% (103) 29% (53) 2% (3) 2% (3) 11% (19) 182Very Unfavorable of Trump 75% (715) 14% (130) 2% (17) 1% (10) 8% (78) 950#1 Issue: Economy 60% (413) 25% (173) 4% (27) 2% (16) 9% (59) 688#1 Issue: Security 41% (105) 35% (89) 5% (14) 5% (13) 13% (33) 254#1 Issue: Health Care 70% (233) 17% (58) 3% (11) 2% (5) 8% (28) 335#1 Issue: Medicare / Social Security 58% (164) 26% (73) 2% (5) 2% (6) 12% (35) 283#1 Issue: Women’s Issues 68% (58) 11% (9) 2% (2) 1% (1) 18% (16) 86#1 Issue: Education 65% (70) 17% (18) 2% (2) 1% (1) 15% (16) 107#1 Issue: Energy 68% (54) 19% (15) 4% (3) — (0) 9% (7) 79#1 Issue: Other 69% (108) 16% (25) 2% (4) 1% (1) 12% (19) 1572018 House Vote: Democrat 76% (582) 15% (117) 2% (15) 1% (6) 6% (48) 7672018 House Vote: Republican 48% (304) 35% (219) 5% (33) 4% (26) 7% (47) 6292018 House Vote: Someone else 47% (34) 29% (21) 4% (3) — (0) 21% (15) 732016 Vote: Hillary Clinton 75% (526) 16% (114) 2% (11) 1% (4) 6% (44) 7002016 Vote: Donald Trump 50% (335) 34% (230) 4% (26) 4% (27) 9% (57) 6752016 Vote: Other 69% (100) 20% (29) 2% (3) 1% (1) 8% (12) 1442016 Vote: Didn’t Vote 52% (242) 19% (86) 6% (27) 3% (12) 21% (98) 466Voted in 2014: Yes 64% (840) 24% (318) 3% (42) 2% (28) 7% (93) 1322Voted in 2014: No 55% (364) 21% (141) 4% (25) 2% (16) 18% (120) 6662012 Vote: Barack Obama 73% (620) 18% (153) 2% (17) 1% (8) 7% (55) 8532012 Vote: Mitt Romney 50% (250) 33% (168) 5% (24) 4% (22) 7% (37) 5012012 Vote: Other 55% (46) 25% (21) 3% (3) 5% (4) 11% (9) 842012 Vote: Didn’t Vote 52% (287) 21% (118) 4% (23) 2% (10) 20% (111) 550
Continued on next page
Page 325
National Tracking Poll #2006102, June, 2020
325
Table POL20_4
Table POL20_4: Do you support or oppose each of the following proposed police reforms?Developing training programs on de-escalation and intervention for police officers
DemographicStronglysupport
Somewhatsupport
Somewhatoppose
Stronglyoppose
Don’t Know /No Opinion Total N
Registered Voters 61% (1204) 23% (459) 3% (67) 2% (44) 11% (213) 19884-Region: Northeast 60% (212) 23% (82) 5% (16) 2% (8) 10% (37) 3554-Region: Midwest 58% (263) 26% (120) 3% (15) 1% (6) 12% (53) 4574-Region: South 60% (442) 23% (170) 4% (27) 3% (26) 10% (78) 7424-Region: West 66% (287) 20% (88) 2% (9) 1% (5) 11% (46) 434Party: Democrat/Leans Democrat 73% (668) 15% (132) 2% (20) 1% (11) 9% (80) 911Party: Republican/Leans Republican 49% (365) 34% (252) 5% (34) 3% (26) 9% (64) 741Parents 61% (523) 25% (217) 4% (35) 1% (12) 9% (77) 864Note: Row proportions may total to larger than one-hundred percent due to rounding. For more information visit MorningConsultIntelligence.com.
Page 326
326
Morning ConsultTable POL20_5
Table POL20_5: Do you support or oppose each of the following proposed police reforms?Requiring officers to use police body cameras
DemographicStronglysupport
Somewhatsupport
Somewhatoppose
Stronglyoppose
Don’t Know /No Opinion Total N
Registered Voters 70% (1393) 17% (339) 3% (53) 1% (23) 9% (180) 1988Gender: Male 65% (604) 20% (185) 4% (33) 1% (14) 10% (95) 930Gender: Female 75% (789) 15% (154) 2% (20) 1% (9) 8% (85) 1058Age: 18-34 67% (335) 12% (59) 6% (28) 1% (6) 14% (72) 499Age: 35-44 66% (200) 20% (60) 1% (4) 2% (5) 11% (34) 302Age: 45-64 71% (514) 19% (135) 2% (16) 1% (8) 7% (50) 724Age: 65+ 74% (344) 18% (84) 1% (5) 1% (4) 5% (24) 463GenZers: 1997-2012 64% (144) 12% (27) 3% (7) 2% (5) 18% (41) 224Millennials: 1981-1996 67% (282) 15% (63) 6% (23) — (2) 12% (49) 419GenXers: 1965-1980 70% (358) 18% (93) 2% (9) 2% (9) 8% (43) 511Baby Boomers: 1946-1964 74% (563) 18% (136) 1% (11) 1% (6) 6% (44) 760PID: Dem (no lean) 79% (597) 11% (87) 2% (16) 1% (5) 7% (53) 757PID: Ind (no lean) 68% (435) 18% (114) 2% (10) 1% (7) 11% (72) 638PID: Rep (no lean) 61% (362) 23% (138) 5% (27) 2% (11) 9% (55) 593PID/Gender: DemMen 75% (247) 13% (42) 2% (8) — (1) 9% (31) 329PID/Gender: DemWomen 82% (350) 10% (44) 2% (8) 1% (4) 5% (22) 429PID/Gender: Ind Men 63% (186) 21% (62) 2% (7) 1% (4) 12% (37) 296PID/Gender: Ind Women 73% (249) 15% (52) 1% (2) 1% (3) 10% (35) 342PID/Gender: Rep Men 56% (171) 26% (80) 6% (18) 3% (9) 9% (28) 306PID/Gender: Rep Women 66% (191) 20% (58) 3% (9) 1% (2) 9% (27) 287Ideo: Liberal (1-3) 81% (492) 12% (74) 1% (8) 2% (10) 4% (24) 609Ideo: Moderate (4) 70% (366) 16% (85) 2% (13) 1% (6) 10% (52) 522Ideo: Conservative (5-7) 63% (431) 24% (162) 4% (29) 1% (5) 8% (53) 679Educ: < College 69% (864) 16% (199) 3% (35) 1% (17) 11% (136) 1250Educ: Bachelors degree 73% (344) 17% (80) 2% (9) 1% (3) 7% (33) 470Educ: Post-grad 69% (185) 22% (60) 4% (10) 1% (2) 4% (11) 267Income: Under 50k 70% (698) 15% (153) 3% (26) 2% (15) 11% (107) 998Income: 50k-100k 69% (454) 19% (124) 3% (21) 1% (7) 8% (55) 660Income: 100k+ 73% (242) 19% (62) 2% (6) — (1) 6% (19) 329Ethnicity: White 69% (1115) 19% (298) 3% (44) 1% (16) 8% (135) 1608Ethnicity: Hispanic 71% (137) 9% (18) 2% (4) 3% (5) 15% (28) 193
Continued on next page
Page 327
National Tracking Poll #2006102, June, 2020
327
Table POL20_5
Table POL20_5: Do you support or oppose each of the following proposed police reforms?Requiring officers to use police body cameras
DemographicStronglysupport
Somewhatsupport
Somewhatoppose
Stronglyoppose
Don’t Know /No Opinion Total N
Registered Voters 70% (1393) 17% (339) 3% (53) 1% (23) 9% (180) 1988Ethnicity: Afr. Am. 77% (195) 7% (18) 3% (7) 1% (3) 12% (29) 252Ethnicity: Other 65% (83) 18% (23) 2% (2) 3% (3) 12% (16) 128All Christian 66% (620) 22% (207) 3% (29) 1% (9) 8% (75) 941All Non-Christian 65% (64) 24% (23) 2% (2) 5% (5) 4% (4) 97Atheist 85% (108) 12% (15) 2% (3) — (0) 2% (2) 128Agnostic/Nothing in particular 71% (340) 12% (58) 2% (12) 2% (8) 13% (61) 478Something Else 76% (261) 10% (36) 2% (8) — (1) 11% (38) 344Religious Non-Protestant/Catholic 69% (83) 22% (26) 2% (2) 4% (5) 3% (4) 120Evangelical 68% (341) 18% (89) 4% (18) 1% (5) 10% (52) 505Non-Evangelical 69% (515) 20% (148) 3% (19) 1% (5) 8% (59) 746Community: Urban 69% (338) 17% (84) 2% (10) — (1) 12% (56) 490Community: Suburban 71% (692) 18% (173) 3% (25) 1% (13) 8% (77) 981Community: Rural 70% (362) 16% (81) 4% (18) 2% (9) 9% (47) 517Employ: Private Sector 70% (440) 20% (127) 3% (21) 1% (4) 6% (39) 631Employ: Government 69% (93) 18% (25) 3% (4) 3% (4) 7% (9) 136Employ: Self-Employed 69% (90) 14% (18) 1% (1) 4% (5) 12% (16) 130Employ: Homemaker 69% (80) 14% (16) 2% (3) — (0) 15% (17) 115Employ: Retired 76% (373) 16% (80) 2% (9) 1% (5) 5% (25) 492Employ: Unemployed 61% (139) 19% (44) 2% (4) 2% (4) 16% (37) 229Employ: Other 69% (104) 13% (19) 6% (9) — (0) 13% (20) 152Military HH: Yes 74% (226) 16% (49) 3% (9) 2% (5) 6% (17) 306Military HH: No 69% (1167) 17% (290) 3% (44) 1% (17) 10% (163) 1682RD/WT: Right Direction 59% (337) 23% (132) 5% (30) 1% (5) 11% (64) 567RD/WT: Wrong Track 74% (1056) 15% (207) 2% (23) 1% (17) 8% (117) 1421Trump Job Approve 61% (469) 23% (180) 4% (34) 2% (14) 10% (76) 774Trump Job Disapprove 78% (899) 13% (150) 2% (20) 1% (8) 7% (76) 1153Trump Job Strongly Approve 60% (247) 23% (96) 4% (18) 3% (12) 10% (42) 415Trump Job Somewhat Approve 62% (222) 24% (85) 4% (16) 1% (3) 9% (34) 359Trump Job Somewhat Disapprove 63% (142) 27% (61) 1% (2) — (1) 9% (21) 226Trump Job Strongly Disapprove 82% (757) 10% (89) 2% (18) 1% (8) 6% (56) 927
Continued on next page
Page 328
328
Morning ConsultTable POL20_5
Table POL20_5: Do you support or oppose each of the following proposed police reforms?Requiring officers to use police body cameras
DemographicStronglysupport
Somewhatsupport
Somewhatoppose
Stronglyoppose
Don’t Know /No Opinion Total N
Registered Voters 70% (1393) 17% (339) 3% (53) 1% (23) 9% (180) 1988Favorable of Trump 60% (468) 24% (186) 4% (33) 2% (13) 11% (87) 787Unfavorable of Trump 79% (891) 13% (149) 2% (19) 1% (9) 6% (64) 1132Very Favorable of Trump 59% (272) 24% (109) 5% (22) 2% (8) 11% (50) 462Somewhat Favorable of Trump 60% (196) 24% (76) 3% (11) 2% (5) 11% (36) 325Somewhat Unfavorable of Trump 60% (109) 31% (57) 2% (4) 1% (2) 5% (9) 182Very Unfavorable of Trump 82% (783) 10% (92) 2% (14) 1% (7) 6% (55) 950#1 Issue: Economy 68% (467) 20% (139) 3% (22) 2% (12) 7% (48) 688#1 Issue: Security 62% (157) 22% (56) 4% (10) 2% (5) 10% (26) 254#1 Issue: Health Care 75% (253) 14% (48) 2% (7) — (1) 8% (26) 335#1 Issue: Medicare / Social Security 74% (209) 15% (42) 1% (3) 1% (2) 10% (28) 283#1 Issue: Women’s Issues 75% (65) 8% (7) 4% (4) — (0) 12% (11) 86#1 Issue: Education 66% (70) 15% (16) 2% (2) — (0) 17% (18) 107#1 Issue: Energy 74% (58) 18% (14) 3% (2) 1% (1) 4% (3) 79#1 Issue: Other 73% (114) 11% (17) 3% (4) 1% (2) 13% (20) 1572018 House Vote: Democrat 81% (621) 12% (92) 2% (12) 1% (4) 5% (40) 7672018 House Vote: Republican 62% (389) 26% (162) 4% (23) 2% (13) 7% (42) 6292018 House Vote: Someone else 64% (47) 20% (14) 1% (1) 1% (1) 15% (11) 732016 Vote: Hillary Clinton 81% (568) 12% (86) 1% (9) — (3) 5% (34) 7002016 Vote: Donald Trump 61% (413) 26% (174) 3% (21) 2% (13) 8% (53) 6752016 Vote: Other 71% (103) 16% (23) 1% (2) 1% (1) 10% (15) 1442016 Vote: Didn’t Vote 66% (307) 12% (56) 4% (21) 1% (5) 17% (78) 466Voted in 2014: Yes 72% (953) 19% (246) 2% (32) 1% (14) 6% (75) 1322Voted in 2014: No 66% (439) 14% (93) 3% (21) 1% (8) 16% (105) 6662012 Vote: Barack Obama 79% (678) 14% (123) 1% (13) — (3) 4% (36) 8532012 Vote: Mitt Romney 63% (315) 26% (129) 3% (14) 2% (11) 6% (32) 5012012 Vote: Other 62% (52) 18% (15) 5% (5) 1% (1) 14% (12) 842012 Vote: Didn’t Vote 63% (348) 13% (72) 4% (22) 1% (8) 18% (100) 550
Continued on next page
Page 329
National Tracking Poll #2006102, June, 2020
329
Table POL20_5
Table POL20_5: Do you support or oppose each of the following proposed police reforms?Requiring officers to use police body cameras
DemographicStronglysupport
Somewhatsupport
Somewhatoppose
Stronglyoppose
Don’t Know /No Opinion Total N
Registered Voters 70% (1393) 17% (339) 3% (53) 1% (23) 9% (180) 19884-Region: Northeast 67% (237) 22% (77) 3% (10) — (2) 8% (28) 3554-Region: Midwest 71% (326) 16% (74) 3% (13) 1% (3) 9% (40) 4574-Region: South 70% (518) 16% (117) 3% (23) 2% (14) 9% (70) 7424-Region: West 72% (312) 16% (70) 2% (7) 1% (4) 10% (42) 434Party: Democrat/Leans Democrat 80% (730) 11% (103) 2% (16) 1% (5) 6% (56) 911Party: Republican/Leans Republican 62% (459) 24% (175) 4% (31) 2% (13) 9% (63) 741Parents 72% (618) 18% (155) 2% (21) — (2) 8% (68) 864Note: Row proportions may total to larger than one-hundred percent due to rounding. For more information visit MorningConsultIntelligence.com.
Page 330
330
Morning ConsultTable POL20_6
Table POL20_6: Do you support or oppose each of the following proposed police reforms?A federal ban on no-knock warrants where an officer enters an individual’s home without prior warning
DemographicStronglysupport
Somewhatsupport
Somewhatoppose
Stronglyoppose
Don’t Know /No Opinion Total N
Registered Voters 43% (855) 21% (410) 12% (246) 11% (219) 13% (259) 1988Gender: Male 42% (393) 22% (200) 12% (115) 12% (116) 11% (106) 930Gender: Female 44% (462) 20% (210) 12% (131) 10% (102) 14% (152) 1058Age: 18-34 45% (227) 19% (94) 10% (48) 10% (48) 17% (83) 499Age: 35-44 44% (133) 24% (74) 12% (35) 6% (18) 14% (41) 302Age: 45-64 43% (311) 19% (135) 13% (93) 13% (93) 13% (92) 724Age: 65+ 40% (183) 23% (107) 15% (70) 13% (59) 9% (43) 463GenZers: 1997-2012 43% (97) 15% (34) 12% (26) 11% (24) 19% (42) 224Millennials: 1981-1996 45% (190) 23% (96) 9% (40) 8% (33) 14% (60) 419GenXers: 1965-1980 45% (228) 21% (105) 12% (64) 11% (56) 11% (58) 511Baby Boomers: 1946-1964 41% (309) 21% (162) 14% (107) 13% (97) 11% (85) 760PID: Dem (no lean) 56% (426) 19% (142) 8% (63) 6% (49) 10% (78) 757PID: Ind (no lean) 39% (252) 22% (140) 11% (72) 12% (75) 15% (98) 638PID: Rep (no lean) 30% (177) 22% (128) 19% (110) 16% (95) 14% (83) 593PID/Gender: DemMen 55% (181) 22% (73) 7% (23) 6% (19) 10% (32) 329PID/Gender: DemWomen 57% (245) 16% (69) 9% (40) 7% (29) 11% (46) 429PID/Gender: Ind Men 40% (120) 21% (61) 12% (36) 13% (37) 14% (42) 296PID/Gender: Ind Women 39% (132) 23% (79) 11% (37) 11% (38) 16% (56) 342PID/Gender: Rep Men 30% (92) 22% (66) 18% (56) 19% (59) 11% (32) 306PID/Gender: Rep Women 30% (85) 22% (62) 19% (54) 12% (35) 18% (50) 287Ideo: Liberal (1-3) 58% (355) 21% (128) 8% (48) 6% (36) 7% (41) 609Ideo: Moderate (4) 41% (213) 23% (119) 12% (61) 11% (55) 14% (74) 522Ideo: Conservative (5-7) 33% (226) 22% (147) 17% (118) 15% (102) 13% (86) 679Educ: < College 41% (517) 19% (244) 12% (152) 12% (152) 15% (186) 1250Educ: Bachelors degree 46% (217) 19% (91) 14% (65) 9% (42) 12% (55) 470Educ: Post-grad 45% (120) 28% (76) 11% (28) 10% (26) 7% (18) 267Income: Under 50k 43% (429) 18% (175) 12% (117) 12% (121) 16% (157) 998Income: 50k-100k 42% (278) 24% (156) 13% (88) 10% (69) 11% (70) 660Income: 100k+ 45% (148) 24% (79) 13% (42) 9% (29) 10% (33) 329Ethnicity: White 40% (641) 22% (358) 13% (217) 11% (183) 13% (209) 1608Ethnicity: Hispanic 49% (94) 18% (35) 8% (16) 9% (18) 15% (29) 193
Continued on next page
Page 331
National Tracking Poll #2006102, June, 2020
331
Table POL20_6
Table POL20_6: Do you support or oppose each of the following proposed police reforms?A federal ban on no-knock warrants where an officer enters an individual’s home without prior warning
DemographicStronglysupport
Somewhatsupport
Somewhatoppose
Stronglyoppose
Don’t Know /No Opinion Total N
Registered Voters 43% (855) 21% (410) 12% (246) 11% (219) 13% (259) 1988Ethnicity: Afr. Am. 59% (149) 13% (32) 6% (16) 10% (24) 13% (32) 252Ethnicity: Other 50% (64) 16% (21) 11% (14) 9% (11) 14% (18) 128All Christian 38% (359) 23% (213) 15% (140) 12% (109) 13% (120) 941All Non-Christian 54% (52) 21% (21) 11% (11) 8% (8) 6% (6) 97Atheist 61% (78) 20% (26) 9% (11) 7% (9) 3% (4) 128Agnostic/Nothing in particular 43% (207) 18% (88) 11% (54) 11% (51) 16% (79) 478Something Else 46% (159) 18% (63) 9% (30) 12% (41) 15% (51) 344Religious Non-Protestant/Catholic 50% (60) 23% (28) 10% (12) 9% (11) 7% (8) 120Evangelical 38% (190) 24% (120) 13% (64) 12% (60) 14% (71) 505Non-Evangelical 42% (317) 20% (147) 14% (102) 12% (87) 13% (93) 746Community: Urban 45% (220) 21% (101) 10% (51) 9% (46) 15% (71) 490Community: Suburban 43% (424) 21% (207) 13% (124) 11% (108) 12% (118) 981Community: Rural 41% (210) 20% (102) 14% (70) 13% (65) 13% (70) 517Employ: Private Sector 47% (294) 22% (138) 11% (72) 10% (64) 10% (63) 631Employ: Government 45% (61) 22% (30) 12% (17) 11% (15) 10% (14) 136Employ: Self-Employed 44% (57) 21% (27) 13% (17) 8% (10) 14% (19) 130Employ: Homemaker 38% (44) 21% (24) 10% (11) 11% (13) 20% (23) 115Employ: Retired 40% (196) 23% (113) 15% (72) 13% (62) 10% (49) 492Employ: Unemployed 45% (102) 16% (36) 11% (26) 10% (23) 18% (42) 229Employ: Other 36% (54) 15% (22) 16% (25) 14% (21) 19% (29) 152Military HH: Yes 45% (137) 18% (56) 13% (39) 13% (39) 11% (34) 306Military HH: No 43% (717) 21% (354) 12% (207) 11% (179) 13% (224) 1682RD/WT: Right Direction 31% (175) 22% (127) 17% (99) 16% (90) 14% (78) 567RD/WT: Wrong Track 48% (680) 20% (283) 10% (147) 9% (129) 13% (181) 1421Trump Job Approve 29% (226) 22% (171) 18% (137) 18% (136) 13% (104) 774Trump Job Disapprove 54% (619) 20% (232) 9% (102) 7% (81) 10% (120) 1153Trump Job Strongly Approve 28% (115) 19% (77) 18% (76) 22% (89) 14% (58) 415Trump Job Somewhat Approve 31% (111) 26% (93) 17% (61) 13% (46) 13% (46) 359Trump Job Somewhat Disapprove 32% (73) 33% (76) 12% (26) 8% (18) 15% (33) 226Trump Job Strongly Disapprove 59% (545) 17% (157) 8% (75) 7% (63) 9% (87) 927
Continued on next page
Page 332
332
Morning ConsultTable POL20_6
Table POL20_6: Do you support or oppose each of the following proposed police reforms?A federal ban on no-knock warrants where an officer enters an individual’s home without prior warning
DemographicStronglysupport
Somewhatsupport
Somewhatoppose
Stronglyoppose
Don’t Know /No Opinion Total N
Registered Voters 43% (855) 21% (410) 12% (246) 11% (219) 13% (259) 1988Favorable of Trump 29% (231) 23% (178) 18% (140) 17% (131) 14% (107) 787Unfavorable of Trump 54% (611) 20% (225) 9% (102) 7% (84) 10% (111) 1132Very Favorable of Trump 27% (124) 21% (97) 18% (81) 21% (96) 14% (64) 462Somewhat Favorable of Trump 33% (107) 25% (81) 18% (59) 11% (35) 13% (43) 325Somewhat Unfavorable of Trump 30% (55) 32% (58) 13% (23) 11% (20) 14% (26) 182Very Unfavorable of Trump 58% (556) 18% (167) 8% (79) 7% (64) 9% (85) 950#1 Issue: Economy 42% (290) 20% (140) 14% (94) 13% (89) 11% (74) 688#1 Issue: Security 30% (76) 22% (56) 18% (45) 17% (43) 13% (34) 254#1 Issue: Health Care 52% (173) 21% (71) 10% (35) 6% (22) 10% (35) 335#1 Issue: Medicare / Social Security 37% (106) 24% (68) 9% (26) 14% (40) 15% (44) 283#1 Issue: Women’s Issues 52% (45) 18% (15) 10% (8) 3% (2) 18% (15) 86#1 Issue: Education 49% (52) 17% (19) 10% (11) 5% (6) 18% (19) 107#1 Issue: Energy 45% (36) 19% (15) 15% (12) 9% (7) 11% (9) 79#1 Issue: Other 49% (77) 17% (27) 9% (14) 6% (10) 18% (29) 1572018 House Vote: Democrat 57% (440) 20% (152) 9% (66) 6% (45) 9% (66) 7672018 House Vote: Republican 31% (198) 23% (145) 18% (114) 15% (95) 12% (76) 6292018 House Vote: Someone else 35% (25) 24% (17) 10% (7) 14% (10) 18% (13) 732016 Vote: Hillary Clinton 57% (396) 20% (140) 9% (61) 6% (44) 8% (59) 7002016 Vote: Donald Trump 31% (207) 23% (154) 17% (117) 16% (111) 13% (86) 6752016 Vote: Other 43% (62) 25% (36) 12% (17) 7% (10) 13% (19) 1442016 Vote: Didn’t Vote 41% (190) 17% (80) 11% (51) 11% (52) 20% (93) 466Voted in 2014: Yes 45% (589) 22% (287) 13% (172) 10% (137) 10% (137) 1322Voted in 2014: No 40% (266) 19% (124) 11% (74) 12% (81) 18% (122) 6662012 Vote: Barack Obama 53% (448) 21% (179) 11% (93) 8% (66) 8% (67) 8532012 Vote: Mitt Romney 30% (153) 22% (112) 18% (92) 16% (79) 13% (65) 5012012 Vote: Other 43% (36) 17% (14) 9% (8) 10% (9) 20% (17) 842012 Vote: Didn’t Vote 39% (217) 19% (105) 10% (53) 12% (65) 20% (110) 550
Continued on next page
Page 333
National Tracking Poll #2006102, June, 2020
333
Table POL20_6
Table POL20_6: Do you support or oppose each of the following proposed police reforms?A federal ban on no-knock warrants where an officer enters an individual’s home without prior warning
DemographicStronglysupport
Somewhatsupport
Somewhatoppose
Stronglyoppose
Don’t Know /No Opinion Total N
Registered Voters 43% (855) 21% (410) 12% (246) 11% (219) 13% (259) 19884-Region: Northeast 41% (145) 21% (74) 15% (54) 12% (41) 12% (41) 3554-Region: Midwest 40% (181) 20% (91) 14% (64) 12% (55) 14% (65) 4574-Region: South 44% (324) 20% (147) 12% (92) 11% (85) 13% (95) 7424-Region: West 47% (205) 23% (98) 8% (36) 9% (37) 13% (57) 434Party: Democrat/Leans Democrat 56% (512) 20% (184) 8% (74) 6% (57) 9% (85) 911Party: Republican/Leans Republican 30% (220) 22% (167) 18% (130) 17% (125) 13% (100) 741Parents 42% (362) 22% (186) 13% (114) 11% (95) 12% (106) 864Note: Row proportions may total to larger than one-hundred percent due to rounding. For more information visit MorningConsultIntelligence.com.
Page 334
334
Morning ConsultTable POL20_7
Table POL20_7: Do you support or oppose each of the following proposed police reforms?A federal requirement to increase regulations for officers to use a no-knock warrant where an officer enters an individual’s home without prior warning
DemographicStronglysupport
Somewhatsupport
Somewhatoppose
Stronglyoppose
Don’t Know /No Opinion Total N
Registered Voters 36% (722) 23% (465) 10% (204) 13% (259) 17% (338) 1988Gender: Male 35% (329) 25% (230) 11% (106) 13% (124) 15% (141) 930Gender: Female 37% (392) 22% (235) 9% (98) 13% (135) 19% (198) 1058Age: 18-34 38% (189) 19% (97) 9% (47) 11% (53) 23% (114) 499Age: 35-44 41% (124) 22% (66) 9% (26) 11% (33) 17% (53) 302Age: 45-64 33% (240) 26% (189) 10% (72) 16% (115) 15% (108) 724Age: 65+ 37% (170) 24% (113) 13% (59) 12% (58) 14% (63) 463GenZers: 1997-2012 36% (80) 20% (44) 9% (20) 9% (21) 26% (59) 224Millennials: 1981-1996 39% (162) 20% (83) 10% (41) 12% (51) 20% (84) 419GenXers: 1965-1980 37% (190) 25% (128) 10% (49) 13% (68) 15% (75) 511Baby Boomers: 1946-1964 34% (260) 26% (199) 11% (81) 15% (110) 14% (109) 760PID: Dem (no lean) 48% (363) 19% (143) 7% (54) 13% (96) 13% (101) 757PID: Ind (no lean) 32% (207) 22% (140) 10% (63) 15% (95) 21% (133) 638PID: Rep (no lean) 26% (151) 31% (182) 15% (87) 11% (68) 18% (104) 593PID/Gender: DemMen 46% (151) 20% (66) 8% (27) 13% (44) 12% (41) 329PID/Gender: DemWomen 49% (212) 18% (78) 6% (26) 12% (52) 14% (61) 429PID/Gender: Ind Men 33% (97) 20% (60) 10% (30) 15% (45) 21% (63) 296PID/Gender: Ind Women 32% (110) 23% (79) 10% (33) 15% (50) 21% (70) 342PID/Gender: Rep Men 27% (81) 34% (104) 16% (49) 11% (34) 12% (37) 306PID/Gender: Rep Women 24% (70) 27% (78) 13% (39) 12% (33) 23% (67) 287Ideo: Liberal (1-3) 49% (297) 18% (111) 8% (51) 14% (87) 10% (63) 609Ideo: Moderate (4) 36% (189) 24% (125) 8% (41) 12% (64) 20% (103) 522Ideo: Conservative (5-7) 28% (192) 31% (210) 14% (94) 11% (74) 16% (108) 679Educ: < College 34% (420) 22% (279) 10% (129) 14% (176) 20% (246) 1250Educ: Bachelors degree 41% (194) 25% (116) 10% (45) 11% (50) 14% (65) 470Educ: Post-grad 40% (107) 26% (70) 11% (30) 12% (33) 10% (27) 267Income: Under 50k 35% (346) 20% (196) 11% (106) 16% (157) 19% (193) 998Income: 50k-100k 36% (237) 28% (186) 9% (62) 11% (74) 15% (102) 660Income: 100k+ 42% (139) 25% (84) 11% (36) 8% (28) 13% (43) 329Ethnicity: White 35% (559) 26% (413) 11% (180) 12% (186) 17% (271) 1608Ethnicity: Hispanic 38% (74) 18% (34) 8% (16) 16% (31) 19% (37) 193
Continued on next page
Page 335
National Tracking Poll #2006102, June, 2020
335
Table POL20_7
Table POL20_7: Do you support or oppose each of the following proposed police reforms?A federal requirement to increase regulations for officers to use a no-knock warrant where an officer enters an individual’s home without prior warning
DemographicStronglysupport
Somewhatsupport
Somewhatoppose
Stronglyoppose
Don’t Know /No Opinion Total N
Registered Voters 36% (722) 23% (465) 10% (204) 13% (259) 17% (338) 1988Ethnicity: Afr. Am. 42% (105) 10% (25) 7% (17) 23% (57) 19% (48) 252Ethnicity: Other 45% (58) 21% (27) 6% (7) 13% (16) 15% (19) 128All Christian 34% (317) 26% (249) 12% (112) 11% (105) 17% (159) 941All Non-Christian 41% (40) 34% (33) 12% (12) 5% (5) 8% (8) 97Atheist 48% (61) 21% (27) 8% (10) 14% (18) 9% (12) 128Agnostic/Nothing in particular 36% (171) 20% (94) 7% (35) 16% (76) 21% (102) 478Something Else 39% (133) 18% (62) 10% (35) 16% (56) 17% (58) 344Religious Non-Protestant/Catholic 38% (46) 36% (43) 13% (16) 6% (7) 7% (9) 120Evangelical 33% (166) 24% (121) 12% (60) 14% (72) 17% (86) 505Non-Evangelical 37% (274) 24% (176) 11% (83) 12% (87) 17% (126) 746Community: Urban 38% (187) 20% (98) 10% (49) 13% (63) 19% (92) 490Community: Suburban 37% (368) 25% (248) 9% (91) 12% (116) 16% (158) 981Community: Rural 32% (168) 23% (118) 12% (64) 15% (79) 17% (89) 517Employ: Private Sector 41% (258) 25% (156) 8% (51) 12% (78) 14% (86) 631Employ: Government 30% (40) 30% (40) 15% (21) 11% (15) 15% (20) 136Employ: Self-Employed 35% (45) 24% (32) 8% (10) 13% (17) 20% (26) 130Employ: Homemaker 35% (40) 19% (21) 9% (10) 14% (17) 23% (26) 115Employ: Retired 34% (169) 26% (126) 13% (62) 13% (65) 14% (70) 492Employ: Unemployed 38% (87) 15% (35) 9% (21) 14% (31) 24% (55) 229Employ: Other 24% (37) 23% (35) 14% (21) 18% (27) 21% (31) 152Military HH: Yes 32% (98) 26% (79) 13% (40) 12% (36) 18% (54) 306Military HH: No 37% (624) 23% (386) 10% (164) 13% (223) 17% (284) 1682RD/WT: Right Direction 28% (157) 30% (169) 13% (75) 12% (69) 17% (97) 567RD/WT: Wrong Track 40% (565) 21% (296) 9% (129) 13% (190) 17% (241) 1421Trump Job Approve 24% (188) 30% (231) 14% (111) 13% (103) 18% (140) 774Trump Job Disapprove 45% (523) 20% (228) 8% (90) 13% (150) 14% (163) 1153Trump Job Strongly Approve 22% (92) 28% (115) 15% (61) 17% (72) 18% (74) 415Trump Job Somewhat Approve 27% (96) 32% (116) 14% (51) 8% (30) 18% (66) 359Trump Job Somewhat Disapprove 34% (77) 31% (69) 11% (24) 8% (18) 17% (37) 226Trump Job Strongly Disapprove 48% (446) 17% (158) 7% (66) 14% (131) 14% (126) 927
Continued on next page
Page 336
336
Morning ConsultTable POL20_7
Table POL20_7: Do you support or oppose each of the following proposed police reforms?A federal requirement to increase regulations for officers to use a no-knock warrant where an officer enters an individual’s home without prior warning
DemographicStronglysupport
Somewhatsupport
Somewhatoppose
Stronglyoppose
Don’t Know /No Opinion Total N
Registered Voters 36% (722) 23% (465) 10% (204) 13% (259) 17% (338) 1988Favorable of Trump 24% (189) 30% (235) 15% (115) 13% (104) 18% (144) 787Unfavorable of Trump 46% (516) 20% (227) 7% (85) 13% (151) 14% (154) 1132Very Favorable of Trump 24% (109) 27% (123) 15% (70) 16% (75) 18% (85) 462Somewhat Favorable of Trump 25% (80) 34% (112) 14% (45) 9% (29) 18% (60) 325Somewhat Unfavorable of Trump 34% (62) 31% (57) 11% (21) 8% (14) 16% (28) 182Very Unfavorable of Trump 48% (454) 18% (169) 7% (64) 14% (137) 13% (125) 950#1 Issue: Economy 36% (245) 24% (165) 12% (82) 13% (93) 15% (103) 688#1 Issue: Security 25% (64) 30% (76) 13% (33) 13% (33) 19% (49) 254#1 Issue: Health Care 42% (142) 21% (71) 9% (31) 13% (45) 14% (46) 335#1 Issue: Medicare / Social Security 33% (92) 26% (73) 7% (19) 16% (47) 19% (52) 283#1 Issue: Women’s Issues 32% (28) 18% (15) 12% (11) 11% (9) 27% (23) 86#1 Issue: Education 42% (45) 22% (24) 10% (10) 7% (8) 19% (20) 107#1 Issue: Energy 46% (36) 15% (12) 13% (10) 11% (8) 16% (13) 79#1 Issue: Other 45% (70) 18% (29) 5% (9) 11% (17) 21% (33) 1572018 House Vote: Democrat 48% (371) 19% (148) 7% (57) 12% (94) 13% (97) 7672018 House Vote: Republican 28% (173) 31% (196) 13% (84) 13% (80) 15% (97) 6292018 House Vote: Someone else 33% (24) 22% (16) 15% (11) 10% (7) 21% (15) 732016 Vote: Hillary Clinton 49% (341) 19% (132) 8% (54) 13% (93) 12% (81) 7002016 Vote: Donald Trump 26% (175) 30% (203) 15% (101) 12% (83) 17% (113) 6752016 Vote: Other 42% (61) 26% (38) 8% (11) 7% (11) 16% (24) 1442016 Vote: Didn’t Vote 31% (145) 20% (92) 8% (38) 16% (73) 25% (118) 466Voted in 2014: Yes 38% (504) 25% (326) 11% (144) 12% (163) 14% (185) 1322Voted in 2014: No 33% (218) 21% (139) 9% (60) 14% (96) 23% (153) 6662012 Vote: Barack Obama 45% (385) 22% (189) 8% (71) 13% (112) 11% (96) 8532012 Vote: Mitt Romney 25% (124) 32% (160) 15% (74) 12% (58) 17% (85) 5012012 Vote: Other 34% (29) 20% (17) 12% (10) 9% (8) 25% (21) 842012 Vote: Didn’t Vote 33% (183) 18% (100) 9% (49) 15% (81) 25% (137) 550
Continued on next page
Page 337
National Tracking Poll #2006102, June, 2020
337
Table POL20_7
Table POL20_7: Do you support or oppose each of the following proposed police reforms?A federal requirement to increase regulations for officers to use a no-knock warrant where an officer enters an individual’s home without prior warning
DemographicStronglysupport
Somewhatsupport
Somewhatoppose
Stronglyoppose
Don’t Know /No Opinion Total N
Registered Voters 36% (722) 23% (465) 10% (204) 13% (259) 17% (338) 19884-Region: Northeast 37% (132) 23% (80) 9% (32) 15% (54) 16% (57) 3554-Region: Midwest 33% (151) 23% (107) 10% (47) 14% (63) 19% (89) 4574-Region: South 35% (261) 24% (176) 12% (88) 13% (98) 16% (118) 7424-Region: West 41% (178) 23% (102) 8% (37) 10% (43) 17% (75) 434Party: Democrat/Leans Democrat 48% (433) 19% (172) 7% (64) 13% (122) 13% (120) 911Party: Republican/Leans Republican 26% (191) 30% (223) 15% (110) 12% (86) 17% (129) 741Parents 37% (322) 24% (211) 11% (94) 13% (108) 15% (128) 864Note: Row proportions may total to larger than one-hundred percent due to rounding. For more information visit MorningConsultIntelligence.com.
Page 338
338
Morning ConsultTable POL20_8
Table POL20_8: Do you support or oppose each of the following proposed police reforms?Incentivizing police departments to hire mental health experts to assist officers
DemographicStronglysupport
Somewhatsupport
Somewhatoppose
Stronglyoppose
Don’t Know /No Opinion Total N
Registered Voters 48% (958) 28% (565) 7% (130) 3% (63) 14% (272) 1988Gender: Male 43% (396) 30% (277) 9% (85) 4% (35) 15% (137) 930Gender: Female 53% (562) 27% (288) 4% (45) 3% (28) 13% (134) 1058Age: 18-34 52% (262) 19% (94) 8% (38) 2% (8) 20% (98) 499Age: 35-44 52% (157) 27% (80) 6% (18) 2% (6) 13% (40) 302Age: 45-64 49% (356) 31% (226) 5% (38) 3% (25) 11% (79) 724Age: 65+ 40% (184) 36% (165) 8% (36) 5% (23) 12% (55) 463GenZers: 1997-2012 49% (110) 17% (38) 7% (16) 1% (3) 25% (56) 224Millennials: 1981-1996 53% (224) 22% (91) 8% (34) 1% (5) 16% (65) 419GenXers: 1965-1980 54% (276) 26% (135) 5% (26) 4% (20) 11% (55) 511Baby Boomers: 1946-1964 43% (328) 36% (275) 5% (40) 4% (29) 12% (88) 760PID: Dem (no lean) 59% (449) 23% (178) 5% (40) 1% (11) 10% (79) 757PID: Ind (no lean) 48% (303) 29% (182) 5% (32) 3% (17) 16% (103) 638PID: Rep (no lean) 35% (205) 35% (205) 10% (57) 6% (34) 15% (90) 593PID/Gender: DemMen 55% (181) 25% (81) 7% (24) 2% (6) 11% (37) 329PID/Gender: DemWomen 63% (269) 23% (97) 4% (16) 1% (5) 10% (42) 429PID/Gender: Ind Men 41% (123) 31% (92) 7% (21) 3% (10) 17% (51) 296PID/Gender: Ind Women 53% (181) 26% (90) 3% (12) 2% (7) 15% (52) 342PID/Gender: Rep Men 30% (93) 34% (105) 13% (40) 6% (18) 16% (50) 306PID/Gender: Rep Women 39% (113) 35% (101) 6% (17) 6% (16) 14% (40) 287Ideo: Liberal (1-3) 66% (399) 21% (129) 6% (34) 1% (5) 7% (42) 609Ideo: Moderate (4) 49% (255) 30% (156) 5% (25) 2% (12) 14% (74) 522Ideo: Conservative (5-7) 36% (243) 36% (243) 10% (68) 5% (34) 13% (91) 679Educ: < College 45% (557) 29% (358) 7% (88) 3% (41) 16% (206) 1250Educ: Bachelors degree 51% (241) 29% (137) 6% (28) 3% (12) 11% (51) 470Educ: Post-grad 60% (160) 26% (70) 5% (14) 4% (10) 5% (14) 267Income: Under 50k 46% (461) 28% (275) 7% (70) 4% (35) 16% (156) 998Income: 50k-100k 47% (311) 29% (195) 7% (45) 3% (22) 13% (88) 660Income: 100k+ 56% (186) 29% (95) 4% (15) 2% (6) 8% (27) 329Ethnicity: White 47% (752) 30% (489) 6% (102) 4% (60) 13% (204) 1608Ethnicity: Hispanic 55% (106) 21% (41) 5% (10) — (0) 18% (35) 193
Continued on next page
Page 339
National Tracking Poll #2006102, June, 2020
339
Table POL20_8
Table POL20_8: Do you support or oppose each of the following proposed police reforms?Incentivizing police departments to hire mental health experts to assist officers
DemographicStronglysupport
Somewhatsupport
Somewhatoppose
Stronglyoppose
Don’t Know /No Opinion Total N
Registered Voters 48% (958) 28% (565) 7% (130) 3% (63) 14% (272) 1988Ethnicity: Afr. Am. 56% (140) 18% (45) 8% (21) — (0) 18% (46) 252Ethnicity: Other 51% (66) 25% (32) 5% (7) 2% (3) 17% (21) 128All Christian 42% (392) 34% (318) 8% (75) 4% (34) 13% (122) 941All Non-Christian 61% (60) 21% (20) 8% (8) 5% (5) 5% (5) 97Atheist 63% (81) 23% (30) 2% (3) 1% (2) 10% (12) 128Agnostic/Nothing in particular 51% (245) 24% (114) 5% (23) 3% (14) 17% (83) 478Something Else 53% (181) 24% (84) 6% (21) 2% (8) 14% (50) 344Religious Non-Protestant/Catholic 58% (69) 24% (29) 8% (10) 5% (6) 5% (6) 120Evangelical 41% (207) 33% (168) 7% (38) 4% (21) 14% (72) 505Non-Evangelical 47% (352) 30% (222) 7% (56) 3% (20) 13% (96) 746Community: Urban 50% (247) 24% (119) 6% (28) 2% (11) 17% (85) 490Community: Suburban 49% (483) 29% (280) 7% (65) 2% (24) 13% (129) 981Community: Rural 44% (228) 32% (167) 7% (37) 5% (28) 11% (58) 517Employ: Private Sector 53% (332) 30% (190) 6% (40) 2% (10) 9% (58) 631Employ: Government 52% (70) 25% (33) 5% (7) 6% (8) 13% (17) 136Employ: Self-Employed 46% (60) 23% (30) 11% (15) 4% (5) 15% (20) 130Employ: Homemaker 56% (65) 20% (23) 1% (1) 2% (2) 21% (24) 115Employ: Retired 41% (201) 36% (176) 8% (39) 6% (28) 10% (48) 492Employ: Unemployed 49% (113) 22% (51) 2% (5) 3% (7) 23% (52) 229Employ: Other 42% (64) 23% (35) 11% (17) 2% (2) 22% (34) 152Military HH: Yes 46% (140) 30% (93) 9% (27) 4% (14) 11% (33) 306Military HH: No 49% (818) 28% (472) 6% (103) 3% (49) 14% (239) 1682RD/WT: Right Direction 33% (186) 35% (197) 12% (66) 6% (33) 15% (86) 567RD/WT: Wrong Track 54% (772) 26% (368) 5% (64) 2% (30) 13% (186) 1421Trump Job Approve 32% (247) 37% (285) 10% (79) 6% (50) 14% (112) 774Trump Job Disapprove 60% (696) 23% (270) 4% (50) 1% (11) 11% (126) 1153Trump Job Strongly Approve 29% (120) 36% (149) 11% (47) 9% (35) 15% (63) 415Trump Job Somewhat Approve 35% (127) 38% (135) 9% (32) 4% (15) 14% (50) 359Trump Job Somewhat Disapprove 46% (103) 36% (81) 5% (12) 1% (3) 13% (28) 226Trump Job Strongly Disapprove 64% (593) 20% (189) 4% (39) 1% (9) 11% (98) 927
Continued on next page
Page 340
340
Morning ConsultTable POL20_8
Table POL20_8: Do you support or oppose each of the following proposed police reforms?Incentivizing police departments to hire mental health experts to assist officers
DemographicStronglysupport
Somewhatsupport
Somewhatoppose
Stronglyoppose
Don’t Know /No Opinion Total N
Registered Voters 48% (958) 28% (565) 7% (130) 3% (63) 14% (272) 1988Favorable of Trump 32% (252) 36% (282) 10% (77) 7% (52) 16% (124) 787Unfavorable of Trump 61% (687) 24% (270) 4% (50) 1% (11) 10% (114) 1132Very Favorable of Trump 30% (139) 35% (161) 12% (54) 7% (34) 16% (74) 462Somewhat Favorable of Trump 35% (113) 37% (121) 7% (23) 5% (17) 16% (50) 325Somewhat Unfavorable of Trump 46% (83) 36% (65) 5% (9) 1% (2) 13% (23) 182Very Unfavorable of Trump 64% (604) 22% (205) 4% (41) 1% (10) 10% (91) 950#1 Issue: Economy 46% (320) 31% (214) 8% (54) 3% (20) 12% (81) 688#1 Issue: Security 28% (70) 34% (86) 14% (34) 6% (14) 19% (49) 254#1 Issue: Health Care 57% (190) 27% (91) 4% (14) 2% (8) 10% (33) 335#1 Issue: Medicare / Social Security 46% (131) 31% (87) 3% (8) 5% (15) 15% (42) 283#1 Issue: Women’s Issues 56% (48) 22% (19) 1% (1) 1% (1) 21% (18) 86#1 Issue: Education 62% (66) 18% (19) 3% (3) 1% (1) 16% (17) 107#1 Issue: Energy 61% (48) 25% (20) 3% (2) 2% (2) 10% (8) 79#1 Issue: Other 54% (84) 20% (31) 9% (14) 2% (3) 16% (25) 1572018 House Vote: Democrat 62% (476) 25% (189) 5% (39) 1% (5) 7% (57) 7672018 House Vote: Republican 33% (206) 38% (237) 10% (62) 7% (45) 12% (78) 6292018 House Vote: Someone else 35% (25) 41% (30) — (0) 2% (2) 22% (16) 732016 Vote: Hillary Clinton 62% (431) 25% (172) 5% (32) 1% (7) 8% (57) 7002016 Vote: Donald Trump 33% (222) 38% (254) 10% (65) 6% (42) 14% (91) 6752016 Vote: Other 54% (78) 33% (48) 1% (2) 1% (2) 11% (15) 1442016 Vote: Didn’t Vote 48% (225) 19% (91) 7% (31) 3% (12) 23% (109) 466Voted in 2014: Yes 49% (642) 32% (417) 6% (85) 4% (47) 10% (131) 1322Voted in 2014: No 47% (316) 22% (148) 7% (45) 2% (16) 21% (141) 6662012 Vote: Barack Obama 59% (505) 28% (236) 4% (37) 1% (13) 7% (62) 8532012 Vote: Mitt Romney 34% (168) 35% (177) 10% (52) 7% (34) 14% (70) 5012012 Vote: Other 31% (26) 43% (36) 2% (1) 9% (7) 16% (13) 842012 Vote: Didn’t Vote 47% (258) 21% (117) 7% (40) 2% (10) 23% (126) 550
Continued on next page
Page 341
National Tracking Poll #2006102, June, 2020
341
Table POL20_8
Table POL20_8: Do you support or oppose each of the following proposed police reforms?Incentivizing police departments to hire mental health experts to assist officers
DemographicStronglysupport
Somewhatsupport
Somewhatoppose
Stronglyoppose
Don’t Know /No Opinion Total N
Registered Voters 48% (958) 28% (565) 7% (130) 3% (63) 14% (272) 19884-Region: Northeast 48% (170) 28% (101) 7% (24) 2% (8) 14% (51) 3554-Region: Midwest 45% (208) 29% (134) 7% (31) 4% (18) 14% (66) 4574-Region: South 46% (339) 29% (214) 8% (58) 4% (33) 13% (98) 7424-Region: West 55% (241) 27% (115) 4% (17) 1% (4) 13% (57) 434Party: Democrat/Leans Democrat 61% (559) 23% (207) 5% (43) 1% (12) 10% (89) 911Party: Republican/Leans Republican 35% (259) 35% (263) 10% (71) 6% (43) 14% (105) 741Parents 49% (421) 31% (269) 5% (45) 3% (22) 12% (106) 864Note: Row proportions may total to larger than one-hundred percent due to rounding. For more information visit MorningConsultIntelligence.com.
Page 342
342
Morning ConsultTable POL20_9
Table POL20_9: Do you support or oppose each of the following proposed police reforms?Allowing individuals to bring civil lawsuits against police officers and departments
DemographicStronglysupport
Somewhatsupport
Somewhatoppose
Stronglyoppose
Don’t Know /No Opinion Total N
Registered Voters 39% (781) 23% (464) 14% (275) 10% (194) 14% (274) 1988Gender: Male 39% (359) 22% (208) 15% (139) 12% (110) 12% (115) 930Gender: Female 40% (423) 24% (255) 13% (136) 8% (84) 15% (160) 1058Age: 18-34 50% (252) 21% (105) 8% (39) 4% (19) 17% (86) 499Age: 35-44 44% (132) 22% (68) 15% (44) 5% (14) 15% (44) 302Age: 45-64 39% (279) 24% (176) 13% (91) 11% (83) 13% (95) 724Age: 65+ 26% (119) 25% (115) 22% (100) 17% (79) 11% (50) 463GenZers: 1997-2012 51% (115) 19% (43) 7% (15) 3% (7) 20% (44) 224Millennials: 1981-1996 47% (198) 21% (90) 12% (49) 4% (18) 15% (64) 419GenXers: 1965-1980 43% (218) 23% (117) 12% (62) 10% (50) 13% (64) 511Baby Boomers: 1946-1964 31% (237) 26% (198) 17% (128) 14% (105) 12% (93) 760PID: Dem (no lean) 58% (437) 23% (171) 6% (49) 4% (27) 10% (73) 757PID: Ind (no lean) 37% (237) 21% (134) 14% (91) 10% (66) 17% (111) 638PID: Rep (no lean) 18% (108) 27% (159) 23% (135) 17% (101) 15% (90) 593PID/Gender: DemMen 54% (177) 23% (77) 8% (26) 5% (15) 10% (34) 329PID/Gender: DemWomen 61% (260) 22% (94) 5% (24) 3% (12) 9% (39) 429PID/Gender: Ind Men 39% (114) 16% (47) 17% (49) 12% (36) 17% (50) 296PID/Gender: Ind Women 36% (122) 25% (87) 12% (41) 9% (30) 18% (61) 342PID/Gender: Rep Men 22% (68) 28% (85) 21% (64) 19% (58) 10% (31) 306PID/Gender: Rep Women 14% (40) 26% (74) 25% (71) 15% (42) 21% (59) 287Ideo: Liberal (1-3) 61% (373) 24% (143) 6% (34) 3% (19) 7% (40) 609Ideo: Moderate (4) 40% (209) 23% (119) 13% (69) 8% (41) 16% (84) 522Ideo: Conservative (5-7) 20% (139) 24% (166) 24% (160) 19% (127) 13% (87) 679Educ: < College 39% (487) 22% (274) 14% (170) 9% (117) 16% (203) 1250Educ: Bachelors degree 40% (187) 26% (122) 14% (64) 10% (47) 11% (50) 470Educ: Post-grad 40% (107) 25% (68) 16% (41) 11% (30) 8% (21) 267Income: Under 50k 41% (406) 22% (222) 12% (119) 9% (89) 16% (162) 998Income: 50k-100k 36% (238) 26% (169) 15% (99) 11% (74) 12% (81) 660Income: 100k+ 42% (137) 22% (73) 17% (57) 9% (31) 9% (31) 329Ethnicity: White 34% (553) 25% (395) 16% (254) 11% (179) 14% (227) 1608Ethnicity: Hispanic 53% (103) 21% (40) 5% (9) 6% (12) 15% (29) 193
Continued on next page
Page 343
National Tracking Poll #2006102, June, 2020
343
Table POL20_9
Table POL20_9: Do you support or oppose each of the following proposed police reforms?Allowing individuals to bring civil lawsuits against police officers and departments
DemographicStronglysupport
Somewhatsupport
Somewhatoppose
Stronglyoppose
Don’t Know /No Opinion Total N
Registered Voters 39% (781) 23% (464) 14% (275) 10% (194) 14% (274) 1988Ethnicity: Afr. Am. 67% (169) 15% (37) 5% (12) 2% (6) 11% (28) 252Ethnicity: Other 47% (60) 25% (32) 7% (9) 7% (9) 15% (19) 128All Christian 29% (276) 27% (253) 16% (152) 13% (122) 15% (138) 941All Non-Christian 42% (41) 29% (28) 16% (16) 7% (6) 7% (7) 97Atheist 61% (77) 21% (27) 12% (16) 3% (4) 3% (4) 128Agnostic/Nothing in particular 45% (213) 20% (98) 12% (56) 8% (36) 16% (76) 478Something Else 51% (174) 17% (59) 10% (36) 7% (25) 15% (50) 344Religious Non-Protestant/Catholic 37% (44) 33% (39) 15% (18) 6% (8) 9% (10) 120Evangelical 34% (172) 22% (109) 17% (83) 13% (68) 14% (73) 505Non-Evangelical 36% (272) 25% (186) 14% (102) 10% (77) 15% (109) 746Community: Urban 45% (222) 23% (114) 9% (45) 8% (41) 14% (67) 490Community: Suburban 39% (382) 25% (244) 14% (137) 9% (88) 13% (129) 981Community: Rural 34% (177) 20% (105) 18% (93) 12% (64) 15% (78) 517Employ: Private Sector 42% (265) 26% (164) 12% (74) 10% (61) 11% (66) 631Employ: Government 44% (59) 22% (29) 13% (18) 11% (15) 11% (15) 136Employ: Self-Employed 46% (60) 20% (26) 14% (18) 6% (8) 14% (18) 130Employ: Homemaker 37% (43) 21% (24) 11% (13) 7% (8) 24% (27) 115Employ: Retired 26% (130) 25% (122) 20% (97) 18% (86) 12% (57) 492Employ: Unemployed 43% (100) 23% (52) 11% (26) 5% (12) 17% (40) 229Employ: Other 41% (63) 20% (31) 15% (23) 3% (5) 20% (30) 152Military HH: Yes 31% (94) 24% (74) 19% (57) 16% (48) 11% (33) 306Military HH: No 41% (688) 23% (390) 13% (217) 9% (145) 14% (242) 1682RD/WT: Right Direction 25% (140) 22% (123) 21% (120) 16% (93) 16% (91) 567RD/WT: Wrong Track 45% (641) 24% (341) 11% (155) 7% (101) 13% (183) 1421Trump Job Approve 20% (152) 23% (176) 22% (172) 20% (152) 16% (121) 774Trump Job Disapprove 54% (619) 24% (276) 8% (96) 3% (38) 11% (124) 1153Trump Job Strongly Approve 18% (73) 19% (79) 24% (101) 26% (109) 13% (53) 415Trump Job Somewhat Approve 22% (79) 27% (97) 20% (71) 12% (44) 19% (68) 359Trump Job Somewhat Disapprove 34% (77) 33% (75) 12% (28) 4% (9) 16% (37) 226Trump Job Strongly Disapprove 58% (542) 22% (201) 7% (68) 3% (29) 9% (87) 927
Continued on next page
Page 344
344
Morning ConsultTable POL20_9
Table POL20_9: Do you support or oppose each of the following proposed police reforms?Allowing individuals to bring civil lawsuits against police officers and departments
DemographicStronglysupport
Somewhatsupport
Somewhatoppose
Stronglyoppose
Don’t Know /No Opinion Total N
Registered Voters 39% (781) 23% (464) 14% (275) 10% (194) 14% (274) 1988Favorable of Trump 18% (144) 23% (181) 23% (179) 19% (153) 16% (129) 787Unfavorable of Trump 55% (621) 24% (270) 8% (90) 4% (40) 10% (111) 1132Very Favorable of Trump 17% (79) 19% (87) 25% (114) 25% (117) 14% (65) 462Somewhat Favorable of Trump 20% (66) 29% (93) 20% (65) 11% (37) 20% (64) 325Somewhat Unfavorable of Trump 34% (61) 33% (60) 15% (27) 5% (9) 13% (24) 182Very Unfavorable of Trump 59% (560) 22% (210) 7% (63) 3% (31) 9% (86) 950#1 Issue: Economy 36% (249) 26% (176) 16% (109) 10% (70) 12% (83) 688#1 Issue: Security 21% (54) 20% (50) 19% (49) 23% (58) 17% (43) 254#1 Issue: Health Care 50% (167) 22% (73) 11% (39) 6% (20) 11% (37) 335#1 Issue: Medicare / Social Security 35% (98) 24% (68) 13% (38) 10% (29) 18% (50) 283#1 Issue: Women’s Issues 63% (54) 15% (13) 5% (4) 1% (1) 16% (14) 86#1 Issue: Education 47% (50) 19% (20) 9% (10) 5% (5) 20% (21) 107#1 Issue: Energy 50% (39) 33% (26) 9% (7) — (0) 8% (7) 79#1 Issue: Other 45% (70) 25% (39) 12% (18) 6% (10) 13% (20) 1572018 House Vote: Democrat 56% (429) 25% (189) 7% (50) 4% (28) 9% (71) 7672018 House Vote: Republican 19% (120) 22% (137) 25% (159) 21% (133) 13% (80) 6292018 House Vote: Someone else 31% (23) 31% (23) 9% (7) 11% (8) 17% (13) 732016 Vote: Hillary Clinton 56% (395) 25% (177) 6% (44) 3% (21) 9% (63) 7002016 Vote: Donald Trump 18% (121) 24% (165) 23% (153) 21% (141) 14% (95) 6752016 Vote: Other 38% (55) 26% (38) 17% (25) 5% (8) 13% (18) 1442016 Vote: Didn’t Vote 45% (208) 18% (84) 11% (52) 5% (24) 21% (99) 466Voted in 2014: Yes 39% (510) 23% (310) 15% (196) 12% (157) 11% (148) 1322Voted in 2014: No 41% (271) 23% (153) 12% (79) 6% (37) 19% (126) 6662012 Vote: Barack Obama 51% (433) 26% (223) 9% (80) 5% (44) 8% (72) 8532012 Vote: Mitt Romney 18% (89) 21% (106) 24% (121) 22% (112) 15% (73) 5012012 Vote: Other 28% (23) 19% (16) 18% (15) 17% (14) 18% (15) 842012 Vote: Didn’t Vote 43% (235) 22% (118) 11% (59) 4% (24) 21% (114) 550
Continued on next page
Page 345
National Tracking Poll #2006102, June, 2020
345
Table POL20_9
Table POL20_9: Do you support or oppose each of the following proposed police reforms?Allowing individuals to bring civil lawsuits against police officers and departments
DemographicStronglysupport
Somewhatsupport
Somewhatoppose
Stronglyoppose
Don’t Know /No Opinion Total N
Registered Voters 39% (781) 23% (464) 14% (275) 10% (194) 14% (274) 19884-Region: Northeast 43% (154) 25% (87) 11% (41) 9% (30) 12% (42) 3554-Region: Midwest 38% (172) 21% (95) 16% (74) 9% (43) 16% (73) 4574-Region: South 37% (274) 23% (171) 17% (122) 11% (82) 12% (92) 7424-Region: West 42% (181) 26% (111) 9% (38) 9% (38) 15% (66) 434Party: Democrat/Leans Democrat 57% (517) 23% (210) 7% (61) 4% (34) 10% (89) 911Party: Republican/Leans Republican 19% (144) 25% (184) 23% (172) 18% (133) 15% (107) 741Parents 37% (317) 25% (217) 15% (131) 11% (91) 13% (108) 864Note: Row proportions may total to larger than one-hundred percent due to rounding. For more information visit MorningConsultIntelligence.com.
Page 346
346
Morning ConsultTable POL21
Table POL21: A federal law that bans officers from placing individuals in chokeholds or using a no-knock warrant. The proposal also establishes anational database of police disciplinary records for police departments to refer to when hiring officers and allows individuals to bring civil lawsuitsagainst police officers and departments.
Demographic
Goes too far toaddress police
reform
Appropriatelyaddresses police
reform
Doesn’t go farenough to addresspolice reform
Don’t know / Noopinion Total N
Registered Voters 19% (384) 48% (955) 17% (329) 16% (319) 1988Gender: Male 22% (201) 49% (454) 17% (155) 13% (120) 930Gender: Female 17% (183) 47% (502) 16% (174) 19% (199) 1058Age: 18-34 13% (66) 47% (235) 19% (94) 21% (105) 499Age: 35-44 20% (59) 47% (143) 18% (55) 15% (46) 302Age: 45-64 20% (146) 47% (339) 17% (120) 16% (119) 724Age: 65+ 24% (113) 52% (239) 13% (61) 11% (49) 463GenZers: 1997-2012 14% (30) 45% (100) 17% (38) 25% (56) 224Millennials: 1981-1996 16% (65) 46% (193) 21% (87) 18% (75) 419GenXers: 1965-1980 21% (106) 47% (241) 18% (90) 15% (74) 511Baby Boomers: 1946-1964 22% (165) 51% (389) 15% (111) 13% (96) 760PID: Dem (no lean) 9% (70) 54% (405) 24% (185) 13% (98) 757PID: Ind (no lean) 20% (127) 46% (295) 14% (91) 20% (125) 638PID: Rep (no lean) 32% (187) 43% (255) 9% (54) 16% (97) 593PID/Gender: DemMen 12% (39) 53% (173) 24% (78) 12% (39) 329PID/Gender: DemWomen 7% (31) 54% (232) 25% (107) 14% (58) 429PID/Gender: Ind Men 21% (64) 46% (138) 15% (44) 17% (51) 296PID/Gender: Ind Women 19% (64) 46% (158) 14% (47) 21% (73) 342PID/Gender: Rep Men 32% (99) 47% (143) 11% (34) 10% (30) 306PID/Gender: Rep Women 31% (88) 39% (112) 7% (20) 23% (67) 287Ideo: Liberal (1-3) 10% (61) 56% (341) 27% (166) 7% (40) 609Ideo: Moderate (4) 16% (83) 49% (257) 18% (93) 17% (90) 522Ideo: Conservative (5-7) 33% (224) 45% (308) 8% (52) 14% (96) 679Educ: < College 18% (224) 45% (564) 17% (211) 20% (251) 1250Educ: Bachelors degree 20% (95) 53% (250) 16% (75) 11% (50) 470Educ: Post-grad 24% (65) 53% (141) 16% (43) 7% (18) 267Income: Under 50k 16% (161) 46% (461) 17% (169) 21% (208) 998Income: 50k-100k 22% (148) 48% (315) 17% (112) 13% (86) 660Income: 100k+ 23% (76) 54% (179) 15% (49) 8% (25) 329
Continued on next page
Page 347
National Tracking Poll #2006102, June, 2020
347
Table POL21
Table POL21: A federal law that bans officers from placing individuals in chokeholds or using a no-knock warrant. The proposal also establishes anational database of police disciplinary records for police departments to refer to when hiring officers and allows individuals to bring civil lawsuitsagainst police officers and departments.
Demographic
Goes too far toaddress police
reform
Appropriatelyaddresses police
reform
Doesn’t go farenough to addresspolice reform
Don’t know / Noopinion Total N
Registered Voters 19% (384) 48% (955) 17% (329) 16% (319) 1988Ethnicity: White 22% (355) 48% (764) 15% (249) 15% (240) 1608Ethnicity: Hispanic 9% (17) 53% (102) 19% (36) 20% (38) 193Ethnicity: Afr. Am. 6% (16) 49% (125) 22% (55) 22% (57) 252Ethnicity: Other 10% (13) 52% (67) 20% (26) 17% (22) 128All Christian 24% (223) 49% (457) 13% (125) 14% (135) 941All Non-Christian 12% (12) 61% (59) 20% (19) 8% (8) 97Atheist 14% (18) 51% (65) 29% (37) 6% (8) 128Agnostic/Nothing in particular 14% (67) 47% (224) 19% (91) 20% (96) 478Something Else 19% (64) 44% (150) 17% (57) 21% (72) 344Religious Non-Protestant/Catholic 15% (17) 56% (68) 19% (22) 10% (12) 120Evangelical 22% (113) 47% (237) 13% (65) 18% (90) 505Non-Evangelical 22% (167) 48% (355) 15% (112) 15% (111) 746Community: Urban 13% (63) 50% (247) 17% (84) 20% (96) 490Community: Suburban 19% (185) 51% (502) 17% (166) 13% (128) 981Community: Rural 26% (136) 40% (206) 15% (80) 18% (95) 517Employ: Private Sector 18% (112) 53% (334) 19% (121) 10% (64) 631Employ: Government 25% (33) 49% (66) 17% (24) 10% (13) 136Employ: Self-Employed 16% (20) 44% (58) 14% (19) 26% (33) 130Employ: Homemaker 21% (24) 37% (43) 15% (18) 27% (31) 115Employ: Retired 24% (118) 50% (244) 13% (66) 13% (64) 492Employ: Unemployed 14% (32) 45% (102) 18% (41) 24% (55) 229Employ: Other 14% (21) 39% (59) 17% (26) 30% (46) 152Military HH: Yes 29% (87) 46% (140) 15% (45) 11% (34) 306Military HH: No 18% (297) 48% (816) 17% (284) 17% (285) 1682RD/WT: Right Direction 29% (162) 43% (244) 11% (60) 18% (101) 567RD/WT: Wrong Track 16% (222) 50% (711) 19% (269) 15% (218) 1421Trump Job Approve 33% (253) 43% (333) 8% (65) 16% (122) 774Trump Job Disapprove 11% (126) 53% (608) 23% (261) 14% (159) 1153
Continued on next page
Page 348
348
Morning ConsultTable POL21
Table POL21: A federal law that bans officers from placing individuals in chokeholds or using a no-knock warrant. The proposal also establishes anational database of police disciplinary records for police departments to refer to when hiring officers and allows individuals to bring civil lawsuitsagainst police officers and departments.
Demographic
Goes too far toaddress police
reform
Appropriatelyaddresses police
reform
Doesn’t go farenough to addresspolice reform
Don’t know / Noopinion Total N
Registered Voters 19% (384) 48% (955) 17% (329) 16% (319) 1988Trump Job Strongly Approve 39% (160) 37% (154) 8% (33) 16% (68) 415Trump Job Somewhat Approve 26% (93) 50% (179) 9% (32) 15% (54) 359Trump Job Somewhat Disapprove 19% (42) 49% (111) 11% (25) 21% (48) 226Trump Job Strongly Disapprove 9% (84) 54% (497) 25% (235) 12% (111) 927Favorable of Trump 31% (243) 43% (339) 9% (67) 17% (137) 787Unfavorable of Trump 12% (132) 53% (599) 23% (257) 13% (144) 1132Very Favorable of Trump 36% (167) 39% (180) 8% (36) 17% (79) 462Somewhat Favorable of Trump 23% (76) 49% (159) 10% (31) 18% (58) 325Somewhat Unfavorable of Trump 23% (41) 48% (88) 11% (20) 18% (33) 182Very Unfavorable of Trump 10% (91) 54% (511) 25% (238) 12% (111) 950#1 Issue: Economy 23% (157) 47% (323) 16% (110) 14% (99) 688#1 Issue: Security 31% (79) 37% (94) 6% (16) 25% (64) 254#1 Issue: Health Care 14% (46) 55% (184) 16% (55) 15% (50) 335#1 Issue: Medicare / Social Security 15% (43) 53% (150) 17% (48) 15% (42) 283#1 Issue: Women’s Issues 15% (13) 46% (40) 27% (23) 12% (11) 86#1 Issue: Education 15% (16) 53% (56) 17% (18) 15% (16) 107#1 Issue: Energy 17% (14) 44% (35) 30% (24) 8% (7) 79#1 Issue: Other 11% (17) 47% (73) 22% (35) 20% (32) 1572018 House Vote: Democrat 9% (66) 56% (427) 25% (195) 10% (79) 7672018 House Vote: Republican 35% (222) 43% (271) 8% (49) 14% (88) 6292018 House Vote: Someone else 17% (13) 39% (29) 20% (15) 24% (17) 732016 Vote: Hillary Clinton 10% (70) 54% (376) 25% (177) 11% (76) 7002016 Vote: Donald Trump 34% (227) 45% (301) 7% (50) 14% (97) 6752016 Vote: Other 18% (26) 46% (66) 23% (33) 14% (20) 1442016 Vote: Didn’t Vote 13% (61) 45% (212) 14% (68) 27% (126) 466Voted in 2014: Yes 21% (273) 49% (649) 17% (231) 13% (169) 1322Voted in 2014: No 17% (111) 46% (307) 15% (99) 23% (150) 666
Continued on next page
Page 349
National Tracking Poll #2006102, June, 2020
349
Table POL21
Table POL21: A federal law that bans officers from placing individuals in chokeholds or using a no-knock warrant. The proposal also establishes anational database of police disciplinary records for police departments to refer to when hiring officers and allows individuals to bring civil lawsuitsagainst police officers and departments.
Demographic
Goes too far toaddress police
reform
Appropriatelyaddresses police
reform
Doesn’t go farenough to addresspolice reform
Don’t know / Noopinion Total N
Registered Voters 19% (384) 48% (955) 17% (329) 16% (319) 19882012 Vote: Barack Obama 12% (100) 55% (469) 23% (193) 11% (91) 8532012 Vote: Mitt Romney 36% (180) 42% (213) 8% (38) 14% (70) 5012012 Vote: Other 28% (24) 37% (31) 13% (11) 21% (18) 842012 Vote: Didn’t Vote 15% (80) 44% (243) 16% (87) 25% (139) 5504-Region: Northeast 19% (68) 50% (179) 14% (49) 17% (59) 3554-Region: Midwest 21% (97) 47% (215) 14% (64) 18% (80) 4574-Region: South 20% (150) 45% (336) 18% (130) 17% (126) 7424-Region: West 16% (69) 52% (225) 20% (86) 12% (54) 434Party: Democrat/Leans Democrat 10% (88) 55% (497) 23% (213) 12% (112) 911Party: Republican/Leans Republican 33% (243) 42% (313) 9% (68) 16% (117) 741Parents 21% (181) 48% (418) 16% (141) 14% (124) 864Note: Row proportions may total to larger than one-hundred percent due to rounding. For more information visit MorningConsultIntelligence.com.
Page 350
350
Morning ConsultTable POL22
Table POL22: A federal law that discourages, but does not ban officers from placing individuals in chokeholds or using a no-knock warrant. Theproposal also establishes a national database of police disciplinary records for police departments to refer to when hiring officers and incentivizes policedepartments to hire mental health experts to assist officers.
Demographic
Goes too far toaddress police
reform
Appropriatelyaddresses police
reform
Doesn’t go farenough to addresspolice reform
Don’t know / Noopinion Total N
Registered Voters 8% (155) 33% (663) 43% (860) 16% (310) 1988Gender: Male 9% (88) 36% (337) 40% (373) 14% (133) 930Gender: Female 6% (67) 31% (326) 46% (486) 17% (178) 1058Age: 18-34 7% (36) 26% (131) 45% (224) 22% (108) 499Age: 35-44 7% (23) 31% (95) 46% (140) 15% (44) 302Age: 45-64 8% (55) 36% (261) 42% (302) 15% (106) 724Age: 65+ 9% (41) 38% (176) 42% (194) 11% (52) 463GenZers: 1997-2012 7% (15) 23% (51) 45% (101) 25% (57) 224Millennials: 1981-1996 7% (30) 29% (123) 45% (190) 18% (75) 419GenXers: 1965-1980 7% (38) 36% (182) 43% (218) 15% (75) 511Baby Boomers: 1946-1964 9% (65) 36% (275) 44% (332) 12% (89) 760PID: Dem (no lean) 5% (41) 23% (172) 60% (455) 12% (90) 757PID: Ind (no lean) 8% (54) 30% (191) 42% (269) 19% (123) 638PID: Rep (no lean) 10% (60) 51% (300) 23% (136) 16% (97) 593PID/Gender: DemMen 6% (21) 25% (84) 56% (184) 12% (40) 329PID/Gender: DemWomen 5% (20) 20% (88) 63% (271) 12% (51) 429PID/Gender: Ind Men 9% (27) 30% (90) 41% (121) 20% (58) 296PID/Gender: Ind Women 8% (27) 30% (101) 43% (148) 19% (65) 342PID/Gender: Rep Men 13% (40) 53% (163) 22% (68) 11% (35) 306PID/Gender: Rep Women 7% (20) 48% (137) 24% (67) 22% (62) 287Ideo: Liberal (1-3) 6% (38) 20% (122) 68% (416) 5% (33) 609Ideo: Moderate (4) 5% (27) 32% (168) 44% (228) 19% (99) 522Ideo: Conservative (5-7) 10% (69) 51% (346) 25% (169) 14% (95) 679Educ: < College 8% (97) 33% (415) 40% (498) 19% (240) 1250Educ: Bachelors degree 7% (32) 35% (163) 48% (225) 11% (50) 470Educ: Post-grad 10% (26) 32% (85) 51% (136) 8% (20) 267Income: Under 50k 8% (75) 31% (309) 42% (421) 19% (193) 998Income: 50k-100k 9% (57) 36% (238) 42% (278) 13% (88) 660Income: 100k+ 7% (22) 36% (117) 49% (160) 9% (29) 329
Continued on next page
Page 351
National Tracking Poll #2006102, June, 2020
351
Table POL22
Table POL22: A federal law that discourages, but does not ban officers from placing individuals in chokeholds or using a no-knock warrant. Theproposal also establishes a national database of police disciplinary records for police departments to refer to when hiring officers and incentivizes policedepartments to hire mental health experts to assist officers.
Demographic
Goes too far toaddress police
reform
Appropriatelyaddresses police
reform
Doesn’t go farenough to addresspolice reform
Don’t know / Noopinion Total N
Registered Voters 8% (155) 33% (663) 43% (860) 16% (310) 1988Ethnicity: White 8% (135) 36% (585) 41% (660) 14% (227) 1608Ethnicity: Hispanic 9% (18) 24% (46) 49% (94) 18% (35) 193Ethnicity: Afr. Am. 4% (9) 19% (47) 54% (137) 23% (59) 252Ethnicity: Other 8% (10) 24% (31) 49% (63) 19% (25) 128All Christian 9% (89) 38% (362) 38% (361) 14% (129) 941All Non-Christian 9% (8) 35% (34) 49% (48) 7% (7) 97Atheist 5% (6) 25% (32) 62% (79) 8% (10) 128Agnostic/Nothing in particular 5% (24) 28% (136) 48% (227) 19% (91) 478Something Else 8% (27) 29% (100) 42% (144) 21% (73) 344Religious Non-Protestant/Catholic 11% (13) 34% (40) 49% (58) 7% (9) 120Evangelical 10% (52) 38% (192) 34% (171) 18% (90) 505Non-Evangelical 8% (59) 35% (261) 43% (317) 14% (108) 746Community: Urban 7% (35) 26% (128) 46% (225) 21% (102) 490Community: Suburban 8% (82) 34% (329) 45% (440) 13% (129) 981Community: Rural 7% (37) 40% (206) 38% (195) 15% (79) 517Employ: Private Sector 7% (42) 36% (226) 47% (296) 11% (67) 631Employ: Government 10% (14) 32% (43) 45% (61) 13% (18) 136Employ: Self-Employed 7% (9) 27% (35) 40% (53) 26% (33) 130Employ: Homemaker 6% (7) 32% (37) 37% (42) 25% (29) 115Employ: Retired 9% (45) 39% (193) 40% (195) 12% (59) 492Employ: Unemployed 8% (19) 24% (55) 44% (102) 23% (53) 229Employ: Other 9% (14) 27% (41) 40% (60) 24% (37) 152Military HH: Yes 12% (37) 41% (126) 36% (109) 11% (34) 306Military HH: No 7% (118) 32% (538) 45% (750) 16% (276) 1682RD/WT: Right Direction 12% (69) 49% (275) 21% (121) 18% (102) 567RD/WT: Wrong Track 6% (85) 27% (388) 52% (739) 15% (208) 1421Trump Job Approve 12% (91) 51% (392) 21% (164) 16% (127) 774Trump Job Disapprove 5% (62) 23% (265) 59% (681) 13% (145) 1153
Continued on next page
Page 352
352
Morning ConsultTable POL22
Table POL22: A federal law that discourages, but does not ban officers from placing individuals in chokeholds or using a no-knock warrant. Theproposal also establishes a national database of police disciplinary records for police departments to refer to when hiring officers and incentivizes policedepartments to hire mental health experts to assist officers.
Demographic
Goes too far toaddress police
reform
Appropriatelyaddresses police
reform
Doesn’t go farenough to addresspolice reform
Don’t know / Noopinion Total N
Registered Voters 8% (155) 33% (663) 43% (860) 16% (310) 1988Trump Job Strongly Approve 14% (57) 54% (223) 15% (63) 17% (72) 415Trump Job Somewhat Approve 9% (34) 47% (169) 28% (101) 15% (55) 359Trump Job Somewhat Disapprove 6% (14) 39% (87) 40% (90) 16% (36) 226Trump Job Strongly Disapprove 5% (48) 19% (177) 64% (591) 12% (110) 927Favorable of Trump 12% (98) 49% (387) 21% (164) 18% (139) 787Unfavorable of Trump 5% (54) 23% (264) 60% (679) 12% (135) 1132Very Favorable of Trump 15% (70) 52% (240) 16% (75) 17% (78) 462Somewhat Favorable of Trump 9% (28) 45% (147) 28% (89) 19% (61) 325Somewhat Unfavorable of Trump 4% (7) 37% (68) 43% (79) 16% (28) 182Very Unfavorable of Trump 5% (47) 21% (196) 63% (600) 11% (106) 950#1 Issue: Economy 8% (53) 39% (269) 39% (266) 14% (100) 688#1 Issue: Security 11% (28) 48% (121) 19% (49) 22% (55) 254#1 Issue: Health Care 9% (29) 24% (81) 54% (182) 13% (43) 335#1 Issue: Medicare / Social Security 8% (22) 31% (88) 46% (129) 15% (44) 283#1 Issue: Women’s Issues 7% (6) 17% (14) 63% (54) 14% (12) 86#1 Issue: Education 5% (6) 30% (32) 49% (53) 16% (17) 107#1 Issue: Energy 7% (5) 32% (25) 52% (41) 9% (7) 79#1 Issue: Other 4% (6) 21% (33) 54% (84) 21% (33) 1572018 House Vote: Democrat 5% (36) 23% (179) 63% (480) 9% (72) 7672018 House Vote: Republican 12% (74) 51% (322) 23% (144) 14% (90) 6292018 House Vote: Someone else 12% (9) 24% (17) 42% (31) 22% (16) 732016 Vote: Hillary Clinton 5% (32) 23% (163) 63% (440) 9% (65) 7002016 Vote: Donald Trump 12% (83) 49% (332) 24% (163) 14% (97) 6752016 Vote: Other 7% (10) 30% (43) 48% (70) 15% (22) 1442016 Vote: Didn’t Vote 6% (29) 27% (125) 40% (186) 27% (126) 466Voted in 2014: Yes 8% (102) 36% (470) 45% (594) 12% (156) 1322Voted in 2014: No 8% (53) 29% (193) 40% (265) 23% (154) 666
Continued on next page
Page 353
National Tracking Poll #2006102, June, 2020
353
Table POL22
Table POL22: A federal law that discourages, but does not ban officers from placing individuals in chokeholds or using a no-knock warrant. Theproposal also establishes a national database of police disciplinary records for police departments to refer to when hiring officers and incentivizes policedepartments to hire mental health experts to assist officers.
Demographic
Goes too far toaddress police
reform
Appropriatelyaddresses police
reform
Doesn’t go farenough to addresspolice reform
Don’t know / Noopinion Total N
Registered Voters 8% (155) 33% (663) 43% (860) 16% (310) 19882012 Vote: Barack Obama 5% (43) 29% (248) 58% (493) 8% (69) 8532012 Vote: Mitt Romney 12% (61) 48% (242) 25% (124) 15% (73) 5012012 Vote: Other 11% (9) 29% (24) 32% (27) 27% (23) 842012 Vote: Didn’t Vote 8% (41) 27% (149) 39% (214) 26% (145) 5504-Region: Northeast 6% (22) 34% (121) 43% (151) 17% (60) 3554-Region: Midwest 7% (31) 36% (167) 40% (184) 16% (75) 4574-Region: South 9% (66) 32% (239) 43% (316) 16% (121) 7424-Region: West 8% (35) 32% (137) 48% (208) 13% (54) 434Party: Democrat/Leans Democrat 5% (46) 23% (211) 61% (556) 11% (99) 911Party: Republican/Leans Republican 10% (78) 51% (375) 24% (174) 15% (114) 741Parents 7% (63) 38% (332) 40% (349) 14% (121) 864Note: Row proportions may total to larger than one-hundred percent due to rounding. For more information visit MorningConsultIntelligence.com.
Page 354
354
Morning ConsultTable POL23
Table POL23: An executive order that bans officers from using chokeholds on individuals unless an officer’s life is at risk. The proposal also establishesa national database of police disciplinary records for police departments to refer to when hiring officers and incentivizes police departments to hiremental health experts to assist officers.
Demographic
Goes too far toaddress police
reform
Appropriatelyaddresses police
reform
Doesn’t go farenough to addresspolice reform
Don’t know / Noopinion Total N
Registered Voters 9% (172) 52% (1039) 25% (498) 14% (279) 1988Gender: Male 11% (103) 52% (486) 25% (228) 12% (114) 930Gender: Female 7% (69) 52% (553) 26% (270) 16% (165) 1058Age: 18-34 8% (40) 45% (225) 26% (130) 21% (104) 499Age: 35-44 10% (29) 49% (148) 27% (83) 14% (42) 302Age: 45-64 8% (58) 54% (393) 25% (182) 12% (90) 724Age: 65+ 10% (44) 59% (273) 22% (103) 9% (42) 463GenZers: 1997-2012 8% (19) 43% (97) 22% (48) 27% (60) 224Millennials: 1981-1996 8% (33) 45% (191) 30% (127) 16% (69) 419GenXers: 1965-1980 10% (52) 52% (267) 25% (128) 13% (65) 511Baby Boomers: 1946-1964 8% (59) 58% (440) 25% (190) 9% (72) 760PID: Dem (no lean) 5% (36) 46% (346) 38% (284) 12% (91) 757PID: Ind (no lean) 8% (54) 50% (321) 24% (151) 18% (112) 638PID: Rep (no lean) 14% (81) 63% (372) 11% (63) 13% (76) 593PID/Gender: DemMen 5% (18) 47% (154) 37% (121) 11% (36) 329PID/Gender: DemWomen 4% (19) 45% (192) 38% (163) 13% (55) 429PID/Gender: Ind Men 10% (29) 51% (150) 23% (69) 16% (48) 296PID/Gender: Ind Women 7% (25) 50% (171) 24% (82) 19% (64) 342PID/Gender: Rep Men 18% (56) 59% (182) 12% (38) 10% (30) 306PID/Gender: Rep Women 9% (25) 66% (190) 9% (25) 16% (46) 287Ideo: Liberal (1-3) 6% (36) 44% (268) 44% (267) 6% (38) 609Ideo: Moderate (4) 7% (37) 53% (279) 24% (126) 15% (80) 522Ideo: Conservative (5-7) 13% (91) 62% (423) 12% (83) 12% (82) 679Educ: < College 8% (101) 52% (648) 22% (279) 18% (221) 1250Educ: Bachelors degree 9% (43) 54% (253) 28% (130) 9% (44) 470Educ: Post-grad 10% (27) 51% (137) 33% (89) 5% (14) 267Income: Under 50k 7% (74) 50% (496) 24% (244) 18% (184) 998Income: 50k-100k 9% (59) 55% (360) 25% (168) 11% (73) 660Income: 100k+ 12% (38) 55% (183) 26% (87) 6% (21) 329
Continued on next page
Page 355
National Tracking Poll #2006102, June, 2020
355
Table POL23
Table POL23: An executive order that bans officers from using chokeholds on individuals unless an officer’s life is at risk. The proposal also establishesa national database of police disciplinary records for police departments to refer to when hiring officers and incentivizes police departments to hiremental health experts to assist officers.
Demographic
Goes too far toaddress police
reform
Appropriatelyaddresses police
reform
Doesn’t go farenough to addresspolice reform
Don’t know / Noopinion Total N
Registered Voters 9% (172) 52% (1039) 25% (498) 14% (279) 1988Ethnicity: White 9% (148) 55% (888) 23% (373) 12% (198) 1608Ethnicity: Hispanic 9% (17) 39% (75) 30% (58) 22% (43) 193Ethnicity: Afr. Am. 6% (14) 37% (94) 36% (90) 21% (53) 252Ethnicity: Other 7% (9) 44% (56) 27% (35) 22% (28) 128All Christian 10% (95) 58% (544) 20% (192) 12% (109) 941All Non-Christian 8% (8) 51% (50) 33% (32) 8% (8) 97Atheist 8% (10) 46% (59) 42% (53) 5% (6) 128Agnostic/Nothing in particular 7% (35) 45% (217) 28% (136) 19% (90) 478Something Else 7% (24) 49% (169) 25% (85) 19% (66) 344Religious Non-Protestant/Catholic 9% (11) 50% (60) 32% (39) 9% (11) 120Evangelical 10% (52) 56% (285) 18% (91) 15% (77) 505Non-Evangelical 9% (64) 55% (414) 23% (175) 13% (94) 746Community: Urban 9% (42) 45% (221) 27% (134) 19% (93) 490Community: Suburban 8% (83) 54% (532) 25% (250) 12% (116) 981Community: Rural 9% (47) 55% (286) 22% (114) 14% (70) 517Employ: Private Sector 9% (55) 57% (360) 25% (156) 9% (59) 631Employ: Government 9% (12) 54% (73) 27% (36) 11% (15) 136Employ: Self-Employed 9% (12) 41% (54) 27% (35) 22% (29) 130Employ: Homemaker 10% (12) 45% (51) 23% (27) 22% (25) 115Employ: Retired 9% (43) 61% (299) 21% (102) 10% (47) 492Employ: Unemployed 10% (23) 35% (81) 34% (77) 21% (49) 229Employ: Other 4% (7) 45% (69) 26% (40) 24% (37) 152Military HH: Yes 12% (37) 61% (188) 18% (54) 9% (27) 306Military HH: No 8% (135) 51% (851) 26% (444) 15% (252) 1682RD/WT: Right Direction 15% (84) 57% (326) 12% (70) 15% (87) 567RD/WT: Wrong Track 6% (88) 50% (713) 30% (428) 13% (192) 1421Trump Job Approve 15% (114) 62% (477) 10% (76) 14% (107) 774Trump Job Disapprove 5% (54) 47% (542) 36% (418) 12% (139) 1153
Continued on next page
Page 356
356
Morning ConsultTable POL23
Table POL23: An executive order that bans officers from using chokeholds on individuals unless an officer’s life is at risk. The proposal also establishesa national database of police disciplinary records for police departments to refer to when hiring officers and incentivizes police departments to hiremental health experts to assist officers.
Demographic
Goes too far toaddress police
reform
Appropriatelyaddresses police
reform
Doesn’t go farenough to addresspolice reform
Don’t know / Noopinion Total N
Registered Voters 9% (172) 52% (1039) 25% (498) 14% (279) 1988Trump Job Strongly Approve 18% (76) 61% (251) 8% (32) 13% (55) 415Trump Job Somewhat Approve 11% (38) 63% (226) 12% (44) 14% (51) 359Trump Job Somewhat Disapprove 9% (20) 60% (136) 17% (38) 14% (33) 226Trump Job Strongly Disapprove 4% (34) 44% (406) 41% (380) 11% (106) 927Favorable of Trump 15% (117) 60% (476) 10% (79) 15% (115) 787Unfavorable of Trump 5% (53) 48% (540) 36% (413) 11% (127) 1132Very Favorable of Trump 17% (81) 61% (280) 8% (38) 14% (63) 462Somewhat Favorable of Trump 11% (37) 60% (195) 13% (41) 16% (52) 325Somewhat Unfavorable of Trump 7% (13) 58% (106) 21% (38) 14% (25) 182Very Unfavorable of Trump 4% (40) 46% (433) 40% (375) 11% (101) 950#1 Issue: Economy 9% (61) 55% (379) 22% (153) 14% (95) 688#1 Issue: Security 14% (37) 57% (144) 10% (25) 19% (49) 254#1 Issue: Health Care 8% (27) 51% (170) 31% (102) 11% (36) 335#1 Issue: Medicare / Social Security 6% (17) 56% (158) 25% (70) 13% (38) 283#1 Issue: Women’s Issues 8% (7) 42% (36) 38% (32) 13% (11) 86#1 Issue: Education 11% (11) 44% (47) 30% (32) 15% (16) 107#1 Issue: Energy 4% (3) 58% (46) 30% (23) 8% (6) 79#1 Issue: Other 5% (8) 38% (59) 39% (61) 18% (28) 1572018 House Vote: Democrat 5% (40) 46% (352) 41% (311) 8% (64) 7672018 House Vote: Republican 14% (90) 64% (401) 10% (66) 11% (72) 6292018 House Vote: Someone else 7% (5) 46% (34) 24% (18) 23% (17) 732016 Vote: Hillary Clinton 5% (37) 45% (312) 41% (289) 9% (62) 7002016 Vote: Donald Trump 14% (96) 62% (421) 12% (82) 11% (77) 6752016 Vote: Other 5% (7) 57% (82) 26% (37) 13% (19) 1442016 Vote: Didn’t Vote 7% (31) 48% (224) 19% (91) 26% (121) 466Voted in 2014: Yes 9% (120) 54% (712) 27% (354) 10% (135) 1322Voted in 2014: No 8% (52) 49% (326) 22% (144) 22% (144) 666
Continued on next page
Page 357
National Tracking Poll #2006102, June, 2020
357
Table POL23
Table POL23: An executive order that bans officers from using chokeholds on individuals unless an officer’s life is at risk. The proposal also establishesa national database of police disciplinary records for police departments to refer to when hiring officers and incentivizes police departments to hiremental health experts to assist officers.
Demographic
Goes too far toaddress police
reform
Appropriatelyaddresses police
reform
Doesn’t go farenough to addresspolice reform
Don’t know / Noopinion Total N
Registered Voters 9% (172) 52% (1039) 25% (498) 14% (279) 19882012 Vote: Barack Obama 5% (45) 51% (431) 37% (312) 8% (64) 8532012 Vote: Mitt Romney 15% (77) 63% (316) 11% (55) 11% (53) 5012012 Vote: Other 11% (9) 47% (39) 17% (14) 25% (21) 842012 Vote: Didn’t Vote 7% (41) 46% (252) 21% (115) 26% (142) 5504-Region: Northeast 9% (32) 52% (183) 27% (97) 12% (43) 3554-Region: Midwest 7% (32) 54% (247) 25% (115) 14% (64) 4574-Region: South 11% (79) 51% (381) 23% (169) 15% (113) 7424-Region: West 7% (29) 53% (228) 27% (118) 14% (60) 434Party: Democrat/Leans Democrat 5% (45) 46% (423) 38% (343) 11% (99) 911Party: Republican/Leans Republican 13% (99) 63% (465) 11% (83) 13% (94) 741Parents 9% (77) 56% (484) 24% (205) 11% (98) 864Note: Row proportions may total to larger than one-hundred percent due to rounding. For more information visit MorningConsultIntelligence.com.
Page 358
358
Morning ConsultTable POLdem1_1NET
Table POLdem1_1NET: And how old are the children that are now living in your household? Please check all that apply.Younger than 5 years old
Demographic Selected Not Selected Total N
Registered Voters 17% (147) 83% (717) 864Gender: Male 15% (55) 85% (319) 374Gender: Female 19% (92) 81% (397) 490Age: 18-34 58% (78) 42% (55) 133Age: 35-44 28% (49) 72% (128) 177Age: 45-64 5% (18) 95% (328) 345Age: 65+ 1% (2) 99% (207) 209Millennials: 1981-1996 48% (84) 52% (91) 175GenXers: 1965-1980 11% (33) 89% (260) 292Baby Boomers: 1946-1964 3% (10) 97% (323) 333PID: Dem (no lean) 19% (58) 81% (246) 304PID: Ind (no lean) 18% (46) 82% (212) 257PID: Rep (no lean) 14% (43) 86% (260) 302PID/Gender: DemMen 19% (23) 81% (98) 121PID/Gender: DemWomen 20% (36) 80% (147) 183PID/Gender: Ind Men 11% (12) 89% (91) 103PID/Gender: Ind Women 22% (34) 78% (120) 154PID/Gender: Rep Men 14% (21) 86% (130) 150PID/Gender: Rep Women 15% (22) 85% (130) 152Ideo: Liberal (1-3) 16% (35) 84% (182) 218Ideo: Moderate (4) 15% (35) 85% (196) 231Ideo: Conservative (5-7) 14% (49) 86% (289) 338Educ: < College 18% (91) 82% (416) 507Educ: Bachelors degree 17% (36) 83% (175) 211Educ: Post-grad 14% (20) 86% (126) 146Income: Under 50k 18% (65) 82% (295) 361Income: 50k-100k 16% (50) 84% (259) 309Income: 100k+ 16% (32) 84% (162) 194Ethnicity: White 14% (104) 86% (612) 716Ethnicity: Hispanic 38% (29) 62% (47) 77Ethnicity: Afr. Am. 31% (33) 69% (72) 105
Continued on next page
Page 359
National Tracking Poll #2006102, June, 2020
359
Table POLdem1_1NET
Table POLdem1_1NET: And how old are the children that are now living in your household? Please check all that apply.Younger than 5 years old
Demographic Selected Not Selected Total N
Registered Voters 17% (147) 83% (717) 864All Christian 14% (63) 86% (391) 454Agnostic/Nothing in particular 19% (33) 81% (141) 174Something Else 24% (38) 76% (118) 156Evangelical 19% (48) 81% (209) 257Non-Evangelical 15% (51) 85% (288) 339Community: Urban 22% (38) 78% (133) 172Community: Suburban 14% (64) 86% (386) 450Community: Rural 18% (44) 82% (198) 242Employ: Private Sector 19% (54) 81% (231) 285Employ: Government 18% (12) 82% (53) 65Employ: Self-Employed 15% (8) 85% (48) 57Employ: Homemaker 33% (29) 67% (60) 89Employ: Retired 2% (5) 98% (208) 213Employ: Unemployed 22% (18) 78% (64) 83Employ: Other 19% (12) 81% (49) 61Military HH: Yes 8% (12) 92% (142) 155Military HH: No 19% (134) 81% (575) 709RD/WT: Right Direction 15% (43) 85% (240) 283RD/WT: Wrong Track 18% (103) 82% (477) 581Trump Job Approve 14% (55) 86% (333) 387Trump Job Disapprove 19% (85) 81% (372) 457Trump Job Strongly Approve 9% (19) 91% (190) 209Trump Job Somewhat Approve 20% (36) 80% (143) 179Trump Job Somewhat Disapprove 22% (21) 78% (76) 97Trump Job Strongly Disapprove 18% (64) 82% (296) 360Favorable of Trump 14% (54) 86% (346) 400Unfavorable of Trump 19% (83) 81% (356) 438Very Favorable of Trump 11% (26) 89% (203) 229Somewhat Favorable of Trump 17% (28) 83% (143) 171Somewhat Unfavorable of Trump 23% (17) 77% (56) 72Very Unfavorable of Trump 18% (66) 82% (300) 366
Continued on next page
Page 360
360
Morning ConsultTable POLdem1_1NET
Table POLdem1_1NET: And how old are the children that are now living in your household? Please check all that apply.Younger than 5 years old
Demographic Selected Not Selected Total N
Registered Voters 17% (147) 83% (717) 864#1 Issue: Economy 21% (66) 79% (242) 308#1 Issue: Security 13% (15) 87% (101) 116#1 Issue: Health Care 14% (21) 86% (126) 147#1 Issue: Medicare / Social Security 6% (6) 94% (109) 115#1 Issue: Education 17% (10) 83% (47) 57#1 Issue: Other 15% (9) 85% (50) 592018 House Vote: Democrat 16% (50) 84% (269) 3192018 House Vote: Republican 12% (40) 88% (289) 3292016 Vote: Hillary Clinton 13% (39) 87% (252) 2902016 Vote: Donald Trump 13% (46) 87% (304) 3502016 Vote: Other 26% (17) 74% (48) 652016 Vote: Didn’t Vote 29% (45) 71% (111) 156Voted in 2014: Yes 12% (79) 88% (555) 634Voted in 2014: No 30% (68) 70% (162) 2302012 Vote: Barack Obama 14% (57) 86% (341) 3982012 Vote: Mitt Romney 12% (32) 88% (232) 2642012 Vote: Didn’t Vote 33% (55) 67% (109) 1634-Region: Northeast 17% (28) 83% (139) 1674-Region: Midwest 14% (29) 86% (185) 2134-Region: South 21% (62) 79% (240) 3024-Region: West 15% (28) 85% (154) 182Party: Democrat/Leans Democrat 18% (64) 82% (290) 354Party: Republican/Leans Republican 15% (56) 85% (318) 374Parents 17% (147) 83% (717) 864Note: Row proportions may total to larger than one-hundred percent due to rounding. For more information visit MorningConsultIntelligence.com.
Page 361
National Tracking Poll #2006102, June, 2020
361
Table POLdem1_2NET
Table POLdem1_2NET: And how old are the children that are now living in your household? Please check all that apply.5-17 years old
Demographic Selected Not Selected Total N
Registered Voters 45% (385) 55% (479) 864Gender: Male 48% (179) 52% (195) 374Gender: Female 42% (206) 58% (284) 490Age: 18-34 58% (77) 42% (55) 133Age: 35-44 83% (147) 17% (30) 177Age: 45-64 44% (152) 56% (193) 345Age: 65+ 4% (9) 96% (200) 209Millennials: 1981-1996 72% (126) 28% (49) 175GenXers: 1965-1980 71% (207) 29% (85) 292Baby Boomers: 1946-1964 12% (39) 88% (295) 333PID: Dem (no lean) 43% (130) 57% (174) 304PID: Ind (no lean) 45% (117) 55% (141) 257PID: Rep (no lean) 46% (139) 54% (164) 302PID/Gender: DemMen 45% (54) 55% (67) 121PID/Gender: DemWomen 41% (76) 59% (108) 183PID/Gender: Ind Men 50% (51) 50% (52) 103PID/Gender: Ind Women 42% (65) 58% (89) 154PID/Gender: Rep Men 49% (74) 51% (76) 150PID/Gender: Rep Women 43% (65) 57% (87) 152Ideo: Liberal (1-3) 49% (107) 51% (111) 218Ideo: Moderate (4) 43% (99) 57% (132) 231Ideo: Conservative (5-7) 43% (147) 57% (191) 338Educ: < College 41% (206) 59% (301) 507Educ: Bachelors degree 50% (105) 50% (106) 211Educ: Post-grad 51% (74) 49% (72) 146Income: Under 50k 37% (133) 63% (227) 361Income: 50k-100k 45% (140) 55% (168) 309Income: 100k+ 57% (111) 43% (83) 194Ethnicity: White 44% (314) 56% (402) 716Ethnicity: Hispanic 68% (52) 32% (24) 77Ethnicity: Afr. Am. 51% (53) 49% (52) 105
Continued on next page
Page 362
362
Morning ConsultTable POLdem1_2NET
Table POLdem1_2NET: And how old are the children that are now living in your household? Please check all that apply.5-17 years old
Demographic Selected Not Selected Total N
Registered Voters 45% (385) 55% (479) 864All Christian 41% (184) 59% (270) 454Agnostic/Nothing in particular 42% (73) 58% (101) 174Something Else 54% (84) 46% (72) 156Evangelical 49% (126) 51% (131) 257Non-Evangelical 39% (133) 61% (207) 339Community: Urban 54% (93) 46% (78) 172Community: Suburban 45% (201) 55% (249) 450Community: Rural 37% (91) 63% (152) 242Employ: Private Sector 63% (180) 37% (104) 285Employ: Government 59% (38) 41% (27) 65Employ: Self-Employed 61% (34) 39% (22) 57Employ: Homemaker 63% (56) 37% (33) 89Employ: Retired 7% (15) 93% (198) 213Employ: Unemployed 36% (30) 64% (53) 83Employ: Other 42% (26) 58% (35) 61Military HH: Yes 29% (45) 71% (109) 155Military HH: No 48% (339) 52% (370) 709RD/WT: Right Direction 47% (132) 53% (151) 283RD/WT: Wrong Track 43% (253) 57% (328) 581Trump Job Approve 45% (173) 55% (214) 387Trump Job Disapprove 44% (201) 56% (256) 457Trump Job Strongly Approve 42% (88) 58% (121) 209Trump Job Somewhat Approve 48% (85) 52% (93) 179Trump Job Somewhat Disapprove 53% (51) 47% (46) 97Trump Job Strongly Disapprove 42% (150) 58% (210) 360Favorable of Trump 45% (181) 55% (219) 400Unfavorable of Trump 43% (187) 57% (252) 438Very Favorable of Trump 41% (93) 59% (135) 229Somewhat Favorable of Trump 51% (87) 49% (84) 171Somewhat Unfavorable of Trump 50% (36) 50% (36) 72Very Unfavorable of Trump 41% (150) 59% (216) 366
Continued on next page
Page 363
National Tracking Poll #2006102, June, 2020
363
Table POLdem1_2NET
Table POLdem1_2NET: And how old are the children that are now living in your household? Please check all that apply.5-17 years old
Demographic Selected Not Selected Total N
Registered Voters 45% (385) 55% (479) 864#1 Issue: Economy 53% (163) 47% (145) 308#1 Issue: Security 39% (45) 61% (71) 116#1 Issue: Health Care 43% (64) 57% (83) 147#1 Issue: Medicare / Social Security 13% (15) 87% (100) 115#1 Issue: Education 76% (43) 24% (14) 57#1 Issue: Other 38% (22) 62% (37) 592018 House Vote: Democrat 41% (131) 59% (188) 3192018 House Vote: Republican 44% (145) 56% (184) 3292016 Vote: Hillary Clinton 41% (118) 59% (172) 2902016 Vote: Donald Trump 44% (155) 56% (195) 3502016 Vote: Other 47% (31) 53% (34) 652016 Vote: Didn’t Vote 50% (79) 50% (77) 156Voted in 2014: Yes 43% (273) 57% (361) 634Voted in 2014: No 49% (112) 51% (118) 2302012 Vote: Barack Obama 45% (180) 55% (218) 3982012 Vote: Mitt Romney 37% (99) 63% (165) 2642012 Vote: Didn’t Vote 51% (84) 49% (79) 1634-Region: Northeast 43% (71) 57% (95) 1674-Region: Midwest 42% (89) 58% (125) 2134-Region: South 47% (143) 53% (158) 3024-Region: West 45% (81) 55% (101) 182Party: Democrat/Leans Democrat 43% (151) 57% (203) 354Party: Republican/Leans Republican 46% (170) 54% (204) 374Parents 45% (385) 55% (479) 864Note: Row proportions may total to larger than one-hundred percent due to rounding. For more information visit MorningConsultIntelligence.com.
Page 364
364
Morning ConsultTable POLdem1_3NET
Table POLdem1_3NET: And how old are the children that are now living in your household? Please check all that apply.18-21 years old
Demographic Selected Not Selected Total N
Registered Voters 12% (102) 88% (761) 864Gender: Male 13% (49) 87% (326) 374Gender: Female 11% (54) 89% (436) 490Age: 18-34 4% (5) 96% (127) 133Age: 35-44 12% (21) 88% (155) 177Age: 45-64 20% (68) 80% (277) 345Age: 65+ 4% (8) 96% (201) 209Millennials: 1981-1996 4% (7) 96% (168) 175GenXers: 1965-1980 25% (72) 75% (220) 292Baby Boomers: 1946-1964 5% (17) 95% (316) 333PID: Dem (no lean) 11% (33) 89% (271) 304PID: Ind (no lean) 13% (35) 87% (223) 257PID: Rep (no lean) 11% (34) 89% (268) 302PID/Gender: DemMen 16% (19) 84% (101) 121PID/Gender: DemWomen 8% (14) 92% (169) 183PID/Gender: Ind Men 15% (15) 85% (88) 103PID/Gender: Ind Women 13% (20) 87% (135) 154PID/Gender: Rep Men 9% (14) 91% (136) 150PID/Gender: Rep Women 13% (20) 87% (132) 152Ideo: Liberal (1-3) 12% (26) 88% (192) 218Ideo: Moderate (4) 12% (28) 88% (203) 231Ideo: Conservative (5-7) 12% (42) 88% (296) 338Educ: < College 12% (58) 88% (448) 507Educ: Bachelors degree 13% (27) 87% (183) 211Educ: Post-grad 11% (16) 89% (130) 146Income: Under 50k 11% (41) 89% (320) 361Income: 50k-100k 12% (36) 88% (273) 309Income: 100k+ 13% (26) 87% (168) 194Ethnicity: White 12% (84) 88% (631) 716Ethnicity: Hispanic 11% (8) 89% (68) 77Ethnicity: Afr. Am. 11% (12) 89% (93) 105
Continued on next page
Page 365
National Tracking Poll #2006102, June, 2020
365
Table POLdem1_3NET
Table POLdem1_3NET: And how old are the children that are now living in your household? Please check all that apply.18-21 years old
Demographic Selected Not Selected Total N
Registered Voters 12% (102) 88% (761) 864All Christian 11% (51) 89% (403) 454Agnostic/Nothing in particular 17% (29) 83% (145) 174Something Else 12% (18) 88% (138) 156Evangelical 10% (25) 90% (232) 257Non-Evangelical 13% (43) 87% (296) 339Community: Urban 10% (16) 90% (155) 172Community: Suburban 14% (63) 86% (387) 450Community: Rural 10% (23) 90% (219) 242Employ: Private Sector 14% (39) 86% (246) 285Employ: Government 10% (7) 90% (58) 65Employ: Self-Employed 12% (7) 88% (50) 57Employ: Homemaker 16% (14) 84% (75) 89Employ: Retired 6% (12) 94% (201) 213Employ: Unemployed 15% (13) 85% (70) 83Employ: Other 14% (9) 86% (52) 61Military HH: Yes 8% (12) 92% (142) 155Military HH: No 13% (90) 87% (619) 709RD/WT: Right Direction 12% (35) 88% (248) 283RD/WT: Wrong Track 12% (67) 88% (514) 581Trump Job Approve 11% (44) 89% (343) 387Trump Job Disapprove 12% (57) 88% (400) 457Trump Job Strongly Approve 12% (26) 88% (183) 209Trump Job Somewhat Approve 10% (19) 90% (160) 179Trump Job Somewhat Disapprove 8% (8) 92% (90) 97Trump Job Strongly Disapprove 14% (49) 86% (311) 360Favorable of Trump 12% (47) 88% (353) 400Unfavorable of Trump 13% (55) 87% (383) 438Very Favorable of Trump 11% (26) 89% (202) 229Somewhat Favorable of Trump 12% (21) 88% (151) 171Somewhat Unfavorable of Trump 13% (9) 87% (63) 72Very Unfavorable of Trump 13% (46) 87% (320) 366
Continued on next page
Page 366
366
Morning ConsultTable POLdem1_3NET
Table POLdem1_3NET: And how old are the children that are now living in your household? Please check all that apply.18-21 years old
Demographic Selected Not Selected Total N
Registered Voters 12% (102) 88% (761) 864#1 Issue: Economy 13% (39) 87% (268) 308#1 Issue: Security 15% (17) 85% (99) 116#1 Issue: Health Care 11% (16) 89% (131) 147#1 Issue: Medicare / Social Security 12% (13) 88% (102) 115#1 Issue: Education 13% (7) 87% (50) 57#1 Issue: Other 11% (7) 89% (52) 592018 House Vote: Democrat 11% (36) 89% (283) 3192018 House Vote: Republican 11% (37) 89% (292) 3292016 Vote: Hillary Clinton 11% (33) 89% (258) 2902016 Vote: Donald Trump 13% (45) 87% (305) 3502016 Vote: Other 6% (4) 94% (61) 652016 Vote: Didn’t Vote 13% (20) 87% (137) 156Voted in 2014: Yes 12% (76) 88% (558) 634Voted in 2014: No 11% (26) 89% (204) 2302012 Vote: Barack Obama 13% (53) 87% (346) 3982012 Vote: Mitt Romney 11% (28) 89% (236) 2642012 Vote: Didn’t Vote 12% (19) 88% (144) 1634-Region: Northeast 13% (21) 87% (146) 1674-Region: Midwest 13% (29) 87% (185) 2134-Region: South 10% (31) 90% (271) 3024-Region: West 12% (22) 88% (160) 182Party: Democrat/Leans Democrat 12% (42) 88% (312) 354Party: Republican/Leans Republican 11% (41) 89% (333) 374Parents 12% (102) 88% (761) 864Note: Row proportions may total to larger than one-hundred percent due to rounding. For more information visit MorningConsultIntelligence.com.
Page 367
National Tracking Poll #2006102, June, 2020
367
Table POLdem1_4NET
Table POLdem1_4NET: And how old are the children that are now living in your household? Please check all that apply.Older than 21 years old
Demographic Selected Not Selected Total N
Registered Voters 44% (383) 56% (481) 864Gender: Male 40% (151) 60% (223) 374Gender: Female 47% (232) 53% (258) 490Age: 18-34 5% (7) 95% (126) 133Age: 35-44 5% (8) 95% (169) 177Age: 45-64 51% (175) 49% (171) 345Age: 65+ 93% (194) 7% (15) 209Millennials: 1981-1996 4% (7) 96% (168) 175GenXers: 1965-1980 21% (61) 79% (231) 292Baby Boomers: 1946-1964 86% (285) 14% (48) 333PID: Dem (no lean) 42% (129) 58% (175) 304PID: Ind (no lean) 43% (111) 57% (146) 257PID: Rep (no lean) 47% (143) 53% (159) 302PID/Gender: DemMen 37% (44) 63% (76) 121PID/Gender: DemWomen 46% (84) 54% (99) 183PID/Gender: Ind Men 41% (42) 59% (61) 103PID/Gender: Ind Women 45% (69) 55% (85) 154PID/Gender: Rep Men 43% (64) 57% (86) 150PID/Gender: Rep Women 52% (79) 48% (73) 152Ideo: Liberal (1-3) 37% (80) 63% (138) 218Ideo: Moderate (4) 48% (111) 52% (120) 231Ideo: Conservative (5-7) 49% (164) 51% (174) 338Educ: < College 48% (243) 52% (264) 507Educ: Bachelors degree 39% (81) 61% (130) 211Educ: Post-grad 40% (58) 60% (88) 146Income: Under 50k 50% (180) 50% (181) 361Income: 50k-100k 45% (138) 55% (171) 309Income: 100k+ 33% (65) 67% (129) 194Ethnicity: White 48% (346) 52% (370) 716Ethnicity: Hispanic 16% (12) 84% (65) 77Ethnicity: Afr. Am. 20% (21) 80% (83) 105
Continued on next page
Page 368
368
Morning ConsultTable POLdem1_4NET
Table POLdem1_4NET: And how old are the children that are now living in your household? Please check all that apply.Older than 21 years old
Demographic Selected Not Selected Total N
Registered Voters 44% (383) 56% (481) 864All Christian 53% (238) 47% (215) 454Agnostic/Nothing in particular 39% (68) 61% (106) 174Something Else 31% (48) 69% (108) 156Evangelical 42% (108) 58% (149) 257Non-Evangelical 51% (173) 49% (166) 339Community: Urban 32% (54) 68% (117) 172Community: Suburban 46% (205) 54% (245) 450Community: Rural 51% (124) 49% (119) 242Employ: Private Sector 28% (80) 72% (205) 285Employ: Government 26% (17) 74% (48) 65Employ: Self-Employed 30% (17) 70% (40) 57Employ: Homemaker 24% (22) 76% (68) 89Employ: Retired 88% (188) 12% (25) 213Employ: Unemployed 41% (34) 59% (49) 83Employ: Other 40% (24) 60% (37) 61Military HH: Yes 63% (97) 37% (57) 155Military HH: No 40% (286) 60% (423) 709RD/WT: Right Direction 43% (122) 57% (162) 283RD/WT: Wrong Track 45% (261) 55% (319) 581Trump Job Approve 46% (177) 54% (210) 387Trump Job Disapprove 44% (199) 56% (258) 457Trump Job Strongly Approve 50% (105) 50% (104) 209Trump Job Somewhat Approve 41% (72) 59% (106) 179Trump Job Somewhat Disapprove 39% (38) 61% (59) 97Trump Job Strongly Disapprove 45% (161) 55% (199) 360Favorable of Trump 47% (186) 53% (214) 400Unfavorable of Trump 44% (191) 56% (247) 438Very Favorable of Trump 51% (116) 49% (113) 229Somewhat Favorable of Trump 41% (71) 59% (101) 171Somewhat Unfavorable of Trump 38% (27) 62% (45) 72Very Unfavorable of Trump 45% (164) 55% (202) 366
Continued on next page
Page 369
National Tracking Poll #2006102, June, 2020
369
Table POLdem1_4NET
Table POLdem1_4NET: And how old are the children that are now living in your household? Please check all that apply.Older than 21 years old
Demographic Selected Not Selected Total N
Registered Voters 44% (383) 56% (481) 864#1 Issue: Economy 35% (107) 65% (201) 308#1 Issue: Security 53% (62) 47% (54) 116#1 Issue: Health Care 44% (65) 56% (82) 147#1 Issue: Medicare / Social Security 82% (94) 18% (21) 115#1 Issue: Education 12% (7) 88% (50) 57#1 Issue: Other 49% (29) 51% (30) 592018 House Vote: Democrat 46% (147) 54% (172) 3192018 House Vote: Republican 48% (159) 52% (169) 3292016 Vote: Hillary Clinton 47% (136) 53% (155) 2902016 Vote: Donald Trump 49% (170) 51% (179) 3502016 Vote: Other 42% (27) 58% (37) 652016 Vote: Didn’t Vote 32% (49) 68% (107) 156Voted in 2014: Yes 49% (311) 51% (323) 634Voted in 2014: No 31% (72) 69% (158) 2302012 Vote: Barack Obama 45% (178) 55% (220) 3982012 Vote: Mitt Romney 56% (149) 44% (115) 2642012 Vote: Didn’t Vote 24% (39) 76% (125) 1634-Region: Northeast 45% (76) 55% (91) 1674-Region: Midwest 52% (110) 48% (103) 2134-Region: South 37% (111) 63% (190) 3024-Region: West 47% (86) 53% (96) 182Party: Democrat/Leans Democrat 43% (151) 57% (203) 354Party: Republican/Leans Republican 47% (176) 53% (198) 374Parents 44% (383) 56% (481) 864Note: Row proportions may total to larger than one-hundred percent due to rounding. For more information visit MorningConsultIntelligence.com.
Page 370
370
Morning ConsultTable POLx_1
Table POLx_1: Next we will look at a list of names that are active in politics. It is a long list, please take the time to go through the list carefullyand give an individual answer for each name below. For each person, please indicate if you have a Very Favorable, Somewhat Favorable, SomewhatUnfavorable, or Very Unfavorable opinion of each If you have heard of the person, but do not have an opinion, please mark ’Heard Of, No Opinion.’ Ifyou have not heard of the person, please mark ’Never Heard Of.’Mitch McConnell
Demographic Total Favorable Total UnfavorableHeard Of, NoOpinion Never Heard Of Total N
Registered Voters 23% (464) 46% (911) 20% (395) 11% (219) 1988Gender: Male 29% (268) 49% (455) 14% (126) 9% (81) 930Gender: Female 19% (196) 43% (456) 25% (269) 13% (138) 1058Age: 18-34 10% (52) 40% (200) 25% (125) 24% (122) 499Age: 35-44 20% (62) 46% (140) 21% (63) 12% (37) 302Age: 45-64 27% (196) 47% (340) 19% (141) 7% (47) 724Age: 65+ 33% (153) 50% (231) 14% (65) 3% (13) 463GenZers: 1997-2012 5% (12) 35% (79) 26% (57) 34% (75) 224Millennials: 1981-1996 15% (64) 44% (183) 25% (104) 16% (68) 419GenXers: 1965-1980 24% (124) 47% (240) 20% (102) 9% (46) 511Baby Boomers: 1946-1964 30% (230) 50% (379) 16% (122) 4% (29) 760PID: Dem (no lean) 8% (58) 63% (479) 19% (140) 11% (80) 757PID: Ind (no lean) 17% (110) 47% (300) 21% (135) 14% (92) 638PID: Rep (no lean) 50% (295) 22% (131) 20% (119) 8% (47) 593PID/Gender: DemMen 7% (25) 69% (228) 15% (49) 8% (28) 329PID/Gender: DemWomen 8% (34) 59% (252) 21% (91) 12% (52) 429PID/Gender: Ind Men 22% (64) 53% (156) 16% (47) 10% (29) 296PID/Gender: Ind Women 14% (46) 42% (145) 26% (89) 18% (63) 342PID/Gender: Rep Men 59% (179) 24% (72) 10% (30) 8% (24) 306PID/Gender: Rep Women 40% (116) 21% (59) 31% (89) 8% (23) 287Ideo: Liberal (1-3) 7% (41) 70% (429) 15% (92) 8% (47) 609Ideo: Moderate (4) 16% (82) 49% (258) 25% (128) 10% (54) 522Ideo: Conservative (5-7) 47% (321) 27% (185) 19% (127) 7% (46) 679Educ: < College 24% (299) 39% (494) 23% (284) 14% (173) 1250Educ: Bachelors degree 20% (94) 55% (257) 18% (86) 7% (33) 470Educ: Post-grad 26% (70) 60% (160) 9% (24) 5% (13) 267Income: Under 50k 22% (216) 41% (412) 23% (235) 14% (135) 998Income: 50k-100k 26% (173) 48% (315) 18% (118) 8% (54) 660Income: 100k+ 23% (74) 56% (183) 13% (42) 9% (30) 329
Continued on next page
Page 371
National Tracking Poll #2006102, June, 2020
371
Table POLx_1
Table POLx_1: Next we will look at a list of names that are active in politics. It is a long list, please take the time to go through the list carefullyand give an individual answer for each name below. For each person, please indicate if you have a Very Favorable, Somewhat Favorable, SomewhatUnfavorable, or Very Unfavorable opinion of each If you have heard of the person, but do not have an opinion, please mark ’Heard Of, No Opinion.’ Ifyou have not heard of the person, please mark ’Never Heard Of.’Mitch McConnell
Demographic Total Favorable Total UnfavorableHeard Of, NoOpinion Never Heard Of Total N
Registered Voters 23% (464) 46% (911) 20% (395) 11% (219) 1988Ethnicity: White 26% (422) 46% (748) 19% (301) 9% (137) 1608Ethnicity: Hispanic 15% (29) 39% (76) 25% (48) 21% (40) 193Ethnicity: Afr. Am. 10% (26) 45% (113) 24% (61) 20% (52) 252Ethnicity: Other 12% (15) 40% (51) 25% (32) 23% (30) 128All Christian 31% (295) 44% (413) 18% (171) 7% (62) 941All Non-Christian 16% (15) 60% (58) 16% (16) 8% (8) 97Atheist 7% (9) 69% (88) 15% (19) 9% (12) 128Agnostic/Nothing in particular 14% (66) 49% (236) 22% (106) 15% (71) 478Something Else 23% (78) 34% (117) 24% (83) 19% (65) 344Religious Non-Protestant/Catholic 14% (17) 57% (68) 20% (24) 9% (11) 120Evangelical 35% (175) 33% (167) 23% (114) 10% (49) 505Non-Evangelical 26% (193) 47% (349) 17% (129) 10% (74) 746Community: Urban 20% (96) 45% (220) 20% (100) 15% (74) 490Community: Suburban 22% (215) 49% (477) 20% (196) 9% (93) 981Community: Rural 29% (153) 41% (214) 19% (99) 10% (52) 517Employ: Private Sector 25% (156) 52% (329) 16% (99) 7% (47) 631Employ: Government 20% (27) 53% (72) 16% (22) 10% (14) 136Employ: Self-Employed 18% (23) 43% (56) 21% (28) 18% (23) 130Employ: Homemaker 13% (15) 43% (49) 23% (27) 21% (24) 115Employ: Retired 34% (167) 47% (232) 17% (83) 2% (9) 492Employ: Unemployed 19% (44) 38% (87) 22% (50) 21% (48) 229Employ: Other 15% (23) 33% (50) 37% (56) 15% (23) 152Military HH: Yes 31% (96) 47% (143) 16% (49) 6% (18) 306Military HH: No 22% (368) 46% (768) 21% (346) 12% (200) 1682RD/WT: Right Direction 48% (274) 22% (126) 22% (122) 8% (45) 567RD/WT: Wrong Track 13% (190) 55% (785) 19% (272) 12% (174) 1421Trump Job Approve 49% (382) 21% (159) 21% (166) 9% (67) 774Trump Job Disapprove 7% (78) 64% (743) 18% (205) 11% (128) 1153
Continued on next page
Page 372
372
Morning ConsultTable POLx_1
Table POLx_1: Next we will look at a list of names that are active in politics. It is a long list, please take the time to go through the list carefullyand give an individual answer for each name below. For each person, please indicate if you have a Very Favorable, Somewhat Favorable, SomewhatUnfavorable, or Very Unfavorable opinion of each If you have heard of the person, but do not have an opinion, please mark ’Heard Of, No Opinion.’ Ifyou have not heard of the person, please mark ’Never Heard Of.’Mitch McConnell
Demographic Total Favorable Total UnfavorableHeard Of, NoOpinion Never Heard Of Total N
Registered Voters 23% (464) 46% (911) 20% (395) 11% (219) 1988Trump Job Strongly Approve 62% (255) 14% (60) 18% (73) 6% (27) 415Trump Job Somewhat Approve 35% (126) 28% (99) 26% (93) 11% (40) 359Trump Job Somewhat Disapprove 11% (26) 49% (111) 26% (59) 14% (31) 226Trump Job Strongly Disapprove 6% (52) 68% (632) 16% (147) 10% (96) 927Favorable of Trump 50% (397) 20% (159) 21% (163) 9% (68) 787Unfavorable of Trump 6% (64) 66% (742) 18% (203) 11% (123) 1132Very Favorable of Trump 60% (278) 16% (72) 18% (83) 6% (29) 462Somewhat Favorable of Trump 37% (119) 27% (87) 24% (79) 12% (39) 325Somewhat Unfavorable of Trump 10% (19) 50% (91) 30% (55) 10% (17) 182Very Unfavorable of Trump 5% (45) 68% (651) 16% (148) 11% (106) 950#1 Issue: Economy 27% (184) 41% (284) 21% (145) 11% (75) 688#1 Issue: Security 41% (105) 30% (76) 19% (48) 10% (25) 254#1 Issue: Health Care 17% (56) 59% (197) 17% (55) 8% (27) 335#1 Issue: Medicare / Social Security 23% (64) 52% (147) 20% (56) 6% (16) 283#1 Issue: Women’s Issues 9% (8) 47% (40) 27% (24) 17% (15) 86#1 Issue: Education 16% (17) 39% (42) 22% (24) 22% (24) 107#1 Issue: Energy 10% (8) 53% (42) 26% (20) 12% (9) 79#1 Issue: Other 15% (23) 53% (83) 14% (23) 18% (28) 1572018 House Vote: Democrat 8% (58) 71% (546) 16% (119) 6% (44) 7672018 House Vote: Republican 52% (327) 26% (163) 16% (98) 7% (41) 6292018 House Vote: Someone else 6% (5) 53% (39) 26% (19) 15% (11) 732016 Vote: Hillary Clinton 8% (55) 71% (494) 16% (110) 6% (42) 7002016 Vote: Donald Trump 50% (335) 27% (181) 16% (108) 8% (51) 6752016 Vote: Other 12% (18) 57% (82) 22% (32) 9% (13) 1442016 Vote: Didn’t Vote 12% (55) 33% (153) 31% (145) 24% (113) 466Voted in 2014: Yes 28% (368) 51% (676) 15% (195) 6% (81) 1322Voted in 2014: No 14% (95) 35% (235) 30% (199) 21% (137) 666
Continued on next page
Page 373
National Tracking Poll #2006102, June, 2020
373
Table POLx_1
Table POLx_1: Next we will look at a list of names that are active in politics. It is a long list, please take the time to go through the list carefullyand give an individual answer for each name below. For each person, please indicate if you have a Very Favorable, Somewhat Favorable, SomewhatUnfavorable, or Very Unfavorable opinion of each If you have heard of the person, but do not have an opinion, please mark ’Heard Of, No Opinion.’ Ifyou have not heard of the person, please mark ’Never Heard Of.’Mitch McConnell
Demographic Total Favorable Total UnfavorableHeard Of, NoOpinion Never Heard Of Total N
Registered Voters 23% (464) 46% (911) 20% (395) 11% (219) 19882012 Vote: Barack Obama 12% (98) 65% (555) 17% (148) 6% (51) 8532012 Vote: Mitt Romney 53% (267) 27% (133) 14% (68) 6% (32) 5012012 Vote: Other 21% (17) 51% (42) 19% (16) 9% (8) 842012 Vote: Didn’t Vote 15% (81) 33% (181) 29% (161) 23% (128) 5504-Region: Northeast 23% (80) 47% (165) 21% (75) 10% (35) 3554-Region: Midwest 22% (102) 48% (221) 20% (90) 10% (45) 4574-Region: South 26% (194) 43% (322) 19% (144) 11% (83) 7424-Region: West 20% (87) 47% (204) 20% (86) 13% (57) 434Party: Democrat/Leans Democrat 7% (62) 65% (589) 19% (169) 10% (91) 911Party: Republican/Leans Republican 48% (352) 24% (179) 20% (151) 8% (58) 741Parents 27% (236) 42% (363) 20% (174) 10% (90) 864Note: Row proportions may total to larger than one-hundred percent due to rounding. For more information visit MorningConsultIntelligence.com.
Page 374
374
Morning ConsultTable POLx_2
Table POLx_2: Favorability forNancy Pelosi
Demographic Total Favorable Total UnfavorableHeard Of, NoOpinion Never Heard Of Total N
Registered Voters 35% (705) 52% (1026) 9% (177) 4% (80) 1988Gender: Male 32% (300) 56% (519) 7% (69) 5% (42) 930Gender: Female 38% (405) 48% (506) 10% (108) 4% (38) 1058Age: 18-34 28% (140) 43% (212) 16% (81) 13% (66) 499Age: 35-44 40% (119) 46% (140) 11% (33) 3% (9) 302Age: 45-64 36% (260) 56% (403) 8% (56) 1% (5) 724Age: 65+ 40% (185) 58% (270) 2% (7) — (0) 463GenZers: 1997-2012 22% (49) 40% (89) 18% (40) 20% (45) 224Millennials: 1981-1996 35% (147) 46% (192) 14% (57) 6% (24) 419GenXers: 1965-1980 37% (190) 51% (260) 10% (52) 2% (9) 511Baby Boomers: 1946-1964 39% (296) 57% (435) 3% (26) — (3) 760PID: Dem (no lean) 67% (511) 18% (135) 10% (77) 5% (35) 757PID: Ind (no lean) 23% (149) 60% (381) 12% (75) 5% (32) 638PID: Rep (no lean) 8% (46) 86% (509) 4% (25) 2% (13) 593PID/Gender: DemMen 64% (210) 21% (70) 9% (30) 6% (19) 329PID/Gender: DemWomen 70% (300) 15% (65) 11% (47) 4% (16) 429PID/Gender: Ind Men 19% (56) 67% (197) 10% (28) 5% (14) 296PID/Gender: Ind Women 27% (92) 54% (184) 14% (47) 5% (19) 342PID/Gender: Rep Men 11% (33) 83% (252) 4% (11) 3% (10) 306PID/Gender: Rep Women 4% (13) 90% (257) 5% (14) 1% (3) 287Ideo: Liberal (1-3) 68% (413) 23% (138) 7% (41) 3% (16) 609Ideo: Moderate (4) 35% (184) 49% (255) 12% (63) 4% (19) 522Ideo: Conservative (5-7) 12% (81) 83% (561) 4% (28) 1% (9) 679Educ: < College 28% (350) 55% (692) 11% (139) 6% (69) 1250Educ: Bachelors degree 46% (216) 45% (213) 7% (32) 2% (8) 470Educ: Post-grad 52% (139) 45% (120) 2% (5) 1% (3) 267Income: Under 50k 33% (330) 49% (492) 12% (118) 6% (58) 998Income: 50k-100k 37% (243) 55% (360) 6% (41) 3% (17) 660Income: 100k+ 40% (131) 53% (174) 5% (18) 2% (6) 329Ethnicity: White 33% (537) 58% (928) 7% (112) 2% (30) 1608Ethnicity: Hispanic 40% (78) 36% (69) 16% (32) 8% (15) 193
Continued on next page
Page 375
National Tracking Poll #2006102, June, 2020
375
Table POLx_2
Table POLx_2: Favorability forNancy Pelosi
Demographic Total Favorable Total UnfavorableHeard Of, NoOpinion Never Heard Of Total N
Registered Voters 35% (705) 52% (1026) 9% (177) 4% (80) 1988Ethnicity: Afr. Am. 46% (115) 22% (56) 17% (42) 16% (39) 252Ethnicity: Other 41% (53) 32% (41) 18% (23) 9% (11) 128All Christian 32% (303) 60% (565) 6% (60) 1% (12) 941All Non-Christian 63% (61) 27% (26) 7% (7) 3% (3) 97Atheist 47% (60) 39% (50) 7% (9) 7% (9) 128Agnostic/Nothing in particular 37% (179) 45% (216) 11% (54) 6% (29) 478Something Else 30% (102) 49% (167) 14% (47) 8% (28) 344Religious Non-Protestant/Catholic 56% (67) 34% (41) 6% (7) 4% (5) 120Evangelical 26% (130) 62% (314) 9% (47) 3% (15) 505Non-Evangelical 36% (267) 54% (399) 8% (58) 3% (21) 746Community: Urban 45% (221) 38% (187) 9% (46) 7% (36) 490Community: Suburban 36% (357) 50% (495) 10% (98) 3% (31) 981Community: Rural 25% (127) 66% (344) 6% (32) 3% (14) 517Employ: Private Sector 37% (231) 55% (346) 6% (41) 2% (14) 631Employ: Government 38% (52) 49% (66) 9% (13) 3% (4) 136Employ: Self-Employed 38% (49) 48% (62) 13% (16) 2% (3) 130Employ: Homemaker 28% (33) 57% (66) 13% (15) 2% (2) 115Employ: Retired 39% (193) 57% (280) 4% (18) — (1) 492Employ: Unemployed 34% (78) 43% (98) 13% (29) 11% (24) 229Employ: Other 28% (42) 42% (63) 19% (28) 12% (18) 152Military HH: Yes 30% (93) 61% (187) 6% (17) 3% (10) 306Military HH: No 36% (612) 50% (839) 10% (160) 4% (71) 1682RD/WT: Right Direction 13% (74) 76% (431) 6% (36) 5% (27) 567RD/WT: Wrong Track 44% (631) 42% (595) 10% (141) 4% (53) 1421Trump Job Approve 9% (68) 84% (650) 5% (38) 2% (18) 774Trump Job Disapprove 55% (634) 31% (354) 10% (112) 5% (53) 1153Trump Job Strongly Approve 8% (33) 88% (366) 2% (10) 1% (5) 415Trump Job Somewhat Approve 10% (35) 79% (284) 8% (27) 4% (13) 359Trump Job Somewhat Disapprove 31% (71) 52% (119) 12% (27) 4% (10) 226Trump Job Strongly Disapprove 61% (563) 25% (235) 9% (85) 5% (43) 927
Continued on next page
Page 376
376
Morning ConsultTable POLx_2
Table POLx_2: Favorability forNancy Pelosi
Demographic Total Favorable Total UnfavorableHeard Of, NoOpinion Never Heard Of Total N
Registered Voters 35% (705) 52% (1026) 9% (177) 4% (80) 1988Favorable of Trump 9% (69) 85% (670) 4% (34) 2% (14) 787Unfavorable of Trump 56% (631) 30% (339) 9% (107) 5% (54) 1132Very Favorable of Trump 8% (35) 88% (407) 3% (13) 2% (8) 462Somewhat Favorable of Trump 11% (34) 81% (263) 6% (21) 2% (7) 325Somewhat Unfavorable of Trump 24% (43) 60% (108) 12% (23) 4% (8) 182Very Unfavorable of Trump 62% (589) 24% (231) 9% (84) 5% (46) 950#1 Issue: Economy 30% (204) 57% (390) 10% (69) 4% (25) 688#1 Issue: Security 12% (29) 80% (203) 6% (15) 3% (7) 254#1 Issue: Health Care 51% (172) 37% (124) 8% (28) 3% (10) 335#1 Issue: Medicare / Social Security 45% (128) 49% (139) 4% (12) 1% (4) 283#1 Issue: Women’s Issues 44% (38) 31% (27) 7% (6) 17% (15) 86#1 Issue: Education 39% (42) 40% (43) 14% (15) 6% (7) 107#1 Issue: Energy 46% (36) 34% (27) 12% (9) 8% (7) 79#1 Issue: Other 35% (55) 47% (73) 15% (23) 4% (6) 1572018 House Vote: Democrat 70% (539) 20% (154) 7% (53) 3% (21) 7672018 House Vote: Republican 8% (49) 88% (556) 3% (18) 1% (6) 6292018 House Vote: Someone else 7% (5) 74% (54) 16% (12) 3% (2) 732016 Vote: Hillary Clinton 74% (520) 16% (114) 7% (49) 2% (17) 7002016 Vote: Donald Trump 9% (58) 88% (591) 3% (20) 1% (5) 6752016 Vote: Other 20% (29) 69% (99) 10% (14) 1% (2) 1442016 Vote: Didn’t Vote 21% (96) 47% (221) 20% (93) 12% (55) 466Voted in 2014: Yes 40% (533) 53% (697) 6% (75) 1% (17) 1322Voted in 2014: No 26% (172) 49% (329) 15% (102) 10% (64) 6662012 Vote: Barack Obama 62% (526) 29% (247) 8% (65) 2% (15) 8532012 Vote: Mitt Romney 9% (43) 90% (449) 1% (6) 1% (3) 5012012 Vote: Other 11% (9) 82% (69) 6% (5) 1% (1) 842012 Vote: Didn’t Vote 23% (127) 47% (259) 18% (101) 11% (62) 550
Continued on next page
Page 377
National Tracking Poll #2006102, June, 2020
377
Table POLx_2
Table POLx_2: Favorability forNancy Pelosi
Demographic Total Favorable Total UnfavorableHeard Of, NoOpinion Never Heard Of Total N
Registered Voters 35% (705) 52% (1026) 9% (177) 4% (80) 19884-Region: Northeast 39% (140) 48% (170) 10% (35) 3% (10) 3554-Region: Midwest 35% (159) 52% (236) 8% (37) 5% (25) 4574-Region: South 30% (219) 58% (430) 9% (68) 3% (25) 7424-Region: West 43% (187) 44% (190) 9% (37) 5% (20) 434Party: Democrat/Leans Democrat 65% (595) 21% (187) 10% (91) 4% (37) 911Party: Republican/Leans Republican 7% (53) 87% (642) 4% (33) 2% (14) 741Parents 32% (274) 57% (494) 8% (70) 3% (26) 864Note: Row proportions may total to larger than one-hundred percent due to rounding. For more information visit MorningConsultIntelligence.com.
Page 378
378
Morning ConsultTable POLx_3
Table POLx_3: Favorability forCharles Schumer
Demographic Total Favorable Total UnfavorableHeard Of, NoOpinion Never Heard Of Total N
Registered Voters 26% (518) 37% (734) 21% (417) 16% (318) 1988Gender: Male 27% (250) 46% (427) 15% (144) 12% (110) 930Gender: Female 25% (268) 29% (307) 26% (274) 20% (209) 1058Age: 18-34 16% (79) 24% (121) 26% (129) 34% (170) 499Age: 35-44 27% (81) 35% (104) 21% (64) 17% (53) 302Age: 45-64 29% (213) 40% (289) 20% (145) 11% (78) 724Age: 65+ 31% (146) 48% (220) 17% (79) 4% (18) 463GenZers: 1997-2012 11% (24) 19% (42) 26% (57) 45% (101) 224Millennials: 1981-1996 20% (86) 30% (127) 26% (111) 23% (96) 419GenXers: 1965-1980 31% (156) 36% (185) 19% (99) 14% (71) 511Baby Boomers: 1946-1964 31% (232) 45% (346) 18% (137) 6% (46) 760PID: Dem (no lean) 47% (355) 16% (118) 22% (167) 16% (118) 757PID: Ind (no lean) 18% (112) 40% (254) 23% (145) 20% (128) 638PID: Rep (no lean) 9% (52) 61% (363) 18% (106) 12% (73) 593PID/Gender: DemMen 47% (155) 22% (72) 19% (63) 11% (37) 329PID/Gender: DemWomen 47% (199) 11% (45) 24% (103) 19% (80) 429PID/Gender: Ind Men 18% (54) 51% (152) 17% (49) 14% (41) 296PID/Gender: Ind Women 17% (57) 30% (102) 28% (96) 25% (87) 342PID/Gender: Rep Men 13% (40) 66% (203) 10% (31) 10% (31) 306PID/Gender: Rep Women 4% (11) 56% (160) 26% (75) 14% (41) 287Ideo: Liberal (1-3) 49% (299) 19% (114) 20% (119) 13% (77) 609Ideo: Moderate (4) 26% (137) 34% (177) 24% (125) 16% (83) 522Ideo: Conservative (5-7) 11% (74) 61% (414) 18% (125) 10% (66) 679Educ: < College 21% (258) 36% (453) 24% (296) 19% (243) 1250Educ: Bachelors degree 31% (144) 39% (183) 18% (85) 13% (59) 470Educ: Post-grad 43% (116) 37% (99) 14% (36) 6% (17) 267Income: Under 50k 23% (233) 32% (323) 26% (264) 18% (178) 998Income: 50k-100k 26% (172) 43% (287) 16% (108) 14% (94) 660Income: 100k+ 34% (113) 38% (124) 14% (46) 14% (47) 329Ethnicity: White 26% (414) 40% (651) 20% (328) 13% (215) 1608Ethnicity: Hispanic 23% (44) 24% (47) 29% (55) 25% (47) 193
Continued on next page
Page 379
National Tracking Poll #2006102, June, 2020
379
Table POLx_3
Table POLx_3: Favorability forCharles Schumer
Demographic Total Favorable Total UnfavorableHeard Of, NoOpinion Never Heard Of Total N
Registered Voters 26% (518) 37% (734) 21% (417) 16% (318) 1988Ethnicity: Afr. Am. 30% (77) 20% (51) 21% (53) 28% (71) 252Ethnicity: Other 21% (27) 25% (33) 28% (36) 25% (32) 128All Christian 24% (222) 46% (429) 21% (199) 10% (91) 941All Non-Christian 48% (47) 23% (23) 15% (15) 13% (13) 97Atheist 38% (48) 31% (39) 15% (19) 16% (21) 128Agnostic/Nothing in particular 28% (135) 30% (144) 19% (90) 23% (110) 478Something Else 19% (66) 29% (100) 27% (94) 24% (84) 344Religious Non-Protestant/Catholic 42% (51) 28% (33) 16% (19) 14% (17) 120Evangelical 17% (84) 44% (224) 27% (137) 12% (60) 505Non-Evangelical 27% (198) 39% (293) 20% (148) 14% (106) 746Community: Urban 31% (153) 26% (130) 23% (111) 20% (96) 490Community: Suburban 27% (261) 39% (381) 21% (202) 14% (137) 981Community: Rural 20% (104) 43% (223) 20% (104) 17% (86) 517Employ: Private Sector 29% (180) 42% (267) 16% (99) 14% (85) 631Employ: Government 25% (33) 41% (56) 19% (26) 15% (20) 136Employ: Self-Employed 29% (37) 23% (29) 31% (40) 18% (23) 130Employ: Homemaker 20% (23) 33% (38) 22% (26) 25% (28) 115Employ: Retired 31% (155) 46% (228) 19% (93) 3% (16) 492Employ: Unemployed 24% (54) 24% (56) 23% (53) 29% (66) 229Employ: Other 17% (27) 23% (36) 33% (50) 26% (40) 152Military HH: Yes 24% (74) 52% (160) 15% (45) 9% (28) 306Military HH: No 26% (444) 34% (574) 22% (373) 17% (291) 1682RD/WT: Right Direction 12% (69) 57% (325) 19% (109) 11% (64) 567RD/WT: Wrong Track 32% (450) 29% (409) 22% (308) 18% (254) 1421Trump Job Approve 9% (69) 59% (460) 19% (149) 12% (96) 774Trump Job Disapprove 39% (448) 23% (267) 21% (245) 17% (193) 1153Trump Job Strongly Approve 9% (36) 67% (280) 16% (66) 8% (33) 415Trump Job Somewhat Approve 9% (33) 50% (180) 23% (83) 17% (62) 359Trump Job Somewhat Disapprove 19% (42) 33% (75) 30% (68) 18% (41) 226Trump Job Strongly Disapprove 44% (406) 21% (192) 19% (177) 16% (152) 927
Continued on next page
Page 380
380
Morning ConsultTable POLx_3
Table POLx_3: Favorability forCharles Schumer
Demographic Total Favorable Total UnfavorableHeard Of, NoOpinion Never Heard Of Total N
Registered Voters 26% (518) 37% (734) 21% (417) 16% (318) 1988Favorable of Trump 9% (73) 59% (467) 20% (153) 12% (94) 787Unfavorable of Trump 39% (442) 23% (263) 21% (235) 17% (191) 1132Very Favorable of Trump 8% (39) 67% (308) 16% (75) 9% (41) 462Somewhat Favorable of Trump 10% (34) 49% (159) 24% (79) 16% (53) 325Somewhat Unfavorable of Trump 16% (30) 39% (70) 25% (45) 21% (37) 182Very Unfavorable of Trump 43% (413) 20% (193) 20% (190) 16% (154) 950#1 Issue: Economy 22% (151) 42% (291) 20% (138) 16% (108) 688#1 Issue: Security 12% (29) 59% (150) 17% (43) 13% (32) 254#1 Issue: Health Care 37% (124) 28% (94) 23% (76) 12% (41) 335#1 Issue: Medicare / Social Security 35% (100) 32% (90) 22% (61) 11% (32) 283#1 Issue: Women’s Issues 23% (20) 17% (15) 30% (26) 29% (25) 86#1 Issue: Education 26% (28) 16% (18) 33% (35) 25% (26) 107#1 Issue: Energy 32% (25) 21% (17) 15% (12) 31% (25) 79#1 Issue: Other 27% (42) 38% (60) 17% (26) 19% (29) 1572018 House Vote: Democrat 52% (400) 18% (140) 18% (141) 11% (87) 7672018 House Vote: Republican 9% (54) 69% (434) 15% (96) 7% (45) 6292018 House Vote: Someone else 7% (5) 45% (33) 30% (22) 18% (13) 732016 Vote: Hillary Clinton 55% (386) 17% (116) 17% (117) 12% (82) 7002016 Vote: Donald Trump 8% (53) 67% (451) 17% (115) 8% (56) 6752016 Vote: Other 16% (23) 49% (70) 21% (31) 14% (21) 1442016 Vote: Didn’t Vote 12% (55) 21% (97) 33% (155) 34% (160) 466Voted in 2014: Yes 32% (419) 43% (565) 17% (225) 9% (113) 1322Voted in 2014: No 15% (99) 25% (169) 29% (192) 31% (206) 6662012 Vote: Barack Obama 47% (399) 24% (202) 20% (166) 10% (86) 8532012 Vote: Mitt Romney 8% (41) 69% (348) 15% (75) 7% (37) 5012012 Vote: Other 7% (6) 62% (52) 19% (16) 12% (10) 842012 Vote: Didn’t Vote 13% (72) 24% (133) 29% (158) 34% (186) 550
Continued on next page
Page 381
National Tracking Poll #2006102, June, 2020
381
Table POLx_3
Table POLx_3: Favorability forCharles Schumer
Demographic Total Favorable Total UnfavorableHeard Of, NoOpinion Never Heard Of Total N
Registered Voters 26% (518) 37% (734) 21% (417) 16% (318) 19884-Region: Northeast 35% (123) 37% (132) 18% (62) 11% (38) 3554-Region: Midwest 24% (111) 36% (167) 23% (104) 16% (75) 4574-Region: South 21% (157) 40% (299) 21% (160) 17% (127) 7424-Region: West 29% (127) 32% (137) 21% (91) 18% (79) 434Party: Democrat/Leans Democrat 45% (414) 18% (160) 22% (199) 15% (138) 911Party: Republican/Leans Republican 8% (61) 60% (447) 19% (140) 13% (93) 741Parents 25% (216) 39% (340) 21% (182) 15% (126) 864Note: Row proportions may total to larger than one-hundred percent due to rounding. For more information visit MorningConsultIntelligence.com.
Page 382
382
Morning ConsultTable POLx_4
Table POLx_4: Favorability forMike Pence
Demographic Total Favorable Total UnfavorableHeard Of, NoOpinion Never Heard Of Total N
Registered Voters 39% (771) 47% (940) 11% (215) 3% (63) 1988Gender: Male 42% (395) 47% (436) 7% (63) 4% (36) 930Gender: Female 36% (376) 48% (503) 14% (152) 3% (27) 1058Age: 18-34 21% (107) 55% (277) 14% (72) 9% (43) 499Age: 35-44 34% (103) 48% (146) 14% (43) 3% (10) 302Age: 45-64 46% (331) 44% (316) 9% (66) 1% (10) 724Age: 65+ 49% (229) 43% (200) 7% (33) — (0) 463GenZers: 1997-2012 19% (43) 55% (124) 13% (30) 12% (28) 224Millennials: 1981-1996 26% (111) 53% (224) 16% (66) 5% (19) 419GenXers: 1965-1980 40% (205) 47% (238) 11% (54) 3% (14) 511Baby Boomers: 1946-1964 48% (366) 44% (333) 8% (59) — (2) 760PID: Dem (no lean) 13% (99) 77% (581) 8% (64) 2% (13) 757PID: Ind (no lean) 34% (219) 45% (290) 15% (96) 5% (33) 638PID: Rep (no lean) 76% (452) 12% (69) 9% (54) 3% (17) 593PID/Gender: DemMen 14% (45) 78% (256) 7% (24) 1% (5) 329PID/Gender: DemWomen 13% (55) 76% (325) 9% (41) 2% (8) 429PID/Gender: Ind Men 37% (109) 47% (139) 11% (32) 6% (17) 296PID/Gender: Ind Women 32% (110) 44% (152) 19% (64) 5% (16) 342PID/Gender: Rep Men 79% (242) 14% (42) 2% (8) 5% (15) 306PID/Gender: Rep Women 74% (211) 9% (26) 16% (47) 1% (3) 287Ideo: Liberal (1-3) 9% (58) 83% (503) 6% (36) 2% (12) 609Ideo: Moderate (4) 32% (165) 52% (274) 12% (65) 3% (17) 522Ideo: Conservative (5-7) 75% (508) 16% (108) 8% (55) 1% (8) 679Educ: < College 40% (501) 42% (529) 13% (166) 4% (54) 1250Educ: Bachelors degree 34% (160) 57% (266) 7% (35) 2% (9) 470Educ: Post-grad 41% (109) 54% (144) 5% (13) — (1) 267Income: Under 50k 37% (368) 44% (442) 14% (141) 5% (47) 998Income: 50k-100k 42% (276) 49% (323) 7% (49) 2% (11) 660Income: 100k+ 38% (126) 53% (174) 7% (24) 2% (5) 329Ethnicity: White 43% (698) 45% (720) 9% (152) 2% (38) 1608Ethnicity: Hispanic 25% (49) 53% (103) 15% (28) 7% (13) 193
Continued on next page
Page 383
National Tracking Poll #2006102, June, 2020
383
Table POLx_4
Table POLx_4: Favorability forMike Pence
Demographic Total Favorable Total UnfavorableHeard Of, NoOpinion Never Heard Of Total N
Registered Voters 39% (771) 47% (940) 11% (215) 3% (63) 1988Ethnicity: Afr. Am. 18% (47) 58% (145) 18% (44) 6% (16) 252Ethnicity: Other 21% (27) 58% (74) 14% (18) 7% (9) 128All Christian 51% (479) 41% (384) 7% (66) 1% (12) 941All Non-Christian 23% (23) 60% (58) 6% (6) 11% (10) 97Atheist 20% (26) 73% (94) 4% (5) 3% (4) 128Agnostic/Nothing in particular 27% (130) 55% (261) 14% (66) 4% (21) 478Something Else 33% (114) 41% (143) 21% (72) 4% (15) 344Religious Non-Protestant/Catholic 27% (32) 57% (68) 8% (9) 9% (10) 120Evangelical 53% (269) 31% (159) 13% (65) 2% (12) 505Non-Evangelical 41% (307) 48% (356) 9% (68) 2% (15) 746Community: Urban 32% (159) 53% (260) 10% (49) 4% (22) 490Community: Suburban 36% (358) 50% (489) 11% (110) 3% (25) 981Community: Rural 49% (255) 37% (190) 11% (56) 3% (17) 517Employ: Private Sector 39% (246) 52% (328) 6% (40) 3% (17) 631Employ: Government 31% (42) 56% (76) 9% (12) 4% (6) 136Employ: Self-Employed 36% (47) 48% (62) 11% (15) 4% (6) 130Employ: Homemaker 40% (46) 43% (49) 17% (20) 1% (1) 115Employ: Retired 50% (245) 42% (208) 8% (38) — (1) 492Employ: Unemployed 28% (65) 49% (112) 16% (37) 7% (15) 229Employ: Other 37% (57) 35% (54) 20% (31) 7% (11) 152Military HH: Yes 50% (154) 40% (122) 7% (22) 2% (8) 306Military HH: No 37% (616) 49% (817) 11% (193) 3% (55) 1682RD/WT: Right Direction 74% (419) 13% (73) 10% (58) 3% (18) 567RD/WT: Wrong Track 25% (352) 61% (867) 11% (157) 3% (45) 1421Trump Job Approve 80% (615) 9% (67) 9% (67) 3% (24) 774Trump Job Disapprove 12% (141) 75% (865) 10% (117) 3% (30) 1153Trump Job Strongly Approve 89% (367) 3% (14) 6% (25) 2% (9) 415Trump Job Somewhat Approve 69% (248) 15% (53) 12% (43) 4% (15) 359Trump Job Somewhat Disapprove 27% (62) 56% (126) 14% (33) 2% (5) 226Trump Job Strongly Disapprove 9% (80) 80% (738) 9% (84) 3% (25) 927
Continued on next page
Page 384
384
Morning ConsultTable POLx_4
Table POLx_4: Favorability forMike Pence
Demographic Total Favorable Total UnfavorableHeard Of, NoOpinion Never Heard Of Total N
Registered Voters 39% (771) 47% (940) 11% (215) 3% (63) 1988Favorable of Trump 80% (631) 9% (69) 8% (66) 3% (21) 787Unfavorable of Trump 12% (133) 76% (864) 9% (106) 2% (28) 1132Very Favorable of Trump 87% (404) 4% (20) 6% (26) 3% (13) 462Somewhat Favorable of Trump 70% (227) 15% (49) 12% (40) 3% (8) 325Somewhat Unfavorable of Trump 34% (61) 47% (86) 17% (31) 2% (4) 182Very Unfavorable of Trump 8% (72) 82% (779) 8% (76) 3% (24) 950#1 Issue: Economy 43% (297) 43% (294) 11% (78) 3% (19) 688#1 Issue: Security 68% (173) 22% (55) 9% (23) 1% (3) 254#1 Issue: Health Care 27% (92) 60% (202) 9% (30) 3% (11) 335#1 Issue: Medicare / Social Security 38% (107) 48% (136) 12% (34) 2% (6) 283#1 Issue: Women’s Issues 13% (11) 69% (59) 10% (8) 8% (7) 86#1 Issue: Education 25% (26) 53% (57) 15% (16) 7% (8) 107#1 Issue: Energy 24% (19) 60% (47) 11% (9) 5% (4) 79#1 Issue: Other 29% (45) 58% (90) 11% (17) 3% (5) 1572018 House Vote: Democrat 11% (81) 81% (620) 7% (56) 1% (11) 7672018 House Vote: Republican 79% (496) 13% (85) 6% (37) 2% (11) 6292018 House Vote: Someone else 34% (25) 37% (27) 25% (19) 4% (3) 732016 Vote: Hillary Clinton 11% (77) 80% (558) 7% (50) 2% (14) 7002016 Vote: Donald Trump 78% (524) 15% (99) 7% (44) 1% (9) 6752016 Vote: Other 25% (36) 58% (84) 16% (23) 1% (2) 1442016 Vote: Didn’t Vote 29% (134) 42% (198) 21% (97) 8% (37) 466Voted in 2014: Yes 43% (562) 48% (638) 8% (102) 1% (19) 1322Voted in 2014: No 31% (209) 45% (302) 17% (112) 7% (44) 6662012 Vote: Barack Obama 20% (168) 70% (594) 9% (76) 2% (15) 8532012 Vote: Mitt Romney 80% (402) 15% (73) 4% (21) 1% (4) 5012012 Vote: Other 56% (47) 29% (24) 13% (11) 2% (1) 842012 Vote: Didn’t Vote 28% (155) 45% (247) 19% (105) 8% (42) 550
Continued on next page
Page 385
National Tracking Poll #2006102, June, 2020
385
Table POLx_4
Table POLx_4: Favorability forMike Pence
Demographic Total Favorable Total UnfavorableHeard Of, NoOpinion Never Heard Of Total N
Registered Voters 39% (771) 47% (940) 11% (215) 3% (63) 19884-Region: Northeast 40% (142) 47% (167) 11% (38) 2% (8) 3554-Region: Midwest 40% (184) 47% (216) 10% (48) 2% (8) 4574-Region: South 42% (315) 42% (311) 12% (86) 4% (30) 7424-Region: West 30% (129) 57% (246) 10% (43) 4% (16) 434Party: Democrat/Leans Democrat 12% (113) 77% (702) 9% (78) 2% (18) 911Party: Republican/Leans Republican 76% (563) 12% (90) 9% (69) 3% (20) 741Parents 46% (395) 41% (352) 11% (96) 2% (20) 864Note: Row proportions may total to larger than one-hundred percent due to rounding. For more information visit MorningConsultIntelligence.com.
Page 386
386
Morning ConsultTable POLx_5
Table POLx_5: Favorability forDonald Trump
Demographic Total Favorable Total UnfavorableHeard Of, NoOpinion Never Heard Of Total N
Registered Voters 40% (787) 57% (1132) 3% (58) 1% (12) 1988Gender: Male 44% (406) 53% (492) 2% (22) 1% (11) 930Gender: Female 36% (381) 61% (640) 3% (36) — (1) 1058Age: 18-34 24% (120) 70% (348) 4% (22) 2% (9) 499Age: 35-44 39% (117) 55% (165) 6% (18) 1% (2) 302Age: 45-64 46% (334) 52% (377) 2% (13) — (0) 724Age: 65+ 47% (216) 52% (242) 1% (4) — (0) 463GenZers: 1997-2012 19% (43) 74% (165) 5% (12) 2% (4) 224Millennials: 1981-1996 32% (133) 62% (261) 5% (20) 1% (5) 419GenXers: 1965-1980 43% (221) 54% (274) 3% (14) — (2) 511Baby Boomers: 1946-1964 46% (346) 53% (403) 2% (11) — (0) 760PID: Dem (no lean) 7% (52) 91% (692) 2% (12) — (1) 757PID: Ind (no lean) 37% (236) 56% (358) 6% (36) 1% (7) 638PID: Rep (no lean) 84% (499) 14% (82) 2% (9) — (3) 593PID/Gender: DemMen 8% (27) 90% (295) 2% (5) — (1) 329PID/Gender: DemWomen 6% (25) 92% (396) 2% (7) — (0) 429PID/Gender: Ind Men 41% (122) 52% (154) 5% (14) 2% (7) 296PID/Gender: Ind Women 33% (114) 60% (205) 7% (22) — (1) 342PID/Gender: Rep Men 84% (257) 14% (43) 1% (3) 1% (3) 306PID/Gender: Rep Women 84% (242) 14% (39) 2% (6) — (0) 287Ideo: Liberal (1-3) 8% (49) 90% (551) 1% (6) 1% (3) 609Ideo: Moderate (4) 29% (150) 67% (348) 4% (23) — (2) 522Ideo: Conservative (5-7) 79% (534) 20% (136) 1% (7) — (2) 679Educ: < College 43% (537) 53% (658) 4% (46) 1% (9) 1250Educ: Bachelors degree 33% (154) 65% (306) 2% (9) — (2) 470Educ: Post-grad 36% (96) 63% (168) 1% (3) — (1) 267Income: Under 50k 39% (394) 56% (558) 4% (40) 1% (6) 998Income: 50k-100k 41% (273) 56% (372) 2% (12) — (3) 660Income: 100k+ 36% (120) 61% (202) 2% (6) 1% (2) 329Ethnicity: White 46% (740) 51% (823) 2% (35) 1% (10) 1608Ethnicity: Hispanic 21% (40) 73% (141) 5% (10) 1% (1) 193
Continued on next page
Page 387
National Tracking Poll #2006102, June, 2020
387
Table POLx_5
Table POLx_5: Favorability forDonald Trump
Demographic Total Favorable Total UnfavorableHeard Of, NoOpinion Never Heard Of Total N
Registered Voters 40% (787) 57% (1132) 3% (58) 1% (12) 1988Ethnicity: Afr. Am. 8% (21) 85% (215) 6% (16) — (1) 252Ethnicity: Other 21% (27) 73% (94) 6% (7) — (0) 128All Christian 48% (449) 50% (470) 2% (16) 1% (6) 941All Non-Christian 26% (26) 71% (69) 1% (1) 2% (2) 97Atheist 17% (22) 78% (100) 5% (6) — (0) 128Agnostic/Nothing in particular 32% (151) 65% (310) 3% (15) — (2) 478Something Else 41% (139) 53% (183) 6% (20) — (1) 344Religious Non-Protestant/Catholic 28% (34) 70% (83) 1% (1) 2% (2) 120Evangelical 54% (274) 41% (207) 4% (21) 1% (4) 505Non-Evangelical 41% (302) 57% (425) 2% (15) — (3) 746Community: Urban 31% (151) 64% (314) 4% (21) 1% (4) 490Community: Suburban 37% (363) 60% (590) 2% (23) 1% (5) 981Community: Rural 53% (273) 44% (228) 3% (13) 1% (3) 517Employ: Private Sector 40% (252) 58% (363) 2% (11) 1% (4) 631Employ: Government 31% (42) 67% (91) 1% (2) — (0) 136Employ: Self-Employed 39% (50) 58% (76) 2% (3) 1% (1) 130Employ: Homemaker 43% (49) 51% (59) 6% (7) — (0) 115Employ: Retired 48% (235) 52% (253) 1% (4) — (0) 492Employ: Unemployed 34% (77) 59% (135) 6% (13) 2% (4) 229Employ: Other 40% (61) 54% (81) 6% (9) 1% (1) 152Military HH: Yes 49% (149) 49% (150) 1% (4) 1% (2) 306Military HH: No 38% (638) 58% (981) 3% (53) 1% (10) 1682RD/WT: Right Direction 82% (464) 16% (88) 2% (11) 1% (5) 567RD/WT: Wrong Track 23% (323) 73% (1044) 3% (47) — (7) 1421Trump Job Approve 94% (729) 4% (30) 1% (10) 1% (4) 774Trump Job Disapprove 4% (48) 94% (1088) 1% (14) — (3) 1153Trump Job Strongly Approve 97% (404) 2% (7) — (2) 1% (2) 415Trump Job Somewhat Approve 91% (325) 7% (24) 2% (8) 1% (2) 359Trump Job Somewhat Disapprove 12% (28) 87% (196) 1% (2) — (0) 226Trump Job Strongly Disapprove 2% (20) 96% (892) 1% (12) — (3) 927
Continued on next page
Page 388
388
Morning ConsultTable POLx_5
Table POLx_5: Favorability forDonald Trump
Demographic Total Favorable Total UnfavorableHeard Of, NoOpinion Never Heard Of Total N
Registered Voters 40% (787) 57% (1132) 3% (58) 1% (12) 1988Favorable of Trump 100% (787) — (0) — (0) — (0) 787Unfavorable of Trump — (0) 100% (1132) — (0) — (0) 1132Very Favorable of Trump 100% (462) — (0) — (0) — (0) 462Somewhat Favorable of Trump 100% (325) — (0) — (0) — (0) 325Somewhat Unfavorable of Trump — (0) 100% (182) — (0) — (0) 182Very Unfavorable of Trump — (0) 100% (950) — (0) — (0) 950#1 Issue: Economy 46% (316) 50% (344) 4% (24) — (3) 688#1 Issue: Security 73% (185) 24% (62) 2% (5) 1% (2) 254#1 Issue: Health Care 26% (86) 73% (244) 1% (5) — (0) 335#1 Issue: Medicare / Social Security 36% (103) 61% (174) 2% (6) — (1) 283#1 Issue: Women’s Issues 12% (10) 84% (72) 1% (1) 3% (3) 86#1 Issue: Education 35% (37) 61% (65) 3% (3) 1% (1) 107#1 Issue: Energy 15% (12) 78% (62) 6% (5) 1% (1) 79#1 Issue: Other 24% (37) 70% (109) 6% (9) 1% (2) 1572018 House Vote: Democrat 6% (48) 93% (712) 1% (7) — (1) 7672018 House Vote: Republican 83% (521) 16% (100) 1% (5) — (3) 6292018 House Vote: Someone else 33% (24) 58% (42) 8% (6) 1% (1) 732016 Vote: Hillary Clinton 5% (34) 94% (657) 1% (8) — (0) 7002016 Vote: Donald Trump 84% (564) 15% (104) 1% (5) — (1) 6752016 Vote: Other 24% (35) 70% (101) 5% (8) — (1) 1442016 Vote: Didn’t Vote 33% (154) 58% (268) 8% (36) 2% (8) 466Voted in 2014: Yes 41% (544) 57% (750) 2% (25) — (3) 1322Voted in 2014: No 36% (243) 57% (382) 5% (33) 1% (9) 6662012 Vote: Barack Obama 17% (144) 81% (690) 2% (15) — (4) 8532012 Vote: Mitt Romney 80% (399) 19% (97) 1% (4) — (1) 5012012 Vote: Other 60% (50) 34% (28) 6% (5) 1% (1) 842012 Vote: Didn’t Vote 35% (194) 57% (316) 6% (34) 1% (6) 550
Continued on next page
Page 389
National Tracking Poll #2006102, June, 2020
389
Table POLx_5
Table POLx_5: Favorability forDonald Trump
Demographic Total Favorable Total UnfavorableHeard Of, NoOpinion Never Heard Of Total N
Registered Voters 40% (787) 57% (1132) 3% (58) 1% (12) 19884-Region: Northeast 36% (126) 60% (214) 3% (12) 1% (2) 3554-Region: Midwest 41% (188) 55% (252) 3% (16) — (1) 4574-Region: South 45% (331) 52% (387) 3% (21) — (4) 7424-Region: West 33% (142) 64% (278) 2% (9) 1% (5) 434Party: Democrat/Leans Democrat 7% (60) 92% (836) 1% (13) — (1) 911Party: Republican/Leans Republican 84% (619) 14% (104) 2% (15) — (3) 741Parents 46% (400) 51% (438) 3% (22) — (3) 864Note: Row proportions may total to larger than one-hundred percent due to rounding. For more information visit MorningConsultIntelligence.com.
Page 390
390
Morning ConsultTable POLx_6
Table POLx_6: Favorability forRepublicans in Congress
Demographic Total Favorable Total UnfavorableHeard Of, NoOpinion Never Heard Of Total N
Registered Voters 34% (684) 54% (1072) 10% (196) 2% (36) 1988Gender: Male 37% (347) 54% (500) 7% (66) 2% (17) 930Gender: Female 32% (337) 54% (572) 12% (130) 2% (19) 1058Age: 18-34 21% (106) 57% (286) 17% (86) 4% (21) 499Age: 35-44 31% (93) 56% (169) 11% (33) 3% (8) 302Age: 45-64 41% (295) 51% (366) 8% (56) 1% (7) 724Age: 65+ 41% (191) 54% (252) 4% (20) — (0) 463GenZers: 1997-2012 18% (40) 53% (119) 22% (49) 7% (16) 224Millennials: 1981-1996 26% (109) 58% (245) 14% (59) 2% (7) 419GenXers: 1965-1980 37% (192) 53% (270) 7% (38) 2% (11) 511Baby Boomers: 1946-1964 40% (307) 53% (404) 6% (47) — (2) 760PID: Dem (no lean) 7% (50) 83% (632) 8% (64) 2% (12) 757PID: Ind (no lean) 27% (174) 54% (346) 16% (101) 3% (17) 638PID: Rep (no lean) 78% (460) 16% (94) 5% (31) 1% (7) 593PID/Gender: DemMen 7% (22) 84% (278) 8% (27) 1% (2) 329PID/Gender: DemWomen 7% (28) 83% (355) 9% (37) 2% (9) 429PID/Gender: Ind Men 30% (88) 57% (170) 10% (30) 3% (9) 296PID/Gender: Ind Women 25% (87) 52% (176) 21% (71) 2% (8) 342PID/Gender: Rep Men 78% (238) 17% (53) 3% (9) 2% (5) 306PID/Gender: Rep Women 78% (223) 14% (41) 8% (22) 1% (2) 287Ideo: Liberal (1-3) 9% (55) 84% (513) 6% (35) 1% (5) 609Ideo: Moderate (4) 26% (136) 59% (308) 14% (71) 2% (8) 522Ideo: Conservative (5-7) 68% (459) 27% (185) 5% (31) 1% (4) 679Educ: < College 36% (449) 49% (610) 13% (165) 2% (26) 1250Educ: Bachelors degree 33% (154) 61% (287) 5% (23) 1% (7) 470Educ: Post-grad 30% (81) 66% (176) 3% (8) 1% (3) 267Income: Under 50k 33% (329) 51% (511) 14% (136) 2% (23) 998Income: 50k-100k 38% (249) 55% (366) 6% (38) 1% (7) 660Income: 100k+ 32% (106) 60% (196) 6% (21) 2% (6) 329Ethnicity: White 39% (632) 51% (821) 8% (134) 1% (20) 1608Ethnicity: Hispanic 29% (56) 52% (101) 18% (35) — (1) 193
Continued on next page
Page 391
National Tracking Poll #2006102, June, 2020
391
Table POLx_6
Table POLx_6: Favorability forRepublicans in Congress
Demographic Total Favorable Total UnfavorableHeard Of, NoOpinion Never Heard Of Total N
Registered Voters 34% (684) 54% (1072) 10% (196) 2% (36) 1988Ethnicity: Afr. Am. 9% (22) 71% (178) 15% (39) 5% (13) 252Ethnicity: Other 23% (30) 57% (73) 18% (23) 2% (3) 128All Christian 43% (404) 49% (465) 7% (66) 1% (6) 941All Non-Christian 26% (25) 64% (62) 6% (6) 5% (4) 97Atheist 18% (23) 71% (91) 9% (12) 1% (1) 128Agnostic/Nothing in particular 24% (114) 61% (292) 12% (55) 4% (17) 478Something Else 34% (118) 47% (162) 17% (57) 2% (7) 344Religious Non-Protestant/Catholic 30% (36) 62% (74) 5% (6) 4% (4) 120Evangelical 47% (238) 40% (201) 12% (59) 1% (7) 505Non-Evangelical 36% (269) 55% (408) 8% (62) 1% (6) 746Community: Urban 27% (132) 60% (292) 11% (55) 2% (11) 490Community: Suburban 33% (321) 56% (553) 10% (94) 1% (14) 981Community: Rural 45% (231) 44% (228) 9% (47) 2% (11) 517Employ: Private Sector 36% (226) 57% (360) 5% (35) 2% (10) 631Employ: Government 31% (43) 61% (83) 5% (7) 2% (2) 136Employ: Self-Employed 29% (38) 58% (75) 10% (13) 4% (5) 130Employ: Homemaker 34% (39) 43% (50) 22% (25) 1% (1) 115Employ: Retired 42% (205) 53% (260) 6% (27) — (0) 492Employ: Unemployed 27% (62) 51% (117) 17% (40) 5% (11) 229Employ: Other 34% (51) 46% (70) 18% (27) 2% (4) 152Military HH: Yes 40% (122) 54% (166) 6% (17) — (1) 306Military HH: No 33% (563) 54% (906) 11% (179) 2% (35) 1682RD/WT: Right Direction 69% (391) 20% (116) 8% (47) 2% (13) 567RD/WT: Wrong Track 21% (294) 67% (956) 10% (148) 2% (22) 1421Trump Job Approve 74% (576) 17% (135) 7% (52) 1% (11) 774Trump Job Disapprove 9% (98) 81% (930) 9% (107) 2% (18) 1153Trump Job Strongly Approve 84% (348) 12% (50) 3% (12) 1% (5) 415Trump Job Somewhat Approve 63% (228) 24% (85) 11% (40) 2% (6) 359Trump Job Somewhat Disapprove 21% (47) 65% (147) 13% (29) 2% (4) 226Trump Job Strongly Disapprove 6% (52) 84% (783) 8% (78) 2% (14) 927
Continued on next page
Page 392
392
Morning ConsultTable POLx_6
Table POLx_6: Favorability forRepublicans in Congress
Demographic Total Favorable Total UnfavorableHeard Of, NoOpinion Never Heard Of Total N
Registered Voters 34% (684) 54% (1072) 10% (196) 2% (36) 1988Favorable of Trump 75% (591) 18% (140) 6% (48) 1% (8) 787Unfavorable of Trump 8% (87) 82% (923) 9% (103) 2% (19) 1132Very Favorable of Trump 84% (389) 12% (54) 3% (16) 1% (3) 462Somewhat Favorable of Trump 62% (201) 26% (86) 10% (33) 2% (5) 325Somewhat Unfavorable of Trump 22% (40) 63% (115) 13% (23) 2% (3) 182Very Unfavorable of Trump 5% (46) 85% (808) 8% (80) 2% (16) 950#1 Issue: Economy 39% (269) 49% (340) 10% (69) 1% (10) 688#1 Issue: Security 64% (161) 30% (77) 6% (14) 1% (2) 254#1 Issue: Health Care 22% (75) 65% (218) 11% (37) 1% (5) 335#1 Issue: Medicare / Social Security 32% (90) 57% (162) 9% (25) 2% (6) 283#1 Issue: Women’s Issues 13% (11) 76% (66) 7% (6) 4% (3) 86#1 Issue: Education 34% (36) 44% (47) 19% (20) 3% (3) 107#1 Issue: Energy 14% (11) 74% (59) 10% (8) 2% (1) 79#1 Issue: Other 19% (30) 66% (103) 11% (16) 4% (6) 1572018 House Vote: Democrat 7% (57) 86% (663) 5% (38) 1% (9) 7672018 House Vote: Republican 73% (460) 22% (140) 4% (24) 1% (5) 6292018 House Vote: Someone else 17% (12) 62% (46) 19% (14) 2% (2) 732016 Vote: Hillary Clinton 7% (49) 85% (597) 6% (42) 2% (11) 7002016 Vote: Donald Trump 69% (468) 26% (172) 4% (27) 1% (8) 6752016 Vote: Other 25% (35) 61% (89) 14% (20) — (1) 1442016 Vote: Didn’t Vote 28% (130) 46% (213) 23% (107) 4% (17) 466Voted in 2014: Yes 36% (477) 57% (755) 6% (75) 1% (15) 1322Voted in 2014: No 31% (207) 48% (318) 18% (121) 3% (21) 6662012 Vote: Barack Obama 15% (132) 76% (650) 7% (59) 1% (11) 8532012 Vote: Mitt Romney 71% (356) 26% (130) 2% (11) 1% (3) 5012012 Vote: Other 36% (30) 49% (41) 11% (10) 4% (3) 842012 Vote: Didn’t Vote 30% (166) 45% (250) 21% (115) 3% (18) 550
Continued on next page
Page 393
National Tracking Poll #2006102, June, 2020
393
Table POLx_6
Table POLx_6: Favorability forRepublicans in Congress
Demographic Total Favorable Total UnfavorableHeard Of, NoOpinion Never Heard Of Total N
Registered Voters 34% (684) 54% (1072) 10% (196) 2% (36) 19884-Region: Northeast 33% (118) 54% (192) 12% (43) 1% (2) 3554-Region: Midwest 33% (152) 53% (242) 12% (54) 2% (9) 4574-Region: South 40% (297) 49% (363) 9% (64) 2% (18) 7424-Region: West 27% (116) 63% (276) 8% (35) 2% (7) 434Party: Democrat/Leans Democrat 6% (58) 84% (768) 8% (73) 1% (12) 911Party: Republican/Leans Republican 76% (560) 18% (131) 6% (41) 1% (9) 741Parents 40% (349) 49% (419) 9% (81) 2% (14) 864Note: Row proportions may total to larger than one-hundred percent due to rounding. For more information visit MorningConsultIntelligence.com.
Page 394
394
Morning ConsultTable POLx_7
Table POLx_7: Favorability forDemocrats in Congress
Demographic Total Favorable Total UnfavorableHeard Of, NoOpinion Never Heard Of Total N
Registered Voters 45% (898) 45% (896) 8% (161) 2% (33) 1988Gender: Male 42% (394) 50% (461) 6% (57) 2% (18) 930Gender: Female 48% (504) 41% (435) 10% (104) 1% (15) 1058Age: 18-34 52% (260) 29% (147) 14% (72) 4% (20) 499Age: 35-44 44% (133) 44% (132) 10% (30) 2% (7) 302Age: 45-64 44% (317) 49% (357) 6% (44) 1% (6) 724Age: 65+ 40% (187) 56% (260) 3% (15) — (0) 463GenZers: 1997-2012 48% (107) 25% (56) 21% (46) 7% (15) 224Millennials: 1981-1996 51% (215) 36% (153) 11% (45) 1% (6) 419GenXers: 1965-1980 46% (237) 46% (233) 6% (32) 2% (9) 511Baby Boomers: 1946-1964 41% (314) 54% (408) 5% (35) — (2) 760PID: Dem (no lean) 86% (652) 8% (61) 5% (39) 1% (6) 757PID: Ind (no lean) 30% (193) 54% (342) 13% (86) 3% (17) 638PID: Rep (no lean) 9% (52) 83% (494) 6% (37) 2% (10) 593PID/Gender: DemMen 83% (273) 10% (33) 6% (21) 1% (2) 329PID/Gender: DemWomen 89% (379) 7% (28) 4% (17) 1% (4) 429PID/Gender: Ind Men 28% (83) 61% (179) 8% (25) 3% (9) 296PID/Gender: Ind Women 32% (110) 48% (162) 18% (61) 2% (8) 342PID/Gender: Rep Men 13% (39) 81% (249) 3% (10) 2% (7) 306PID/Gender: Rep Women 5% (14) 85% (245) 9% (26) 1% (3) 287Ideo: Liberal (1-3) 82% (500) 12% (75) 5% (28) 1% (5) 609Ideo: Moderate (4) 45% (233) 41% (217) 12% (64) 2% (8) 522Ideo: Conservative (5-7) 15% (101) 81% (549) 4% (25) 1% (4) 679Educ: < College 40% (505) 47% (588) 11% (134) 2% (23) 1250Educ: Bachelors degree 52% (244) 43% (201) 4% (17) 2% (8) 470Educ: Post-grad 56% (149) 40% (107) 4% (10) 1% (2) 267Income: Under 50k 45% (451) 43% (424) 10% (104) 2% (19) 998Income: 50k-100k 44% (288) 50% (327) 6% (38) 1% (7) 660Income: 100k+ 48% (159) 44% (145) 6% (19) 2% (7) 329Ethnicity: White 41% (657) 51% (816) 7% (110) 2% (24) 1608Ethnicity: Hispanic 55% (106) 31% (60) 13% (25) 1% (1) 193
Continued on next page
Page 395
National Tracking Poll #2006102, June, 2020
395
Table POLx_7
Table POLx_7: Favorability forDemocrats in Congress
Demographic Total Favorable Total UnfavorableHeard Of, NoOpinion Never Heard Of Total N
Registered Voters 45% (898) 45% (896) 8% (161) 2% (33) 1988Ethnicity: Afr. Am. 69% (175) 16% (39) 12% (31) 3% (7) 252Ethnicity: Other 51% (66) 32% (41) 16% (20) 1% (1) 128All Christian 41% (382) 54% (504) 5% (50) 1% (5) 941All Non-Christian 69% (67) 22% (21) 5% (5) 5% (4) 97Atheist 58% (75) 30% (38) 11% (14) 1% (1) 128Agnostic/Nothing in particular 47% (224) 40% (192) 10% (47) 3% (16) 478Something Else 44% (150) 41% (142) 13% (46) 2% (6) 344Religious Non-Protestant/Catholic 62% (74) 29% (34) 6% (7) 4% (4) 120Evangelical 34% (173) 56% (283) 9% (44) 1% (5) 505Non-Evangelical 46% (344) 46% (347) 7% (49) 1% (6) 746Community: Urban 56% (273) 33% (163) 9% (44) 2% (10) 490Community: Suburban 46% (452) 44% (433) 9% (84) 1% (11) 981Community: Rural 33% (172) 58% (300) 7% (34) 2% (11) 517Employ: Private Sector 46% (293) 48% (302) 4% (28) 1% (8) 631Employ: Government 51% (69) 43% (58) 5% (7) 1% (1) 136Employ: Self-Employed 49% (64) 37% (48) 10% (13) 4% (6) 130Employ: Homemaker 35% (40) 46% (52) 18% (20) 2% (2) 115Employ: Retired 42% (205) 54% (266) 4% (21) — (0) 492Employ: Unemployed 48% (109) 35% (81) 14% (31) 3% (8) 229Employ: Other 43% (65) 41% (63) 13% (19) 3% (4) 152Military HH: Yes 38% (116) 58% (177) 3% (10) 1% (3) 306Military HH: No 46% (782) 43% (719) 9% (151) 2% (30) 1682RD/WT: Right Direction 18% (104) 72% (410) 7% (40) 2% (14) 567RD/WT: Wrong Track 56% (794) 34% (487) 9% (121) 1% (19) 1421Trump Job Approve 12% (93) 81% (625) 5% (41) 2% (15) 774Trump Job Disapprove 69% (798) 22% (255) 8% (89) 1% (12) 1153Trump Job Strongly Approve 8% (33) 87% (362) 3% (13) 2% (7) 415Trump Job Somewhat Approve 17% (60) 73% (263) 8% (27) 2% (8) 359Trump Job Somewhat Disapprove 45% (101) 44% (100) 9% (21) 2% (4) 226Trump Job Strongly Disapprove 75% (697) 17% (155) 7% (68) 1% (7) 927
Continued on next page
Page 396
396
Morning ConsultTable POLx_7
Table POLx_7: Favorability forDemocrats in Congress
Demographic Total Favorable Total UnfavorableHeard Of, NoOpinion Never Heard Of Total N
Registered Voters 45% (898) 45% (896) 8% (161) 2% (33) 1988Favorable of Trump 13% (105) 80% (631) 5% (41) 1% (10) 787Unfavorable of Trump 69% (781) 22% (250) 8% (88) 1% (13) 1132Very Favorable of Trump 9% (43) 86% (398) 4% (17) 1% (3) 462Somewhat Favorable of Trump 19% (62) 72% (232) 7% (24) 2% (7) 325Somewhat Unfavorable of Trump 38% (69) 50% (91) 10% (19) 2% (3) 182Very Unfavorable of Trump 75% (713) 17% (158) 7% (70) 1% (9) 950#1 Issue: Economy 43% (293) 50% (341) 7% (46) 1% (8) 688#1 Issue: Security 17% (44) 77% (195) 5% (13) 1% (3) 254#1 Issue: Health Care 59% (198) 30% (101) 10% (33) 1% (3) 335#1 Issue: Medicare / Social Security 49% (138) 42% (119) 7% (21) 2% (5) 283#1 Issue: Women’s Issues 58% (50) 20% (17) 18% (15) 4% (4) 86#1 Issue: Education 53% (56) 33% (36) 11% (11) 4% (4) 107#1 Issue: Energy 67% (53) 20% (16) 10% (8) 2% (1) 79#1 Issue: Other 42% (66) 45% (71) 9% (14) 3% (5) 1572018 House Vote: Democrat 83% (635) 14% (104) 3% (25) 1% (4) 7672018 House Vote: Republican 10% (62) 85% (536) 4% (24) 1% (8) 6292018 House Vote: Someone else 13% (9) 69% (50) 16% (12) 2% (2) 732016 Vote: Hillary Clinton 84% (590) 11% (77) 4% (29) 1% (4) 7002016 Vote: Donald Trump 11% (73) 84% (570) 4% (25) 1% (8) 6752016 Vote: Other 32% (46) 57% (82) 11% (16) — (1) 1442016 Vote: Didn’t Vote 41% (189) 36% (167) 20% (91) 4% (19) 466Voted in 2014: Yes 47% (618) 48% (634) 4% (58) 1% (12) 1322Voted in 2014: No 42% (280) 39% (263) 15% (103) 3% (21) 6662012 Vote: Barack Obama 72% (610) 24% (202) 4% (34) 1% (7) 8532012 Vote: Mitt Romney 10% (51) 85% (428) 4% (18) 1% (4) 5012012 Vote: Other 11% (9) 75% (63) 10% (8) 4% (3) 842012 Vote: Didn’t Vote 41% (227) 37% (204) 18% (100) 3% (19) 550
Continued on next page
Page 397
National Tracking Poll #2006102, June, 2020
397
Table POLx_7
Table POLx_7: Favorability forDemocrats in Congress
Demographic Total Favorable Total UnfavorableHeard Of, NoOpinion Never Heard Of Total N
Registered Voters 45% (898) 45% (896) 8% (161) 2% (33) 19884-Region: Northeast 48% (172) 41% (145) 10% (36) 1% (3) 3554-Region: Midwest 43% (194) 47% (214) 9% (42) 1% (6) 4574-Region: South 42% (310) 49% (363) 7% (54) 2% (16) 7424-Region: West 51% (222) 40% (175) 7% (29) 2% (8) 434Party: Democrat/Leans Democrat 84% (764) 11% (99) 5% (43) 1% (6) 911Party: Republican/Leans Republican 9% (67) 84% (620) 6% (41) 2% (12) 741Parents 42% (361) 49% (426) 7% (64) 1% (13) 864Note: Row proportions may total to larger than one-hundred percent due to rounding. For more information visit MorningConsultIntelligence.com.
Page 398
398
Morning ConsultTable POLx_8
Table POLx_8: Favorability forKevin McCarthy
Demographic Total Favorable Total UnfavorableHeard Of, NoOpinion Never Heard Of Total N
Registered Voters 17% (345) 25% (495) 31% (626) 26% (522) 1988Gender: Male 23% (219) 33% (304) 25% (229) 19% (179) 930Gender: Female 12% (126) 18% (191) 38% (398) 32% (343) 1058Age: 18-34 9% (46) 19% (97) 31% (155) 40% (202) 499Age: 35-44 15% (47) 27% (82) 29% (87) 29% (86) 302Age: 45-64 19% (141) 26% (189) 30% (221) 24% (174) 724Age: 65+ 24% (111) 28% (127) 35% (164) 13% (60) 463GenZers: 1997-2012 8% (18) 14% (32) 32% (71) 46% (103) 224Millennials: 1981-1996 11% (47) 24% (99) 30% (126) 35% (147) 419GenXers: 1965-1980 18% (94) 25% (126) 30% (154) 27% (138) 511Baby Boomers: 1946-1964 22% (165) 29% (224) 32% (247) 16% (124) 760PID: Dem (no lean) 9% (69) 32% (243) 32% (241) 27% (205) 757PID: Ind (no lean) 12% (78) 26% (168) 31% (195) 31% (196) 638PID: Rep (no lean) 33% (198) 14% (84) 32% (191) 20% (120) 593PID/Gender: DemMen 11% (37) 43% (140) 27% (90) 19% (61) 329PID/Gender: DemWomen 7% (31) 24% (103) 35% (150) 34% (144) 429PID/Gender: Ind Men 17% (49) 36% (106) 23% (69) 24% (72) 296PID/Gender: Ind Women 8% (29) 18% (62) 37% (126) 36% (125) 342PID/Gender: Rep Men 43% (132) 19% (58) 23% (69) 15% (46) 306PID/Gender: Rep Women 23% (66) 9% (26) 42% (121) 26% (74) 287Ideo: Liberal (1-3) 10% (60) 37% (223) 29% (179) 24% (146) 609Ideo: Moderate (4) 9% (45) 27% (143) 37% (191) 27% (143) 522Ideo: Conservative (5-7) 34% (232) 17% (115) 29% (197) 20% (136) 679Educ: < College 17% (212) 21% (260) 34% (420) 29% (359) 1250Educ: Bachelors degree 16% (76) 30% (143) 29% (139) 24% (112) 470Educ: Post-grad 21% (57) 34% (92) 25% (67) 19% (51) 267Income: Under 50k 16% (163) 21% (206) 34% (342) 29% (288) 998Income: 50k-100k 18% (118) 30% (195) 29% (194) 23% (154) 660Income: 100k+ 20% (64) 29% (94) 27% (90) 24% (81) 329Ethnicity: White 19% (302) 26% (414) 32% (508) 24% (384) 1608Ethnicity: Hispanic 15% (29) 16% (31) 33% (63) 36% (69) 193
Continued on next page
Page 399
National Tracking Poll #2006102, June, 2020
399
Table POLx_8
Table POLx_8: Favorability forKevin McCarthy
Demographic Total Favorable Total UnfavorableHeard Of, NoOpinion Never Heard Of Total N
Registered Voters 17% (345) 25% (495) 31% (626) 26% (522) 1988Ethnicity: Afr. Am. 13% (32) 21% (52) 32% (80) 35% (88) 252Ethnicity: Other 9% (11) 23% (29) 29% (37) 39% (50) 128All Christian 22% (210) 23% (220) 32% (297) 23% (213) 941All Non-Christian 20% (19) 31% (30) 24% (24) 25% (24) 97Atheist 10% (13) 46% (59) 26% (34) 18% (22) 128Agnostic/Nothing in particular 10% (50) 28% (134) 33% (160) 28% (135) 478Something Else 15% (53) 15% (52) 33% (112) 37% (127) 344Religious Non-Protestant/Catholic 18% (22) 26% (32) 31% (37) 25% (29) 120Evangelical 24% (122) 17% (85) 34% (170) 25% (129) 505Non-Evangelical 18% (137) 25% (185) 30% (222) 27% (202) 746Community: Urban 18% (87) 26% (128) 28% (139) 28% (136) 490Community: Suburban 17% (164) 25% (249) 32% (315) 26% (253) 981Community: Rural 18% (94) 23% (118) 33% (172) 26% (133) 517Employ: Private Sector 20% (124) 30% (192) 27% (170) 23% (145) 631Employ: Government 17% (23) 27% (37) 29% (39) 27% (37) 136Employ: Self-Employed 11% (14) 26% (33) 39% (51) 24% (32) 130Employ: Homemaker 10% (12) 13% (15) 31% (36) 45% (52) 115Employ: Retired 25% (123) 27% (135) 34% (168) 14% (67) 492Employ: Unemployed 14% (31) 20% (45) 29% (67) 38% (87) 229Employ: Other 9% (14) 17% (27) 40% (60) 34% (52) 152Military HH: Yes 26% (79) 29% (89) 25% (78) 20% (60) 306Military HH: No 16% (265) 24% (406) 33% (549) 27% (462) 1682RD/WT: Right Direction 37% (207) 13% (76) 30% (169) 20% (115) 567RD/WT: Wrong Track 10% (138) 30% (420) 32% (457) 29% (406) 1421Trump Job Approve 34% (266) 14% (107) 31% (241) 21% (159) 774Trump Job Disapprove 7% (76) 33% (383) 31% (363) 29% (331) 1153Trump Job Strongly Approve 43% (179) 12% (51) 29% (119) 16% (66) 415Trump Job Somewhat Approve 24% (87) 16% (56) 34% (122) 26% (94) 359Trump Job Somewhat Disapprove 9% (19) 24% (55) 34% (76) 33% (75) 226Trump Job Strongly Disapprove 6% (57) 35% (327) 31% (287) 28% (256) 927
Continued on next page
Page 400
400
Morning ConsultTable POLx_8
Table POLx_8: Favorability forKevin McCarthy
Demographic Total Favorable Total UnfavorableHeard Of, NoOpinion Never Heard Of Total N
Registered Voters 17% (345) 25% (495) 31% (626) 26% (522) 1988Favorable of Trump 35% (275) 14% (110) 30% (237) 21% (165) 787Unfavorable of Trump 6% (68) 34% (381) 32% (358) 29% (325) 1132Very Favorable of Trump 43% (200) 13% (58) 28% (131) 16% (73) 462Somewhat Favorable of Trump 23% (75) 16% (52) 33% (106) 28% (92) 325Somewhat Unfavorable of Trump 8% (14) 25% (45) 36% (65) 32% (58) 182Very Unfavorable of Trump 6% (54) 35% (336) 31% (292) 28% (268) 950#1 Issue: Economy 21% (143) 23% (155) 30% (209) 26% (181) 688#1 Issue: Security 33% (85) 17% (44) 32% (80) 18% (45) 254#1 Issue: Health Care 10% (34) 35% (119) 32% (108) 22% (74) 335#1 Issue: Medicare / Social Security 14% (39) 23% (66) 41% (115) 22% (63) 283#1 Issue: Women’s Issues 7% (6) 26% (22) 24% (21) 43% (37) 86#1 Issue: Education 12% (13) 16% (17) 32% (34) 41% (43) 107#1 Issue: Energy 9% (7) 27% (21) 24% (19) 39% (31) 79#1 Issue: Other 11% (18) 33% (51) 25% (40) 30% (47) 1572018 House Vote: Democrat 8% (60) 37% (288) 31% (237) 24% (182) 7672018 House Vote: Republican 36% (229) 17% (104) 27% (173) 20% (123) 6292018 House Vote: Someone else 5% (3) 36% (26) 35% (25) 25% (18) 732016 Vote: Hillary Clinton 10% (67) 37% (258) 29% (201) 25% (174) 7002016 Vote: Donald Trump 34% (232) 18% (120) 28% (188) 20% (135) 6752016 Vote: Other 6% (8) 29% (43) 38% (55) 27% (38) 1442016 Vote: Didn’t Vote 8% (36) 16% (73) 39% (183) 37% (174) 466Voted in 2014: Yes 21% (275) 29% (385) 29% (382) 21% (279) 1322Voted in 2014: No 10% (70) 17% (111) 37% (244) 36% (242) 6662012 Vote: Barack Obama 10% (83) 35% (297) 31% (261) 25% (212) 8532012 Vote: Mitt Romney 38% (192) 17% (87) 27% (135) 17% (87) 5012012 Vote: Other 12% (10) 29% (24) 32% (27) 27% (23) 842012 Vote: Didn’t Vote 11% (60) 16% (87) 37% (202) 36% (200) 550
Continued on next page
Page 401
National Tracking Poll #2006102, June, 2020
401
Table POLx_8
Table POLx_8: Favorability forKevin McCarthy
Demographic Total Favorable Total UnfavorableHeard Of, NoOpinion Never Heard Of Total N
Registered Voters 17% (345) 25% (495) 31% (626) 26% (522) 19884-Region: Northeast 17% (60) 28% (101) 30% (108) 24% (86) 3554-Region: Midwest 17% (77) 23% (105) 35% (159) 25% (115) 4574-Region: South 18% (135) 23% (170) 32% (237) 27% (200) 7424-Region: West 17% (73) 27% (119) 28% (122) 28% (120) 434Party: Democrat/Leans Democrat 8% (75) 33% (299) 32% (290) 27% (246) 911Party: Republican/Leans Republican 32% (236) 15% (114) 32% (235) 21% (156) 741Parents 20% (177) 23% (197) 30% (256) 27% (234) 864Note: Row proportions may total to larger than one-hundred percent due to rounding. For more information visit MorningConsultIntelligence.com.
Page 402
402
Morning ConsultTable POLx_9
Table POLx_9: Favorability forJoe Biden
Demographic Total Favorable Total UnfavorableHeard Of, NoOpinion Never Heard Of Total N
Registered Voters 45% (894) 47% (936) 7% (138) 1% (20) 1988Gender: Male 42% (391) 51% (474) 6% (53) 1% (13) 930Gender: Female 48% (503) 44% (462) 8% (86) 1% (6) 1058Age: 18-34 44% (219) 42% (210) 12% (58) 2% (11) 499Age: 35-44 46% (139) 44% (133) 9% (26) 1% (4) 302Age: 45-64 45% (327) 48% (351) 6% (42) 1% (5) 724Age: 65+ 45% (209) 52% (242) 3% (12) — (0) 463GenZers: 1997-2012 40% (89) 42% (93) 14% (31) 5% (10) 224Millennials: 1981-1996 46% (195) 43% (181) 10% (43) — (1) 419GenXers: 1965-1980 47% (238) 46% (234) 7% (34) 1% (5) 511Baby Boomers: 1946-1964 46% (346) 50% (383) 4% (27) 1% (4) 760PID: Dem (no lean) 82% (622) 13% (100) 4% (34) — (2) 757PID: Ind (no lean) 32% (202) 56% (359) 10% (67) 2% (10) 638PID: Rep (no lean) 12% (71) 80% (476) 6% (38) 1% (8) 593PID/Gender: DemMen 80% (262) 15% (48) 5% (16) 1% (2) 329PID/Gender: DemWomen 84% (360) 12% (52) 4% (17) — (0) 429PID/Gender: Ind Men 28% (82) 63% (186) 7% (19) 3% (9) 296PID/Gender: Ind Women 35% (120) 51% (173) 14% (47) — (2) 342PID/Gender: Rep Men 15% (47) 78% (239) 6% (17) 1% (3) 306PID/Gender: Rep Women 8% (24) 83% (237) 7% (21) 2% (5) 287Ideo: Liberal (1-3) 75% (457) 21% (130) 3% (21) — (0) 609Ideo: Moderate (4) 50% (260) 42% (217) 8% (40) 1% (5) 522Ideo: Conservative (5-7) 18% (119) 78% (527) 4% (28) 1% (4) 679Educ: < College 39% (490) 50% (627) 9% (116) 1% (17) 1250Educ: Bachelors degree 52% (243) 44% (209) 4% (17) — (2) 470Educ: Post-grad 60% (161) 37% (100) 2% (5) — (1) 267Income: Under 50k 43% (429) 45% (453) 10% (103) 1% (14) 998Income: 50k-100k 44% (293) 52% (345) 3% (20) — (3) 660Income: 100k+ 52% (172) 42% (139) 5% (15) 1% (3) 329Ethnicity: White 41% (660) 53% (845) 5% (87) 1% (17) 1608Ethnicity: Hispanic 52% (99) 36% (70) 12% (23) — (0) 193
Continued on next page
Page 403
National Tracking Poll #2006102, June, 2020
403
Table POLx_9
Table POLx_9: Favorability forJoe Biden
Demographic Total Favorable Total UnfavorableHeard Of, NoOpinion Never Heard Of Total N
Registered Voters 45% (894) 47% (936) 7% (138) 1% (20) 1988Ethnicity: Afr. Am. 70% (175) 16% (40) 14% (35) 1% (2) 252Ethnicity: Other 46% (59) 40% (51) 13% (17) 1% (1) 128All Christian 41% (390) 53% (503) 4% (41) 1% (6) 941All Non-Christian 61% (60) 29% (28) 7% (7) 3% (3) 97Atheist 55% (71) 37% (48) 6% (8) 1% (1) 128Agnostic/Nothing in particular 47% (224) 44% (213) 7% (36) 1% (6) 478Something Else 44% (150) 42% (144) 14% (46) 1% (3) 344Religious Non-Protestant/Catholic 57% (68) 33% (39) 7% (8) 4% (4) 120Evangelical 36% (183) 56% (285) 7% (34) 1% (3) 505Non-Evangelical 46% (346) 46% (343) 7% (52) 1% (5) 746Community: Urban 53% (259) 38% (187) 8% (38) 1% (5) 490Community: Suburban 48% (469) 45% (439) 7% (67) 1% (7) 981Community: Rural 32% (166) 60% (311) 6% (33) 1% (8) 517Employ: Private Sector 47% (294) 48% (301) 5% (32) 1% (4) 631Employ: Government 52% (70) 44% (59) 4% (6) — (0) 136Employ: Self-Employed 50% (64) 42% (55) 6% (8) 2% (3) 130Employ: Homemaker 33% (37) 54% (62) 11% (12) 2% (3) 115Employ: Retired 45% (219) 53% (259) 3% (14) — (0) 492Employ: Unemployed 47% (107) 39% (89) 13% (30) 2% (4) 229Employ: Other 39% (60) 42% (63) 15% (23) 4% (6) 152Military HH: Yes 42% (130) 55% (168) 3% (8) — (1) 306Military HH: No 45% (764) 46% (768) 8% (130) 1% (19) 1682RD/WT: Right Direction 18% (104) 72% (411) 8% (46) 1% (7) 567RD/WT: Wrong Track 56% (790) 37% (525) 6% (92) 1% (13) 1421Trump Job Approve 12% (91) 80% (623) 7% (53) 1% (7) 774Trump Job Disapprove 69% (801) 25% (293) 5% (54) — (5) 1153Trump Job Strongly Approve 8% (33) 86% (358) 5% (22) — (2) 415Trump Job Somewhat Approve 16% (58) 74% (265) 8% (30) 1% (5) 359Trump Job Somewhat Disapprove 47% (106) 47% (107) 6% (13) — (1) 226Trump Job Strongly Disapprove 75% (695) 20% (187) 4% (41) — (4) 927
Continued on next page
Page 404
404
Morning ConsultTable POLx_9
Table POLx_9: Favorability forJoe Biden
Demographic Total Favorable Total UnfavorableHeard Of, NoOpinion Never Heard Of Total N
Registered Voters 45% (894) 47% (936) 7% (138) 1% (20) 1988Favorable of Trump 12% (94) 81% (639) 6% (48) 1% (7) 787Unfavorable of Trump 70% (792) 25% (284) 5% (53) — (3) 1132Very Favorable of Trump 9% (41) 85% (394) 5% (25) — (2) 462Somewhat Favorable of Trump 16% (53) 75% (245) 7% (23) 1% (4) 325Somewhat Unfavorable of Trump 41% (74) 53% (96) 7% (12) — (0) 182Very Unfavorable of Trump 76% (718) 20% (188) 4% (41) — (3) 950#1 Issue: Economy 41% (285) 52% (355) 6% (43) 1% (5) 688#1 Issue: Security 19% (48) 73% (184) 7% (19) 1% (3) 254#1 Issue: Health Care 61% (205) 31% (105) 7% (24) 1% (2) 335#1 Issue: Medicare / Social Security 50% (142) 44% (125) 6% (16) — (1) 283#1 Issue: Women’s Issues 55% (47) 33% (29) 10% (9) 2% (1) 86#1 Issue: Education 50% (54) 39% (41) 8% (9) 3% (3) 107#1 Issue: Energy 61% (48) 28% (22) 9% (7) 2% (2) 79#1 Issue: Other 42% (66) 48% (75) 8% (12) 2% (3) 1572018 House Vote: Democrat 80% (616) 16% (120) 4% (31) — (1) 7672018 House Vote: Republican 13% (84) 82% (517) 4% (25) 1% (4) 6292018 House Vote: Someone else 24% (17) 64% (47) 10% (7) 2% (2) 732016 Vote: Hillary Clinton 83% (580) 13% (92) 4% (27) — (0) 7002016 Vote: Donald Trump 13% (90) 82% (551) 4% (30) — (3) 6752016 Vote: Other 36% (52) 56% (81) 7% (10) 1% (1) 1442016 Vote: Didn’t Vote 36% (169) 45% (211) 15% (71) 3% (15) 466Voted in 2014: Yes 48% (640) 47% (619) 4% (55) 1% (7) 1322Voted in 2014: No 38% (254) 48% (317) 12% (83) 2% (13) 6662012 Vote: Barack Obama 72% (612) 24% (202) 4% (34) 1% (5) 8532012 Vote: Mitt Romney 14% (72) 83% (416) 2% (9) 1% (4) 5012012 Vote: Other 16% (13) 77% (65) 6% (5) 1% (1) 842012 Vote: Didn’t Vote 35% (195) 46% (254) 16% (90) 2% (11) 550
Continued on next page
Page 405
National Tracking Poll #2006102, June, 2020
405
Table POLx_9
Table POLx_9: Favorability forJoe Biden
Demographic Total Favorable Total UnfavorableHeard Of, NoOpinion Never Heard Of Total N
Registered Voters 45% (894) 47% (936) 7% (138) 1% (20) 19884-Region: Northeast 47% (166) 46% (162) 7% (26) — (1) 3554-Region: Midwest 46% (209) 44% (203) 8% (37) 2% (7) 4574-Region: South 41% (307) 51% (381) 6% (46) 1% (8) 7424-Region: West 49% (212) 44% (191) 7% (29) 1% (3) 434Party: Democrat/Leans Democrat 79% (721) 16% (149) 4% (40) — (2) 911Party: Republican/Leans Republican 12% (87) 81% (602) 6% (44) 1% (8) 741Parents 45% (387) 48% (417) 6% (53) 1% (7) 864Note: Row proportions may total to larger than one-hundred percent due to rounding. For more information visit MorningConsultIntelligence.com.
Page 406
406
Morning ConsultTable POLx_10
Table POLx_10: Favorability forThe Supreme Court
Demographic Total Favorable Total UnfavorableHeard Of, NoOpinion Never Heard Of Total N
Registered Voters 56% (1122) 27% (547) 14% (288) 2% (31) 1988Gender: Male 58% (540) 29% (271) 11% (103) 2% (17) 930Gender: Female 55% (582) 26% (276) 17% (185) 1% (15) 1058Age: 18-34 46% (227) 27% (135) 24% (120) 3% (17) 499Age: 35-44 55% (165) 28% (84) 16% (47) 2% (5) 302Age: 45-64 58% (423) 28% (203) 12% (90) 1% (8) 724Age: 65+ 66% (306) 27% (125) 7% (31) — (1) 463GenZers: 1997-2012 44% (99) 20% (46) 30% (67) 5% (12) 224Millennials: 1981-1996 50% (209) 30% (125) 19% (80) 1% (5) 419GenXers: 1965-1980 55% (284) 30% (155) 12% (63) 2% (10) 511Baby Boomers: 1946-1964 63% (482) 27% (203) 9% (70) 1% (5) 760PID: Dem (no lean) 57% (433) 29% (217) 13% (101) 1% (7) 757PID: Ind (no lean) 51% (326) 28% (182) 18% (116) 2% (14) 638PID: Rep (no lean) 61% (363) 25% (148) 12% (71) 2% (11) 593PID/Gender: DemMen 56% (183) 31% (101) 13% (42) 1% (2) 329PID/Gender: DemWomen 58% (250) 27% (115) 14% (58) 1% (5) 429PID/Gender: Ind Men 51% (150) 34% (100) 13% (39) 2% (6) 296PID/Gender: Ind Women 52% (176) 24% (81) 23% (77) 2% (7) 342PID/Gender: Rep Men 68% (207) 23% (69) 7% (22) 3% (8) 306PID/Gender: Rep Women 54% (156) 28% (79) 17% (49) 1% (2) 287Ideo: Liberal (1-3) 58% (351) 33% (200) 9% (53) 1% (5) 609Ideo: Moderate (4) 56% (294) 25% (129) 18% (92) 1% (7) 522Ideo: Conservative (5-7) 61% (414) 27% (182) 12% (78) 1% (5) 679Educ: < College 53% (665) 27% (332) 18% (228) 2% (26) 1250Educ: Bachelors degree 59% (277) 31% (146) 9% (43) 1% (5) 470Educ: Post-grad 68% (181) 26% (69) 6% (17) — (1) 267Income: Under 50k 53% (532) 26% (264) 18% (178) 2% (24) 998Income: 50k-100k 59% (388) 30% (199) 10% (69) 1% (5) 660Income: 100k+ 62% (203) 25% (84) 12% (41) 1% (2) 329Ethnicity: White 58% (940) 27% (439) 13% (208) 1% (21) 1608Ethnicity: Hispanic 58% (111) 24% (47) 17% (33) 1% (1) 193
Continued on next page
Page 407
National Tracking Poll #2006102, June, 2020
407
Table POLx_10
Table POLx_10: Favorability forThe Supreme Court
Demographic Total Favorable Total UnfavorableHeard Of, NoOpinion Never Heard Of Total N
Registered Voters 56% (1122) 27% (547) 14% (288) 2% (31) 1988Ethnicity: Afr. Am. 46% (116) 30% (75) 20% (51) 4% (10) 252Ethnicity: Other 52% (66) 26% (33) 22% (29) — (1) 128All Christian 62% (583) 25% (238) 12% (113) 1% (6) 941All Non-Christian 66% (64) 25% (24) 4% (4) 5% (5) 97Atheist 49% (63) 38% (49) 13% (16) — (0) 128Agnostic/Nothing in particular 49% (234) 32% (152) 16% (78) 3% (14) 478Something Else 52% (178) 24% (83) 22% (76) 2% (7) 344Religious Non-Protestant/Catholic 62% (74) 27% (32) 6% (8) 5% (6) 120Evangelical 60% (302) 23% (118) 16% (79) 1% (6) 505Non-Evangelical 59% (441) 26% (195) 14% (103) 1% (6) 746Community: Urban 55% (269) 27% (131) 16% (79) 2% (11) 490Community: Suburban 58% (566) 27% (265) 14% (140) 1% (10) 981Community: Rural 55% (287) 29% (151) 13% (69) 2% (10) 517Employ: Private Sector 56% (351) 33% (209) 10% (61) 2% (10) 631Employ: Government 59% (81) 30% (40) 9% (13) 1% (2) 136Employ: Self-Employed 55% (71) 25% (32) 16% (21) 5% (6) 130Employ: Homemaker 42% (48) 28% (32) 29% (33) 2% (2) 115Employ: Retired 66% (323) 24% (119) 10% (50) — (1) 492Employ: Unemployed 53% (121) 25% (57) 20% (45) 2% (6) 229Employ: Other 47% (72) 27% (41) 24% (36) 2% (4) 152Military HH: Yes 63% (193) 27% (83) 9% (27) 1% (3) 306Military HH: No 55% (929) 28% (463) 15% (261) 2% (29) 1682RD/WT: Right Direction 62% (351) 23% (129) 14% (78) 2% (9) 567RD/WT: Wrong Track 54% (771) 29% (417) 15% (210) 2% (22) 1421Trump Job Approve 60% (467) 27% (207) 12% (89) 1% (11) 774Trump Job Disapprove 56% (641) 29% (334) 14% (163) 1% (15) 1153Trump Job Strongly Approve 60% (251) 28% (117) 9% (39) 2% (8) 415Trump Job Somewhat Approve 60% (217) 25% (90) 14% (50) 1% (3) 359Trump Job Somewhat Disapprove 57% (130) 22% (49) 19% (44) 2% (4) 226Trump Job Strongly Disapprove 55% (511) 31% (286) 13% (119) 1% (11) 927
Continued on next page
Page 408
408
Morning ConsultTable POLx_10
Table POLx_10: Favorability forThe Supreme Court
Demographic Total Favorable Total UnfavorableHeard Of, NoOpinion Never Heard Of Total N
Registered Voters 56% (1122) 27% (547) 14% (288) 2% (31) 1988Favorable of Trump 61% (482) 27% (209) 11% (89) 1% (8) 787Unfavorable of Trump 56% (631) 29% (332) 14% (155) 1% (14) 1132Very Favorable of Trump 60% (277) 28% (131) 10% (48) 1% (6) 462Somewhat Favorable of Trump 63% (205) 24% (77) 13% (41) — (2) 325Somewhat Unfavorable of Trump 55% (100) 23% (41) 19% (35) 3% (5) 182Very Unfavorable of Trump 56% (531) 31% (290) 13% (120) 1% (9) 950#1 Issue: Economy 60% (410) 26% (177) 14% (94) 1% (7) 688#1 Issue: Security 56% (143) 30% (76) 13% (32) 1% (3) 254#1 Issue: Health Care 57% (190) 28% (92) 14% (47) 2% (5) 335#1 Issue: Medicare / Social Security 57% (162) 28% (79) 13% (37) 2% (6) 283#1 Issue: Women’s Issues 44% (38) 35% (30) 17% (15) 3% (3) 86#1 Issue: Education 58% (61) 18% (19) 21% (22) 3% (4) 107#1 Issue: Energy 54% (42) 29% (23) 17% (13) 1% (1) 79#1 Issue: Other 48% (76) 32% (50) 18% (28) 2% (2) 1572018 House Vote: Democrat 59% (453) 30% (232) 10% (73) 1% (9) 7672018 House Vote: Republican 61% (385) 28% (179) 9% (55) 2% (10) 6292018 House Vote: Someone else 44% (32) 31% (23) 23% (17) 2% (2) 732016 Vote: Hillary Clinton 61% (428) 28% (198) 9% (65) 1% (9) 7002016 Vote: Donald Trump 60% (404) 29% (198) 10% (64) 1% (8) 6752016 Vote: Other 55% (80) 28% (41) 16% (23) — (1) 1442016 Vote: Didn’t Vote 45% (209) 23% (109) 29% (135) 3% (13) 466Voted in 2014: Yes 60% (790) 29% (388) 10% (127) 1% (17) 1322Voted in 2014: No 50% (332) 24% (159) 24% (161) 2% (15) 6662012 Vote: Barack Obama 61% (522) 28% (238) 10% (85) 1% (8) 8532012 Vote: Mitt Romney 62% (311) 27% (136) 10% (48) 1% (6) 5012012 Vote: Other 44% (37) 37% (31) 13% (11) 5% (4) 842012 Vote: Didn’t Vote 46% (251) 26% (142) 26% (143) 2% (13) 550
Continued on next page
Page 409
National Tracking Poll #2006102, June, 2020
409
Table POLx_10
Table POLx_10: Favorability forThe Supreme Court
Demographic Total Favorable Total UnfavorableHeard Of, NoOpinion Never Heard Of Total N
Registered Voters 56% (1122) 27% (547) 14% (288) 2% (31) 19884-Region: Northeast 57% (201) 26% (91) 16% (58) 1% (4) 3554-Region: Midwest 56% (255) 27% (124) 15% (70) 2% (8) 4574-Region: South 56% (415) 28% (209) 14% (106) 2% (13) 7424-Region: West 58% (252) 28% (123) 12% (53) 2% (7) 434Party: Democrat/Leans Democrat 58% (531) 29% (261) 12% (111) 1% (7) 911Party: Republican/Leans Republican 59% (440) 26% (191) 13% (97) 2% (12) 741Parents 58% (497) 27% (232) 14% (124) 1% (10) 864Note: Row proportions may total to larger than one-hundred percent due to rounding. For more information visit MorningConsultIntelligence.com.
Page 410
410
Morning ConsultTable POLx_11
Table POLx_11: Favorability forJohn Roberts
Demographic Total Favorable Total UnfavorableHeard Of, NoOpinion Never Heard Of Total N
Registered Voters 24% (468) 23% (461) 22% (434) 31% (625) 1988Gender: Male 31% (285) 29% (268) 17% (161) 23% (215) 930Gender: Female 17% (183) 18% (192) 26% (273) 39% (409) 1058Age: 18-34 12% (60) 17% (85) 26% (128) 45% (227) 499Age: 35-44 22% (66) 24% (73) 22% (66) 32% (97) 302Age: 45-64 26% (189) 25% (180) 20% (146) 29% (208) 724Age: 65+ 33% (153) 27% (123) 20% (94) 20% (93) 463GenZers: 1997-2012 10% (23) 12% (28) 28% (63) 49% (110) 224Millennials: 1981-1996 15% (64) 21% (88) 24% (101) 39% (166) 419GenXers: 1965-1980 25% (126) 24% (122) 20% (104) 31% (160) 511Baby Boomers: 1946-1964 30% (227) 27% (205) 20% (150) 24% (179) 760PID: Dem (no lean) 25% (189) 20% (154) 22% (165) 33% (249) 757PID: Ind (no lean) 20% (126) 23% (145) 23% (147) 34% (220) 638PID: Rep (no lean) 26% (153) 27% (161) 21% (122) 26% (157) 593PID/Gender: DemMen 29% (96) 28% (92) 19% (63) 23% (77) 329PID/Gender: DemWomen 22% (93) 15% (63) 24% (102) 40% (172) 429PID/Gender: Ind Men 27% (80) 29% (87) 18% (54) 25% (75) 296PID/Gender: Ind Women 13% (46) 17% (58) 27% (93) 42% (145) 342PID/Gender: Rep Men 36% (109) 29% (89) 14% (44) 21% (63) 306PID/Gender: Rep Women 15% (44) 25% (72) 27% (78) 32% (93) 287Ideo: Liberal (1-3) 28% (173) 24% (143) 20% (121) 28% (172) 609Ideo: Moderate (4) 21% (111) 16% (86) 27% (140) 35% (185) 522Ideo: Conservative (5-7) 27% (182) 30% (204) 18% (119) 26% (174) 679Educ: < College 18% (222) 22% (281) 24% (299) 36% (448) 1250Educ: Bachelors degree 27% (126) 26% (122) 20% (92) 28% (130) 470Educ: Post-grad 45% (121) 22% (58) 16% (43) 17% (46) 267Income: Under 50k 18% (184) 22% (219) 24% (241) 36% (355) 998Income: 50k-100k 27% (176) 24% (159) 21% (136) 29% (189) 660Income: 100k+ 33% (109) 25% (83) 17% (57) 25% (81) 329Ethnicity: White 26% (410) 24% (386) 21% (340) 29% (472) 1608Ethnicity: Hispanic 18% (34) 15% (29) 27% (52) 40% (78) 193
Continued on next page
Page 411
National Tracking Poll #2006102, June, 2020
411
Table POLx_11
Table POLx_11: Favorability forJohn Roberts
Demographic Total Favorable Total UnfavorableHeard Of, NoOpinion Never Heard Of Total N
Registered Voters 24% (468) 23% (461) 22% (434) 31% (625) 1988Ethnicity: Afr. Am. 15% (37) 22% (55) 23% (59) 40% (101) 252Ethnicity: Other 16% (21) 16% (20) 28% (35) 40% (52) 128All Christian 27% (255) 25% (240) 21% (198) 26% (248) 941All Non-Christian 35% (34) 25% (24) 15% (15) 25% (24) 97Atheist 20% (26) 33% (42) 17% (22) 30% (38) 128Agnostic/Nothing in particular 21% (101) 20% (98) 23% (111) 35% (169) 478Something Else 15% (53) 17% (57) 26% (88) 42% (146) 344Religious Non-Protestant/Catholic 31% (38) 24% (29) 16% (19) 28% (34) 120Evangelical 23% (114) 25% (124) 23% (115) 30% (152) 505Non-Evangelical 25% (189) 22% (166) 22% (164) 30% (226) 746Community: Urban 23% (111) 24% (115) 22% (106) 32% (157) 490Community: Suburban 26% (251) 23% (228) 21% (207) 30% (295) 981Community: Rural 21% (106) 23% (118) 23% (120) 33% (173) 517Employ: Private Sector 27% (171) 26% (161) 20% (124) 28% (175) 631Employ: Government 26% (35) 25% (34) 18% (25) 30% (41) 136Employ: Self-Employed 22% (29) 24% (31) 20% (25) 35% (45) 130Employ: Homemaker 12% (13) 21% (24) 24% (28) 43% (50) 115Employ: Retired 33% (160) 26% (128) 21% (103) 21% (101) 492Employ: Unemployed 15% (34) 20% (45) 21% (47) 45% (103) 229Employ: Other 11% (17) 18% (27) 32% (48) 39% (60) 152Military HH: Yes 34% (103) 27% (83) 15% (46) 24% (74) 306Military HH: No 22% (366) 22% (377) 23% (388) 33% (551) 1682RD/WT: Right Direction 27% (152) 27% (154) 20% (114) 26% (148) 567RD/WT: Wrong Track 22% (317) 22% (307) 23% (320) 34% (477) 1421Trump Job Approve 25% (190) 27% (212) 20% (158) 28% (213) 774Trump Job Disapprove 24% (275) 21% (245) 22% (249) 33% (384) 1153Trump Job Strongly Approve 28% (114) 33% (135) 17% (72) 23% (94) 415Trump Job Somewhat Approve 21% (76) 22% (77) 24% (87) 33% (119) 359Trump Job Somewhat Disapprove 18% (41) 17% (39) 25% (55) 40% (91) 226Trump Job Strongly Disapprove 25% (235) 22% (206) 21% (193) 32% (293) 927
Continued on next page
Page 412
412
Morning ConsultTable POLx_11
Table POLx_11: Favorability forJohn Roberts
Demographic Total Favorable Total UnfavorableHeard Of, NoOpinion Never Heard Of Total N
Registered Voters 24% (468) 23% (461) 22% (434) 31% (625) 1988Favorable of Trump 24% (189) 29% (224) 20% (158) 27% (216) 787Unfavorable of Trump 24% (275) 21% (233) 22% (248) 33% (376) 1132Very Favorable of Trump 26% (121) 33% (155) 16% (75) 24% (111) 462Somewhat Favorable of Trump 21% (67) 21% (70) 25% (83) 32% (105) 325Somewhat Unfavorable of Trump 18% (33) 17% (30) 28% (51) 37% (68) 182Very Unfavorable of Trump 26% (243) 21% (203) 21% (197) 32% (308) 950#1 Issue: Economy 24% (162) 26% (179) 19% (133) 31% (214) 688#1 Issue: Security 25% (63) 29% (75) 24% (61) 22% (55) 254#1 Issue: Health Care 26% (88) 20% (67) 25% (85) 28% (95) 335#1 Issue: Medicare / Social Security 24% (67) 20% (57) 22% (62) 34% (97) 283#1 Issue: Women’s Issues 17% (15) 15% (13) 26% (22) 42% (36) 86#1 Issue: Education 16% (17) 15% (16) 18% (19) 51% (55) 107#1 Issue: Energy 24% (19) 13% (10) 27% (22) 36% (29) 79#1 Issue: Other 24% (37) 29% (45) 19% (30) 28% (44) 1572018 House Vote: Democrat 30% (228) 22% (168) 21% (158) 28% (213) 7672018 House Vote: Republican 27% (170) 32% (203) 18% (115) 22% (141) 6292018 House Vote: Someone else 8% (6) 29% (21) 20% (15) 43% (31) 732016 Vote: Hillary Clinton 31% (216) 22% (155) 19% (130) 28% (199) 7002016 Vote: Donald Trump 26% (176) 31% (212) 18% (120) 25% (167) 6752016 Vote: Other 18% (26) 19% (28) 30% (44) 32% (47) 1442016 Vote: Didn’t Vote 11% (49) 14% (65) 30% (140) 45% (212) 466Voted in 2014: Yes 29% (381) 27% (356) 19% (255) 25% (329) 1322Voted in 2014: No 13% (88) 16% (104) 27% (179) 44% (295) 6662012 Vote: Barack Obama 28% (240) 22% (184) 20% (173) 30% (256) 8532012 Vote: Mitt Romney 32% (158) 30% (151) 17% (84) 22% (108) 5012012 Vote: Other 9% (8) 41% (35) 26% (22) 23% (19) 842012 Vote: Didn’t Vote 11% (63) 17% (91) 28% (154) 44% (241) 550
Continued on next page
Page 413
National Tracking Poll #2006102, June, 2020
413
Table POLx_11
Table POLx_11: Favorability forJohn Roberts
Demographic Total Favorable Total UnfavorableHeard Of, NoOpinion Never Heard Of Total N
Registered Voters 24% (468) 23% (461) 22% (434) 31% (625) 19884-Region: Northeast 24% (84) 25% (90) 25% (90) 26% (90) 3554-Region: Midwest 22% (100) 25% (112) 23% (104) 31% (140) 4574-Region: South 22% (167) 22% (166) 22% (166) 33% (244) 7424-Region: West 27% (117) 21% (93) 17% (74) 35% (150) 434Party: Democrat/Leans Democrat 26% (234) 21% (188) 21% (188) 33% (301) 911Party: Republican/Leans Republican 25% (182) 28% (204) 22% (159) 26% (195) 741Parents 25% (214) 23% (198) 21% (186) 31% (266) 864Note: Row proportions may total to larger than one-hundred percent due to rounding. For more information visit MorningConsultIntelligence.com.
Page 414
Morning ConsultRespondent Demographics Summary
Respondent Demographics Summary
Summary Statistics of Survey Respondent DemographicsDemographic Group Frequency Percentage
xdemAll Registered Voters 1988 100%
xdemGender Gender: Male 930 47%Gender: Female 1058 53%
N 1988
age Age: 18-34 499 25%Age: 35-44 302 15%Age: 45-64 724 36%Age: 65+ 463 23%
N 1988
demAgeGeneration GenZers: 1997-2012 224 11%Millennials: 1981-1996 419 21%
GenXers: 1965-1980 511 26%Baby Boomers: 1946-1964 760 38%
N 1914
xpid3 PID: Dem (no lean) 757 38%PID: Ind (no lean) 638 32%PID: Rep (no lean) 593 30%
N 1988
xpidGender PID/Gender: DemMen 329 17%PID/Gender: DemWomen 429 22%
PID/Gender: Ind Men 296 15%PID/Gender: Ind Women 342 17%
PID/Gender: Rep Men 306 15%PID/Gender: Rep Women 287 14%
N 1988
xdemIdeo3 Ideo: Liberal (1-3) 609 31%Ideo: Moderate (4) 522 26%
Ideo: Conservative (5-7) 679 34%N 1810
xeduc3 Educ: < College 1250 63%Educ: Bachelors degree 470 24%
Educ: Post-grad 267 13%N 1988
Continued on next page
414
Page 415
National Tracking Poll #2006102, June, 2020Respondent Demographics Summary
Summary Statistics of Survey Respondent DemographicsDemographic Group Frequency Percentage
xdemInc3 Income: Under 50k 998 50%Income: 50k-100k 660 33%
Income: 100k+ 329 17%N 1988
xdemWhite Ethnicity: White 1608 81%
xdemHispBin Ethnicity: Hispanic 193 10%
demBlackBin Ethnicity: Afr. Am. 252 13%
demRaceOther Ethnicity: Other 128 6%
xdemReligion All Christian 941 47%All Non-Christian 97 5%
Atheist 128 6%Agnostic/Nothing in particular 478 24%
Something Else 344 17%N 1988
xdemReligOther Religious Non-Protestant/Catholic 120 6%
xdemEvang Evangelical 505 25%Non-Evangelical 746 38%
N 1251
xdemUsr Community: Urban 490 25%Community: Suburban 981 49%
Community: Rural 517 26%N 1988
xdemEmploy Employ: Private Sector 631 32%Employ: Government 136 7%
Employ: Self-Employed 130 7%Employ: Homemaker 115 6%
Employ: Retired 492 25%Employ: Unemployed 229 12%
Employ: Other 152 8%N 1884
xdemMilHH1 Military HH: Yes 306 15%Military HH: No 1682 85%
N 1988
xnr1 RD/WT: Right Direction 567 29%RD/WT: Wrong Track 1421 71%
N 1988
Continued on next page
415
Page 416
Morning ConsultRespondent Demographics Summary
Summary Statistics of Survey Respondent DemographicsDemographic Group Frequency Percentage
Trump_Approve Trump Job Approve 774 39%Trump Job Disapprove 1153 58%
N 1927
Trump_Approve2 Trump Job Strongly Approve 415 21%Trump Job Somewhat Approve 359 18%
Trump Job Somewhat Disapprove 226 11%Trump Job Strongly Disapprove 927 47%
N 1927
Trump_Fav Favorable of Trump 787 40%Unfavorable of Trump 1132 57%
N 1919
Trump_Fav_FULL Very Favorable of Trump 462 23%Somewhat Favorable of Trump 325 16%
Somewhat Unfavorable of Trump 182 9%Very Unfavorable of Trump 950 48%
N 1919
xnr3 #1 Issue: Economy 688 35%#1 Issue: Security 254 13%
#1 Issue: Health Care 335 17%#1 Issue: Medicare / Social Security 283 14%
#1 Issue: Women’s Issues 86 4%#1 Issue: Education 107 5%
#1 Issue: Energy 79 4%#1 Issue: Other 157 8%
N 1988
xsubVote18O 2018 House Vote: Democrat 767 39%2018 House Vote: Republican 629 32%
2018 House Vote: Someone else 73 4%N 1470
xsubVote16O 2016 Vote: Hillary Clinton 700 35%2016 Vote: Donald Trump 675 34%
2016 Vote: Other 144 7%2016 Vote: Didn’t Vote 466 23%
N 1986
xsubVote14O Voted in 2014: Yes 1322 66%Voted in 2014: No 666 34%
N 1988
Continued on next page
416
Page 417
National Tracking Poll #2006102, June, 2020Respondent Demographics Summary
Summary Statistics of Survey Respondent DemographicsDemographic Group Frequency Percentage
xsubVote12O 2012 Vote: Barack Obama 853 43%2012 Vote: Mitt Romney 501 25%
2012 Vote: Other 84 4%2012 Vote: Didn’t Vote 550 28%
N 1987
xreg4 4-Region: Northeast 355 18%4-Region: Midwest 457 23%
4-Region: South 742 37%4-Region: West 434 22%
N 1988
xdemPidLean Party: Democrat/Leans Democrat 911 46%Party: Republican/Leans Republican 741 37%
N 1652
POLdem2 Parents 864 43%
Note: Group proportions may total to larger than one-hundred percent due to rounding. All statistics are calcu-lated with demographic post-stratification weights applied.
417
Page 418
418 Morning Consult