40
NATSURV13

NATSURV13

NATSURV 13
WATER AND WASTE-WATER MANAGEMENT IN
THE TEXTILE INDUSTRY
prepared for the
WATER RESEARCH COMMISSION
by
STEFFEN ROBERTSON AND KIRSTEN
Consulting Engineers
WRC PROJECT NO. 145
TT 50/90
MARCH 1993
PO Box 55291
Steffen Robertson and Kirsten NORTHLANDS
265 Oxford Road 2116
ILLOVO Tel: (011)441-1111
2196 Fax: (Oil) 880-8086

Available from:
Water Research Commission
PO Box 824
PRETORIA
0001
Republic of South Africa
ISBN 0 947447 81 4
This publication stems from a research project entitled:
National Industrial Water and Waste-water Survey (NATSURV)
that was carried out by: Steffen Robertson and Kirsten, Consulting Engineers
DISCLAIMER
This report has been reviewed by the Water Research Commission and approved tor publication.
Approval does not signify that the contents necessarily reflect the views and policies of the Water
Research Commission, nor does mention o\' trade names or commercial products constitute
endorsement or recommendation for use.
- 1! -

FOREWORD
The need for guidelines to assist industry in reducing its water intake and managing its waste-water
disposal as effectively as possible is of national concern in the RSA in view of the country's water
scarcity and the growing deterioration in the quality of available water supplies.
To establish norms for water intake and waste-water disposal, the Water Research Commission
(WRC), in collaboration with the Department of Water Affairs (DWA), contracted a firm of
consulting engineers, to undertake a National Industrial Water and Waste-water Survey (NATSURV)
of all classes of industry. The results obtained in the survey of the textile industry form the basis of
this guide on Water and Waste-water Management in the Textile Industry.
It is expected that this guide will be of value to the industry itself and to other interested parties such
as municipalities, legislators, researchers and consultants in the water and effluent fields.
- in -

ACKNOWLEDGEMENTS
The preparation of this publication was constituted under the guidance of the following Editorial
Committee:
D r O O Hart Water Research Commission (Chairman)
Mr D F Sutton Department of Water Affairs and Forestry
Mr A W La Cock Cape Town City Council
Mr S Gribi SA Dyers and Finishers Association
Mr P Skivington Steften Robertson and Kirsten
Mr G N Steenveld Steffen Robertson and Kirsten.
The contributions made by the members of the Editorial Committee to the preparation of this Guide
are gratefully acknowledged.
Assistance given by the Textile Federation is gratefully acknowledged, as is the cooperation of the
Pollution Research Group at the University of Natal in making available information obtained from
their activities in the textile industry in the course of other projects carried out on behalf of the Water
Research Commission.
- iv -

SUMMARY
The textile industry in the RSA ("the Industry") comprises a group of related industrial operations
which use various natural and synthetic fibres as the raw materials to produce a wide variety of end-
products, ranging from processed fibres to woven materials to finished garments or piece goods. This
guide is addressed primarily at the sector of the industry which uses water extensively in its
processing operations.
Most of the field data collected is from the Western Cape area, although major textile plants in the
Eastern Cape and Natal have also been surveyed. The data obtained has been correlated with other
data available on water intake and effluent generation in the Industry, as referenced in the text.
Overall, water intake by the Industry is estimated to be around 30 x 10s m3/a, of which 70 to 80%
is returned as industrial effluent.
Specific water intake (SWI) was found to vary from 95 to 400 t/kg of material processed. The wide
range in SWI values observed is partly due to the diverse nature of the Industry, for example in terms
of the types and proportions of different fibres processed, but also reflects a relative lack of water
efficiency at some factories compared to others with similar processing operations. The latter factor
indicates that significant reductions in water intake and improvements in water management can be
achieved within the Industry.
Specific pollution load {SPL) values were found to vary considerably depending on the type of
processing involved, which in turn is affected by the material handled and the type of equipment
employed. In general, the waste waters from the Industry have high salinity and range widely in
terms of pH values, and, in some cases, have high heavy metal concentrations, colour and (relatively
non-biodegradable) organic content.
The strategic approach consequently recommended for reducing overall SWI and SPL values in the
Industry is for individual factories to implement water-saving and pollution-reducing measures, using
their individual SWI and SPL values as targets against which to measure improvement. Generally
applicable measures for reducing water use (i.e. improving water efficiency), for reducing pollutant
loads at source, and for providing on-site pretreatment of the effluents arising, are identified in the
Guide. These measures should be implemented selectively on a site-specific basis to further the
strategic approach indicated above.
- v -

TABLE OF CONTENTS
Page
1 INTRODUCTION 1
2 PROCESS RESUME 3
2.1 Categorization of the industry 3
2.2 Unit operations in textile processing 4
2.3 Textile mill types 6
2.4 Processing sequences for major fibre types 8
3 SUMMARY OF WATER USE AND EFFLUENT GENERATION IN THE
INDUSTRY 15
3.1 Introduction 15
3.2 Water intake and water use 15
3.3 Effluent 18
4 CONCLUSIONS AND RECOMMENDATIONS 20
4.1 Water intake 20
4.2 Water management 20
4.3 Reduction in water use 21
4.4 Effluent generation 22
4.5 Effluent management 23
4.6 Waste-water treatment 23
5 REFERENCES 25
APPENDIX 26
- vi -

LIST OF TABLES
Table Title Page
1.1 Fibre consumption in the Industry (1987 base date) 2
3.1 Range of specific water use (SWU) values for wet-processing steps 16
3.2 Example of processing SWU values at 50/50 polyester/cotton mill 17
3.3 Range of specific pollutant loads (SPLs) in textile processing 18
3.4 Example of heavy metal concentrations in a dyehouse effluent 19
A.I Summary of textile mills surveyed 27
A.2 Specific water intake at textile mills surveyed 28
A.3 Waste-water analyses at textile mills 29
A.4 Specific effluent loads at textile mills 29
LIST OF FIGURES
Figure Title Page
2.1 Overall processing in the textile industry 3
2.2 Schematic diagram of dry processing mill 8
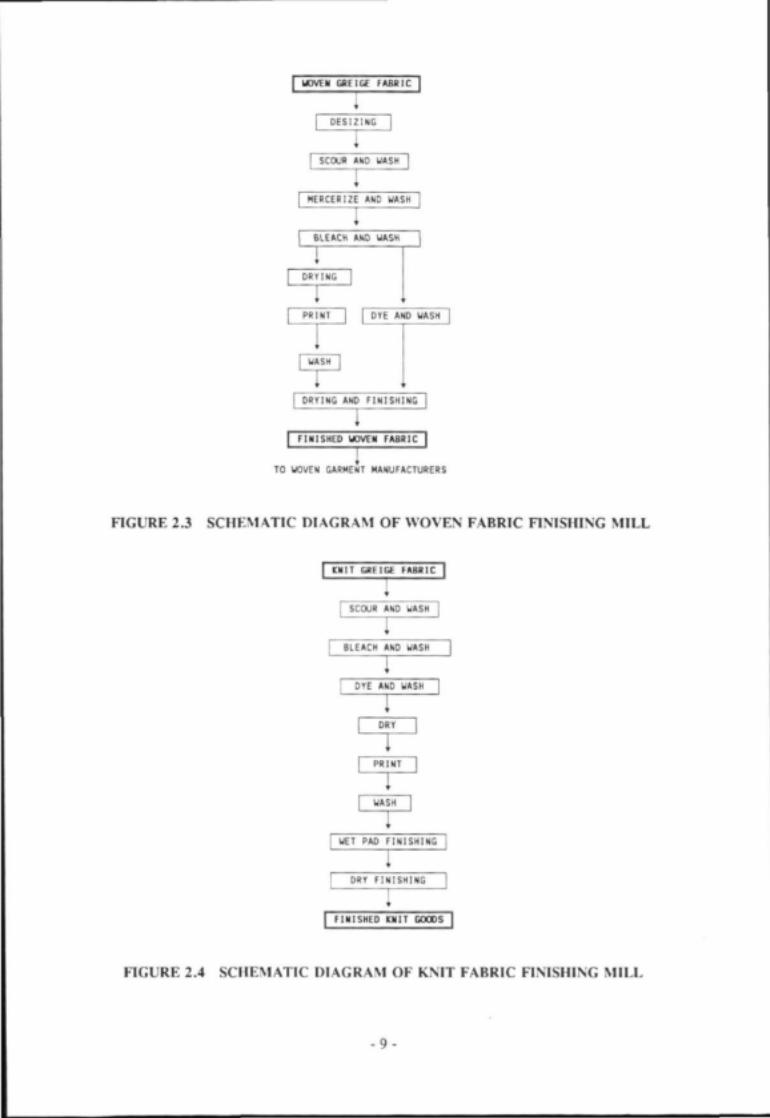
2.3 Schematic diagram of woven fabric finishing mill 9
2.4 Schematic diagram of knit fabric finishing mill 9
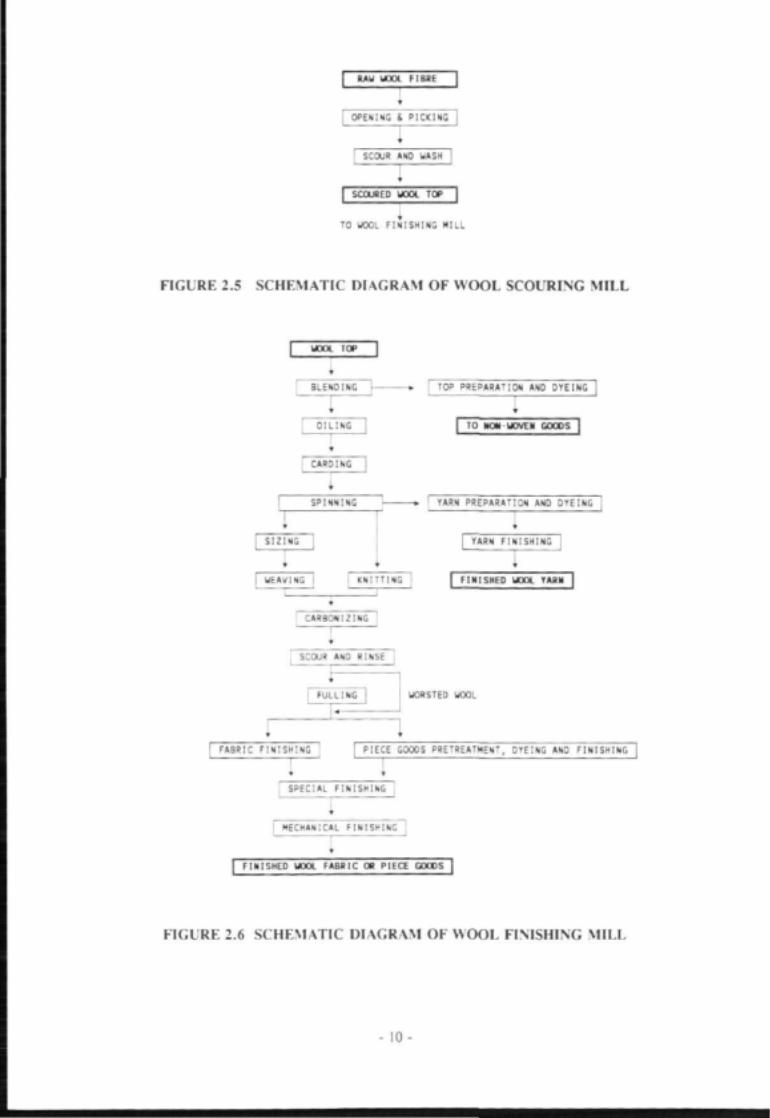
2.5 Schematic diagram of wool scouring mill 10
2.6 Schematic diagram of wool finishing mill 10
2.7 Schematic diagram of stock or yarn dyeing and finishing mill 11
2.8 Schematic diagram of carpet mill 11
2.9 Major steps in cotton processing 12
2.10 Major steps in wool processing 13
2.11 Major steps in synthetics processing 14
3.1 Breakdown of specific water use for processing 16
Note:
In the schematic diagrams, process operation steps are shown as a single-line box thus
while raw materials, semi-processed materials and products are shown by bold print in a
double-line box thus
- va -

GLOSSARY
BLEACHING The chemical (oxidizing or reducing) treatment of textilematerials to destroy colouring matter and otherimpurities.
CARDING An operation in which raw fibres are aligned.
CARBONIZING The acid washing of wool to remove residual vegetablematter.
COMBING An operation in which raw fibres are cleaned by acombing process.
DESIZING The removal of sizing agents before further finishing ofthe fabric.
FINISHING The final operations carried out on yarn or fabric toimpart the desired properties and appearance.
FULLING The alkaline/detergent treatment of wool, followed byroller-milling, to increase body and density.
GREIGE Woven cloth which has not received any furtherprocessing.
KNITTING The production of fabric by looping together yarn orthread.
MERCERIZING The treatment of cotton fabric with concentrated sodiumhydroxide to impart sheen and improve the wettability ofthe fabric.
PIECE GOODS Fabric produced from yarn by weaving or knitting.
- via -

SCOURING The treatment of cotton fabric with hot concentratedsodium hydroxide to remove waxes and pectins from thefabric.
SIZING The application of a polymeric coating to warp yarn toimprove its weaving characteristics; the traditional sizingagent is starch, but more recently synthetic polymers andpolymer blends have also been used.
SPECIFIC EFFLUENT VOLUME The effluent volume for a particular period divided bythe product quantity processed in the same period.
SPECIFIC POLLUTION LOAD The mass of given pollutant for a particular perioddivided by the product quantity processed in the sameperiod.
SPECIFIC WATER INTAKE The water intake for a particular period divided by theproduct quantity processed in the same period.
SPINNING The production of yarn from fibres or filaments.
SUINT Saline excretions from the skin of sheep, accumulating inraw wool as an impurity which is removed by washing(scouring).
WARP The longitudinal threads in a length of fabric.
WEAVING The production of fabric by the interlacing of warp andweft yarn threads on a loom.
WEFT The cross-threads inserted into the warp during weaving.
YARN Spun fibre.
- ix -

ABBREVIATIONS
BOD Biochemical oxygen demand
COD Chemical oxygen demand
FOG Fats, oils and greases
OA Oxygen absorbed
SEV Specific effluent volume
SPL Specific pollution load
SS Suspended solids
SWI Specific water intake
SWU Specific water use
TDIS Total dissolved inorganic solids
TDS Total dissolved solids
VVRC Water Research Commission
- x -

INTRODUCTION
The textile industry in the RSA ("the Industry") comprises a group of related industries engaged
in processing activities ranging from yarn and fabric production and finishing through to the
manufacture of clothing and other soft goods items1'1. The factories concerned are often
referred to as mills (in the text following, the terms "factory" and "mill" are used
interchangeably, depending on the context).
The total water intake by the Industry has been assessed at around 30 x I(?m3/a':i. Definitive
categorization of the Industry according to water intake or water use is complicated by a
number of factors. One factor is the degree of vertical integration: many major mills are fully
integrated vertically i.e. they take in one or more types of the raw fibre and carry out all
operations from yarn spinning through fabric production, preparation, dyeing, printing and
finishing. Other factories take in varying proportions of undyed and pre-dyed yarn and process
accordingly to produce piece goods, or take in varying proportions of yarn (dyed or undyed)
and fabric to produce garments.
In terms of water intake per unit of production for processing purposes, extremes in the
Industry are represented on the one hand by those factories which employ large numbers of
people but carry out essentially "dry" operations such as garment manufacturing, and on the
other hand by those factories operating as commission dyers and finishers and using large
volumes of water directly for such "wet" processing purposes.
A second major variable affecting the classification of the Industry is the type of fibre
processed. Fibre consumption in the Industry191 over the period 1989 to 1991 is indicated in
Table 1.1. Depending inter alia on market requirements these are also blended in various
proportions. Some factories produce only specific blends, while others at various times process
any and all of the fibre types and blends. This significantly affects both the water intake and
the waste-water characteristics, as the different fibre types have different processing
requirements. From Table 1.1 it may be noted that the total fibre consumption by the Industry
in the RSA increased moderately from 1987 to 1989 and then declined in 1990 (with a further
decline reported IU1 in 1991). The proportions of the major fibre types however remained
relatively constant over the period 1987 to 1990.
Other variables affecting water intake and effluent characteristics in the Industry are the type
of dyestuff used, the method of dyeing and the type of equipment employed. Wide variations
in water use and effluent quality for similar products are thus observed. Seasonal variations
due to market and fashion demands also affect the situation with regard to water intake and
effluent quality.
- 1 -
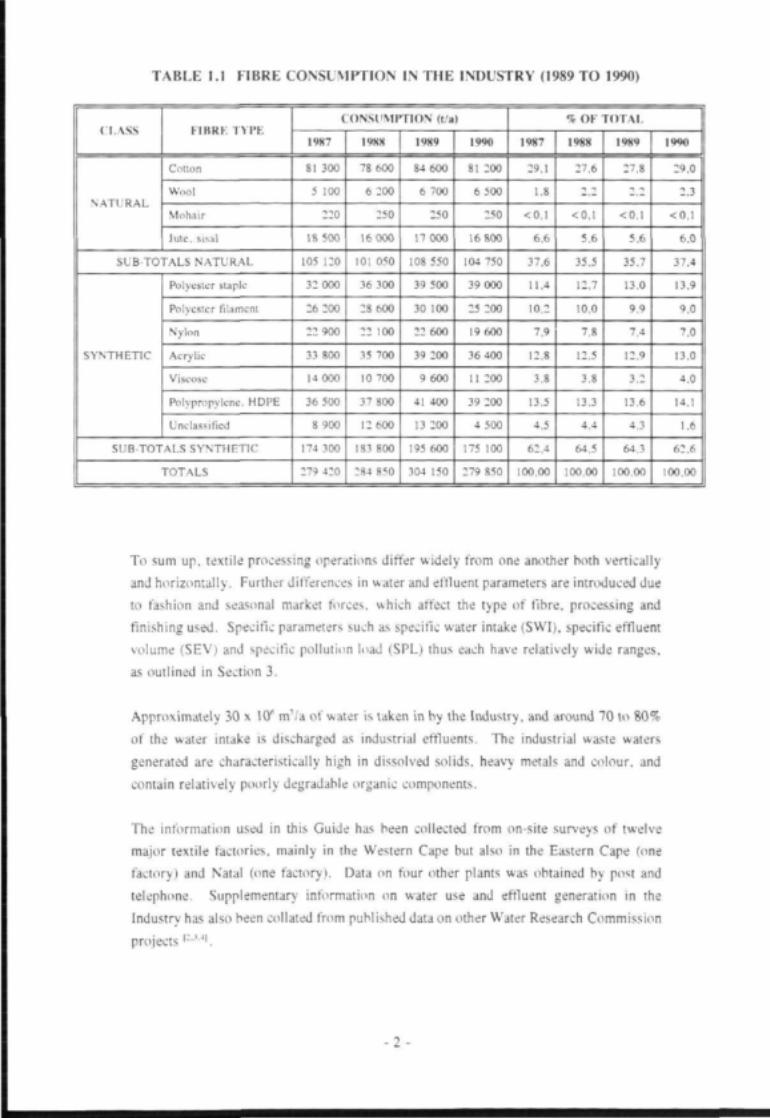
TABLE 1.1 FIBRE CONSUMPTION IN THE INDUSTRY (1989 TO 1990)
CLASS
NATURAL
FIBRE TYPE
Cotton
Wool
Mohair
Jute, sisal
SUB-TOTALS NATURAL
SYNTHETIC
Polyester staple
Polyester filament
Nylon
Acrylic
Viscose
Polypropylene. HDPE
Unclassified
SUB-TOTALS SYNTHETIC
TOTALS
CONSUMPTION (t/a)
1987
81 300
5 100
220
18 500
105 120
32 000
26 200
22 900
33 800
14 000
36 500
8 900
174 300
279 420
1988
78 600
6 200
250
160O0
101 050
36 300
28 600
22 100
35 700
10 700
37 800
12 600
183 800
284 850
1989
84 600
6 700
250
17000
108 550
39 500
30 100
22 600
39 200
9 600
41 400
13 200
195 600
304 150
1990
81 200
6 500
250
16 800
104 750
39 000
25 200
19 600
36 400
11 200
39 200
4 500
175 100
279 850
% OF TOTAL
1987
29,1
1,8
<0,l
6,6
37,6
11.4
10,2
7,9
12,8
3,8
13,5
4,5
62,4
100,00
1988
27,6
~> 2
<0,l
5,6
35,5
12,7
10,0
7,8
12,5
3,8
13,3
4,4
64,5
100,00
1989
27,8
•» i
<0,l
5,6
35,7
13,0
9,9
7,4
12,9
3.2
13,6
4,3
64.3
100,00
1990
29,0
2,3
<0,l
6,0
37,4
13.9
9.0
7.0
13,0
4.0
14,1
1,6
62.6
100.00
To sum up, textile processing operations differ widely from one another both vertically
and horizontally. Further differences in water and effluent parameters are introduced due
to fashion and seasonal market forces, which affect the type of fibre, processing and
finishing used. Specific parameters such as specific water intake (SWI), specific effluent
volume (SEV) and specific pollution load (SPL) thus each have relatively wide ranges,
as outlined in Section 3.
Approximately 30 x 10* nvVa of water is taken in by the Industry, and around 70 to 80%
of the water intake is discharged as industrial effluents. The industrial waste waters
generated are characteristically high in dissolved solids, heavy metals and colour, and
contain relatively poorly degradable organic components.
The information used in this Guide has been collected from on-site surveys of twelve
major textile factories, mainly in the Western Cape but also in the Eastern Cape (one
factory) and Natal (one factory). Data on four other plants was obtained by post and
telephone. Supplementary information on water use and effluent generation in the
Industry has also been collated from published data on other Water Research Commission
projects(2-3-4'.
- 2 -

2 PROCESS RESUME
2.1 Categorization of the industry
Processing in the Industry is carried out by a group of related industries using a variety
of natural and/or synthetic fibres as stock; blending and spinning of various types of fibre
as required to produce specific yarn mixes; weaving and knitting processes to produce
fabric; bleaching, dyeing, printing and finishing of the fabric; and manufacture of soft
piece goods from fabric. The fibre concerned may be dyed and finished in one or more
forms as stock, yarn, fabric or garments. In this guide, the focus is on the "wet"
operations and sectors in the Industry.
FIBRE STOCK(cotton, wool, synthetics)
BLENDING
SPINNING
YARN PROCESSING
WOVEN FABRIC KNITTED FABRIC MOW-WOVEN FABRIC
FABRIC PROCESSING
PIECE GOODS GARMENTS CURTAINING,UPHOLSTERY
FIGURE 2.1 OVERALL PROCESSING IN THE TEXTILE INDUSTRY
The Industry is by nature highly diversified, and various bases may be adopted to
rationalize a description of the Industry; the basis of categorization chosen should be
selected appropriately for the purpose concerned.
In the context of this guide, three methods of classification are considered, firstly in terms
of the unit operations carried out. secondly on the basis of mill type, and thirdly
according to the processing sequences applicable to the major fibre types. No single basis
provides a complete and definitive classification: in each case other relevant factors must
be cross-correlated, for example in describing a sector of the Industry by mill type, other
factors such as fibre type(s), the range and type of processing operations carried out, the
end-products produced and even the type of machinery employed may all significantly
affect the water intake and effluent generation to be expected.
- 3 -

In Section 2.2 the unit operations carried out by the Industry are described, and in
Section 2.3 the major types of mill are described briefly as this gives a useful background
for describing various sectors of the Industry. In Section 2.4 the sequences of unit
operations involved in the processing of the major fibre types are outlined. Water intake,
water use and effluent generation in the Industry are discussed in Chapter 3 on the basis
of unit operations, as this approach is best suited to assessing the relative efficiencies
(with regard to water and waste-water management) of comparable operations carried out
at different textile mills.
2.2 Unit operations in textile processing
Many water-using steps in textile processing are common to a number of different fibre
types, although the specific water use may vary according to fibre type, equipment,
methods, and other factors. The major unit operations are described briefly in the
following, with reference to their application as appropriate to different fibre types:
Opening, picking and blending are operations where bales of raw fibre are opened and
picked to remove trash, seed and short fibre before being blended together
(e.g. cotton/polyester) as required.
Combing and carding are operations where the fibre is cleaned, the long axes of the
fibre are aligned, and further removal of short fibre takes place.
Spinning is a mechanical operation in which the fibres are drawn out into yarn and a
twist is introduced to produce yarns for dyeing, finishing, knitting, or weaving, as
required.
Sizing is the coating of yarns with a film of the sizing agent to provide protection from
abrasion during weaving, to strengthen the yarn and to reduce yarn hairiness. Sizing
agents used may be either natural or synthetic e.g. starch, modified starch compounds,
poiyvinyl alcohol, carboxymethyl cellulose, and mixtures of these.
Weaving is a dry process but is normally carried out under controlled high-humidity
conditions to minimize yarn breaks on the loom, as the size film is flexible under such
conditions.
Singeing of woven fabric is carried out to remove surface hairiness-
Knitting is also a dry process but knitting oils are applied to reduce friction and breaking
of the yarn, and these oils (typically 0,5 to 3,0% m/m) have subsequently to be removed
for further processing.
- 4 -

Desizing is the removal, after weaving, of the sizing agent applied. Enzymatic
degradation is used to desize starch sizes, which cannot therefore be effectively
recovered, while synthetic sizes can he recovered inter alia by membrane techniques.
Wool is not desized. the sizing agent remaining on the fibre.
Dyeing is carried out on either the stock, yarn or fabric (knitted or woven) using various
classes of dyestuff (for example direct, sulphur, pigment, vat. reactive, acid, disperse or
cationic) as appropriate for the fibre concerned. The dyeing methods used may be either
batch or continuous, may be carried out using a variety of equipment types (e.g. jig, jet,
beam) and may be carried out with the fabric either in rope or in open-width form.
Where blends are dyed, the fibres concerned are dyed separately because of the
differences in their chemical composition. Depending on the combination of factors
involved, water use at the dyeing stage varies widely. The chemical conditions under
which the dyestuff is applied depend on the fibre type and the dyestuff type, and the
resultant effluents thus also vary widely in terms of pH, dissolved solids and colour.
Printing of fabric is carried out using similar classes of dyestuff as used for the dyeing
of yarn or fabric, but applied as a paste using, for example, hydrocarbons or alginates
which are then dried (baked), fixed and washed off. Ranked generally in order of
decreasing water use and effluent generation, printing methods range from conventional
printing using diffusing dyes (direct, acid metal complex, reactive, disperse, vat and
cationic) to pigment printing (with or without hydrocarbons) to transfer printing.
Scouring processes are used extensively to remove inherent or added impurities in raw
fibre or fabrics. Wool is scoured using sodium carbonate and detergents. Cotton is
scoured with hot (boiling) sodium hydroxide solutions and detergents to remove naturally
occurring waxes and added processing oils. Polyester is scoured at lower temperatures
(typically 60°C) and under more mild alkaline conditions to avoid excessive
saponification of the fibre. Polyester/cotton blends are scoured under intermediate
alkaline and temperature conditions. Scouring effluents are generally alkaline and high
in sodium content.
Mercerizing is a treatment given to cotton fibre, under tension, using a concentrated
sodium hydroxide solution at 22 to 26% m/m. to improve various properties of the fibre
such as reflectance, lustre, tear strength, dyeability and dimensional stability. The
tensioned cotton is immersed in the mercerized liquor, generally at 13 to 15°C but
sometimes at elevated temperatures (up to 40°C). After mercerizing the fibre is rinsed
extensively and neutralized using a weak organic acid such as acetic or formic acid.
Mercerizing effluents consist of the rinse waters and are generally characterized by being
highly alkaline (pH > 13,5). high-temperature (up to 100°C. due to the exothermic
nature of the process) and with high residual concentrations of sodium hydroxide (27 to
80 g/f has been reported1"11).
- 5 -

Bleaching is carried out using oxidizing agents such as hydrogen peroxide or
hypochlorite solutions with the aim of reducing the natural colour of the yarn or fabric.
Finishing operations include various processes to improve the stability and quality of
handle of the fabric (e.g. softening, crease resistance) and to impart special properties
(e.g. stain resistance, flame proofing, etc.)
The unit operations described briefly above are applied as indicated to various fibre types. Two unit
operations which are used only for wool processing are:
Carbonizing, where the wool is treated with sulphuric acid to remove residual organic
matter; and
Fulling, where the wool is mechanically worked wet, with the addition of detergents, to
improve the stretch characteristics of the material (worsteds and wool blends are not
fulled).
2.3 Textile mill types
The main types of textile mill include the following:
(a) Dry processing mill (Figure 2.2)
At dry processing mills, raw fibre stock is taken in to produce either spun yarn or we ven
fabric for forwarding respectively to stock yarn dyeing and finishing mills or woven
fabric finishing mills. In the RSA. dry processing mills are usually integrated on the
same site with further processing mills.
(b) Woven fabric finishing mill (Figure 2.3)
Woven fabrics involving cotton are sized at the dry processing mill stage. At woven
fabric finishing mills, extensive pretreatment is then carried out to prepare the fabric for
dyeing or printing, where it is common for mills to carry out both processes. Finishing
operations carried out depend on the fibre type and the properties required, for example
woven fabrics involving cotton are usually finished with a resin/softener combination to
give crease-resistant properties, whereas woven synthetics are usually just softened.
- 6 -

(c) Knit fabric finishing mill (Figure 2.4)
Knitted cotton fabric is prepared for dyeing and/or printing similarly as for woven cotton
fabrics, except that different equipment is used and the fabric is usually not resin-finished.
Knitted synthetics are given a light scour to remove knitting oil and are then dyed or
printed. A softener is applied during finishing.
(d) Wool scouring mill (Figure 2.5)
Raw wool contains a high proportion of impurities (typically 60% by mass) including
dirt, suint, grease and vegetable matter, and wool scouring thus produces an effluent with
very high organic and inorganic pollutant loads. In the RSA, wool scouring is carried
out using sodium carbonate and detergents in sequential bowl scouring stages to clean the
wool. Water use and effluent management in wool scouring mills have been dealt with
in a separate WRC project161.
(e) Wool finishing mill (Figure 2.6)
The wool top is generally blended and scoured to remove oils, etc., before dyeing of the
fibre, which may be carried out on the stock, yarn or fabric. Most wool finishing mills
also produce wool/synthetic blends. 100% woollen goods are fulled in the presence of
detergents to improve dimensional stability of the material. Worsteds and wool-synthetic
blends are not fulled.
(f) Stock and yarn dyeing and finishing mill (Figure 2.7)
Cotton yarns are bleached and occasionally mercerized, before being dyed and softened,
while synthetic yarns are given a light scour before being dyed and softened.
(g) Carpet mill (Figure 2.8)
Carpets are either woven with pre-dyed yarn or are dyed or printed after weaving, using
techniques appropriate to the type of fibre involved. After being washed and dried, a
later foam backing is often applied to stabilize the pile.
(h) Other
Contract dyehouses take in a variety of fibre and fabric types and carry out a wide range
of dyeing and finishing operations using batch or continuous processing methods.
- 7 -

2.4 Processing sequences for major fibre types
Major steps in the processing of cotton are illustrated in Figure 2.9, which shows also at which
unit operations liquid effluents and solid wastes are produced.
Major steps in the processing (excluding scouring) of wool are illustrated in Figure 2.10,
showing also at which unit operations liquid effluents and solid wastes are produced.
Major steps in synthetics processing are illustrated in Figure 2.11. Synthetics used commonly
in the Industry to produce a wide range of products include polyester, acrylics, viscose (rayon)
and nylon. The processing requirements, in particular for dyeing, vary widely due to the
differing chemical compositions of the various synthetic fibres. Where blends are produced,
as in polyester-cotton blends, the two fibres are either dyed separately, i.e. two dyeing effluents
are generated, or the blend is dyed, generating a single dyeing effluent.
Production of garment, accessory and haberdashery materials involves a wide range of
processes, sometimes including dyeing and finishing and therefore with a significant impact on
water and effluent. Large numbers of workers are employed in this sector of the textile
industry, and significant quantities of solid waste (and sometimes liquid effluents) are produced
in some of the processing activities involved.
RAU FIBRE STOCK
OPENING, PICKING, BLENDING
CARDING
YARN TO KNIT FABRIC FINISHING MILL
SIZING h — — • YARN TO YARN DYEING AND FINISHING MILL
WEAVING
UOVEN GREIGE FABRIC
TO WOVEN FABRIC FINISHING M I L L
FIGURE 2.2 SCHEMATIC DIAGRAM OF DRY PROCESSING MILL
UOVEM GREIGE FABRIC
OESIZING
SCOUR AND UASH
MERCERIZE AND UASH
BLEACH AND UASH
DRYING
PRINT DYE AND UASH
DRYING AND FINISHING
i| FINISHED UOVEM FABRIC |
TO WOVEN GARMENT MANUFACTURERS
FIGURE 2.3 SCHEMATIC DIAGRAM OF WOVEN FABRIC FINISHING MILL
KNIT GREIGE FABRIC
SCOUR AND UASH
BLEACH AND UASH
DYE AND UASH
DRY
UASH
WET PAD FINISHING
DRY FINISHING
FINISHED KNIT GOODS
FIGURE 2.4 SCHEMATIC DIAGRAM OF KNIT FABRIC FINISHING MILL
- 9 -
RAW WOOL FIBRE
OPENING & PICKING
SCOUR AND UASH
I[ SCOURED UCOL TOP |
TO WOOL FINISHING MILL
FIGURE 2.5 SCHEMATIC DIAGRAM OF WOOL SCOURING MILL
UOOL TOP
BLENDING
OILING
TOP PREPARATION AND DYEING
T| TO HOH-UOVEN GOODS
CARDING
SPINNING
SIZING
iWEAVING KNITTING
*
CARBONIZING
YARN PREPARATION AND DYEING
YARN FINISHING
| FINISHED WOOl YARN |
SCOUR AND RINSE
FULLING WORSTED WOOL
FABRIC FINISHING PIECE GOODS PRETREATMENT, DYEING AND FINISHING
SPECIAL FINISHING
MECHANICAL FINISHING
| FINISHED'WOOL FABRIC OR PIECE GOODS |
FIGURE 2.6 SCHEMATIC DIAGRAM OF WOOL FINISHING MILL
- 10-

COTTON Oft COTTON-BLEND STOCK OR YARN SYNTHETIC FIBRE STOCK OS YARN
MERCERIZE
1
BLEACH
SCOUR
DYEING
FINISHED STOCK OR TARN
FIGURE 2.7 SCHEMATIC DIAGRAM OF STOCK OR YARN DYEINGAND nNISHING MILL
YARN
TUFTING
PIECE DYEING AND PRINTING
DRYING
LATEX BACKING
FINISHED CARPET
PRE-DYEDYARN
FIGURE 2.8 SCHEMATIC DIAGRAM OF CARPET MILL
- 11 -

| RAU
\
SIZING
1UEAVING
I| WOVEN GfiEIGE
1MERCERIZE
1rDESIZING
BLEACH & RINSE
IDYEING/PRINTIN
lOTTOM STOCK (BALED) |
iOPENING,PICKING &BLENDING
— * SU
r
COMBING,CARDING &SPINNING
— • SU
COTTOKYARN
• • LE
KNITTING
1| KNIT GREIGE |
— • LE
1—* LE SCOUR & RINSE
OR I
BLEACH & RINSE [—.
Ih - • L E
J|—* LE
|DYEING/PRINTINGI—.
IDRYING & FINISHINGL
—
••
YARN PRETREATMENT jDYEING AND FINISHING. »LE
t
FINISHED YARN ]
LE
LE
- LE
—* LE
DRYING & FINISHING)—» LE |FINISHED KNITTED FABRICJ
|FIHISHED WOVEN FABRIC)
IMANUFACTURING
IWOVEN GARMENT
MANUFACTURING!
—*• SU
1
1CNITTED GARHEN1
LEGEND
LE = LIQUID EFFLUENTS
SU = SOLID WASTE
FIGURE 2.9 MAJOR STEPS IN COTTON PROCESSING
- 12 -

RAU UOOL STOCK |
ISCOUR ANO
RINSELE
| UOOL TOP
BLEND
OILING
WOOL TOP PRETREATMENTOYEING AND FINISHING
TWOM-UOVEN GOODS |
LE
CARDING ANDSPINNING
UOOLYARN
SIZING
KNITTING/WEAVING
LE
UOOL YARN PRETREATMENTDYEING AND FINISHING
TLE
|FINISHED UOOL YARN]
CARBONIZING LE
SCOUR & RINSE
FULLING
LE
WORSTED WOOL
BLEACHING & RINSING LE
DYEING LE
FINISHING LE
[ FINISHED UOOL FABRIC |
TMANUFACTURING SW
LEGEND
LE = LIQUID EFFLUENT
SW = SOLID WASTES
FINISHED GARNENT GOODS
FIGURE 2.10 MAJOR STEPS IN WOOL PROCESSING
- 13 -

SYNTHETIC FIBRE STOCK
BLEN
CARDING AND SPINNING — • SU
SYNTHETIC YARN SYNTHETIC YARN PRETREATMENTDYEING AND FINISHING
KNITTING/WEAVING
PRETREATMENT,DYEING ANDFINISHINGACCORDING TOFIBRE TYPEAND BLEND
SU
LE
FINISHEDSYNTHETIC
FABRIC
MANUFACTURING SU
FINISHED GARMENT GOODS
LE
LEGEND
LE - LIQUID EFFLUENT
SU = SOLID UASTE
FIGURE 2.11 MAJOR STEPS IN SYNTHETICS PROCESSING
- 14-

3 SUMMARY OF WATER USE AND EFFLUENT GENERATIONIN THE INDUSTRY
3.1 Introduction
The textile industry is extremely diverse and varied, not only vertically (e.g. mill type and finalproducts) and horizontally (e.g. fibre type, fibre form, method of dyeing, dyeing equipment,pre- and post-treatment requirements, etc.) but also time-wise by season and according tomarket and fashion trends. Some factories surveyed produce essentially a single fibre type orblend, on a continuous basis, while in others (e.g. commission dyehouses) the materials handledand methods can vary hourly on a batch-wise basis.
A number of projects sponsored by the WRC have been aimed at identifying water use andeffluent generation in various sectors of the textile industry. In the present project, a cross-section of textile mills was surveyed, as summarized in Appendix A. The results were foundto be generally within the range reported previously12-3-4-3i 6 7-101.
3.2 Water intake and water use
The overall water intake at a textile plant may be broken down into water used for processing,for utilities and for amenities as follows:
• Water use for processing depends on a number of factors (e.g. fibre type, type of mill, dyetype, dyeing and/or printing processes, dyeing and/or printing equipment, etc.) and is bestdescribed in terms of unit operations.
• Water use for utilities (water treatment, boilers, cooling, steam drying, air conditioning,humidifying, etc.), depends on site specific factors, but is typically 5 to 10% of the overallwater intake.
• Water use for amenities (ablutions, gardens, etc.) is significantly affected by the numberof workers employed on site, and. in "dry processing" operations such as garment manufac-ture, can account for up to 100% of the overall water intake.
Because of the factors indicated above, the water use for processing, amenities and ablutionsrespectively at different textile plants can constitute very widely varying proportions of thewater intake, as illustrated in Figure 3.1. Similarly, where wet processing is carried out, theoverall specific water use (SWU, ?/kg) for processing will depend on both the nature and thewater-efficiency of the wet-processing operations involved. The SWU for processing can thusvary widely, as illustrated in Table 3.1 and as detailed in other WRC studies l-31.
- 15-

WATER USE
0 -
FOR
90%
PROCESSING
OF UI
WATER INTAKE (WI)
100%
WATER USE FOR AMENITIES
5 - 10% OF WI
WATER USE FOR ABLUTIONS
5 - 90% OF WI
FIGURE 3.1 BREAKDOWN OF SPECIFIC WATER USE FOR PROCESSING
TABLE 3.1 RANGE OF SPECIFIC WATER USE (SWU) VALUESFOR WET-PROCESSING STEPS
PROCESS STEP
SingeingSizing - woven goodsDesizingScouringMercerizingBleachingDyeingPrintingWashing-off printsFinishing
Overall (typical)*
RANGE* IN SWU FOR PROCESSING STEPS (f/kg)
LOW VALUE
1154610932913
100
HIGH VALUE
22152517
10033033
505134
300
• Note that lor some types of fibre or product, one or more of the processing steps indicated may not be
carried out at all, in which case the lower limit would be zero. The "overall (typical)" SWU values given
are thus not obtained by summing the individual values in Table 3 1 .
From Table 3.1, it may be noted that the largest area of variation in processing SWU values
is in dyeing and printing, where the following factors significantly affect the SWU for dyeing
and/or printing;
• the fibre types and blends being processed, and their proportions;
• the fibre form (stock, yarn, woven fabric, knitted fabric, piece goods);
• pretreatment and post-treatment requirements.
• the dyeing mode (batch, continuous);
• dye class, equipment and the liquor ratios employed;
• the range and depth of shade;
• the degree of re-processing involved;
• production variations due to fashion demands, colourage and seasonal changes.
- 16-

For any particular textile factory carrying out a set sequence of wet-processing operations, the
overall SWU for processing may he derived hy summing the SWU values for the individual
processing steps. A table of SWU breakdown, similar in form to Table 3.1 but reflecting only
the process water uses actually involved can then be constructed. An example is given in Table
3.2 for various wet-processing operations at a mill producing a 50/50 polyester/cotton blend and
carrying out both dyeing and printing'71.
TABLE 3.2 EXAMPLE OF PROCESSING SWU VALUES AT50/50 POLYESTER/COTTON MILL
PKOCKSS
SingeingSizingDesizingScouringMercerizingBleaching'1'Dyeing12)
Printing13'Finishing
Processing SWU
SWU (f/kg>
1.212.512.525.016.716.742.012,512.5
151.6
% OF PROCESSING SWU
1,08,28,216.511,011,027,78,28,2
100,0
Notes: (1) Based on woven goods; olher values'2' arc 83 f/kg for knit goodsand 100 f/kg for yarn goods.
(2) Based on various lypcs of dyeing for woven goods.(3) Based on pigment dyeing of woven goods; olher values1*1 range
up to 33 f/kg for vat dyeing.
From Table 3.2 it may be noted that dyeing and printing account for a large proportion (43%
in this case) of the SWU for processing. The SWU for dyeing and printing will vary from case
to case, and in some instances, (e.g. batch dyeing in a commission dyehouse), even from hour
to hour.
In view of the considerations presented, it is concluded that the Industry does not have a
meaningful national average specific water intake (NASWI) value. It has been estimated'71 that
the water intake by the Industry is around 30 000 Mf/a. Applying this figure to the annual
consumption of cotton, polyester, acrylic, nylon, viscose and wool by the Industry in the RSA
in 1990 (total 219 350 t/a. Table 1.1), a national average specific water intake of around
137 f/kg is indicated. As an example of the differences that can arise, however, at one factory
a change from 60% batch processing (40% continuous) to 8% batch processing (92%
continuous) was largely responsible for a reduction in SWI from 140 to 95 f/kg. As indicated
previously, such factory-specific or process-specific factors are more significant for a particular
factory at a particular time than an NASWI value.
- 17-

3.3 Effluent
Apart from evaporative losses, water is generally used non-consumptively in the wet processing
operations in textile processing, i.e. the effluent volume generated is approximately equal to the
water use at the processing step concerned. Specific effluent volumes (SEV) are thus typically
80-90% of the corresponding SWU value, which depends on the processing regime concerned
(Section 3.2).
From survey data obtained during a number of projects'"3'"*'101 carried out for the WRC, Table
3.3 summarizes pollutant loads for various wet preparation, dyeing and finishing operations in
terms of SEV and SPL (specific pollutant load) values. Note that effluent concentrations of
particular pollutant parameters may be obtained from : Concentration (rag/f) = 1 000
SPL/SEV.
TABLE 3.3 RANGE OF SPECIFIC POLLUTANT LOADS (SPLs)
IN TEXTILE PROCESSING
UNIT OPERATION
Singeing
Desizing
Scouring
Mercerizing
Bleaching
Dyeing - cotton, direct
Printing
Finishing
SEV(//kg)
1,1
12,5
25.0
16,7
16.7- 100.0
10.8 - 120.0
12- 400
12,5
pll
6 - 8
6 - 8
12
12
10
3 - 12
6 • 1 1
6 - 8
COD
11
77 - 425
21 - 27
3 - 14
3
3.5 -123,5
3 - 75
12 - 120
SPL
ss
11
5 - 7 7
5
5
4
< 1
0 ,1-25
12-30
(g/kg)
TDS
2
20- 55
10
72 - 77
20
10 - 900
3 - 35
17- 22
COLOUR
0
0
0
0
0
0.5 - 2.1
0.1 -0 ,5
N.D.
Note : The ranges of values given are not necessarily comprehensive, since extreme values for minorfibre types or operations are not necessarily included and may lie outside the ranges quoted.
There are wide variations in the SEV and SPL values for the various unit operations
depending18' inter alia on the fibre form (yarn, woven, knit), the mode of processing (batch,
continuous), and the class of dyestuff (direct, reactive, vat. sulphur, dispersed, acid, basic).
Examples'4' of the ranges in values that occur are : SEV values for wool dyeing may range from
38 to 152 i/kg for wool top compared to worsted piece dyeing; SEV values for cotton dyeing
may range from 80 to 120 t/kg for different classes of dye; SPL values for dyeing 50/50
polyester/cotton may range from 57 to 192g TDS/kg for naphthol/dispersed versus
reactive/dispersed dyeing.
- 18-

The waste-water quality and specific effluent loads for factories surveyed are given in the
Appendix (Tables A.3 and A.4 respectively) for a range of types of mill, fibre types and
processing routes. In some cases, where the processing operations are relatively constant and
continuous, the average values are generally representative of the factory. In other cases, where
production processes vary significantly, the results obtained are indicative only of the effluent
quality during the survey period; widely different results could be obtained at other times.
In addition to the common pollutant parameters (COD, TDS. TDIS and SO4) identified in
Tables A.3 and A.4, dyehouse effluents can also contain significant concentrations of heavy
metals depending on the particular dyestuff employed. An example'41 for a particular dyehouse
is given in Table 3.4.
TABLE 3.4 EXAMPLE OF HEAVY METAL CONCENTRATIONS IN A DYEHOUSE
EFFLUENT
HEAVY METAL
Cadmium
Chrome
Copper
Iron
Mercury
Lead
Zinc
MEAN
(mg/n
0,12
0,85
1.08
2,10
0,85
0,27
0,77
RANGE
(mg/f)
-
0,3 -2.3
0,1 - 1,6
0.4 - 3,8
-
-
0,1 - 1,2
STANDARD
DEVIATION
-
1.0
0.8
-
-
-
0.6
It may be noted that if accurate data on process chemical quantities, liquor ratios, and
absorption and fixing ratios on the fibre are available for a particular process, the theoretical
pollutant load in the effluent may be calculated. This approach may have useful application in
particular cases.
- 19-

4 CONCLUSIONS AND RECOMMENDATIONS
4.1 Water intake
SWI values observed in the textile industry in the RSA range from 95 to 459 ?/kg. In view
of the diverse nature of the Industry in terms inter alia of the fibre type processed, fibre form,
pretreatment requirements, dyeing mode, dyeing methods, equipment, printing techniques and
finishing requirements, a narrow range in SWI values cannot be realistically expected.
Equally, it is not realistic to set specific targets for SWI for the Industry as a whole. This
would require a large number of process-specific target conditions, which would in practice be
unworkable for large sectors of the Industry.
It is therefore concluded that individual textile processing facilities must begin by developing
their own overall processing SWI values based on the SWU values applicable to the particular
processing steps being carried out. as described in Section 3.2. Once sufficient data has been
obtained, meaningful SWU and SWI targets can be set for the processes and factory.
It should be noted that in the water-scarce. South African context, a reduction in SWI could in
many significant cases be either the only or the most cost-effective means towards ensuring an
adequate water supply for future expansion of production.
In order to utilize the water intake more efficiently, two parallel requirements must be met,
namely:
• a suitable water management plan must be formulated and implemented, and
• methods of reducing water use must be identified and implemented.
4.2 Water management
Water management should aim firstly at reducing arbitrary variations in SWU and SWI values,
and secondly at reducing the absolute SWU and SWI values. A suitable approach to water
management for the textile industry is as follows:
• Available water resources and their cost, including the cost of treatment, if required, must
be assessed. Due account should be taken of expansion plans.
• Provision must be made to monitor comprehensively and accurately the existing water
intake and water use. This entails inter alia developing proper drawings of the water
reticulation system, rationalization of the water reticulation system (elimination of unneces-
- 2 0 -

sary cross-links, etc.), identification of all water using points, and the installation and
maintenance of water meters with recorders where necessary.
• Having installed an adequate metering system so that water intakes can be properly
accounted for, an appropriate routine system for monitoring individual water uses and
constructing a water balance must be adopted and implemented.
• The data obtained should be used by management to identify excessive water uses, wastages
and extraordinary occurrences and, very importantly, to ensure that theoretical minima (e.g.
machine settings, process requirements, etc.) are routinely attained.
• Operating personnel should be involved in the water management programme and be made
aware of the importance of water conservation.
• Opportunities for reducing specific water intake and improving the efficiency of water use
should be identified and acted upon.
4.3 Reduction in water use
Methods of reducing water use. i.e. improving water efficiency, include the following:
• Elimination where possible of batch equipment in favour of continuous processing (in a case
study, an increase from 40% continuous processing to 92% continuous processing was
largely responsible for a reduction in SWI from 140 to 95 f/kg).
• Use of water-efficient processes and equipment.
• Automated regulation of water flow on stoppage of machines.
• Selection of water-efficient dyeing methods.
• Further development of solvent-dyeing processes as opposed to aqueous-media dyeing.
• Proper design of rinsing operations according to engineering principles so as to provide
maximum water-efficiency.
• Continued and extended use of counter-current continuous rinsing techniques.
• Cascaded re-use of slightly contaminated final rinse waters for purposes requiring lesser
water quality standards e.g. cooling.
• Elimination of live steam heating and the provision of condensate return systems.
-21 -

• Consideration of water reclamation for re-use from effluents, for example by membrane
techniques.
• The introduction of closed-loop systems for size recovery from desizing effluents (where
applicable), to reduce water use and pollutant loads in sizing/desizing.
4.4 Effluent generation
The quantity (SEV) and quality (SPL/SEV) of textile effluents vary widely due to the diversity
of processing and other variables concerned. SEV values ranging from 106 to 413 (7kg were
observed. SPL values ranging from 9 to 352 g COD/kg, 101 to 762 g TDS/kg. 62 to 660 g
TDlS/kg and 19 to 225 g SO4/kg were determined, and high levels of heavy metal
contamination were noted in some dyehouse effluents.
For the same reasons cited for water intake (Section 4.1). it is impracticable because of the
diverse nature of the textile industry to set universal SEV or SPL targets. A similar approach
as described for SWU and SWI should be adopted to develop suitable SEV and SPL targets.
Proper account should be taken of the following characteristic features of textile effluents:
• High volumes arising from the extensive wet processing methods involved.
• High acidity and/or basicity, frequently with rapid and wide swings in pH as different
effluents predominate in the final effluent.
• High levels of dissolved solids.
• High levels of inorganic salts.
• Moderately high organic (e.g. COD) levels but relatively low biodegradability.
• High colour, depending on the dyeing process used.
• The possible presence of heavy metals, potentially at unacceptably high concentrations or
mass loadings.
The textile industry generally has difficulty in meeting waste-water discharge limits, particularly
with regard to dissolved solids, ionic salts. pH, colour and, sometimes, heavy metals. Even
where local discharge limits are met. the waste water discharged often poses problems to the
treatment authority because of its limited tractability and variable quality.
It should be noted that effluent discharge tariffs have increased rapidly in the recent past, a
trend that is set to continue in the future. This is of significance to the textile industry in view
-22 -

of the large effluent volumes generated and the high effluent discharge costs attracted, both
normally and as penalties for infringements of permissible discharge limits.
4.5 Effluent management
Pollutant loads in final effluents can be minimized by limiting and controlling pollutants at
source. Areas that should be given attention include the following:
• Segregation and appropriate separate treatment of high-strength effluents such as dyeing,
mercerizing, scouring and dyebath effluents.
• Dry collection techniques for chemical spillages, rather than flushing to drain.
• Minimizing effluent volume by reducing water use, while concomitantly reducing pollutant
losses to drain to ensure that effluent quality discharge limits are not exceeded.
• Identification and control or elimination of pollutant sources that pose special discharge
problems, for example detergents, oils, solvents, dyes and finishing agents.
• Substitution wherever possible of less aggressive processing chemicals as alternative for
toxic or highly polluting chemicals.
• Proper inventorying and control of the large quantities of chemicals routinely handled on
site.
4.6 Waste-water treatment
On-site effluent treatment methods that can be practised using established technology to achieve
significant improvement in the final waste-water quality discharged from textile processing
operations include the following:
• Sodium hydroxide recovery from highly alkaline mercerizing effluents; in addition to
reducing the excessively high pH of some final effluents, the high sodium content of the
final effluent is also reduced.
• Fine screening to remove lint etc. to reduce suspended solids in the effluent.
- 2 3 -

Balancing and/or storage of the final effluent to smooth out inter alia variations in quality;
an additional benefit is available from some municipalities in that if the balanced effluent
is discharged at night with proper flow control and recording, a substantial reduction in the
effluent discharge tariff is offered.
Adjustment of the pH of the waste water discharged using adequate pH control and
chemical dosing systems, to ensure permissible discharge limits are not exceeded.
Consideration can be also be given to the use of advanced waste-water treatment systems
for economically treating individual effluent streams, to reduce the pollution loads
discharged as well as offering potential benefits in terms of recovered and re-useable
materials.
- 2 4 -

REFERENCES
1. Funke, J.W. (1969) Industrial water and effluent management in the textile industry. CSIR
Technical Guide Kl 1, Pretoria.
2. Pollution Research Group(1983) A guide for the planning, design and implementation of waste-
water treatment plants in the textile industry. Part One : Closed loop treatment/recycle system
for textile sizing/desizing effluent. Dept. of Chemical Engineering. University of Natal.
Prepared for the Water Research Commission, Pretoria.
3. Pollution Research Group (1987) A guide for the planning, design and implementation of waste-
water treatment plants in the textile industry, Part Two : Effluent treatment/water recycle
systems for textile dyeing and printing effluents. Dept. of Chemical Engineering, University of
Natal. Prepared for the Water Research Commission, Pretoria.
4. Pollution Research Group (1990) A guide for the planning, design and implementation of waste-
water treatment plants in the textile industry. Part Three : Closed loop treatment/recycle options
for textile scouring, bleaching and mercerizing effluents. Dept. of Chemical Engineering.
University of Natal. Prepared for the Water Research Commission. Pretoria.
*5. Department of Water Affairs (1988) Management of the water resources of the Republic of
South Africa. Pretoria.
6. WRC Gubb & Inggs Project Reports 1984-89.
7. Water Research Commission (1976) Master plan for water management and effluent treatment,
including water recycle and the recovery of chemicals. Pretoria.
8. Funke. J.W. (1969) A guide to water conservation and reclamation in industry. CSIR Technical
Guide K9, Pretoria.
9. Brink, B. (1989) Personal communication. Textile Federation, ref BB/ft.
10. NATSURV Interim and Final Reports.
11. Keller. E (1992) Personal communication. Textile Federation.
- 2 5 -

A P P E N D I X
- 2 6 -

TABLE A.I SUMMARY OF TEXTILE MILLS SURVEYED
FACTORY
A
BC
D
EFG
HIJKL
M
N
0
P
Q
R
FIBRE RANGE
Poly-cotton, cotton
Cotton
Cotton, synthetics
Cotton
Cotton, synthetics
Synthetics, cotton
All
All
Synthetics, colton
Cotton
Wool, synthetics
Polyester-cotton
Cotton, synthetics
All
Wool, synthetics
Colton, synthetics
Cotton, synthetics
Cotton, synthetics
CLASSIFICATION
WFF
WFF
WFF
KFF, GAR
WFF
WFF
KFF, COM, GAR
COM
KFF
ACC, HAB
WFF, WOR
WFF
ACC
GAR
CAR
COM
WFF
WFF
PRODUCTION (kB/a)
> 2 000 000
942 300
1 413 000
1 056 000
1 93: 000
351 398
8 :50 000
1 993 500
686 700
1 250 000
N/A
N/A
980 000
N/A
N/A
N/A
N/A
* Codes: WFF
COM
ACC
WOR
KFF
GAR
HAB
CAR
woven fabric finishing;
commission dyehousc;
accessories manufacture;
worsted fabric finishing;
knit fabric finishing
garment manufacture;
haberdashery manufacture;
carpel manufacture
Note: N/A indicates rcpresenlalive production throughput not available.
- 2 7 -

TABLE A.2 SPECIFIC WATER INTAKE AT TEXTILE MILLS SURVEYED
FACTORY
A
B
C
D
E
F
G
H
I
J
K
L
M
N
O
TOTAL
MEAN
ANNUAL WATER INTAKE
(m3)
568 800
1 321 112
391 978
375 840
291 837
446 806
127 756
990 000
357 209
118 800
158 400
33 044
198 000
446 400
300 000
3 188 567
-
ANNUAL PRODUCTION
(kg)
> 2000 000
942 300
1 413 000
1 056 000
+ 1 932 000
N/A
351 398
8 250 000
N/A
686 700
I 320 000
72 000
N/A
N/A
N/A
18 023 348
SWI
(//kg)
284
140
277
356
< 151 (95)
N/A
364
120
N/A
173
120
459
N/A
N/A
N/A
177
Points to note in relation to Table A.2 are:
(a) Where different fibres arc processed at different times, for example in commission dychouses, an
average SWI over a period has been derived.
(b) Where only a fraction of production throughput is wet-processed (e.g. dyed and/or finished) on
site, due account has been taken in determining the appropriate SWI value.
(c) Where a textile factory cither exclusively or predominantly processes one fibre type to a relatively
small range of finished products, the SWI value is more representative than in cases where factory
operation is variable.
(d) In many textile factories, the material produced is affected by market and fashion trends and often
varies seasonally as well, both of which affect water usage for processing and hence SWI.
(e) Equipment variations and efficiency affect the SWI value when comparing apparently similar
operations.
- 2 8 -

TABLE A.3 WASTE-WATER ANALYSES AT TEXTILE MILLS
FACTORY
A
8
C
D
E
F
G
pll
9,3
9,9
6,9
9,7
11,15
6,5
8,5
COD <mg//)
1520
556
1585
515
2686
190
81
TDS (mg//)
N.D.
1296
2231
2467
4850
1454
950
TDIS (mg//)
1396
N.D.
1643
2135
2450
954
587
SO4 (ing//)
989
N.D.
767
N.D.
350
295
181
N.D. = not determined
TABLE A.4 SPECIFIC EFFLUENT LOADS AT TEXTILE MILLS
FACTORY
A
B
C
D
E
F
G
H
I
J
PRODUCTION
(kg/a)
+ 2 000 000
942 300
1 413 000
1 056 000
+ 1 932 000
351 398
8 250 000
686 700
1 320 000
72 000
SEV
«/kg>
2^7
115
t n
309
113
226
106
138
113
413
SIM. (g/kg)
COD
345
64
352
159
304
43
9
N.D.
N.D.
N.D.
TDS
N.D.
409
495
762
548
349
101
N.D.
N.D.
N.D.
THIS
317
N.D.
365
660
277
216
62
N.D.
N.D.
N.D.
SO,
225
N.D.
170
N.D.
40
67
19
N.D.
N.D.
N.D.
- 2 9 -


