1 POVERTY REDUCTION AND ECONOMIC MANAGEMENT (PREM) NETWORK www.worldbank.org/economicpremise MAY 2012 • Number 83 Economic Premise POVERTY REDUCTION AND ECONOMIC MANAGEMENT NETWORK (PREM) THE WORLD BANK Natural Capital and the Resource Curse Otaviano Canuto and Matheus Cavallari Natural Capital and Income Levels How to measure development progress? “While precise defini- tions may vary, development is, at heart, a process of building wealth—the produced, natural, human, and institutional capi- tal which is the source of income and wellbeing” (Andersen and Canuto 2011, xi). However one defines development, it supposes rising income levels and an underlying process of building and managing a portfolio of assets. At least in an ac- counting sense, such wealth accumulation spans the wide range of capital types mentioned above. The World Bank (1997, 2006, 2011) has started a break- through in national accounts toward capturing the span of as- sets. A set of wealth accounts covering a 10-year period, 1995 to 2005, for more than 120 countries is now available. This includes produced capital (machinery, structures, and equip- ment); natural capital (agricultural land, protected areas, for- An abundance of natural resources is intuitively expected to be a blessing. Nonetheless, it has been argued for some decades that large endowments of natural resources—oil, gas, and minerals in particular—may actually become more of a curse, often leading to slow economic growth and redistributive struggles (including armed conflict). Over the years, vast empirical literature has addressed this “paradox.” The literature has had to rely on proxies for natural resource abundance because of the lack of appropriate data, generating doubt on whether results would be similar if direct measures of natural wealth were available. This gap is now starting to be filled with the data series released by the World Bank (1997, 2006, 2011) on natu- ral capital and other forms of countries’ wealth. This note presents an analysis of these data to revisit some of the conclusions reached in the literature on the relationship between natural resource abundance and economic growth. The findings are in alignment with the view that there is no clear deterministic evidence of natural resource abundance as a curse or a blessing; therefore, the effect on a country depends on other determinants. ests, minerals, and energy); and intangible capital. The latter is clearly a wealth component requiring much further work. In- tangible capital is still measured as a residual, the difference between estimates of total wealth and the sum of natural and produced capitals: 1 “It implicitly includes measures of human, social, and institutional capital, which includes factors such as the rule of law and governance that contribute to an efficient economy” (World Bank 2011, 4–5). 2 Table 1 reproduces the aggregate figures of wealth and per capita wealth by type of capital and income group in 1995 and 2005 (World Bank 2011, 7). From an accountant’s perspective, there are some striking features regarding an archetype of prog- ress up the income-wealth ladder. First, the share of produced capital in wealth moves upward from low levels in low-income countries, but remains reasonably modest thereon. Figures for lower-middle-income countries are heavily influenced by the weight of China and by its extraordinarily fast pace of produced Public Disclosure Authorized Public Disclosure Authorized Public Disclosure Authorized Public Disclosure Authorized
Transcript
1 POVERTY REDUCTION AND ECONOMIC MANAGEMENT (PREM) NETWORK www.worldbank.org/economicpremise
MAY 2012 • Number 83
JUN 010 • Numbe 18
Economic Premise
POVERTYREDUCTION
AND ECONOMICMANAGEMENT
NETWORK (PREM)
THE WORLD BANK
Natural Capital and the Resource CurseOtaviano Canuto and Matheus Cavallari
Natural Capital and Income Levels
How to measure development progress? “While precise defini-tions may vary, development is, at heart, a process of building wealth—the produced, natural, human, and institutional capi-tal which is the source of income and wellbeing” (Andersen and Canuto 2011, xi). However one defines development, it supposes rising income levels and an underlying process of building and managing a portfolio of assets. At least in an ac-counting sense, such wealth accumulation spans the wide range of capital types mentioned above.
The World Bank (1997, 2006, 2011) has started a break-through in national accounts toward capturing the span of as-sets. A set of wealth accounts covering a 10-year period, 1995 to 2005, for more than 120 countries is now available. This includes produced capital (machinery, structures, and equip-ment); natural capital (agricultural land, protected areas, for-
An abundance of natural resources is intuitively expected to be a blessing. Nonetheless, it has been argued for some decades that large endowments of natural resources—oil, gas, and minerals in particular—may actually become more of a curse, often leading to slow economic growth and redistributive struggles (including armed conflict). Over the years, vast empirical literature has addressed this “paradox.” The literature has had to rely on proxies for natural resource abundance because of the lack of appropriate data, generating doubt on whether results would be similar if direct measures of natural wealth were available. This gap is now starting to be filled with the data series released by the World Bank (1997, 2006, 2011) on natu-ral capital and other forms of countries’ wealth. This note presents an analysis of these data to revisit some of the conclusions reached in the literature on the relationship between natural resource abundance and economic growth. The findings are in alignment with the view that there is no clear deterministic evidence of natural resource abundance as a curse or a blessing; therefore, the effect on a country depends on other determinants.
ests, minerals, and energy); and intangible capital. The latter is clearly a wealth component requiring much further work. In-tangible capital is still measured as a residual, the difference between estimates of total wealth and the sum of natural and produced capitals:1 “It implicitly includes measures of human, social, and institutional capital, which includes factors such as the rule of law and governance that contribute to an efficient economy” (World Bank 2011, 4–5).2
Table 1 reproduces the aggregate figures of wealth and per capita wealth by type of capital and income group in 1995 and 2005 (World Bank 2011, 7). From an accountant’s perspective, there are some striking features regarding an archetype of prog-ress up the income-wealth ladder. First, the share of produced capital in wealth moves upward from low levels in low-income countries, but remains reasonably modest thereon. Figures for lower-middle-income countries are heavily influenced by the weight of China and by its extraordinarily fast pace of produced
Pub
lic D
iscl
osur
e A
utho
rized
Pub
lic D
iscl
osur
e A
utho
rized
Pub
lic D
iscl
osur
e A
utho
rized
Pub
lic D
iscl
osur
e A
utho
rized
wb406484
Typewritten Text
wb406484
Typewritten Text
wb406484
Typewritten Text
wb406484
Typewritten Text
69260
wb406484
Typewritten Text
2 POVERTY REDUCTION AND ECONOMIC MANAGEMENT (PREM) NETWORK www.worldbank.org/economicpremise
capital accumulation, with the ex-China subgroup displaying numbers closer to a smoother evolution. It appears that cumu-lative savings used for investments in physical assets accompany and support the rise in income levels, but typically at a propor-tionate speed.
Secondly, intangible wealth is the largest single component of total wealth at all levels of income, but increasingly so as it moves to the upper-middle- and high-income levels. Increased educational attainments, as well as improvements in institu-tions, governance, and other intangible forms of wealth are im-perative if a country is to overcome “middle-income traps” (Ca-nuto 2011). The nexus with savings and investments is not as straightforward as in the case of produced capital, because the dynamics of intangible wealth accumulation—or depletion—depend to a large extent on factors of another nature (quality of education; institutional evolution; collective knowledge tacitly embedded in routines of firms, the public sector, organizations, and other social groups; and non-research- and development-derived technical progress).3
It follows that natural assets comprise a substantial por-tion of total wealth at low-income levels, decreasing in rele-vance—particularly compared to intangible wealth—if the econ-omy succeeds in moving up the income ladder. However, no matter how large or small that natural capital is, it combines with unskilled labor and existing intangible wealth to generate income, and the subsequent corresponding savings and invest-ments create new produced capital and intangible wealth.
As one might expect, levels and compositions of natural capital vary widely between countries (World Bank 2011, ap-pendix C). In all cases, however, if the use of nonrenewable natural capital—extractive resources such as oil, gas, and minerals—does not lead to the ac-cumulation of other forms of productive wealth, but instead is used to support con-sumption, there will be no income-generat-ing assets to replace it when it is exhausted. As for the renewable part of natural capital, such as forest land, inappropriate manage-ment regimes and property rights may also lead to wealth depletion.4
Natural capital also varies over time for reasons other than its use. The fact that it di-minishes in relative terms as a wealth compo-nent when the economy moves up the in-come ladder does not preclude it to rise in absolute terms as a result of technological changes or new discoveries. As Collier (2009, 2) has highlighted, this partially explains why paradoxically:
As of 2000, the typical square kilometer of the OECD had $125,000 of known subsoil assets
waiting to be exploited. In contrast, the aver-age kilometer of Africa had only $25,000 of known subsoil assets. Most likely, this re-flects a massive failure in the discovery pro-cess in Africa: the scope for resource extrac-tion may be five times what it currently appears to be.
Collier remarks that the discovery process depends upon “good governance,” a missing component of intangible wealth in many low-income countries.
Values of natural capital may also change as a result of het-erogeneity among natural resources. The value of existing as-sets may rise if increases of global production have to be based on less efficient sources at the margin. Such “rents” tend to be reflected in the value of natural capital in countries well en-dowed with high-quality resources.
One may then guess that abundance of natural capital—as measured by per capita natural wealth—is in principle favorable to raising per capita income levels. Furthermore, the average archetype of wealth-cum-income progression depicted in table 1 may take place with different shares of natural wealth in dif-ferent countries. This is illustrated by the different wealth com-positions as of 2005 among high-income countries (the United States, Japan, Norway, Canada, and Australia), as well as among middle- and low-income countries (table 2).
Differences in the quality of natural resources may also ex-plain why countries with different levels of technological achievement can have similar income levels. The World Bank (2007) developed country indexes of technological achieve-ments and showed their (nonlinear) relationship with income
Income group
1995
Total wealth (US$
billions)
Per capita wealth (US$)
Intangible capital
(%)
Produced capital
(%)
Natural capital
(%)
Low income 2,447 5,290 48 12 41
Lower-middle income 33,950 11,330 45 21 34
Upper-middle income 36,794 73,540 68 17 15
High-income OECD 421,641 478,445 80 18 2
World 504,548 103,311 76 18 6
2005
Low income 3,597 6,138 57 13 30
Lower-middle-income 58,023 16,903 51 24 25
Upper-middle income 47,183 81,354 69 16 15
High-income OECD 551,964 588,315 81 17 2
World 673,593 120,475 77 18 5Source: World Bank 2011, 7.Note: Figures are based on the set of countries for which wealth accounts are available from 1995 to 2005. Data in this table do not include high-income oil exporters. OECD = Organisation for Economic Co-operation and Development.
Table 1. Wealth and Per Capita Wealth by Type of Capital and Income Group, 1995 and 2005
3 POVERTY REDUCTION AND ECONOMIC MANAGEMENT (PREM) NETWORK www.worldbank.org/economicpremise
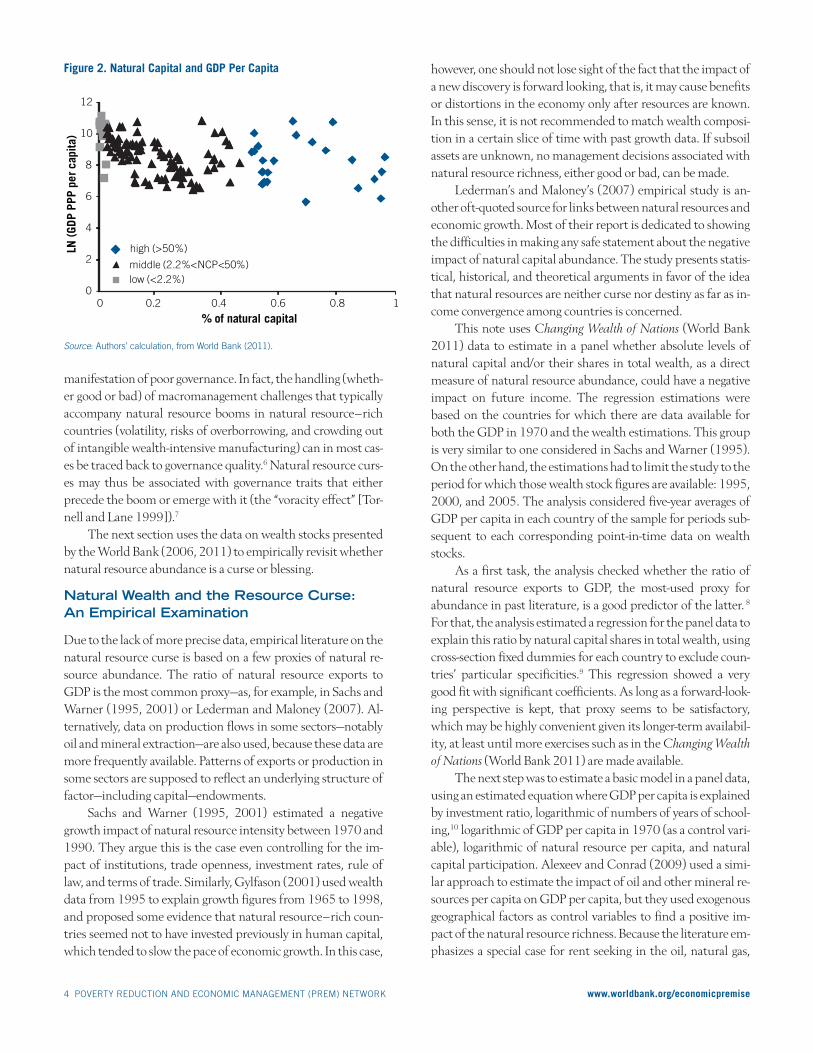
So, where can one locate a possible “natural resource curse”? Since country rankings by per capita income display several natural resource–rich countries at the top, there ap-pears to be no inevitable impediment to income growth associ-ated with abundance of natural resources. As one can see in figure 2, there is no clear pattern regarding gross domestic product (GDP) per capita and shares of natural capital. One can find 14 countries with GDP per capita higher than US$35,000 and natural wealth ratios ranging from almost zero up to 79 percent.
However, there is now enormous evidence, both system-atic and anecdotal, of cases in which natural resource discover-ies or appreciations, instead of being followed by a transforma-tion of natural capital into other forms of productive wealth through some virtuous process of savings and investment, were accompanied by stagnation or even income regression, general-ly in combination with political disruption.5
Brahmbhatt, Canuto, and Vostroknutova (2010) explain how certain conditions could result in situations where natural resource booms become a curse. Weak governance and corre-sponding poor economic policies underlie the misallocation and mismanagement of resources. Resources shift out of pro-ductive activities into unproductive rent-seeking activity when, for example, patronage networks are strengthened with their appropriation of fallen-from-heaven rents. It is not by chance that resource curse cases can be primarily associated with ex-tractive industries (oil, gas, and minerals) because these are “concentrated ‘point source’ resources that can easily become the object of rent-seeking and redistributive struggles” (ibid, 107), a point originally made by Collier and Goderis (2007).
Consumption use of tax revenues derived from natural resource extraction through public spending is also a typical
levels. On the other hand, many countries in Latin America and the Caribbean managed to reach middle-income levels with much less technological effort than others (figure 1). Pro-duced capital does not seem to explain such a discrepancy and, apart from non-technology-related intangible wealth, the high quality of known natural resources in the region—large swaths of arable land and mapped sources of oil and minerals—may
well be among the explaining factors.
Country
Total wealth per capita
(2005 US$)
Natural capital per capita (2005 US$)
Share of natural capital
(%)
Norway 861,797 110,162 12.8
United States 734,195 13,822 1.9
Japan 548,751 2,094 0.4
Canada 538,697 36,924 6.9
Australia 518,805 39,979 7.7
Brazil 79,142 14,978 18.9
Argentina 71,252 10,267 14.4
Malaysia 64,767 12,750 19.7
Botswana 58,895 5,420 9.20
Jordan 51,454 2,690 5.2
Nigeria 10,982 6,042 55.0
India 10,539 2,704 25.7
Malawi 3,471 1,170 33.7
Table 2. Shares of Natural Capital in Total Wealth Per Capita (Selected Countries)
Source: Authors’ calculation, from World Bank (2011, appendix C).
Figure 1. Technological Achievements Rise with Income Levels
Source: World Bank 2007, 84.
Latin America and the Caribbean
all countries
Europe and Central Asia
all countries.30
.05
0
.10
.15
.20
.25
5,00
0
40,0
00
35,0
00
30,0
00
25,0
00
20,0
00
15,0
00
10,0
00
inde
x
per capita income (PPPs)
her countries
atin America and the Caribbean
Middle Ea t a
-0.05
-0.10
East Asia and Pacific
high-income other countries
South Asia
Europe and Central Asia
Latin America and the Caribbean
Sub-Saharan Africa
high-income OECD countries
Middle East and North Africa
.25
.05
0
.10
.15
.20
2,00
08,
000
6,00
04,
000
inde
x
-0.05
-0.10
developing countries only
per capita income (PPPs)
Europe and Central Asia
Latin America and the Caribbean
10,0
00
20,0
00
18,0
00
16,0
00
14,0
00
12,0
00
4 POVERTY REDUCTION AND ECONOMIC MANAGEMENT (PREM) NETWORK www.worldbank.org/economicpremise
manifestation of poor governance. In fact, the handling (wheth-er good or bad) of macromanagement challenges that typically accompany natural resource booms in natural resource–rich countries (volatility, risks of overborrowing, and crowding out of intangible wealth-intensive manufacturing) can in most cas-es be traced back to governance quality.6 Natural resource curs-es may thus be associated with governance traits that either precede the boom or emerge with it (the “voracity effect” [Tor-nell and Lane 1999]).7
The next section uses the data on wealth stocks presented by the World Bank (2006, 2011) to empirically revisit whether natural resource abundance is a curse or blessing.
Natural Wealth and the Resource Curse: An Empirical Examination
Due to the lack of more precise data, empirical literature on the natural resource curse is based on a few proxies of natural re-source abundance. The ratio of natural resource exports to GDP is the most common proxy—as, for example, in Sachs and Warner (1995, 2001) or Lederman and Maloney (2007). Al-ternatively, data on production flows in some sectors—notably oil and mineral extraction—are also used, because these data are more frequently available. Patterns of exports or production in some sectors are supposed to reflect an underlying structure of factor—including capital—endowments.
Sachs and Warner (1995, 2001) estimated a negative growth impact of natural resource intensity between 1970 and 1990. They argue this is the case even controlling for the im-pact of institutions, trade openness, investment rates, rule of law, and terms of trade. Similarly, Gylfason (2001) used wealth data from 1995 to explain growth figures from 1965 to 1998, and proposed some evidence that natural resource–rich coun-tries seemed not to have invested previously in human capital, which tended to slow the pace of economic growth. In this case,
however, one should not lose sight of the fact that the impact of a new discovery is forward looking, that is, it may cause benefits or distortions in the economy only after resources are known. In this sense, it is not recommended to match wealth composi-tion in a certain slice of time with past growth data. If subsoil assets are unknown, no management decisions associated with natural resource richness, either good or bad, can be made.
Lederman’s and Maloney’s (2007) empirical study is an-other oft-quoted source for links between natural resources and economic growth. Most of their report is dedicated to showing the difficulties in making any safe statement about the negative impact of natural capital abundance. The study presents statis-tical, historical, and theoretical arguments in favor of the idea that natural resources are neither curse nor destiny as far as in-come convergence among countries is concerned.
This note uses Changing Wealth of Nations (World Bank 2011) data to estimate in a panel whether absolute levels of natural capital and/or their shares in total wealth, as a direct measure of natural resource abundance, could have a negative impact on future income. The regression estimations were based on the countries for which there are data available for both the GDP in 1970 and the wealth estimations. This group is very similar to one considered in Sachs and Warner (1995). On the other hand, the estimations had to limit the study to the period for which those wealth stock figures are available: 1995, 2000, and 2005. The analysis considered five-year averages of GDP per capita in each country of the sample for periods sub-sequent to each corresponding point-in-time data on wealth stocks.
As a first task, the analysis checked whether the ratio of natural resource exports to GDP, the most-used proxy for abundance in past literature, is a good predictor of the latter. 8 For that, the analysis estimated a regression for the panel data to explain this ratio by natural capital shares in total wealth, using cross-section fixed dummies for each country to exclude coun-tries’ particular specificities.9 This regression showed a very good fit with significant coefficients. As long as a forward-look-ing perspective is kept, that proxy seems to be satisfactory, which may be highly convenient given its longer-term availabil-ity, at least until more exercises such as in the Changing Wealth of Nations (World Bank 2011) are made available.
The next step was to estimate a basic model in a panel data, using an estimated equation where GDP per capita is explained by investment ratio, logarithmic of numbers of years of school-ing,10 logarithmic of GDP per capita in 1970 (as a control vari-able), logarithmic of natural resource per capita, and natural capital participation. Alexeev and Conrad (2009) used a simi-lar approach to estimate the impact of oil and other mineral re-sources per capita on GDP per capita, but they used exogenous geographical factors as control variables to find a positive im-pact of the natural resource richness. Because the literature em-phasizes a special case for rent seeking in the oil, natural gas,
Figure 2. Natural Capital and GDP Per Capita
0
2
4
6
8
10
12
0 0.4 0.6 0.8 1
LN (G
DP P
PP p
er c
apita
)
% of natural capital
high (>50%)
low (<2.2%)middle (2.2%<NCP<50%)
0.2
Source: Authors’ calculation, from World Bank (2011).
5 POVERTY REDUCTION AND ECONOMIC MANAGEMENT (PREM) NETWORK www.worldbank.org/economicpremise
coal and mining sectors (that is, subsoil assets), this analysis replicates the estimations for three similar cases: (i) the total natural capital per capita and its share of total wealth, (ii) only the subsoil per capita and its abundance, and finally, (iii) simi-lar measures isolating agriculture assets per capita (for example, crop, land, and timber) from subsoil assets per capita, but also considering their share in total wealth.
Coefficients were significant to all independent variables except for the natural capital share in all the cases! As presented in table 3, the higher the levels of education, gross investment ratios, and natural capital per capita, the higher the GDP per capita. Regardless of whether natural resources are dominant or not, it just seems that in most cases new capital translates into more income. The model accounted for around 85 per-cent of the GDP per capita differential. In fact, as shown in fig-ure 2, there is no regular pattern between relative abundance of natural wealth and income levels, and thus no kind of natural resource curse can be depicted.
Intuitively, as confirmed by these results, the potential blessing associated with natural resource discoveries exists be-cause they expand the country’s stock of total capital. In this sense, nations can take advantage of the additional source of richness from the period of exploration until the complete de-pletion, lifting the GDP per capita. Clearly, the real challenge is to invest those rents in other productive assets, thereby generat-
ing other kinds of abundance for future generations and sus-taining income per capita at corresponding higher levels. To meet this challenge, responsible governments need to deal with intertemporal decisions, such as those embedded in fiscal and saving rules, coping with the volatility of this income stream while transitioning between the ex ante scarcity and the ex post abundance (Collier 2010).
Concluding Remarks
Using the data on the natural wealth of countries recently made available by the World Bank, this analysis could not find signifi-cant deterministic evidence of a direct negative relationship be-tween the abundance of natural resources and income per capi-ta levels, or the so-called “natural resource curse.” The results here align with others who have stressed that intangible wealth in the form of governance quality is a key determinant to the outcome of natural resource abundance as a blessing or a curse.
Three types of policies have been emphasized in the litera-ture as the safest way to make sure the bang from the natural resource buck is maximized, especially in the case of low-in-come countries for which the use of natural resources may be crucial for a leap upward in the income per capita ladder (Col-lier 2010; Brahmbhatt, Canuto, and Vostroknutova 2010). Ensuring high transparency and strengthened checks and bal-ances for all phases of natural resource extraction and use (terms of contracts, monitoring of operations, collection and use of taxes) are critical for a favorable outcome, as well as to minimize risks of rent capture by patronage networks and avoid premiums on rent-seeking behavior. By the same token, adopting fiscal rules to ring-fence investments from proceeds of overtime depletion of natural resources and to mitigate the ef-fects of the usual volatility associated with natural resource prices can reinforce the virtuous dynamics of wealth accumula-tion toward the upper scales of the income ladder. Reforms to improve public sector capacities in terms of public investment management, monitoring and evaluation, budget processes, and so forth will also help transform natural wealth into pro-
duced capital and intangible wealth.
About the Authors
Otaviano Canuto is the Vice President and Head of the Poverty Reduction and Economic Management (PREM) Network, and Matheus Cavallari is a Consultant for the PREM Network. The authors thank Taewon Um for his technical assistance, as well as Milan Brahmbhatt, Kirk Hamilton, Bernard Hoekman, Daniel Lederman, and Cara Zappala for their comments.
Notes
1. Total wealth is estimated as the present value of sustainable consumption along a 25-year time horizon, assuming the pure rate of time preference and the future rate of per capita con-
Table 3. Regression Results (1995–2005)
Dependent variable: Ln GDP (1) (2) (3)
GCF/GDP 0.072* 0.071* 0.036*
Ln GDP (1970) 0.797* 0.728* 0.485*
Ln YSC 0.436* 0.846* 0.858*
LNC—agriculture 0.311*
LNC—subsoil 0.039* 0.036*
LNC—total 0.053**
NCS—share 0.010
NCT—share 0.167 -0.150
Cross-sections 58 51 51
Total pool observations: 173 150 150
R-squared 0.84 0.81 0.89
Source: Authors’ calculations.Note: Method—pooled least squares. Variables are defined as: gross capital formation (GCF)/GDP, natural logarithmic of GDP per capita (Ln GDP), natural logarithmic of years of schooling (Ln YSC), natural logarithmic of natural capital per capita (LNC) considering the agriculture, the subsoil and the total, subsoil capital as share of the total wealth (NCS) and the same measure considering all natural capital (NCT). Estimations were calculated using ordinary least squares, as well as the generalized least squares, allowing for contemporaneous covariances and for serial correlation. In the first variant, case (1) and case (2) showed results very similar to the basic estimation exhibited in table 3, but in case (3), all the coefficients are significant. This was the only particular subcase of significant negative impact of natural capital share in GDP per capital among all nine subcases. When considering the serial correlation, the coefficients are very similar in cases (1), (2) and (3), but in case (1), the p-value for the coefficient of the LNC total was 11.5 percent.* Significant at 1 percent. ** Significant at 2 percent.
6 POVERTY REDUCTION AND ECONOMIC MANAGEMENT (PREM) NETWORK www.worldbank.org/economicpremise
sumption growth to be, respectively, 1.5 percent and 2.5 per-cent per annum (World Bank 2011, 94–95).2. Net foreign assets are also treated as part of intangible capital in most of the book.3. See, for example, Canuto (1995) on tacit and idiosyn-cratic features of knowledge and technologies. The collec-tive nature of knowledge and skills acquisitions is well captured in the concept of capabilities used by Haus-mann et al. (2011) as something that cannot be reduced to single “factors of production.” 4. The World Bank (2011, appendix D) provides esti-mates of national savings adjusted to be net of energy de-pletion, mineral depletion, forest depletion, and others. See also Hamilton and Ley (2010).5. See Frankel (2010) for a recent survey.6. Macroeconomic challenges associated with natural re-source booms in natural resource–rich countries are also present at higher income and better governance levels, as in the “Dutch disease” case of the Netherlands (Brahmb-hatt, Canuto, and Vostroknutova 2010).7. There is also the classical argument about a secular trend of deterioration of terms of trade for natural re-source sectors in comparison to all others. However, as Brahmbhatt, Canuto, and Vostroknutova (2010, 105) have argued: “On the basis of statistical properties alone, we have little reason to expect commodity prices to trend either up or down in the long term.” 8. Data were obtained from the World Bank’s World De-velopment Indicators database. The analysis team fol-lowed a suggestion first made by Edmar Bacha.9. The panel data regression was estimated using ordinary least squares and generalized least squares (allowing for serial correlation and contemporaneous covariances); all the coefficients are similar and significant at 1 percent, and average R-squared is close to 92 percent. 10. The database for years of schooling comes from Barro and Lee (2000) for 1995 and 2000, and it was assumed to stay constant after that.
References
Alexeev, M., and Conrad, R. 2009. “The Elusive Curse of Oil.” The Review of Economics and Statistics 91 (3): 586–98.
Andersen, I., and O. Canuto. 2011. “Foreword.” In The Changing Wealth of Nations: Measuring Sustainable Development in the New Millennium. Washington, DC: World Bank.
The Economic Premise note series is intended to summarize good practices and key policy findings on topics related to economic policy. They are produced by the Poverty Reduction and Economic Management (PREM) Network Vice-Presidency of the World Bank. The views expressed here are those of the authors and do not necessarily reflect those of the World Bank. The notes are available at: www.worldbank.org/economicpremise.
Brahmbhatt, M., O. Canuto, and E. Vostroknutova. 2010. “Natural Resources and Development Strategy after the Crisis.” In The Day after Tomorrow: A Handbook on the Future of Economic Policies in the Developing World, ed. O. Canuto and M. Giugale. Washington, DC: World Bank. www.worldbank.org/prem
Barro, R., and J. Lee. 2000. “International Data on Educational Attainment: Updates and Implications.” National Bureau of Economic Research Working Paper 7911, Cambridge, MA.
Canuto, O. 1995. “Competition and Endogenous Technological Change: An Evolutionary Model.” Revista Brasileira de Econo-mia.
———. 2011. Navigating the Road to Riches. Project Syndicate, July 12. http://www.project-syndicate.org/commentary/navigating-the-road-to-riches
Collier, P. 2009. “The Development Challenge for Natural Resource Exporters.” Joint DAC-EPOC High Level Meeting, Paris, May 28.
———. 2010. Plundering the Planet: Why We Must—and How We Can—Manage Nature for Global Prosperity. New York: Oxford University Press.
Collier, P., and B. Goderis. 2007. “Commodity Prices, Growth and the Natural Resources Curse: Reconciling a Conundrum.” Working Paper 276, Centre for the Study of African Econo-mies, Oxford.
Frankel, J. 2010. “The Natural Resource Curse: A Survey.” Faculty Research Working Paper Series RWP10-005, Harvard Kennedy School, February.
Gylfason, T. 2001. “Natural Resources, Education, and Economic Development.” European Economic Review 45: 847–59.
Hamilton, K., and E. Ley. 2010. “Measuring National Income and Growth in Resource-Rich, Income-Poor Countries.” Economic Premise, World Bank, Washington, DC.
Hausmann, R., Cesar Hidalgo, Sebastian Bustos, et al. 2011. The At-las of Economic Complexity: Mapping Paths to Prosperity. Center for International Development, Harvard University.
Lederman, D., and W. F. Maloney, eds. 2007. Natural Resources: Neither Curse nor Destiny. Washington, DC: World Bank; and Stanford, CA: Stanford University Press.
Sachs, J. D., and A. M. Warner. 1995. “Natural Resource Abun-dance and Economic Growth.” National Bureau of Economic Research Working Paper 5398, Cambridge, MA.
———. 2001. “The Curse of Natural Resources.” European Economic Review 45 (4–6): 827–38.
Tornell, A., and P. R. Lane. 1999. “The Voracity Effect.” American Economic Review 89 (1): 22–46.
World Bank. 1997. Expanding the Measure of Wealth: Indicators of Environmentally Sustainable Development. Washington, DC.
———. 2006. Where Is the Wealth of Nations? Measuring Capital for the 21st Century. Washington, DC.
———. 2007. Global Economic Prospects 2008. Washington, DC.———. 2011. The Changing Wealth of Nations: Measuring Sustainable
Development in the New Millennium. Washington, DC.