22
Natural Gas & Petroleum Systems - 2018 GHGI Public Review Draft Stakeholder Webinar March 1, 2018

Natural Gas & Petroleum Systems -2018 GHGI Public Review Draft
Stakeholder WebinarMarch 1, 2018
Outline
• 2018 Public Review (PR) Draft Greenhouse Gas Inventory (GHGI) Results Overview
• Changes from 2017 Final GHGI to 2018 PR GHGI • Improvements Under Consideration for 2018 Final GHGI and Future
GHGI• Requests for Stakeholder Feedback
2

2018 PR Results Overview
3
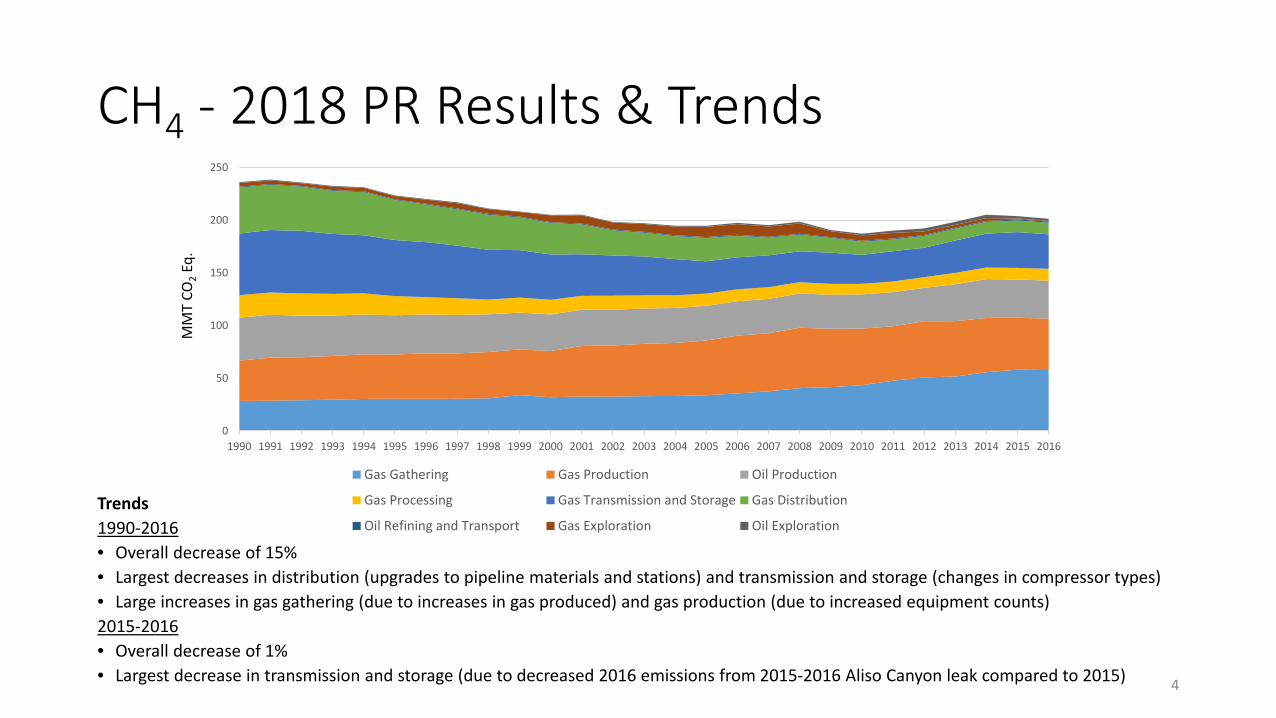
CH4 - 2018 PR Results & Trends
Trends1990-2016• Overall decrease of 15%• Largest decreases in distribution (upgrades to pipeline materials and stations) and transmission and storage (changes in compressor types)• Large increases in gas gathering (due to increases in gas produced) and gas production (due to increased equipment counts)2015-2016• Overall decrease of 1%• Largest decrease in transmission and storage (due to decreased 2016 emissions from 2015-2016 Aliso Canyon leak compared to 2015) 4
0
50
100
150
200
250
1990 1991 1992 1993 1994 1995 1996 1997 1998 1999 2000 2001 2002 2003 2004 2005 2006 2007 2008 2009 2010 2011 2012 2013 2014 2015 2016
Gas Gathering Gas Production Oil Production
Gas Processing Gas Transmission and Storage Gas Distribution
Oil Refining and Transport Gas Exploration Oil Exploration
MM
T CO
2Eq
.

CO2 - 2018 PR Results & Trends
Trends1990-2016• Overall increase of 34%• Largest increases in oil and gas production emissions (due to increased flaring, especially at tanks) 2015-2016• Overall decrease of 19%• Largest decrease in oil production (due to decreased flaring of associated gas)
5
0
10
20
30
40
50
60
70
1990 1991 1992 1993 1994 1995 1996 1997 1998 1999 2000 2001 2002 2003 2004 2005 2006 2007 2008 2009 2010 2011 2012 2013 2014 2015 2016
Gas Exploration Oil Exploration Gas Production Oil Production
Gas Processing Gas Transmission and Storage Gas Distribution Oil Refining
MM
T CO
2

Changes from 2017 Final to 2018 PR
6
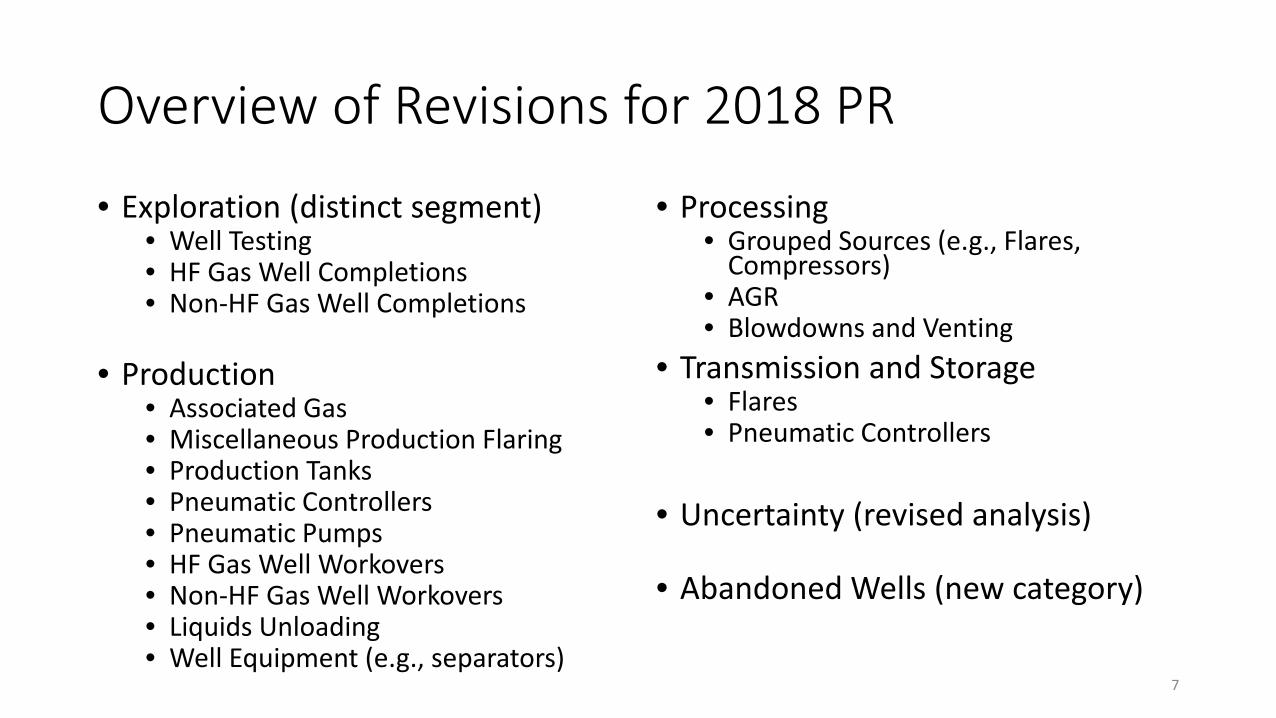
Overview of Revisions for 2018 PR
• Exploration (distinct segment)• Well Testing• HF Gas Well Completions • Non-HF Gas Well Completions
• Production• Associated Gas• Miscellaneous Production Flaring• Production Tanks• Pneumatic Controllers• Pneumatic Pumps• HF Gas Well Workovers• Non-HF Gas Well Workovers• Liquids Unloading• Well Equipment (e.g., separators)
• Processing• Grouped Sources (e.g., Flares,
Compressors)• AGR• Blowdowns and Venting
• Transmission and Storage• Flares• Pneumatic Controllers
• Uncertainty (revised analysis)
• Abandoned Wells (new category)
7
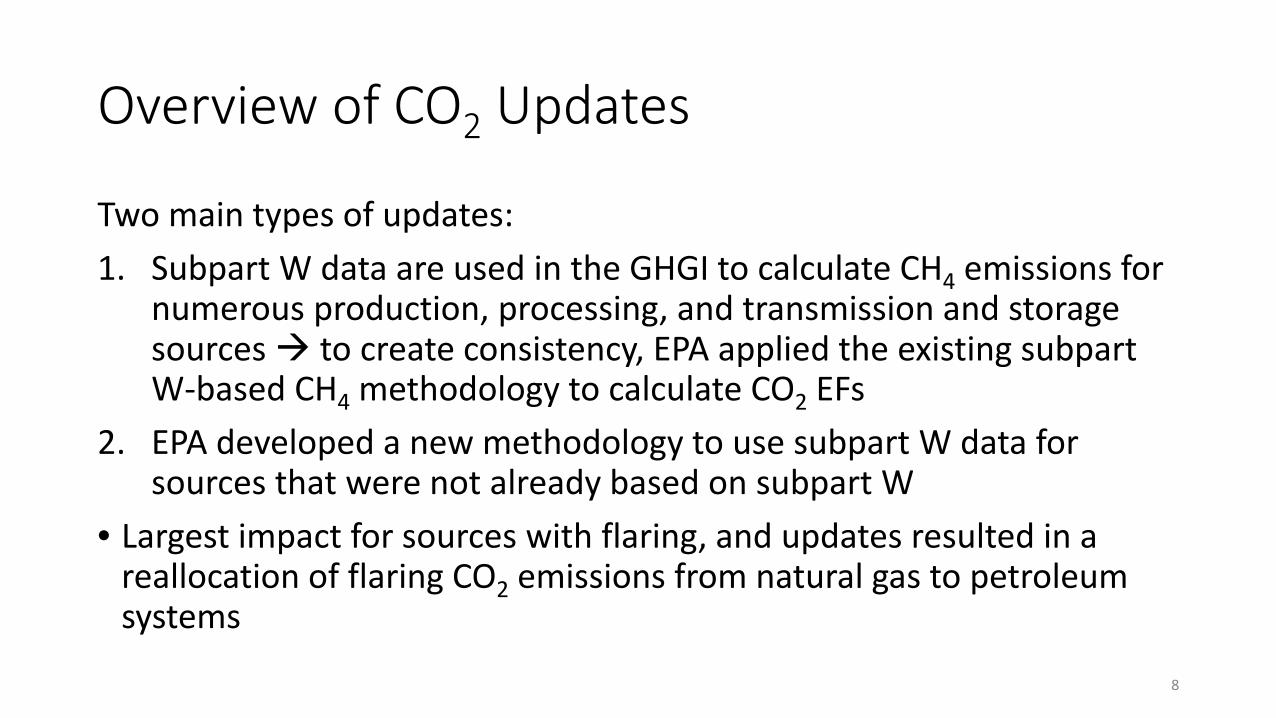
Overview of CO2 Updates
Two main types of updates:1. Subpart W data are used in the GHGI to calculate CH4 emissions for
numerous production, processing, and transmission and storage sources to create consistency, EPA applied the existing subpart W-based CH4 methodology to calculate CO2 EFs
2. EPA developed a new methodology to use subpart W data for sources that were not already based on subpart W
• Largest impact for sources with flaring, and updates resulted in a reallocation of flaring CO2 emissions from natural gas to petroleum systems
8

Overview of Uncertainty Updates
• Performed a detailed uncertainty analysis for sources that contribute 75% of emissions for natural gas and petroleum systems (i.e., modeled sources)
• A detailed uncertainty analysis was not conducted for the remaining sources (i.e., unmodeled sources)
• Used 2017 Final emissions and methodologies• There are 3 main steps to determine the total uncertainty:
1. Calculate uncertainty for each modeled source--characterize the probability density function for each input (e.g., EF and AF)
2. Estimate uncertainty for the unmodeled sources3. Combine uncertainty for the modeled and unmodeled sources to estimate source
category total uncertainty• For each step, Monte Carlo simulations were used (IPCC Approach 2)
9
AnalysisNatural Gas Systems Petroleum Systems
Lower Bound Upper Bound Lower Bound Upper Bound2011 Analysis -19% +30% -24% +149%2018 PR -15% +17% -32% +36%

Overview of Abandoned Wells Update
• New category for the Inventory• Plugged and unplugged EFs were developed at the national-level and
for the Appalachia region• Appalachia region EFs were applied to abandoned wells in the Appalachian
basin region, and the national-level EFs were applied to all other abandoned wells
• Population of abandoned wells, including split between plugged and unplugged wells, were based on Drillinginfo and historical data
10
YearAbandoned Well Count (millions) Plugging Status (%) Population in Each
Region (%)Total Gas Oil Unplugged Plugged Appalachia Other
1990 2.37 0.32 2.05 81 19 26 742016 3.35 0.72 2.63 69 31 24 76
Regional EFs (g/h/well) Unplugged Plugged
National 10 0.002Appalachian 23 0.36

Other Updates for 2018 PR
• Reorganized Inventory to include a specific exploration segment, which includes:
• HF and non-HF well completions• Well drilling• Well testing (new source)
• Updated well counts
11
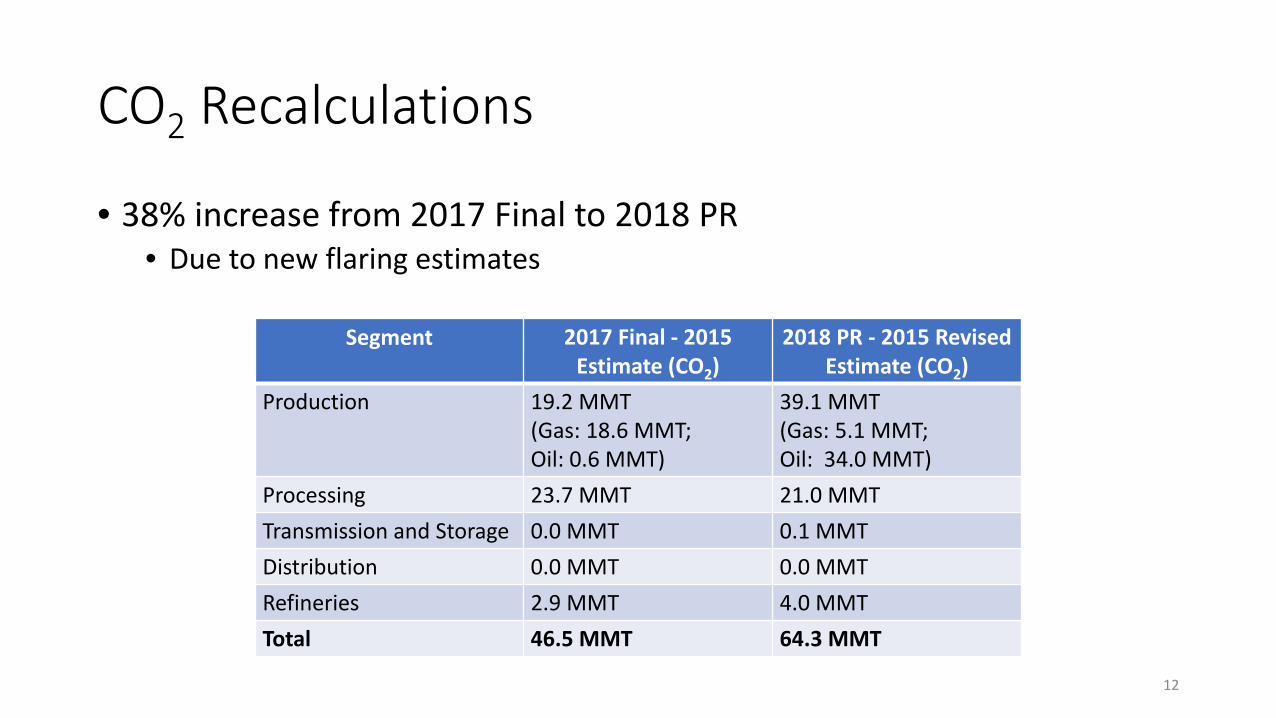
CO2 Recalculations
• 38% increase from 2017 Final to 2018 PR• Due to new flaring estimates
12
Segment 2017 Final - 2015 Estimate (CO2)
2018 PR - 2015 Revised Estimate (CO2)
Production 19.2 MMT(Gas: 18.6 MMT;Oil: 0.6 MMT)
39.1 MMT(Gas: 5.1 MMT; Oil: 34.0 MMT)
Processing 23.7 MMT 21.0 MMTTransmission and Storage 0.0 MMT 0.1 MMTDistribution 0.0 MMT 0.0 MMTRefineries 2.9 MMT 4.0 MMTTotal 46.5 MMT 64.3 MMT

CH4 Recalculations
• <1% increase from 2017 Final to 2018 PR
13
Segment 2017 Final -2015 Estimate (CO2e)
2018 PR – 2015 Estimate (CO2e)
Production 145.6 MMTCO2e(Gas: 106.6 MMTCO2e;Oil: 39.0 MMTCO2e)
146.8 MMTCO2e(Gas: 108.3 MMTCO2e;Oil: 38.5 MMTCO2e)
Processing 11.1 MMTCO2e 11.0 MMTCO2eTransmission and Storage 33.7 MMTCO2e 34.0 MMTCO2eDistribution 11.0 MMTCO2e 11.0 MMTCO2eRefineries and transport 0.8 MMTCO2e 0.9 MMTCO2eTotal 202.2 MMTCO2e 203.8 MMTCO2eAbandoned Wells N/A 7.2 MMTCO2e
(Gas: 1.4 MMTCO2e;Oil: 5.8 MMTCO2e)

Improvements Under Consideration for 2018 Final GHGI and Future GHGI
14

Stakeholder Feedback• EPA is seeking stakeholder feedback on updates in the public review
draft • EPA is considering implementing improvements to the updates in the
PR draft based on feedback received through 2017-2018 stakeholder process
• EPA is also seeking stakeholder feedback on potential updates for future GHG Inventories
• Public review draft comment deadline: March 9, 2018.• Instructions for how to comment on last slide
15
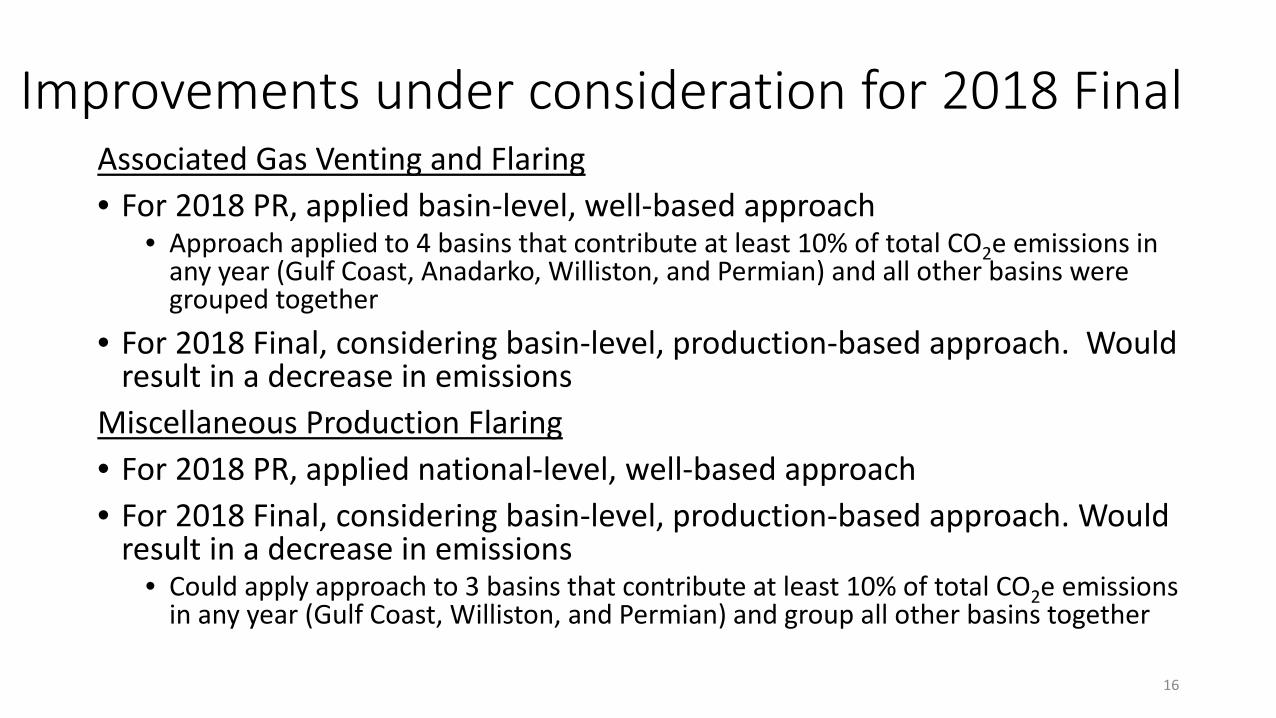
Improvements under consideration for 2018 FinalAssociated Gas Venting and Flaring • For 2018 PR, applied basin-level, well-based approach
• Approach applied to 4 basins that contribute at least 10% of total CO2e emissions in any year (Gulf Coast, Anadarko, Williston, and Permian) and all other basins were grouped together
• For 2018 Final, considering basin-level, production-based approach. Would result in a decrease in emissions
Miscellaneous Production Flaring• For 2018 PR, applied national-level, well-based approach• For 2018 Final, considering basin-level, production-based approach. Would
result in a decrease in emissions• Could apply approach to 3 basins that contribute at least 10% of total CO2e emissions
in any year (Gulf Coast, Williston, and Permian) and group all other basins together
16
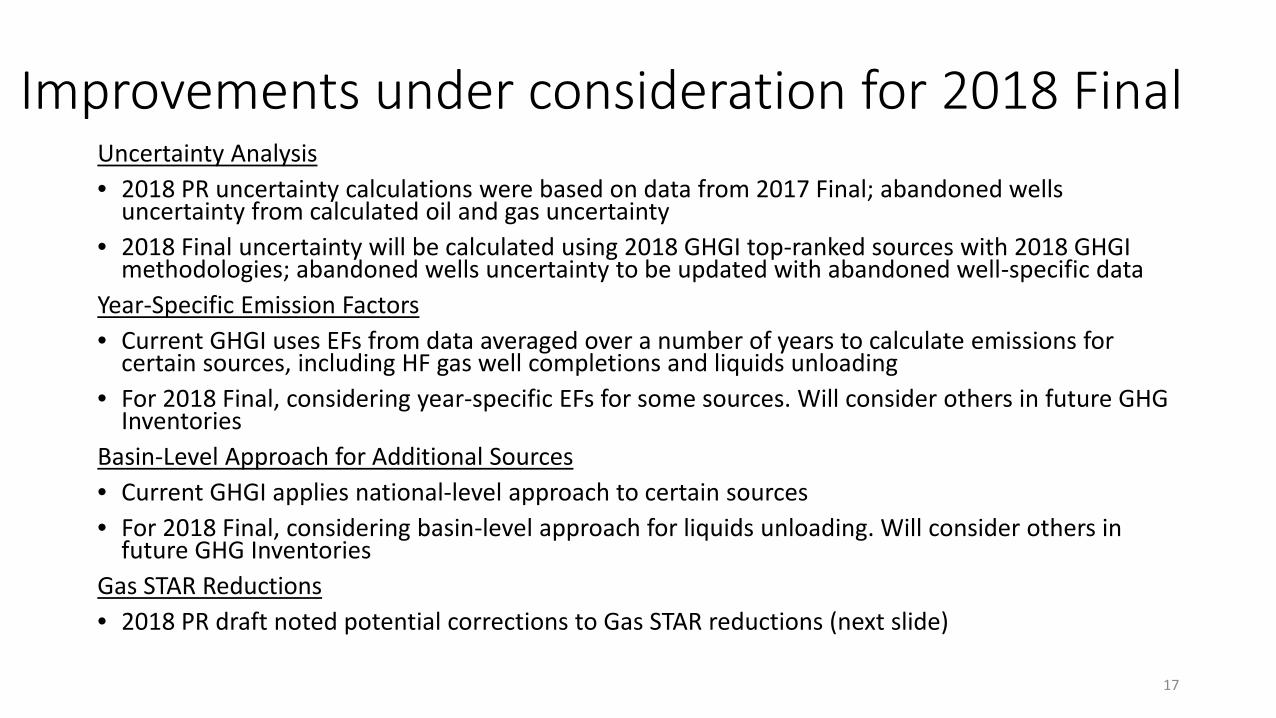
Improvements under consideration for 2018 FinalUncertainty Analysis• 2018 PR uncertainty calculations were based on data from 2017 Final; abandoned wells
uncertainty from calculated oil and gas uncertainty• 2018 Final uncertainty will be calculated using 2018 GHGI top-ranked sources with 2018 GHGI
methodologies; abandoned wells uncertainty to be updated with abandoned well-specific dataYear-Specific Emission Factors• Current GHGI uses EFs from data averaged over a number of years to calculate emissions for
certain sources, including HF gas well completions and liquids unloading• For 2018 Final, considering year-specific EFs for some sources. Will consider others in future GHG
Inventories Basin-Level Approach for Additional Sources• Current GHGI applies national-level approach to certain sources• For 2018 Final, considering basin-level approach for liquids unloading. Will consider others in
future GHG Inventories Gas STAR Reductions• 2018 PR draft noted potential corrections to Gas STAR reductions (next slide)
17

Gas STAR Reductions for Final 2018 GHGI• For 2018 Final, considering adjusting Gas STAR reductions from:
18
Reduction Activity
Year 2016 Source
Reduction (MMT CO2e)
Impact on Segment-Total Year 2016 Reductions (MMT CO2e)
2018 PR Considering for 2018 Final
“Other” production segment activities 1.1 8.9 7.9
Transmission and storage station fugitives 0.18.3 8.2Miscellaneous unclassified activities within “other”
reductions for transmission and storage segment+
Distribution mishaps/dig-ins and pipeline blowdowns +1.0 0.0Miscellaneous unclassified activities within “other”
reductions for distribution segment 1.0
+ less than 0.05

Stakeholder Feedback Request: Associated Gas Venting and Flaring and Miscellaneous Flaring• Approaches for associated gas venting and flaring and miscellaneous
production flaring• Basin-level, well-basis• Basin-level, production basis
• Time series data
19

Stakeholder Feedback Request: Abandoned Wells• Calculating uncertainty surrounding activity data estimates for
abandoned wells• Which scenario using "Entire U.S.", "Appalachian" and "Western U.S."
EFs best represents U.S. emissions from abandoned wells; alternative approaches to consider
• Population of wells abandoned prior to 1990 (considering that the production phase of many such wells likely pre-dates DrillingInfocoverage)
• Split between plugged and unplugged wells existing in each year of the time series (1990–2016)
20
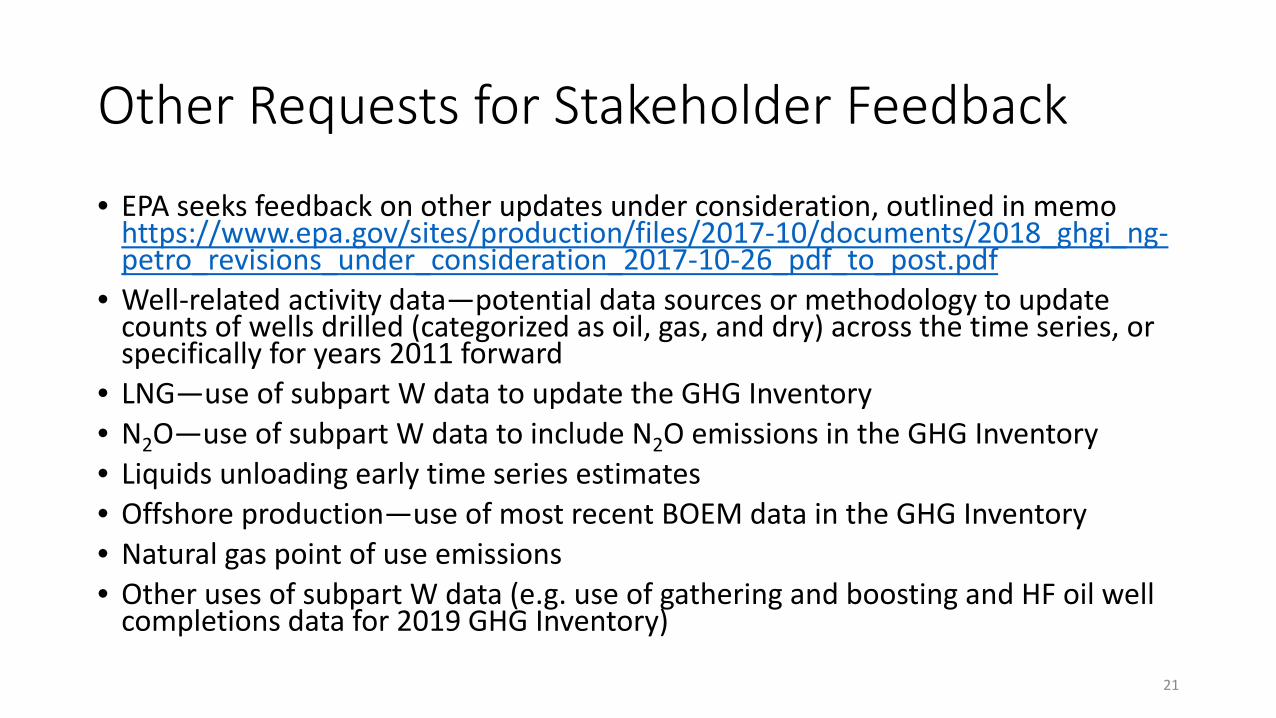
Other Requests for Stakeholder Feedback
• EPA seeks feedback on other updates under consideration, outlined in memo https://www.epa.gov/sites/production/files/2017-10/documents/2018_ghgi_ng-petro_revisions_under_consideration_2017-10-26_pdf_to_post.pdf
• Well-related activity data—potential data sources or methodology to update counts of wells drilled (categorized as oil, gas, and dry) across the time series, or specifically for years 2011 forward
• LNG—use of subpart W data to update the GHG Inventory• N2O—use of subpart W data to include N2O emissions in the GHG Inventory• Liquids unloading early time series estimates• Offshore production—use of most recent BOEM data in the GHG Inventory• Natural gas point of use emissions• Other uses of subpart W data (e.g. use of gathering and boosting and HF oil well
completions data for 2019 GHG Inventory)
21

Commenting on Public Review Draft
• Comment deadline: March 9, 2018• Can submit comments online or via email
• Online: Follow the online instructions for submitting comments to the Draft Inventory Report Docket at EPA-HQ-OAR-2017-0729 from the Federal Register Notice [FRL-9974-04-OAR].
• Email: Comments can be sent to [email protected]. These comments will also be posted to the docket.
• Draft GHG Inventory: https://www.epa.gov/ghgemissions/draft-inventory-us-greenhouse-gas-emissions-and-sinks-1990-2016
• Draft GHGI Energy Chapter: https://www.epa.gov/sites/production/files/2018-01/documents/2018_chapter_3_energy.pdf
• Petroleum Systems: Pages 65-77• Natural Gas Systems: Pages 77-93• Abandoned Oil and Gas Wells: Pages 93-96
• Annex excel files for oil and gas: https://www.epa.gov/ghgemissions/stakeholder-process-natural-gas-and-petroleum-systems-1990-2016-inventory
22


