NBER WORKING PAPER SERIES LABOR RELATIONS, WAGES AND NONAGES COMPENSATION IN MUNICIPAL EMPLOYMENT Jeffrey S. Zax Working Paper No. 1582 NATIONAL BUREAU OF ECONOMIC RESEARCH 1050 Massachusetts Avenue Cambridge, MA 02138 March 1985 The Social Science Research Council graciously supported the research presented in this paper through grant SS—25—83—01. Roo Canfield and Lisa Manshel assisted, indispensably, with the empirical analysis. Linda Edwards, Jonathan Leonard, Robert Lipsey, Richard Freeman and Casey Ichniowski have been generous with constructive comments. Only I am responsible for the content. The research reported here is part of the NBER's research program in Labor Studies and project in Government Budget. Any opinions expressed are those of the author and not those of the National Bureau of Economic Research.
Transcript
NBER WORKING PAPER SERIES
LABOR RELATIONS, WAGES AND NONAGESCOMPENSATION IN MUNICIPAL EMPLOYMENT
Jeffrey S. Zax
Working Paper No. 1582
NATIONAL BUREAU OF ECONOMIC RESEARCH1050 Massachusetts Avenue
Cambridge, MA 02138March 1985
The Social Science Research Council graciously supported theresearch presented in this paper through grant SS—25—83—01. RooCanfield and Lisa Manshel assisted, indispensably, with the empiricalanalysis. Linda Edwards, Jonathan Leonard, Robert Lipsey, RichardFreeman and Casey Ichniowski have been generous with constructivecomments. Only I am responsible for the content. The researchreported here is part of the NBER's research program in Labor
Studies and project in Government Budget. Any opinions expressedare those of the author and not those of the National Bureau ofEconomic Research.
NBER Working Paper #1582March 1985
Labor Relations, Wages and NonwagesCompensation in Municipal Employment
ABSTRACT
In the private sector. 'unionization' typically refers to employees who
are organized, recognized, and covered by contracts, according to the
procedures established by the National Labor Relations Board. The
municipal sector provides an instructive contrast. There. 'unionizationS
encompasses five mutually exclusive combinations of organizational
structure and labor relations practice. These 'modes' form a hierarchy
of employee power, from strongest to weakest: recognized bargaining
units, unrecognized unions in cities which contain other recognized
unions, unorganized employees in cities which contain recognized unions,
unrecognized unions in cities which contain no recognized unions, and
unorganized employees in cities which contain no recognized unions.
Differences in the effects of each mode on compensation for municipal
employees demonstrate differences in the intrinsic strength of different
union institutions..
Municipal compensation levels are dramatically higher for employees
represented by more powerful modes of unionization, regardless of other
conditions in factor and output markets. Union effects on total compen-
sation, in comparison to its mean, range from 3.8 for unrecognized
unions in cities which contain no recognized bargaining units, to li.8
for recognized bargaining units, themselves.
In addition, union effects on total compensation are reater than
union effects an wages in all modes. Relative union effects on expendi-
tures for paid time not worked and pension benefits are usually more
than twice wage effects, Union effects on medical benefits re nearly
twice wage effects.
Jeffrey 3. ZaxNationsl Bureau of Economic Research
269 Mercer St., 6th floorNew Vo r< • New Yorh lOO3
In October i9BO. municipal qovernments had 2,560,516 full- and part-time
employees (Labor-Management Services Administration), or 2.4 of the
American labor force in that month (Economic Report of the President)
More than half of full-time employees. 53.9. were members of unions or
employee associations (Labor-Management Services Administration). The
size of the municipal sector, and the prominence of unions within it,
have stimulated many studies of these unions and their economic ac-
Itivity.
In addition, municipal unions provide several comparisons with
unionization in the private sector. Municipal unions may be able to
exercise greater influence over compensation levels than can unions in
the private sector, because they have political as well as economic
power (Wellington and Winter). That ability may be rarely exercised:
current estimates of union wage effects in municipal employment seem to
be modest in comparison to those in private sector employment, both in
the aggregate (Freeman) and in individual functions (Edwards and Ed-
wards, 1982a)
Furthermore, municipal unionization also offers a comparison --
unique in the American economy -- between different institutions of
labor relations. The strengths of both municipal and private sector
unions may vary with conditions in product and factor markets. Only
municipal unions vary importantly in strength because of differences in
union structure. The opDortunity to study these differences has been
Freeman. and EhrenberQ and Schwarz summarize this literature.
iqnored in previous work.
In the private sector, 'unionization' typically refers to employees
who are orqanized, recognized, and covered by contracts, accordinq to
the procedures established by the National Labor Relations Board. Excep-
tions to this characterization are only temporary: new unions still
seeking recognition, and bargaining units whose most recent contract has
lapsed prior to agreement on a successor. Private sector unions are at
once employee associations and representatives of bargaining units. The
bargaining units they represent are legally entitled to binding con-
tracts (Beal, Wickersham and Kienast).
In the municipal sector, 'unionization' encompasses five mutually
exclusive combinations of organizational structure and labor relations
practice. These 'modes' form a hierarchy of employee power. Municipal
compensation levels are dramatically higher for employees represented by
more powerful modes, regardless of other conditions in factor and output
markets. This paper describes the five modes of municipal labor rela-
tions and estimates the effects of each on total compensation levels,
wages and four types of nonwage compensation.
- f
There is no single definition cf unionization' in municipal employment.
Municipal employees may be organized by an employee association which is
not recognized as a bargaining unit. They may be represented by a bar-
gaining unit which is not covered by a contract. They may benefit from
employment by a bargaining city, even if they are members of neither a
bargaining unit nor an employee organization.
Accordingly, there is no single measure of unionization among
municipal employees. Unfortunately, previous attempts to analyze the
relationship between unionization in the local public sector and
municipal compensation have not successfully differentiated between weak
and powerful union structures. As examples, Ashenfelter, and Edwards and
Edwards (1982b) use only a dummy variable indicating the presence of a
union. Schmenner, Ehrenberg (1973) and Ichniowski use both this variable
and a dummy for the presence of a contract, though only Schmenner uses
them simultaneously. These studies present only polar concepts of
municipal labor relations. Union membership, by itself, is the weakest
form of municipal unionization. The strongest form is represented by an
enforceable union contract.
These representations, in isolation, ignore two important dimensions
of the relationships between municipal employers and employees. First,
common patterns of municipal organization are intermediate to unioniza-
tion and contractual agreement in sophistication arid in union power.
Second, union power is 'additive'; distinctive characteristics of weak
municipal labor relations practices are incorporated into stronger
forms, to whose power they contribute.
Munc±pai unionization takes on five different forms, each repre-
senting the joint effects of different levels of organization and dif—
ferent bargaining practices.2
Bargaining -is the most important aspect
of municipal labor relations. Employees in individual municipal func-
tions experience one of three bargaining environments; no bargaining, a
barqaininq city or a barqaining function. Nonbarqaininq functions,
regardless of whether their city bargains, may or may not contain
employee organizations.
Teble i summarizes the levels of organization and the bargaining
practices which define each mode. It also introduces several additional
features of municipal unionization which further distinguish powerful
modes from weak. The distribution of those features across modes
demonstrates that institutions of municipal labor relations become more
sophisticated as bargaining practices become more formal.
Nonunion functions in nonbargaining cities represent the first,
weakest mode of municipal labor relations. Employees in these functions
are unorganized, and are employed by cities which do not bargain with
any of their employees in any function Table 1 confirms that nonbar-
gaining cities in which nonunion functions are found do not enter into
2State laws impose limits on municipal bargaining and organizationalpractices which may vary. No convenient summary of these laws ex-ists. Therefore, the analysis of this paper does not introduce them
explicitly.
Employees in bargaining functions always belong to an employeeassocistion.
Notes: These statistics are calculated from the sample describedin the Appendix to this paper. Observations represent police,fire, sanitation and an aggregate of all other non-educationalfunctions.
contractual agreements or memoranda of understandinq with any of their
employees.
Employees who organize, thouqh the city for which they work does not
bargain, belQnq to the second mode -- union functions in nonjarqaininq
cities. Union formation is the first initiative open to employees who
wish to increase their influence. Organized employees may, through
informal interactions with administrators in which their solidarity is
expressed, obtain greater compensation than were they unorganized,
though their union is not legally entitled to bargain.
Unorganized and organized functions, in conjunction with cities that
bargain, form the bases of modes three and four. Bargaining cities are
those in which at least one bargaining unit is recognized, or in which
unrecognized functions are routinely invited to meet-and-confer discus-
sions. As indicated in Table 1, bargaining cities have typically
signed binding contracts, as well as memoranda of understanding.
Nonunion and union functions in bargaining cities represent 39 of
all functions which do not contain a bargaining unit. Employees in these
functions enjoy some of the benefits which accrue to formal nego-
tiations. Some cities may prefer to establish conditions of employment
through a uniform procedure for all functions, whether or not they are
legally entitled to bargain. Many cities may offer unrecognized func-
tions conditions which are similar to those obtained by recognized
Most cities that meet this definition do so because a bargainingunit has been recognized.
The Surveys of Government, from which these data are taken, reportonly total contracts per city. They do not identify the functionswith which contracts are signed.
6The observations in these modes disproportionately represent sanita-tion departments. They may regularly profit from the activities of
functions, in order to forestall organization and rec.oqnition drives.
In either case, compensation levels for municipal employees in nonbar
gaining functions are increased because other functions bargain.
Bargaining functions -- the fifth mode of municipal labor relations
-- represent the apex of employee power. Employees in these functions
are organized, their unions are recognized, and they are entitled to
legally enforceable contracts. These functions are ordinarily respon-
sible for the contracts signed by cities in which they are contained.
Their employees have greater influence than any others over municipal
compensation levels.
Table 1 lists the defining characteristic of bargaining functions,
the presence of a bargaining unit. This table also reveals that recogni-
tion may entail more than the presence of a single bargaining unit.
Municipal bargaining units vary widely in their scope. The broadest
units include all workers in a function, and their supervisors, as well.
Units with more narrow definitions may exclude supervisors, and may even
exclude other 'rank—and-file' employees within the same function. In
this latter case, several such units may coexist. The union status of
supervisors and the presence of multiple bargaining units define dis-
tinctions between municipal employees. These distinctions offer
strategic opportunities in negotiation to both employer and employee.
more highly organized police and fire departments.
7 flFunctions in which a bargaining unit is recoqnzed are, by detini-tion, in a bargaining city
Supervisors are represented by bargaining units in one-third of those
functions in which a bargaining unit is present.8
These functions
represent approximately one-sixth of the total. The influence and
sophistication of municipal bargaining units may be increased by the
inclusion of supervisory staff. However, their exclusion from municipal
management may indicate that function employees are alienated from the
city administration. The net effect of supervisor representation on
municipal compensation levels depends on the relative strengths of these
l,_S,_
Twelve percent of all functions, or nearly one-quarter of functions
with bargaining units, harbor more than one bargaining unit. Municipal
employees at different grade levels may demand separate bargaining
units, for two reasons. First, they reinforce professional hierarchies.
Second, multiple bargaining units create opportunities for negotiations
with different units to demand escalating concessions under the rubric
of 'comparability'. Municipal employers may welcome multiple bargaining
units as presenting opportunities to reduce employee solidarity. As with
supervisory representation, the net effect of mulitiple bargaining units
on municipal compensation depends on the relative advantages of com-
parability over solidarity.
Collective bargaining is the most powerful and the most complicated
8Supervisory representation is unique to the public sector."Managerial employees (in the private sector] are excluded fromcoverage of the NLRA (National Labor Relations Act]" (Beal, Wicker-sham and Kienast, pg. 197).
One function in the sample under study has 44 bargaining units.
amonq the five modes of municipal labor relations. Only unions which
exercise all the rights to which they may legally lay claim are entitled
to barcain. However, formal bargaining may engender formal divisions
between employees of the same function. These divisions create oppor-
tunities for both employee cooperation and competition in their rela
Table 2 displays mean values of compensation levels for each mode.
These values support the hierarchy of union power attributed to the five
modes. veraqe levels of total compensation and of all its components --
with the excepton of miscellaneous benefits are •reater in functions
-9-
which p.rticipste more fully in collective barqairiinq. Ajronq function-s
with identical access to bargaining those which are organized receive
higher compensation than do those which are not. These differentials.
and their relationship to municipal unionization, are analyzed more
thoroughly in the discussion which follows.
- c4c
Regression estimates of compensation levels which account for many of
their determinants, in addition to labor relations practices,
demonstrate the effects of municipal unionization predicted above. All
important measures of compensation per hour worked increase with in-
creased engagement in bargaining activity. At any level of bargaining.
compensation is higher in organized than in unorganized functions.
'Union compensation effects' increase monotonically across the five
modes for all measures of compensation with the exception of miscel-
laneous benefits.
The analysis in this section tests the models of municipal labor
relations presented above against the relationships between union
characteristics and compensation levels observed in a large sample of
functions from American cities. This sample is a pooled cross-section
time-series of function-years. Each observation represents one of four
functions (police, fire, sanitation and an aggregate of all other non-
educational functions) in one of three years (1975. 1977 and 1979), in
10one of 889 cities.
Total compensation per hour worked in this sample is comprised of
five components; wages, paid time not worked, medical benefits, pension
benefits and miscellaneous benefits. Levels of these compensation
measures depend upon characteristics of demand for municipal services,
supply of municipal services, and labor supply, as well as characteris—
tics of labor relations. OLS equations discussed here take total compen—
sation and its five components as dependent, and measures of all these
determinants as independent, so as to distinguish their influences. 11
These equations account for compensation determinants other than union
status with thirty-nine measures of population characteristics, alterna-
tive employment opportunities, government structure, function,
qeographic area, and year of observation.
?!easures of the eight labor relations characteristics presented in
Table 1 represent union status in these equations. Four variables -- the
percent of employees belonging to employee associations, the presence
and number of bargaining units, and the union status of supervisors --
10A description of the sample, a complete list of variables, thecomplete regressions and their summary statistics comprise theAppendix to this paper. Zax (1984a) discusses these matters further.
The compensation packages analyzed here are measured in unusualdetail. Previous attempts to estimate the effects of local publicsector unionization on nonwage compensation have relied upon single,aggregate measures of expenditure. Ichniowski measures fringebenefits as "city contribution to employees' retirement benefits andinsurance programs". Edwards and Edwards (1982b) use an expandedmeasure which additionally includes vacation and sick pay. Barteland Lewin use the difference between total expenditures for person-nel costs and total expenditures for salaries, presumably a numberwhich is similar to that of Ichniowski,
— IL
uminarize union characteristics within individual municipal functions.
Three variables -- the number of contracts and memoranda of understand-
ing to which the city is a party, and the proportion of all municipal
employees covered by contracts -- summarize labor relations practices
12within the city as a whole. One variable measures the interaction
between city-wide practices and union status within functions; an in-
dicator for functions without bargaining units, in bargaining cities.13
The coefficients for these eight variables are presented in Table
They are the basis for the aggregate estimates of mode-specific compen-
sation effects with which this analysis culminates. As a preliminary to
these estimates, the effects of individual union characteristics are
worthy of some notice in their own right. Bargaining practices are more
important than any other aspect of municipal unionization in the deter—
mination of municipal compensation levels. Organization is important in
its own right, as well as a precursor to recognition and bargaining.
Municipal unionization usually elicits larger relative increases in
12The Surveys of Government, from which these measures are taken, donot collect the number of contracts, the number of memoranda or thepercent covered for individual functions.
13 Coefficient estimates for union variables in this specification aresubject to potential biases arising from two different considera-tions. First, current compensation levels and current union statusmay he chosen simultaneously. This bias is limited, here, becauseunion variables are measured in the year prior to that in whichcompensation measures are made. Second, past compensation levels maydetermine both current union status and current compensation. Thisspecification would spuriously attribute the effects of past oncurrent compensation to current union status. However, if currentunionization is due to low levels of past compensation, such at-tribution would yield underestimates of union compensation effects.Effects reported here would be lower bounds. Both sources of biasare probably best dealt with in panel data sets. Bartel and Lewinattempt to deal explicitly with these issues in a cross-sectioncontext.
14work bargains. Bargaining cities increase total compensation for
nonbargaining functions by .29 . Total compensation increases by $.042
with each increment of ten percentage points in the proportion of
employees who belong to unions.
Municipal union compensation effects are seriously underestimated if
pensation for all compensation measures with the exception of medi-cal benefits.
Alternative estimations, not reported here1 demonstrate that theeffects of percent organized on compensation levels are estimated attwice their true magnitudes and significance if equations do notinclude variables for the presence of bargaining units and a bar-gaining environment, Estimates derived from these incorrectspecifications notably exaggerate the actual power of organization.
15
15
their effects on nonwage compensation components are ignored. Bargajniriq
functions and bargaining cities display marked preferences for nonwage
compensation. Only 4O of their effects on total compensation are allo-
cated to wages. Thirty—three percent take the form of additional paid
time not worked. Twenty-two percent take the form of increased pension
benefits. Organization, in itself, emphasizes nonwage compensation less.
Even so, 39? of the union effect on total compensation is attributable
to union effects on nonwage components, while these components comprise
only 28 of the total, on average.
Previous analyses of municipal union compensation effects draw
similar conclusions, though they employ less sophisticated measures of
unionization and nonwage compensation. Hall and Vanderportea estimate
that the practice of collective bargaining has greater impact on compen-
sation levels than do signed contracts. Ehrenberg and Goldstein -- in
analogy to the effects of bargaining cities -- find that compensation
levels within function depend upon unionization in other functions.
Ichniowski, and Edwards and Edwards (1982b) estimate greater municipal
union effects on nonwaqe than on wags compensation.
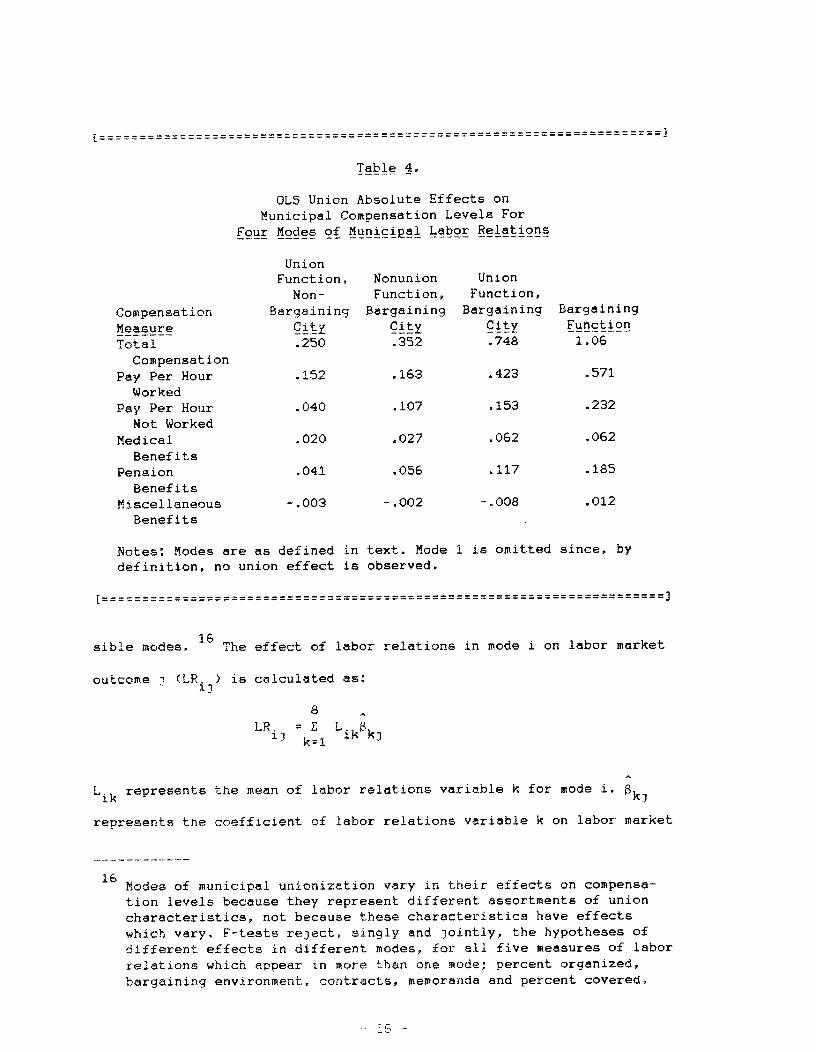
These individual effects are interesting, but the principle theme of
this paper is that individual union characteristics do not exist in
isolation. Tables 4 and 5 combine the coefficients of Table 3 arid mode-
specific mean values for labor relations variables from Table I to
construct estimates of compensation effects for each of the five pos-
Notes: Nodes are as defined in text. Mode 1 is omitted since, bydefinition, no union effect is observed.
sible modes.16
The effect of labor relations in mode i on labor market
outcome , (LR, ) is calculated as:11
8
LR, =E L.k=1 ik k)
Lik represents the mean of labor relations variable k for mode •
represents the coefficient of labor relations variable k on labor market
16Modes of municipal unionization vary in their efects on compensa-tion levels because they represent different assortments of unioncharacteristics, not because these characteristics have effectswhich vary. F-tests reject singly and jointly, the hypotheses ofdifferent effects in different modes, for all five measures of laborrelations which appear in more than one mode; percent organized,bargaining environment, contracts, memoranda and percent covered.
outcome i.
Functions in all modes which include organization or barqaining
obtain increases in total compensation, compared to levels in mode one,
nonunion functions of nonbargaining cities. All components of compensa-
tion, with the exception of miscellaneous benefits, are increased, as
well. Absolute union effects on all but one measure of compensation
increase across modes. Again, miscellaneous benefits provide the sole
exception.
These estimates provide three interesting comparisons between the
power of union functions and barqaining cities. Union functions achieve
larger compensation increases in bargaining than in nonbargaining cities
-- effects in mode four exceed those in mode two. Compensation is higher
for nonunion functions in bargaining cities than in union functions in
nonbargaining cities effects in mode three exceed those in mode two.
Organization and bargaining cities reinforce each other -- their ioint
impacts, as estimated for mode four, exceed the sum of their individual
effects in modes two and three.
Table 5 restates these absolute union effects as percentages of mode-
specific means. The same patterns reappear: relative effects increase in
17Where comparable, these effects are consistent with the range ofeffects summarized in Freeman, and Ehrenberq and Schwarz Totalcompensation effects in modes two and five are representative of thesmallest and largest effects reported in previous studies. Nonwaqecompensation effects for paid time not worked, medical and pensionbenefits in mode five are comparable to those recorted by ich
Table 5.
OLS Union Relative Effects onMunicipal Compensation Levels For
Four Modes of Municipal Labor Relations
UnionFunction, Nonunion Union
Non- Function, Function,
Compensation Bargaining Bargaining Bargaining BargainingMeasure City City City FunctionTotal 3.84 5.24 1O.O li.
——L.LU!1
Pay Per Hour 3.21? 3.3O 7.8O 9.OlWorked
Pay Per Hour 4.7O' l3.2' l7.3' l9.7'Not Worked
Medical 9.l2 8.92' 15.8 14.4'Benefits
Pension 6.81 9.88 17.O 19.4Benef its
Miscellaneous -2.98k -1.98k -1O.1' 9.4OBenefits
Notes: Modes are as defined in text. Mode 1 is owitted since, bydefinition, no union effect is observed.
Table 6 presents aggregate union absolute and relative effects on
municipal compensation levels. The effect of labor relations in the
sample on labor market outcome j (LR) is calculated as:
8LR = E L
k=1 k kj
18Lk represents the sample mean of labor relations variable k. The
18This aggregate effect is identical to a sum of all mode-specificeffects, with each mode weighted by its share in the sample.
qcreqate 8' union effect on total compensation is composed of a 6
effect on wages, a 4 effect on miscellaneous benefits, an ll effect on
medical benefits and 15 effects on paid leisure and pension expendi-
tures.
III. Conclusion
Municipal labor relations are conducted under one of five mutually
exclusive modes. These modes form a hierarchy of employee power. Union
effects on total compensation and all its components are uniformly
greater in more powerful modes. In particular, union compensation ef-
fects increase as bargaining practices become more formal. Union wage
effects are uniformly smaller than are union effects on any other com-
ponent of compensation, in all modes.
These results demonstrate that outcomes in municipal labor markets
depend significantly upon the level at which municipal unions par-
ticipate. That participation may have several aspects. Compensation
increases associated with municipal unionization are explicable in terms
of supply restrictions, but other evidence indicates that strong unions
can increase employment, as well (Zax). Together, these results suggest
that municipal unions can also alter the conditions of demand for
municipal output, thereby altering the demand for their own services. In
addition, intermode differences in union strength do not explain all
intermode differences in compensation levels. They may be more corn-
pletely explained by interactions between labor relations mode and other
determinants of labor market outcomes, such as that with structure of
municipal government (Zax).
These results are provocative, but they do not constitute a complete
explanation of municipal union behavior. That. explanation requires more
comprehensive empirical models which treat compensation, employment and
union status simultaneously. Comparisons between function-specific union
effects may provide the best perspectives on interactions between
employee unionization, publicness and politicization of output. On the
evidence accumulated to this point, these further studies are worth
pursuing.
V-
american Nun:
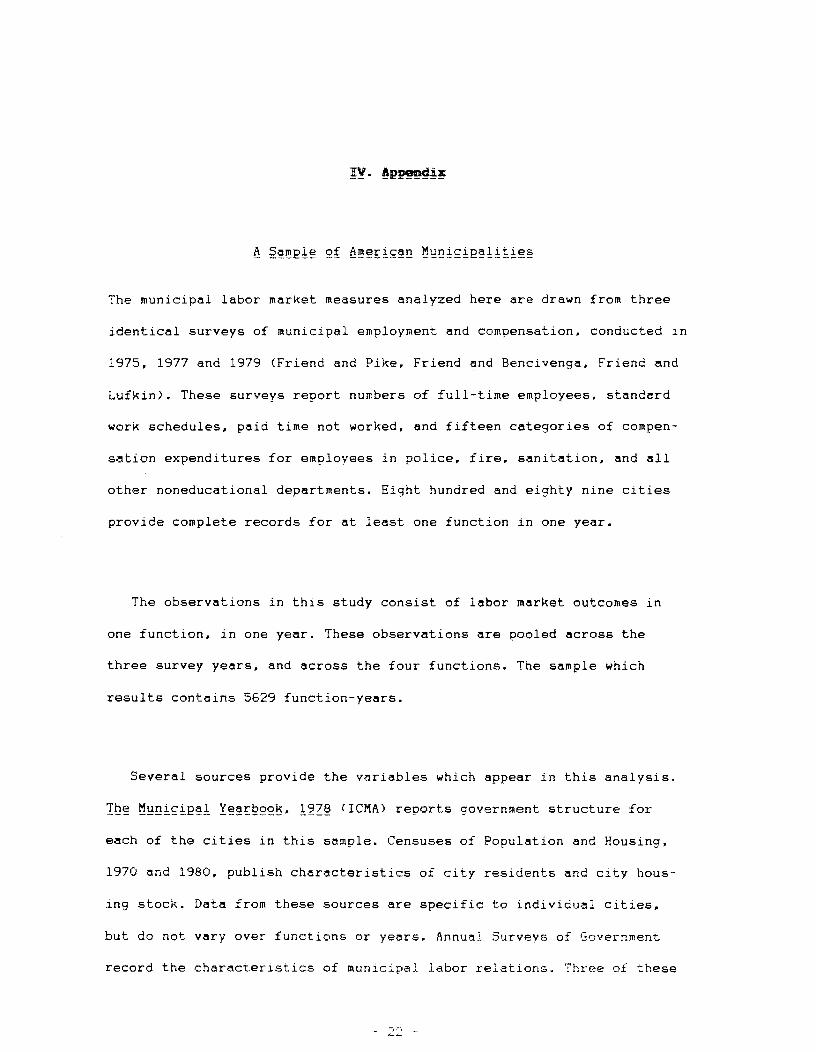
The municipal labor market measures analyzed here are drawn from three
identical surveys of municipal employment and compensation, conducted in
17 1q77 ,rr4 qq (nr d P4tt ind nd v?,enR rnr4Lufkin). These surveys report numbers of full-time employees, standard
work schedules, paid time not worked, and fifteen categories of compen-
sation expenditures for employees in police, fire, sanitation, and all
other noneducational departments. Eight hundred and eighty nine cities
provide complete records for at least one function in one year.
The observations in this study consist of labor market outcomes in
one function, in one year. These observations are pooled across the
three survey years, and across the four functions. The sample which
results contains 5629 function-years.
Several sources provide the variables which appear in this analysis.
The Municipal Yearbook, 1978 (ICMA) reports government structure for
each of the cities in this sample. Censuses of Population and Housing,
1970 and 1980, publish characteristics of city residents and city hous-
ing stock. Data from these sources are specific to individual cities,
but do not vary over functions or years. Annual Surveys of Government
record the characteristics of municipal labor relations. Three of these
measures are specific to each city in each year. Five are observed in
each function, in each of the three years.
The complete sample yields six dependent measures of municipal com-
pensation levels and 47 independent variables. The compensation measures
are total compensation, wage payments, payments for time not worked,
expenditures on medical benefits, expenditures on pension benefits, and
expenditures on miscellaneous benefits per hour worked. By definition,
the five component measures sum to the total.
Compensation is measured as municipal expenditures rather than
employee income. This distinction is important with regard to nonwaqe
compensation components. In particular, the relationship between pension
expenditures and pension liabilities is not reported.
Expenditures for
Total Compensation
Expenditures for
Paid Time Worked
Expenditures for
Paid Time Not Worked
8-square
.5711
- .5711!
.2858
Degrees of Freedom
55814
55811
55811 Mean Square Error
4.356156
1.7798145
0.402566
Intercept
Coefficient
3.733425
T—statistlc
4.7817
Coefficient
2.964838
T—statistic
5.91107
Qfljclfl
0.5116705
T—statistic
2.3034
1970 Population, in 1,000
0.00061156926
3.1309
0.00070211111
5.3263
0.000156318
2.11933
1960-70 %
Increase, Population
.00009269941!
0.4439
-.0000382476
-0.2865
—.0000001208
—0.0019
1960-70 % Decrease, Population
0.010193
1.1519
0.012770
2.2577
0.0005623193
0.2090
1970-80 %
Increase, Population
1970-80 % Decrease, Population
0.0002233463
-0.0352514
0.2016
-4.11191
0.0001265988
-0.0205113
0.1788
-4.0286
0.0002095857
—0.005101131!
0.6223
—2.1048
1969 %
Fam
ilies Below Poverty Level
1969 Median Family Income, in $1,000
1970 Median Housing Value,
in $1,000
-0.0221430
0.061729
0.038348
-1.9192
1.6216
3.1890
-0.013206
0.0211315
0.021474
-1.7678
0.9993
2.7938
-0.00680515
0.018927
-0.000595692
—1.91511
1.6356
—0.1630
1970 % U
nits in One-Unit Structures
-0.00226947
—0.6777
-0.00388681
—1.8157
-0.000713701
—0.7010
1970 % B
lack Population
0.0111335
4.0603
0.009173213
4.0649
0.003427111
3.1932
1970 %
Spanish
Population
1970
%
Population
§18 Y
ears of Age
0.0091425894
-0.023579
2.1713
-2.8711
0.003955813
-0.00452761
1.11256
-0.8625
0.002385456
-0.014751
1.8076
—5.9083
1970
%
Population
¶65 Y
ears of Age
-0.004556814 -0.3648
-000129393 -0.1621
—0.013055
—3.14383
1970 Median Year of School
0.034349
0.5572
0.010446
0.2651
0.023375
1.21472
1970 Male Operative Median Earnings In $1,000
0.348807
7.9038
0.238705
8.14620
0.050639
3.77146
1970 Nonworker/Worker Ratio
-0.388203
—2.0519
—0.2661401
-2.2029
0.047687
0.8291
1970 %
Persons
¶23 With ¶3 Years High School
-0.00205726
-0.3086
0.00187011314
0.4390
-0.00312337
—1.5414
1980 Median Age
-0.010025
-0.8733
-0.00579976
-0.7904
-0.000670904
-0.1923
1970 %
in White
Collar Occupations
-0.011757
-2.01487
-0.00427125
-1.16144
-0.00113167
-0.61487
1970 % F
oreign Stock
0.033598
6.85914
0.020734
6.6225
0.005396383
3.62142
Middle Atlantic Division
0.825558
4.7368
0.259903
2.3330
0.018192
0.3113Li East North Central Division
West North Central Division
1.14167142
0.966200
8.96'43
5.7961
0.632475
0.319968
6.2608
3.0029
0.061253
0.044916
1.27149
0.88611
South A
tlantic Division
0.656546
3.5680
0.2401489
2.0446
0.0470614
0.814111
East
South C
entral Division
0.395190
1.8115
—0.078268
—0.5613
0.0714052
1.1166
West
South
Central Division
0.535306
2.8010
0.061801
0.5059
0.090721
1.5615
Mountain D
ivision 1.581037
7.7288
0.64491314 4.96141!
0.299666
4.8188
Pacific C
oast Division
2.138601
12.7354
1.186527
11.05140
0.158367
3.1023
Presence of C
ity Manager
0.293600
3.5775
0.152453
2.9061
—0.00706812
—0.2833
Partisanship on
Election
Ballot
0.049560 0.59114
0.122523
2.2991
0.023474
0.9262
% of
Councilmen Elected at-Large
0.222201
2.9292
0.159221
3.2837
0.067320
2.9194
Percent O
rganized Presence of Bargaining Units
0.004160899
0.611626
3.7222
5.2928
0.002525593
0.242105
3.53116
3.2777
0.0006661114149
0.201303
1.9612
5.7304
Number of Bargaining Units
Labor R
elations Pol i
cy, no Bargaining Units
-0.025937
0.293926
-1.0234
2.91477
—0.000874133
0.114020
-0.'O540
1.7889
—0.00602892
0.108904
—0.7825
3.5927
Presence of
Supervisors in
Bargaining U
nits 0.01411625
0.5110
0.027833
0.11986
-0.00696114
—0.2622
Number of
Contracts
0.058287
3.5351
0.0346110
3.2868
-0.002071453
—0.14139
Number of Memoranda of Understanding
0.025'483
1.14634
0.006318215
0.5676
0.0014475693
0.81455
%
Em
ployees Covered by C
ontracts -0.00113008
-0.6246 0.0006996881
0.6050 —
0.000124036 —
0.2255 P
01 ice D
epartment
2.12148142
26.2376
1.370998
26.14847
0.2119140
8.6088
Fire Department
0.5761446
6.5876
—0.302969
—5.4166
0.63142211
23.8420
Sanitation D
epartment
-0.126512 —
1.2629 —
0.236537 —
3.69111 0.033274
1.0927 Observation From 1975
—2.9146905
-41.7337
—1.677026
—37,1554
—0.3651482
—17.0263
Observation
From
1977
-1.743607 -25.7298
—0.857709
-19.8011 -0.218325
-10.5980
Expenditures for
Medical Benefits
Expenditures for
Pension Benefits
Expenditures for
Miscellaneous Benefits
8-square
.2754
.2801
.2401
Degrees of Freedom
5584
5584
5584
Mean Square Error
0.094651
0.4149445
0.016674
Coefficient
1-statistic
Coefficient
T—statlstic
Coefficient
T—statlstic
Intercept
0.1469526
14.0797
-0.363597
—1.41498
0.115953
2.400'1
1970 Population,
in 1,000
-0.000159053
-5.2320
-.00000147127
-0.0711
-0.0000149001
-3.81404
1960-70 %
Incr
ease
, Population
0.00012802
14.1584
0.000006128
0.0913
-.0000030801
1960—70 % Decrease, Population
—0.00125845
—0.96148
-0.0021401402
-0.81458
0.00052214118
0.95142
1970—80 %
Incr
ease
, Population
0.00026891467
1.61469
—0.0006145282
—1.8133
0.00026349714
3.84113
1970-80 % Decrease, PopulatIon
1969 %
Fam
i I los Below Poverty Level
1969 Median Family Income,
In $1,000
1970 Median Housing Value,
in $1,000
1970 % U
nits
in One-Unit Structures
-0.00457544
-0.004011
0.00104612
0.004021937
0.001896307
—3,8910
—2.3283
0.18614
2.2690
3.8415
-0.00536436
0.002154982
0.016301
0.014215
-.00007091486
-2.0935
0.57141
1.3332
3.6801
-0.0660
0.0003330922
-0.000562916
0.001139387
-0.000767257
0.0005056815
0.6749
—0.7785
0.4838
-1.0313
2.41406
1970 % Black Population
0.0005267867
1.0122
0.001263583
1.1142
-.0000558652
—0.2558
1970% Spanish Population
1970 % Population §18 Years of Age
-0.000216642
-0.003597
-0.3386
-2.9713
0.003627614
0.002362732
2,6016
0.8957
-0.0003263146
-0.00306675
-1.2151
-6.0356
1970 % Population ¶65 Years of Age
-0.000455814
-0.21476
0.013368
3.3322
—0.003120149
-4.0383
1970 Median Year of School
-0.0214376
—2.6823
0.032880
1.6604
-0.0079769
-2.09114
1970 Male Operative Median Earnings in $1,000
0.013820
2.1245
0.01401143
2.8318
0.005500519
2.0146
1970 Nonworker/Worker Ratio
0.033830
1.2131
—0.239335
—3.9383
0.036016
3.0769
1970 % Persons 123 W
ith 1
3 Y
ears
High School
0.0021409556
2.14523
-0.00340314
—1.5894
0.0001892676
0.14589
1980 Median Age
-0.00117077
-0.6919
-0.00258089
-0.6999
0.0001972558
0.2777
1970 % in White Collar Occupations
-0.00389371
-4.6030
-0.00271406
-1.47214
0.0002538567
0.7150
1970 % Foreign Stock
0.00221709
3.0708
0.0014411477
2.8040
0.0008385899
2.7673
Middle Atlantic Division
0.086592
3.3706
0.1472373
8.4379
—0.011502
—1.0667
East North Central Division
0.098935
4.2468
0.625028
12.3123
-0.000949741
-0.0971
West North Central Division
0.074317
3.0245
0.536289
10.0157
-0.00929033
-0.9008
South Atlantic Division
-0.029500
-1.0876
0.404260
6.8397
-0.00576692
-0.5066
East South Central Division
0.022953
0.7138
0.390920
5.5788
—0.014467
-1.0719
West South Central Division
—0.00211633
—0.0751
0.403302
6.5699
—0.0181401
—1.5562
Mountain Division
0.098540
3.2679
0.537212
8.1758
—0.00351387
-0.2776
Pacific Coast Division
0,177810
7.1834
0.613984
11.3829
0.001912933
0.1841
Presence of City Manager
0.049574
4.0979
0.070785
2.6852
0.027856
5.4862
Partisanship on Election Ballot
% of Councilmen Elected at-Large
Percent Organized
Presence of Bargaining Units
Number of Bargaining Units
Labor Relations Policy, no Bargaining
Presence of Supervisors In Bargaining
Number of Contracts
Units
Units
0.007080721
-0.012009
0.0003383831
0.015496
—0.00107007
0.020099
0.0003591196
0.002384847
0.5762
-1.0740
2.0536
0.9097
—0.2864
1.3674
0.0279
0.9813
-0.091321
0.0009765884
0.0006782769
0.132818
—0.016596
0.050659
0.019288
0.022565
—3.4100
0.0401
1.8890
3.5783
—2.0386
1.5816
0.6876
4.2607
-0.012197
0.006692065
-.0000477986
0.019904
—0.00136851
0.0002443137
0.0014105997
0.0007717929
-2.3645
1.4259
-0.6911
2.7839
-0.8728
0.0396
0.7599
0.7566
Number of Memoranda of UnderstandIng
% Employees Covered by Contracts
P01 ice Department
Fire Department
Sanitation Department
0.013298
-.0000852764
0.069847
0.008506281
0.065947
5.1806
-0.3197
5.8511
0.6595
4.4662
-0.000278664
-0.00136977
0.320395
0.167361
—0.013456
-0.0498
-2.3568
12.3168
5.9543
—0.4182
0.001670382
-0.000250691
0.151662
0.069324
0.024260
1.5504
-2.2394
30.2693
12.8050
3.91414
Observation From 1975
—0.295826
—28.4215
-0.563415
—24.8406
—0.045156
—10.3362
Observation From 1977
-0.216998
-21.7237
-0.413517
-18.9974
-0.037056
-8.8385
References
Ashenfelter, Orley, "The Effect of Unionization on Wages in thePublic Sector: The Case of Firefighters", Industrial and Labor RelationsReview, Vol.. 24, #2, January, 1971, pp. 191-202.
Bartel, Ann and David Lewin. "Wages and Unionism in the Public Sec-tor: The Case of Police, The Review of Economics and Statistics, Vol.
63, February, 1981, pp. 53-59.
Beal, Edwin F., Edward 0. Wickersharn arid Philip K. Kienast, Thece of collective Bargaining, Fifth Edition, Richard 0. Irwin.
Inc., Homewood, Illinois, 1976.
Economic Report of the President, U. S. Government Printing Office,Washington, 0. C., 1983.
Edwards, Linda N. and Franklin R. Edwards, "Public Unions, LocalGovernment Structure and the Compensation of Municipal SanitationWorkers", Economic Inquiry, Vol. XX, July 1982(b), pgs. 405-425.
Edwards, Linda N. and Franklin R. Edwards, "Wellington and WinterRevisited: The Case of Municipal Sanitation Collection", Industrial and
Ehrenberq, Ronald 6., "Municipal Government Structure1. Unionization,and the Wages of Fire Fighters", Industrial end Labor Relations Review,October, 1973, pgs. 36-48.
Ehrenberg, Ronald 6. and Joshua L. Schwarz, "Public Sector LaborMarkets's, National Bureau of Economic Research, Working Paper #1179,Cambridge, Massachusetts, August, 1983.
Freeman, Richard B., "Unionism Comes to the Public Sector", Un-published working paper, National Bureau of Economic Research,Cambridge, Massachusetts, August, 1984.
Friend. Edward H. and Albert Pike III, Third National Survey of
-TR 2DD Q Labor—Management Relations Service of the United States Conference of Mayors,Washington, D.C., 1977.
Friend, Edward H. and David F. Bencivenga, Fourth National Survey of
2I2!! fits for Full-Tine Personnel of U.S. Municipalities, Labor-Nanagement Relations Service of the United States Conference of Mayors,Washington, D.C., 1979.
Friend, Edward H. and Lorraine A. Lufkin, Fifth National Survey of
22Y -T1! 2RR 2 RlUl2A11' Labor-Management Relations Service of the United States Conference of Mayors.Washington, D.C., 1982.
Hall, W. Clayton and Bruce Vanderporten, "Unionization, NonopsonyPower, and Police Salaries", Industrial Relations, Volume 16, Number 1,February 1977, PP. 94-100.
Ichniowaki, Casey, "Economic Effects of the Firefighter's Union".Industrial and Labor Relations Review, Vol. 33, January, 1980, pgs. 198-211.
International City Management Association, Municipal Yearbook 1978,Washington, D.C. 1979.
Schmeriner, Roger, "The Determination of Municipal Employee Wages",Review of Economics and Statistics, February, 1973, pgs. 83-90.
U. S. Bureau of the Census, Annual Survey 1976and 1978, Washington, D. C.
U. S. Bureau of the Census, Census of Population and Housing, 1970and 1980, Washington, D. C.
U. S. Bureau of the Census, Labor-Management Relations in State andLocal Governments: 1980 Series GSS No. 102, U. S. Government FrintinqOff ice, Washington, D. C., 1980.
Weljinqton, H. H., and R. K. Winter, "The Limits of Collective Bar-gaining in Public Employment", Vale Law Journal, Vol. 78, No. 7, 1969,PP. 107-1127.
Zax, Jeffrey S., C ation and Employment in AiçGovernments, unpublished doctoral dissertation, Harvard University,Cambridge, Massachusetts. 1984.