NBRC Annual Economic & Demographic Research for Fiscal Year 2019 To Determine Categories of Distress within the NBRC Service Area Northern Border Regional Commission A Federal-State Partnership for Economic Development in northern Maine, New Hampshire, Vermont, and New York JC Cleveland Federal Building, Suite 1201 55 Pleasant Street Concord, New Hampshire 03301 (603) 369-3001 www.nbrc.gov December, 2018
Transcript
NBRC Annual Economic & Demographic Research for
Fiscal Year 2019 To Determine Categories of Distress within the NBRC Service Area
Northern Border Regional Commission A Federal-State Partnership for Economic Development in northern Maine, New Hampshire, Vermont, and New York JC Cleveland Federal Building, Suite 1201 55 Pleasant Street Concord, New Hampshire 03301 (603) 369-3001 www.nbrc.gov December, 2018
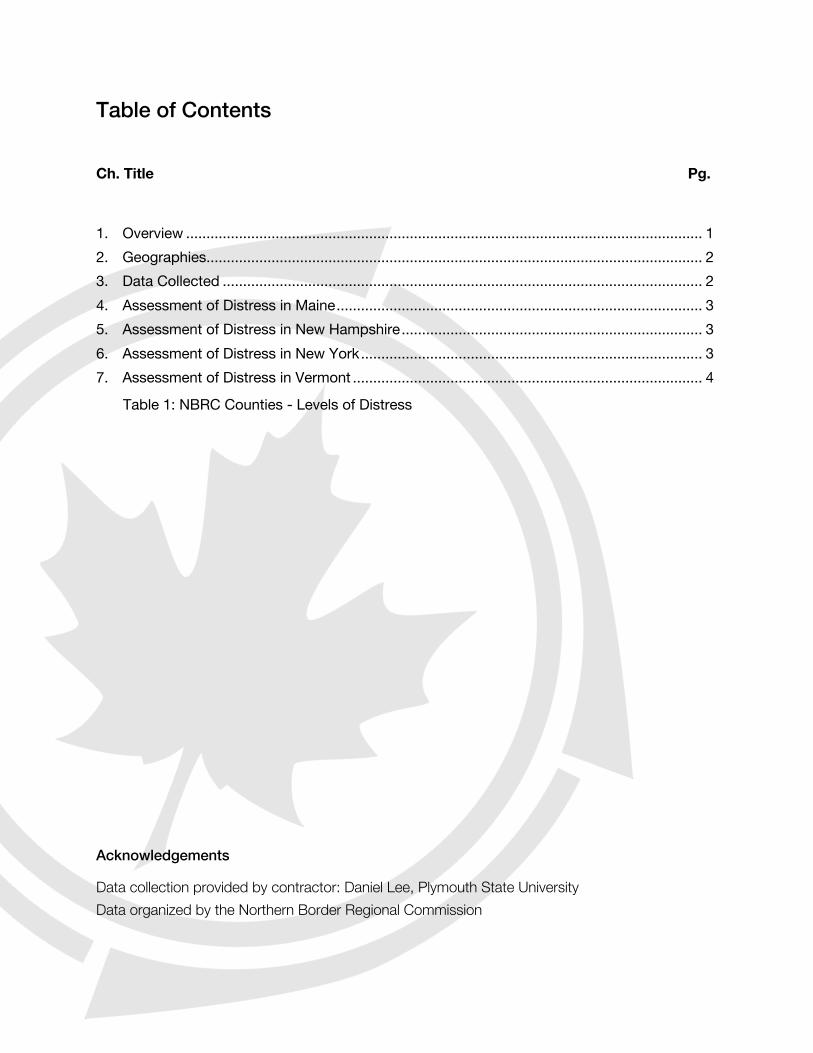
Table of Contents
Ch. Title Pg.
1. Overview ............................................................................................................................... 1 2. Geographies .......................................................................................................................... 2 3. Data Collected ...................................................................................................................... 2 4. Assessment of Distress in Maine .......................................................................................... 3 5. Assessment of Distress in New Hampshire .......................................................................... 3 6. Assessment of Distress in New York .................................................................................... 3 7. Assessment of Distress in Vermont ...................................................................................... 4
Table 1: NBRC Counties - Levels of Distress
Acknowledgements
Data collection provided by contractor: Daniel Lee, Plymouth State University Data organized by the Northern Border Regional Commission
1
1. About The NBRC
Created by the US Congress in 2008, the NBRC is a Federal-State partnership whose mission is to help alleviate economic distress in counties of Maine, New Hampshire, Vermont, and New York. The NBRC partnership is led of the governors of Maine, New Hampshire, Vermont, and New York as well as a Federal Co-chair, who is appointed by the President. Local oversight is provided through multi-county local development districts. While Congress allowed the NBRC considerable flexibility in the types of areas in which to focus, the NBRC has created a Five-Year Strategic Plan that emphasizes three goals related to Infrastructure; Business and Entrepreneurial growth; and Leadership and Community Capacity. More information on the NBRC can be found at www.nbrc.gov. 2. Overview
By statute, the NBRC is required to annually assess the level of economic and demographic distress
within its region:
• To have reliable and timely data that can inform NBRC leadership as they create new- and perfect existing- economic and infrastructure funding programs, • To create a benchmark in which annual compilations of economic and demographic data can be
compared to the NBRC’s Five Year Plan goals, • To identify whether or not the NBRC can provide grants to projects within a county, • What level of match is required by grant applicants for projects. • To assist States as they develop their own economic and community development programs, and • To provide publicly available information so local decision makers can prioritize their economic and
community development strategies. Federal law (40 U.S.C., Subtitle V) states that, ‘distressed’ counties are those that, “have high rates of poverty, unemployment, or outmigration” and “are the most severely and persistently economic distressed and underdeveloped.” The NBRC is required to allocate 50% of its total appropriations to projects in counties falling within this designation. The maximum percent of a “distressed” project that can be funded by the NBRC is 80%. ‘Transitional’ counties “have recently suffered high rates of poverty, unemployment, or outmigration” or “are economically distressed and underdeveloped.” The maximum percent of a “transitional” project that can be funded by the NBRC is 50%. ‘Attainment’ counties are those that are neither ‘distressed’ nor ‘transitional’ The NBRC is not allowed to fund projects within an attainment county unless the project is within an ‘isolated area of distress,’ or have been granted a waiver. Isolated areas of distress are “areas [municipalities] that have high rates of poverty, unemployment, or outmigration.”
2
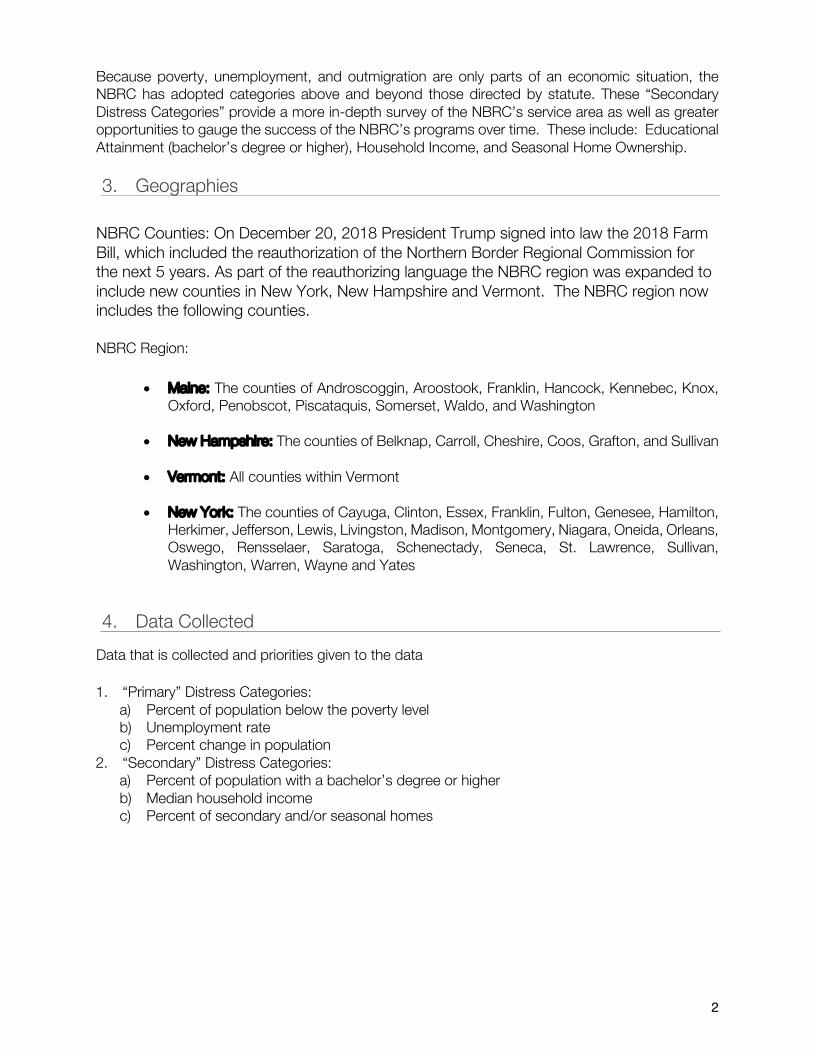
Because poverty, unemployment, and outmigration are only parts of an economic situation, the NBRC has adopted categories above and beyond those directed by statute. These “Secondary Distress Categories” provide a more in-depth survey of the NBRC’s service area as well as greater opportunities to gauge the success of the NBRC’s programs over time. These include: Educational Attainment (bachelor’s degree or higher), Household Income, and Seasonal Home Ownership. 3. Geographies
NBRC Counties: On December 20, 2018 President Trump signed into law the 2018 Farm Bill, which included the reauthorization of the Northern Border Regional Commission for the next 5 years. As part of the reauthorizing language the NBRC region was expanded to include new counties in New York, New Hampshire and Vermont. The NBRC region now includes the following counties. NBRC Region:
• Maine: The counties of Androscoggin, Aroostook, Franklin, Hancock, Kennebec, Knox, Oxford, Penobscot, Piscataquis, Somerset, Waldo, and Washington
• New Hampshire: The counties of Belknap, Carroll, Cheshire, Coos, Grafton, and Sullivan
• Vermont: All counties within Vermont
• New York: The counties of Cayuga, Clinton, Essex, Franklin, Fulton, Genesee, Hamilton, Herkimer, Jefferson, Lewis, Livingston, Madison, Montgomery, Niagara, Oneida, Orleans, Oswego, Rensselaer, Saratoga, Schenectady, Seneca, St. Lawrence, Sullivan, Washington, Warren, Wayne and Yates
4. Data Collected
Data that is collected and priorities given to the data
1. “Primary” Distress Categories: a) Percent of population below the poverty level b) Unemployment rate c) Percent change in population
2. “Secondary” Distress Categories: a) Percent of population with a bachelor’s degree or higher b) Median household income c) Percent of secondary and/or seasonal homes
3
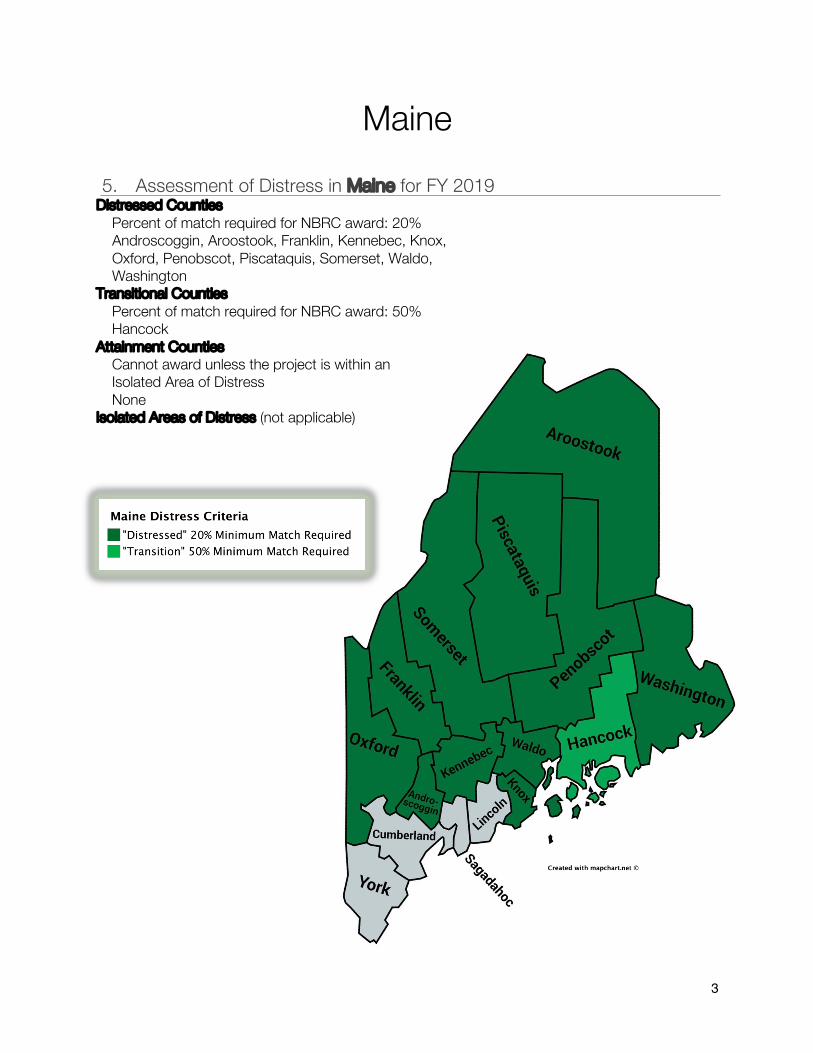
Maine 5. Assessment of Distress in Maine for FY 2019
Distressed Counties Percent of match required for NBRC award: 20% Androscoggin, Aroostook, Franklin, Kennebec, Knox, Oxford, Penobscot, Piscataquis, Somerset, Waldo, Washington
Transitional Counties Percent of match required for NBRC award: 50% Hancock
Attainment Counties Cannot award unless the project is within an Isolated Area of Distress None
Isolated Areas of Distress (not applicable)
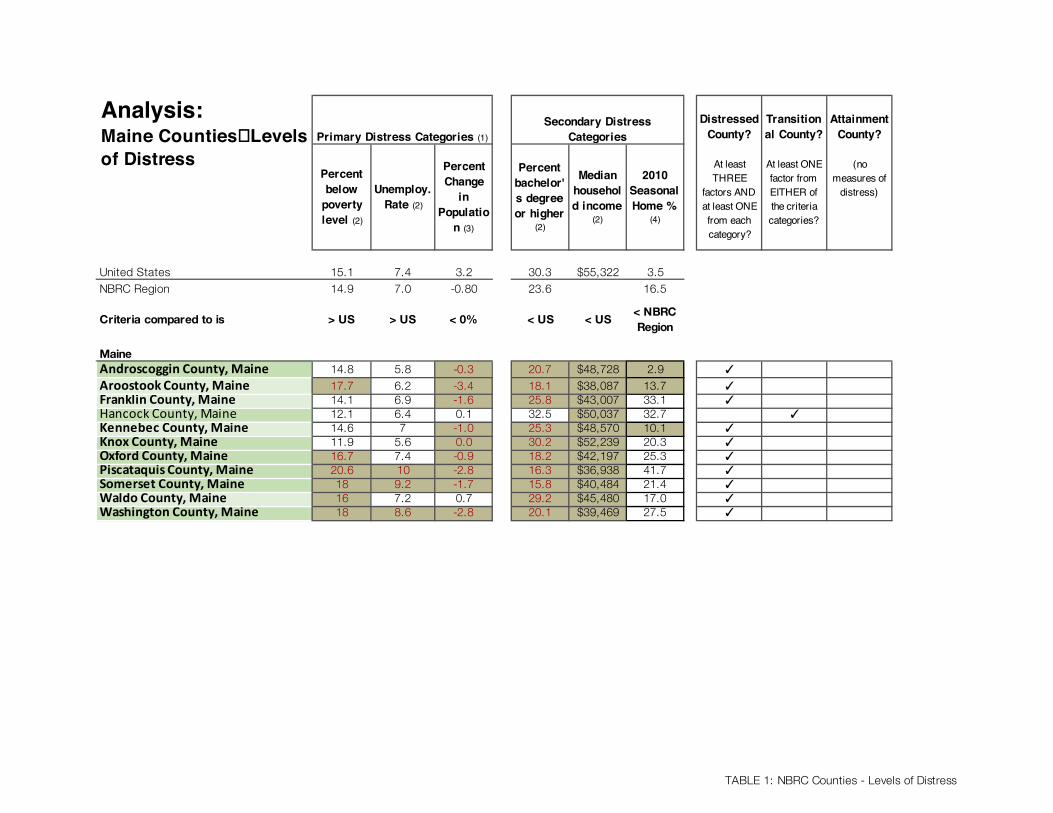
TABLE 1: NBRC Counties - Levels of Distress
Percent below
poverty level (2)
Unemploy. Rate (2)
Percent Change
in Populatio
n (3)
Percent bachelor's degree or higher
(2)
Median household income
(2)
2010 Seasonal Home %
(4)
United States 15.1 7.4 3.2 30.3 $55,322 3.5NBRC Region 14.9 7.0 -0.80 23.6 16.5
Criteria compared to is > US > US < 0% < US < US < NBRC Region
MaineAndroscoggin County, Maine 14.8 5.8 -0.3 20.7 $48,728 2.9 ✓
Aroostook County, Maine 17.7 6.2 -3.4 18.1 $38,087 13.7 ✓Franklin County, Maine 14.1 6.9 -1.6 25.8 $43,007 33.1 ✓Hancock County, Maine 12.1 6.4 0.1 32.5 $50,037 32.7 ✓Kennebec County, Maine 14.6 7 -1.0 25.3 $48,570 10.1 ✓Knox County, Maine 11.9 5.6 0.0 30.2 $52,239 20.3 ✓Oxford County, Maine 16.7 7.4 -0.9 18.2 $42,197 25.3 ✓Piscataquis County, Maine 20.6 10 -2.8 16.3 $36,938 41.7 ✓Somerset County, Maine 18 9.2 -1.7 15.8 $40,484 21.4 ✓Waldo County, Maine 16 7.2 0.7 29.2 $45,480 17.0 ✓Washington County, Maine 18 8.6 -2.8 20.1 $39,469 27.5 ✓
Analysis:Maine Counties�Levels of Distress
Secondary Distress Categories
Attainment County?
(no measures of
distress)
Primary Distress Categories (1)
Transitional County?
At least ONE factor from EITHER of the criteria categories?
Distressed County?
At least THREE
factors AND at least ONE from each category?
4
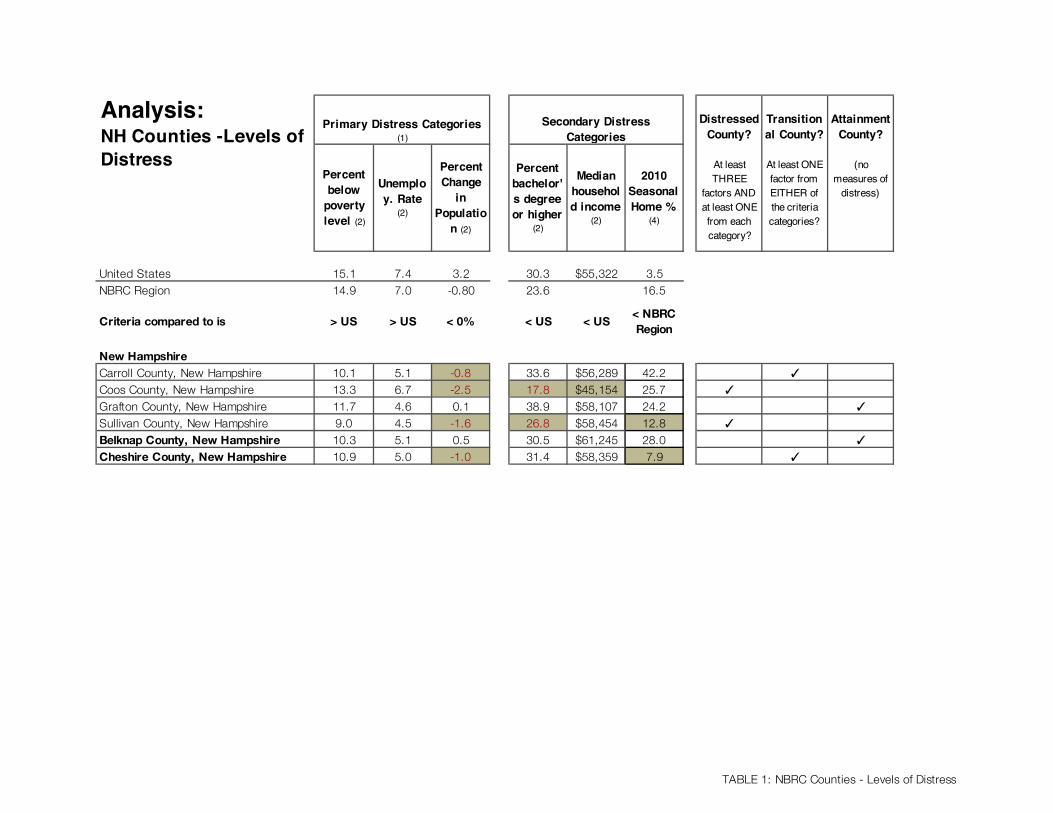
New Hampshire 6. Assessment of Distress in New
Hampshire for FY 2019 Distressed Counties
Percent of match required for NBRC award: 20% Coos, Sullivan
Transitional Counties Percent of match required for NBRC award: 50% Carroll, Cheshire
Attainment Counties Cannot award unless the project is within an Isolated Area of Distress Grafton, Belknap
Isolated Areas of Distress (See Table 1) Percent of match required for NBRC award:50% Many, listed in Table 1
TABLE 1: NBRC Counties - Levels of Distress
Percent below
poverty level (2)
Unemploy. Rate
(2)
Percent Change
in Populatio
n (2)
Percent bachelor's degree or higher
(2)
Median household income
(2)
2010 Seasonal Home %
(4)
United States 15.1 7.4 3.2 30.3 $55,322 3.5NBRC Region 14.9 7.0 -0.80 23.6 16.5
Criteria compared to is > US > US < 0% < US < US < NBRC Region
New HampshireCarroll County, New Hampshire 10.1 5.1 -0.8 33.6 $56,289 42.2 ✓
Coos County, New Hampshire 13.3 6.7 -2.5 17.8 $45,154 25.7 ✓
Grafton County, New Hampshire 11.7 4.6 0.1 38.9 $58,107 24.2 ✓
Sullivan County, New Hampshire 9.0 4.5 -1.6 26.8 $58,454 12.8 ✓
Belknap County, New Hampshire 10.3 5.1 0.5 30.5 $61,245 28.0 ✓
Cheshire County, New Hampshire 10.9 5.0 -1.0 31.4 $58,359 7.9 ✓
Analysis:NH Counties - Levels of Distress
Secondary Distress Categories
Primary Distress Categories (1)
Attainment County?
(no measures of
distress)
Transitional County?
At least ONE factor from EITHER of the criteria categories?
Distressed County?
At least THREE
factors AND at least ONE from each category?
TABLE 1: NBRC Counties - Levels of Distress
Column1 Column2 Column3 Column4 Column5 Column6 Column7Alton town, Belknap County, 5.8 4.3 0.7Barnstead town, Belknap County 5.1 6.2 0.8Belmont town, Belknap County 8.6 4.5 -1.0 ✓
Center Harbor town, Belknap County 7.8 5.1 -7.8 ✓
Gilford town, Belknap County 7.7 2 -0.3 ✓
Gilmanton town, Belknap County 9.6 4.2 -0.9 ✓
Laconia city, Belknap County 16.4 7.5 1.4 ✓
Meredith town, Belknap County 11.9 4.4 1.8New Hampton town, Belknap County 8.7 3.8 4.8Sanbornton town, Belknap County 2.9 4.4 0.3Tilton town, Belknap County 11.8 5 0.0Alexandria town, Grafton County 8.5 7.5 16.3 ✓
Ashland town, Grafton County 21.3 4.8 4.0 ✓
Bath town, Grafton County 9.1 10.8 -9.3 ✓
Benton town, Grafton County 5.5 7.4 28.8Bethlehem town, Grafton County 15.9 5 0.6 ✓
Bridgewater town, Grafton County 4.6 4.6 -8.9 ✓
Bristol town, Grafton County 10.6 2.5 -0.1 ✓
Campton town, Grafton County 2.6 2.2 -0.9 ✓
Canaan town, Grafton County 12.1 4.1 -0.1 ✓
Dorchester town, Grafton County 4.8 3.8 -5.9 ✓
Easton town, Grafton County 2.9 4.5 7.9Ellsworth town, Grafton County 5.6 3.3 28.9Enfield town, Grafton County 4.7 3.4 -0.5 ✓
Franconia town, Grafton County 4.9 3.2 -5.9 ✓
Grafton town, Grafton County 12.2 10.5 -4.8 ✓
Groton town, Grafton County 18 6.2 3.4 ✓
Hanover town, Grafton County 11.3 2.1 1.0Haverhill town, Grafton County 9.2 7.9 -1.7 ✓
Hebron town, Grafton County 5.2 6.3 -3.3 ✓
Holderness town, Grafton County 6.6 1.3 13.6Landaff town, Grafton County 6.6 5 2.2Lebanon city, Grafton County 13.6 3.4 2.9Lincoln town, Grafton County 25.5 12.4 -19.6 ✓
Lisbon town, Grafton County 18.6 6.5 8.0 ✓
Littleton town, Grafton County 18.1 6 -0.2 ✓
Livermore town, Grafton County NA NA NA ✓
Lyman town, Grafton County 4.8 3.7 16.9Lyme town, Grafton County 3.9 3.7 2.2Monroe town, Grafton County 4.3 5.8 26.3Orange town, Grafton County 8.7 1.5 -30.5 ✓
Orford town, Grafton County 8.8 5.4 21.6Piermont town, Grafton County 4.8 2.1 6.3Plymouth town, Grafton County 20.5 7.2 -4.7 ✓
Rumney town, Grafton County 19.2 3.7 11.1 ✓
Sugar Hill town, Grafton County 3.6 3.7 23.3Thornton town, Grafton County 2.2 2.9 -19.4 ✓
Warren town, Grafton County 19 9.5 -3.9 ✓
Waterville Valley town, Grafton County 2.2 1.1 -24.7 ✓
Wentworth town, Grafton County 10.8 5.9 -13.0 ✓
Woodstock town, Grafton County 9.6 5.9 -26.9 ✓
Isolated Area of Distress?
At least ONE factor from the PRIMARY Distress
Category
5
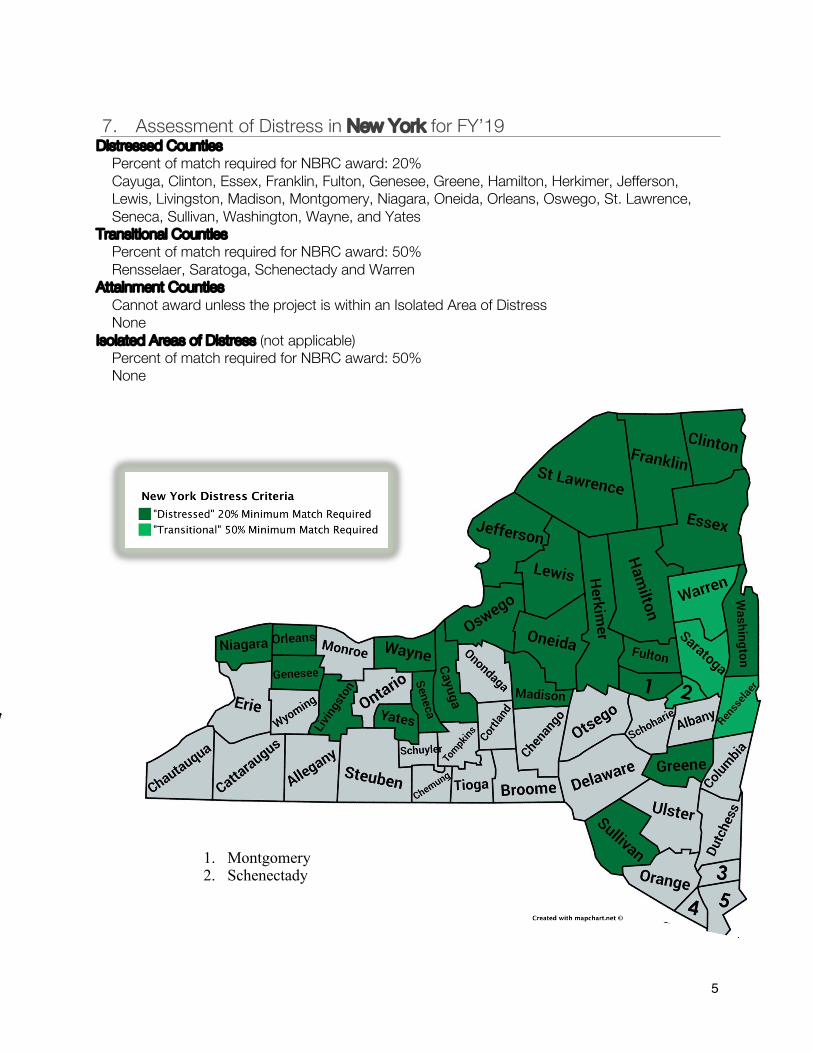
7. Assessment of Distress in New York for FY’19
Distressed Counties Percent of match required for NBRC award: 20% Cayuga, Clinton, Essex, Franklin, Fulton, Genesee, Greene, Hamilton, Herkimer, Jefferson, Lewis, Livingston, Madison, Montgomery, Niagara, Oneida, Orleans, Oswego, St. Lawrence, Seneca, Sullivan, Washington, Wayne, and Yates
Transitional Counties Percent of match required for NBRC award: 50% Rensselaer, Saratoga, Schenectady and Warren
Attainment Counties Cannot award unless the project is within an Isolated Area of Distress None
Isolated Areas of Distress (not applicable) Percent of match required for NBRC award: 50% None
1. Montgomery 2. Schenectady
TABLE 1: NBRC Counties - Levels of Distress
Percent below
poverty level (2)
Unemploy. Rate
(2)
Percent Change
in Populatio
n (3)
Percent bachelor's degree or higher
(2)
Median household income
(2)
2010 Seasonal Home %
(4)
United States 15.1 7.4 3.2 30.3 $55,322 3.5NBRC Region 14.9 7.0 -0.80 23.6 16.5
Criteria compared to is > US > US < 0% < US < US < NBRC Region
New York Cayuga County, New York 11.4 6.9 -1.6 21.6 $53,114 7.9 ✓
Clinton County, New York 16.1 6.6 -0.8 22.2 $50,502 6.2 ✓Essex County, New York 10.1 7.5 -2.0 24.6 $53,244 29.9 ✓Franklin County, New York 19.2 8.5 -1.1 18.4 $49,782 17.5 ✓Fulton County, New York 16.7 8 -2.2 17.0 $46,090 13.7 ✓Genesee County, New York 12.5 5.4 -1.7 21.2 $52,641 1.1 ✓Greene County, New York 13 7.8 -2.3 20.3 $51,013 23.2 ✓Hamilton County, New York 11.3 9.2 -2.9 21.6 $52,708 71.1 ✓Herkimer County, New York 14 8.8 -1.5 21.5 $48,893 14.1 ✓Jefferson County, New York 14.6 9.4 1.5 20.8 $49,911 18.7 ✓Lewis County, New York 14 7.9 0.1 15.5 $49,976 25.2 ✓Livingston County, New York 14.9 5.1 -1.2 24.5 $52,724 4.8 ✓Madison County, New York 11.9 4.9 -1.8 26.7 $55,858 6.8 ✓Montgomery County, New York 20.6 8.4 -1.1 16.0 $44,455 1.4 ✓Niagara County, New York 13.6 7.1 -1.4 23.5 $50,094 1.1 ✓Oneida County, New York 16.7 6.9 -0.9 23.8 $49,838 3.3 ✓Orleans County, New York 15.6 7.4 -2.2 15.9 $48,731 5.8 ✓Oswego County, New York 18.3 9.1 -1.3 18.0 $49,571 7.0 ✓Rensselaer County, New York 12.4 6.8 0.3 29.3 $61,754 2.1 ✓St. Lawrence County, New York 19.2 10 -0.4 22.8 $46,313 14.5 ✓Saratoga County, New York 6.4 5.4 2.4 39.6 $74,080 5.6 ✓Schenectady County, New York 12 7.4 0.1 30.6 $59,959 0.6 ✓
Seneca County, New York 12.4 5.3 -0.6 20.0 $50,073 9.9 ✓
Sullivan County, New York 17.1 10.1 -2.2 22.4 $52,027 29.2 ✓
Warren County, New York 11.1 6 -1.2 28.4 $57,174 22.2 ✓
Washington County, New York 12.9 8.1 -1.2 20.2 $51,449 10.0 ✓
Wayne County, New York 11.9 7 -2.0 21.2 $51,627 4.5 ✓Yates County, New York 13.9 7.2 -1.0 23.2 $50,105 24.0 ✓
Analysis:New York Counties -�Levels of Distress
Secondary Distress Categories
Attainment County?
(no measures of
distress)
Primary Distress Categories (1)
Transitional County?
At least ONE factor from EITHER of the criteria categories?
Distressed County?
At least THREE
factors AND at least ONE from each category?
6
Vermont
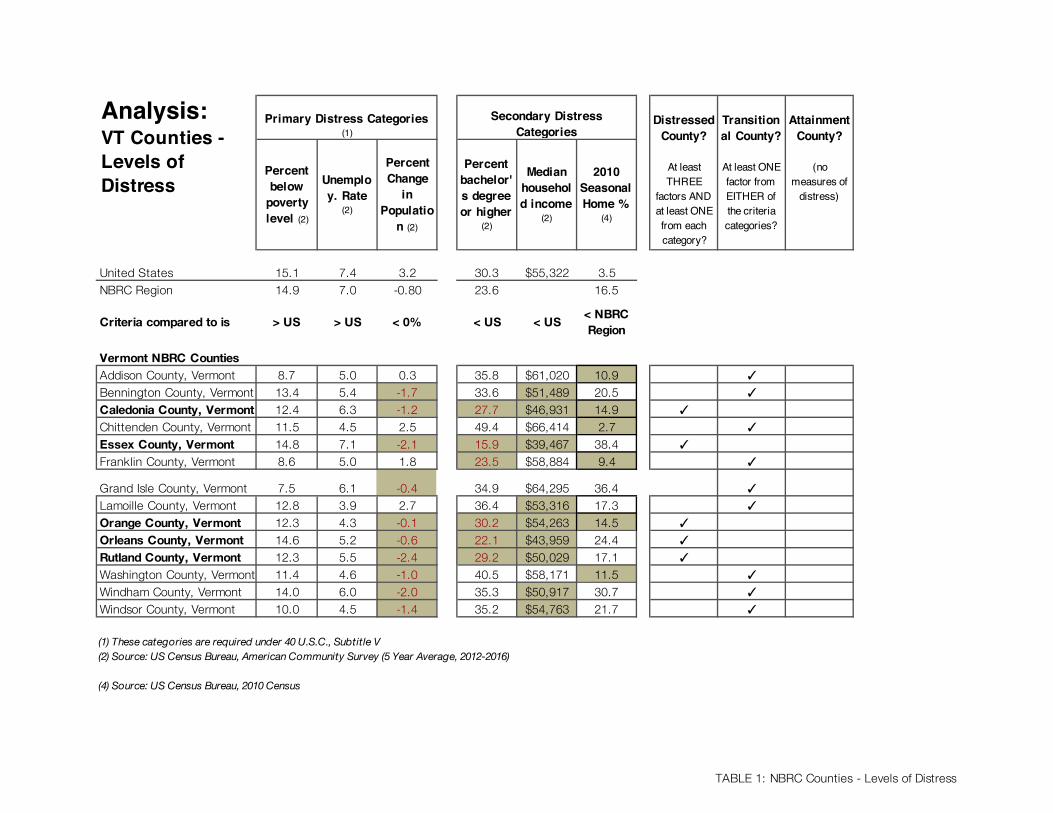
8. Assessment of Distress in Vermont for FY 2019
Distressed Counties Percent of match required for NBRC award: 20% Caledonia, Essex, Orange, Orleans, and Rutland
Transitional Counties Percent of match required for NBRC award: 50% Addison, Bennington, Chittenden, Franklin, Grand Isle, Lamoille, Washington, Windham and Windsor
Attainment Counties Not eligible, unless designated as an Isolated Area of Distress None
Isolated Areas of Distress (not applicable)
TABLE 1: NBRC Counties - Levels of Distress
Percent below
poverty level (2)
Unemploy. Rate
(2)
Percent Change
in Populatio
n (2)
Percent bachelor's degree or higher
(2)
Median household income
(2)
2010 Seasonal Home %
(4)
United States 15.1 7.4 3.2 30.3 $55,322 3.5NBRC Region 14.9 7.0 -0.80 23.6 16.5
Criteria compared to is > US > US < 0% < US < US < NBRC Region