Transportation leadership you can trust. presented to Tennessee Model Users Group Prepared by David Kurth and Thomas Rossi Updated and Presented by Robert G. Schiffer, AICP Cambridge Systematics, Inc. March 28, 2012 NCHRP 8-61 Travel Demand Forecasting: Parameters and Techniques
Transcript
Transportation leadership you can trust.
presented to
Tennessee Model Users Group
Prepared byDavid Kurth and Thomas RossiUpdated and Presented by
Robert G. Schiffer, AICP Cambridge Systematics, Inc.
March 28, 2012
NCHRP 8-61 Travel Demand Forecasting: Parameters and Techniques
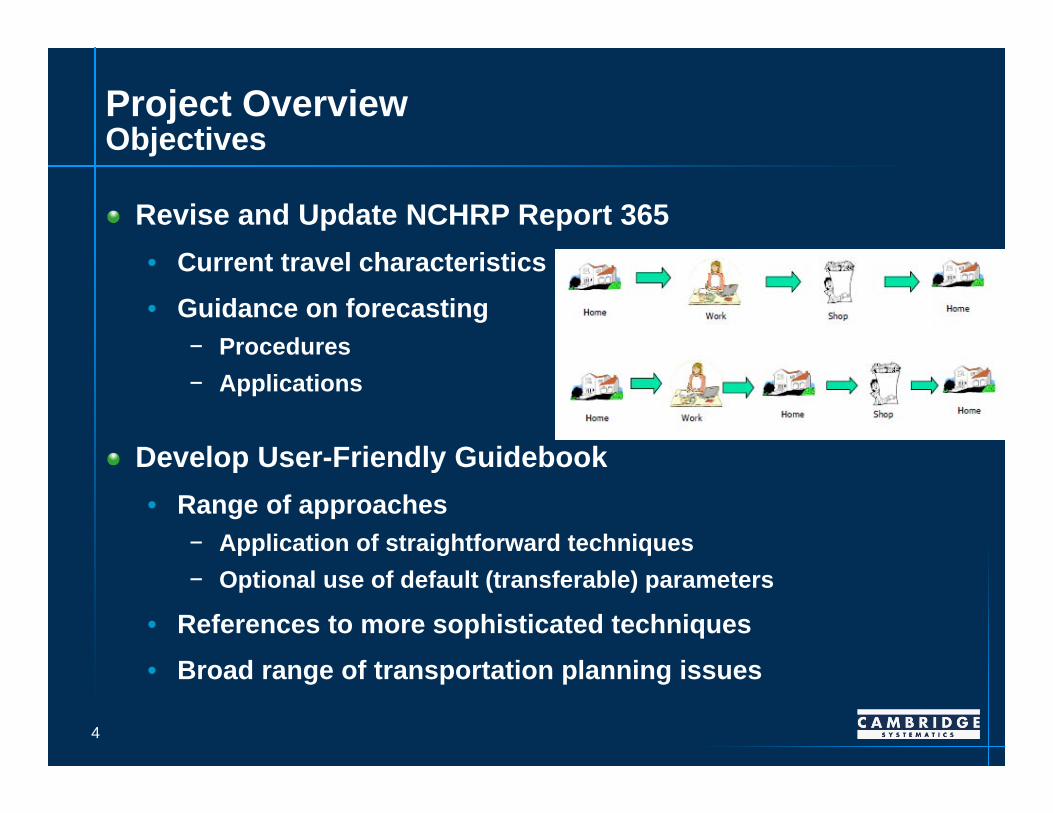
Revise and Update NCHRP Report 365• Current travel characteristics• Guidance on forecasting
− Procedures− Applications
Develop User-Friendly Guidebook• Range of approaches
− Application of straightforward techniques− Optional use of default (transferable) parameters
• References to more sophisticated techniques• Broad range of transportation planning issues
5
Project OverviewStatus to Date
Analysis of 2001 NHTS data
Analysis of MPO model documentation
Guidebook finalized
Case studies completed/documented
Forecast YearHighwayNetwork
ForecastYearTransit Network
Forecast YearSocioeconomic Data
Trip Generation Model
Internal Productions and Attractions by Purpose
Trip DistributionModel
Mode ChoiceModel
Person and VehicleTrip Tables by
Purpose/Time Period
Time of Day Model
Person and Vehicle Trip Tablesby Mode/Purpose/Time Period
HighwayAssignment
CHECK: Input andoutput times consistent?
Transit Assignment
Highway Volumes/Times by Time Period
Transit Volumes/Times by Time Period
Input Data
Model Output
Model Component
Decision
FeedbackLoop
Yes
No
Truck Trip Generationand Distribution Models
Production/Attraction PersonTrip Tables by Purpose
Truck Vehicle TripTables by Purpose
Truck Time of DayModel
Truck Vehicle TripTables by Time Period
External TripGeneration
andDistribution
Models
External Vehicle TripTables by Time Period
6
Analysis of NHTS DataProcess
Information developed for four variables of interest• Person trip production rates
− Per household by trip purpose
• Reported average trip durations− By mode and trip purpose
• Time of day of travel distributions− By trip purpose
• Vehicle occupancy − By trip purpose
Variables selected based on potential for transferability
7
Analysis of NHTS DataClassifications
Trip purposes used for data summaries • Home based work• Home based school• Home based other• Non-home based
Urban area population classifications (from 2009 NHTS)• 1 million + with subway/rail; 1 million + without subway/rail• 500k to 1 million• 200k to 500k• 50k to 200k• Not in urban area
Home based non-work
8
Analysis of NHTS DataSample Tabulations
Sample trip production tabulation (2009)Home based work - MSA population less than 250,000
Workers
Autos 0 1 2 3+ Avg
0 0.0 1.2 2.3 1.6 0.6
1 0.0 1.0 1.7 4.7 0.7
2 0.0 1.3 2.5 2.8 1.7
3+ 0.0 1.2 2.5 3.7 2.3
Avg 0.0 1.1 2.4 3.6 1.5
9
Analysis of NHTS DataSample Tabulations
Sample trip length tabulation (2009)Home based work – Average travel time in minutes
MSA Population18 Auto TransitNon-
MotorizedAll
Modes
Greater than 3 million 29 56 18 31
Between 1 and 3 million 24 48 19 25Between 500,000 and 1 million 24 53 14 24Between 250,000 and 500,000 21 30 11 21
Less than 250,000 20 59 11 20
Not in MSA 21 57 8 21
All trips 25 55 15 26
10
Data from Existing MPO ModelsProcess
Information from over 70 MPOs• Small, medium, large• Direct contact or publicly available reports• Information collected
− Model parameters♦ Trip attraction rates♦ Friction factor parameters♦ Mode choice parameters♦ Volume-delay function parameters♦ …
− Model methods used
11
Data from Existing MPO Models Sample Tabulation
Sample gamma function gravity model parameters(home based work)
V/CLarge MPO Large MPO Large MPO Large MPO Large MPOLarge MPO Large MPO Large MPO Large MPO Large MPOLarge MPO Large MPO Medium MPO Medium MPO Medium MPOMedium MPO Small MPO Average Curve
What’s in the Guidebook? (continued)
Chapter 4 subsectionsVehicle Availability
Trip Generation
Trip Distribution
External Travel
Mode Choice
Automobile Occupancy
Time-of-Day Characteristics
Truck/Freight Modeling
Highway Assignment
Transit Assignment
16
What’s in the Guidebook? (continued)
Chapter 4 appendices
% of HHs by number of vehicles by U.S. metro area
Coefficients for logit vehicle availability models
• 1 vehicle HHs
• 2 vehicle HHs
• 3+ vehicle HHs
Mean trip length in minutes by purpose and mode by population range
Trip production rates by population size and purpose:
• HBW
• HBNW
• NHB
• HBSC
• HBO (nonwork, nonschool)
Time-of-day distributions by purpose and direction
17
18
What’s in the Guidebook? (continued)
Chapter 5. Model Validation Process• Validation overview
− Consistent with other sources
− Appropriate out-references
− Not duplication of existing references
• Basic guidance − Focus on information
in the guidebook
19
What’s in the Guidebook? (continued)
Chapter 6. Advanced Modeling Practices• Overview • Tour and activity based approaches• Traffic microsimulation
Chapter 7. Case Study Application(s)• Two studies
− Smaller urban area with little transit− Larger area with transit
• Illustrate use of the information from Chapters 4 and 5
• Draw on concepts presented guidebook− Similar to approach in NCHRP Report 365
20
Next Steps
Publication of Final Report
Related study in progress – NCHRP 8-84, Long-Distance and Rural Transferable Parameters for Statewide Models• Conduct Review of Long-Distance Data
Sources - complete• Review of Statewide Model Long-Distance