NCHRP IDEA Program BRIDGE DECK SEALER MONITOR: THERMAL SEALCHECK Final Report for NCHRP IDEA Project 220 Prepared by: Paul A. Fuchs, Ph.D. Glenn A. Washer, Ph.D., P.E. Fuchs Consulting, Inc. October 2021
Transcript
NCHRP IDEA Program
BRIDGE DECK SEALER MONITOR: THERMAL SEALCHECK
Final Report for NCHRP IDEA Project 220
Prepared by: Paul A. Fuchs, Ph.D. Glenn A. Washer, Ph.D., P.E. Fuchs Consulting, Inc. October 2021
Innovations Deserving Exploratory Analysis (IDEA) Programs Managed by the Transportation Research Board
This IDEA project was funded by the NCHRP IDEA Program.
The TRB currently manages the following three IDEA programs:
• The NCHRP IDEA Program, which focuses on advances in the design, construction, and maintenance of highway systems, is funded by American Association of State Highway and Transportation Officials (AASHTO) as part of the National Cooperative Highway Research Program (NCHRP).
• The Safety IDEA Program currently focuses on innovative approaches for improving railroad safety or performance. The program is currently funded by the Federal Railroad Administration (FRA). The program was previously jointly funded by the Federal Motor Carrier Safety Administration (FMCSA) and the FRA.
• The Transit IDEA Program, which supports development and testing of innovative concepts and methods for advancing transit practice, is funded by the Federal Transit Administration (FTA) as part of the Transit Cooperative Research Program (TCRP).
Management of the three IDEA programs is coordinated to promote the development and testing of innovative concepts, methods, and technologies.
For information on the IDEA programs, check the IDEA website (www.trb.org/idea). For questions, contact the IDEA programs office by telephone at (202) 334-3310.
IDEA Programs Transportation Research Board 500 Fifth Street, NW Washington, DC 20001
The project that is the subject of this contractor-authored report was a part of the Innovations Deserving Exploratory Analysis (IDEA) Programs, which are managed by the Transportation Research Board (TRB) with the approval of the National Academies of Sciences, Engineering, and Medicine. The members of the oversight committee that monitored the project and reviewed the report were chosen for their special competencies and with regard for appropriate balance. The views expressed in this report are those of the contractor who conducted the investigation documented in this report and do not necessarily reflect those of the Transportation Research Board; the National Academies of Sciences, Engineering, and Medicine; or the sponsors of the IDEA Programs.
The Transportation Research Board; the National Academies of Sciences, Engineering, and Medicine; and the organizations that sponsor the IDEA Programs do not endorse products or manufacturers. Trade or manufacturers’ names appear herein solely because they are considered essential to the object of the investigation.
IDEA Program Transportation Research Board The National Academies 500 Fifth Street NW Washington, DC 20001
Prepared by Fuchs Consulting, Inc. Paul A. Fuchs, Ph.D. Glenn A. Washer, Ph.D., P.E. 75 Lawson Road, SE STE 204 Leesburg, VA 20175 Phone: (703) 777-2115 Fax: (703) 737-6381 Cell: (571) 239-7139 [email protected]
ACKNOWLEDGEMENTS We would like to express our appreciation to the National Cooperative Highway Research (NCHRP) IDEA Program for supporting this project. In particular, we would like to thank Inam Jawed (Senior Program Officer, NCHRP) for all his contributions to this effort. Without this support we would not have had the opportunity to develop this new measurement method that we hope will contribute to the highway bridge community.
We would like to thank our project expert panel members.
J. L. Milton Bridge Preservation Specialist Structure and Bridge Division Virginia Department of Transportation
Ryan Bowers P.E. Structures Asset Management Engineer Bureau of Structures Wisconsin Department of Transportation
Ryan Martin, P.E. Research Engineer Missouri Department of Transportation
We acknowledge the support of Rex Pearce (Staunton District Bridge Engineer) of the Virginia Department of Transportation. VDOT offered to assist with the research effort and provide access to test slabs and facilities for testing. COVID-19 restrictions made such testing impractical.
We would like to acknowledge the following organizations and individuals who assisted these field test efforts. We appreciate access to the bridges and the resources provided by the Missouri Department of Transportation, the City of Columbia, Missouri, and Emery, Sapp, & Sons.
Kenyon R. Warbritton, P.E. Maintenance Liaison Engineer Missouri Department of Transportation
James Hager District Engineer Missouri Department of Transportation Chip Jones, P.E. Emery, Sapp & Sons Columbia, MO Seth Nelson, P.E. Pavement Engineer Public Works Department City of Columbia, MO Tim Woolery Vice President of Sales Advanced Chemical Technologies, Inc.
NCHRP IDEA PROGRAM COMMITTEE
CHAIR CATHERINE MCGHEE Virginia DOT
MEMBERS FARHAD ANSARI University of Illinois at Chicago NICHOLAS BURMAS California DOT PAUL CARLSON Road Infrastructure, Inc. ERIC HARM Consultant PATRICIA LEAVENWORTH Massachusetts DOT A. EMILY PARKANY Virginia Agency of Transportation KEVIN PETE Texas DOT JOSEPH WARTMAN University of Washington
AASHTO LIAISON GLENN PAGE AASHTO FHWA LIAISON MARY HUIE Federal Highway Administration
USDOT/SBIR LIAISON RACHEL SACK USDOT Volpe Center TRB LIAISON RICHARD CUNARD Transportation Research Board
IDEA PRO GRAMS STAFF CHRISTOPHER HEDGES Director, Cooperative Research Programs LORI SUNDSTROM Deputy Director, Cooperative Research Programs INAM JAWED Senior Program Officer DEMISHA WILLIAMS Senior Program Assistant
EXPERT REVIEW PANEL Ryan Bowers, Wisconsin DOT Patricia A. Leavenworth, Massachusetts DOT Ryan Martin, Missouri DOT J. L. Milton, Virginia DOT.
iii
TABLE OF CONTENTS Acknowledgements ........................................................................................................................................................................ii Table of Contents ..........................................................................................................................................................................iii Executive Summary .......................................................................................................................................................................1 Bridge Deck Sealer Monitor: Thermal SealCheck.......................................................................................................................2 IDEA Product .................................................................................................................................................................................2 Concept and Innovation .................................................................................................................................................................2
Extension of IR-UTD Technology ...........................................................................................................................................3 Investigation ...................................................................................................................................................................................4 Current Deck sealing procedures ..................................................................................................................................................4
Standard methods for assessment of deck sealers ...................................................................................................................5 Laboratory testing ..........................................................................................................................................................................6
Description of laboratory test setup ..........................................................................................................................................6 Sealer ..........................................................................................................................................................................................7 Reference Specimens.................................................................................................................................................................7
Develop of measurement algorithms ............................................................................................................................................8 Measurement principle ..............................................................................................................................................................9 Data processing steps...............................................................................................................................................................10 Laboratory Test Results...........................................................................................................................................................10
Quantitative Data .................................................................................................................................................................11 Field Testing .................................................................................................................................................................................12
Test Procedure..........................................................................................................................................................................12 Test Bridge Description...........................................................................................................................................................13
Rt. 22 over Rt. 63.................................................................................................................................................................13 Old K over Hinkson Creek..................................................................................................................................................16
Deck Water Method Comparison ...........................................................................................................................................18 Reference Slabs........................................................................................................................................................................18 Field Test Results.....................................................................................................................................................................19
Test 1: Partial Sealed Deck Test .........................................................................................................................................19 Test 2: Unsealed Deck Test.................................................................................................................................................21 Test 3: Sealed Deck Test .....................................................................................................................................................23
Plans for Implementation.............................................................................................................................................................25 Conclusion ....................................................................................................................................................................................26 Future Work..................................................................................................................................................................................26 Investigator Profile.......................................................................................................................................................................27 Glossary and References..............................................................................................................................................................27
1
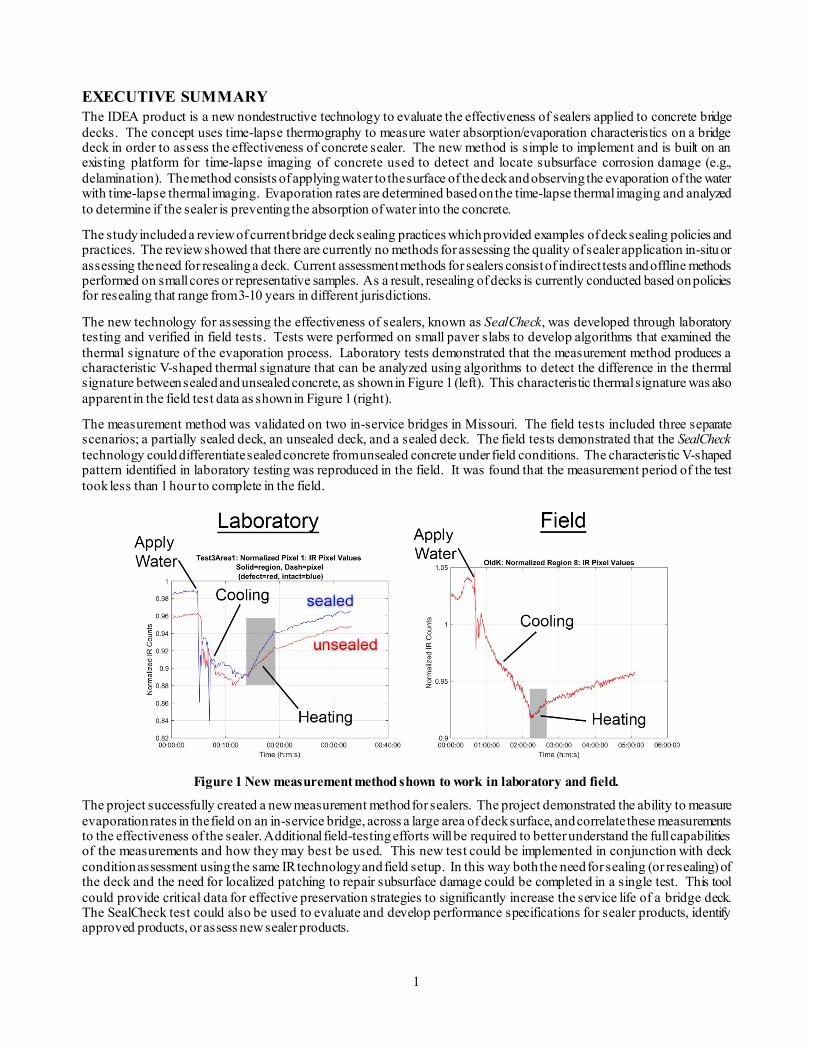
EXECUTIVE SUMMARY The IDEA product is a new nondestructive technology to evaluate the effectiveness of sealers applied to concrete bridge decks. The concept uses time-lapse thermography to measure water absorption/evaporation characteristics on a bridge deck in order to assess the effectiveness of concrete sealer. The new method is simple to implement and is built on an existing platform for time-lapse imaging of concrete used to detect and locate subsurface corrosion damage (e.g., delamination). The method consists of applying water to the surface of the deck and observing the evaporation of the water with time-lapse thermal imaging. Evaporation rates are determined based on the time-lapse thermal imaging and analyzed to determine if the sealer is preventing the absorption of water into the concrete.
The study included a review of current bridge deck sealing practices which provided examples of deck sealing policies and practices. The review showed that there are currently no methods for assessing the quality of sealer application in-situ or assessing the need for resealing a deck. Current assessment methods for sealers consist of indirect tests and offline methods performed on small cores or representative samples. As a result, resealing of decks is currently conducted based on policies for resealing that range from 3-10 years in different jurisdictions.
The new technology for assessing the effectiveness of sealers, known as SealCheck, was developed through laboratory testing and verified in field tests. Tests were performed on small paver slabs to develop algorithms that examined the thermal signature of the evaporation process. Laboratory tests demonstrated that the measurement method produces a characteristic V-shaped thermal signature that can be analyzed using algorithms to detect the difference in the thermal signature between sealed and unsealed concrete, as shown in Figure 1 (left). This characteristic thermal signature was also apparent in the field test data as shown in Figure 1 (right).
The measurement method was validated on two in-service bridges in Missouri. The field tests included three separate scenarios; a partially sealed deck, an unsealed deck, and a sealed deck. The field tests demonstrated that the SealCheck technology could differentiate sealed concrete from unsealed concrete under field conditions. The characteristic V-shaped pattern identified in laboratory testing was reproduced in the field. It was found that the measurement period of the test took less than 1 hour to complete in the field.
Figure 1 New measurement method shown to work in laboratory and field.
The project successfully created a new measurement method for sealers. The project demonstrated the ability to measure evaporation rates in the field on an in-service bridge, across a large area of deck surface, and correlate these measurements to the effectiveness of the sealer. Additional field-testing efforts will be required to better understand the full capabilities of the measurements and how they may best be used. This new test could be implemented in conjunction with deck condition assessment using the same IR technology and field setup. In this way both the need for sealing (or resealing) of the deck and the need for localized patching to repair subsurface damage could be completed in a single test. This tool could provide critical data for effective preservation strategies to significantly increase the service life of a bridge deck. The SealCheck test could also be used to evaluate and develop performance specifications for sealer products, identify approved products, or assess new sealer products.
2
BRIDGE DECK SEALER MONITOR: THERMAL SEALCHECK
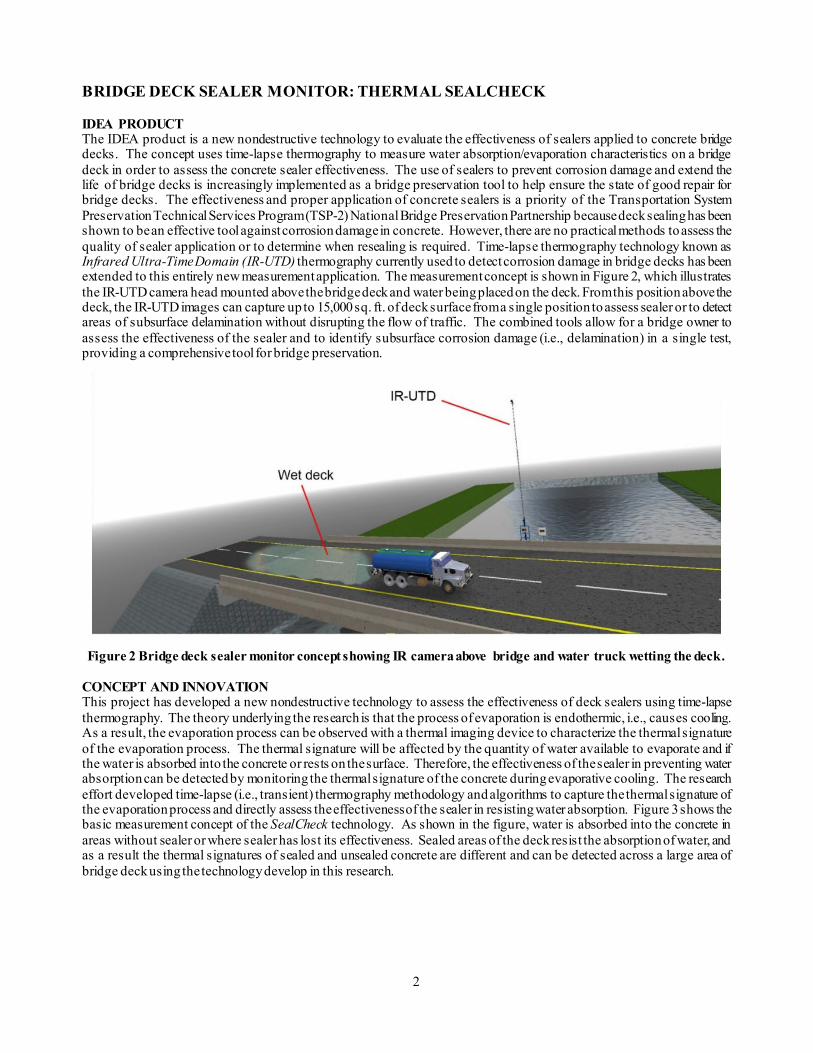
IDEA PRODUCT The IDEA product is a new nondestructive technology to evaluate the effectiveness of sealers applied to concrete bridge decks. The concept uses time-lapse thermography to measure water absorption/evaporation characteristics on a bridge deck in order to assess the concrete sealer effectiveness. The use of sealers to prevent corrosion damage and extend the life of bridge decks is increasingly implemented as a bridge preservation tool to help ensure the state of good repair for bridge decks. The effectiveness and proper application of concrete sealers is a priority of the Transportation System Preservation Technical Services Program (TSP-2) National Bridge Preservation Partnership because deck sealing has been shown to be an effective tool against corrosion damage in concrete. However, there are no practical methods to assess the quality of sealer application or to determine when resealing is required. Time-lapse thermography technology known as Infrared Ultra-Time Domain (IR-UTD) thermography currently used to detect corrosion damage in bridge decks has been extended to this entirely new measurement application. The measurement concept is shown in Figure 2, which illustrates the IR-UTD camera head mounted above the bridge deck and water being placed on the deck. From this position above the deck, the IR-UTD images can capture up to 15,000 sq. ft. of deck surface from a single position to assess sealer or to detect areas of subsurface delamination without disrupting the flow of traffic. The combined tools allow for a bridge owner to assess the effectiveness of the sealer and to identify subsurface corrosion damage (i.e., delamination) in a single test, providing a comprehensive tool for bridge preservation.
Figure 2 Bridge deck sealer monitor concept showing IR camera above bridge and water truck wetting the deck.
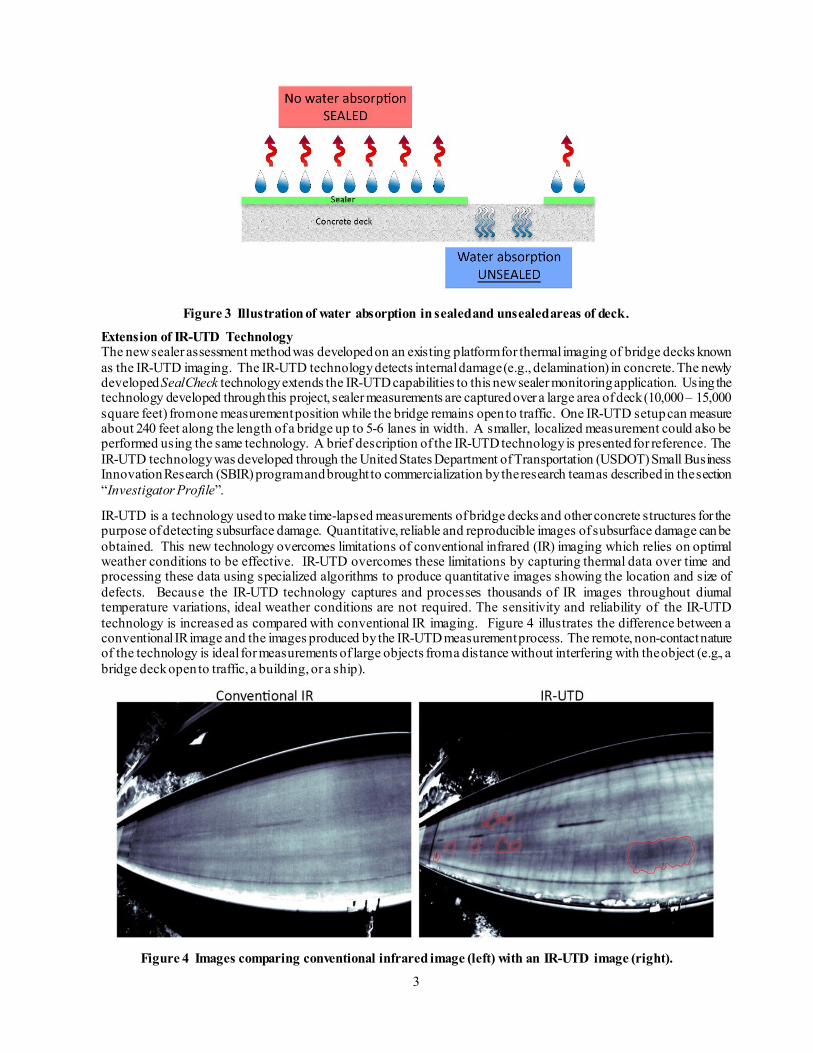
CONCEPT AND INNOVATION This project has developed a new nondestructive technology to assess the effectiveness of deck sealers using time-lapse thermography. The theory underlying the research is that the process of evaporation is endothermic, i.e., causes cooling. As a result, the evaporation process can be observed with a thermal imaging device to characterize the thermal signature of the evaporation process. The thermal signature will be affected by the quantity of water available to evaporate and if the water is absorbed into the concrete or rests on the surface. Therefore, the effectiveness of the sealer in preventing water absorption can be detected by monitoring the thermal signature of the concrete during evaporative cooling. The research effort developed time-lapse (i.e., transient) thermography methodology and algorithms to capture the thermal signature of the evaporation process and directly assess the effectiveness of the sealer in resisting water absorption. Figure 3 shows the basic measurement concept of the SealCheck technology. As shown in the figure, water is absorbed into the concrete in areas without sealer or where sealer has lost its effectiveness. Sealed areas of the deck resist the absorption of water, and as a result the thermal signatures of sealed and unsealed concrete are different and can be detected across a large area of bridge deck using the technology develop in this research.
3
Figure 3 Illustration of water absorption in sealed and unsealed areas of deck.
Extension of IR-UTD Technology The new sealer assessment method was developed on an existing platform for thermal imaging of bridge decks known as the IR-UTD imaging. The IR-UTD technology detects internal damage (e.g., delamination) in concrete. The newly developed SealCheck technology extends the IR-UTD capabilities to this new sealer monitoring application. Using the technology developed through this project, sealer measurements are captured over a large area of deck (10,000 – 15,000 square feet) from one measurement position while the bridge remains open to traffic. One IR-UTD setup can measure about 240 feet along the length of a bridge up to 5-6 lanes in width. A smaller, localized measurement could also be performed using the same technology. A brief description of the IR-UTD technology is presented for reference. The IR-UTD technology was developed through the United States Department of Transportation (USDOT) Small Business Innovation Research (SBIR) program and brought to commercialization by the research team as described in the section “Investigator Profile”.
IR-UTD is a technology used to make time-lapsed measurements of bridge decks and other concrete structures for the purpose of detecting subsurface damage. Quantitative, reliable and reproducible images of subsurface damage can be obtained. This new technology overcomes limitations of conventional infrared (IR) imaging which relies on optimal weather conditions to be effective. IR-UTD overcomes these limitations by capturing thermal data over time and processing these data using specialized algorithms to produce quantitative images showing the location and size of defects. Because the IR-UTD technology captures and processes thousands of IR images throughout diurnal temperature variations, ideal weather conditions are not required. The sensitivity and reliability of the IR-UTD technology is increased as compared with conventional IR imaging. Figure 4 illustrates the difference between a conventional IR image and the images produced by the IR-UTD measurement process. The remote, non-contact nature of the technology is ideal for measurements of large objects from a distance without interfering with the object (e.g., a bridge deck open to traffic, a building, or a ship).
Figure 4 Images comparing conventional infrared image (left) with an IR-UTD image (right).
4
As shown in the figure, the conventional IR image shows very little detail. By comparison, the processed IR-UTD images shows significantly more detail and clarity of the thermal features of the deck. For example, the deck shown in the figure has significant transverse cracking and area of subsurface delamination at depths of ~3 in. in the concrete. These subsurface defects are shown in the IR-UTD data but are not shown in the conventional IR images. These data illustrate the increased sensitivity of IR-UTD as compared with conventional IR imaging.
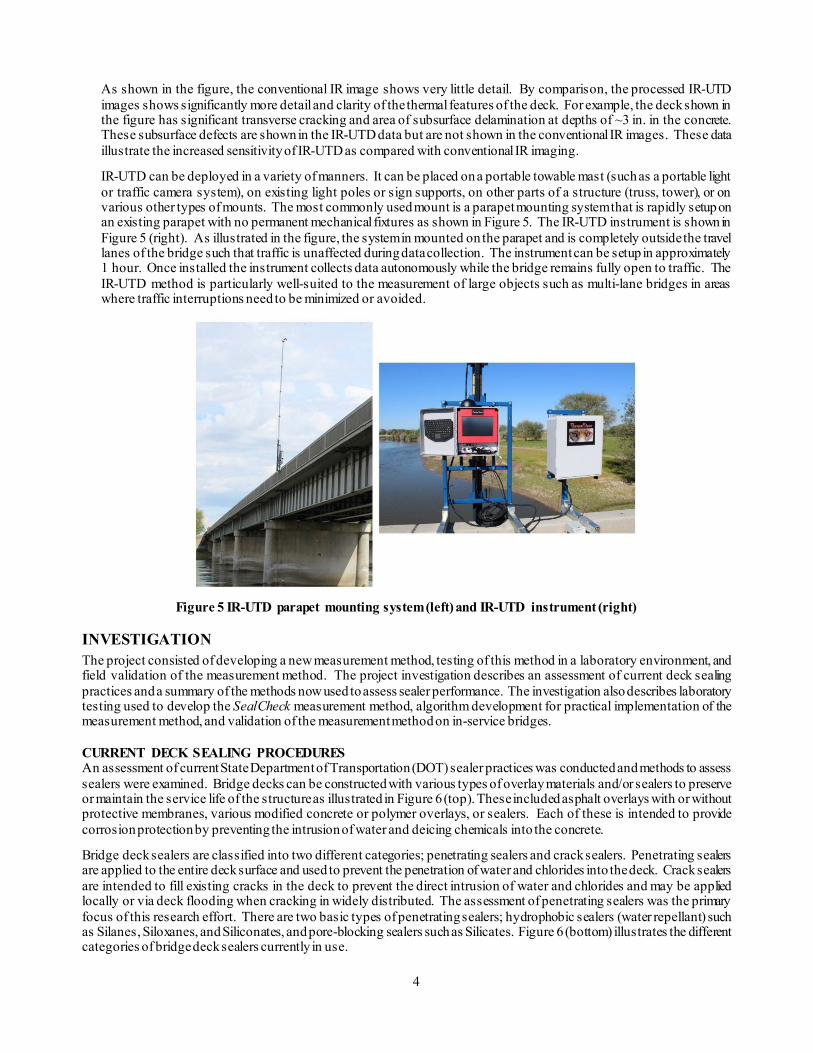
IR-UTD can be deployed in a variety of manners. It can be placed on a portable towable mast (such as a portable light or traffic camera system), on existing light poles or sign supports, on other parts of a structure (truss, tower), or on various other types of mounts. The most commonly used mount is a parapet mounting system that is rapidly setup on an existing parapet with no permanent mechanical fixtures as shown in Figure 5. The IR-UTD instrument is shown in Figure 5 (right). As illustrated in the figure, the system in mounted on the parapet and is completely outside the travel lanes of the bridge such that traffic is unaffected during data collection. The instrument can be setup in approximately 1 hour. Once installed the instrument collects data autonomously while the bridge remains fully open to traffic. The IR-UTD method is particularly well-suited to the measurement of large objects such as multi-lane bridges in areas where traffic interruptions need to be minimized or avoided.
Figure 5 IR-UTD parapet mounting system (left) and IR-UTD instrument (right)
INVESTIGATION The project consisted of developing a new measurement method, testing of this method in a laboratory environment, and field validation of the measurement method. The project investigation describes an assessment of current deck sealing practices and a summary of the methods now used to assess sealer performance. The investigation also describes laboratory testing used to develop the SealCheck measurement method, algorithm development for practical implementation of the measurement method, and validation of the measurement method on in-service bridges.
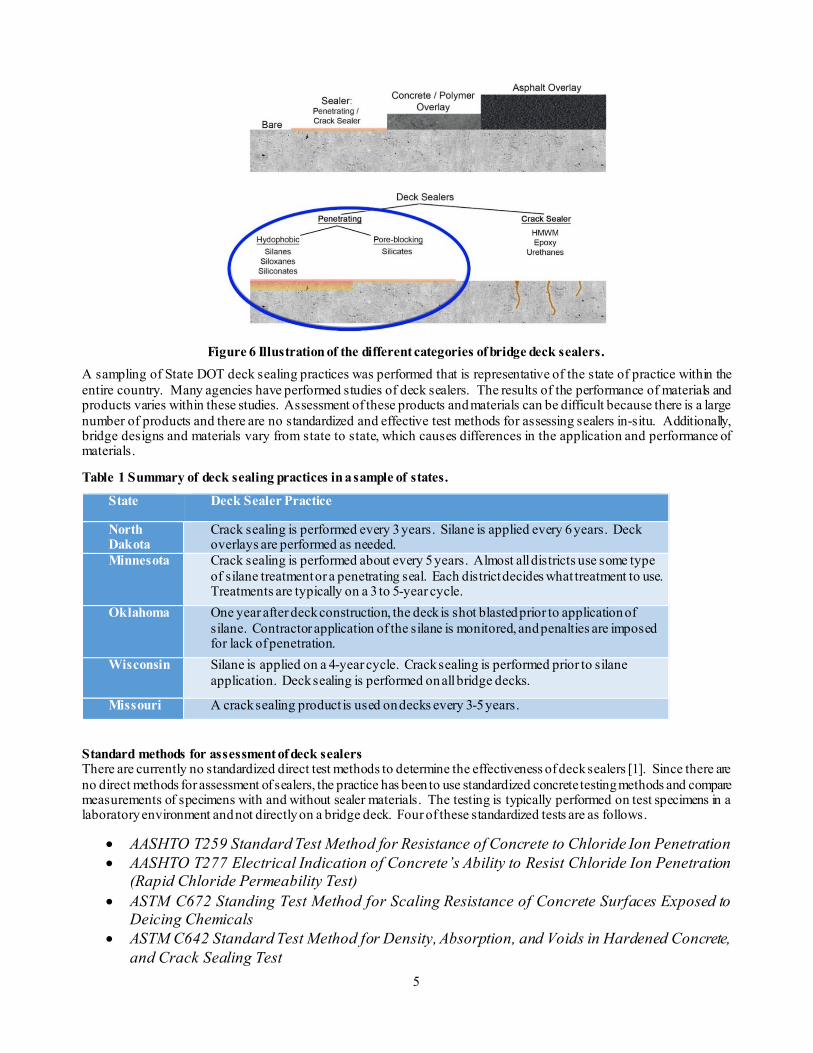
CURRENT DECK SEALING PROCEDURES An assessment of current State Department of Transportation (DOT) sealer practices was conducted and methods to assess sealers were examined. Bridge decks can be constructed with various types of overlay materials and/or sealers to preserve or maintain the service life of the structure as illustrated in Figure 6 (top). These included asphalt overlays with or without protective membranes, various modified concrete or polymer overlays, or sealers. Each of these is intended to provide corrosion protection by preventing the intrusion of water and deicing chemicals into the concrete.
Bridge deck sealers are classified into two different categories; penetrating sealers and crack sealers. Penetrating sealers are applied to the entire deck surface and used to prevent the penetration of water and chlorides into the deck. Crack sealers are intended to fill existing cracks in the deck to prevent the direct intrusion of water and chlorides and may be applied locally or via deck flooding when cracking in widely distributed. The assessment of penetrating sealers was the primary focus of this research effort. There are two basic types of penetrating sealers; hydrophobic sealers (water repellant) such as Silanes, Siloxanes, and Siliconates, and pore-blocking sealers such as Silicates. Figure 6 (bottom) illustrates the different categories of bridge deck sealers currently in use.
5
Figure 6 Illustration of the different categories of bridge deck sealers. A sampling of State DOT deck sealing practices was performed that is representative of the state of practice within the entire country. Many agencies have performed studies of deck sealers. The results of the performance of materials and products varies within these studies. Assessment of these products and materials can be difficult because there is a large number of products and there are no standardized and effective test methods for assessing sealers in-situ. Additionally, bridge designs and materials vary from state to state, which causes differences in the application and performance of materials.
Table 1 Summary of deck sealing practices in a sample of states.
State Deck Sealer Practice
North Dakota
Crack sealing is performed every 3 years. Silane is applied every 6 years. Deck overlays are performed as needed.
Minnesota Crack sealing is performed about every 5 years. Almost all districts use some type of silane treatment or a penetrating seal. Each district decides what treatment to use. Treatments are typically on a 3 to 5-year cycle.
Oklahoma One year after deck construction, the deck is shot blasted prior to application of silane. Contractor application of the silane is monitored, and penalties are imposed for lack of penetration.
Wisconsin Silane is applied on a 4-year cycle. Crack sealing is performed prior to silane application. Deck sealing is performed on all bridge decks.
Missouri A crack sealing product is used on decks every 3-5 years.
Standard methods for assessment of deck sealers There are currently no standardized direct test methods to determine the effectiveness of deck sealers [1]. Since there are no direct methods for assessment of sealers, the practice has been to use standardized concrete testing methods and compare measurements of specimens with and without sealer materials. The testing is typically performed on test specimens in a laboratory environment and not directly on a bridge deck. Four of these standardized tests are as follows.
• AASHTO T259 Standard Test Method for Resistance of Concrete to Chloride Ion Penetration • AASHTO T277 Electrical Indication of Concrete’s Ability to Resist Chloride Ion Penetration
(Rapid Chloride Permeability Test) • ASTM C672 Standing Test Method for Scaling Resistance of Concrete Surfaces Exposed to
Deicing Chemicals • ASTM C642 Standard Test Method for Density, Absorption, and Voids in Hardened Concrete,
and Crack Sealing Test
6
Many of the tests are time-consuming to perform. For example, the Chloride Ion Penetration Test (AASHTO T259) requires a 90-day period where water is ponded on a specimen. These types of tests are applied to assess the performance of a material, as compared to a quality control or quality assessment tool for product application. No current measurement methods provide field assessment of a bridge deck sealer to determine if reapplication is needed or to verify the quality of new sealer applications.
In addition to standardized test methods, one non-standardized test, known as the Crack Sealing Test, has also been used by some State DOTs to assess sealers. Concrete beam specimens are broken in a three-point bending test and then put back together. Water is ponded over the crack in the beam and the amount of time for water to flow through the crack to the other side of the beam is measured. This test can be performed before and after coating with a sealer.
LABORATORY TESTING Laboratory tests were conducted to develop a measurement procedure and algorithm for detection of sealers on concrete. The experimental approach was to capture transient thermal images of several slabs with and without sealer simultaneously during the water evaporation process.
Description of laboratory test setup The following is a description of the test setup used to develop a measurement method to assess the presence or absence of concrete sealer. Small concrete paving slabs were used as test specimens for initial developmental testing. For each test, six slabs were used; two that were sealed and had water applied, two that were unsealed and had water applied, and two controls that were in as-manufactured condition. Tests were conducted both indoors and outdoors. The results for the outdoor measurements are provided below because it more closely represents how the technique will be implemented on a bridge using ambient weather conditions. The concrete specimens tested were 16 x 16 x 2-inch concrete pavers (Lowe’s Item 54338). While these specimens were smaller in size than optimal for thermal edge effects and may have a different pore structure as compared with structural concrete, the specimens provided a good means to perform algorithm development and initial proof-of-concept testing.
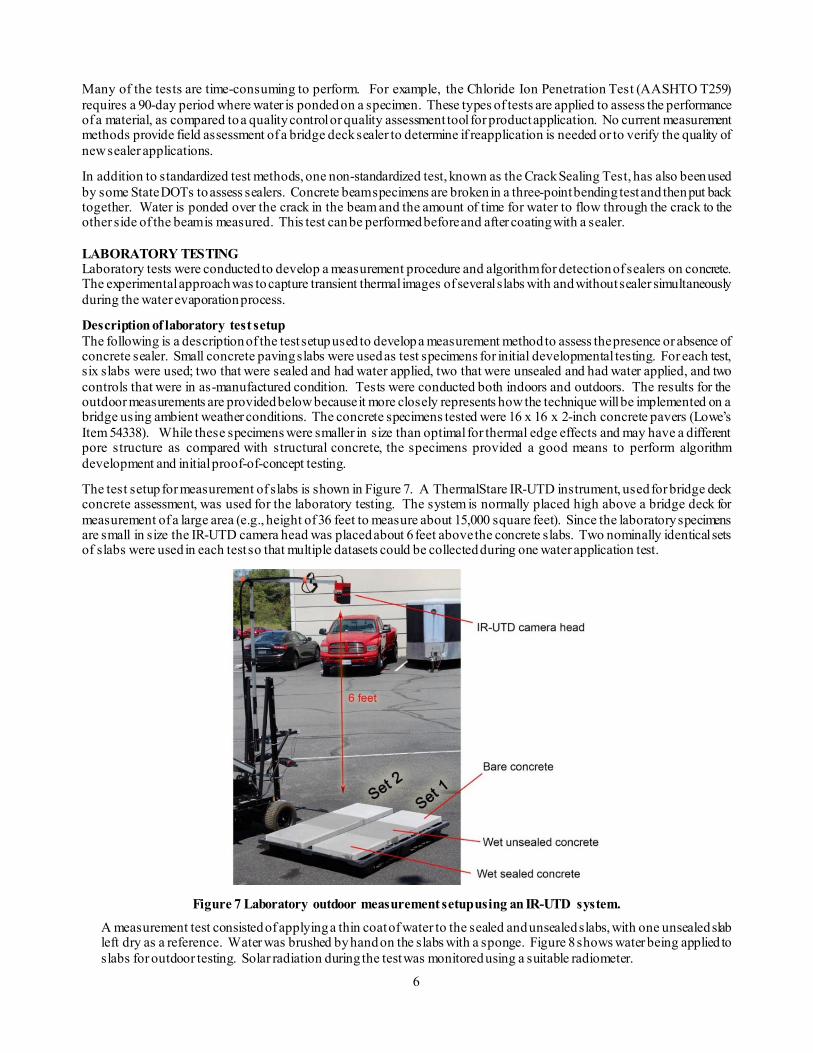
The test setup for measurement of slabs is shown in Figure 7. A ThermalStare IR-UTD instrument, used for bridge deck concrete assessment, was used for the laboratory testing. The system is normally placed high above a bridge deck for measurement of a large area (e.g., height of 36 feet to measure about 15,000 square feet). Since the laboratory specimens are small in size the IR-UTD camera head was placed about 6 feet above the concrete slabs. Two nominally identical sets of slabs were used in each test so that multiple datasets could be collected during one water application test.
Figure 7 Laboratory outdoor measurement setup using an IR-UTD system.
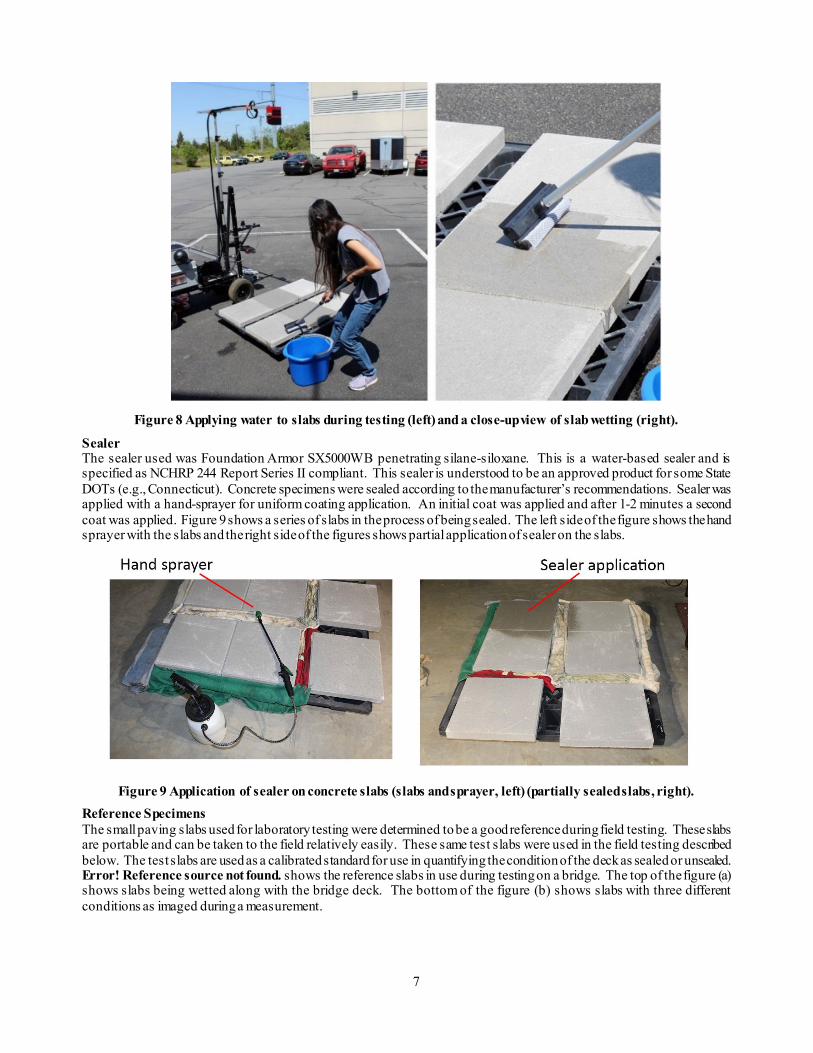
A measurement test consisted of applying a thin coat of water to the sealed and unsealed slabs, with one unsealed slab left dry as a reference. Water was brushed by hand on the slabs with a sponge. Figure 8 shows water being applied to slabs for outdoor testing. Solar radiation during the test was monitored using a suitable radiometer.
7
Figure 8 Applying water to slabs during testing (left) and a close-up view of slab wetting (right).
Sealer The sealer used was Foundation Armor SX5000WB penetrating silane-siloxane. This is a water-based sealer and is specified as NCHRP 244 Report Series II compliant. This sealer is understood to be an approved product for some State DOTs (e.g., Connecticut). Concrete specimens were sealed according to the manufacturer’s recommendations. Sealer was applied with a hand-sprayer for uniform coating application. An initial coat was applied and after 1-2 minutes a second coat was applied. Figure 9 shows a series of slabs in the process of being sealed. The left side of the figure shows the hand sprayer with the slabs and the right side of the figures shows partial application of sealer on the slabs.
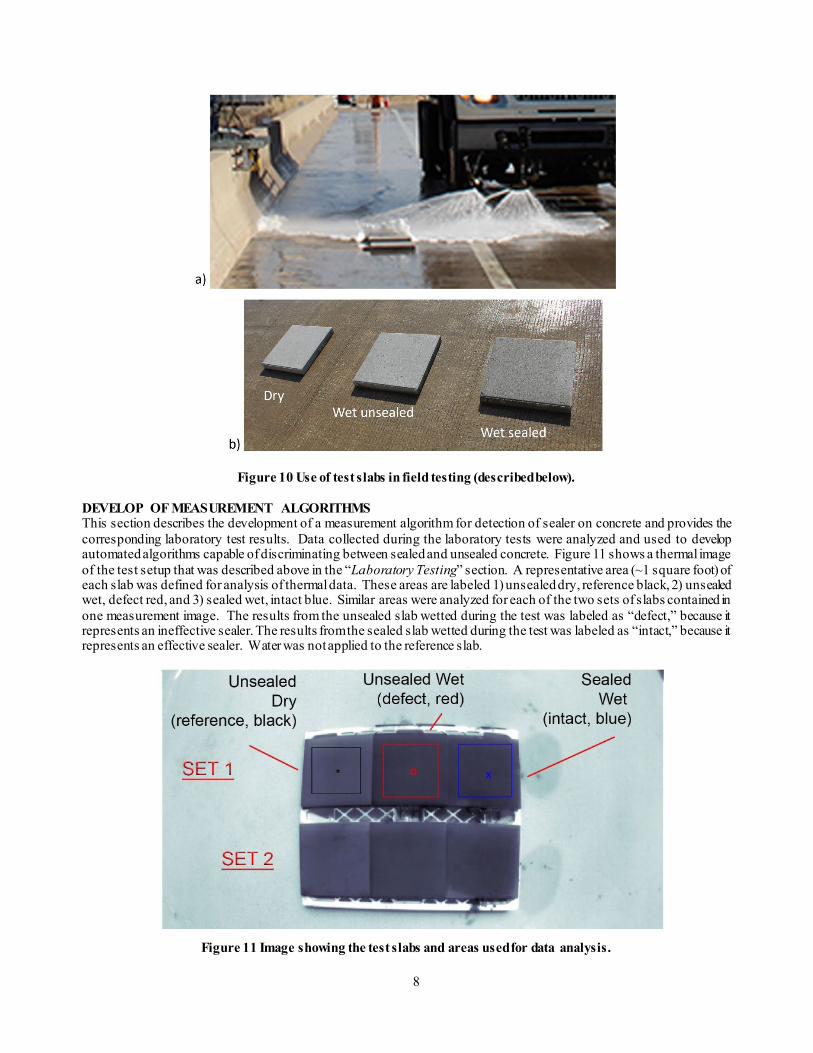
Figure 9 Application of sealer on concrete slabs (slabs and sprayer, left) (partially sealed slabs, right). Reference Specimens The small paving slabs used for laboratory testing were determined to be a good reference during field testing. These slabs are portable and can be taken to the field relatively easily. These same test slabs were used in the field testing described below. The test slabs are used as a calibrated standard for use in quantifying the condition of the deck as sealed or unsealed. Error! Reference source not found. shows the reference slabs in use during testing on a bridge. The top of the figure (a) shows slabs being wetted along with the bridge deck. The bottom of the figure (b) shows slabs with three different conditions as imaged during a measurement.
8
Figure 10 Use of test slabs in field testing (described below).
DEVELOP OF MEASUREMENT ALGORITHMS This section describes the development of a measurement algorithm for detection of sealer on concrete and provides the corresponding laboratory test results. Data collected during the laboratory tests were analyzed and used to develop automated algorithms capable of discriminating between sealed and unsealed concrete. Figure 11 shows a thermal image of the test setup that was described above in the “Laboratory Testing” section. A representative area (~1 square foot) of each slab was defined for analysis of thermal data. These areas are labeled 1) unsealed dry, reference black, 2) unsealed wet, defect red, and 3) sealed wet, intact blue. Similar areas were analyzed for each of the two sets of slabs contained in one measurement image. The results from the unsealed slab wetted during the test was labeled as “defect,” because it represents an ineffective sealer. The results from the sealed slab wetted during the test was labeled as “intact,” because it represents an effective sealer. Water was not applied to the reference slab.
Figure 11 Image showing the test slabs and areas used for data analysis.
9
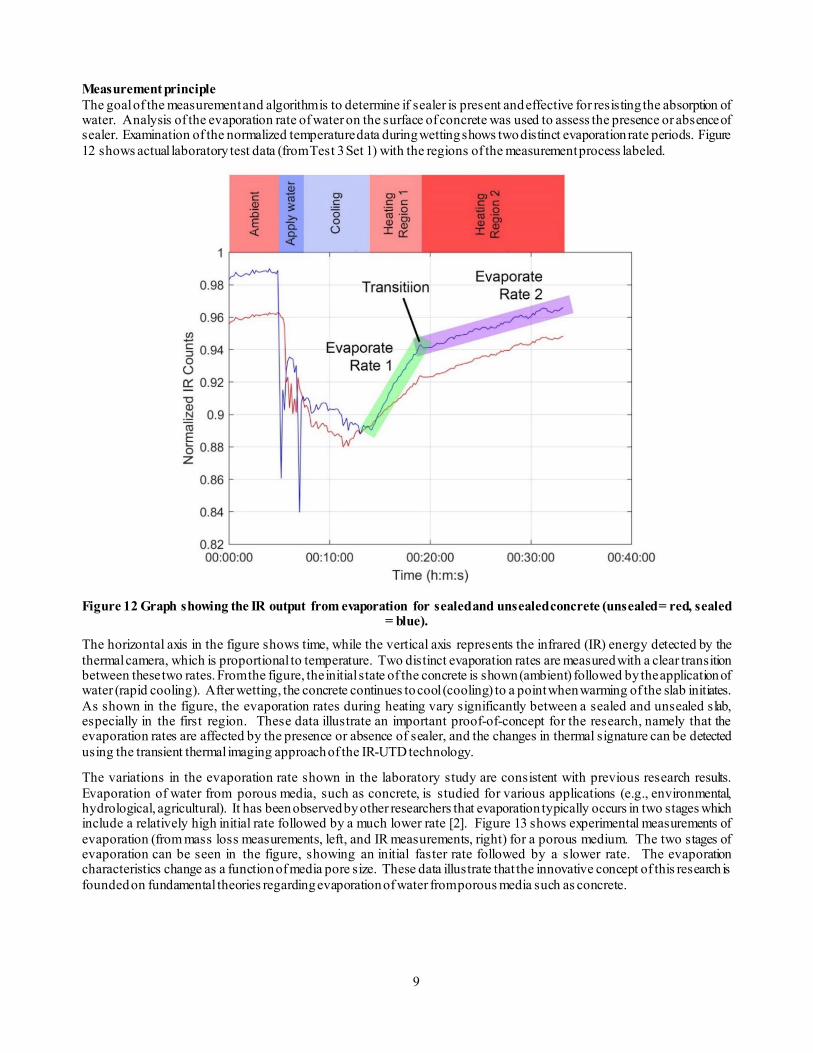
Measurement principle The goal of the measurement and algorithm is to determine if sealer is present and effective for resisting the absorption of water. Analysis of the evaporation rate of water on the surface of concrete was used to assess the presence or absence of sealer. Examination of the normalized temperature data during wetting shows two distinct evaporation rate periods. Figure 12 shows actual laboratory test data (from Test 3 Set 1) with the regions of the measurement process labeled.
Figure 12 Graph showing the IR output from evaporation for sealed and unsealed concrete (unsealed = red, sealed
= blue).
The horizontal axis in the figure shows time, while the vertical axis represents the infrared (IR) energy detected by the thermal camera, which is proportional to temperature. Two distinct evaporation rates are measured with a clear transition between these two rates. From the figure, the initial state of the concrete is shown (ambient) followed by the application of water (rapid cooling). After wetting, the concrete continues to cool (cooling) to a point when warming of the slab initiates. As shown in the figure, the evaporation rates during heating vary significantly between a sealed and unsealed slab, especially in the first region. These data illustrate an important proof-of-concept for the research, namely that the evaporation rates are affected by the presence or absence of sealer, and the changes in thermal signature can be detected using the transient thermal imaging approach of the IR-UTD technology.
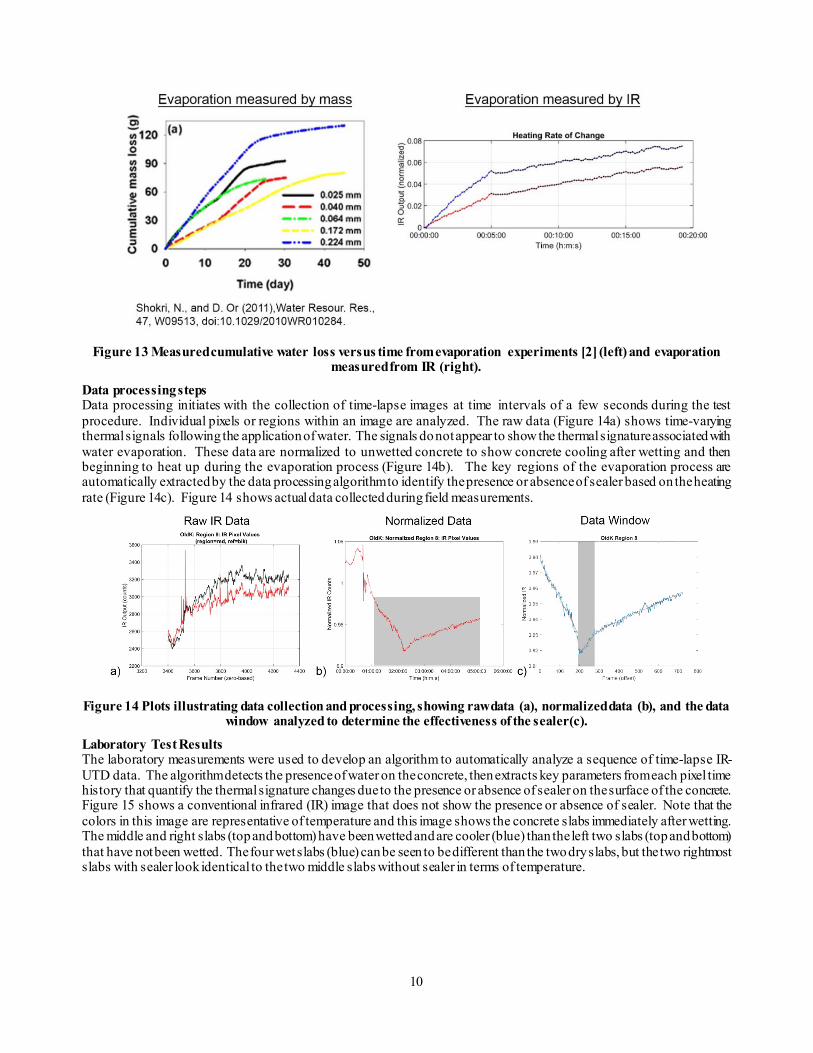
The variations in the evaporation rate shown in the laboratory study are consistent with previous research results. Evaporation of water from porous media, such as concrete, is studied for various applications (e.g., environmental, hydrological, agricultural). It has been observed by other researchers that evaporation typically occurs in two stages which include a relatively high initial rate followed by a much lower rate [2]. Figure 13 shows experimental measurements of evaporation (from mass loss measurements, left, and IR measurements, right) for a porous medium. The two stages of evaporation can be seen in the figure, showing an initial faster rate followed by a slower rate. The evaporation characteristics change as a function of media pore size. These data illustrate that the innovative concept of this research is founded on fundamental theories regarding evaporation of water from porous media such as concrete.
10
Figure 13 Measured cumulative water loss versus time from evaporation experiments [2] (left) and evaporation measured from IR (right).
Data processing steps Data processing initiates with the collection of time-lapse images at time intervals of a few seconds during the test procedure. Individual pixels or regions within an image are analyzed. The raw data (Figure 14a) shows time-varying thermal signals following the application of water. The signals do not appear to show the thermal signature associated with water evaporation. These data are normalized to unwetted concrete to show concrete cooling after wetting and then beginning to heat up during the evaporation process (Figure 14b). The key regions of the evaporation process are automatically extracted by the data processing algorithm to identify the presence or absence of sealer based on the heating rate (Figure 14c). Figure 14 shows actual data collected during field measurements.
Figure 14 Plots illustrating data collection and processing, showing raw data (a), normalized data (b), and the data
window analyzed to determine the effectiveness of the sealer(c).
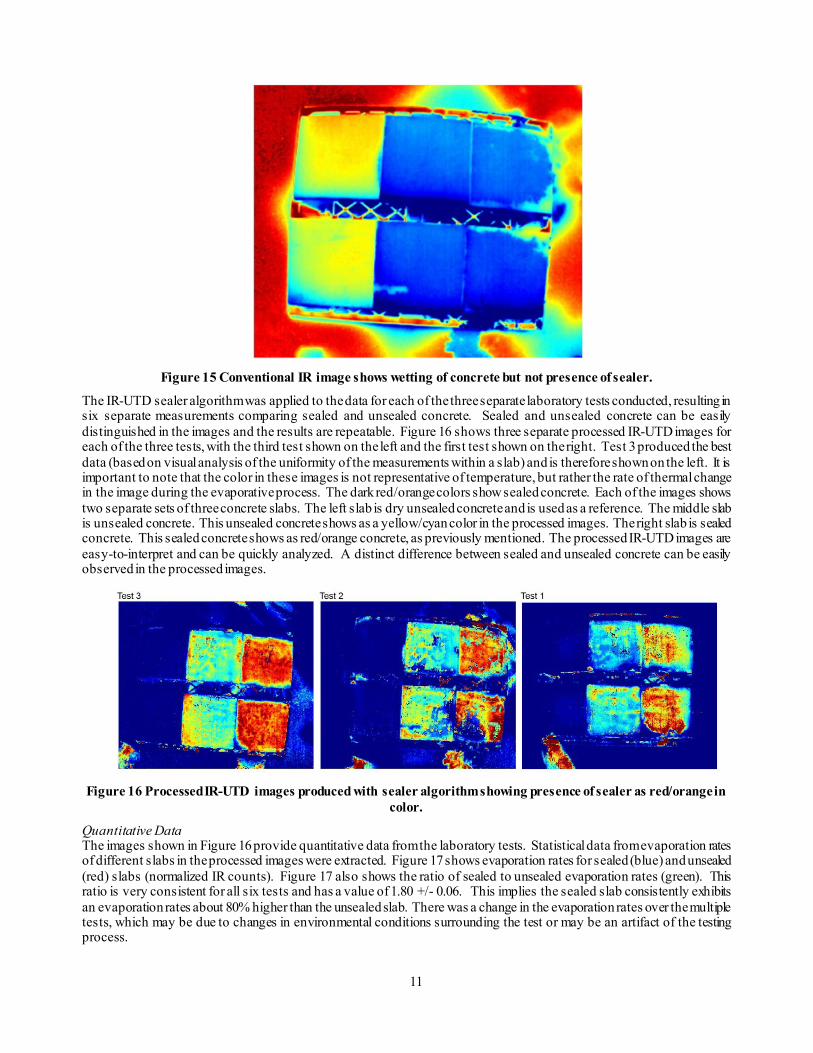
Laboratory Test Results The laboratory measurements were used to develop an algorithm to automatically analyze a sequence of time-lapse IR-UTD data. The algorithm detects the presence of water on the concrete, then extracts key parameters from each pixel time history that quantify the thermal signature changes due to the presence or absence of sealer on the surface of the concrete. Figure 15 shows a conventional infrared (IR) image that does not show the presence or absence of sealer. Note that the colors in this image are representative of temperature and this image shows the concrete slabs immediately after wetting. The middle and right slabs (top and bottom) have been wetted and are cooler (blue) than the left two slabs (top and bottom) that have not been wetted. The four wet slabs (blue) can be seen to be different than the two dry slabs, but the two rightmost slabs with sealer look identical to the two middle slabs without sealer in terms of temperature.
11
Figure 15 Conventional IR image shows wetting of concrete but not presence of sealer.
The IR-UTD sealer algorithm was applied to the data for each of the three separate laboratory tests conducted, resulting in six separate measurements comparing sealed and unsealed concrete. Sealed and unsealed concrete can be easily distinguished in the images and the results are repeatable. Figure 16 shows three separate processed IR-UTD images for each of the three tests, with the third test shown on the left and the first test shown on the right. Test 3 produced the best data (based on visual analysis of the uniformity of the measurements within a slab) and is therefore shown on the left. It is important to note that the color in these images is not representative of temperature, but rather the rate of thermal change in the image during the evaporative process. The dark red/orange colors show sealed concrete. Each of the images shows two separate sets of three concrete slabs. The left slab is dry unsealed concrete and is used as a reference. The middle slab is unsealed concrete. This unsealed concrete shows as a yellow/cyan color in the processed images. The right slab is sealed concrete. This sealed concrete shows as red/orange concrete, as previously mentioned. The processed IR-UTD images are easy-to-interpret and can be quickly analyzed. A distinct difference between sealed and unsealed concrete can be easily observed in the processed images.
Figure 16 Processed IR-UTD images produced with sealer algorithm showing presence of sealer as red/orange in
color.
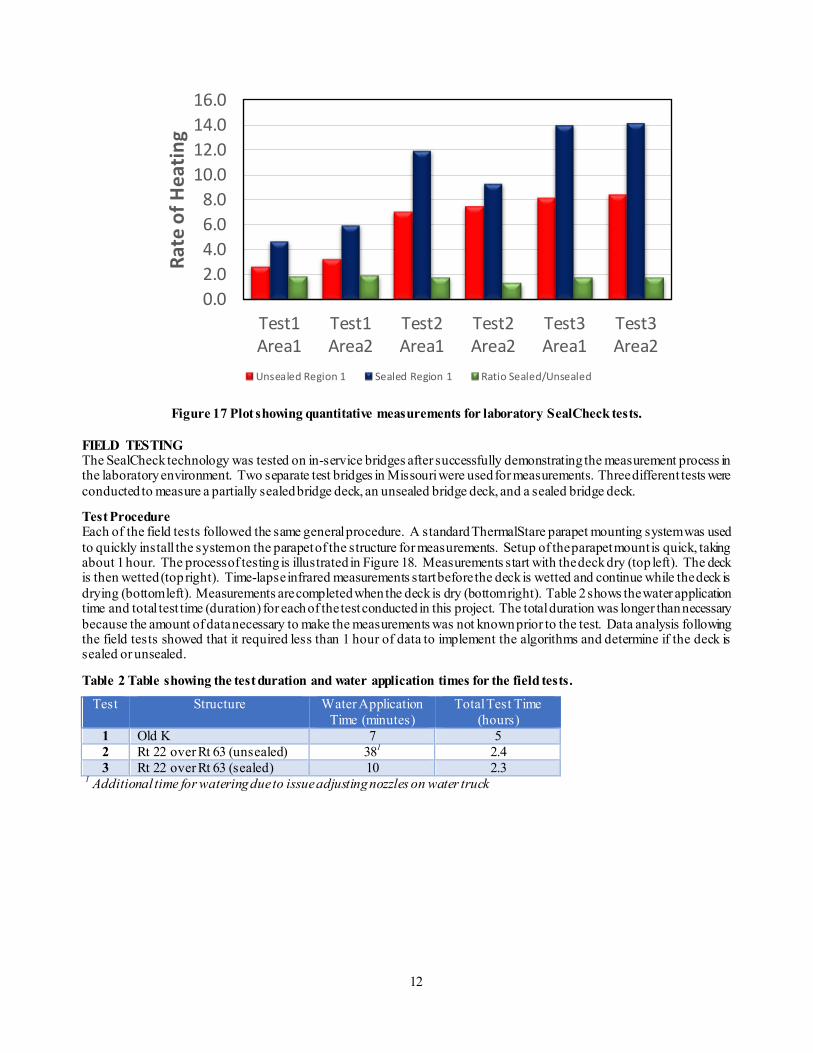
Quantitative Data The images shown in Figure 16 provide quantitative data from the laboratory tests. Statistical data from evaporation rates of different slabs in the processed images were extracted. Figure 17 shows evaporation rates for sealed (blue) and unsealed (red) slabs (normalized IR counts). Figure 17 also shows the ratio of sealed to unsealed evaporation rates (green). This ratio is very consistent for all six tests and has a value of 1.80 +/- 0.06. This implies the sealed slab consistently exhibits an evaporation rates about 80% higher than the unsealed slab. There was a change in the evaporation rates over the multiple tests, which may be due to changes in environmental conditions surrounding the test or may be an artifact of the testing process.
12
Figure 17 Plot showing quantitative measurements for laboratory SealCheck tests.
FIELD TESTING The SealCheck technology was tested on in-service bridges after successfully demonstrating the measurement process in the laboratory environment. Two separate test bridges in Missouri were used for measurements. Three different tests were conducted to measure a partially sealed bridge deck, an unsealed bridge deck, and a sealed bridge deck.
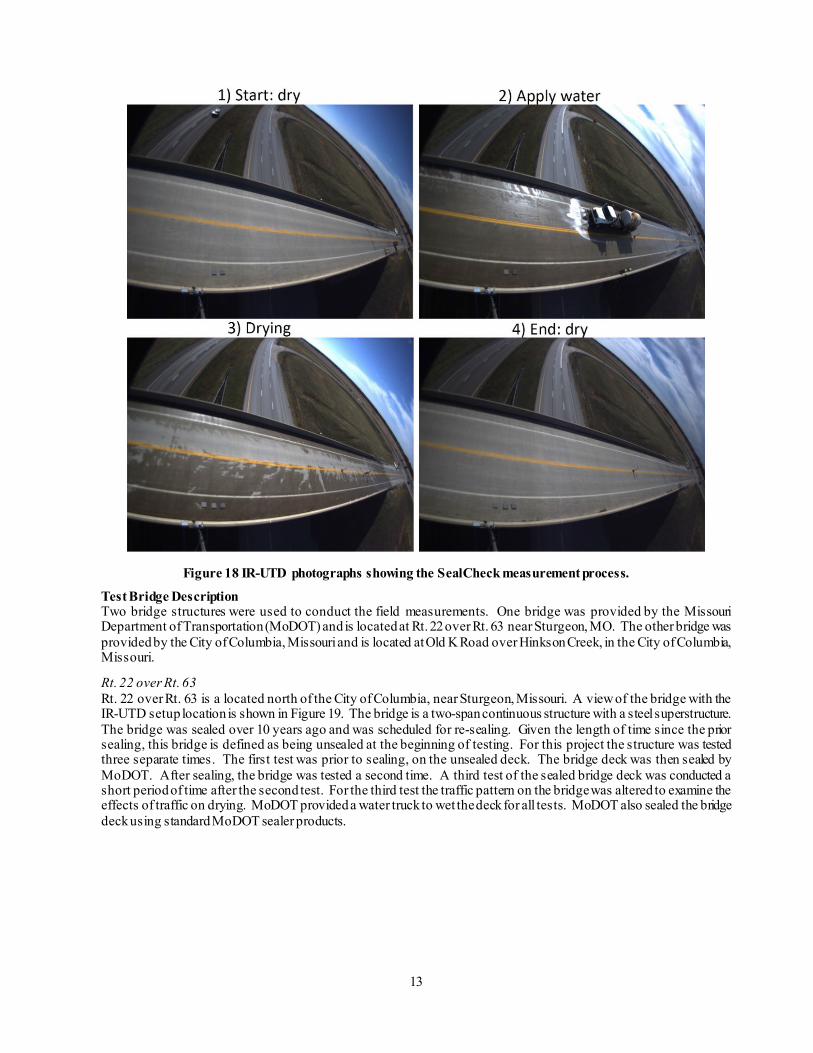
Test Procedure Each of the field tests followed the same general procedure. A standard ThermalStare parapet mounting system was used to quickly install the system on the parapet of the structure for measurements. Setup of the parapet mount is quick, taking about 1 hour. The process of testing is illustrated in Figure 18. Measurements start with the deck dry (top left). The deck is then wetted (top right). Time-lapse infrared measurements start before the deck is wetted and continue while the deck is drying (bottom left). Measurements are completed when the deck is dry (bottom right). Table 2 shows the water application time and total test time (duration) for each of the test conducted in this project. The total duration was longer than necessary because the amount of data necessary to make the measurements was not known prior to the test. Data analysis following the field tests showed that it required less than 1 hour of data to implement the algorithms and determine if the deck is sealed or unsealed.
Table 2 Table showing the test duration and water application times for the field tests.
Test Structure Water Application Time (minutes)
Total Test Time (hours)
1 Old K 7 5 2 Rt 22 over Rt 63 (unsealed) 381 2.4 3 Rt 22 over Rt 63 (sealed) 10 2.3
1 Additional time for watering due to issue adjusting nozzles on water truck
0.02.04.06.08.0
10.012.014.016.0
Test1Area1
Test1Area2
Test2Area1
Test2Area2
Test3Area1
Test3Area2
Rate
of H
eatin
g
Unsealed Region 1 Sealed Region 1 Ratio Sealed/Unsealed
13
Figure 18 IR-UTD photographs showing the SealCheck measurement process.
Test Bridge Description Two bridge structures were used to conduct the field measurements. One bridge was provided by the Missouri Department of Transportation (MoDOT) and is located at Rt. 22 over Rt. 63 near Sturgeon, MO. The other bridge was provided by the City of Columbia, Missouri and is located at Old K Road over Hinkson Creek, in the City of Columbia, Missouri.
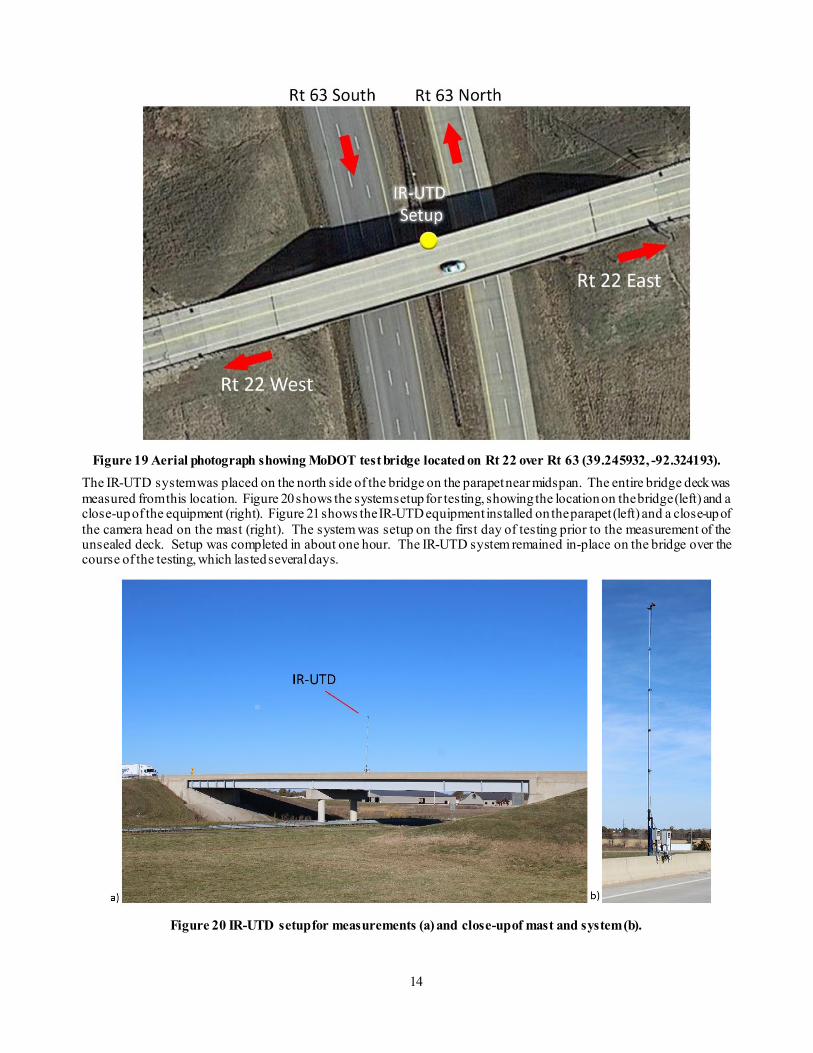
Rt. 22 over Rt. 63 Rt. 22 over Rt. 63 is a located north of the City of Columbia, near Sturgeon, Missouri. A view of the bridge with the IR-UTD setup location is shown in Figure 19. The bridge is a two-span continuous structure with a steel superstructure. The bridge was sealed over 10 years ago and was scheduled for re-sealing. Given the length of time since the prior sealing, this bridge is defined as being unsealed at the beginning of testing. For this project the structure was tested three separate times. The first test was prior to sealing, on the unsealed deck. The bridge deck was then sealed by MoDOT. After sealing, the bridge was tested a second time. A third test of the sealed bridge deck was conducted a short period of time after the second test. For the third test the traffic pattern on the bridge was altered to examine the effects of traffic on drying. MoDOT provided a water truck to wet the deck for all tests. MoDOT also sealed the bridge deck using standard MoDOT sealer products.
14
Figure 19 Aerial photograph showing MoDOT test bridge located on Rt 22 over Rt 63 (39.245932, -92.324193). The IR-UTD system was placed on the north side of the bridge on the parapet near midspan. The entire bridge deck was measured from this location. Figure 20 shows the system setup for testing, showing the location on the bridge (left) and a close-up of the equipment (right). Figure 21 shows the IR-UTD equipment installed on the parapet (left) and a close-up of the camera head on the mast (right). The system was setup on the first day of testing prior to the measurement of the unsealed deck. Setup was completed in about one hour. The IR-UTD system remained in-place on the bridge over the course of the testing, which lasted several days.
Figure 20 IR-UTD setup for measurements (a) and close-up of mast and system (b).
15
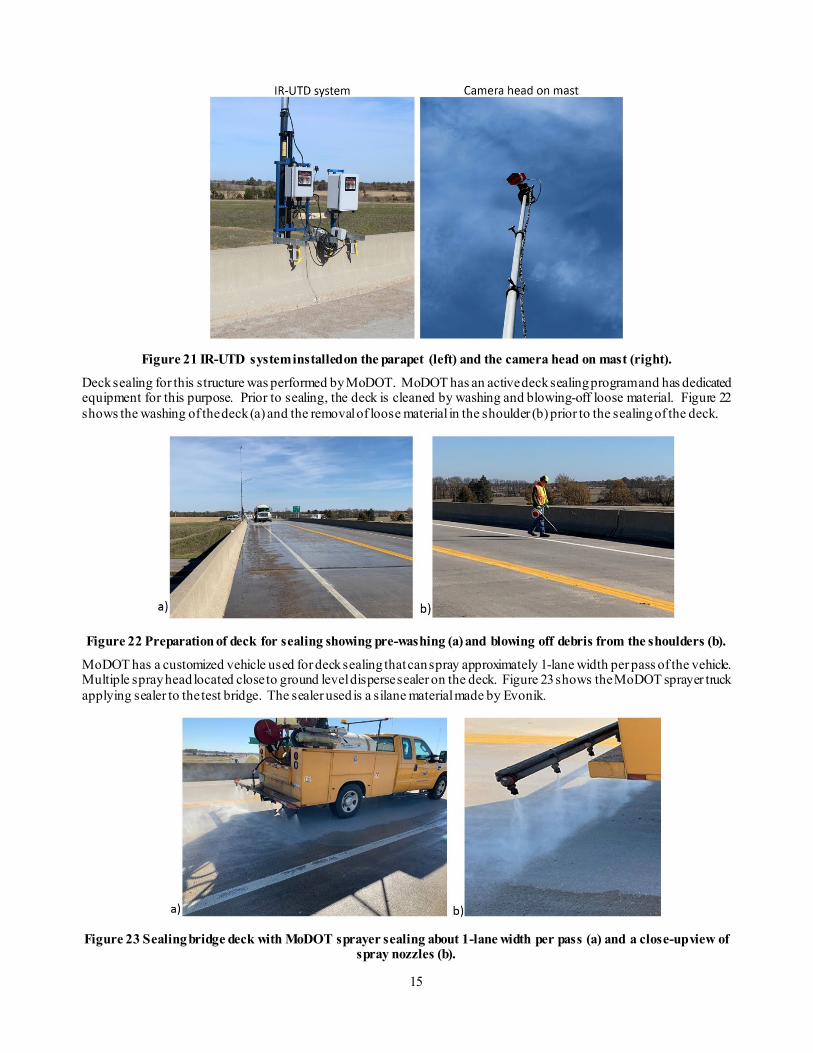
Figure 21 IR-UTD system installed on the parapet (left) and the camera head on mast (right).
Deck sealing for this structure was performed by MoDOT. MoDOT has an active deck sealing program and has dedicated equipment for this purpose. Prior to sealing, the deck is cleaned by washing and blowing-off loose material. Figure 22 shows the washing of the deck (a) and the removal of loose material in the shoulder (b) prior to the sealing of the deck.
Figure 22 Preparation of deck for sealing showing pre-washing (a) and blowing off debris from the shoulders (b).
MoDOT has a customized vehicle used for deck sealing that can spray approximately 1-lane width per pass of the vehicle. Multiple spray head located close to ground level disperse sealer on the deck. Figure 23 shows the MoDOT sprayer truck applying sealer to the test bridge. The sealer used is a silane material made by Evonik.
Figure 23 Sealing bridge deck with MoDOT sprayer sealing about 1-lane width per pass (a) and a close-up view of
spray nozzles (b).
16
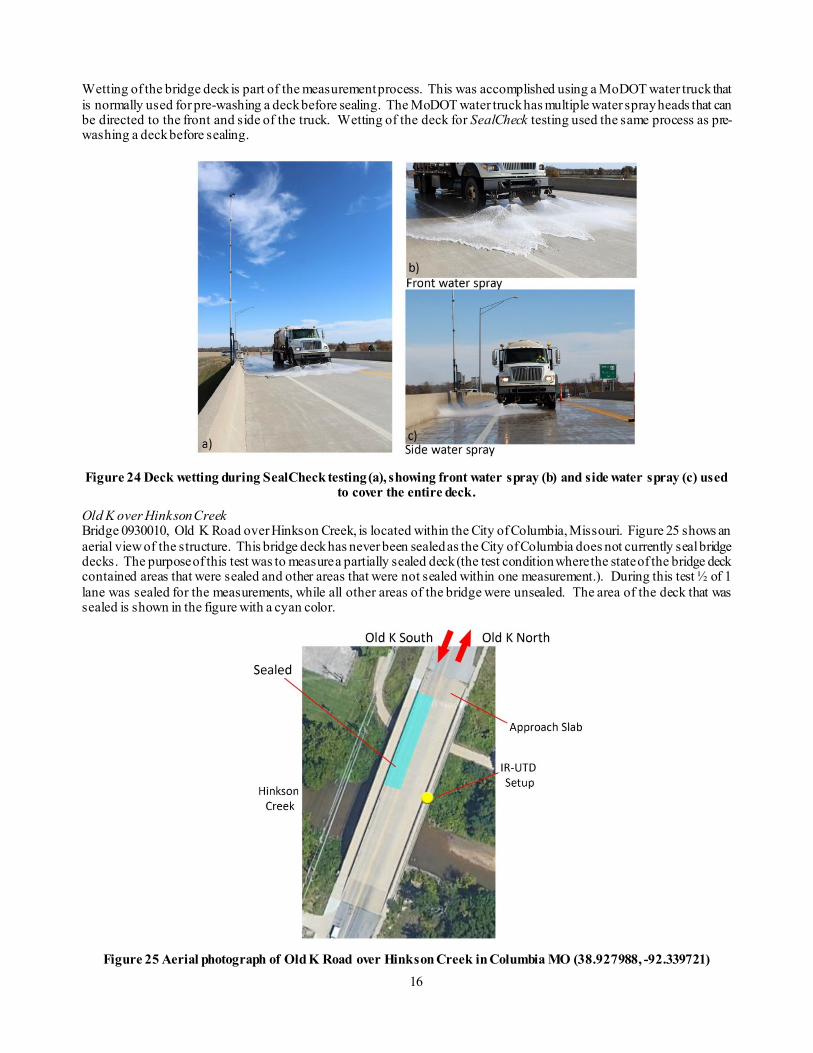
Wetting of the bridge deck is part of the measurement process. This was accomplished using a MoDOT water truck that is normally used for pre-washing a deck before sealing. The MoDOT water truck has multiple water spray heads that can be directed to the front and side of the truck. Wetting of the deck for SealCheck testing used the same process as pre-washing a deck before sealing.
Figure 24 Deck wetting during SealCheck testing (a), showing front water spray (b) and side water spray (c) used
to cover the entire deck.
Old K over Hinkson Creek Bridge 0930010, Old K Road over Hinkson Creek, is located within the City of Columbia, Missouri. Figure 25 shows an aerial view of the structure. This bridge deck has never been sealed as the City of Columbia does not currently seal bridge decks. The purpose of this test was to measure a partially sealed deck (the test condition where the state of the bridge deck contained areas that were sealed and other areas that were not sealed within one measurement.). During this test ½ of 1 lane was sealed for the measurements, while all other areas of the bridge were unsealed. The area of the deck that was sealed is shown in the figure with a cyan color.
Figure 25 Aerial photograph of Old K Road over Hinkson Creek in Columbia MO (38.927988, -92.339721)
17
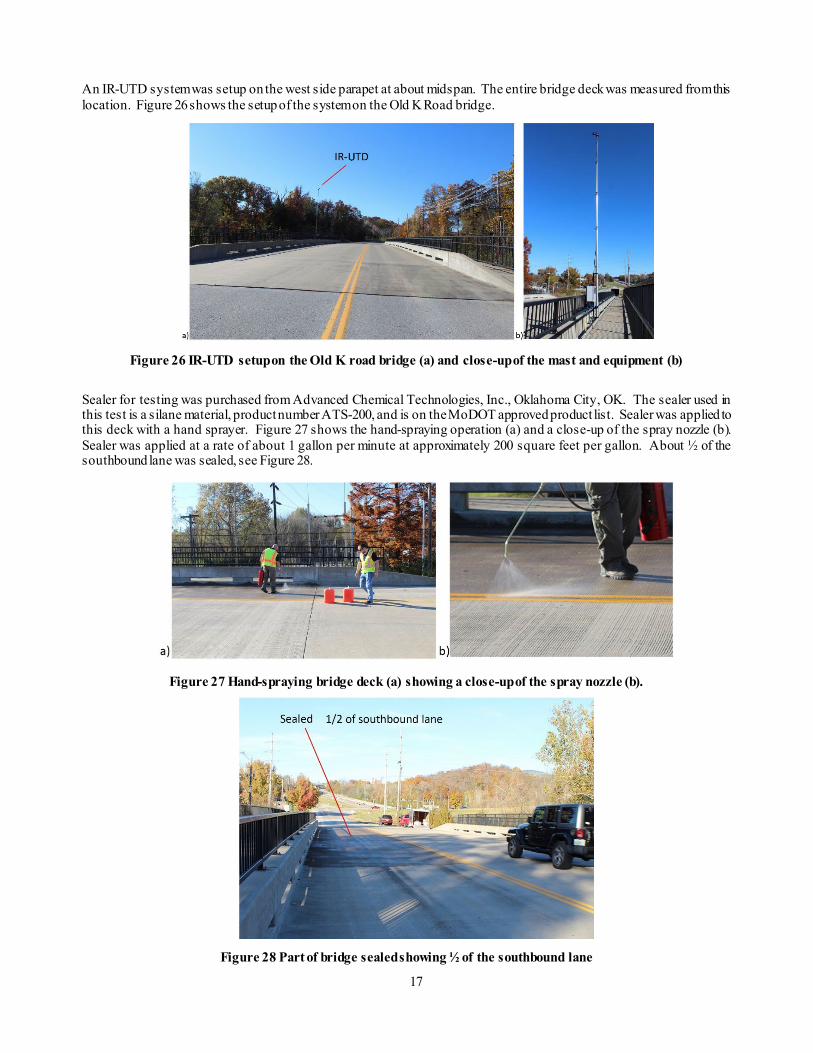
An IR-UTD system was setup on the west side parapet at about midspan. The entire bridge deck was measured from this location. Figure 26 shows the setup of the system on the Old K Road bridge.
Figure 26 IR-UTD setup on the Old K road bridge (a) and close-up of the mast and equipment (b)
Sealer for testing was purchased from Advanced Chemical Technologies, Inc., Oklahoma City, OK. The sealer used in this test is a silane material, product number ATS-200, and is on the MoDOT approved product list. Sealer was applied to this deck with a hand sprayer. Figure 27 shows the hand-spraying operation (a) and a close-up of the spray nozzle (b). Sealer was applied at a rate of about 1 gallon per minute at approximately 200 square feet per gallon. About ½ of the southbound lane was sealed, see Figure 28.
Figure 27 Hand-spraying bridge deck (a) showing a close-up of the spray nozzle (b).
Figure 28 Part of bridge sealed showing ½ of the southbound lane
18
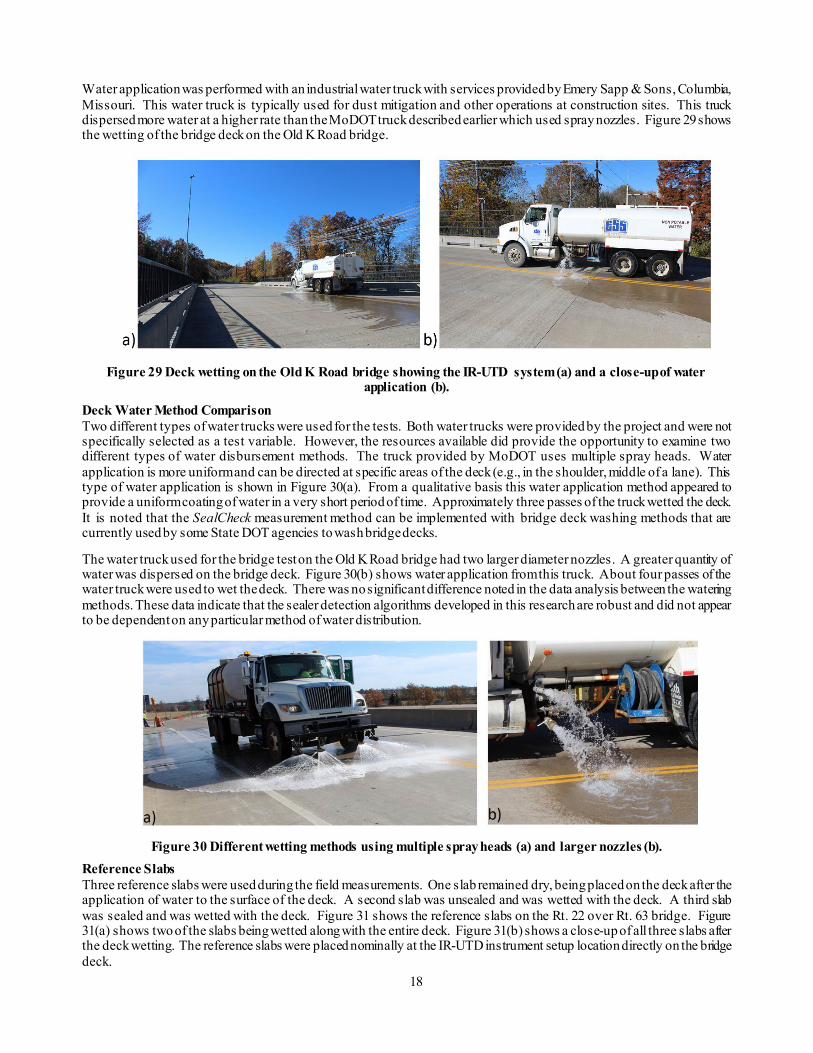
Water application was performed with an industrial water truck with services provided by Emery Sapp & Sons, Columbia, Missouri. This water truck is typically used for dust mitigation and other operations at construction sites. This truck dispersed more water at a higher rate than the MoDOT truck described earlier which used spray nozzles. Figure 29 shows the wetting of the bridge deck on the Old K Road bridge.
Figure 29 Deck wetting on the Old K Road bridge showing the IR-UTD system (a) and a close-up of water
application (b).
Deck Water Method Comparison Two different types of water trucks were used for the tests. Both water trucks were provided by the project and were not specifically selected as a test variable. However, the resources available did provide the opportunity to examine two different types of water disbursement methods. The truck provided by MoDOT uses multiple spray heads. Water application is more uniform and can be directed at specific areas of the deck (e.g., in the shoulder, middle of a lane). This type of water application is shown in Figure 30(a). From a qualitative basis this water application method appeared to provide a uniform coating of water in a very short period of time. Approximately three passes of the truck wetted the deck. It is noted that the SealCheck measurement method can be implemented with bridge deck washing methods that are currently used by some State DOT agencies to wash bridge decks.
The water truck used for the bridge test on the Old K Road bridge had two larger diameter nozzles. A greater quantity of water was dispersed on the bridge deck. Figure 30(b) shows water application from this truck. About four passes of the water truck were used to wet the deck. There was no significant difference noted in the data analysis between the watering methods. These data indicate that the sealer detection algorithms developed in this research are robust and did not appear to be dependent on any particular method of water distribution.
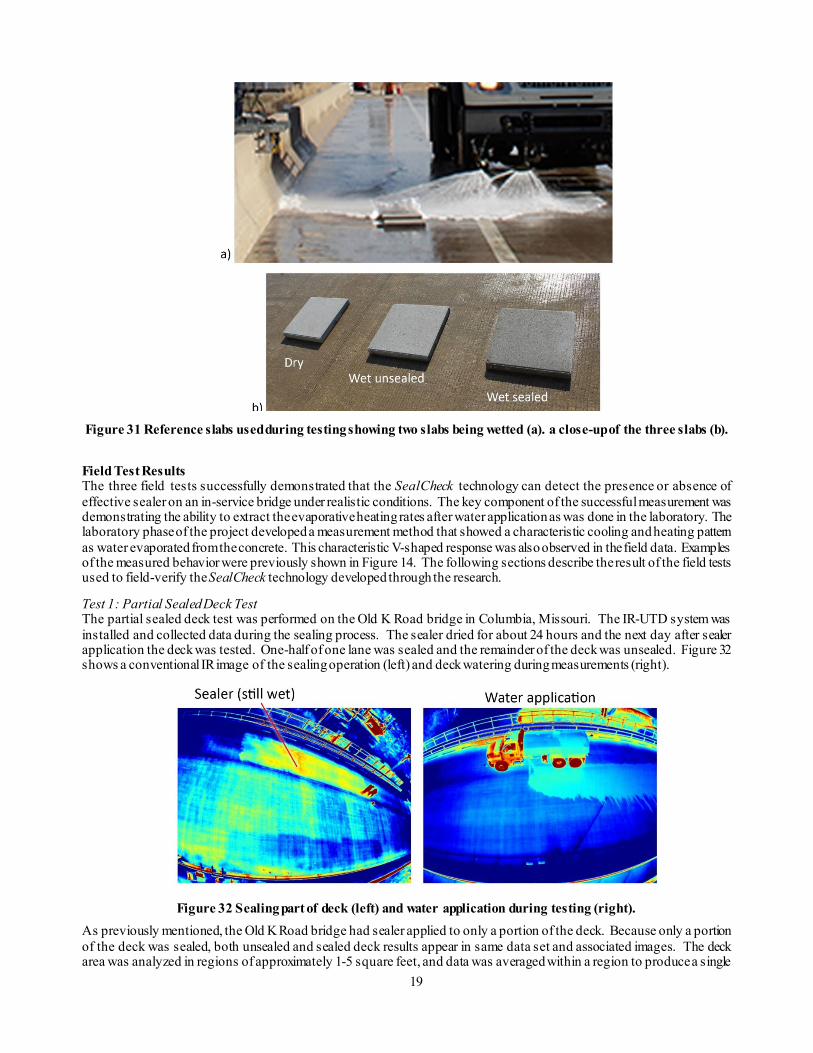
Figure 30 Different wetting methods using multiple spray heads (a) and larger nozzles (b). Reference Slabs Three reference slabs were used during the field measurements. One slab remained dry, being placed on the deck after the application of water to the surface of the deck. A second slab was unsealed and was wetted with the deck. A third slab was sealed and was wetted with the deck. Figure 31 shows the reference slabs on the Rt. 22 over Rt. 63 bridge. Figure 31(a) shows two of the slabs being wetted along with the entire deck. Figure 31(b) shows a close-up of all three slabs after the deck wetting. The reference slabs were placed nominally at the IR-UTD instrument setup location directly on the bridge deck.
19
Figure 31 Reference slabs used during testing showing two slabs being wetted (a). a close-up of the three slabs (b).
Field Test Results The three field tests successfully demonstrated that the SealCheck technology can detect the presence or absence of effective sealer on an in-service bridge under realistic conditions. The key component of the successful measurement was demonstrating the ability to extract the evaporative heating rates after water application as was done in the laboratory. The laboratory phase of the project developed a measurement method that showed a characteristic cooling and heating pattern as water evaporated from the concrete. This characteristic V-shaped response was also observed in the field data. Examples of the measured behavior were previously shown in Figure 14. The following sections describe the result of the field tests used to field-verify the SealCheck technology developed through the research.
Test 1: Partial Sealed Deck Test The partial sealed deck test was performed on the Old K Road bridge in Columbia, Missouri. The IR-UTD system was installed and collected data during the sealing process. The sealer dried for about 24 hours and the next day after sealer application the deck was tested. One-half of one lane was sealed and the remainder of the deck was unsealed. Figure 32 shows a conventional IR image of the sealing operation (left) and deck watering during measurements (right).
Figure 32 Sealing part of deck (left) and water application during testing (right).
As previously mentioned, the Old K Road bridge had sealer applied to only a portion of the deck. Because only a portion of the deck was sealed, both unsealed and sealed deck results appear in same data set and associated images. The deck area was analyzed in regions of approximately 1-5 square feet, and data was averaged within a region to produce a single
20
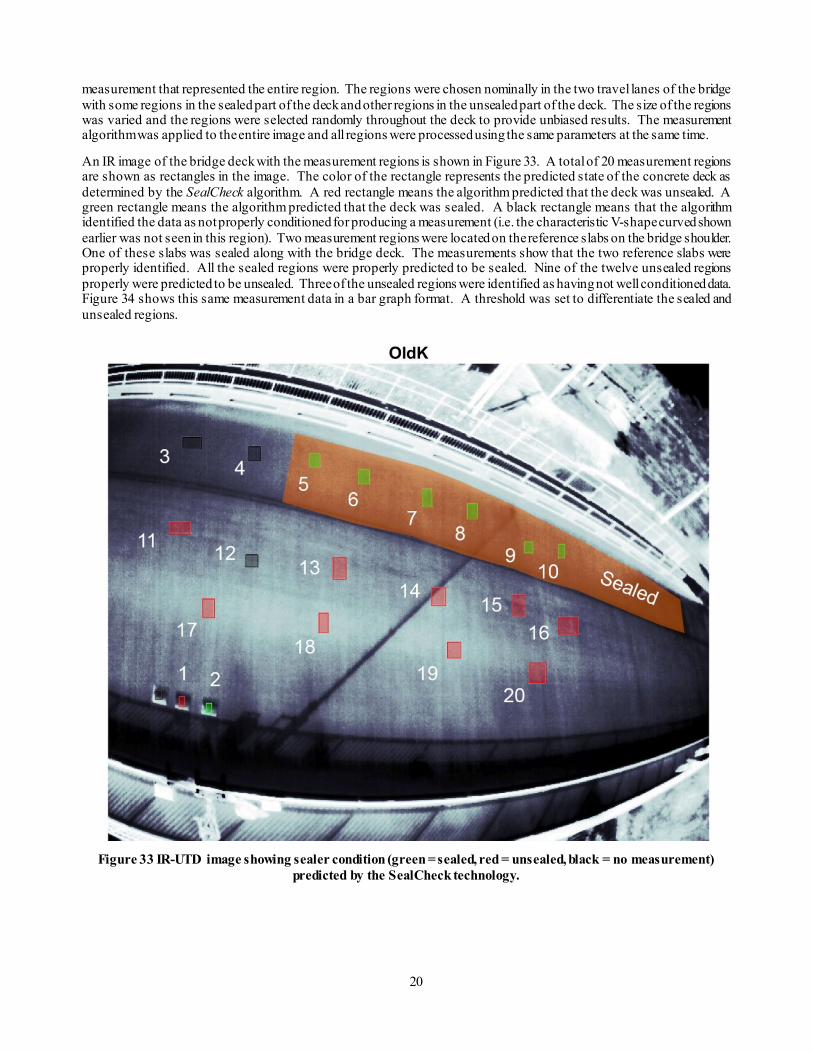
measurement that represented the entire region. The regions were chosen nominally in the two travel lanes of the bridge with some regions in the sealed part of the deck and other regions in the unsealed part of the deck. The size of the regions was varied and the regions were selected randomly throughout the deck to provide unbiased results. The measurement algorithm was applied to the entire image and all regions were processed using the same parameters at the same time.
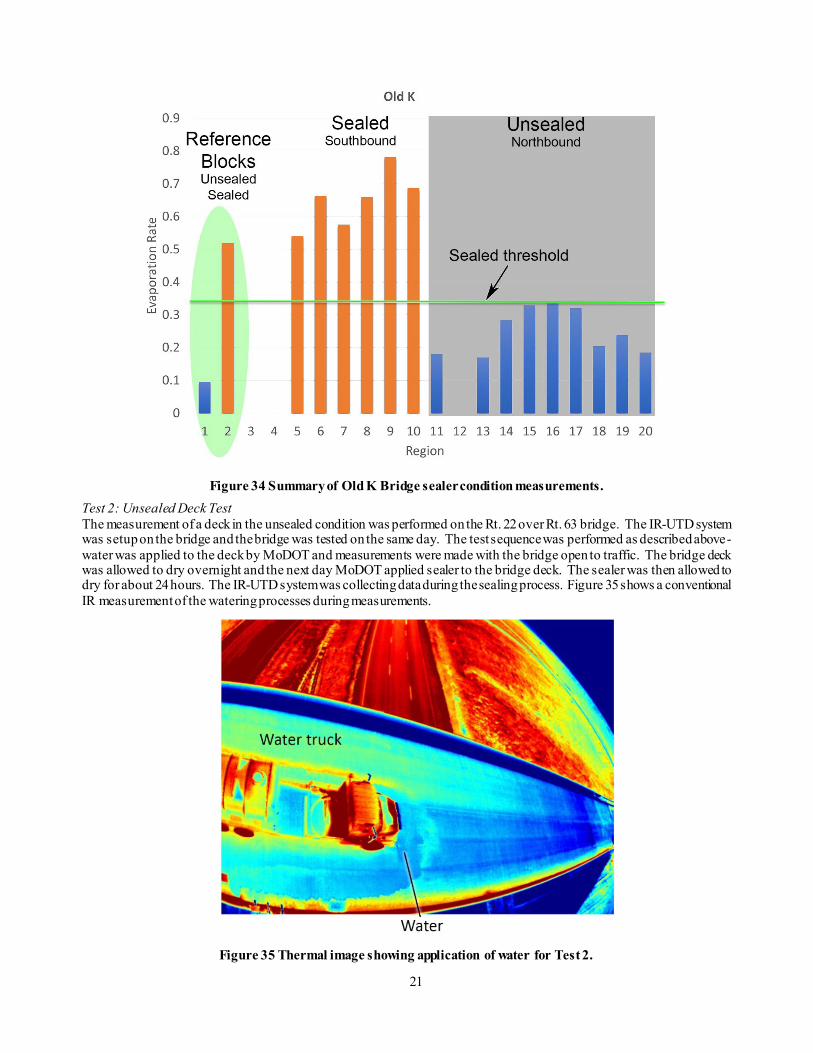
An IR image of the bridge deck with the measurement regions is shown in Figure 33. A total of 20 measurement regions are shown as rectangles in the image. The color of the rectangle represents the predicted state of the concrete deck as determined by the SealCheck algorithm. A red rectangle means the algorithm predicted that the deck was unsealed. A green rectangle means the algorithm predicted that the deck was sealed. A black rectangle means that the algorithm identified the data as not properly conditioned for producing a measurement (i.e. the characteristic V-shape curved shown earlier was not seen in this region). Two measurement regions were located on the reference slabs on the bridge shoulder. One of these slabs was sealed along with the bridge deck. The measurements show that the two reference slabs were properly identified. All the sealed regions were properly predicted to be sealed. Nine of the twelve unsealed regions properly were predicted to be unsealed. Three of the unsealed regions were identified as having not well conditioned data. Figure 34 shows this same measurement data in a bar graph format. A threshold was set to differentiate the sealed and unsealed regions.
Figure 33 IR-UTD image showing sealer condition (green = sealed, red = unsealed, black = no measurement)
predicted by the SealCheck technology.
21
Figure 34 Summary of Old K Bridge sealer condition measurements. Test 2: Unsealed Deck Test The measurement of a deck in the unsealed condition was performed on the Rt. 22 over Rt. 63 bridge. The IR-UTD system was setup on the bridge and the bridge was tested on the same day. The test sequence was performed as described above - water was applied to the deck by MoDOT and measurements were made with the bridge open to traffic. The bridge deck was allowed to dry overnight and the next day MoDOT applied sealer to the bridge deck. The sealer was then allowed to dry for about 24 hours. The IR-UTD system was collecting data during the sealing process. Figure 35 shows a conventional IR measurement of the watering processes during measurements.
Figure 35 Thermal image showing application of water for Test 2.
22
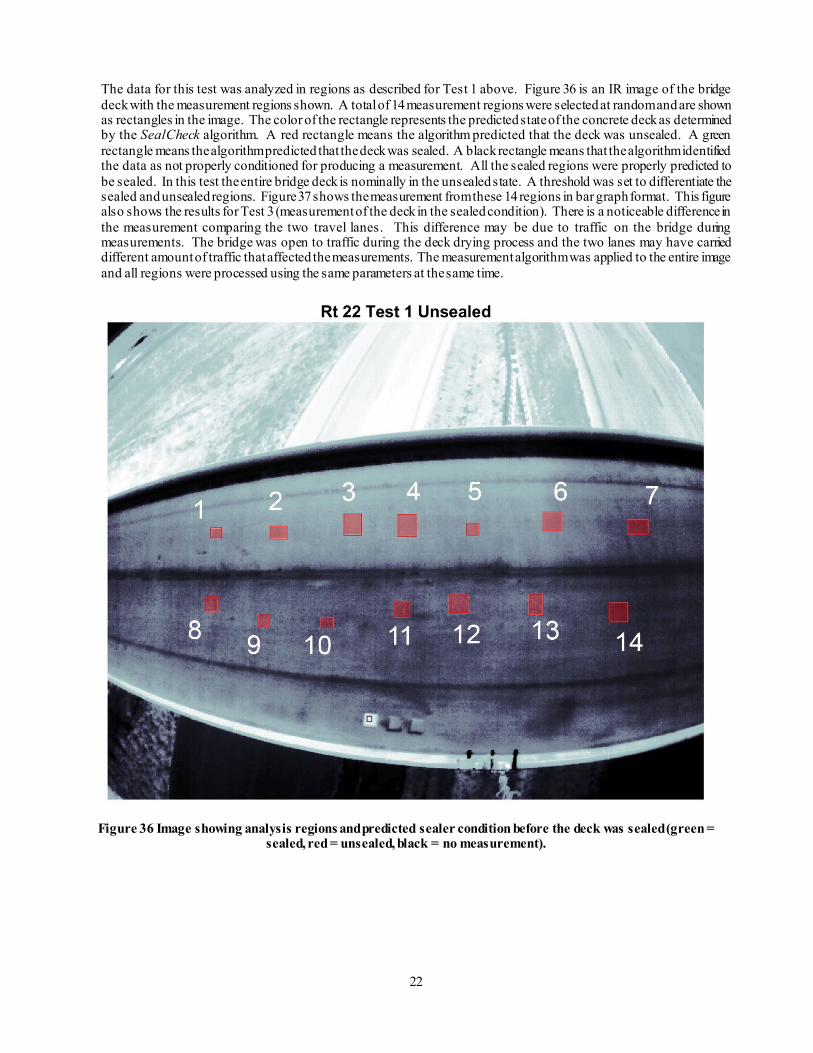
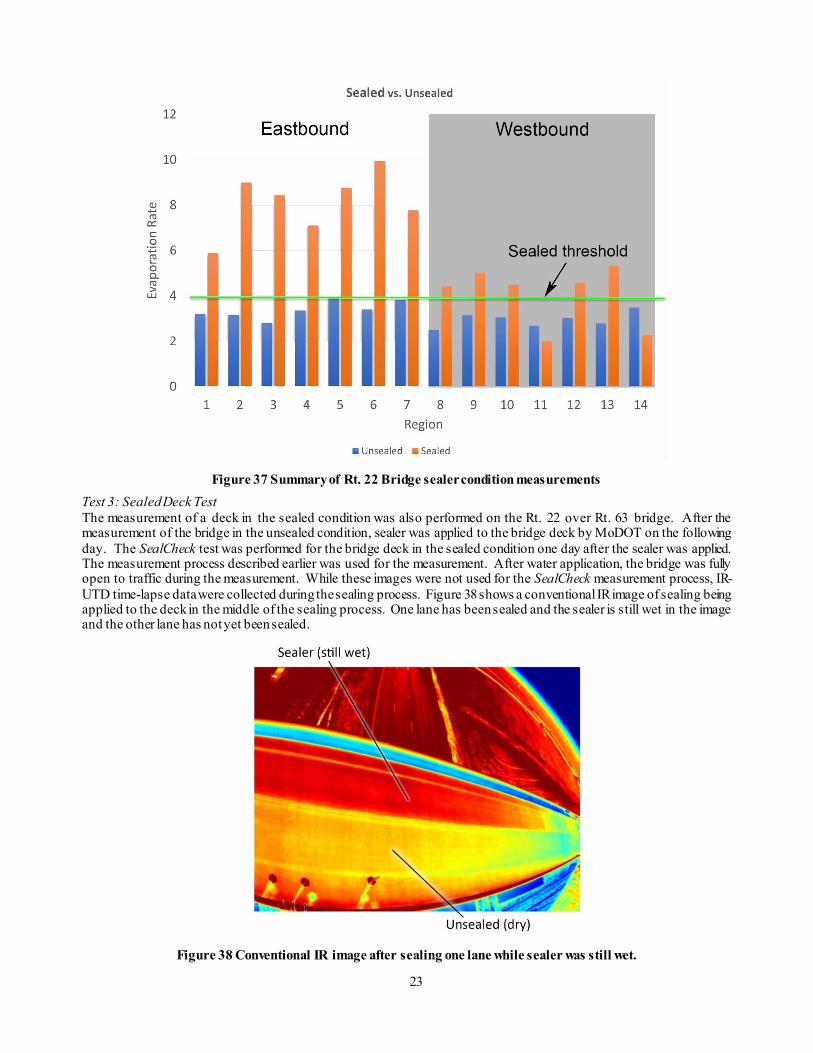
The data for this test was analyzed in regions as described for Test 1 above. Figure 36 is an IR image of the bridge deck with the measurement regions shown. A total of 14 measurement regions were selected at random and are shown as rectangles in the image. The color of the rectangle represents the predicted state of the concrete deck as determined by the SealCheck algorithm. A red rectangle means the algorithm predicted that the deck was unsealed. A green rectangle means the algorithm predicted that the deck was sealed. A black rectangle means that the algorithm identified the data as not properly conditioned for producing a measurement. All the sealed regions were properly predicted to be sealed. In this test the entire bridge deck is nominally in the unsealed state. A threshold was set to differentiate the sealed and unsealed regions. Figure 37 shows the measurement from these 14 regions in bar graph format. This figure also shows the results for Test 3 (measurement of the deck in the sealed condition). There is a noticeable difference in the measurement comparing the two travel lanes. This difference may be due to traffic on the bridge during measurements. The bridge was open to traffic during the deck drying process and the two lanes may have carried different amount of traffic that affected the measurements. The measurement algorithm was applied to the entire image and all regions were processed using the same parameters at the same time.
Figure 36 Image showing analysis regions and predicted sealer condition before the deck was sealed (green =
sealed, red = unsealed, black = no measurement).
23
Figure 37 Summary of Rt. 22 Bridge sealer condition measurements Test 3: Sealed Deck Test The measurement of a deck in the sealed condition was also performed on the Rt. 22 over Rt. 63 bridge. After the measurement of the bridge in the unsealed condition, sealer was applied to the bridge deck by MoDOT on the following day. The SealCheck test was performed for the bridge deck in the sealed condition one day after the sealer was applied. The measurement process described earlier was used for the measurement. After water application, the bridge was fully open to traffic during the measurement. While these images were not used for the SealCheck measurement process, IR-UTD time-lapse data were collected during the sealing process. Figure 38 shows a conventional IR image of sealing being applied to the deck in the middle of the sealing process. One lane has been sealed and the sealer is still wet in the image and the other lane has not yet been sealed.
Figure 38 Conventional IR image after sealing one lane while sealer was still wet.
24
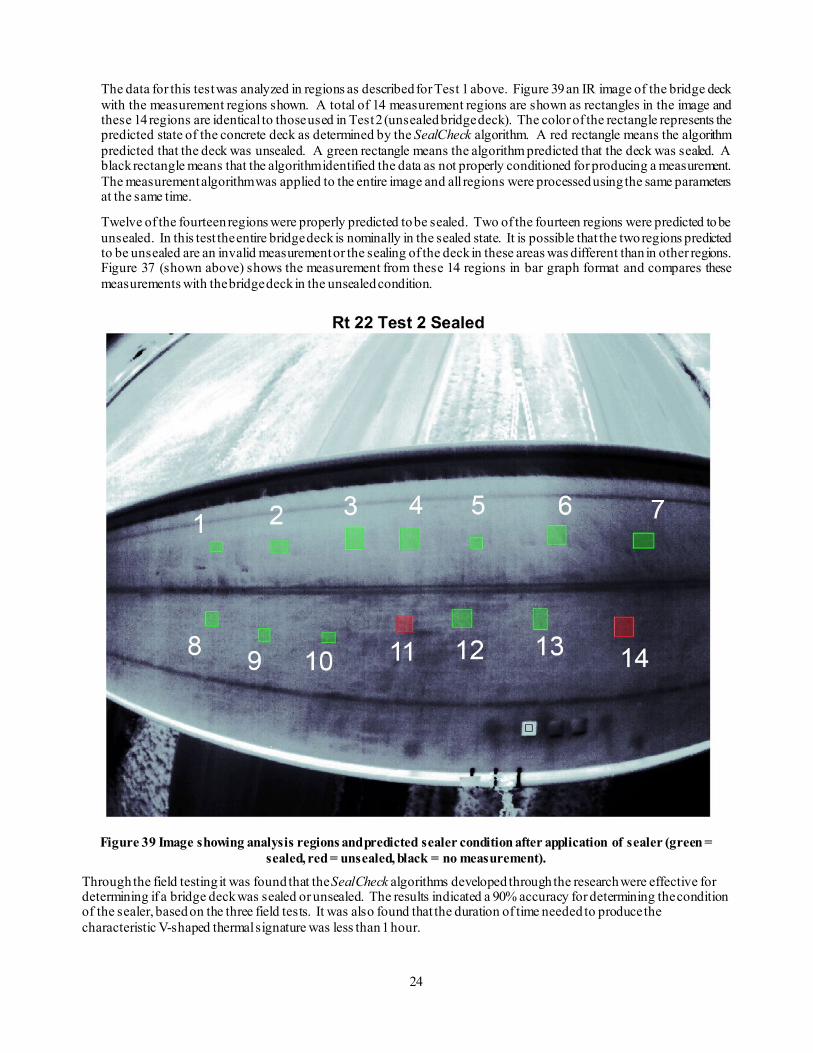
The data for this test was analyzed in regions as described for Test 1 above. Figure 39 an IR image of the bridge deck with the measurement regions shown. A total of 14 measurement regions are shown as rectangles in the image and these 14 regions are identical to those used in Test 2 (unsealed bridge deck). The color of the rectangle represents the predicted state of the concrete deck as determined by the SealCheck algorithm. A red rectangle means the algorithm predicted that the deck was unsealed. A green rectangle means the algorithm predicted that the deck was sealed. A black rectangle means that the algorithm identified the data as not properly conditioned for producing a measurement. The measurement algorithm was applied to the entire image and all regions were processed using the same parameters at the same time.
Twelve of the fourteen regions were properly predicted to be sealed. Two of the fourteen regions were predicted to be unsealed. In this test the entire bridge deck is nominally in the sealed state. It is possible that the two regions predicted to be unsealed are an invalid measurement or the sealing of the deck in these areas was different than in other regions. Figure 37 (shown above) shows the measurement from these 14 regions in bar graph format and compares these measurements with the bridge deck in the unsealed condition.
Figure 39 Image showing analysis regions and predicted sealer condition after application of sealer (green =
sealed, red = unsealed, black = no measurement).
Through the field testing it was found that the SealCheck algorithms developed through the research were effective for determining if a bridge deck was sealed or unsealed. The results indicated a 90% accuracy for determining the condition of the sealer, based on the three field tests. It was also found that the duration of time needed to produce the characteristic V-shaped thermal signature was less than 1 hour.
25
PLANS FOR IMPLEMENTATION This project extends the capabilities and adds a new component to an existing commercial product. The SealCheck measurement is an adaptation of the existing ThermalStare IR-UTD time-lapse thermography system. The project team has an existing commercial entity that offers time-lapse thermography measurements for bridge structures and other assets. ThermalStare was formed in 2014 specifically for commercialization of infrared-based products developed by Fuchs Consulting, Inc. ThermalStare offers IR-UTD services and has performed bridge deck evaluations for State Departments of Transportation and other entities all around the United States. These existing resources will be leveraged to implement the proposed IR-UTD SealCheck technology and this new measurement of sealer effectiveness can be provided for interested parties.
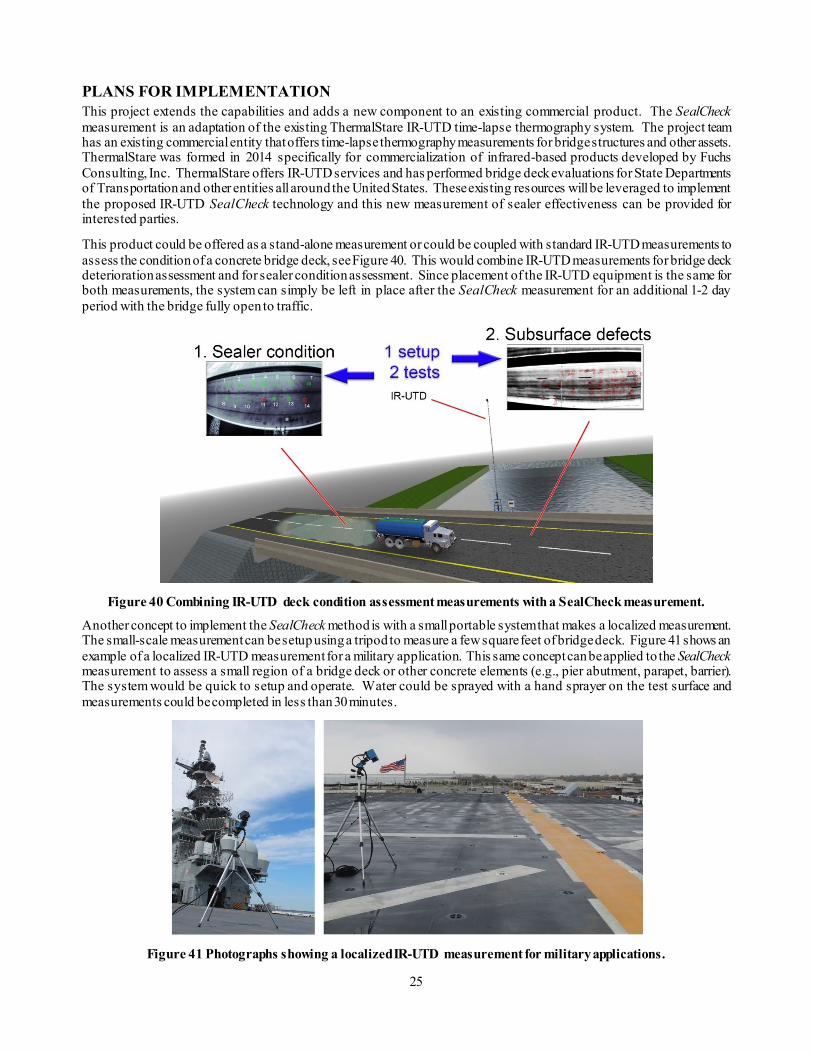
This product could be offered as a stand-alone measurement or could be coupled with standard IR-UTD measurements to assess the condition of a concrete bridge deck, see Figure 40. This would combine IR-UTD measurements for bridge deck deterioration assessment and for sealer condition assessment. Since placement of the IR-UTD equipment is the same for both measurements, the system can simply be left in place after the SealCheck measurement for an additional 1-2 day period with the bridge fully open to traffic.
Figure 40 Combining IR-UTD deck condition assessment measurements with a SealCheck measurement.
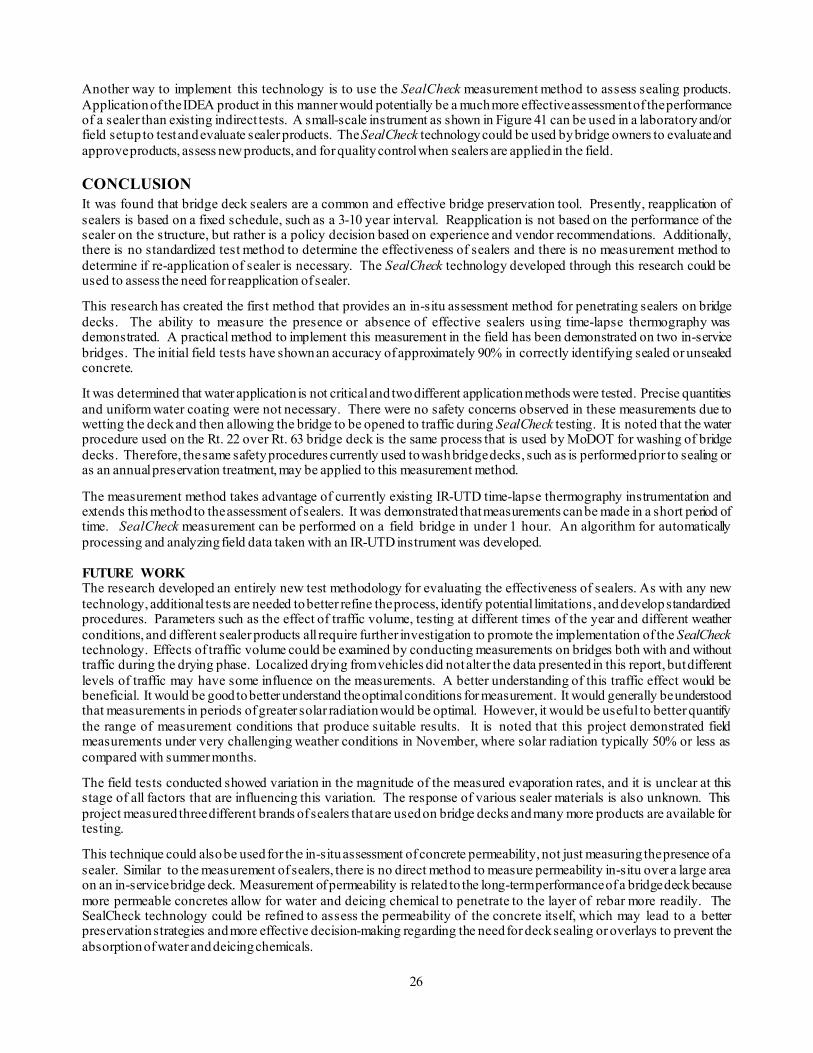
Another concept to implement the SealCheck method is with a small portable system that makes a localized measurement. The small-scale measurement can be setup using a tripod to measure a few square feet of bridge deck. Figure 41 shows an example of a localized IR-UTD measurement for a military application. This same concept can be applied to the SealCheck measurement to assess a small region of a bridge deck or other concrete elements (e.g., pier abutment, parapet, barrier). The system would be quick to setup and operate. Water could be sprayed with a hand sprayer on the test surface and measurements could be completed in less than 30 minutes.
Figure 41 Photographs showing a localized IR-UTD measurement for military applications.
26
Another way to implement this technology is to use the SealCheck measurement method to assess sealing products. Application of the IDEA product in this manner would potentially be a much more effective assessment of the performance of a sealer than existing indirect tests. A small-scale instrument as shown in Figure 41 can be used in a laboratory and/or field setup to test and evaluate sealer products. The SealCheck technology could be used by bridge owners to evaluate and approve products, assess new products, and for quality control when sealers are applied in the field.
CONCLUSION It was found that bridge deck sealers are a common and effective bridge preservation tool. Presently, reapplication of sealers is based on a fixed schedule, such as a 3-10 year interval. Reapplication is not based on the performance of the sealer on the structure, but rather is a policy decision based on experience and vendor recommendations. Additionally, there is no standardized test method to determine the effectiveness of sealers and there is no measurement method to determine if re-application of sealer is necessary. The SealCheck technology developed through this research could be used to assess the need for reapplication of sealer.
This research has created the first method that provides an in-situ assessment method for penetrating sealers on bridge decks. The ability to measure the presence or absence of effective sealers using time-lapse thermography was demonstrated. A practical method to implement this measurement in the field has been demonstrated on two in-service bridges. The initial field tests have shown an accuracy of approximately 90% in correctly identifying sealed or unsealed concrete.
It was determined that water application is not critical and two different application methods were tested. Precise quantities and uniform water coating were not necessary. There were no safety concerns observed in these measurements due to wetting the deck and then allowing the bridge to be opened to traffic during SealCheck testing. It is noted that the water procedure used on the Rt. 22 over Rt. 63 bridge deck is the same process that is used by MoDOT for washing of bridge decks. Therefore, the same safety procedures currently used to wash bridge decks, such as is performed prior to sealing or as an annual preservation treatment, may be applied to this measurement method.
The measurement method takes advantage of currently existing IR-UTD time-lapse thermography instrumentation and extends this method to the assessment of sealers. It was demonstrated that measurements can be made in a short period of time. SealCheck measurement can be performed on a field bridge in under 1 hour. An algorithm for automatically processing and analyzing field data taken with an IR-UTD instrument was developed.
FUTURE WORK The research developed an entirely new test methodology for evaluating the effectiveness of sealers. As with any new technology, additional tests are needed to better refine the process, identify potential limitations, and develop standardized procedures. Parameters such as the effect of traffic volume, testing at different times of the year and different weather conditions, and different sealer products all require further investigation to promote the implementation of the SealCheck technology. Effects of traffic volume could be examined by conducting measurements on bridges both with and without traffic during the drying phase. Localized drying from vehicles did not alter the data presented in this report, but different levels of traffic may have some influence on the measurements. A better understanding of this traffic effect would be beneficial. It would be good to better understand the optimal conditions for measurement. It would generally be understood that measurements in periods of greater solar radiation would be optimal. However, it would be useful to better quantify the range of measurement conditions that produce suitable results. It is noted that this project demonstrated field measurements under very challenging weather conditions in November, where solar radiation typically 50% or less as compared with summer months.
The field tests conducted showed variation in the magnitude of the measured evaporation rates, and it is unclear at this stage of all factors that are influencing this variation. The response of various sealer materials is also unknown. This project measured three different brands of sealers that are used on bridge decks and many more products are available for testing.
This technique could also be used for the in-situ assessment of concrete permeability, not just measuring the presence of a sealer. Similar to the measurement of sealers, there is no direct method to measure permeability in-situ over a large area on an in-service bridge deck. Measurement of permeability is related to the long-term performance of a bridge deck because more permeable concretes allow for water and deicing chemical to penetrate to the layer of rebar more readily. The SealCheck technology could be refined to assess the permeability of the concrete itself, which may lead to a better preservation strategies and more effective decision-making regarding the need for deck sealing or overlays to prevent the absorption of water and deicing chemicals.
27
INVESTIGATOR PROFILE This project was completed by Fuchs Consulting, Inc. (FCI) by the key personnel of Paul Fuchs and Glenn Washer. FCI was founded in 1998 and has a history of producing commercial products from research activities. FCI has completed multiple successful IDEA projects that include NCHRP-127, NCHRP-153, and NCHRP-179. NCHRP-127 developed a bridge virtual assembly method that produced entirely new fabrication methods for steel bridges. This project led to a transportation pooled fund project, TFP-5(226) and has resulted in changes in the way the fabrication is completed within steel bridge fabrication shops. NCHRP-153 produced a system for field retrofit measurement of bridges using advanced laser metrology. NCHRP-179 produced an instrument to measure total stress in bridges and was performed in collaboration with the University of Missouri. NCHRP-179 has led to the current research activities to extend this effort through the FHWA Accelerated Readiness Marketing Program (AMR).
FCI performed an SBIR project for the USDOT that produced several commercial products. ThermalStare was formed as a new company in 2014 specifically for the commercial application of these products. ThermalStare is a leader in the development of innovative infrared-based technologies for the highway bridge industry. This IDEA product technology is a further advancement of technologies developed through an award-winning SBIR project funded by the USDOT/FHWA. The technology developed through the SBIR program included an innovative, non-contact coating inspection technology and a bridge deck inspection technology (US Patent No.: 10,497,109), both capitalizing on transient thermal measurement technology used in this IDEA project. The SBIR project was featured by the Small Business Administration (SBA) as an SBIR Success Story and awarded a 2020 Tibbetts Award that “recognizes those companies, organizations, and individuals that exemplify the very best in SBIR/STTR achievements.”
The Principle Investigator for this project is Dr. Paul Fuchs, Manager of ThermalStare. Dr. Paul Fuchs has significant experience with the application of nondestructive evaluation to civil structures. He has applied commercial technology to assess civil structures and has developed custom prototype instrumentation. Dr. Fuchs received his Ph.D. in Electrical Engineering from West Virginia University in 1995. Dr. Fuchs has experience as an entrepreneur and business owner. He holds patents for gyratory compactor calibration instrumentation developed for FHWA, for virtual assembly procedures for steel bridges, and for time-lapse imaging of concrete and other large structures. Dr. Fuchs is also the President of Fuchs Consulting, Inc., which has been in business for over 23 years and the manager of ThermalStare, since its formation in 2014.
The research team includes the collaboration of Dr. Glenn Washer. Dr. Washer is a co-founder of ThermalStare and is also a Professor at the University of Missouri. He has served on the faculty at this institution since 2004. Dr. Washer worked for the FHWA for fourteen years prior to moving to academia. At the FHWA, Dr. Washer served as the Program Manager for the FHWA NDE Validation Center at the Turner-Fairbank Highway Research Center. He has led the advancement of automated ultrasonic inspection for steel bridge fabrication and in the application of phased-array ultrasonic technology for highway bridges. He has served as the Principal Investigator for a number of NCHRP projects including NCHRP 12-82, Developing Reliability Based Bridge Inspection Practices and NCHRP 12 – 104, Improving the Quality of Element-Level Bridge Inspection Data. Dr. Washer serves as the Academic Director for the TSP2 Midwest Bridge Preservation Partnership. Dr. Washer is a registered Professional Engineer in the State of Missouri. He received his Ph.D. in Materials Science and Engineering from the Johns Hopkins University in 2001.
GLOSSARY AND REFERENCES 1 Liang, Y.C., B. Gallaher, and Y. Xi. 2014. Evaluation of Bridge Deck Sealers. Colorado Department of Transportation, Applied Research and Innovation Branch, Denver, CO.
2 Shokri, N., and D. Or (2011), “What determines drying rates at the onset of diffusion controlled stage-2 evaporation from porous media?”, Water Resour. Res., 47, W09513, doi:10.1029/2010WR010284.