APPENDIX A COMMENTARY Further discussion and elaboration are provided on certain sections in the text. Those sections for which commentary is given correspond to section numbers in the text preceded by the letter "A." For example, "A3.2.1" refers to Section 3.2.1 in the text. CHAPTER ONE A .1.1 Vehicle crash tests are complex experiments that are not easily replicated because of difficulties in controlling critical test conditions such as speed, angle, and condition of test vehicle and the sometimes random and unstable behavior of dynamic crush and fracture mechanisms. Testing guidelines are intended to enhance precision of these experiments while maintaining their costs within acceptable bounds. User agencies should recognize the limitations of these tests and exercise care in interpreting the results. It is impractical or impossible to duplicate the innumerable highway site and safety feature layout conditions that exist in a limited number of standardized tests. Accordingly, the aim of the guidelines is to normalize or idealize test conditions. Hence, straight longitudinal barriers are tested, although curved installations exist; a flat grade is recommended, even though installations are sometimes situated on sloped shoulders and behind curbs. These normalized factors have significant effect on a barrier's performance and may obscure serious safety deficiencies that exist under more typical but less ideal conditions. However, these normalized factors are thought to be secondary in importance when the object of a test program is to compare the results of two or more systems. Moreover, the normalized conditions are more easily duplicated by testing agencies than say, a unique feature. Consequently, they should promote correlation of results from different groups. Nevertheless, when the highway engineer requires the performance of a system for specified site conditions (such as a unique soil or curb layout) or the performance of a safety feature is suspected of being unacceptable under some likely conditions, it is important that these conditions be used instead of, or in addition to, the idealized conditions. These guidelines are intended for use with highway safety features that will be permanently or temporarily installed along the highway. Temporary features are generally used in work or construction zones or other temporary locations and their duration of use is normally relatively small. An important additional characteristic of a work zone is the exposure of work zone personnel to errant traffic. Thus, a barrier in a work zone may be required to (1) redirect errant traffic away from a roadside hazard of other traffic and (2) to shield workers from errant vehicles. Depending on specific site conditions, potential collision severity may equal or even exceed conditions found at typical nonconstruction zone sites. A-1
Transcript
APPENDIX A
COMMENTARY
Further discussion and elaboration are provided on certain sections in the text. Those sections for whichcommentary is given correspond to section numbers in the text preceded by the letter "A." For example, "A3.2.1" refers toSection 3.2.1 in the text.
CHAPTER ONE
A .1.1
Vehicle crash tests are complex experiments that are not easily replicated because of difficulties in controllingcritical test conditions such as speed, angle, and condition of test vehicle and the sometimes random and unstable behaviorof dynamic crush and fracture mechanisms. Testing guidelines are intended to enhance precision of these experimentswhile maintaining their costs within acceptable bounds. User agencies should recognize the limitations of these tests andexercise care in interpreting the results.
It is impractical or impossible to duplicate the innumerable highway site and safety feature layout conditions thatexist in a limited number of standardized tests. Accordingly, the aim of the guidelines is to normalize or idealize testconditions. Hence, straight longitudinal barriers are tested, although curved installations exist; a flat grade isrecommended, even though installations are sometimes situated on sloped shoulders and behind curbs. These normalizedfactors have significant effect on a barrier's performance and may obscure serious safety deficiencies that exist under moretypical but less ideal conditions. However, these normalized factors are thought to be secondary in importance when theobject of a test program is to compare the results of two or more systems. Moreover, the normalized conditions are moreeasily duplicated by testing agencies than say, a unique feature. Consequently, they should promote correlation of resultsfrom different groups. Nevertheless, when the highway engineer requires the performance of a system for specified siteconditions (such as a unique soil or curb layout) or the performance of a safety feature is suspected of being unacceptableunder some likely conditions, it is important that these conditions be used instead of, or in addition to, the idealizedconditions.
These guidelines are intended for use with highway safety features that will be permanently or temporarilyinstalled along the highway. Temporary features are generally used in work or construction zones or other temporarylocations and their duration of use is normally relatively small. An important additional characteristic of a work zone is theexposure of work zone personnel to errant traffic. Thus, a barrier in a work zone may be required to (1) redirect erranttraffic away from a roadside hazard of other traffic and (2) to shield workers from errant vehicles. Depending on specificsite conditions, potential collision severity may equal or even exceed conditions found at typical nonconstruction zonesites.
A-1
A1..2
The intent of this section is to make the designer/developer of a safety feature aware of the process that musttypically be followed and aware of available tools so that the most cost-effective approach or combination of tools may beselected. This report does not endorse or approve any one design method, procedure, or analytical technique or suggestthat one procedure is equivalent to another. Rather, the basic purpose of the report is to provide guidelines for the full-scale crash testing and in-service evaluation of a feature once a decision has been made to proceed with step 4 of Figure1.1. Users of the document should follow as closely as practical the recommended guidelines. Acceptability of acomplementary technique in lieu of, or in addition to, full-scale crash testing is a policy decision beyond the purview ofthis report.
As indicated in steps 2 and 3 of Figure 1.1, there are various design and analysis tools and experimental tools thatcan be used in the initial development of a safety feature. Reference should be made to Appendix D for information onthese tools. Also, as indicated, the developer should be cognizant of the various factors, other than those related to impactperformance, that must be considered in the development of a feature. Conventional structural analysis and designtechniques are most useful in early development stages of a safety feature. Computer simulations of the vehicle/featuredynamic interactions are useful in gaining insight for a wide range of impact conditions. The potential for obtainingvaluable insight from simple static tests of components and assemblies should not be overlooked.
CHAPTER TWO
A2.2.1
Impact performance of many longitudinal barriers and breakaway or yielding support structures depends onstrength and fixity of the soil foundation. Soil foundation is an integral part of such systems. For example, displacementand/or rotation of a breakaway device footing during collision can adversely affect the fracture mechanism. Insufficientsoil support can lead to excessive guardrail post movements and guardrail lateral deflection during vehicle collision andresult in a lower system capacity to contain and redirect errant vehicles. Insufficient soil strength can also be a critical andlimiting factor for the anchoring function of a longitudinal barrier terminal. On the other hand, an unusually firm soil canincrease the lateral stiffness of a longitudinal barrier and subject occupants of a colliding vehicle to undue hazard.
Soil conditions along the highway are variable. Strength is a function of soil type and ranges from soft sandmaterials to hard rock materials; moreover, the soil type may vary considerably within a locale as well as from region toregion. Soil strength may also be a function of the season as it can be significantly affected by moisture content andwhether it is frozen. The testing agency should be aware of the importance of soil strength and select the most appropriatesoil type consistent with potential application of the feature.
Recommended soils are well-graded materials that should be readily available to most testing agencies. Thestandard soil of Section 2.2.1.1 is a selected AASHTO material that compacts to form a relatively strong foundation. Theweak soil of Section 2.2.1.2 is a typical
A-2
AASHTO fine aggregate. These soils are essentially the same as the "strong" and "weak" soils of NCHRP Report 230.
The following general guidance is offered the user agency and the testing agency in soil selection:
Standard Soil
Unless the test article is limited to areas of weak soils, the standard soil should be used with any feature whoseimpact performance is sensitive to soil-foundation or soil-structure interaction. A large percentage of previous testinghas been performed in similar soil and a historical tie is needed. Although it is probably stronger than the averagecondition found along the roadside, it is still representative of a considerable amount of existing installations.
Weak Soil
The weak soil should be used, in addition to the standard soil, for any feature whose impact performance is sensitiveto soil-foundation or soil-structure interaction if identifiable areas of the state or local jurisdiction in which thefeature will be installed contain soil with similar properties, and if there is a reasonable uncertainty regardingperformance of the feature in the weak soil. Tests have shown that some base-bending or yielding small signsupports readily pull out of the weak soil upon impact. For features of this type, the strong soil is generally morecritical and tests in the weak soil may not be necessary.
In addition to soil selection, the footing or foundation used in a test of a breakaway support structure should bedesigned for the minimum wind conditions permitted, thus yielding a minimum footing mass and size; a larger footing willyield a greater breakaway device fixity and, hence, is less critical.
It has been shown that the standard soil of Section 2.2.1.1 is especially sensitive to moisture content. Thetesting agency should sample and test the soil to insure moisture content is within recommended limits given in thespecification at the time of the test.
A2.3.1
Failure or adverse performance of a highway safety feature during crash testing can often be attributed toseemingly insignificant design or construction details, something as innocuous as a substandard washer. For this reason itis most important to assure that the test article has been properly assembled and erected and that critical materials have thespecified design properties. Details of most concern are those that are highly stressed (such as welded and boltedconnections, anchor cables, cable connections, and concrete footings) or those that must fracture or tear away duringimpact (such as transformer bases or weakened barrier posts). Compressive tests of concrete cylinders, proof tests of cableassemblies, and physical and chemical properties of materials, in general, should be performed on a random sample of thetest article elements or obtained from the supplier of the material. Even though well-defined material specifications
A-3
and appropriate fracture modes may not be fully developed, the properties of all material used in the test article should bedocumented in detail in the test report.
A2.3.2.1
Proper judgment must be exercised in establishing test installation length. In specifying minimum length of alongitudinal barrier installation, the intent is to minimize influence of terminals and thereby simulate a long barrier. Alsoto be considered is the possible need to extend the barrier installation to observe a second collision between vehicle andbarrier.
A2.3.2.4
See commentary in Section A3.2.4.
A2.4.1
The vehicle's design and condition at the time of testing can have major influence on the dynamic performance ofa feature. Among the more important parameters are vehicle bumper height, configuration, and stiffness; vehicle massdistribution and suspension system; and vehicle structure. For these reasons the test vehicles should correspond closely tothe recommended vehicle properties.
A2.4.1.1
Changes have occurred in the vehicle fleet since publication of NCHRP Report 230. Automobiles with curbmasses of 725 kg and less are now operating on U.S. highways. The typical family sedan now has a mass somewherebetween 900 kg and 1800 kg with only the expensive luxury cars and a few station wagons weighing more than 1800 kg.The mix also contains a significant number of "light-duty trucks," such as pickups, vans, Suburbans, Blazers, Broncos,etc., and "recreational vehicles," such as van conversions (customized vans), motor homes, etc. A significant portion of thelight-duty trucks has a mass over 1800 kg. Many, if not most, of the light-duty trucks, in fact, serve as a passenger vehicleas opposed to a commercial or utility vehicle. Cars and light-duty trucks are combined herein into a single "passengervehicle" category.
Sales of trucks above the light-duty category totaled 368,703 in 1988. These are trucks with a gross vehicle massin excess of 4500 kg. Of this total, 40% were in the 15,000 kg and over category.
Unfortunately it is difficult, at best, to project even short term trends in the vehicle mix due to the volatile andunpredictable nature of factors that influence vehicle design. Due to the intense competitive and proprietary nature of theautomobile industry, future vehicular design data are simply not available. Further, the development cycle time frominception to production of a new model has been decreasing over the years and is projected to continue to decrease.Perhaps the best available source for projected trends in automotive design is a recent report prepared by the University ofMichigan (54). The study was conducted in 1988 and it was the fifth in a series of Delphi surveys of high-level automotiveindustry leaders. According to the
A-4
report, "More than 300 CEO's, presidents, vice presidents, directors, and managers - organized into three panels -responded to 160 questions concerning technological, marketing, and materials developments within the automotiveindustry through the year 2000." One of the many projections of this study was that the "expected total vehicle weight willremain fairly constant through the year 2000 based on present fuel economy regulations and vehicle sizes." However, itwas predicted that there will be a slight downward trend in weights due primarily to the increased use of structuralcomposites. The total curb mass for the average North American produced passenger car was predicted to be between1375 kg and 1430 kg for model year 1985 and between 1335 kg and 1380 kg for model year 2000. The average weight forthe 1987 model year was estimated to be 1440 kg.
Upon review of available data and after careful review of various options, the recommended test vehicles listedin Tables 2.1 and 2.2 were selected. Consideration was given to including a vehicle more representative of the automobilepopulation, i.e., a car with a mass of approximately 1550 kg. In some special cases it may be possible to design a feature tomeet the performance recommendations for the 820C and 2000P test vehicles, leaving a potential problem for the typicalcar. A crash cushion is one such feature. It may also be possible for a longitudinal barrier to perform satisfactorily for thesmall and large vehicles but exhibit a snagging problem for the typical car. However, tests with a typical car wereultimately dismissed for three basic reasons: (1) they would not, in most cases, reveal problems that would not beidentified with the 820C and 2000P vehicles, (2) technology has advanced to the point that potential problems with atypical car can usually be foreseen prior to the testing phase of the feature's development or can be inferred upon carefulreview of the recommended tests, and (3) they would significantly increase the cost of testing. If after exhausting alldesign and evaluation procedures a reasonable doubt remains, additional tests with the typical car may be warranted.
Test Vehicle 700C
This is a new test vehicle and it represents the very low end of the passenger car spectrum in terms of mass. Testexperience with this vehicle is limited. Reference should be made to a study of the impact performance of widely-usedhighway safety features for a vehicle similar to 700C (7). In general this study found that acceptable impact performancecan be expected for impacts with rigid and semirigid longitudinal barriers. As expected, marginal or unacceptableperformance can be expected for most in-service features sensitive to the mass of the impacting vehicle, such as terminals,crash cushions, and some support structures. It was predicted that most support structures utilizing a slip-base breakawaydevice or other devices with similar behavior would have acceptable impact performance. Even so, it was pointed out thatimpact performance of slip-base devices for a 700C type vehicle is much more sensitive to factors such as bolt torques(and, hence, breakaway force), frontal crush stiffness of vehicle, and proper activation of the upper hinge in a sign supportthan a larger vehicle. It was also reported that more overturns can be expected with a vehicle of this size due to itsinherently lower stability. Roadway or roadside surface discontinuities or irregularities such as curbs, ruts, and vegetationthat would not upset a sliding larger vehicle would cause this vehicle to overturn.
A-5
Although agencies should consider the 700C vehicle in safety feature development, its use in lieu of the 820Cvehicle should be viewed as desirable but not required. A suggested policy is to design for the 700C vehicle when it can bedone cost effectively.
Test Vehicle 820C
The recommended test inertial mass of the 820C test vehicle (820 kg or approximately 1800 lb) is essentially thesame as the 1800S vehicle of NCHRP Report 230. It was chosen as a basic test vehicle for the following reasons: (1) it isrepresentative of a reasonable portion of passenger cars at the lower end of the spectrum in terms of mass, (2) althoughtenuous, predictions suggest minor changes in passenger car sizes over the next 10 years, and (3) its use will providelinkage with a considerable crash test database accumulated since publication of Report 230.
Although several makes of cars were used for the 1800S vehicle of Report 230, the vast majority of tests wereconducted with Honda Civics of various model years. In recent years the mass of the Civic has increased to the point thatit can no longer be used as an 1800S test vehicle. While a specific vehicle make was not recommended in Report 230, theunofficial adoption of the Honda Civic as the standard for the 1800S vehicle had its obvious advantages.
A specific make for the 820C vehicle is not required herein either. However, in view of the diversity of keyvehicular properties of small cars (see, for example, the variations in frontal crush stiffness of small cars reported inreference 7) and in view of the population differences of available makes, consideration should be given to the selection ofan "unofficial" make for the 820C vehicle. After reviewing candidate vehicles that would meet recommended propertiesfor the 820C vehicle for at least through 1996, it was concluded that the Ford Festiva should be given strong considerationas an unofficial 820C test vehicle. Sales of the Festiva exceeded other cars in the sub-820 kg category for the 1987-1990model years. It should therefore be readily available.
Test Vehicle 2000P
A pickup truck was selected to replace the full-size automobile widely used in the past (4500S vehicle in Report230) for the following reasons:
(1) Sales of light-duty trucks, in general, and pickup trucks, in particular, have increased to the point that theynow constitute a significant portion of all passenger vehicles operating on U.S. highways.
(2) Full-size automobiles with the mass of the 4500S test vehicle (2040 kg) are no longer sold in the U.S.with the exception of a few expensive luxury cars. The nominal mass of a full-size family sedan nowbeing sold in the U.S. is about 1350 kg.
(3) Although there are structural and profile differences, the recommended 2000 kg pickup will produceimpact loading reasonably similar to the 4500S vehicle of Report 230. Limited full-scale crash tests withan instrumented wall (17) indicate that a pickup will produce a maximum impact force slightly less thanthat of an automobile
A-6
of equal mass, whereas the effective height of the impact force will be slightly higher for the pickup, all otherconditions being equal. Consequently, the 2000P test vehicle is expected to provide linkage with the numerous testsconducted with the 4500S vehicle.
A 3/4-ton pickup is recommended for the following reasons:
(1) Section 1073 of the Intermodal Surface Transportation Efficiency Act of 1991 mandated the development of standardsfor roadside barriers and other safety appurtenances "...which provide an enhanced level of crashworthy performanceto accommodate vans, minivans, pickup trucks, and 4-wheel drive vehicles..." The 3/4-ton pickup is believed to berepresentative of a large segment of the light-duty truck population. The light-duty truck population includes largenumbers of conversion vans on 3/4-ton chassis, Blazers, Broncos, and pickups with and without 4-wheel drive,pickups with campers, minivans, etc., whose mass and center of mass above ground approximate those of the 3/4-tonpickup. However, the exact degree to which features designed to meet test and evaluation requirements recommendedherein will satisfy the intent of Section 1073 is not known at this time. Impact performance of any given feature isknown to be sensitive to small changes in test parameters, especially those associated with the test vehicle. It must alsobe noted that some 4-wheel drive vehicles, as well as some conventional-drive vehicles, are either manufactured orcustomized by their owners to have oversized tires, extended suspension systems, small track widths, etc.. Thesedesign features can greatly diminish a vehicle's stability, i.e., its resistance to overturn. It is not economically feasibleto design safety features to accommodate vehicles of this type.
(2) Very little, if any, ballast will be needed to meet the recommended test inertial mass.
(3) Use of a specific pickup type will enhance test standardization.
Test Vehicles 8000S, 36000V, and 36000T
These three heavy vehicles were selected for use in crash test evaluation of longitudinal barriers designed for thehigher test or service levels. Several tests have been conducted with each of the three vehicles. Studies have indicatedheights of approximately 81 cm, 107 cm, and 205 cm will be required for rigid barriers for the 8000S, 36000V, and36000T vehicles, respectively, when ballasted as recommended.
Note in Table 2.2 that some of the dimension parameters have a suggested maximum value but no minimumvalue. This was done for two basic reasons: (1) it allows the testing agency more flexibility in purchasing the test vehicleand (2) impact loads will tend to increase as the value of these parameters decrease. Thus, although it is preferable toselect vehicles with parameters near the maximum permissible values, lower values will provide an added factor of safetyin the test.
Testing and user agencies should be aware of potential problems that may occur with a test using the 36000V testvehicle. In particular, the undercarriage attachment of the trailer
A-7
tandems to the trailer frame may not be of sufficient strength to provide necessary restraint during the specified test. Thisproblem is believed to be peculiar to sliding undercarriage or sliding axle designs. In at least one test, the attachment(which was the sliding undercarriage type) failed due to an inability to transfer lateral impact loads and the trailer wentover the barrier. In a similar test with a fixed undercarriage attachment, no such failure occurred and the trailer did not goover the barrier. A sliding attachment is recommended for the test trailer since it is widely used in the industry. While it isdesirable to test with widely-used vehicles and equipment, the primary purpose of the test is to demonstrate structuraladequacy of the barrier, not the trailer. A barrier capable of containing a trailer with a sliding axle may have to beconsiderably taller than one capable of containing a trailer with a fixed axle. Nevertheless, public safety requires effectivecontainment of vehicles on the road. If testing reveals this defect in trailer design will cause significant increases in thecost of effective barrier designs, support should be sought from appropriate officials and agencies to develop improvedtrailer designs and possibly the retrofitting of existing designs.
Each of the above test vehicles should be in sound structural shape without major sheet metal damage. Use of avehicle for more than one crash test without repairs should be avoided because vehicle damage may affect performance ina subsequent test. This is particularly important in evaluating safety features such as a breakaway support where vehiclecrush significantly affects the fracture mechanism.
A2.4.1.2
An emerging trend in evaluating impact performance of selected features is the use of surrogate test devices suchas a bogie vehicle or a pendulum. A bogie vehicle is now being used by FHWA at the Federal Outdoor Impact Laboratory(FOIL) facility for compliance testing of breakaway sign and luminaire supports. It has exhibited a good degree ofrepeatability in replicating the response of a small car. Another key attribute is its relatively low cost of operation.
A wheeled bogie vehicle and a swinging pendulum with a crushable nose are the two primary types of surrogatesused to date. While the pendulum can be used to evaluate certain aspects of impact performance, it is limited in terms ofimpact speed and replication of the postimpact behavior of an actual vehicle. It is also limited basically to single-supporttype structures. For certain features the bogie can replicate the full, three-dimensional dynamic behavior of an actualvehicle for the full range of design impact speeds. Although the following discussion will concentrate on the wheeledbogie, issues relevant to the pendulum are also relevant to the bogie.
A bogie is defined as a surrogate vehicle mounted on four wheels whose mass and other relevant characteristicsmatch a particular vehicle or are representative of a typical or generic vehicle. It can be directed into the test article by aguide rail or cable, by remote control, or other means. It can be accelerated to impact speeds up to about 100 km/h by apush or tow vehicle, by self-power, or by a stationary windlass. The cost of operation is low since it can be reused withoutmajor repairs.
A-8
In addition to mass, properties such as frontal crush stiffness, weight distribution and center-of-mass location,dimensional properties including wheelbase and track width, and tire properties can be adjusted to represent a selectedvehicle. Frontal crush stiffness can be simulated by adjusting the size and type of crushable modules.
Currently, the bogie at the FOIL is the only operational one in the U.S. designed for roadside safety studies. It ispresently configured and has been validated to replicate a 1979 Volkswagen Rabbit. However, automobiles weighing from635 kg up to 1,020 kg can be modeled. At the time of this writing, the California Department of Transportation (Caltrans)was developing two bogies for its California Automotive Research Test Site (CARTS) located at the University ofCalifornia at Davis. One will cover weight ranges of 680-1,360 kg and the other will cover the range of 1,350-2,725 kg.The CARTS bogies can be configured with or without a suspension system (i.e., springs, shock absorbers, and suspensionstops). The FOIL bogie does not have a suspension system. The FOIL bogie vehicle has exhibited a good degree ofrepeatability in replicating the response of a small car impacting breakaway support structures.
It is recommended that the surrogate be configured to model a specific vehicle, as opposed to a generic vehicle,with the stipulation that the vehicle being modeled meet specifications for production model test vehicles, i.e.,specifications that define tolerances on age, weight, etc. This is by far the least expensive of the two options sinceproperties of only one vehicle have to be measured and the validation process involves crash testing with only one vehiclemodel.
It would be desirable for FHWA or NCHRP to establish a project in which all bogie properties would be updatedand validated periodically to keep current bogies within specifications. This would not only be the most efficient approachsince each testing agency would not have to do it independently, it would insure uniformity throughout the testingcommunity.
A2.4.1.3
See commentary in Section A3.2.4.
A2.4.2.2
Ballast for test vehicles that is free to shift or that can break loose during impact may be totally ineffective oronly partially effective in initial loading of the feature because it tends to move independently of the vehicle. Unlessspecifically designed to evaluate effects of cargo shifting, tests with the 8000S and 36000V vehicles are to be conductedwith a firmly secured ballast. The tie-down system should preferably be capable of resisting a lateral load equal toapproximately ten times the weight of the ballast.
It must be noted, however, that test experience has shown that it is quite difficult to design a ballast tie-downsystem for a van truck or trailer with sufficient strength to resist typical impact loads for two reasons: (1) the absence oflateral stiffness in the walls of the van and (2) the height the ballast must be placed above the floor of the van to achievethe recommended
A-9
center of mass of the ballast. For reasons of economy and convenience, sand bags on pallets are commonly used as aballast in tests of van trucks or van trailers. While this achieves the required mass and center-of-mass height, it is difficultto secure this type of ballast and it creates a concentrated lateral load at some height above the floor of the van duringimpact. It would be preferable to use a ballast material with a density as low as possible so that the ballast would beuniformly distributed along the length, width, and height of the van, thus minimizing the need and structural requirementsof the tie-down system. Bales of hay have been used as a relatively low density ballast.
A2.4.3
Because front wheel brakes of the test vehicle are sometimes damaged during impact, remotely actuated brakesare generally applied to the rear wheels only. This braking mode may cause the vehicle to yaw or spin during after-collision trajectory. For this reason braking should be delayed as long as safely feasible so that the unbraked after-collisiontrajectory can be observed. One suggestion is to use diagonal wheels, the front wheel away from impact and the impact-side rear wheel for braking in order to reduce vehicle spin. This practice would also be representative of brake designs onmany automobiles. In any case, vehicle position at the time of brake application should be noted in the report.
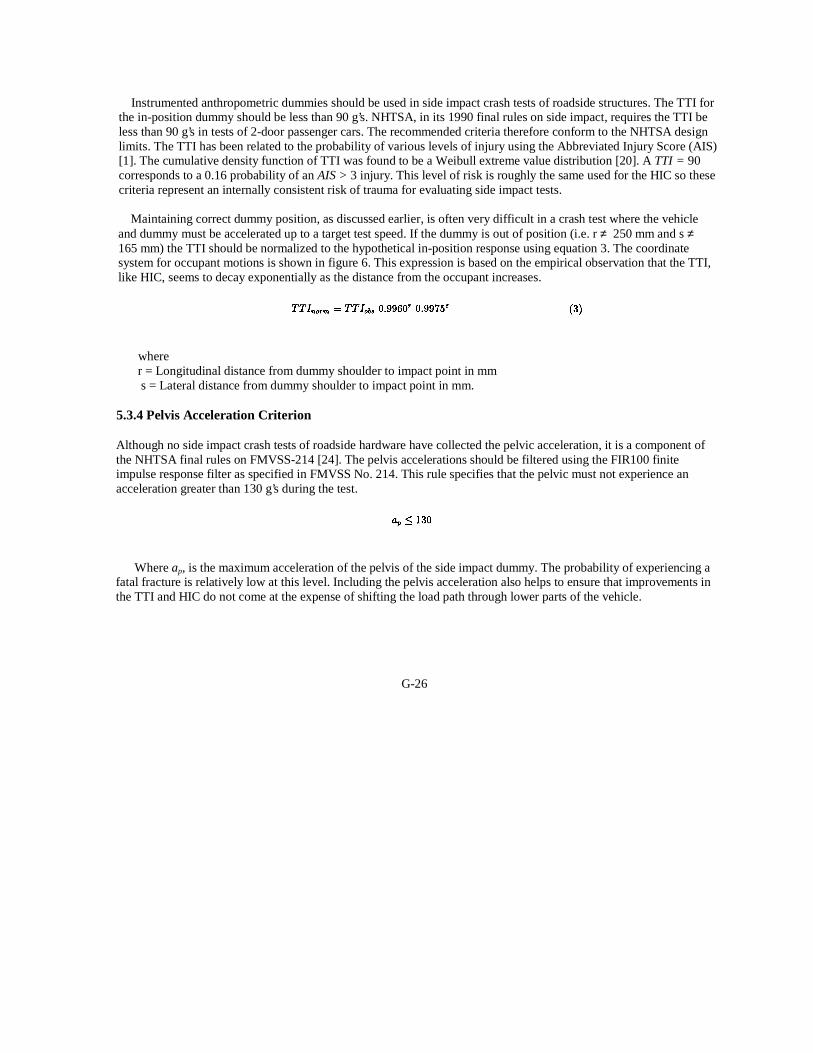
A2.5
The automobile manufacturers and the National Highway Traffic Safety Administration (NHTSA) have devotedconsiderable effort in upgrading responsiveness and measurement techniques for dummies, primarily in the chest andhead/neck regions. New and highly advanced dummies such as Hybrid III and Eurosid (developed in Europe) have beendeveloped with 40 or more channels of data. However, it was concluded that the greatly increased cost of acquiring,maintaining, and applying dummies of this type and the added complexity of and demands on data acquisition and datareduction systems would more than offset the added benefits that may be realized in roadside safety design. Use of thesedummies is therefore optional. Effectiveness of dummies that preceded Hybrid III and Eurosid in accurately quantifyingthe severity of a crash test has been found to be very limited. They are, therefore, not recommended except for use instudying the gross motion of an occupant and/or in studying the added mass effects of an occupant.
Also, expanded use is being made of sophisticated collision victim simulation computer simulation models. TheCVS model developed under sponsorship of NHTSA is a three dimensional model with many features and complexities.To use it to evaluate a crash test one would input the response of the test vehicle into CVS, and the program wouldcompute the dynamic response of an occupant positioned anywhere in the passenger compartment for either a restrained oran unrestrained condition. However, the amount and complexity of input data required for its use, the cost of running theprogram and, more importantly, the absence of any past record of performance and demonstrated efficacy of the programin the assessment of crash tests by the roadside safety community essentially precludes its application at this time.
A-10
CHAPTER THREE
A3.1
The "multiple service level" (MSL) concept for highway safety features was first introduced in NCHRP Report239 (55). This study only addressed bridge railings. Report 230 adopted the MSL concept to a degree. Table 3 in NCHRPReport 230, "Crash Test Conditions for Minimum Matrix," provided testing for a MSL of 2. Table 4 of Report 230,"Typical Supplementary Crash Test Conditions," provided testing for an MSL of 1 and 3. The supplementary matrixapplied primarily to longitudinal barriers. In recent years there has been an increased interest in the concept, not only forlongitudinal barriers but for other features. AASHTO recently endorsed the MPL concept for the design of bridge railings(29). Three performance levels were selected for bridge railings.
For the present document it was decided that "test level" would be a more appropriate term than "service level."Selection of the recommended set of test levels and associated test conditions was based on the collective judgment of theresearchers and the advisory panel after carefully reviewing past and current practices and anticipated future needs. It wasalso made in close collaboration with those responsible for developing AASHTO policies relevant to the safetyperformance of bridge rails and sign and luminaire support structures. The advantage of this approach is that it utilizedcurrent information and it reflects the combined expertise of a cross-section of disciplines and agencies directly involvedin the full array of roadside safety issues. The disadvantage is that some of the decisions were, of necessity, based onlimited quantitative data. As noted in the text, there are no warrants or criteria that identify roadway classifications, trafficconditions, traffic volumes, etc., for which a safety feature meeting a given test or performance level should be used.Given the choice, it would be preferable to first establish conditions or warrants for which features having givencapabilities would be cost effective and thereby define appropriate test levels than to first establish a set of test levels withthe uncertainty as to where features developed to meet these levels would have application. If and when warrants formultiple test level features are developed, it is possible that some of the levels will prove to be unnecessary or redundantand/or that other levels are needed.
A3.2
Errant vehicles of all sizes and classes leave the travelway and strike highway safety features with a wide rangeof speeds, angles, and attitudes. It should be a goal of transportation officials to design safety features that willsatisfactorily perform for this range of impact conditions. Combinations of vehicle speed, mass, and approach angle thatoccur are unlimited. However, impact conditions must be reduced to a very limited number to keep an evaluation testseries within economic and practical bounds. The approach used in formulating the recommended test conditions is toevaluate the devices for cases that are very severe, yet practical. Accordingly, there is no assurance that a safety featurewill perform acceptably with other vehicle types presently in service or those vehicle types that may come into use duringthe normal service life of the device.
For test levels 3 through 6 and for the passenger test vehicles (700C, 820C, and 2000P), features are tested at a100 km/h speed instead of the 89 km/h limit applicable to all highways
A-l1
other than rural freeways (most of which have a 105 km/h limit). Since a large percentage of high-speed travel occurs onother than rural freeways, the 100 km/h test speed should provide some degree of additional conservatism to the design ofa feature. In addition to examining safety features for a range of impacts, the low-speed tests are important for certainfeatures since they explore the activation of fracture or breakaway devices at relatively low kinetic energy levels.
A3.2.1
For test levels 4 through 6 and for the truck test vehicles (8000S, 36000V, and 36000T), longitudinal barriers aretested at a speed of 80 km/h. This is in recognition that speed limits for trucks are generally lower than for passengervehicles. Also, most truck tests have been conducted at 80 km/h and linkage to past practices is desirable.
While vehicles leave the travelway and impact barriers within a wide spectrum of angles, most reportedcollisions with longitudinal barriers occur at impact angles less than 25 deg with the majority less than 15 deg.Historically, the 25 deg impact angle has been accepted as a practical worst case and the 15 deg approach angle as a moretypical collision condition. The 25 deg angle test with the 2000P vehicle has been retained in the present document and isintended as a strength test for test levels 1 through 3. Tests with vehicles 8000S, 36000V, and 36000T are at 15 deg andare intended as strength tests for test levels 4, 5, and 6, respectively.
Since publication of Report 230 there has been a recognition and acceptance that while the 15 deg impact angleis more typical, a 20 deg angle is more discerning for tests with the 820C vehicle. The 20 deg angle has therefore beenadopted for evaluating the impact severity of longitudinal barriers.
Critical impact point (CIP) is a new concept in testing of longitudinal barriers and other features. Rather thanrequiring the initial impact point to be at a specified point, e.g., midway between posts in Report 230, it is recommendedthat an effort be made to determine the CIP or the point with the greatest potential for causing a failure of the test. Failurecan be caused by excessive snagging or pocketing of the vehicle, fracture of the barrier, vehicular override or underride ofthe barrier, vehicular overturn, etc. Suggested procedures for determining the CIP are given in Sections 3.4 and A3.4.
A3.2.2
Terminals and crash cushions function in the same or similar manner, i.e., they either bring the vehicle to acontrolled stop, redirect the vehicle, allow controlled penetration of the vehicle, or a combination thereof. However, sinceany given design will generally not function in all three of these modes, it was necessary to categorize the recommendedtest matrices.
The two major categories are "terminals and redirective crash cushions" and "nonredirective crash cushions."This was done in recognition that there are two distinct types of crash cushions widely used in the U.S., i.e., those thatredirect a vehicle if impacted along their length and those that do not, and in recognition that both types have proven veryeffective in reducing roadside hazards when properly applied. As noted in the text, terminals and
A-12
redirective crash cushions are subjected to a more rigorous and demanding test series than nonredirective crash cushions.Consequently, impact performance capabilities of a redirective crash cushion will generally be greater than for anonredirective cushion. Determining site conditions for which each type would have application is the responsibility of theuser agency and was beyond the scope of this document.
Terminals and redirective crash cushions are further categorized into "gating" and "nongating" devices. As ageneral rule, a gating device is designed to allow controlled penetration of the vehicle for impacts upstream of thebeginning of the length of need (LON). The breakaway cable terminal and its successor, the eccentric loader terminal, areexamples of a gating device. As a general rule, a nongating device will redirect the vehicle if impacted along its side andbrings the vehicle to a controlled stop if impacted on its end. The "GREAT" terminal (56) is considered to be a nongatingdevice. Unfortunately, these subcategories do not uniquely describe the manner in which all terminals and redirectivecrash cushions function. For example, the "ET-2000" terminal (57) permits controlled penetration along portions of itslength and it brings the vehicle to a controlled stop when impacted on its end if the impact angle is within a certainenvelope.
The above discussion underscores an important point made in Section 3.1, i.e., the recommended test matricescannot and should not be expected to be an all inclusive set of standardized procedures. When appropriate, the testingagency and/or the user agency should devise other critical test conditions consistent with the range of expected impactconditions.
In comparison to Report 230, additional tests are recommended for terminals and/or redirective crash cushions.Tests 32, 33, 37 and 39 are new tests. As indicated in Table 3.2 and in the text, some of these tests may not be required,depending on the design of the terminal and on its intended application. Note in the redirective "strength" tests (35, 37, and38), the recommended impact angle is now 20 deg compared to 25 deg in Report 230. Selection of 20 deg was based on arecognition that design of a terminal or crash cushion is very sensitive to the redirective requirements of the 2000P vehicleand the associated impact angle, and crash cushions have historically been designed for a 20 deg side impact angle.
While it is preferable that the test vehicle remain upright after each test described herein, exceptions are made forall heavy vehicle tests and for tests of crash cushions and terminals within test level 1 (see Criterion G of Table 5.1).Overturn is permitted in the heavy vehicle tests since the primary goal in these tests is to demonstrate that the longitudinalbarrier being evaluated can contain and redirect the vehicle. Crash test experience with heavy vehicles has shown that ifoverturn occurs, the vehicle usually undergoes only a 90 degree roll, remaining on its side while coming to rest.Exceptions are made for tests of crash cushions and terminals for test level 1 since most overturns at 50 km/h are notbelieved to be life-threatening. Exceptions are also made to permit and encourage the development and use of cost-effective crash cushion and terminals for low-speed applications. For example, a concrete, sloped-end terminal section canprobably be designed to satisfy test level 1 criterion. Note that even though overturn is permitted for all heavy vehicle testsand level 1 tests of crash cushions and terminals, evaluation criterion D of Table 5.1 must be satisfied, i.e.. the overturnmust not result in deformations of the occupant compartment that could cause serious injuries.
A-13
A3.2.3
Test matrices for work zone traffic control devices and breakaway utility poles are new. Limited testing has beenconducted on both types of features and the recommended tests and evaluation criteria were based in part on these studies.As more experience is gained in the test and evaluation of these features, it may be desirable to amend therecommendations.
The energy or force required to fracture a breakaway device or support structure, in general, may be sensitive toits orientation with respect to direction of impact or the impact angle. For example, tests have indicated a breakawaytransformer base breaks more readily when struck on a corner than on a flat side. Because errant vehicles may approach asupport structure, work zone traffic control device, or a breakaway utility pole at various angles, it is recommended thatthe device be tested assuming the most severe direction of vehicle approach consistent with expected traffic conditions orat the critical impact angle (CIA) discussed in Section 3.2.3 For instance, the transformer base should be oriented so thevehicle strikes a flat side. Moreover, because the energy required to fracture a device can be increased due to buckling ofthe support at the point of contact with the vehicle, the handhold in the luminaire shaft should be positioned during a testso that probability of local collapse of the shaft is maximized.
Development of an energy-absorbing, yielding luminaire support pole was under way at the time of this writing.It is designed to decelerate the vehicle to a safe stop, similar to a crash cushion, rather than permit the vehicle to breakthrough and continue with minimal reduction in speed. Rigid, nonbreakaway supports are often used in urban areas whereencroachment of the vehicle beyond the pole could endanger pedestrians or other innocent bystanders. While this practicemay offer protection for the innocent bystander, it may also increase risks to errant motorists. The yielding pole may haveapplication in these areas, and/or areas where trees or other hazards exist just beyond the pole line that could endangeroccupants of the encroaching vehicle. However, since such a design would not pass occupant risk criteria recommendedfor breakaway support structures, it would be necessary to use criteria recommended for a crash cushion.Recommendations on use of such features is beyond the purview of this document. Their use must be based on policydecisions by the user agency.
Breakaway utility poles are tested and evaluated somewhat differently from other support structures. A higheroccupant impact velocity is permitted in a utility pole test. This is-in recognition of the relatively high change in vehicularvelocity and, hence, occupant impact velocity that occurs during impact with commonly used wooden utility poles withthe 820C test vehicle, irrespective of the breakaway mechanism. The change in vehicular velocity occurs in large part as aresult of momentum transfer caused by the mass of the pole. Since a higher occupant impact velocity is permitted, theimpact speed for the "low speed" test was set at 50 km/h, or 13.9 m/s. Note that for an impact speed of 35 km/h or 9.7 m/s(as used for other support structures), the vehicle could come to an abrupt stop and still pass the 12 m/s maximumoccupant impact velocity criterion. Recommended tests and assessment criteria notwithstanding, it should be a goal of thedesigner to develop breakaway utility pole systems that minimize vehicular velocity change and, when possible, limitingoccupant velocities should equal those for other support structures. Replacement of solid timber poles with lighterstructures, if
A-14
feasible, could reduce or eliminate problems associated with the relatively large mass of timber poles. Utility poles couldthen be expected to meet the same safety standards as other support structures.
A special feature somewhat related to support structures and not specifically included in the test guidelines is a firehydrant. When it is required to evaluate the impact performance of a fire hydrant, it is recommended that it be tested to anappropriate test level and evaluated in accordance with the recommendations for a support structure.
A3.2.4
There are three basic areas of concern in an impact with a TMA: (1) risks to occupants of the impacting vehicle, (2)risks to occupants of the support truck to which the attenuator is attached, and (3) risks to workers if the support truck ispushed or rolls forward into the area occupied by the workers. All other factors being equal, risks to the occupants of theimpacting vehicle generally increase as the mass of the support truck increases and/or as the degree of braking of thesupport truck increases. On the other hand all other factors being equal, risks to the occupants of the support truck and toworkers ahead of the truck generally increase as the mass of the support truck decreases and/or the degree of brakingdecreases. Roll-ahead distance, the distance the support truck will advance upon impact, increases as the mass of thesupport truck decreases and as the degree of braking of the support truck decreases. Preferably, all these areas of concernwould be evaluated in a given test series. It was concluded that at a minimum the recommended test series should focus onthe first area of concern identified above, and additional optional tests could be conducted to evaluate other areas ifnecessary. Furthermore, it was concluded that the recommended tests should be standardized to the extent practicable,recognizing the rather wide variance in TMA specifications, support truck sizes and weights, and operating conditions(53). Thus, for test with the 820C (or the 700C) vehicle the support truck is braced against a rigid wall to preventmovement, thereby eliminating support truck mass effects. It can be shown that the small car test when conducted in thismanner in most cases will not produce results significantly different from those with a braked support truck, consideringthe mass of most support trucks now in use. It is believed that this test will have major safety implications since it willrequire that all TMA's meet a minimum performance standard, regardless of support truck mass, and since risks tooccupants of a small car impacting a TMA are generally greater than occupants of a larger vehicle, all other factors beingequal. For test with the 2000P vehicle, the standardized truck mass (see Section 2.4.1.3) is representative of the heaviertrucks used by state transportation agencies. The recommended braking is believed to be representative of typical in-service conditions. Test with the 2000P vehicle are designed to assess occupant risks and the roll-ahead distance of thesupport truck. It is noted that roll-ahead distances can be accurately estimated from the "conservation of momentum"principle of mechanics, knowing the frictional resistance of the support truck to forward movement. Reference 53contains a description of the use of this principle in calculating roll-ahead distances.
A3.4.2
Longitudinal barriers generally fail due to structural inadequacies that allow snagging or pocketing on stiff points inthe barrier systems or rupture of one of the "weak points" in the
A-15
barrier system, such as a connection point. Thus, most barrier systems have one or more critical locations where failure islikely to take place, whether it be through wheel snag or rupture of a barrier element. The potential for each type of failureis affected to some extent by the selected impact point.
Report 230 recommended that the impact point be selected to provide a worst-case loading on the redirectivedevice. However, in the absence of guidelines, most testing agencies used the default recommendation, i.e., impactingmidway between posts for a length-of-need test, 4.6 m upstream from stiffer system for transitions, midway between noseand beginning of length of need for terminals, and at midlength for crash cushions. Recent studies have developedprocedures for quantifying the critical impact point for certain devices.
Whenever possible, Barrier VII or another simulation program should be used to identify CIP's for longitudinalbarrier tests. The following procedure may be followed to identify the CIP for snagging:
(a) Input the appropriate barrier and vehicular properties.
(b) Select an impact point with respect to the reference post. It is preferable, although not necessary, that thispoint be in reasonable proximity to the expected CIP so as to minimize the number of computer runsnecessary to converge on the CIP.
(c) Determine vehicular and barrier response for the impact conditions of concern. The primary measure ofsnagging potential is the degree of wheel overlap with the reference post. Reference 15 discusses themanner in which the overlap is measured.
(d) Make incremental changes in the location of the impact point, repeating step c for each increment. Sufficientruns must be made to clearly bracket and then determine the CIP, i.e., the point that produces the greatestwheel overlap with the reference post. Experience has indicated the distance from the reference post to theCIP, denoted as "x," ranges from approximately 1 m for stiff systems to approximately 6 m for flexiblesystems.
A3.4.2.1
The small mass and low crush stiffness of passenger vehicles increases the likelihood and severity of wheel snagor pocketing on stiff elements of longitudinal barriers. Therefore, testing of longitudinal barriers with the 700C, 820C, and2000P vehicles must be planned to examine the potential for wheel snag and pocketing as well as structural failure of thebarrier elements. Wheel snagging and vehicular pocketing are the two barrier failure modes that exhibit the greatestsensitivity to impact point selection. When an impact point is too close to a post or other stiff point in a barrier system, thevehicle will not penetrate into the barrier prior to reaching the snag point. Conversely, when the selected impact point istoo far from a snag point, the vehicle will redirect and begin to exit the barrier prior to snagging.
A-16
Connection loading is another important test parameter that is affected by impact location. Fortunately, impactlocations that maximize wheel snagging or pocketing at one point in the barrier will also maximize connection loads nearthat same point in the barrier. Therefore, whenever rail splices or other critical connections fall at or near (within 1 meter)a snag point such as a barrier post, the impact location can be chosen to maximize both the potential for snagging andconnection loadings. Since barrier loadings are generally higher upstream of the snag point, critical connections should beplaced at or just upstream of the snag point, provided the connection locations are consistent with in-service locations.Rail tensile loads are maximized all along the length of the first span upstream from the snag point. Thus, the potential forrail splice tensile failure can generally be maximized by choosing the CIP for snagging if the connection is placed at thesnag point or anywhere within the first span upstream from the snag point.
However, when a barrier connection is not located within approximately one meter of a snag point, bendingmoment and shear in the connection will not be maximized by an impact location chosen to maximize snagging. Whenbarrier connections are not within one meter of a snag point and when wheel snag or pocketing as well as connectionloading in bending and/or shear are significant concerns, the designer may consider conducting two tests with differentimpact locations. Barrier VII or a similar simulation program is recommended to investigate the need for two tests and toselect CIP's.
It has been found that the CIP with regard to snagging is sensitive primarily to dynamic yield force of barrierposts, plastic moment of rail elements, and post spacing (16). Post yield forces and spacing were then combined into asingle parameter, Fp, by dividing the dynamic post yield forces by the post spacing. CIP selection curves were thendeveloped as a function of plastic moment of rail elements, Mp, and post yield force per unit length of barrier, Fp.Reference 16 contains a more detailed description of the development of CIP selection curves shown in Figures 3.7through 3.14.
The plastic moment of a barrier rail element is merely the product of the beam's plastic section modulus and thematerial yield stress. Procedures for calculating plastic section modulus are presented in many textbooks on plastic designof steel structures (64). The plastic section modulus can be estimated with a reasonable degree of accuracy by multiplyingthe elastic section modulus by a form factor. Form factors for common beam shapes vary from a low of about 1.1 to amaximum of 2.0. As the fraction of a beam's cross section located near the neutral surface increases, the form factor of thecross section increases. Wide flange beams have very little material near the neutral surface and, as a result, generally haveform factors less than 1.18 with an average near 1.14. Form factors for square box beams range from a low of 1.13 for avery thin-walled tube to a high of 1.5 for a solid rectangular rod. Form factors and plastic moments for some commonbarrier rail elements are shown in Table A3.1.
Barriers with multiple rail elements complicate the selection of an appropriate plastic moment for the barrier.When this type of barrier deflects during an impact, the upper rail deflection is much higher than that of lower railelements. A simple energy analysis indicates that the total energy absorbed by each rail element is roughly proportional tothe mounting height of the element. Equation 3.2 was then developed to estimate an equivalent plastic moment formultiple rail systems. A limited sensitivity study using Barrier VII revealed that
A-17
A-18
the CIP determined by use of Equation 3.2 accurately estimates the CIP for most multiple rail barrier systems. This studyindicated that the procedure was somewhat less accurate for barriers that have relatively stiff rail elements well above theimpacting vehicle. For this situation, barrier posts will yield above the impacting vehicle and the upper rails will notdeflect as much as the lower rails. Although the CIP selection procedures do give reasonable estimates of critical impactlocations for most of these barriers, a simulation program should be used when possible to verify the findings.
Prior to determining Fp it is necessary to determine the dynamic yield force of the post. The post yield force willbe governed by the smaller of two values: that necessary to yield the post itself assuming it is rigidly anchored at its base,or that necessary to yield the soil in which the post is embedded.
When barrier posts are rigidly anchored, yield forces are controlled by the material properties of the post. Adynamic magnification factor is normally applied to the plastic section modulus of metal posts to estimate the dynamicyield force for a post as given in Equation A3. 1.
where:
Fy = dynamic post yield force for a rigid anchor;D = dynamic magnification factor;ρy = post yield stress;Zp = post plastic section modulus; andH r= height of highest rail above base of post.
The accuracy of Equation A3.1 can be demonstrated by comparing a measured value of Fy for a rigidly anchored W6X9steel post with the calculated value. A dynamic magnification factor of 1.5 is typically used for steel posts and a W6X9beam has a plastic section modulus of 103 cm3 and a yield stress of 248 MPa. For a 0.53 meter mounting height, EquationA3.1 gives an Fy of 71.9 kN compared to a measured value of 74.7 kN from reference 58.
Wood materials exhibit a brittle failure mechanism and therefore the plastic section modulus in Equation A3.1 isreplaced by the elastic section modulus. Reference 58 reported that pendulum tests of a 6 inch X 8 inch (15.2 cm X 20.3cm) Douglas Fir post have an average failure force of 72.1 kN when mounted in a rigid support. Southern Douglas Fir hasan average modulus of rupture of 46.8 MPa (59). Using a dynamic magnification factor of 1.0, Equation A3.1 predictsfailure forces of 91.9 kN and 74.0 kN for rough cut and finished posts with a nominal 6 inch X 8 inch (15.2 cm X 20.3 cm)size. Although it is unclear whether posts used in the pendulum tests were rough cut or finished size, the test results doindicate that the dynamic magnification factor from Equation A3.1 should be no more than 1.0 for wood materials. TableA3.2 shows the modulus of rupture for some common wood post materials.
Dynamic yield forces for posts embedded in soil are generally more difficult to estimate. Soil yield forces areusually measured through pendulum or instrumented cart testing at speeds
A-19
near 32 km/h. A number of guardrail posts have been tested for various soil embedment conditions (34,58,60,61,62,63).Dynamic yield forces for common guardrail posts embedded in strong soils are shown in Table A3.3. The testingprograms referenced above have shown that post yield forces can be approximated as a linear function of the square of theembedment depth. Thus, yield forces from Table A3.3 can be extrapolated for other embedment depths by multiplying theforces shown by the square of the ratio of the two embedment depths as given in Equation A3.2.
whereFs' = soil dynamic yield force at alternate embedment depth, De';Fs = soil dynamic yield force shown in Table A3.3;De' = alternate embedment depth; andDe = post embedment depth shown in Table A3.3.
Some pendulum tests have been conducted in soft soils and are reported in reference 58. Analytical procedures forestimating the yield forces of other post sizes and soil conditions are discussed in reference 60.
The application of CIP selection curves is demonstrated in the following example:Barrier Rail 10 ga. thrie-beam mounted 0.58 m above ground
Post: W6X9 Steel with 1.5 meter embedmentSpacing 2.5 meters
Test 3-11 Vehicle 2000PImpact Cond: 100 km/h, 25 deg
From Table A3.1 the plastic moment of a 10 ga. thrie-beam is found to be 22.1 kN-m. From Table A3.3 thedynamic yield force for a W6X9 steel post embedded 1.12 m in soil is approximately 55.2 kN. The approximate soil yieldforce for a W6X9 steel post embedded 1.5 m in soil can be estimated using Equation A3.2.
The yield force for a rigidly anchored, W6X9 steel post can be calculated from Equation A3. 1. A W6X9 beamhas a section modulus of 102 cm3 and a yield stress of 248 MPa (64). The post yield force then becomes:
A-20
A-21
The numerator of Fp in this case is the lower of the above two values, or 65 kN. Th post yield force per unitlength for this barrier then becomes:
The CIP distance, "x," for this test is found from Figure A3.1. For an Mp of 22.1 kN-m, "x" distances of 3.0 mand 5.5 m correspond to Fp values of 50 kN-m and 8 kNm, respectively. Linear extrapolation can be used toestimate "x" for this example as follows:
Thus, the impact point for this test should be 4.4 m upstream from the reference post. Note that the reference postshould be located at or just downstream from a rail splice.
A3.4.2.2
Connection loading is the test parameter of primary importance for selecting impact points for heavy vehiclecrash tests. Impact point selection guidelines presented in Section 3.4.2.1 are based on the distance from initial contact tothe location of maximum lateral force. When possible, the impact point should be selected to generate maximum lateralloading at all important connection points including rail splices, rail-to-post connections, and post-to-base or post-to-deckconnections. If the primary concern is for the truck to roll over the top of the barrier, the impact point should be selected tomaximize lateral loading at midspan where the top barrier rail would be expected to deflect downward and increaserollover potential. Note that since heavy trucks spread impact loads over a larger area, a single test can usually be devisedto apply near maximum loadings on all critical connections and adequately investigate the potential for post failure as wellas rollover.
CHAPTER FOUR
A4.1
Proper documentation of key test details is often missing in a test report. For those not directly involved in thetest program, assessment of a test and its results and development and implementation of standards for the test articlecannot easily be done without good documentation. Sections 4.2, 4.3, and 4.4 describe important pretest, test, and post-test parameters.
A-22
A-23
A4.3.2
Although not required at this time, the testing agency is encouraged to develop the capability to determine the sixcomponents of accelerations for the sprung mass (assumed to be a rigid body): translational accelerations in the x, y, and zvehicular axes and angular accelerations about these axes. These data, as well as corresponding velocities anddisplacements, should be shown in the report in plots or tables as a function of time.
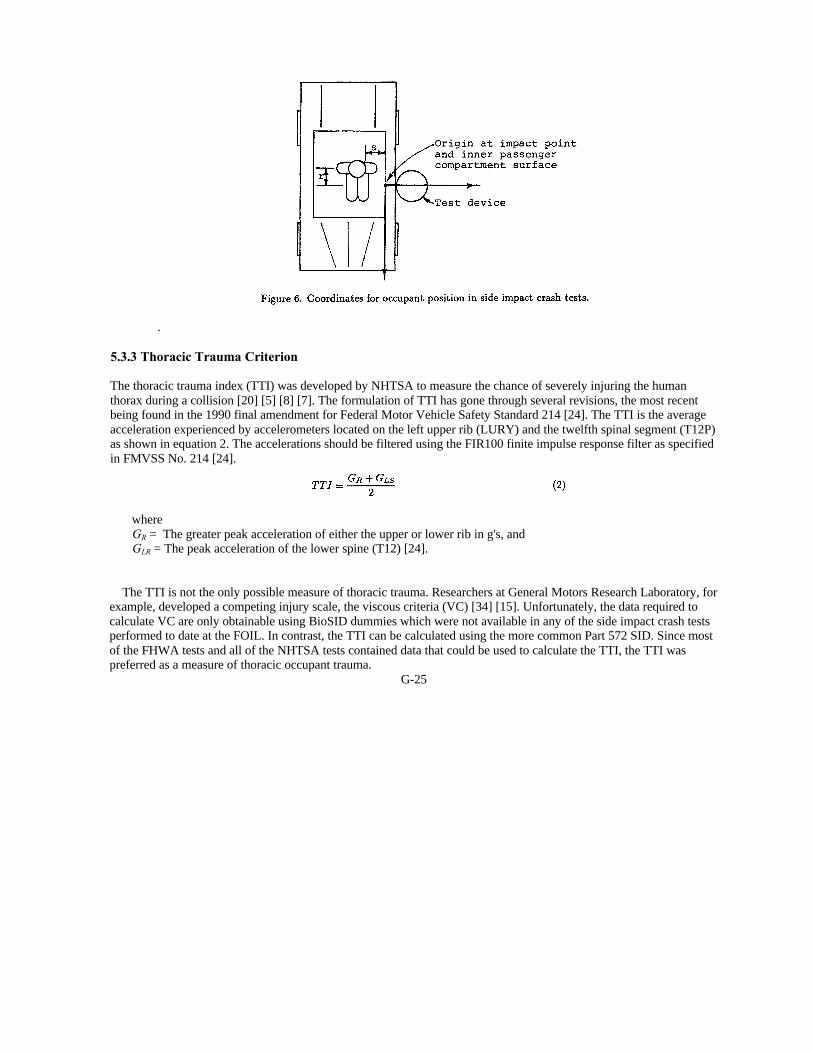
High-speed cine is essential for study of crash dynamics to determine behavior of the test vehicle and the testarticle. In addition, high-speed cine has been used by some agencies as a backup system for determining vehicularaccelerations and kinematics. Guidance for this secondary system consists of (1) minimum film speed (see Table 4.1), (2)internal or external timing device, and (3) stationary references located in the field of view of at least two cameraspositioned 90 degrees apart. Layout and coordinates of references, camera positions, and impact point should be reported.Reference targets should be located on the side and the top of the test vehicle and should be of sufficient size and distanceapart to allow accurate interpretation of the film. The instant of impact should be denoted by a flash unit placed in view ofdata cameras. The instant of impact should also be recorded on the electronic recording device(s).
A4.3.3
Vehicular accelerations are used in the assessment of test results through the occupant flail space model.Accelerations may also be used to estimate impact forces between the vehicle and the test article.
Implicit in the flail space model is the assumption that accelerations are measured at the center of mass of thevehicle. NCHRP Report 230 recommended that a set of accelerometers be placed at or near the center of mass. However,experience has shown that this cannot always be done due to physical constraints within the vehicle. As a result, actualplacement of the set of accelerometers may be offset a significant distance from the center of mass. Depending on theoffset, major differences can occur between measured accelerations and those at the center of mass for redirection impacts(such as impacts with a longitudinal barrier) or impacts which cause angular vehicular motions. The following procedureis recommended if accelerometers cannot be placed within +5 cm of the center of mass as measured in the x-y plane.Although roll motions (rotations about the vehicle's x-axis) of the vehicle are not accounted for, the method has beenshown to give acceptable levels of accuracy even for moderate roll motions.
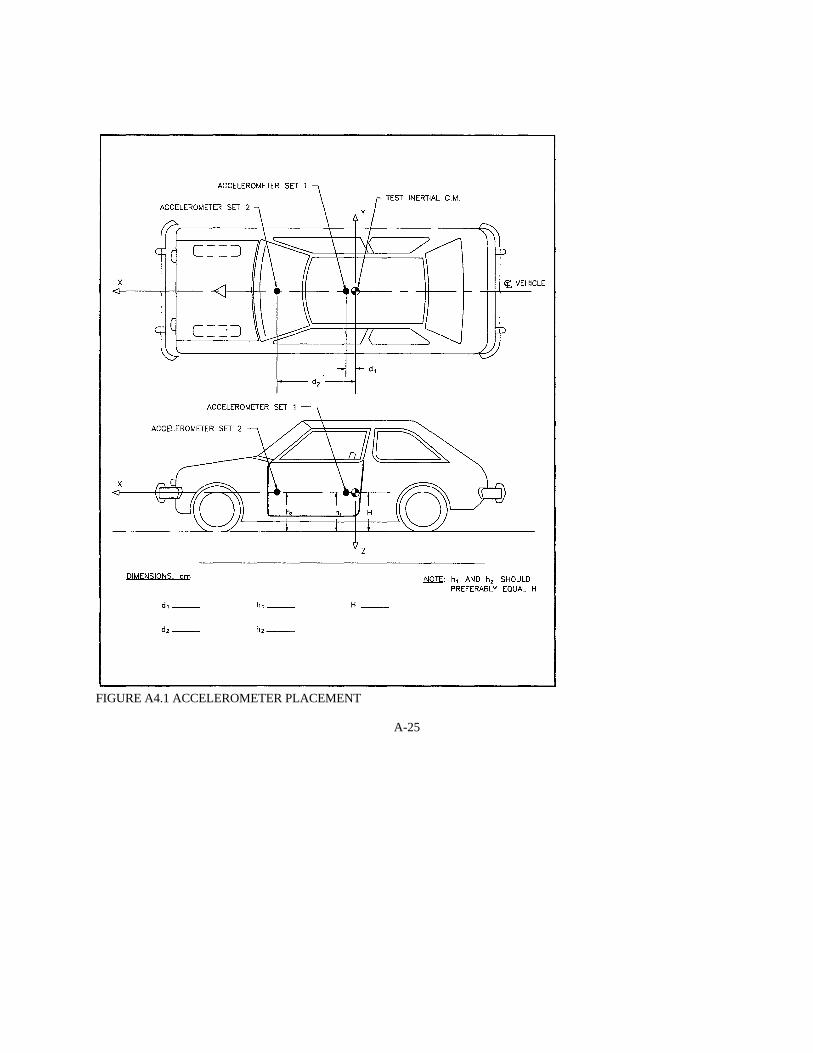
Procedure:(1) A triaxial set of accelerometers, set 1 in Figure A4.1, is mounted on a common block and placed as close to the
vehicle's center of mass as practical with their positive directions corresponding to the positive sign conventiongiven in Figure 4.6. Measurement of the vertical (z direction) acceleration is optional, but preferred. The setmust be mounted along the fore-aft centerline (along x axis) of the vehicle. Theoretically, it is not necessarythat set 1 be placed near the center of mass; however, this is recommended in the event accelerometer set 2malfunctions. It is preferable that distance h1 be within ±3 cm of distance H.
A-24
FIGURE A4.1 ACCELEROMETER PLACEMENT
A-25
(2) A triaxial set of accelerometers, set 2 in Figure A4. 1, is mounted as far as practical from set 1, preferably 60cm or greater, either in front of or behind set 1. Note that both sets must be mounted forward of thecab/bed interface for the 2000P vehicle. The separation distance of the two sets should be as large as practicalto reduce computational errors provided the accelerometers are not placed in an area that would be expectedto undergo significant local dynamic deformations. Set 2 must also be mounted along the fore-aft centerlineof the vehicle. It is preferable that distance h2 be within +2 cm of distance h1.
(3) Using output from the above two accelerometer sets and distances d1 and d2, lateral, longitudinal, andvertical accelerations at the center of mass are computed by Equations A4.3, developed below. Note that d1
and d2 and their signs are measured with respect to the origin of the x,y,z axes located at the center of mass.For positions shown in Figure A4.1, both d1 and d2 are positive. However, it is not necessary that either bepositive.
(4) Values of d1, d2, h1, h2, and H should be recorded and reported as shown in Figure A4.1.
Derivations of Equations:
Accelerations in the longitudinal direction ax, lateral direction ay, and vertical direction az measured byaccelerometers located on the x axis a distance d forward from the center of mass are given by
where, axg,ayg,azg = longitudinal, lateral, and vertical accelerations at the center of mass; and
ωy, ωz, ωy, ωz = pitch and yaw rates, and pitch and yaw accelerations.
Thus, the accelerations at points 1 and 2 of Figure A4. 1 are given by
A-26
. .
Equatioons A4.2 can be solved to obtain the desired accelerations at the center of mass,axg,.ayg, and azg as follows:
Note that the second and fifth equations and the third and sixth equations of set A4.2 can be solved to yield anexplicit solution for pitch and yaw acceleration as follows:
Pitch rate ,ωy, at any time T after impact can be obtained by adding the pitch rate at impact to the integral of thefirst equation of set A4.4 with respect to time from impact to time T. Yaw rate, ωz, can be similarly computed using thesecond equation of set A4.4
A4.4
Measuring and recording both the vehicle damage scale (VDS), formerly the traffic accident data scale (TAD),and the collision damage classification (CDC) are recommended for the following reasons. First, VDS has been in use fora number of years by various accident
A-27
investigation agencies, and a considerable bank of data exists relating VDS to occupant injuries. Hence, by not reportingVDS, the tie of future tests with these historical data would be lost. And second, the National Highway Traffic SafetyAdministration (NHTSA) has standardized on the CDC for its multidisciplinary accident investigations. Therefore, CDC isneeded to tie test vehicle damage (in which vehicle accelerations are measured) to real accidents in which occupant injuryis documented.
CHAPTER FIVE
A5.1
Recommended evaluation criteria are limited to appraising safety performance of highway features for idealizedvehicle crash test conditions. The basic purpose of crash tests is to screen out those candidate systems with functionaldeficiencies and to compare the relative merits of two or more promising candidate safety features. The test results areinsufficient to project the overall performance of a safety feature for in-service use or in an actual collision situation. Finalevaluation of a safety feature should be based on carefully documented in-service use.
Criteria for evaluating a vehicular crash test of a safety feature are patterned after those in Report 230 and consistof three interrelated factors: structural adequacy, occupant risk, and vehicle trajectory. In comparison to Report 230, thepresent criteria presented in Table 5.1 incorporate the following changes and/or modifications (further discussion of theseitems are given in following sections):
(a) Item D was moved from the "Structural Adequacy" category to the "Occupant Risk" category.
(b) Item E was added for evaluation of work zone traffic control devices.
(c) Item G was added for evaluation of heavy vehicle tests and test level 1 terminals and crash cushions.
(d) Under item H in the upper part of the table, the lateral occupant impact velocity limit was set equal to thelongitudinal limit.
(e) The Hybrid III dummy is recommended as an optional measure of occupant risk for frontal impacts.
(f) Item L replaced item I of Report 230.
A5.2
The "structural adequacy" factor essentially assesses the feature from a structural and mechanical aspect.Depending on the feature, conditions to be examined include:
A-28
1. Strength. For longitudinal barriers, this requires containment and redirection of the design vehicles. Terminalsand redirective crash cushions should develop necessary anchoring forces for anticipated site conditions.
2. Geometry. Longitudinal barrier rail members should engage the colliding vehicle at proper height to prevent thevehicle from underriding or overriding the installation. As a general rule, the vehicle-barrier contact surface shouldfacilitate a smooth redirection. However, controlled stopping of the vehicle in a safe manner while the vehicle remains incontact with the rail is also satisfactory performance.Rail discontinuities such as splices and transitions and other elementssuch as support posts should not cause snagging to the extent that occupant risk criteria would not be met, or anotherfailure mode would occur. Shaped rigid barriers, such as the New Jersey concrete barrier, should be designed to considerthe stability of design vehicles.
3. Mechanisms. Stiffness, deformation, yielding, fracture, energy absorption and/or dissipation, etc., arecharacteristics of a feature that should be verified over the range of design vehicles.
In general, a safety feature should perform its function of redirecting, containing, or permitting controlledpenetration of the test vehicles in a predictable and safe manner. Violent roll or rollover, pitching, or spinout of the vehiclereveal unstable and unpredictable dynamic interaction, behavior that is unacceptable.
A5.3 Relationships between occupant risk and vehicle dynamics during interaction with a high-way safety feature areextremely difficult to quantify because they involve such important by widely varying factors as occupant physiology,size, seating position, attitude and restraint, and vehicle interior geometry and padding. Advances have been made inrecent years in better defining these relationships through development and application of sophisticated analytical andexperimental tools, such as the collision victim simulation (CVS) computer program (66) and the Hybrid III dummy. Useof these tools would undoubtedly enhance assessment of occupant risk in tests of safety features. However, for the presentdocument this was ruled unfeasible because of (a) costs associated with their purchase and/or use, (b) level ofinstrumentation and expertise needed, and (c) the absence of experience by testing agencies involved in evaluatinghighway safety features. Studies are needed to better define feasibility and effectiveness of tools of this type in improvingoccupant risk assessment in crash tests.
Flail-Space Model
Report 230 adopted the simplified point mass, flail-space model for assessing risks to occupants within theimpacting vehicle due to vehicular accelerations. Two measures of risk are used; (1) the velocity at which a hypotheticaloccupant impacts a hypothetical interior surface and (2) "ridedown" acceleration experienced by the occupant subsequentto contact with the interior surface. Reference should be made to Report 230, the section on "Occupant Risk" in ChapterFour, in particular, for the underlying reasons for its adoption and its description, limitations, and assumed limiting riskfactors. Based in part on reasons given in Section A5.3, it was concluded that the flail-space model should be retained forthe present document.
A-29
Furthermore, it has served its intended purpose well and there are no indications that features designed and assessedthereby have performed adversely in service. Consideration was given to upgrading the flail-space model to better trackthe "occupant" as it flailed about the "occupant compartment." Assumptions made in the current model were:
(a) Occupant positioned at the vehicle's center of mass;
(b) Yaw motions of vehicle are ignored and, consequently, motion of the occupant in the lateral direction iscompletely independent of motion in the longitudinal direction,
(c) Vehicular and occupant motion is planar (in x-y plane); and
(d) Occupant contained in a compartment such that ± 0.3 m lateral movement can occur before impact with thesides of the compartment (idealized vehicular side structure), and 0.6 m longitudinal (forward) movement can occurbefore impact with the front of the compartment (idealized instrument panel/dash/windshield).
Options considered in updating the model all concerned changes that would affect results of redirection impacts. Theseincluded (a) positioning the occupant at the driver's and/or right-front passenger's seated position, (b) properly accountingfor yaw motion of vehicle, and (c) changing the dimensions of the compartment to better represent the actual occupantcompartment, e.g., this would allow the driver to flail 0.3 m to the left and in excess of 1.0 m to the right. After furtherstudy and careful review, it was concluded that the current model would be retained without changes for the followingreasons:
(a) For typical redirection impacts, incorporation of options a and b, while effecting noncontrolling factors, wouldnot have significant effects on controlling factors.
(b) If option c were incorporated, practically all redirection features would not meet limiting risk factors. Thiscould be interpreted to mean one of several things including: most in-service redirection features developedaccording to Report 230 guidelines are unsafe; limiting occupant impact velocities and ridedown accelerationsare too low; impact conditions of most accidents are not as severe as test conditions; occupants do not flailabout the seats as would be assumed by option c; or a combination of these and/or other things. Since mostredirection features designed according to Report 230 appear to be performing satisfactorily and since theflailspace model is actually an index or measure of occupant risk as opposed to an absolute measure,incorporation of option c does not appear warranted.
(c) Incorporation of these options would require use of a rather complex, standardized computer program andstandardized input.
(d) A problem to date with determination of occupant risks through the flail-space model has been inconsistenciesin positioning accelerometers used in measuring accelerations, i.e., they are not being placed at the vehicle'scenter of mass.
A-30
Recommendations contained in Section 4.3.3 should greatly reduce or eliminate this problem.
In the flail-space approach, lateral and longitudinal but not vertical vehicular accelerations measured at thevehicle's center-of-mass are used. By requiring that the vehicle in the occupant risk test remain upright throughout thecollision, it is believed that the vertical component of vehicle acceleration becomes of secondary importance with regard tooccupant kinematics for the level terrain tests described in this document and for most roadside features. Consequently, thevertical acceleration is considered an optional factor at present and has been neglected in the flail-space calculations.
The performance design strategy for a feature should be to (1) keep the occupant-vehicle interior impact velocitylow by minimizing average vehicle accelerations or vehicle velocity change during the time the occupant is travelingthrough the occupant space and (2) limit peak vehicle accelerations during occupant ridedown.
Limiting Values for Impact Velocity and Ridedown Acceleration
The following items are to be noted:
(a) Report 230 presented "threshold" values a nd suggested feature-dependent factors of safety to apply to thethreshold values. Table 8 of Report 230 contains values thusly obtained. In the present document, two sets oflimiting values are given in Table 5.1: "preferred," which with some exceptions correspond to values in Table8, and "maximum," which with some exceptions correspond to the threshold values.
(b) Based on consultations with biomechanics experts in the automotive industry and based on a review of theliterature (67,68,69), it was concluded that Report 230 threshold values for occupant longitudinal impactvelocity, and lateral and longitudinal ridedown accelerations should be retained. Based on information fromthese same sources, it was concluded that the threshold value for lateral occupant impact velocity should beincreased to equal the value used for the longitudinal component. Note that reference 68 reported on a studythat addressed the efficacy of the flail-space model and limiting values used therein. Among other things, thisstudy found that recommended limiting occupant risk values of Report 230 were conservative, i.e., theyoverstated the risk level.
(c) Report 230 does not have a criterion that corresponds to the "preferred" limit for occupant impact velocity forsupport structures and work zone traffic control devices. The preferred limiting value of 3 m/sec and themaximum limiting value of 5 m/sec are approximately the same as those adopted by AASHTO (40). Themaximum limiting value is slightly higher than the recommended value of Report 230.
(d) Due to conversions to the SI system, limiting occupant impact velocities and ridedown accelerations wererounded and consequently are not precisely the same as those in Report 230 or AASHTO.
A-31
"Maximum" limiting values of Table 5.1 should be treated as threshold limits. Test results should fall belowthese limits and desirably should not exceed the "preferred" values to promote safer performing features. In developingappropriate acceptance values, consideration should be given to the art-of-the-possible (i.e., can a device be made,regardless of cost, to perform to the requirements?) and cost effectiveness (i.e., can the increase in safety performancelevel justify the added cost?). Establishment of acceptance values is a policy decision and, therefore, beyond the purviewof this report.
Procedures for acquiring and reducing vehicular accelerations used in determining occupant risk should followrecommended specifications given in Sections 5.3.2 and 5.3.3.
Calculation Procedures
The expression for occupant impact velocity is
Where V1 is occupant-car interior impact velocity in the x or y directions, ax,y is vehicular acceleration in x or y direction,and t* is time when the occupant has traveled either 0.6 m forward or 0.3 m lateral, whichever is smaller. Time t* isdetermined by incremental integration as follows:
where, X = 0.6 m and Y = 0.3 m. Acceleration in the x direction is integrated twice with respect to time to find the valueof time, tx*, at which the double integration equals 0.6 m. Acceleration in the y direction is integrated twice with respect totime to find the value of time, ty*, at which the double integration equals 0.3 m. Time t* is the smaller of tx* and ty*.
In tests of breakaway features the impulse on the vehicle may be relatively small and of short duration. It is notunusual in such tests for X and Y to be less than 0.6 m and 0.3 m, respectively, during the period in which accelerationsare recorded or up to the time brakes are applied to the test vehicle. In such cases it is recommended that the occupantimpact velocity be set equal to the vehicle's change in velocity that occurs during contact with the test article, or partsthereof. If parts of the test article remain with the vehicle after impact, the vehicle's change in velocity should be computedat the time the vehicle clears the footing or foundation of the test article.
For the ridedown acceleration to produce occupant injury, it should have at least a minimum duration rangingfrom 0.007 to 0.04 sec, depending on body component (70). Thus, vehicular acceleration "spikes" of duration less than0.007 s are not critical and should be averaged from the pulse. An arbitrary duration of 0.010 s has been selected as aconvenient and somewhat conservative time base for averaging accelerations for occupant risk assessment. This isaccomplished by taking a moving 10-ms average of vehicular "instantaneous" accelerations in the x and y directions,subsequent to t*.
A-32
xy
The occupant impact velocity and the highest 10-ms average acceleration values are then compared torecommended limits; it is desirable that both values be below the "preferable" limits; values in excess of the "maximum"limits are considered to be unacceptable.
Recommendations relative to the measurement of accelerations are given in Section 4.3.3 and in Appendix C.Further, for purposes of standardization of occupant risk calculation procedures, the following are recommended:
(1) Prior to integration using above formulas, accelerometer analog data should be digitized at 1,500 samplesper second. This is consistent with recommendations of Appendix C, Section 9.2. It is recommendedtherein that the sample rate be, at a minimum, eight times Fh, where Fh = 180 for measurement of vehicularresponse. Note that Fh X 8 = 1,440, which is rounded to 1,500 for convenience and ease of integration.
(2) It is recommended the "linear acceleration" assumption or the equivalent "trapezoidal rule" be used tointegrate the digitized accelerometer data. As such, accelerations are assumed to vary linearly over eachtime step ti to ti+1 . Description of the trapezoidal rule can be found in most numerical methods textbooks.
A5.4
In general the ideal after-collision vehicular trajectory performance goal for all features should be that the vehicletrajectory and final stopping position should not intrude into the adjacent or opposing traffic stream. For breakaway oryielding supports the trajectory of a vehicle after it has collided with a test article that satisfies structural adequacy andoccupant risk requirements is generally away from the traffic stream and, hence, is normally noncritical. For end-onimpacts into crash cushions and barrier terminals that function as crash cushions, preferably the final position of thevehicle should be next to the test device.
For redirectional performance tests of length of need, transitions, terminals and redirective crash cushions, theafter-collision trajectory is more difficult to assess. The after-collision trajectory may be one of the least repeatableperformance factors because of variation in method and timing of brake application. Further, variables that are in partrelated to the specific model of vehicle selected for tests such as damage to vehicle suspension, tires, etc., may alter thevehicle's stability and path. Moreover, because driver response in avoiding secondary collisions is not simulated in thecrash tests, it seems inappropriate to predict in-service performance based on the complete test trajectory. For thesereasons trajectory evaluation for the redirectional type of tests is focused on the vehicle during contact (criterion L ofTable 5.1). At the time it loses contact with the test article (criterion M of Table 5.1) and the subsequent part of thetrajectory is only subjectively evaluated (criterion K of Table 5.1).
A study (71) conducted since publication of Report 230 found that risks to occupants of the impacting vehicle orto other motorists, as a consequence of the vehicle being redirected, are not as great as previously believed, provided theimpacting vehicle does not collide subsequently with other roadside objects. The study pointed out that secondarycollisions with roadside objects such as trees, other barriers, etc., is of major concern after a redirected impact. Hence,
A-33
the 24.2 km/h (15 mi/h) velocity change criterion of Report 230 (item I of Table 6) was not adopted in the presentdocument. Criterion L of Table 5.1 is intended to allow controlled deceleration of the vehicle without excessive pocketingor snagging of the vehicle. Note that for most redirectional devices, a 12 m/sec occupant impact velocity equates to avehicular velocity change of approximately the same magnitude or 43.2 km/h (26.8 mi/h).
While the above cited study suggests that trajectory of the vehicle into adjacent or opposing lanes may not be ascritical as previously thought, it remains preferable that the vehicle exit the device at a low angle. Although idealperformance would be for the vehicle to exit with a path parallel to the installation, an upper limit of 60 percent of theimpact angle is recommended.
A5.5
Specific test and evaluation guidelines for geometric features are not provided due to the largely nonstandard andvariable nature of such features. However, it should be a goal of transportation agencies to design and implementgeometric features that meet the spirit, if not the specifics, of safety recommendations for the more well-defined roadsidesafety features.
Evaluation guidelines given in this section were derived from a review of past practices and the collectiveexpertise of those involved in preparing the document. They are, of necessity, general and may be amended as necessary toaccommodate special designs or test conditions.
CHAPTER SIX
(No commentary is provided for this chapter)
CHAPTER SEVEN
A7.1
In-service evaluation guidelines are intended to encourage a cautious, systematic introduction of a new safetyfeature. With careful monitoring, unanticipated problems and design deficiencies can be identified before the feature hasbeen installed in an excessive number of sites. Moreover, all the affected departments will have an opportunity to observethe performance of the device with respect to their operations. For instance there may be minor design changesrecommended by the maintenance groups that may reduce normal maintenance or damage repair costs. Also, substitutionof material or fasteners could ease the problem of a large inventory of spare parts. Care should be taken not to makechanges in design details that could adversely affect safety performance without verification of adequate performancethrough full-scale crash testing or other acceptable means.
The in-service evaluation guidelines are intended to encourage a more consistent and thorough implementationof new devices and to promote a more direct and systematic process in demonstrating the operational status of ,safetyfeatures.
A-34
82
APPENDIX B
SOIL SPECIFICATIONS
APPENDIX B
PART 1
STANDARD SOIL
Taken from Standard Specifications for Transportation Materials andMethods of Sampling and Testing. Copyright 1990. By the AmericanAssociation of State Highway and Transportation Officials. Reproducedwith permission.
APPENDIX B
PART 2
WEAK SOIL
Taken from Standard Specifications for Transportation Materials andMethods of Sampling and Testing. Copyright 1990. By the AmericanAssociation of State Highway and Transportation Officials. Reproducedwith permission.
APPENDIX B
PART 3
COMPACTION GUIDELINES
Taken from Guide Specifications for Highway Construction. Copyright1988. By the American Association of State Highway and TransportationOfficials. Reproduced with permission.
83
PART 1Standard Specification
for
Materials for Aggregate and Soil-Aggregate Subbase,Base and Surface Courses
AASHTO DESIGNATION: M 147-65 (1990)
1. SCOPE
1.1 This specification covers the quality andgrading of sand-clay mixtures; gravel, stone orslag screenings; or sand, crusher run coarseaggregate consisting of gravel, crushed stone orslag with or without soil mortar or anycombination of these materials for use in theconstruction of subbase, base and surfacecourses. The requirements are intended to coveronly materials having normal or averagespecific gravity, absorption and gradationcharacteristics. Where other materials are to beused, appropriate limits suitable to their usemust be specified.
2. GENERAL REQUIREMENTS
2.1 Coarse Aggregate:2.1.1 Coarse aggregate retained on the 2.00
mm (No. 10) sieve shall consist of hard, durableparticles or fragments of stone, gravel or slag.Materials that break up when alternately frozenand thawed or wetted and dried shall not beused.
2.1.2 Coarse aggregate shall have apercentage of wear, by the Los Angeles test,AASHTO T 96, of not more than 50.
NOTE 1-A higher or lower percentage of wearmay be specified by the Engineer, depending uponthe materials available for the work.
2.2 Fine Aggregate:
2.2.1 Fine aggregate passing the 2.00 mm(No. 10) sieve shall consist of natural or crushedsand, and fine mineral particles passing the0.075 mm (No. 200) sieve.2.2.2 The fraction passing the 0.075 mm sieveshall not be greater than two-thirds of thefraction passing the 0.425 mm (No. 40) sieve.The fraction passing the 0.425 mm sieve shallhave a liquid limit not greater than 25 and aplasticity index not greater than 6 2.3 All material shall be free from vegetablematter and lumps or balls of clay. The soil-aggregate material shall conform to the gradingrequirements of Table 1. The gradingrequirements for composite aggregate materialwill be specified by the Engineer.
3. SUBBASE MATERIALS
3.1 Materials for subbase shall conform to therequirements of sections 2 and 3 for gradings A,B, C, D, E, or E The type and grading desiredshall be specified.
NOTE 2-Where local experience has shown thatlower percentages passing the 0.075 (No. 200)sieve than are required in Table 1 are necessary forsubbase materials in order to prevent damage byfrost action, the Engineer should specify suchlower percentages.
4. BASE COURSE MATERIALS 4.1 Materials for base course shall conform to
the requirements of section 2 for gradings A, B,C, D, E, or F The grading desired shall bespecified.
NOTE 3-Where local experience has shownthat lower percentages passing the 0.075 mm(No. 200) sieve than are required in Table 1 arenecessary for base course materials in order toprevent damage by frost action, the Engineershould specify such lower percentages.
5. SURFACE COURSEMATERIALS
5.1 Materials for surface course shall conformto the requirements of sections 2 and 3 forgradings C, D, E, or F The gradings desiredshall be specified.
NOTE 4-Where it is planned that the soilaggregate surface course is to be maintained forseveral years without bituminous surface treatmentor other superimposed impervious surfacing, theEngineer should specify a minimum of 8 percentpassing 0.075 mm (No. 200) sieve in lieu of theminimum percentages shown in Table I for gradingC, D, or E, and should specify a maximum liquidlimit of 35 and plasticity index range of 4 to 9 inlieu of the limits given in 2.2.2.
6. MOISTURE CONTENT
6.1 All materials shall contain moisture equalto or slightly below the optimum necessary toinsure that the design density requirements areobtained when materials are compacted.
7. ADMIXTURE
7.1 Calcium chloride used for the control ofmoisture shall meet the requirements of
Standard Specifications for Calcium Chloride(AASHTO M 144).
8. METHODS OF SAMPLINGAND TESTING
8.1 Sampling and testing shall be inaccordance with the following standard methodsof the American Association of State Highwayand Transportation Officials:
Sampling T 2Sieve analysis T 27 or T 88Surveying and sampling soilsfor highway subgrades T 86Preparing samples T 87Liquid limit T 89Plastic limit and plasticity index T 90Percentage of wear T 96Passing 0.075 mm .. T 11
B-4
85
PART 2 Standard Specification
for
Fine Aggregate for Portland Cement Concrete
AASHTO DESIGNATION: M 6-87
1. SCOPE
1.1 This specification covers the quality andgrading of fine aggregate for port land cementconcrete used in pavements or basics, highwaybridges, and incidentalStructures. 1.2 Units of Measurement: 1.2.1 For sieve sizes and the size of aggregateas determined by the use of testing sieves, thevalues in inch-pound units are shown for theconvenience of the user; however, the standardsieve designation shown in parentheses is thestandard value as stated in AASHTO M 92. 1.2.2 For other units of measure, the valuesstated in inch-pound units are to be regarded asstandard.
2. REFERENCED DOCUMENTS
2.1 AASHTO Standards:M 80 Coarse Aggregate for
Portland CementConcrete
M 92 Wire Cloth Sieves forTesting Purposes
T 2 Sampling AggregatesT 11 Amount of Material Finer
Than 75-mu m Sieve inAggregate
T 21 Organic Impurities inFine Aggregate forConcrete
T 27 Sieve Analysis of Fineand Coarse Aggregates
T 71 Effect of Organic Impurities in Fine Aggregate on Strength of Mortar
T 103 Soundness of Aggregatesby Freezing and Thawing
T 104 Soundness of Aggregatesby Use of Sodium Sulfateor Magnesium Sulfate
T 112 Clay Lumps and Friable T 113 Lightweight Pieces in
Aggregate T 161 Resistance of Concrete to
Rapid Freezing and Thawing
3. ORDERING INFORMATION
3.1 The purchaser shall include thefollowing information in the purchase orderor contract when applicable: 3.1.1 Reference to this Specification,AASHTO M 6, and year of issue, 3.1.2 Grading requirements for No. 8 (2.36mu m) and No. 30 (600 mu m) sieves, whenrequired (5.1 and Note 1), 3.1.3 Whether the deleterious substanceslimits for Class A or Class B apply, andlimits on other deleterious substances (7.1and Note 3), 3.1.4 If the sulfate soundness requirementis waived (8.5), 3.1.5 In the case of the sulfate soundnesstest (8.1), which salt is to be used. If none isstated, either salt may be used. 3.1.6 If the supplementary requirement forreactive aggregates applies, (see S 1), and 3.1.7 Any exceptions or additions to thisspecification.
4. GENERAL REQUIREMENTS
4.1 Fine aggregate shall consist of naturalsand or manufactured sand or combinationsthereof, having hard, strong, durableparticles. 4.2 Fine aggregate from different sources ofsupply shall not be mixed or stored in thesame pile.
5. GRADING
5.1 Fine aggregate, when tested by meansof laboratory sieves, shall conformto the following requirements, except asprovided in 5.2 and 5.3:
NOTE 1-The purchaser or specifier may insertspecific values for percent passing the No. 8 andNo. 30 sieves to further control the grading ofthe material.
MassSieve Percent Passing
3/8 in. (9.5mm)
100
No. 4 (4.75mm)
95-100
No. 8 (2.36mm)
--
No. 16 (1.18mm)
45-80
No. 30 (600µm)
--
No. 50 (3(x)µm)
10-30
No. 100 (150µm)
2-10
5.2 The minimum percent shown above formaterial passing the No. 50 (300-µm) andNo. 100 (150-µm) sieves may be reduced to5 and 0, respectively, if the aggregate is to beused in air-entrained concrete containingmore than 400 lb of cement per cubic yard(237 kg/m3) or in nonair-entrained concretecontaining more than 500 lb of cement percubic yard (297 kg/m3) or if an approvedmineral admixture is used to supply thedeficiency in percent passing these sieves.Air-entrained concrete is here considered tobe concrete containing air-entraining cementor an airentraining agent and having an aircontent of more than 3%. 5.3 The fine aggregate shall have not morethan 45% passing any sieve and retained onthe next consecutive sieve of those shown in5. 1.
6. UNIFORMITY OF GRADING
6.1 The grading requirements given in 5.1represent the extreme limits which shalldetermine suitability for use from all sourcesof supply. The grading from any one sourceshall be reasonably uniform and not subjectto the extreme percentages
Particles in Aggregate
86
of grading specified above. For continuingshipments of fine aggregate from a givensource, the fineness modulus shall not varymore than 0.20 from the base fineness modulus.The base fineness modulus shall be that valuethat is typical of the source. If necessary, thebase fineness modulus may be changed whenapproved by the purchaser.
NOTE 2-The base fineness modulus should bedetermined from previous tests, or if no previoustests exist, from the average of the finenessmodulus values for the first ten samples (or allpreceding samples if less than ten) on the order.The proportioning of a concrete mixture may bedependent on the base fineness modulus of the fineaggregate to be used. Therefore, when it appearsthat the base fineness modulus is considerablydifferent from the value used in selectingproportions for the concrete mixture, a suitableadjustment in the mixture may be necessary.
7. DELETERIOUS SUBSTANCES
7.1 The amount of deleterious substancesshall not exceed the following limits (see tableentitled "Deleterious Substances Limits"):
NOTE 3-The purchaser or specifier, due toknowledge of the requirements of the work andthe constituents of locally available aggregate,should insert appropriate requirements whenneeded.
7.2 Organic Impurities: 7.2.1 Fine aggregate shall be free of injuriousamounts of organic impurities. Except as hereinprovided, aggregates subjected to the test fororganic impurities and producing a color darkerthan the standard shall be rejected. 7.2.2 A fine aggregate failing in the test maybe used, provided that the discoloration is dueprincipally to the presence of small quantities ofcoal, lignite, or similar discrete particles. 7.2.3 A fine aggregate failing in the test maybe used, provided that, when tested for the
effect of organic impurities on strength ofmortar, the relative strength at 7 days calculatedin accordance with AASHTO T 71 is not lessthan 95%.
8. SOUNDNESS
8.1 Except as provided in 8.2 through 8.5,fine aggregate subjected to five cycles of thesoundness test shall have a weighted averageloss not greater than 10% when sodiumsulfate is used or 15% when magnesiumsulfate is used. 8.2 Fine aggregate failing to meet therequirements of 8.1 may be accepted,provided that concrete of comparableproperties, made from similar aggregate fromthe same source, has given satisfactoryservice when exposed to weathering similarto that to be encountered. 8.3 Fine aggregate not having ademonstrable service record and failing tomeet the requirements of 8.1 may beaccepted, provided it gives satisfactoryresults in concrete subjected to freezing andthawing tests. (See AASHTO T 161.) 8.4 Fine aggregate failing to meet therequirements given in 8.1 may, at the optionof the purchaser or specifier, be subjected toan alternate freezing and thawing test ofunconfined aggregate and may be acceptedprovided it gives satisfactory results. NOTE 4-The purchaser or specifier shoulddetermine the details of the evaluation andcriteria for determining satisfactoryperformance in 8.2, 8.3, and 8.4. 8.5 The requirements for soundness givenin 8.1 may be waived in the case of aggregatefor use in structures or portions of structuresnot exposed to weathering.
9. METHODS OF SAMPLING AND TESTING
9.1 Sampling and testing of fine aggregate shall be in accordance with the following
methods of the American Association of StateHighway and Transportation Officials: 9.1.1 Sampling-T 29.1.2 Sieve analysis and fineness modulus-T279.1.3 Clay lumps and friable particles-T 112 9.1.4 Coal and Lignite-T 113, using a liquidof 2.0 specific gravity to remove the particlesof coal and lignite. Only material that isbrownish-black, or black, shall be consideredcoal or lignite. Coke shall not be classed ascoal or lignite. 9.1.5 Material finer than No. 200 (75-µm)-T11 9.1.6 Organic impurities-T 21 9.1.7 Effect of organic impurities onstrength-T 71 9.1.8 Sulfate soundness-T 1049.1.9 Soundness (unconfined freezing andthawing)-T 103 9.1.10 Freezing and thawing of concrete-T161
SUPPLEMENTARYREQUIREMENT
The following supplementary requirementapplies only when specifically stated in theorder or contract.
S1. REACTIVE AGGREGATE
S1.1 Fine aggregate for use in concrete thatwill be subject to wetting, extended exposure tohumid atmosphere, or contact with moist groundshall not contain any materials that aredeleteriously reactive with the alkalies in thecement in an amount sufficient to cause
excessive expansion of mortar or concrete,except that if such materials are present ininjurious amounts, the fine aggregate may beused with a cement containing less than 0.60%alkalies calculated as sodium oxide
equivalent (Na2O + 0.658K20) or with theaddition of a material that has been shown toprevent harmful expansion due to the alkali-aggregate reaction. (See Appendix X1 ofAASHTO M 80.)
87NOTE SI-This supplementary requirementwould normally be specified only in areas having ahistory of reactive aggregate, except for unusuallycritical structures, to save costs and delays due tounnecessary testing.
B-8
PART 3
CONSTRUCTION REQUIREMENTS
304.05 Placing. If the required compacted depth of the base course exceeds 6 inches, the base shall beconstructed in two or more layers of approximate equal thickness. The base material shall be laid bymeans of an approved mechanical spreader capable of placing the material to a uniform depth withoutsegregation. The maximum compacted thickness of any one layer
B-10
Section 300
shall not exceed 6 inches, except a single layer upon approval may be increased to a depth of 8inches when vibratory equipment or special compaction equipment is used.
304.07 Shaping and Compaction. The material shall be shaped to the required section and waterapplied or aerated as necessary to provide the optimum moisture content for compaction. Compactionshall continue until a density of not less than ..... percent (95 percent suggested) of the maximumdensity determined in accordance with AASHTO T 180 Method D has been achieved. The surfaceshall be maintained during the compaction operations in such a manner that a uniform texture isproduced and the aggregates firmly keyed. Water shall be uniformly applied over the base materialsduring compaction in the amount necessary for proper consolidation. In-place density will be determined in accordance with AASHTO T 191, T 205, or other approvedmethod. The use of AASHTO T 224 (alternative) to correct for oversize particles may be required.AASHTO T 238 may be used if the limitations of the method as cited in the appendix to the standardare fully recognized.
B-11
APPENDIX C
ELECTRONIC AND PHOTOGRAPHICINSTRUMENTATIONSPECIFICATIONS
Reprinted with permission from SAE J-211Copyright 1992 Society of Automotive Engineers, Inc.
This report is published by SAE to advance the state of technical andengineenng sciences. The use of this report is entirely voluntary and itsapplicability and suitablity for any particular use. including any patentinfringement arising therefrom. is the sole responsibility of the user.
PRINTED IN U S A.
Ø INSTRUMENTATION FOR IMPACT TEST
SCOPE:
This recommended practice outlines a series of performancerecommendations which concern the whole data channel. Theserecommendations are not subject to any variation and all of them should beadhered to by any agency conducting tests to this practice. However, themethod of demonstrating compliance with the recommendations is flexibleand can be adapted to suit the needs of the particular equipment theagency is using.
It is not intended that each recommendation be taken in a literal sense, asnecessitating a single test to demonstrate that the recommendation is met.Rather, it is intended that any agency proposing to conduct tests to thispractice should be able to demonstrate that if such a single test could beand were carried out, then their equipment would meet therecommendations. This demonstration should be undertaken on the basisof reasonable deductions from evidence in their possession, such as theresults of partial tests.
In some systems it may be necessary to divide the whole channel intosubsystems, for calibration and checking purposes. The recommendationshave been written only for the whole channel, as this is the sole route bywhich subsystem performances affect the quality of the output. If it isdifficult to measure the whole channel performance, which is usually thecase, the test agency may treat the channel as two or more convenientsubsystems. The whole channel performance could then be demonstratedon the basis of subsystem results, together with a rationale for combiningthe subsystem results together.
Part 1 of this recommended practice covers electronic instrumentation andPart 2 covers photographic instrumentation.
SAE Technical Board Rules provide that "This report is published by SAE to advance the state oftechnical and engineering sciences. The use of this report is entirely voluntary, and its applicabilityand suitability for any particular use, including any patent infringement arrising therefrom, is thesole responsibility of the user "
SAE reviews each technical report at least every five years at which time at may be reaffirmed,revised, or cancelled. SAE invites your written comments and suggestions.
Copyright 1988 Society of Automotive Engineers, Inc. Printed in U.S.A.All rights reserved
J211 SAE Page 2
PART 1 - ELECTRONIC INSTRUMENTATION
1. PURPOSE:
The purpose of this SAE Recommended Practice is to provideguidelines and recommendations for the techniques ofmeasurement used in impact tests. The aim is to achieve uniformityin instrumentation practice and in reporting test results. Use of thisrecommended practice will provide a basis for meaningfulcomparisons of test results from different sources.
2. FIELD OF APPLICATION:
The instrumentation as defined in this recommended practiceapplies in particular to impact tests for road vehicles, including testsof their sub-assemblies, and occupant surrogates.
3. DEFINITIONS:
The definitions in 3.5 to 3.14 apply to the whole data channel, asdefined in3.1.
3.1 Data Channel: All of the instrumentation from and including asingle transducer (or multiple transducers whose outputs arecombined in some specified way) up to and including any analysisprocedures that may alter the frequency content or the amplitudecontent or the timing of data. It also includes all cabling andinterconnections.
3.2 Transducer: The first device in a data channel, used to convert aphysical quantity to be measured into a second quantity (such as anelectrical voltage) which can be processed by the remainder of thechannel.
3.3 Full Scale: The maximum usable linear range of a data channel.
3.4 Data Channel Full Scale: That value of a data channel determinedby the component of the channel with the lowest full scale level.This is expressed in terms of the measured variable (input). Forexample, F.S.=50 G, 1000 N, 100 cm/s, etc.
3.5 Channel Amplitude Class, CAC: The designation for a data channelthat meets certain amplitude characteristics as specified by thisrecommended practice.
The CAC number is numerically equal to the upper limit of themeasurement range, (that is, equivalent to the data channel fullscale).
3.6 Characteristic Frequencies, Fh, F1, Fn: These frequencies aredefined in Fig. 1.
3.7 Channel Frequency Class, CFC: The channel frequency class isdesignated by a number indicating that the channel frequencyresponse lies within limits specified by Fig. 1.
This number and the value of the frequency Fh in Hz arenumerically equal.
Page 3 SAE J211
3.8 Calibration Value: The value measured and read during thecalibration of a data channel (see 4.6).
3.9 Sensitivity Coefficient: The slope of the straight line representingthe best fit to the calibration values determined by the method ofleast squares within the channel amplitude class.
3.10 Calibration Factor of a Data Channel: The arithmetic mean of thesensitivity coefficients evaluated over frequencies which areevenly spaced on a logarithmic scale between Fl and Fh/2.5.
3.11 Linearity Error: The ratio, in percent, of the maximum differencebetween the calibration value and the corresponding value read onthe straight line defined in 3.9 at the upper limit of the channelamplitude class (data channel full scale).
3.12 Sensitivity: The ratio of the output signal (in equivalent physicalunits) to the input signal (physical excitation), when an excitation isapplied to the transducer. (Example: 10.24 mV/G/V for a straingage accelerometer.)
3.13 Phase Delay Time: The phase delay time of a data channel isequal to the phase delay (in radians) of a sinusoidal signal,divided by the angular frequency of that signal (in radians persecond).
3.14 Environment: The aggregate, at a given moment, of all externalconditions and influences to which the data channel is subjected.
3.15 Transverse Sensitivity (of a rectilinear transducer): The sensitivityto excitation in a nominal direction perpendicular to its sensitiveaxis.
Note: The transverse sensitivity is usually a function of the nominaldirection of the axis chosen.
3.16 Transverse Sensitivity Ratio (of a rectilinear transducer): The ratioof the transverse sensitivity to its sensitivity along its sensitive axis.
4. DATA CHANNEL PERFORMANCE REQUIREMENTS:
4.1 Linearity Error: The absolute value of the linearity error of a datachannel at any frequency in the CFC, shall be less than or equal to2.5% of the value of the CAC, through the whole measurementrange. In general a sufficient number of measurements should becarried out in order to ensure the linearity in the range of interest,that is, between Fl and Fh. For a transducer, linearity at DC issufficient.
4.2 Amplitude Against Frequency: The frequency response of a datachannel shall lie within the limiting curves given in Fig. 1. The zerodB line is defined by the calibration factor.
J211 SAE Page 4
4.3 Phase Delay Time: The phase delay time between the input andthe output of a data channel shall be determined, and shall not varymore than 1/(lO*Fh) seconds between 0.03*Fh and Fh. Thisincludes the transducer, that is the input is the excitation to thetransducer.
4.4 Time:
4.4.1 Time Base: A time base shall give at least 1/100 secondresolution with an error of less than 1/10000 seconds.
4.4.2 Relative Time Delay: The relative time delay between the signalsof two or more data channels regardless of their frequency class,must not exceed 1 millisecond excluding phase delay caused byphase shift. Two or more data channels of which the signals arecombined shall have the same frequency class and shall not havea relative time delay greater than l/(10*Fh) seconds.
This requirement applies to analog-signals as well assynchronization pulses and digital signals.
4.5 Transducer Transverse Sensitivity Ratio: The transverse sensitivityratio of all transducers shall be less than 5% in any direction.
4.6 Calibration: Values in this section apply to reference equipment or"standards" against which a data channel is "calibrated", that is, itsperformance is determined.
4.6.1 General: A data channel shall be calibrated at least once a yearagainst reference equipment traceable to known standards. Themethods used to carry out a comparison with reference equipmentshall not introduce an error greater than 1% of the CAC. The use ofthe reference equipment is limited to the range of frequencies forwhich they have been calibrated.
Subsystems of a data channel may be evaluated individually and theresults factored into the accuracy of the total data channel. This canbe accomplished for example by an electrical signal of knownamplitude simulating the output signal of the transducer whichallows a check to be made on the gain of the data channel, exceptthe transducer.
4.6.2 Accuracy of Reference Equipment for Calibration: The accuracyof the reference equipment shall be certified or endorsed by anapproved metrology service (for example, traceable to theNational Bureau of Standards).
4.6.2.1 Static Calibration:
4.6.2.1.1 Accelerations: The error shall be less than 1.5% of thechannel amplitude class.
4.6.2.1.2 Forces: The error shall be less than 1% of the channelamplitude class.
Page 5 SAE J211
4.6.2.1.3 Displacements: The error shall be less than 1% of the channelamplitude class.
4.6.2.2 Dynamic Calibration:
4.6.2.2.1 Accelerations: The error in the reference accelerationsexpressed as a percentage of the channel amplitude classshall be less than 1.5% below 400 Hz, less than 2% between400 and 900 Hz, and less than 2.5% between 900 Hz and themaximum frequency at which the reference acceleration isutilized (see 4.6.4).
4.6.2.2.2 Forces and Displacements: (No method for the evaluation ofthe dynamic response during calibration of data channels forforces and displacements is included since no satisfactorymethod is known at present.)
4.6.2.3 Time: The error in the reference time shall be less than0.00001 seconds.
4.6.3 Sensitivity Coefficient and Linearity Error: The sensitivitycoefficient and the linearity error shall be determined bymeasuring the output signal of the data channel against a knowninput signal, for various values of this signal. (The input signal isreferenced to well known physical data, that is, a load oracceleration, but not voltage.)
The calibration of the data channel shall cover the whole range ofthe amplitude class. (This is between Fl and Fh/2.5.)
For bi-directional channels, both the positive and negative valuesshall be evaluated.
If the calibration equipment cannot produce the required input,due to excessively high values of the quantity to be measured,calibrations shall be carried out within the limits of thesecalibration standards and these limits shall be recorded in thereport.
A total data channel shall be calibrated at a frequency or at aspectrum of frequencies with its significant values comprisedbetween Fl and Fh/2.5.
4.6.4 Calibration of the Frequency Response: The response curves ofphase and amplitude against frequency for the data channel shallbe determined by measuring the output signals of the datachannel in terms of phase and amplitude against a known inputsignal, for various values of this signal varying between Fl and 10times the CFC or 3000 Hz whichever is the lower value.
4.7 Environmental Effects: The presence of any environmental effectsshall be checked (that is, electric or magnetic flux, cable velocity,etc.). This can be done for instance by recording the output of sparechannels equipped with dummy transducers.
If an output signal is greater than 2% of the expected data peakvalue, corrective action shall be taken, for instance re-allocation orreplacement of cables.
J211 SAE Page 6
4.8 Choice and Designation of the Data Channel: The CAC and CFCdefine a data channel.
A data channel consistent with the specifications of thisrecommended practice shall be designated according to thefollowing codes:
SAE J211 XXXXX - (number of this recommended practice)CAC ... - (channel amplitude class)CFC ... - (channel frequency class)
If the calibration of the amplitude or frequency response does notcover the complete CAC or CFC owing to limited properties of thecalibration equipment, then the CAC or CFC shall be marked withan asterisk.
Example, SAE J211 XXXXCAC* 200 m/s2
CFC 1000 Hz
means that:
-this measurement has been carried out according to thisrecommended practice:
-the channel amplitude class was 200 m/s2;
-the channel frequency class was 1000 Hz;
-the calibration of the amplitude response did not cover thecomplete CAC.
The test report shall indicate the calibration limits.
5. DATA CHANNEL SELECTION:
The selection of a frequency response class is dependent uponmany considerations, some of which may be unique to a particulartest. The ultimate usage of the data and good engineering judgmentwill determine what portions of the frequency spectrum aresignificant or useful. The various classes of frequency response inFig. 1 are intended to permit appropriate choices for differentengineering requirements.
It is important to note that valid comparisons using differentfrequency response classes may be difficult to make. It is useful toestablish specific frequency response classes when comparing testresults from different sources. The frequency response classes inTable 1 are recommended for that purpose. Theserecommendations reflect current practices and equipment. However,it is recognized that other considerations (for example,biomechanics) may impose special instrumentation requirements.
Page 7 SAE J211
5. DATA CHANNEL SELECTION: (continued)
The channel class recommendations for a particular application should notbe considered to imply that all the frequencies passed by that channel aresignificant for the application. In several cases, such as occupant headaccelerations, headform accelerations, and femur force, therecommendation may be higher than necessary, but current biomechanicalknowledge will not permit a closer specification. All data is to be gatheredat class lOO0 or higher, for any purpose.
J211 SAE Page 8
5. DATA CHANNEL SELECTION: (continued)
#Filtering can cause appreciable time lag (for example,approximately 2.5 mswith class 60 channel). These effects should be considered whencomparing film and electronic data, or when performing integration.
1. When overall acceleration of the frame or body in a givendirection is desired and a higher frequency response class isused, readability of the data may be improved by averagingoutputs of two or more transducers at different locations prior torecording of the output.
2. References are listed in Section A.4.
3. These classifications are needed to calculate head impactforces based n neck forces and head accelerations when usingthe Hybrid III crash test dummy.
4. No rationale for this classification. By default, class 1000 waschosen.
6. MOUNTING OF TRANSDUCERS:
Mechanical resonances associated with transducer mounting shouldnot distort readout data.
Transducers should be mounted on dummies using a supportspecially provided for this purpose. In cases where properties ofnon-mechanical test subjects preclude rigid transducer mounting, ananalytical or experimental evaluation of mounting effects on the datashould be provided.
Acceleration transducers, in particular, should be mounted in such away that the initial angle of the actual measurement axis to thecorresponding axis of the reference axis system is not greater than5 deg unless analytical or experimental assessment of the effect ofthe mounting on the collected data is made. When multi-axialaccelerations at a point are to be measured, each accelerationtransducer axis should pass within 10 mm of that point, and thecenter of seismic mass of each accelerometer should be within 30mm of that point.
7. SIGN CONVENTION:
A standardized coordinate system and axes designation for majorbody segments of dummies or other test surrogates as well as fortest vehicles and sleds is needed throughout the crash testingcommunity. The results of computer modeling and biomechanicalresearch have been hard to interrelate with test results due todifferent coordinate and sign conventions.
The sign convention for dummies and other test surrogates shouldbe consistent with Fig. 2 for applicable instrumentation. Table 2provides a method for determining positive output from dummytransducers when a force is applied to its various body segments.
Page 9 SAE J211TABLE 2
The directions are defined in relation to a seated dummy
(1) Chest is normally compressed for negative output.
For vehicles and sleds the positive X-axis should be in the normalforward motion direction of the vehicle or sled. The positive Z-axis shouldbe vertically downward (+G) and, following the right hand rule, thepositive Y-axis should be towards the right.
Inertial coordinate systems should be chosen with positive Z-axisvertically downward (+G) and the positive Y-axis toward the right from thechosenX-axis. The directional reference of the X-axis should be reported.
8. RECORDING:
8.1 Analogue Magnetic Recorder: Tape speed should be stable towithin less than 0.5% of the tape speed used. The signal-to-noise ratio of the recorder should not be less than 42 dB at themaximum tape speed.
The total harmonic distortion should be less than 3% and thelinearity error should be less than 1% of the measurement range.
It is suggested that standard tape speeds be used: 15/16, 1 7/8, 33/4, 1.5, 15, 30, 60, 120 ips. Conformance to Inter-RangeInstrumentation Group (IRIG) specifications is desirable.
J211 SAE Page 10
8.2 Digital Magnetic Recorder: Tape speed should be stable to withinless than 10% of the tape speed used. It is suggested that standardtape speeds be used: 75 or 100 ips. Tapes should be 0.5 in wideand recorded at standard 800, 1600 or 6250 bpi on 7 or 9 trackformats.
8.3 Paper Tape Recorder: In the case of direct data recording, the paperspeed in millimeters per second should be at least 1.5 times thenumber expressing Fh in Hz.
In other cases, the paper speed should be such that an equivalentresolution should be obtained.
9.. DIGITAL DATA PROCESSING:
This section establishes guidelines for digital data processingequipment used by crash testing agencies.
9.1 Presample Filtering: Filtering corresponding to the frequencies ofthe data channel class may be carried out during processing ofdata.
However, before recording, analog filtering at a higher level thanCFC-1O00 should take place in order to use at least 50% of thedynamic range of the recorder and to reduce the risk of highfrequencies saturating the recorder. Since crash test data mayhave high-frequency components above the channel class Fh,presample filtering should be used to keep these components fromcausing aliasing errors in the sampling process. The user iscautioned to examine the unfiltered data for signal overloads,since the filtering process can mask certain overload conditions.Since Class 1000 data is generally the highest frequency datarequired in crash testing, many laboratories set the presample filterto Class 1000 and use digital filtering for lower classes. Digitalfiltering should only be done once per data channel; that is, do notdigital filter a digitally filtered signal.
The maximum error induced by aliasing at the Fh frequency shallnot exceed 0.1% of the CAC.
9.2 Sampling Rate: The minimum acceptable sampling rate is afunction of many variables, particularly sophistication of thereconstruction method used in the processing software. For thoseinstallations utilizing only simple reconstruction software, thesample rate should be a minimum of eight times the Fh. Ininstallations with Class lO00 presample filters, this corresponds toa minimum sampling rate of approximately 8000 samples persecond per channel. In the case of analog recording, when therecording and playback speeds are different, the samplingfrequency can be divided by the speed ratio.
9.3 Resolution: Digital word lengths of at least 10 bits (including sign)should be used to be assured of reasonable accuracy inprocessing. In those systems in which the dynamic range of thedata is less than 5U% of the A/D converter full-scale, a higherresolution may be required. The least significant bit shouldcorrespond to approximately 0.2% of the CAC.
Page 11 SAE J211
9.4 Data Processing: Processing software is typically used to scaleand filter data, determine zero levels, perform mathematicaloperations and prepare data plot formats.
9.4.1 Digital Filtering: Filtering may be either phase-shifting orphaseless. Phase-shifting filters will cause time offsets andphaseless filters will cause time uncertainty; either of which willcause problems in comparing data to film, and comparing data todata if the class filters are different. Filtering should precede allnon-linear operations, such as calculation of resultant vectors andinjury indices. Any filtering algorithm can be used as long as theresults conform to the data channel performance requirements asgiven in Section 4. The type of digital filter used should bereported.
9.4.2 Scaling and Zeroing: Software should be used to determine zerolevels and calibration factors rather than relying on set gains andexpecting no zero drift. Zero offset errors in orthogonalcomponents cause comparable errors in resultant computationthat are often difficult to detect.
9.4.3 Injury Index Calculations: Injury index calculations should use allsampled data points. Head Injury Criterion calculations should useall data points for the integration. However, the maximizing timeintervals need be no more precise than 1 ms.
10. TIMING MARKS:
Timing marks are essential in data analysis and correlation ofhigh-speed film to other data channels. Timing frequency errorshould be less than 1% of the chosen or designated frequency.Timing synchronization should be within +/-1 ms.
11. TIME OF CONTACT:
Time of initial contact (real or simulated) should be known within+/- 1 ms and can be accomplished by recording a switch actuatedby the impact or by observing the instant the test accelerationexceeds a predetermined value (for example, 0.5 G). It should alsobe recorded in film data through strobe lights or timing markchannels.
12. PRESENTATION OF RESULTS:
In reporting results of tests, the following information should beprovided with data tabulations, time history traces, etc.:
(a) The data channel designations.(b) Description of designated reference points and locations of
vehicle accelerations.(c) Transducer mounting analysis, if required by Section 6.(d) Type of digital filter used.(e) Method of combining sub-systems for calibration.(f) Inertial coordinate system definition.
J211 SAE Page 12
12. PRESENTATION OF RESULTS: (continued)
The results should be presented on A4 (210 x 297 mm) size paper(ISO 216) or 8.5 x 11 n paper. Results presented as diagramsshould have axes scaled with one measurement unit correspondingto a suitable multiple of the chosen unit (for example 1, 2, 5, 10, 20millimeters). SI units shall be used, except for vehicle velocity wherekm/h may be used and for accelerations due to an impact where Gmay be used (with G = 9.81 m/s/s).
Page 13 SAE J211
ANNEX TO PART 1 - SPECIFIC MEASUREMENTS
A.1 Impact Velocity: This can be calculated by measuring the timerequired to traverse a known distance prior to impact. Determinationof impact velocity should be with an error of less than 1% of theactual velocity.
A.2 Test Specimen Crush:
A.2.1 Residual Crush: Residual crush is specified by one or moresingle-valued data points, with respect to a designated referencepoints. Determination of residual crush should be with an error ofless than 5% of the actual crush.
A.2.2 Dynamic Crush: Maximum dynamic crush is a measurement ofthe maximum deformation of the test specimen during the impact.This is also measured with respect to one or more designatedreference points. Contingent on the size of the specimen and themagnitude of the expected dynamic crush, the following arepossible measurement methods:
(a) High-speed motion picture photography.(b) Double integration of acceleration data.(c) Use of a specific displacement transducer.
The error should be less than 5% of the actual crush.
A.3 Steering Column Displacement: Displacements relative todesignated reference points on the vehicle can be measured byvarious techniques. The coordinate system in which displacementis measured should be indicated. Determination of steering columndisplacement should be accurate to +/-0.5 in (+/-1.27 cm).
A.4 References: Information pertaining to the justification of some ofthe specified filter frequency classes is contained in the minutes ofthe SAE Safety Test Instrumentation Subcommittee meetings heldon April 16, September 24, and November 21, 1986.
J211 SAE Page 14
PART 2 - PHOTOGRAPHIC INSTRUMENTATION
1. SCOPE:
The purpose of this recommended practice is to define criteria ofperformance for an optical data channel when numerical time andspace data are taken from the images to analyze impact test results.
The requirements are to facilitate comparison between resultsobtained by different laboratories.
2. DEFINITIONS:
2.1 Optical Data Channel: A system composed of an image takingdevice (for example, camera and lenses), a recording medium forthese images (film, disc, magnetic tape . . .), an optical path (forexample, fiber optic cable) and a system for analyzing the imagesincluding any analysis procedure that may modify the content of thedata.
2.2 Distortion Index: The distortion index is a quality parameter of theoptical data channel.
2.3 Analysis System: An analysis system is composed of a system formeasuring and collecting the coordinates of image points as afunction of time.
2.4 Time Base System: A device to enable the determination of the timeinterval elapsed between any two recorded events.
2.5 Time Origin Identification Device: A device for identifying the instantchosen as the time origin, usually the beginning of the impact.
2.6 Imaging Rate: This is the frequency of renewal of information for agiven point expressed in renewals per second or in images persecond when all the points of the image are renewedsimultaneously.
3. PERFORMANCES:
The performances of the optical data channel should be evaluatedinitially to establish performance levels and repeated whenever thesystem is modified to an extent which could cause a change inaccuracy.
The following measures of performance may be evaluated as detailedin the annex or in an equivalent manner.
3.1 Optical Performance: The optical performance is determined byanalyzing the variation of apparent length of 40 diameters accordingto the annex.
3.1.1 Distortion Index: The distortion index is assessed by using thephotographic target and procedure described in the annex. Itshall be evaluated as detailed in the annex and shall not exceed1%.
Page 15 SAE J211
3.2 Time Base: A time base is required. It shall permit thedetermination of the time between recorded events with an error ofless than the reciprocal of the imaging rate or 1% of the actual time,whichever is greater
3.3 Time Origin Identificaton Device: The accuracy of the device shallbe equal to the value expressed in s of the inverse of the imagingrate.
3.4 Imaging Rate: The imaging rate shall be left to the user's initiative,taking account of the following main three factors:
- the goal to be attained- the limitations due to the equipment, (blur, etc...)- the need to combine data from several image taking devices and
rom electronic recordings of the impact test.
The user's choice shall be guided by the distance the recordedpoint moves between two analyzed images. This distance shouldnot exceed the accuracy required for its positional determination.
3.5 Length Reference: A length calibration shall be performed whichpermits the determination of lengths within any requirements theremay be on their accuracies.
In lieu of such requirements it is recommended to be able to performlength determinations with an error of less than 1% of the diagonalof the picture.
J211 SAE Page 16
ANNEX TO PART 2
Recommended procedure for determining the optical performance of anoptical data channel.
A.1 Test Equipment: A rectangular target having dimensions inconformity with Fig. 3 shall be used.
This target shall be divided into four parts by joining the centerpoints of two opposite sides. In each quadrant thus obtained and atthe target center, circles 400 +/- 1 mm in diameter shall be drawn.
The five circles shall be marked on their circumference with sixteenequally spacedreference marks, thus defining eight diameters for each, and henceforty diameters for the whole target.
A.2 Test Procedure: The target shall be exposed "full frame" by thecamera forming one of the elements of the data channel to betested.
The film or tape to be used for calibration shall be of the same typeand quality as that used for impact testing. It shall be analyzed usingthe analysis system.
The coordinates of the marks of a diameter, dij, must be measuredon the same frame while the coordinates of the marks of differentdiameters must be measured on consecutive analyzed images.
For each circle, j, j=l to 5, label the 16 marks, i, i=l to 16,consecutively around a circle. Then the forty diameters (dij) shall bemeasured as
The mean diameter (D) and the standard deviation (S) shall becalculated taking the 40 diameter values (dij) into account:
The distortion index is equal to the ratio (S/D) of the standarddeviation (S) to the mean diameter (D).
Page 17 SAE J211
A.3 Alternate Procedure: Other targets with different sizes or patterns ofreference marks may be used, in which case the user has todetermine the distortion index in an indirect way.
There is then also a need to show that the indirect method gives aresult equivalent to the use of the pattern specified in this annex.
This may be of advantage when for instance a target with arectangular pattern of reference marks is employed for thedetermination of lens corrections, which are needed in case of somewide angle lenses.
The phi (∅) symbol is for the convenience of the user in locating areaswhere technical revisions have been made to the previous issue of thereport. If the symbol is next to the report title, it indicates a completerevision of the report.
J211
J211 OCT 88
RATIONALE:
Not applicable.
RELATIONSHIP OF SAE STANDARD TO ISO STANDARD:
Not applicable.
REFERENCE SECTION:
Not applicable.
APPLICATION:
The purpose of this SAE Recommended Practice is to provide guidelinesand recommendations for the techniques of measurement used in impacttests. The aim is to achieve uniformity in instrumentation practice and nreporting test results. Use of this recommended practice will provide abasis for meaningful comparisons of test results from different sources.
COMMITTEE COMPOSITION:
T. Nielsen, General Motors Corp., Milford, MI - ChairmanD. Alianello, Amgerst, NYS. M. Backaitis, Nat’l. Hwy. Traffic Safety Admin., Washington, DCP. C. Begman, rosse Pte. Wds., MIP. G. Fouts, Chrysler Corp., Chelsea, MIT. R. Hayek, Chrysler Provin Ground, Chelsea, MIR. J. Howell, Farmington Hills, MIR. Malo, Transport Canada, Quebec, Canada
SPONSORED BY THE SAE MOTOR VEHICLE SAFETY SYSTEMSTESTING COMMITTEE:
H. J. Mertz, GMC Warren, MI - ChairmanR. P. Daniel, Dearborn, MID. B. Johnson, Southern Methodist University, Dallas, TXW. D. Nelson, Howell, MIT. Nielsen, General Motors Corp., Milford, MIA. Thebert, Engineering Research Analysis, Utica, MI
APPENDIX D
ANALYTICAL AND EXPERIMENTAL TOOLS
Design, synthesis, and development of a new safety feature is not a straightforward procedure but is an iterativeprocess requiring tradeoffs among sometimes conflicting safety performance requirements, environmentalconsiderations, and costs. In this appendix, analytical and experimental tools (excluding full-scale crash tests) that aretypically used in developing and evaluating new safety features are presented and discussed. Also, application andlimitations of these techniques are presented.
D1 Useful Techniques
D1.1 Structural Design
The primary design objective of longitudinal barriers and crash cushions is the safety performance with errantvehicles, but there are other design considerations pertaining to economy, environment, maintenance, and operationalneeds.
On the other hand, safety performance during vehicle collision is not the reason for installing supports for signsand luminaires. If lighting or information for the motorist is not needed, the installation should not be located on theroadside. Hence, the primary design objective is to support the luminaire or sign blank for environmental loading, andsafety performance is a secondary objective. Fortunately, engineers have been able to develop breakaway andyielding supports that will satisfy both the primary and secondary objectives.
Structural loading and design procedures are contained in civil engineering textbooks, AASHTO design manuals,and research publications. Primary references are given in Table D-l for each type of safety feature. Thedesigner/developer should consult these references as a first step along with the appropriate safety featuremanufacturer. These references will aid the developer in estimating design loads and proportioning a new design forsubsequent evaluation steps.
1.2 Static Tests
During an early stage of development, certain critical details and connections of a safety feature may requirestrength/deflection evaluation. Safety features are often designed to function at or near ultimate capacity of thematerials. Since the materials will be loaded well beyond typical design ranges such as elastic limits, these tests areoften very specialized and do not conform to standard tests suggested by ASTM.
Most static tests will have one of the following objectives:
* Demonstrate safety feature performance under simulated environmental loading.* Evaluate ultimate strength of critical connections.* Develop load/deflection properties for subsequent computer model simulations.
D-l
D-2
Static testing is often used to compare the performance of competing design details. When such tests are used toevaluate safety feature components that must perform under dynamic loading, developers should be aware of themany problems that can arise from material load rate sensitivity. A primary concern in the design of many roadsidesafety features is the energy absorbed as a component fails. Static testing generally allows a component to fail at thelowest possible load. However, the lowest failure load often will not correspond to the lowest energy failure mode.For example, wood posts embedded in soil seldom fracture under static loading and energy dissipation is usually highas the post rotates in the soil. Under dynamic loading, soils can generate much higher loadings and a wood post canfracture prematurely with little energy dissipation.
In general it is anticipated that quality control of materials used in the operational system may vary extensively.Where possible, safety performance behavior should not rely heavily on material properties that cannot be carefullycontrolled. For instance, energy to fragment a frangible transformer base can vary more than 100 percent with evenminor changes in heat treatment of the aluminum alloy. Soil conditions can exhibit even wider seasonal variations asa soil goes through saturated, dry, and frozen situations. In contrast, tensile strength and elastic modulus of wire ropevary within a narrow performance band.
Even at this stage the developer should be aware of value engineering by avoiding overspecifying materials,especially components that are noncritical. Moreover, he should ensure that materials used in the prototypes aretypical and routinely acquired materials and not "Sunday samples." Where possible, the developer should use standardhardware elements for initial economy and to minimize costs associated with inventory maintenance (31).
D1.3 Computer Simulations
A number of computer programs have been developed that simulate vehicle dynamics and kinematics duringinteractions with highway safety features. Also, several models have been developed to simulate occupant dynamicsduring impact. These models vary in complexity of mathematical analog, type of safety feature investigated, and classof vehicle. Simulation results are sensitive to vehicle parameters that are sometimes difficult to obtain or approximate.Vehicle moments of inertia, crush properties, and suspension stiffness properties are generally not published and mustbe determined experimentally. Moreover, barriers often exhibit large deflections that are difficult to predict because ofuncontrolled features such as joint slack, soil variation, and unstable structural behavior.
Most of the available simulation programs have been correlated to some degree with crash tests. For thevalidated cases, simulation results can be most helpful to the safety feature designer by providing sometimes uniqueinsight into the collision event. Where the program has been validated for multiple impact conditions, it can be usedwith some confidence in investigating conditions that are bracketed by the validated conditions. Althoughinvestigation of impact conditions outside the validated range can provide some insight, the engineer should use carein these extrapolations and view the findings with caution. The most important simulation programs are given inTable D-2 and are described below.
D-3
HVOSM - The Highway Vehicle Object Simulation Program (HVOSM) (6,7) is a very sophisticated and widelyused vehicle handling model. HVOSM incorporates an 11 degree of freedom (DOF) vehicle model with relativelysophisticated suspension and tire models. This program has been extensively validated against a wide variety of crashtests involving many different terrain configurations. The program has demonstrated validity for modeling vehicletraversals of ditches, driveways, and a variety of roadside slopes. HVOSM is especially suited for evaluation ofroadway and roadside geometrics where vehicle stability is a primary concern.
This program has also been successfully used for simulating rigid barrier impacts (7). This version of theprogram incorporates a relatively sophisticated sheet metal crush model and barrier/vehicle interaction routines.However, the program continues to be limited by its thin disk tire model and an inability to adequately predict ormodel suspension and wheel damage. Nonetheless, HVOSM is the best available model for simulating rigid barrierimpacts.
Barrier VII - Barrier VII program (49) is a widely used model for simulating impacts with flexible barriers. Thisprogram incorporates a beam and column finite element model (FEM) of the barrier and a two-dimensional vehiclemodel. The FEM code incorporates both geometric and material nonlinearities as well as a number of specializedbarrier elements including nonlinear springs and dashpots. Although the vehicle model incorporates relatively simplebilinear spring elements and is limited to three degrees of freedom (DOF), this program has been successfully validatedfor a wide variety of flexible barriers and a number of different vehicles. The primary limitation of this program is thatit cannot be used to predict vehicle stability. However, the program is especially suited for use as a tool for barrierdesign in predicting maximum loads on and strains in barrier components. Further, the program has proven useful foridentification of critical impact locations as well as predicting vehicle snagging and pocketing.
GUARD - The GUARD program (50) utilizes a three dimensional finite element barrier model and a 6 DOFvehicle model. The finite element barrier model incorporates both translational and rotational degrees of freedom forall elements. Although this feature makes the program versatile and should improve accuracy for many structures, thelow rotational stiffnesses of many barrier elements, such as W-beam guardrail, tend to destabilize the solution routine.As a result, this program is very difficult to use and has not been adequately validated for very many barriers or impactconditions. The program is also severely handicapped by the limited number of barrier nodes and elements that can beaccommodated. GUARD's sheet metal crush model incorporates deformable panels that interact with predescribedlines on the barrier surface. Special care must be taken when describing panel surfaces to make sure that panel contactlines are properly positioned relative to barrier contact lines. Further, GUARD's suspension and tire models arerelatively crude and severely limit the program's usefulness for modeling safety-shaped barrier impacts.
GUARD has yet to be adequately validated for any general class of simulations. Although the program isostensibly capable of simulating impacts with virtually any barrier, it is best suited for relatively strong beam barrierswhere torsional stiffnesses are high. This program is not recommended for the inexperienced user and evenexperienced users should view simulation findings with extreme caution.
D-5
NARD - The Numerical Analysis for Roadside Design (NARD) program (51) has evolved from GUARD. Theprogram is designed to be both a handling and impact model and can simulate a variety of vehicles including passengercars, single unit trucks, and combination trucks with as many as three trailers. The program is also capable ofsimulating impacts with a variety of roadside objects including breakaway devices and crash cushions as well aslongitudinal barriers. Unfortunately, NARD incorporates the same basic program structure as the GUARD programfrom which it evolved. As a result, NARD suffers from virtually all of the same problems as GUARD. Nard doesincorporate a relatively sophisticated suspension and tire model similar to HVOSM that should allow it to simulatesafety-shaped barrier impacts.
Like GUARD, the NARD program is both unvalidated and very difficult to use. After proper validation, theprogram should offer a reasonably accurate handling model for automobiles and trucks. However, an extensive effort isrequired before the program can be considered to be validated for barrier impacts. Users are cautioned against usingNARD without proper validation.
SMAC - The Simulation Model for Automobile Collisions (SMAC) (52) is a two dimensional program formodeling two car collisions. The vehicles are modeled as uniformly crushable blocks with linear stiffness coefficients.Although this program was designed as a tool for reconstructing traffic accidents, the program has proven to be quiteuseful for analyzing impacts with crash cushions and barrier end treatments. For this purpose a roadside object can bemodeled as one of the two vehicles. The program has been shown to be capable of predicting the extent of vehiclecrush and planar rotations during impacts with guardrail terminals and roadside poles. The gross vehicle modelincorporated by the program and problems associated with modeling roadside objects as a vehicle are significantlimitations of this program. Nonetheless, SMAC can be a useful design tool that merits further consideration.
D1.4 Laboratory Dynamic Tests
In addition to full-scale crash tests procedures presented elsewhere in this report, there are four types of dynamictest methods to evaluate and study safety features: gravitational pendulum, drop mass/dynamic test device, scalemodel, bogie vehicle.
D1.5 Gravitational Pendulum
The facility is characterized by a striking mass that swings in a circular arc suspended by cables or by rigid armsfrom a main frame. The specimen is generally mounted in an upright manner. Mass velocity at impact is governed bythe formula
subject to minor corrections due to friction and aerodynamic losses, where h is the drop height of the mass. As anexample, for an impact speed of 35 km/h (9.7 m/s), a drop height of 4.8 m is required. The swing radius is usuallyconsiderably larger than the drop height. Gravitational pendulums are commonly used to evaluate performance atimpact speeds of
D-6
approximately 40 km/h or less. A gravitational pendulum capable of high speed impacts would be very large andunwieldy.
A primary problem associated with this type of testing is the type of impact surface or crushable nose used on thependulum. A rigid nose greatly increases the impact forces applied to the pendulum while reducing the energydissipation during the test. An excessively soft nose will minimize impact forces and maximize energy dissipationassociated with the tested feature. Although simulated soft noses have been developed for subcompact and minisizevehicles (2,30), these devices were developed to simulate vehicle models that are well over 10 years old. Nose assemblysystems must be revalidated periodically if pendulum testing is to yield accurate predictions of safety featureperformance during full-scale testing.
Pendulum testing is frequently used to evaluate the performance of breakaway structures such as luminaire andsign supports. Such systems often absorb more impact energy during low speed crashes than during high speed impacts.As a result, pendulums are an inexpensive method for evaluating the low-speed performance of prototype designalternatives. Some breakaway systems have been placed into service based solely on pendulum testing. As discussed inSection 2.4.1.2, the acceptance of safety features based on such testing is left to the discretion of the user agency.
Pendulums can also be used for dynamic testing of various safety feature components. For example, pendulumsare often used for dynamic testing of barrier posts embedded in soil and crash cushion attenuator elements. This type oftesting is not sensitive to the design of the pendulum's crushable nose and can yield valuable information with a rigidimpact surface.
D1.6 Drop Mass/Dynamic Test Device
These facilities generally involve a rigid striking mass or plate that strikes a test specimen at prescribedvelocities. Drop mass devices can be used to test large components and assemblies under low-speed dynamicconditions. Dynamic test devices are not limited to low test speeds, but specimen sizes are generally very limited. As aresult, these devices are limited to tests of scale models or relatively small components of a safety feature. Althoughthese test methods have proven to be quite valuable, developers should be aware of the problems associated with bothtest methods. Low test speeds associated with drop test facilities can lead to the same strain rate sensitivities associatedwith static testing. Further, since dynamic testing devices accelerate and decelerate the impact plate over relatively shortdistances, the velocity of the strike plate can vary significantly during the test event. In this case, strain rate sensitivitiescan make test results virtually useless since the test velocity is no longer constant.
D1.7 Scale Model
Scale model testing involves constructing models of safety features and test vehicles to a reduced scale. Thecomplexity of modeling automobile sheet metal crush, tire-pavement interaction, and suspension behavior has limitedthe application of these procedures for development of most roadside safety features. However, scale modeling can beuseful during the development phases of safety features where most vehicle properties are of secondary importance,such as impact attenuation devices (73). This technique may yield useful
D-7
information about the gross motion of a vehicle during impact with selected safety features. Uncertainties associatedwith modeling of connection designs and material properties have continued to limit the usefulness of theseprocedures.
D1.8 Bogie Test
The bogie vehicle is defined as a structure mounted on four wheels and with mass equivalent to that of a selectedpassenger vehicle. The bogie vehicle is steered by rails, guide cable, remote control, or other means to strike thespecimen. The bogie vehicle may be accelerated to impact speed by a push or tow vehicle, by self power, or bystationary windlass. A crushable or otherwise deformable nose is mounted on the front of the bogie.
As discussed in Section 2.4.1.2, bogie vehicles must be revalidated periodically if the devices are to berepresentative of modern vehicles. Existing bogies have been designed to replicate vehicular crush characteristics andinertial properties. Such a bogie has been shown to be capable of simulating impacts with breakaway structures.However, significant improvements to the vehicle crush and suspension models must be made before existing bogiescan be expected to replicate impacts with other safety features such as longitudinal barriers.
D2.0 Comparison of Techniques
Applications and limitations of safety feature development techniques are given in Table D-3.
D-8
D-9
APPENDIX E
OCCUPANT COMPARTMENT DEFORMATION INDEX
El. Definition
The Occupant Compartment Deformation Index (OCDI) described herein was taken from reference 77, andmodified slightly. As recommended herein, it will be used by the European Committee for Normalization (CEN) forinformation purposes only and for the purpose of creating a data base from which future indices can be developed. It isreferred to as the Vehicle Cockpit Deformation Index in reference 77.
This index designates both location and extent of deformation of the occupant compartment. It consists of twoalphabetic characters plus seven numeric characters, in the form:
XXabcdefg
E2. Location of the Deformation
The location of occupant compartment deformation is indicated by two alphabetic characters XX, as follows:
E-1
E3. Extent of the Deformation
The seven subindices a, b, c, d, e, f and g indicate the percentage of reduction of seven interior dimensionsshown on the following figure:
where,a = distance between the dashboard and a reference point at the rear of the occupant compartment, such astop of rear seat, or the rear part of the cab on a pickup;
b = distance between the roof and the floor panel;
c = distance between a reference point at the rear of the occupant compartment and the motor panel;
d = distance between the lower dashboard and the floor panel;
e = interior width;
f = distance between the lower edge of right window and the upper edge of leftwindow; and
E-2
g = distance between the lower edge of left window and the upper edge of rightwindow.
All pre-impact reference points used in the above measurements should be marked and documented so that post-impact measurements can be made between the same points. To the extent possible, pre-impact measurements should bemade in the area where maximum occupant compartment deformations are expected to occur. For example, the right-front part of the occupant compartment has the highest potential for damage from an impact with a longitudinal barrier,when the right-front part of the vehicle makes initial contact. In such a case, a set of a, b, c, and d measurements shouldbe made on the right side of the occupant compartment, near the right door. Another set should probably be mademidway between the sides of the occupant compartment. The value of each subindex should be based on the greatestreduction in each respective set of values. For example, the greatest reduction in c may occur at the center of thecompartment and the greatest reduction in d may occur at the right side of the compartment. For the above longitudinalbarrier impact, measurements e, f, and g should be made at the front windows of the vehicle.
Pre-impact reference points may not always coincide with the area of maximum compartment damage. In such acase it is recommended that pre-impact measurements be made on a vehicle of the same make and model year as theone tested. If this is not practical, estimates can be made from pre-impact measurements.
If resources permit, accurate measurements can be obtained by making sets of pre-impact subindices measurementsalong several planes that dissect the occupant compartment as one moves from the front to the rear of the compartment,and as one moves from one side of the compartment to the other.
The value of each of the seven numeric subindices is determined by the following scale:
0 - If the reduction is less than 3%1 - If the reduction is more than 3% and less or equal to 10%2 - If the reduction is more than 10% and less or equal to 20%3 - If the reduction is more than 20% and less or equal to 30%4 - If the reduction is more than 30% and less or equal to 40%, etc.
E4. Examples
(1) If an impact causes deformations to the right side of the occupant compartment, wherein e and f are reducedby 14% and g by 7% for the right seats (deformation centered approximately midway between the front andrear seats), the reduction of all the remaining dimension being below 3%, the OCDI will be: RS0000221.
(2) If in an impact distance a is reduced by 8% and c by 12% at the right front seat, all other reductions remainingbelow 3%, the OCDI will be: RF1200000.
E-3
APPENDIX F
DETERMINATION OF THE THIV, THE PHD, AND THE ASI
Fl. Introduction
The European Committee for Normalization (CEN) has adopted the Theoretical Head Impact Velocity (THIV)and associated Post-Impact Head Deceleration (PHD), and the Acceleration Severity Index (ASI) as measures ofoccupant risks for purposes of evaluating results of a crash test (77). They are presented herein with the hope andexpectation that U.S. testers will determine and report these indices. The goal of this effort is to (a) develop a database from which comparisons can be made between the THIV, ASI, the flail space indices recommended herein, andother measures of occupant risk, and (b) to provide a basis from which future test and evaluation procedures can beformulated by and harmonized between the U.S., CEN, and other countries.
F2. A Guide to the Measurement of the Theoretical Head Impact Velocity (THIV) and the Post-Impact HeadDeceleration (PHD)
F2.1 General
The Theoretical Head Impact Velocity (THIV) concept has been developed for assessing occupant impact severity forvehicles involved in collisions with road vehicle restraint systems (78). The occupant is considered to be a freelymoving object (head) that, as the vehicle changes its speed during contact with the safety feature, continues movinguntil it strikes a surface within the interior of the vehicle. The magnitude of the velocity of the theoretical head impactis considered to be a measure of the impact severity.
The head is presumed to remain in contact with the surface during the remainder of the impact period. In so doingit experiences the same levels of acceleration as the vehicle during the remaining contact period (Post-impact HeadDeceleration - PHD) (79).
F2.2 Theoretical Head Impact Velocity (THIV)
It can be assumed that at the beginning of vehicular contact with the test article, both the vehicle and thetheoretical head have the same horizontal velocity VO, vehicular motion being purely translational.
During impact, the vehicle is assumed to move only in a horizontal plane, because high levels of pitch, roll, orvertical motion are not of prime importance unless the vehicle overturns. This extreme event does not need to beconsidered, as in this case the decision to reject the candidate system will be taken on the basis of visual observationor photographic recording.
Two reference frames are used, as indicated in Figure F2.1. The first of these is a vehicular reference Cxy, xbeing longitudinal and y transversal; the origin C is a point at or near the vehicle's center of mass, where twoaccelerometers and a rate gyroscope are typically
F-1
installed (see Section 4.3.3 for recommended procedures to determine accelerations and yaw rate at C if theinstrumentation cannot be placed at or near the center of mass). Let xc and yc be the accelerations of point C (in m/s2),respectively, along the x and y vehicle axes, recorded from the two accelerometers, and Ψ the yaw rate (in radians persecond), recorded from the gyroscope (x positive forward, y positive to right hand side and Ψ positive clockwise lookingfrom above).
The second reference frame is a ground reference OXY, with the X axis aligned with the initial vehicular velocity VO,and the origin O coinciding with the initial position of the vehicular datum point C.
Xc(t), Yc(t) are the ground coordinates of the vehicle reference C, while Xb(t), Yb(t) are the ground coordinates of thetheoretical head (see Figure F2.2).
With these definitions and simplifying hypotheses, vehicle and theoretical head motion can be computed as follows.
F-2
¨ ¨ ..
¨¨
VEHICULAR MOTION
Initial conditions:
The yaw angle Ψ is computed by integration of the yaw rate Ψ:
Then, from the components of vehicular acceleration in ground reference,
Vehicular velocity and position are computed by integration:
THEORETICAL HEAD MOTION RELATIVE TO GROUND
Initial condition: time=0
Then, if the theoretical head continues its uniform motions:
F-3
THEORETICAL HEAD MOTION RELATIVE TO VEHICLE
Vehicular components of the relative velocity of the theoretical head are:
Coordinates of the theoretical head with respect to the vehicle's frame can be computed by the formula:
TIME OF FLIGHT
Notional impact surfaces inside the vehicle are assumed to be flat and perpendicular to the x and y vehicular axes
(see Figure F2.2). The distances of such surfaces from the original head position (flail distances) are Dx forward and Dy
laterally on both sides.
F-4
The time of flight of the theoretical head is the time of impact on one of the three notional surfaces in Figure F2.2,i.e., the shortest time T when one of the three following equalities is satisfied:
The standard values of the flail distances are:
THIV
Finally, the Theoretical Head Impact Velocity is the relative velocity at time T, i.e.:
THIV shall be reported in m/s.F2.3 Post-Impact Head Deceleration (PHD)
Post-impact Head Deceleration (PHD) is the maximum value of the acceleration filtered by a 10 Hz low-passfilter, occurring after the time T of the collision of the theoretical head. If 10 represents the filtering, then:
PHD shall be reported in g units
F2.4 Summary of Procedure to Compute THIV and PHD
1. Record vehicular accelerations and yaw rate, and store in digital form at the sample rate S; let the data in thethree record files be kxc,
kyc, kΨ (k = 1,2,...,N). The time interval between two subsequent data in the record
file is h = kt - k-1t = 1/S. For example, if S = 500 samples per second, h = 2 ms.
2. Integrate the yaw rate by the recurrent formula (from Equation F2.2):
3. Compute vehicular acceleration in ground reference (from Equation F2.3):
F-5
¨ ¨.
4. Integrate vehicular acceleration in ground reference (from Equations F2.4 and F2.9)
5. Compute relative position and relative velocity of the theoretical head as functions of time (from Equations 8 and 9):
6. Find the minimum value of j for which one of the three equalities is satisfied.
7. Compute
8. Compute the resultant vehicular acceleration in g as a function of time
9. Filter the sequence kA with a digital Butterworth low-pass filter, having a cut-off frequency of 10 Hz and a roll-off of48 dB/octave; PHD is the maximum of such filtered sequence.
F-6
F3. A Guide to the Measurement of the Acceleration Severity Index (ASI)
F3.1 Procedure
The Acceleration Severity Index (ASI), developed by TTI (80), is a function of time, computed with thefollowing formula:
2/1222 ])ˆ/()ˆ/()ˆ/[()( zzyyxx aaaaaatASI ++=
where âx, ây, and âz, are limit values for the components of the acceleration along the body axes x, y, and z; ax, ay, and
az are the components of the acceleration of a selected point P of the vehicle, averaged over a moving time interval delta
δ = 50 ms, so that:
The index ASI is intended to give a measure of the severity of the vehicular motion during an impact for a personseated in the proximity of point P.
Averages computed in Equations F3.2 are equivalent to what would be obtained by a low pass filter, and takeinto account the fact that vehicular accelerations can be transmitted to the occupant body through relatively soft contactswhich cannot pass the highest frequencies. Direct use of vehicular accelerations, even if averaged, implies that the partsof occupant body than can be injured are continuously in contact with some part of the vehicle.
Note that Equation F3.1 is a basic interaction formula of three variables. If any two components of vehicularacceleration are null, ASI reaches its limit value of 1 when the third component reaches its limit acceleration. When twoor three components are non null, ASI may be 1 with the single components well below the relevant limits. Limitaccelerations are interpreted as the values below which occupant risk is very small (light injuries, if any).
In Europe (France, Germany, and Netherlands), for occupants wearing safety belts, the generally used limitaccelerations are:
where g = 9.81 ms-2 is the acceleration of Earth gravity at sea level.
With the above definition ASI is a nondimensional quantity, which is a scalar function of time and, in general, ofthe selected vehicular point, having only positive values. Occupant risk is assumed to be proportional to ASI. Therefore,the maximum value attained by ASI in a collision is assumed as a single measure of the severity, or:
Vehicular accelerations in the x, y, and z directions are measured at or near the center of mass of the vehicle (seeSection 4.3.3 for recommended procedures to determine accelerations
F-7
(F3. 1)
(F3.2)
(F3.3)
¯ ¯¯
in the x and y directions at the center of mass if the accelerometers cannot be placed at or near the center of mass).
F3.2 Summary
In summary, the following steps are used to compute the ASI.
1. Record vehicular accelerations in the x, y, and z directions at or near the vehicle's center of mass (see Section 4.3.3 ifaccelerometers can not be placed at or near the center of
mass). In general, accelerations are stored on a magnetic tape as three series of N numbers, sampled at a certainsampling rate S (samples/sec).
For such three series of measures,
where acceleration of gravity g is the unit of measurement.
2. Find the number m of samples in the averaging window delta o = 0.05s: m = INT(o *S) =INT(.05*S), where INT(R)is the integer nearest to R. For example, if S = 500 samples per sec., m = 25.
3. Compute the average accelerations from Equation F3.2:
Functions of time kt = h (k+m/2).
4. Compute ASI as a function of time from Equation F3. 1:
5. Find ASI as the maximum of the series of the kASI.
F-8
APPENDIX G
SIDE IMPACT TEST AND EVALUATION PROCEDURES FOR ROADSIDESTRUCTURE CRASH TESTS
Concurrent with the effort to prepare an update to NCHRP Report 230, an FHWA-sponsored study was beingconducted to examine the side impact problem and to develop tentative side impact test procedures for sign andluminaire support structures. This appendix contains a report, copied verbatim, from that study describingrecommended test and evaluation procedures for side impact testing. It is included for information purposes onlybecause no recommendations are made relative to the impact performance requirements of a safety feature for sideimpacts (see discussion in Section 3.5). Until these or other guidelines are nationally accepted, developers of safetyfeatures for side impact capabilities may use guidelines presented therein. Note that references cited in the appendix refer to the list of references given at the end of the Appendix G.
G-1
G-2
G-3
Contents
1 Introduction 1
2 Test Parameters 2 2.1 Test Facilities 2 2.2 Test Articles 4 2.3 Vehicle 4
3 Test Conditions 5 3.1 General 5 3.2 Vehicle Orientation 6 3.3 Velocity 9 3.4 Impact Point 10 3.5 Anthropometric Dummy Position 11
4 Data Acquisition 12 4.1 General 12 4.2 Anthropometric Dummy 13 4.3 Displacement Transducer . 14
3 Vehicle orientation for side impact crash tests 84 Displacement transducer 155 Example Displacement Transducer Output 156 Coordinates for occupant position in side impact crash tests 20
List of Tables
1 Test devices appropriate for side impact crash testing 42 Side impact test vehicle 53 Side impact test condition 64 Change in velocity statistics for side impact accidents
with fixed objects(19821985 NASS) [32] 9
5 Injury as a function of lateral change in velocity forside impacts centeredthe passenger compartment [32] 10
6 Anthropometric side impact test dummy 127 Data elements required in side impact crash tests 138 Side impact crash test evaluation criteria 17
G-5
1 Introduction
Side impact collisions involving fixed roadside objects like utility poles, trees and luminaire supports account for about1600 fatalities and 60,000 injured vehicle occupants each year in the United States [28] [31]. This type of collisionappears to cause a disproportionate number of fatalities and serious injuries [16][28] [31].
Many of the fixed objects struck on the roadside are intentionally placed there to provide lighting, powertransmission, or to convey information. While usually serving a benign purpose, these objects can become a hazard ifthey are not designed to breakaway, collapse, or fracture in an impact with an errant vehicle. This report recommendstesting conditions and evaluation criteria for side impact full-scale crash tests of structures placed on the roadside.
These recommendations supplement guidelines published by the National Cooperative Highway ResearchProgram (NCHRP) [19] [29]. Where a particular guideline is not specifically addressed herein, the more generalNCHRP guidelines should be applied. For example, test documentation is not specifically addressed so alldocumentation items recommended in the NCHRP guidelines should be included in a complete side impact test report.These recommendations are organized much like the latest NCHRP guidelines [29].
This document is based largely on research described in several other reports and papers [32] [27] [28] [31] [14]. TheFatal Accident Reporting System (FARS) and National Accident Sampling System (NASS) were investigated to learnabout the characteristics of side impacts with fixed roadside objects [32] [28]. A number of side impact crash tests ofluminaire supports and guardrail terminals were performed by the Federal Highway Administration (FHWA) duringthe past decade [27] [12] [10]. More information on particular aspects of these recommendations can be found in theseother documents.
The National Highway Traffic and Safety Administration (NHTSA) has published rules on performing vehicle-to-vehicle side impact crash tests to evaluate the crashworthiness of production automobiles and light trucks [23] [21][22]. Although there are important differences between the objectives of these NHTSA tests and the tests addressed bythis report, the proposed NHTSA rules were used as a guide wherever possible in formulating these recommendations[24]. Any linkage that can be forged between NHTSA and FHWA side impact crash tests would be beneficial in thefuture as more is learned by both research communities about side impact collisions.
G-6
2 Test Parameters
2.1 Test Facilities
Side impact crash tests are significantly more difficult to perform than typical safety appurtenance crash tests.Accelerating the vehicle laterally requires test facilities that are not commonly found in the roadside researchcommunity. Side impact crash tests have been performed using:
• A differentially braked vehicle on a slick pavement [9].• A cable-guided cable-towed carriage with the vehicle mounted sideways [2].• A cable-towed wooden pallet with the vehicle resting sideways [33].• A monorail and outrigger assembly with the vehicle resting on casters [11].
The Federal Outdoor Impact Laboratory (FOIL), shown in figure 1, was used for most of the side impact crash testsperformed to assess the performance of roadside structures. The vehicle is transported on a monorail. A stabilizingoutrigger rail runs parallel to the monorail. Rolling carriages are mounted on the underside of the vehicle body. Themonorail and outrigger rail end approximately 2 m from the test device. The vehicle is brought up to the desired testspeed using a drop-weight accelerator. The vehicle, with the attached roller carriages, drops off the rails and slides theremaining distance to the test device. Information about the construction, capabilities, and operation of the FOIL can befound elsewhere [11].
Test devices should be mounted in as realistic a manner as possible. Some objects like foundation mountedluminaire supports may be rigidly connected to a universal foundation if they are normally supported on a rigidfoundation in the field. Soil mounted structures like guardrail terminals, utility poles and signs should be mounted in asoil representative of the soil type typically found in the field.
The vehicle should slide laterally at least two vehicle track widths to allow the vehicle to stabilize after dropping offthe monorail. The sliding should occur on pavement or wood since soft earth may trip a vehicle sliding broadside over alarge distance. Wetting down the approach area with water just prior to the test will help reduce friction between thesurface and the vehicle tires. Accidents certainly occur on dry non-paved surfaces but experimental difficulties with thestability of the vehicle and repeatability of the test make reducing the sliding friction advisable.
G-7
G-8
2.2 Test Articles
An investigation of the Fatal Accident Reporting System (FARS) and National Accident Sampling System (NASS)showed that narrow objects accounted for 60 percent of the accidents but 80 percent of the fatalities in side impactaccidents involving fixed roadside objects. Narrow objects subject the side of a vehicle to highly concentrated loadingsthat are difficult to resist without extensive vehicle deformation.
Highway safety appurtenances in the narrow-object category (table 1) include luminaire supports, utility poles, signsupports, guardrail terminals and narrow crash cushions. These recommendations should be used during an assessmentprogram after all the applicable frontal tests have been performed. The side impact test is much more demanding than thefrontal tests. After successful performance is observed in the frontal tests, the side impact test should be performed.
Table 1. Test devices appropriate for side impact crash testing.Luminaire Supports
Large and Small Sign SupportsGuardrail Terminals Narrow Crash Cushions
Breakaway Utility Poles
2.3 Vehicle
A two-door 820-kg small vehicle should be used in side impact crash testing of roadside hardware. This vehicle isidentical to the 820C vehicle recommended in the NCHRP guidelines with the exception that only two-door modelsshould be used [29]. All the requirements for mass tolerances, vehicle age and condition recommended in the NCHRPguidelines should also be satisfied for side impact crash tests as should recommended vehicle dimensions.
Examination of the FARS accident data has shown that the fatality rate in smaller vehicles is no different than forlarger vehicles in side-impact fixed-object accidents [28]. Partyka has shown that, in general, the fatality rate is not afunction of weight in single-vehicle accidents where rollover does not occur [25]. The choice of a lighter test vehicle,therefore, cannot be justified on the grounds that the occupant is more at risk.
Instead, the lighter vehicle was chosen in order to (1) minimize the kinetic energy available for device activationand (2) maximize the probability of vehicle instability during the post collision trajectory. Most of the devicestargeted by these recommended procedures function by breaking away, collapsing, yielding or fracturing. T1 e 820Cvehicle provides a reasonable minimum amount of kinetic energy in an impact.
G-9
While vehicle stability was not normally a problem in side impact crash tests with fixed objects, smallervehicles tend to be less stable than larger vehicles because of narrower track widths, smaller masses, and theposition of their centers of gravity. Stability problems like rolling over are more easily identified when smallervehicles are used so their use is recommended.
The door on a two-door vehicle spans a larger distance than in comparable four-door models. This larger span ontwo-door models makes the door inherently weaker than the four-door model. The two-door small car minimizes theside impact resistance of the vehicle.
Side impact crash tests of narrow fixed objects sponsored by the FHWA have been performed using the Honda CivicSi, the Dodge Colt, the Plymouth Champ and the Volkswagen Rabbit [27]. All the vehicles used were two-door modelsmanufactured between 1978 and 1986 and conform to the requirements shown in table 2.
3 Test Conditions
3.1 General
Side impact tests will be supplementary to the usual frontal crash tests specified in NCHRP Report 230. The standardfrontal matrix of tests includes a 30 km/h test of the breakaway mechanism. Since this frontal test examines thebreakaway mechanism at the 30 kJ level, there should be no need to retest in a side impact configuration. In frontaltests, the amount of kinetic energy transformed to vehicle deformation is usually a relatively small percentage of thetotal energy; most of the energy can be used to activate the device. In side impacts, vehicle deformation accounts for amuch larger proportion of the initial kinetic energy. It cannot be assumed a priori, then, that a device that activates in alow speed frontal collision will activate in a side impact collision. While testing at a lower speed would produce amore demanding test in terms of device activation, it may not by satisfactory for evaluating the risk to vehicleoccupants. The side impact test
G-10
recommended herein will focus on the response of the hypothetical occupant.
Impact conditions for full-scale crash tests have generally been designed to represent the practical worse-case impactscenario [19]. With this perspective in mind, accident data from the Fatal Accident Reporting System (FARS) and theNational Accident Sampling System (NASS) Continuous Sampling System (CSS) were investigated to examine thecharacteristics of side impact fixed object accidents [32] [28] [31].
The following recommended test conditions for side-impact fixed object collisions are a compromise between themost realistic conditions and those easiest to obtain in controlled experiments. The accident data provides indications ofthe speeds and orientations common in side impact collisions. Because of the shortcomings of accident data the estimatesof impact conditions must be viewed as tentative. The accident data does, however, provide the only view of the real-world accident problem. It appears that most side impacts occur at relatively low lateral speeds and high angles.
Table 3 shows the recommended impact conditions for side impact testing of roadside structures. A collision betweena fixed roadside object and the center of the driver's side door is recommended. The lateral impact speed for test SI-should be 50 km/h. Test SI-2 is an optional higher velocity test that can be included when the performance of a device isexpected to degrade at higher velocities. While real accidents involve longitudinal and angular velocity components,experimental limitations often preclude testing with these additional velocity components. These impact conditions aresuggested as a reasonable set of experimentally achievable test conditions for exploring the performance of roadsidehardware in side impact collisions.
3.2 Vehicle Orientation
Side impacts have been shown to be associated primarily with narrow fixed objects such as utility poles and luminairesupports [28] [31]. The impact angle is usually defined in a crash test as the angle between the longitudinal axis of adevice and the approach path of the vehicle. Since many narrow objects have no longitudinal axis the impact angle istechnically undefined. The vehicle orientation and yaw angle can be defined instead in
G-11
terms of the orientation of the traveled way as shown in figure 3. This ensures that the basic accident scenario beinginvestigated is the same even if the devices are different.
There is no direct measure of the yaw angle given in the NASS-CSS accident data. An estimate of these quantitiescan be made, however, using the direction-of-force variable and the longitudinal and lateral changes in velocity. Theyaw angle is the angle between the longitudinal direction of the vehicle and the direction of the velocity vector.
The direction-of-force (DOF variable is an estimate of the orientation of the resultant force during the collision. ADOF of 0 indicates that the force interaction was parallel with the center line of the vehicle whereas a DOF of 90 wouldindicate a perpendicular force. Figure 2 shows the direction of force distribution for side impacts with fixed objectsfrom the 1982 through 1985 NASS-CSS data [32]. The mean direction of force was found to be 56 degrees and themedian value was 60 degrees. The most frequently observed direction of force was 90 degrees, a full broadsidecollision. Figure 2 also shows that the vehicle had a forward component of velocity in more than 80 percent of theimpacts. Angles between 45 and 105 degrees accounted for almost 50 percent of the side impact yaw impact angles.
Another rough estimate of the yaw angle can be obtained by calculating the arctangent of the longitudinal and lateralchange in velocity. These estimates are very approximate because of the uncertainties in calculating the two velocityvalues [30]. The mean yaw
G-12
angle was found to be 57 degrees with a standard deviation of 19 degrees [32]. Both estimates of the yaw angle, then,indicate that the mean yaw angle is approximately 60 degrees. The final rule on side impact testing published by NHTSAspecifies a test with a crabbed impactor bogie. The principal direction of force on the test vehicle is 63 degrees. Thischoice of a crabbed vehicle was based on NHTSA's analysis of vehicle-to-vehicle side impact collisions.
Performing tests with a yaw angle of 60 degrees was considered but abandoned in favor of a 90-degree orientation forseveral reasons:
• Mounting a vehicle on a carriage with a 60 degree yaw angles causes some experimental problems in balancingthe vehicle on the guidance rails and mounting the carriages under the vehicle. In NHTSA tests the impactedvehicle is stationary so it does not have to balanced and accelerated. The impactor bogie, though yawed, is atracking vehicle since the wheel are attached at an angle.
• When a yawed vehicle releases from the carriage it will tend to roll ahead making the vehicle difficult to control.Obtaining repeatable impact locations would be impossible with a yawing vehicle.
• A full broadside orientation constitutes a reasonable worst-case (possible unsurvivable) scenario in terms of theside-door strength of the vehicle. The side of the vehicle is relatively weak and the perpendicular orientationmaximizes the loading in the weak direction.
Side impact crash tests of roadside structures should be performed with the vehicle perpendicular to the traveled waywith the front of the vehicle facing the traveled way.
G-13
This orientation, shown in figure 3, represents the common accident scenario of leaving the road on the wrong side,partially recovering and striking a fixed object nearly broadside.
3.3 Velocity
The velocity change values reported in the 1982 through 1985 NASS-CSS data for side impact fixed objects accidentscentered on the occupant compartment were used to estimate the impact velocity [32]. The change in velocity can beassumed to be close to the impact velocity if it is assumed that the vehicle was brought to rest as a result of the collision.The most frequently struck objects in the NASS-CSS data are trees, utility poles and other narrow objects. While some ofthese objects, like sign supports and delineator posts, do break away or yield the majority of collisions are with objectsthat do not break away such as trees and utility poles. When the fixed object does not break away, the vehicle must cometo rest. The assumption that the changes in lateral velocity can be used to represent lateral impact velocities, then, seemsto be a reasonable first approximation for side impacts with fixed roadside structures.
The mean lateral change in velocity, as shown in table 4, was 24 km/h. The maximum lateral velocity observed in thissample was 63 km/h. If the distribution of lateral velocities is assumed to be exponential, 85 percent of the cases wouldoccur at less than 45 km/h and 70 percent of the cases would occur at less than 30 km/h. An exponential distribution is areasonable assumption since the most common lateral velocity should be zero and large lateral velocities should be quiterare. An exponentially distributed lateral velocity distribution is suggested by the NASS data [27].
Table 5 illustrates the increasing severity of injury with increasing total velocity change. More than 60 percent of allminor injuries occurred in accidents where the lateral change in velocity was less than 10 km/h. In contrast 75 percent ofthe severe and fatal injuries occurred in accidents where the lateral change in velocity was greater than 31 km/h. Clearly,the amount of energy dissipated is related to the severity of injury experienced by the vehicle occupants. It has beensuggested that injury can be defined as exposure to energy [4]; more energy should be correlated with a higherproportion of severe injuries. The proportion of severe and moderately injured occupants increases as the lateral changein velocity increases.
G-14
Severe injuries (AIS > 3) can be observed across the range of impact speeds but 75 percent occur at velocities greaterthan 30 .km/h. The mean velocity for occupants who received AIS > 3 injuries was approximately 40 km/h. Impactsoccurring in the 30 to 60 km/h range resulted in 1 chance in 18 of sustaining an AIS > 3 injury. A test velocity of 50km/h was selected since successful performance at this speed would imply protection for nearly 90 percent of thevehicle occupants in this sample. Specifying a higher test velocity would probably exceed the point of diminishingreturns.
3.4 Impact Point
The impact point for side impact crash tests of roadside structures should be at the center of the driver's side door on asmall 2-door passenger vehicle. This location is near the longitudinal center of gravity of the 820C vehicle and about250 mm in front of the dummy shoulder. The door is weakest at the center so the maximum amount of intrusion shouldbe observed when the impact is located at this point.
One of the CRASH3 data items collected in the NASS data is the distance from the vehicle center of gravity to thecentroid of the damaged area. Nearly 60 percent of the side impacts in the study sample occurred between the A and Bpillar [32]. Impacts that occur between the A and B pillars will be located on the front door, very close to the front seatoccupant.
Earlier tests [12] have used an impact point centered on the front seat occupant. While this orientation represents apractical worst case scenario, recent testing has indicated that obtaining useful anthropometric dummy responses is verydifficult when the dummy directly contacts the intruding object [27]. Accidents where the occupant's head directlycontacted an intruding pole are not difficult to find in the literature or in the accident data.
G-15
When this occurs the occupant is nearly always severely injured, even when the lateral impact velocity is very low. Theabsence of any protection between the head and the window makes protection of the occupant in this situation nearlyimpossible.
The recommended impact location is slightly in front of the dummy shoulder. This location, while not the worst,subjects the dummy to large impact loadings but is far enough removed to yield more repeatable and meaningfuldummy responses.
3.5 Anthropometric Dummy Position
NHTSA vehicle-to-vehicle side impact tests require the use of an instrumented Part 572 Subpart F side impact dummy(SID) [24]. The side impact tests performed at the FOIL since 1985 have all used this type of dummy. The long-termobjective of this research is to specify criteria that will allow side impact crash tests to be evaluated without dummies.There are several reasons for not including dummies in crash tests of safety appurtenances. A recent FHWA staff studiesfound that in most typical appurtenance crash tests, the data obtained from the anthropometric dummy was rarely usedand the responses were often subcritical [17].
The use of dummies in the early stages of side impact research, however, is inescapable. Judging the performance of atest article ultimately involves judging the risk of serious injury to vehicle occupants in real accidents. Theanthropometric dummy is the best available device that, at least in principal, links the performance of the device on thetest pad to the performance in the real world. Instrumented side impact dummies should, therefore, be used in the sideimpact crash tests of roadside objects for the foreseeable future.
The Part 572 dummy is recommended primarily because all previous side impact crash tests of roadside structureshave used this device, and it is unlikely that newer side impact anthropometric devices like the EuroSID or BioSID willbe made available to roadside appurtenance researchers in the near future.
The seat should be positioned as far to the rear as the normal seat adjustment will allow in order to fit both theanthropometric test device and the displacement transducer in the occupant compartment (see section 4.3). Thedisplacement transducer includes a string that stretches from the impact-side door to the non-impact-side door. If thedummy is not position far enough back the string could interfere with the dummy response.
The dummy was placed in the driver's position in all the side impact tests performed at the Federal Outdoor ImpactLaboratory. The dummy should be placed in the front seat position on the impact side on the vehicle. Although manyinjuries in real accidents result from an unrestrained non-impact-side occupant flailing across the passengercompartment, the impact-side occupant is always at greater risk of injury.
G-16
The seat back should be positioned in the "normal," unadjusted position. This is usually the most verticalorientation. Some recent research has suggested that ensuring the head is relatively level is an important factor inobtaining repeatable HIC values in side impacts [24]. While explicit leveling of the head is not necessary, the uprightposition of the seat back will result in a more level head form.
Traditionally, restraints have not been used in full-scale crash tests of safety hardware. Seat belts are not effective inside impacts when the impact is on the same side as the occupant. The lap belt restrains the pelvis but not the upperbody, allowing the head and thorax to contact the side structure of the vehicle. Seat belts do, however, help keep thedummy in-position as the vehicle is being transported down the test track. Prior research has indicated that alloccupant response measures are extremely sensitive to the position of the dummy at impact. The seat belts help keepthe dummy from bouncing out of position during the acceleration and sliding phases prior to impact. All availablerestraints should be used in side-impact fixed object crash tests.
4 Data Acquisition
4.1 General
Side impact crash tests require the same types of vehicle data as more traditional full-scale crash tests [29]. The vehicleshould be instrumented with accelerometers to measure all six degrees of freedom of the vehicle. Photographiccoverage should conform to the usual practice in appurtenance tests. Film analysis of the vehicle motions should beperformed as well as analyses of the vehicle accelerometer outputs. An on-board high-speed camera is useful forunderstanding the response of the vehicle occupants and possible sources of injury and is essential for determining thepre-impact position of the dummy.
Relating observable results of crash tests and the risk of severe injury in such collisions is the long-term goal of sideimpact crash testing. Table 7 shows the data elements that should be calculated, collected, recorded and reported inside impact crash tests. To date there are relatively few side impact crash tests available for analysis. These dataelements
G-17
are thought to be important characteristics of the collision that might be useful in building models that predict the risk ofsevere occupant injury. Collecting these data will allow a data base of important side impact parameters to beassembled. Table 7 also shows the data acquisition device needed to obtained each parameter. Most involve typicalacquisition methods like vehicle accelerometers and film analysis. In addition to the usual data acquisition methods, afully instrumented anthropometric dummy and a displacement transducer to measure the deformation of the door shouldbe used.
4.2 Anthropometric Dummy
While anthropometric dummies were routinely used in the past in full-scale safety appurtenance crash tests, they did notprovide much useful information [17]. The forces in most longitudinal barrier tests are well below the level necessary toresult in significant dummy responses. In recent years anthropometric dummies have been included in most crash testsonly to represent the occupant's inertia and to enhance the on-board photographic record.
G-18
The severity of the crash loading in side impacts, however, places the dummy in a much more extreme environmentand meaningful dummy responses can be obtained. An instrumented SID should be used in side impact crash tests withroadside structures.
The dummy should be instrumented so that the Thoracic Trauma Index (TTI), the Head Injury Criteria (HIC) and themaximum pelvis accelerations (ap) can be calculated. Calculation of the TTI requires accelerometers located on theimpact-side ribs and T12 segment of the spine. The HIC is calculated based on the resultant of a triaxial accelerometermounted in the head form of the Part 572 dummy [24].
4.3 Displacement Transducer
The intrusion of the door into the passenger compartment is one of the most hazardous characteristics of side impactaccidents. The occupant strikes the intruding door structure in a typical side impact event. Penetration of the passengercompartment has long been recognized as a very hazardous event in roadside collisions. Any significant penetration ordeformation of the passenger compartment is disallowed in all other types of full-scale appurtenance crash tests. Theseverity of side impact collisions, however, makes this an unreasonable and unobtainable restriction. In order todetermine the effect of the intrusion and more particularly the intrusion rate, the use of a displacement transducer isrecommended.
A Celesco PT510 string pot transducer has been used successfully in several side impact crash tests of guardrailterminals [27]. This device can accurately record distances between 0 and 2 m. Devices of this type are readilyavailable, inexpensive and very robust. Figure 4 shows how the transducer was mounted in several recent tests. Thetransducer unit was attached to the inner window sill of the non-impact side door. The end of the string was stretchedacross the passenger compartment and screwed into the structure of the impact-side door. The string should beperpendicular to the door. The transducer measures the instantaneous width of the passenger compartment and the slopeof this line represents the velocity of the inner surface of the intruding door. Figure 5 shows the output of a string pottransducer in a side impact test of a guardrail terminal.
5 Evaluation Criteria
5.1 General
Using standard testing conditions ensures that different tests performed by different testing agencies can be compareddirectly. Standardizing test conditions does not indicate how well a device performs; evaluation criteria do. Evaluationcriteria are a set of quantifiable
G-19
limits that, taken together, suggest how well a roadside structure can be expected to perform in real-world impacts.
The NCHRP guidelines recommend three separate criteria for evaluating crash tests: structural adequacy, occupantrisk, and vehicle trajectory. These three criteria have evolved over the years to ensure that hardware performs asdesigned (structural adequacy criteria), it does so without undue risk to vehicle occupants (occupant risk criteria), andthe probability of subsequent accident events is minimized (vehicle trajectory). Although past criteria have notaddressed side impacts specifically, the three general criteria are as applicable to the side impact scenario as other,more typical accident scenarios. The three general NCHRP evaluation criteria are used as a framework fordeveloping side impact crash test evaluation procedures.
5.2 Structural Adequacy Criteria
The structural adequacy criteria requires that a roadside structure be structurally capable of accomplishing its primarypurpose. For longitudinal barriers, this primary structural purpose is preventing the vehicle from crossing the barrierline; for breakaway hardware the primary purpose is to yield or breakaway without penetrating the passengercompartment or scattering debris onto the roadway.
In side impacts, roadside structures should be expected to breakaway, fracture, collapse or yield allowing thevehicle to either pass by or stop. The suggested structural adequacy criteria for side impacts are shown in table 8.Italicized text represents an addition to NCHRP criterion B
5.3 Occupant Risk Criteria
The occupant risk criteria have evolved into the most important single evaluation criteria in testing roadsidehardware. The ultimate objective of all safety hardware is to prevent or minimize the potential for injury to occupantsof vehicles that leave the traveled way.Unfortunately, establishing a linkage between parameters measured in crash tests and real occupants of vehicles inaccidents has been an extraordinarily difficult task.
Report 230 introduced the concept of the flail space occupant risk criteria. The flail space method calculates thehypothetical impact velocity of an occupant head with the interior of the vehicle. The impact velocity between theoccupant and the vehicle interior did not prove to be a good predictor of dummy response even when the flail spacemethod was modified to account for the intrusion rate of the door.
Relating the forces experienced by anthropometric test devices to the potential for
G-21
G-22
serious injury is a challenging area of research that has been pursued by NHTSA, the military and the automotivedesign communities for decades. The measures of injury promoted by NHTSA are recommended since that agency hasthe most expertise and ability in the area of biomechanics and human tolerance. Conforming to the NHTSArecommendations will allow the roadside safety community to take advantage of a wealth of biomechanics experiencewhile also facilitating the exchange of information between these two agencies in the future. While the HIC and TTIcould certainly be improved, they have a better linkage to real human trauma than the flail space for side impacts.
The recommended occupant risk criteria, discussed below, is composed of four subcriterion: a vehicle stabilitycriterion, a thoracic trauma criterion, a head injury criterion and a pelvis acceleration criterion.
5.3.1 Vehicle Stability Criterion
Roll over of the vehicle has long been recognized has a very hazardous event in single vehicle accidents [25]. Roadsidestructures should breakaway, collapse or yield in an impact without causing the vehicle to rollover or completely loosecontact with the ground.
5.3.2 Head Injury Criterion
The Head Injury Criteria (HIC) evolved from several earlier techniques for measuring the resultant accelerationsexperienced by the head form of the Part 572 dummy [18]. The HIC has been used for many years in frontal barriercrash tests by NHTSA as well as by the roadside design community. A HIC of 1000 has generally been considered thethreshold for severe injury.
The purpose of any occupant response measure is to estimate the risk to occupants in real accidents. A cumulativeprobability density function relating the probability of sustaining an AIS > 3 injury based on the observed HIC has beendeveloped from the results of cadaver testing [26]. According to this curve, a HIC = 1000 implies a risk of AIS > 3injury of 0.18: 18 percent of occupants with a HIC = 1000 will be severely injured.
Unfortunately, the HIC was not developed to measure head injury potential in side impacts. The differences betweenlongitudinal and lateral head impact tolerance and the degree to which the Part 572 head form predicts human injuryhave been debated but no consensus has been reached [18]. It is widely agreed, however, that the head is probably lesstolerant in lateral impacts than in frontal impacts so the HIC should certainly be no greater than 1000. There is a greatneed for the biomechanics research community to address the issue of an appropriate lateral HIC limit or, moregenerally, head injury criteria
G-23
for the side of the head. A HIC = 1000 has been used in a recent study of head form impacts with upper vehicle-interiorstructures like the A-pillar, roof rails and B-pillar [6]. A limit of 1000 appears to be the best available link between thedynamics of an impacting head and the potential for serious injury.
Anthropometric dummies should be used in side impact crash tests of roadside structures as long as the possibility ofserious damage to the dummy is minimal. The HIC should be evaluated in the same manner typically used for frontalcollisions. Details on computationally efficient HIC algorithms can be found in a variety of papers in the literature [18][3] [13].
The exact location of the dummy at the time of impact has been a problem in performing side impact crash tests ofroadside structures. Dummies in vehicle-to-vehicle crash tests do not move prior to the impact because the struckvehicle is stationary so correct dummy position can be guaranteed. In roadside structure crash tests the vehicle anddummy must be accelerated to the desired impact velocity since the structure is fixed and the vehicle is accelerated.Ideally, the dummy should be in the "normal" seating position. This would correspond to a location about 250 mmbehind the impact point and 165 mm from the head to the side window.
When the dummy is not in the correct position at impact, the HIC can be normalized using the following expression:
wherer = Longitudinal distance from dummy shoulder to impact point in mm. s = Lateral distance from dummy shoulder to impact point in mm.
This expression was derived from a regression analysis of 15 side impact crash tests of poles. The HIC appears todecay exponentially as the distance between the head and the impact point increases. The worst-case impact location isone that is centered on the occupant's head when the occupant is in contact with the door window (r = 0, s = 0). Figure 6shows the definition of the coordinates for equation 1.
It is very important to normalize the HIC when different tests are being compared since a large HIC may be due tothe head impact being too close to the intruding object rather than a difference in performance between one device andanother.
G-24
.
5.3.3 Thoracic Trauma Criterion
The thoracic trauma index (TTI) was developed by NHTSA to measure the chance of severely injuring the humanthorax during a collision [20] [5] [8] [7]. The formulation of TTI has gone through several revisions, the most recentbeing found in the 1990 final amendment for Federal Motor Vehicle Safety Standard 214 [24]. The TTI is the averageacceleration experienced by accelerometers located on the left upper rib (LURY) and the twelfth spinal segment (T12P)as shown in equation 2. The accelerations should be filtered using the FIR100 finite impulse response filter as specifiedin FMVSS No. 214 [24].
whereGR = The greater peak acceleration of either the upper or lower rib in g's, andGLR = The peak acceleration of the lower spine (T12) [24].
The TTI is not the only possible measure of thoracic trauma. Researchers at General Motors Research Laboratory, forexample, developed a competing injury scale, the viscous criteria (VC) [34] [15]. Unfortunately, the data required tocalculate VC are only obtainable using BioSID dummies which were not available in any of the side impact crash testsperformed to date at the FOIL. In contrast, the TTI can be calculated using the more common Part 572 SID. Since mostof the FHWA tests and all of the NHTSA tests contained data that could be used to calculate the TTI, the TTI waspreferred as a measure of thoracic occupant trauma.
G-25
Instrumented anthropometric dummies should be used in side impact crash tests of roadside structures. The TTI forthe in-position dummy should be less than 90 g’s. NHTSA, in its 1990 final rules on side impact, requires the TTI beless than 90 g’s in tests of 2-door passenger cars. The recommended criteria therefore conform to the NHTSA designlimits. The TTI has been related to the probability of various levels of injury using the Abbreviated Injury Score (AIS)[1]. The cumulative density function of TTI was found to be a Weibull extreme value distribution [20]. A TTI = 90corresponds to a 0.16 probability of an AIS > 3 injury. This level of risk is roughly the same used for the HIC so thesecriteria represent an internally consistent risk of trauma for evaluating side impact tests.
Maintaining correct dummy position, as discussed earlier, is often very difficult in a crash test where the vehicleand dummy must be accelerated up to a target test speed. If the dummy is out of position (i.e. r ≠ 250 mm and s ≠165 mm) the TTI should be normalized to the hypothetical in-position response using equation 3. The coordinatesystem for occupant motions is shown in figure 6. This expression is based on the empirical observation that the TTI,like HIC, seems to decay exponentially as the distance from the occupant increases.
wherer = Longitudinal distance from dummy shoulder to impact point in mm s = Lateral distance from dummy shoulder to impact point in mm.
5.3.4 Pelvis Acceleration Criterion
Although no side impact crash tests of roadside hardware have collected the pelvic acceleration, it is a component ofthe NHTSA final rules on FMVSS-214 [24]. The pelvis accelerations should be filtered using the FIR100 finiteimpulse response filter as specified in FMVSS No. 214. This rule specifies that the pelvic must not experience anacceleration greater than 130 g’s during the test.
Where ap, is the maximum acceleration of the pelvis of the side impact dummy. The probability of experiencing afatal fracture is relatively low at this level. Including the pelvis acceleration also helps to ensure that improvements inthe TTI and HIC do not come at the expense of shifting the load path through lower parts of the vehicle.
G-26
5.4 Vehicle Trajectory Criterion
The purpose of the vehicle trajectory criteria is to reduce the chance of a subsequent harmful event after theappurtenance collision. Since the vehicle is sliding sideways in a side impact it will usually loose speed rapidly andcome to rest near the first impact point. Sometimes, after the collision, the laterally sliding tires may begin to rotatecausing the vehicle to roll forward. Since the front of the vehicle is pointing toward the traveled way in the standardorientation (figure 3) there is a danger that the vehicle can reenter the roadway or even travel completely across it.Reentry of the vehicle into the roadway, especially at the high angles resulting from a side impact, is not acceptable.
Criteria SI-V, shown in table 8, is very similar to NCHRP evaluation criteria K [29] except more restrictive languageis used. This slightly more stringent criteria is recommended because, after a side impact, a vehicle could reenter theroadway at a high angle, perhaps even perpendicular to the roadway. After the vehicle comes to rest it will probablyrequire towing since vehicle damage is usually extensive in a side impact.
6 Estimating Dummy Responses
6.1 General
Ultimately anthropometric dummies should be eliminated from full scale tests. The environment in many full scalecrash tests of roadside safety appurtenances is so severe it is often not advisable to place dummies in the vehicle. Gooddummy results require careful and frequent calibration which has traditionally been a problem for roadside safetyapplications. Since the response of the vehicle can be easily measured in a full-scale test, vehicle-based evaluationparameters that estimate the response of hypothetical humans are preferable to the use of fully instrumentedanthropometric dummies.
As discussed earlier, there are three primary injury mechanisms that are active in side impact collisions: thoracictrauma, head injury and pelvic fracture. Data from 15 previous crash tests were analyzed to determine if there were anyrelationships between the observed vehicle-based parameters and the vales of TTI and HIC. Pelvic acceleration was notmodeled since there has been no data collected as yet. The same type of modeling activity could be performed toestimate the accelerations of the pelvis based on vehicle-based parameters once sufficient data has been collected. The15 tests used represent all the tests that used instrumented SID dummies. The following sections summarize the findingsof these investigations [27].
G-27
6.2 Thoracic Trauma Index
A multiple linear regression analysis was performed on 15 tests of small cars side impacting a variety of poles. Valuesfor all the parameters listed in table 7 were collected and entered into a data base of values. A variety of regressionmodels were evaluated. Models that included the effect of occupant position (parameters r and s) and impact velocitywere required. Beyond these three basic parameters the model with the fewest predictors and highest R2 were preferred.The best five parameter model was:
R2 = 0.90where r = Longitudinal distance from occupant head to impact point in mm.
s = Lateral distance from occupant head to the impact point in mm. Vi = Vehicle impact velocity in m/sec. ci = Maximum static passenger compartment crush in mm. ci = Average passenger compartment intrusion rate in m/sec.
The coefficient of regression squared (R2) for this model was quite good for this type of experimental data. Thecomponents of this model seem reasonable: severity should increase as the occupant gets closer to the impact point (rand s) and severity should be a function of the impact velocity (Vi) since this is a measure of the total amount ofkinetic energy at the start of the impact event. Passenger compartment crush and crush rate were also thought to bedirectly related to the TTI since thoracic injuries are caused by contact with the side door panels.
In a test with no dummy, three of these parameters (r, s, and Vi)are specified. Only crush and crush rate aremeasurable results of the test. The desirable, in-position location of an occupant is at r = 250 mm, s = 165 mm andthe standard impact speed is 50 km/h (14 m/sec). The maximum allowable TTI from table 8 is 90 g's. These valuescan be substituted into equation 5 and
solved for the quantity . Doing so results in a criterion for allowable thoracic trauma.
If the crush and crush rate result in a value less than 1000, the probability of observing a TTI greater than 90 isrelatively small.
This expression was developed using the results of 15 side impact tests of slip-base and ESV poles. The degree towhich this expression will predict TTI scores for other types of devices is not known. The range of crush and crushrate in these tests was between 200 and 900 mm and 1 and 10 m/sec, respectively. These expressions might not yield
G-28
appropriate estimates for tests where the crush or crush rate was substantially more than the tested range. Theseexpressions should be used as a guide when direct measures of the TTI are not available.
6.3 Head Injury Criteria
The same type of stepwise regression analysis was performed to find models for the HIC. The results of this analysiswere not as attractive as the TTI model described in the previous section. It is presented here to serve as an approximateguide for tests where no dummies were included.
Most of the 15 tests were conducted with the dummy head aligned with the impacting pole. This caused exceptionallyhigh HIC values since there was often direct contact between the pole and the head. This extreme test condition may bemore demanding than the SID dummy capabilities. For this reason, a longitudinal impact point (r) of 250 mm isrecommended for future tests. The severity of the loading caused problems in developing a model for HIC. The r = 0position appears to represent a singularity in the response of the dummy. Future research with dummies at positionsother than r = 0 should help to refine the model presented herein. Equation 7 represents the model with the best R2 valuewhich included terms for occupant position (r and s).
{ } ( )7Vc
c9883.09925.0280HIC 15.0
occ
64.1isr
=&
R2 = 0.56where r = Longitudinal distance from occupant head to impact point in mm.
s = Lateral distance from occupant head to the impact point in mm. Vocc= Occupant impact velocity with intruding vehicle interior in m/sec ci = Maximum static passenger compartment crush in mm. ci = Average passenger compartment intrusion rate in m/sec.
When there is no dummy in the test vehicle, the above expression can be solved for limiting values of the quantity
. . Substituting HIC=1000, r=250 , and s=165, yields a value of 165.An approximate criteria that would
predict acceptable HIC values could be stated as :
As with the TTI model described above, this model may not be appropriate for devices that are not breakaway polesand for impacts outside the range of typical values used in building the regression models. Equation 7 is presented as aguide for tests where it is not possible to use a dummy in the test vehicle. This model, due to the underlying data.should only be used in tests where there is a possibility of direct contact between the head
G-29
and the intruding object. In tests of guardrail terminals, for example, there is no possible contact between the headand the terminal so the HIC should not be evaluated. The HIC should always be evaluated for tall, narrow objectslike luminaires, utility poles and signs.
7 References
[1] AAAM, The abbreviated injury scale (AIS-80), tech. rep., American Association for AutomotiveMedicine, Morton Grove, IL, 1980.
[2] C. E. BUTH, G. R. SAMUELSON, AND R. M. OLSON, Crash tests and evaluation of highwayapurtenances, Tech. Rep. FHWA-RD-79-092, Federal Highway Administration, September 1979.
[3] C. C. CHOU, R. J. HOWELL, AND B. Y. CHANG, A review and evaluation of various HIC algorithms,SAE Technical Paper Series, (1988).
[4] N. R. C. COMMITTEE ON TRAUMA RESEARCH, Injury In America: A Continuing Public HealthProblem, National Academy Press, Washington, D.C., 1985.
[5] R .A. EPPINGER, J. H. MARCUS, AND R. M. MORGAN, Development of dummy and injury index fornhtsa's thoracic side impact protection research program, SAE Technical Paper Series, (1984).
[6] H. C. GABLER AND D. T. WILKE, Upper interior head impacts: The safety performance of passengervehicles, in Thirteenth International Technical Conference on Experimental Safety Vehicles, no. 91-59-0-07, National Highway Traffic Safety Administration, November 1991.
[7] J. R. HACKNEY, M. W. MONK, W. T. HOLLOWELL, L. K. SULLIVAN, AND D. T. WILLKE,Results of the national highway safety administration's thoracic side impact protection research program,SAE Technical Paper Series, (1984).
[8] R. L. HESS, K. WEBER, AND J. W. MELVIN, Review of literature and regulation relating to thoracicimpact tolerance and injury criteria, Tech. Rep. UM-HSRI-81-38, Motor Vehicle ManufacturingAssociation, Detroit, MI, 1981.
[9] H. J. HIGNETT, A sideway impact test into a 12.2m (40 ft) lighting column fitted with a break-away joint,Tech. Rep. RRL Report LR 241, Road Research Laboratory, Ministry of Transport, Crowthorne,Berkshire, UK, 1969.
[10] J. A. HINCH, J. A. HANSEN, M. W. HARGRAVE, AND D. R. STOUT, Full-scale side impacttesting, Tech. Rep. FHWA-RD-89-157, Federal Highway Administration, Washington, D.C., February1989.
[11] J. A. HINCH, G. MANARD, D. STOUT, AND R. OWINGS, Laboratory procedures to determine thebreakaway behavior of luminaire supports in minisized vehicle collisions, Tech. Rep. FHWA/RD-86/106,Federal Highway Administration, August 1987.
G-30
[12] J. A. HINCH AND D. STOUT, Tests 1785-SI#1-87 through 1785-SI#8-88, Federal HighwayAdministration, Washington, D.C., 1988.
[13] G. L. HOLSTEIN AND N. M. ALEM, Fast algorithm for computing HIC.
[14] F. C. III AND M. H. RAY, Side impact crash testing of highway safety hardware, in Highway Safety onTwo Continents, Vag-och Traffik Institutet, 1991.
[15] I. V. LAU AND D. C. VIANO, How and when blunt injury occurs - implications to frontal and sideimpact, SAE Technical Paper Series, (1988).
[16] K. K. MAK AND R. L. MASON, Accident analysis - breakaway and nonbreakawa poles including signand light standards along highways, tech. rep., National Highway Traffic Safety Administration,Washington, D.C., August 1980.
[17] L. MECZKOWSKI, Evaluation of test dummies for use in FHWA crash tests, FHWA staff report, FederalHighway Administration, Washington, D.C., January 1987.
[18] J. W. MELVIN AND K. WEBER, Review of Biomechan Impact Response and injury in the AutomotiveEnvironment, no. DOT HS 807 042, National Highway Traffic Safety Administration, Washington, D.C.,1985.
[19] J. D. MICHIE, Recommended procedures for the safety performance evaluation of highwayappurtenances, Tech. Rep. 230, National Cooperative Highway Research Program, 1981.
[20] R. M. MORGAN, J. H. MARCUS, AND R. H. EPPINGER, Side Impact - The Biofidelity of NHTSA 'sProposed ATD and Efficacy of TTI, no. P-189, Society of Automotive Engineers, October 1986.
[21] NHTSA, Federal motor vehicle safety standards: Side impact protection, Federal Register, 53 (1988), pp.2239-2260.
[22] Federal motor vehicle safety standards: Side impact protection - light trucks, vans, and multipurposepassenger vehicles, Federal Register, 53 (1988), pp. 31716-31720.
[23] Federal motor vehicle safety standards: Side impact protection - passenger cars, Federal Register, 53(1988), pp. 31712-31716.
[24] Federal motor vehicle safety standards: Side impact protection, Federal Register, 55 (1990), pp. 45722-45780.
[25] S. C. PARTYKA AND W. A. BOEHLY, Registration Based Fatality Rates by Car Size from 1978through 1987, no. DOT HS 80744, National Information Technical Service, Springfield, VA, 1989.
[26] P. PRASAD AND H. MERTZ, The position of the united states delegation to the iso working group 6 onthe use of HIC in the automotive environment, SAE Technical Paper Series, (1985).
G-31
[27] M. H. RAY, J. F. C. III, M. FARAMAWI, AND L. A. TROXEL, Side impact crash testing, Tech. Rep.draft, Federal Highway Administration, Washington, D.C., 1992.
[28] M. H. RAY, L. A. TROXEL, AND J. F. C. III, Characteristics of side impact accidents involving fixedroadside objects, Journal of Transportation Engineering, 117 (1991).
[29] H . E. Ross, D. L. SICKING, H. S. PERERA, AND J. D. MICHIE, Update of RECOMMENDEDPROCEDURES FOR THE SAFETY PERFORMANCE EVALUATION OF HIGHWAYAPPURTENANCES, tech. rep., National Cooperative Highway Research Program, July 1991. (SecondDraft).
[30] R. A. SMITH AND J. T. NOGA, Accuracy and sensitivity of crash, SAE Technical Paper Series, (1982).
[31] L. TROXEL, M. H. RAY, AND J. F. C. III, Side impact collisions with roadside obstacles,Transportation Research Record, (1991).
[32] L. A. TROXEL, M. H. RAY, AND J. F. C. III, Accident data analysis of side-impact, fixed-objectcollisions, Tech. Rep. FHWA-RD-91-122, Federal Highway Administration, Washington, D.C., 1991.
[33] T. TURBELL, Eftergivliga belysningsstolpar: Utveckling av en provningsmetod och forslag till krav,Tech. Rep. 204, Staten Vag- och Trafikinstitut (VTI), Linkoping, Sweden, 1980.
[34] D. C. VIANO, Biomechanics of injury in lateral impacts, Accident Analysis and Prevention, 21 (1989).
G-32
APPENDIX H
REFERENCES AND BIBLIOGRAPHY
1. MICHIE, J.D., "Recommended Procedures for the SafetyPerformance Evaluation of Highway Appurtenances,"NCHRPReport 230, Transportation Research Board,Washington, D.C. (March 1981).
2. HANSEN, A.G., HARGRAVE, M.W., and Horr, C.R.,"Validation of a Surrogate Vehicle for Luminaire SupportCertification Testing," Transportation Research Record 1233,Transportation Research Board, Washington, D.C. (1989).
3. BRAUER, S.K., MAYER, J.B., and KIRKSEY, R.E., "1800-lbPendulum Mass with 10-Stage Crushable Nose ElementCalibration Tests PCAL-1 & PCAL-2," Southwest ResearchInstitute Test Report, (October 1987).
4. Ross, H.E., JR., ET AL., "Safety Treatment of Roadside DrainageStructures," Transportation Research Record 868, TransportationResearch Board, Washington, D.C. (1982).
5. OLSON, R.M., ET AL., "Effect of Curb Geometry and Locationon Vehicle Behavior," NCHRP Report 150, TransportationResearch Board, Washington, D.C. (1974).
6. DELEYS, N.J., "Safety Aspects of Roadside Cross SectionDesign," Final Report, FHWA Contract No. DOT-FH-11-8189,Report No. FHWA-RD-75-41, Federal Highway Administration,Washington, D.C. (Feb. 1975).
7. Ross, H.E., JR., ET AL., "Roadside Safety Design for SmallVehicles," NCHRP Report 318, Transportation Research Board,Washington, D.C. (May 1989).
8. WEAVER, G.D., MARQUIS, E.L., and OLSON, R.M., "TheRelation of Side Slope Design to Highway Safety," NCHRPReport 158, Transportation Research Board, Washington, D.C.(1975).
9. SEGAL, D.J., "Highway-Vehicle-Object-Simulation-Model1976,"Report No. FHWA-RD-75-162 through 165. Four volumes,Federal Highway Administration, Washington, D.C. (Feb. 1976).
10. JAMES, M.E., and Ross, H.E., JR., "HVOSM User's Manual,"Research Report 140-9, Texas Transportation Institute, TexasA&M University, College Station, Texas (Aug. 1974).
11. IVEY, D.L., and SICKING, D.L., "The Influence of PavementEdge and Shoulder Characteristics on Vehicle Handling andStability," Transportation Research Record 1084, TransportationResearch Board, Washington, D.C. (1986).
12. ZIMMER, R., and IVEY, D.L., "Influence of Roadway SurfaceHoles on the Potential for Vehicle Loss of Control," ResearchReport 328-2F, Texas Transportation Institute, Texas A&MUniversity, College Station, TX (Aug. 1983).
13. NORDLIN, E.F., ET AL., "The Effect of Longitudinal Edge ofPaved Surface Drop-Off on Vehicle Stability," Report No. CA-DOT-TL-6783-1-76-22 California Department of Transportation(March 1976).
14. KLIEN, R.M., JOHNSON, W.A., and SZOSTAK, H.T.,"Influence of Roadway Disturbances on Vehicle Handling,"Systems
127
Technology, Inc., Final Report, Contract DOT-HS-5-01223(Oct. 1976).
15. BLIGH, R.P., and SICKING, D.L., "Applications of BarrierVII in the Design of Flexible Barriers," TransportationResearch Record 1233, Transportation Research Board,Washington, D.C. (1990).
16. SICKING, D.L., HEMSORACH, S., and BLIGH, R.P.,"Critical Impact Locations for Longitudinal Barriers," paperunder review by ASCE (1991).
17. BEASON, W.L., and HIRSCH, T.J., "Measurement of HeavyVehicle Impact Forces and Inertia Properties," Publ. No.FHWARD-89-120, Federal Highway Administration,Washington, D.C. (May 1989).
18. DELEYS, N.J., and PARADA, L.O., "Rollover Potential ofVehicles on Embankments, Sideslopes, and other RoadsideFeatures," Final Report, Contract No. DTF61-83-C-00060,Calspan Corp. (August 1986).
19. COUNCIL, F.M., ET AL., "Safe Geometric Design forMinicars,"Report No. FHWA/RD-87/047, Federal HighwayAdministration, Washington, D.C. (March 1987).
20. HARGRAVE, M.W., HANSEN, A.G., and HINCH, J.A., "ASummary of Recent Side Impact Research Conducted by theFed eral Highway Administration," ASCE Publication(1989).
21. RAY, M.H., and CARNEY, J.F., "Side Impact CrashTesting," Federal Highway Administration Contract DTFH61-88-R 00092, Vanderbilt University (Ongoing at time of thiswriting).
22. "Specifications for the Collection and Storage of Crash TestData," Volume II, Report No. FHWA-RD-91-039, FederalHighway Administration, Washington, D.C. (1991).
23. SOLOMON, D., and BOYD, H., "Model Procedure for In-Service Evaluation of Roadside Safety Hardware Devices,"Report No. FHWA-IP-86-8, Federal Highway Administration,Washington, D.C. (April 1986).
24. LEONIN, C., and POWERS, R., "In-Service Evaluatiofi ofExperimental Traffic Barriers: An Interim Report," ReportNo.FHWA-DP64/EP7-1, Federal Highway Administration,Washington, D.C. (April 1986).
25. PERERA, H.S., "Development of an Improved Highway-Vehicle-Object- Simulation Model for Multi-Faced RigidBarriers, "Transportation Research Record 1233,Transportation Research Board, Washington, D.C. (1989).
26. PERERA, H.S., and Ross, H.E., JR., "Prediction of RolloverCaused by Concrete Safety-Shape Barriers," TransportationResearch Record 1233, Transportation Research Board,Washington, D.C. (1989).
27. AASHTO, "Roadside Design Guide," American Association ofState Highway and Transportation Officials, Washington, D.C.(1988).
128
28. AASHTO, "AASHTO Standard Specifications for Highway
Bridges," American Association of State Highway and
Transportation Officials, Washington, D.C. (1989).29. AASHTO, "Guide Specification for Bridge Railings," American
Association of State Highway and Transportation Officials,Washington, D.C. (1989).
31. "A Guide to Standardized Highway Barrier Rail Hardware,"Technical Bulletin No. 268B, Joint Report from AASHTO, AGC,ARTBA Task Force 13, American Road and TransportationBuilders, Washington, D.C. (June 1979).
32. BUTH, E., ET AL., "Development of Safer Bridge RailingDesigns," Final Report Draft, FHWA Contract FH- 1-9181, Federal Highway Administration, Washington, D.C. (Feb. 1981).
33. MICHIE, J.D., CALCOTE, L.R., and BRONSTAD, M.E.,"Guardrail Performance and Design," NCHRP Report 115,Transportation Research Board, Washington, D.C. (1971).
34. BRONSTAD, M.E., ET AL., "Guardrail-Bridge Rail TransitionDesigns," Research Report FHWA/RD-86/178, Volume I,Southwest Research Institute (April 1988).
35. BUTH, E., ET AL., "Performance Limits of Longitudinal BarrierSystems," Final Report on Contract DTFH61-82-C-00051, TexasTransportation Institute, Texas A&M Research Foundation,College Station, Texas (May 1985).
36. SICKING, D.L., and Ross, H.E., JR., "Structural Optimization ofStrong Post W-beam Guardrail," Transportation ResearchRecord 1133, Transportation Research Board, Washington, D.C.(1987).
37. BRONSTAD, M.E., CALCOTE, L.R., and KIMBALL, C.E.,"Concrete Median Barrier Research," Final report, ContractDOTFH-11-8130, Volumes I and II, Southwest Research Institute(June 1976).
38. LAWRENCE, L.R., and HATTON, J.H., JR., "CrashCushionsSelection Criteria and Design," Federal HighwayAdministration, Washington, D.C. (Sept. 1975).
40. AASHTO, "AASHTO Standard Specifications for StructuralSupports for Highway Signs, Luminaires and Traffic Signals,"American Association of State Highway and TransportationOfficials, Washington, D.C. (1985).
41. "A Guide to Standardized Highway Lighting Pole Hardware,"Technical Bulletin No. 270, Joint Report from AASHTO, AGC,ARTBA Task Force 13, American Road and TransportationBuilders, Washington, D.C. (April 1980).
42. EDWARDS, T.C., ET AL., "Development of Design Criteria forSafer Luminaire Supports," NCHRP Report 77, TransportationResearch Board, Washington, D.C. (1969).
43. "Cost-Effectiveness of Small Highway Sign Supports," FHWAContract FH-11-8821, Report No. FHWA/RD/80/502, FederalHighway Administration, Washington, D.C. (1980).
44. LABRA, J.J., "Development of Safer Utility Poles," ContractDOT-FH-11-8909, Final Report, Southwest Research Institute(Feb. 1980).
45. IVEY, D.L., and MORGAN, J.R., "Timber Pole Safety ByDesign," Transportation Research Record No. 1065,Transportation Research Board, Washington, D.C. (1986).
46. SCHIEFFERLY, C., and MARLOW, J., "Development of aLightweight Truck Mounted Attenuator," 32036-609934,California Department of Transportation, Sacramento, California(July 1983).
47. STOUGHTON, R.L., STOKER, J.R., and NORDLIN, E.F.,"Vehicular Impact Tests of a Truck Mounted AttenuatorContaining Vermiculite Concrete Cells," 33001-609936,California Department of Transportation, Sacramento, California(June 1980).
48. GRIFFIN, L.I., III, ET AL., "An Evaluation of Selected TruckMounted Attenuators (TMA's) with Recommended PerformanceSpecifications," Texas Transportation Institute, Texas A&MUniversity, College Station, Texas (December 1990).
49. POWELL, G.H., "A Computer Program for Evaluation ofAutomobile Barrier Systems," Report DOT-RD-73-51, FederalHighway Administration, U.S. Department of Transportation,Washington, D.C. (1973).
50. CHOU, C.C., ET AL., "Guard Version 3.1 Users andProgrammers Manual," Final Report on Contract DTFH61-87-Z-00116, Federal Highway Administration, Washington, D.C. (July1989).
51. CHOU, C.C., HANCOCK, K., and BASU, S., "NARD:Numerical Analysis of Roadside Design, Version 2.0," FinalReport on Contract DTFH61-87-Z-00116, Federal HighwayAdministration, Washington, D.C. (July 1989).
52. SOLOMON, P.L., "The Simulation Model of AutomobileCollisions (SMAC) Operator's Manual," National HighwayTraffic Safety Administration (Oct. 1974).
53. MICHIE, J.D., "Performance and Operational Experience ofTruck-Mounted Attenuators," NCHRP Project 20-5, Topic 2201,Dynatech Engineering, INC. (in progress at time of this writing).
54. "Delphi V-Forecast and Analysis of the U.S. AutomotiveIndustry Through the Year 2000," University of MichiganTransportation Research Institute, Ann Arbor, Michigan (July1989).
55. BRONSTAD, M.E., and MICHIE, J.D., "Multiple-Service-LevelHighway Bridge Railing Selection Procedures," NCHRP Report239, Transportation Research Board, Washington, D.C.(November 1981).
56. Energy Absorption Systems, Inc., One East Wacker Drive,Chicago, Illinois, 60601.
57. Syro Steel Company, 1170 N. State Street, Girard, Ohio 44420.58. CALCOTE, L.R., "Development of a Cost-Effectiveness Model
for Guardrail Selection," Final Report on Contract DOT-FH11-8827, Southwest Research Institute, San Antonio, Texas(November 1977).
60. DEWEY, J.F., ET AL., "A Study of the Soil-Structure InteractionBehavior of Highway Guardrail Posts," Research Report 3431,Texas Transportation Institute, Texas A&M University System,College Station, Texas (July 1983).
61. STOUT, D., HINCH, J., and SAWYER, D., "Guardrail TestingProgram," Final Report on Contract DTFH71-87-C-00002, Ensconc., Springfield, Virginia (June 1990).
62. STOUT, D., HINCH, J., and YANG, T.L., "Force-DeflectionCharacteristics of Guardrail Posts," Final Report on ContractDTFH61-85-C-00099, Ensco Inc., Springfield, Virginia (Sept.1988).
63. EGGERS, D.W., and HIRSCH, T.J., "The Effects of EmbedmentDepth, Soil Properties, and Post Type on the Performance ofHighway Guardrail Post," Research Report 405-1, Texas
Transportation Institute, Texas A&M University System, CollegeStation, Texas (Aug. 1986).
64. BEEDLE, L.S., "Plastic Design of Steel Frames," John Wiley &Sons, Inc., New York, New York (1958).
65. AMERICAN INSTITUTE of STEEL CONSTRUCTION,Manual of Steel Construction, Chicago, Illinois.
66. FLECK, J.T., "Validation of the Crash Victim Simulator," ReportNo. DOT-HS-806 279, Volumes I through IV, U.S. Departmentof Transportation, Washington, D.C. (December 1981).
67. VIANO, D.C., and LAU, I.V., "Biomechanics of Impact Injury,"Research Publication GMR-6894, General Motors ResearchLaboratories (December 1989).
68. RAY, M.H., and MICHIE, J.D., "Evaluation of Design AnalysisProcedures and Acceptance Criteria for Roadside HardwareVol.IV: The Importance of the Occupant Risk Criteria," Report No.FHWA/RD-87/099, Federal Highway Administration,Washington, D.C. (July 1987).
69. HINCH, J., ET AL., "Impact Attenuators: A Current EngineeringEvaluation," Transportation Research Record 1198,Transportation Research Board, Washington, D.C. (1988).
70. SNYDER, R.G., "State-of-the-Art-Human Impact Tolerances,"SAE 700398 (rev. Aug 1970); reprinted from 1970 InternationalAutomobile Safety Conference Compendium (May 1970).
71. RAY, M.H., ET AL., "Evaluation of Design Analysis Proceduresand Acceptance Criteria for Roadside Hardware-Vol. V: Hazardsof the Redirected Car," Report No. FHWA/RD-87/100, FederalHighway Administration, Washington, D.C. (July 1987).
72. HIRSCH, T.J., "Longitudinal Barriers for Busses and Trucks,"Transportation Research Record No. 1052, TransportationResearch Board, Washington, D.C. (1986).
129
73. CARNEY, J.F., III, "Development of a Metal Tube CrashCushion for Narrow Hazard Highway Sites," Report FHWA-CTRD-HPR-1080, Federal Highway Administration, U.S.Department of Transportation, Washington, D.C. (1986).
74. RAY, M.H., and CARNEY, J.F., III, "Side Impact Test andEvaluation Procedures for Roadside Structure Crash Tests,"Final Report, Contract DTFH61-88-R-00092, Department ofCivil and Environmental Engineering, VanderbiltUniversity, Nashville, Tennessee (March 1992).
75. NATIONAL SAFETY COUNCIL, "Vehicle Damage Scalefor Traffic Accident Investigators," 444 North MichiganAvenue, Chicago, Illinois 60611 (1984).
76. SOCIETY OF AUTOMOBILE ENGINEERS, "CollisionDeformation Classification, Recommended Practice J224a,"SAE, New York, New York (1972).
77. EUROPEAN COMMITTEE FOR STANDARDIZATION,"Road Restraint Systems" (publication expected in 1993).
78. LAKER, I.B., and PAYNE, A.R., "The Theoretical HeadImpactVelocity Concept," Workshop on InternationalHarmonization of Testing and Evaluation Procedures forRoadside Safety Hardware, Transportation Research Board,Washington, D.C. (Jan. 1991).
79. LAKER, I.B., "A Guide to the Measurement of TheoreticalHead Impact Velocity (THIV) and Post-Impact HeadDeceleration (PHD), TRRL3.691.
80. Ross, H.E., JR., and POST, E.R., "Criteria for GuardrailNeed and Location on Embankments," Research Report140-4, Texas Transportation Institute, Texas A&MUniversity (Aug. 1971).
81. "Road Vehicles with Two Axles-Determination of Centre ofGravity," International Organization for Standardization,Reference Number ISO 10392:1992(E), First Edition (June6, 1992).
130
APPENDIX I
GLOSSARY
AASHTO American Association of State Highway andTransportation Officials.ACI American Concrete Institute.
AISC American Institute of Steel Construction.AISI American Iron and Steel Institute.ASI Acceleration Severity Index.ASTM American Society for Testing and Materials.Ballast Mass added to vehicle, other than simulated occupant(s)
and instrumentation, to simulate cargo and/or to achievedesired test inertial mass.
Bogie A device used as a surrogate for a production model testvehicle. Existing bogies are four-wheeled devices that aretowedinto the test article. They are typically designed toreplicate the dynamic response of a vehicle for specific tests,e.g., tests of breakaway features. Bogies typically can be usedfor both lowand high-speed tests.
Center of Mass (c.m.) Point within test vehicle at which its totalmass can be assumed to be concentrated.
Clear Zone The total roadside border area, starting at the edge ofthe traveled way, available for safe use by errant vehicles. Thisarea may consist of a shoulder, a recoverable slope, anonrecoverable slope, and/or a clear run-out area. The desiredwidth is dependent on the traffic volumes and speeds and onthe roadside geometry.
Crash Cushion A device designed primarily to safely stop avehicle within a relatively short distance. A redirective crashcushion is designed to contain and redirect a vehicle impactingdownstream from the nose of the cushion. A nonredirectivecrash cushion is designed to contain and capture a vehicleimpacting downstream from the nose of the cushion.
Crash Test A test in which a production model test vehicle or asurrogate test vehicle impacts or traverses a highway feature.Critical Impact Angle (CIA) For a given test and theattendant range of vehicular impact angles, the CIA is theangle withinthis range judged to have the greatest potential for causing afailure when the test is assessed by the recommendedevaluation criteria. For most tests, impact angles can rangefrom 0 up to 25 degrees.
Critical Impact Point (CIP) For a given test, the CIP is the initialpoint(s) of vehicular contact along the longitudinal dimensionof a feature judged to have the greatest potential for causing afailure when the test is assessed by the recommendedevaluation criteria.
Curb Mass Mass of test vehicle with standard equipment,maximum capacity of engine fuel, oil and coolant and, if soequipped, air conditioning and additional optional massengine. It does not include occupants or cargo.
Device Refers to a design or a specific part thereof, such as abreakaway device. Note that the terms "device" and"feature"are often synonymous.
Evaluation Criteria Criteria used to assess the results of a crashtest or to assess the in-service performance of a feature.
Feature Refers to a specific element of a highway. It may be ahardware item and its associated foundation, such as a signorbarrier installation, or it may be a geometric element, suchas a side slope or a ditch cross section.
FHWA Federal Highway Administration.Flail Space Hypothetical space in which a hypothetical
occupant is permitted to move during impact.Gating Device (Feature) A device designed to allow controlled
penetration of a vehicle when impacted upstream of thebeginning of the length of need (LON). Note there is somedistance between the end of a gating device and thebeginning of the LON of the device.
Geometric Feature A roadside cross section element such as aditch section, an embankment, a driveway or a mediancrossover, or a curb. It also includes drainage structures suchas inlets and culvert ends and devices such as grates used toenhance safety of these features.
Gross Static Mass Sum of test inertial mass and mass ofsurrogate occupant(s).
Hybrid III Dummy An anthropomorphic dummy, representingthe 50th percentile male, the specifications of which arecontained in part 572, Subpart E, Title 49 of the Code ofFederal Regulations, Chapter V-(10-1-88 Edition).
Impact Angle (Θ) Angle between normal direction of trafficand approach path of test vehicle into the test article. Thetest article should be oriented as it would typically be inservice with respect to the normal direction of traffic.
Impact Point The initial point on a test article contacted by theimpacting test vehicle.
Impact Severity (IS) A measure of the impact severity of avehicle of mass M, impacting at a speed V, at an impactangle Θ. It is defined as follows: IS = 1/2M(V Sin Θ)2
Length of Need (LON) That part of a longitudinal barrier orterminal designed to contain and redirect an errant vehicle.
Longitudinal Barrier A device whose primary functions are toprevent vehicular penetration and to safely redirect an errantvehicle away from a roadside or median hazard. The threetypes of longitudinal barriers are roadside barriers, medianbarriers, and bridge rails.
Nongating Device A device with redirectional capabilitiesalong its entire length. Note that the end of a nongatingdevice is the beginning of the length of need for the device.
Occupant Impact Velocity Velocity at which a hypothetical"point mass" occupant impacts a surface of a hypotheticaloccupant compartment.
Pendulum A device used as a surrogate for a production modeltest vehicle. A mass is attached to cables, which are in turnsuspended from a fixed point. The mass is raised to aselected height and released, allowing gravity to acceleratethe mass as it swings into the test article. The structure ofthe mass can be designed to replicate the dynamic crushproperties of a produc tion model test vehicle. It isbasically a low-speed test device.
Permanent Feature (Device) A feature with an anticipatedlong duration of service, as opposed to those used in a workor construction zone having a relatively short duration ofservice.
Pocketing If, on impact, a redirective device undergoesrelatively large lateral displacements within a relativelyshort longitudinal
distance, pocketing is said to have occurred. Depending on thedegree, pocketing can cause large and unacceptablevehicular decelerations.
PHD Post-Impact Head Deceleration.Production Model Test Vehicle A commercially available
vehicle with properties matching those required in a giventest. Ridedown Acceleration Acceleration experienced by ahypothetical "point mass" occupant subsequent to impactwith a hypothetical occupant compartment.SAE Society of Automotive Engineers.
Sprung Mass All mass that is supported by a vehicle'ssuspension system, including portions of the mass of thesuspensionmembers.
Snagging When a portion of a test vehicle, such as awheel,engages a vertical element in a redirective device,such as apost, snagging is said to have occurred. Thedegree of snagging depends on the degree of engagement.Snagging may cause large and unacceptable vehiculardecelerations.
Support Structure A system used to support a sign panel,chevronpanel, luminaire, utility lines, mailbox, oremergency call box.The system includes the post(s),pole(s), structural elements, foundation, breakawaymechanism if used, and accompanying hardware used tosupport the given feature.
SI International System of Units.Surrogate Occupant A dummy, set of sand bags, or other
artifact used to simulate the effects and/or to study thedynamic responseof an occupant in a vehicle.
Surrogate Test Vehicle A bogie, pendulum device, or othersubstitute device designed to replicate the dynamicresponse of aproduction model vehicle when in collisionwith a roadside feature.
131
Temporary Feature (Device) A feature used in a work,construction, or maintenance zone. Its duration of use isnormally relatively short, usually one year or less.
Terminal A device designed to treat the end of a longitudinalbarrier. A terminal may function by (a) decelerating avehicle to a safe stop within a relatively short distance, (b)permitting controlled penetration of the vehicle behind thedevice, (c) containing and redirecting the vehicle, or (d) acombination of a, b, and c.
Test Article (Test Feature) All components of a system,including the foundation as relevant, being evaluated in acrash test. Notethat the system may be a geometric featuresuch as a ditch or driveway slope.
Test Inertial Mass Mass of test vehicle and all items rigidlyattached to vehicle's structure, including ballast andinstrumentation. Mass of surrogate occupant(s), if used, isnot included in test inertial mass.
Test Level (TL) A set of conditions, defined in terms ofvehiculartype and mass, vehicular impact speed, andvehicular impact angle, that quantifies the impact severityof a matrix of tests.
Test Vehicle A commercially available, production modelvehicle or an approved surrogate vehicle used in a crash testto evaluate the impact performance of a test article.
THIV Theoretical Head Impact Velocity.Track Width Center-of-tire-to-center-of-tire distance for a
givenaxle of a vehicle.Transition That part of a longitudinal barrier system between
and connecting sections of differing lateral stiffness and/orsectionsof differing design or geometry.
Truck-Mounted Attenuator (TMA) An energy-absorbingdeviceattached to the rear of a truck or utility vehicle. ATMA isdesigned to provide a controlled stop of a vehicleimpacting the rear of the truck.
Unsprung Mass All mass which is not carried by thesuspensionsystem but is supported directly by the tire orwheel and considered to move with it.
Utility Pole A support structure used to support powertransmission lines or communication lines.
Work Zone Traffic Control Device A device used in a workzone to regulate, warn, and guide road users and advise themtotraverse a section of highway or street in the propermanner. Work zone traffic control devices of interest hereininclude signs, plastic drums, and lights that may be usedthereon; cones, barricades, chevron panels, and their supportsystem; and any other such device(s) commonly exposed totraffic that may pose a hazard to occupants of a vehicleand/or to work zone personnel.
APPENDIX J
SI CONVERSIONS
To convert from____________ To_________________ Multiply byl____
ACCELERATION
Meter per second squared (m/s2) ft/s2 3.280 840 E+00
AREA
Square meter (m2) ft2 1.076 391 E+01
ENERGY
Joule (J) ft-lbf 7.375 621 E-01
FORCE
Newton (N) pound-force (lbf) 2.248 089 E-01
LENGTH
Meter (m) ft 3.280 840 E+00 Meter (m) in 3.937 008 E+01Centimeter (cm) in 3.937 008 E-01
Kilometer per hour (km/h) miles per hour (mi/h) 6.213 712 E-01Kilometer per hour (km/h) ft/s 9.113 444 E-01Meter per second (m/s) ft/s 3.280 840 E+00
1 Numbers to the left of "E" are multiplied by 10 raised to an exponent equal to the number, andaccompanying sign, to the right of "E."
ii
THE TRANSPORTATION RESEARCH BOARD is a unit of the National ResearchCouncil, which serves the National Academy of Sciences and the National Academy ofEngineering. It evolved in 1974 from the Highway Research Board which wasestablished in 1920. The TRB incorporates all former HRB activities and also performsadditional functions under a broader scope involving all modes of transportation and theinteractions of transportation with society. The Board's purpose is to stimulate researchconcerning the nature and performance of transportation systems, to disseminateinformation that the research produces, and to encourage the application of appropriateresearch findings. The Board's program is carried out by more than 270 committees, taskforces, and panels composed of more than 3,300 administrators, engineers, socialscientists, attorneys, educators, and others concerned with transportation; they servewithout compensation. The program is supported by state transportation and highwaydepartments, the modal administrations of the U.S. Department of Transportation, theAssociation of American Railroads, the National Highway Traffic Safety Administration,and other organizations and individuals interested in the development of transportation.
The National Academy of Sciences is a private, nonprofit, self-perpetuating society ofdistinguished scholars engaged in scientific and engineering research, dedicated to thefurtherance of science and technology and to their use for the general welfare. Upon theauthority of the charter granted to it by the Congress in 1863, the Academy has a mandatethat requires it to advise the federal government on scientific and technical matters. Dr.Frank Press is president of the National Academy of Sciences.
The National Academy of Engineering was established in 1964, under the charter of theNational Academy of Sciences, as a parallel organization of outstanding engineers. It isautonomous in its administration and in the selection of its members, sharing with theNational Academy of Sciences the responsibility for advising the federal government.The National Academy of Engineering also sponsors engineering programs aimed atmeeting national needs, encourages education and research and recognizes the superiorachievements of engineers. Dr. Robert M. White is president of the National Academy ofEngineering.
The Institute of Medicine was established in 1970 by the National Academy ofSciences to secure the services of eminent members of appropriate professions in theexamination of policy matters pertaining to the health of the public. The Institute actsunder the responsibility given to the National Academy of Sciences by its congressionalcharter to be an adviser to the federal government and, upon its own initiative, to identifyissues of medical care, research, and education. Dr. Kenneth I. Shine is president of theInstitute of Medicine.
The National Research Council was organized by the National Academy of Sciences in1916 to associate the broad community of science and technology with the Academy'spurpose of furthering knowledge and advising the federal government. Functioning inaccordance with general policies determined by the Academy, the Council has becomethe principal operating agency of both the National Academy of Sciences and theNational Academy of Engineering in providing services to the government, the public,and the scientific and engineering communities. The Council is administered jointly byboth Academies and the Institute of Medicine. Dr. Frank Press and Dr. Robert M. Whiteare chairman and vice chairman, respectively, of the National Research Council.
Transportation Research BoardNational Research Council2101 Constitution Avenue, N.W.Washington, D.C. 20418_____________________________________ADDRESS CORRECTION REQUESTED