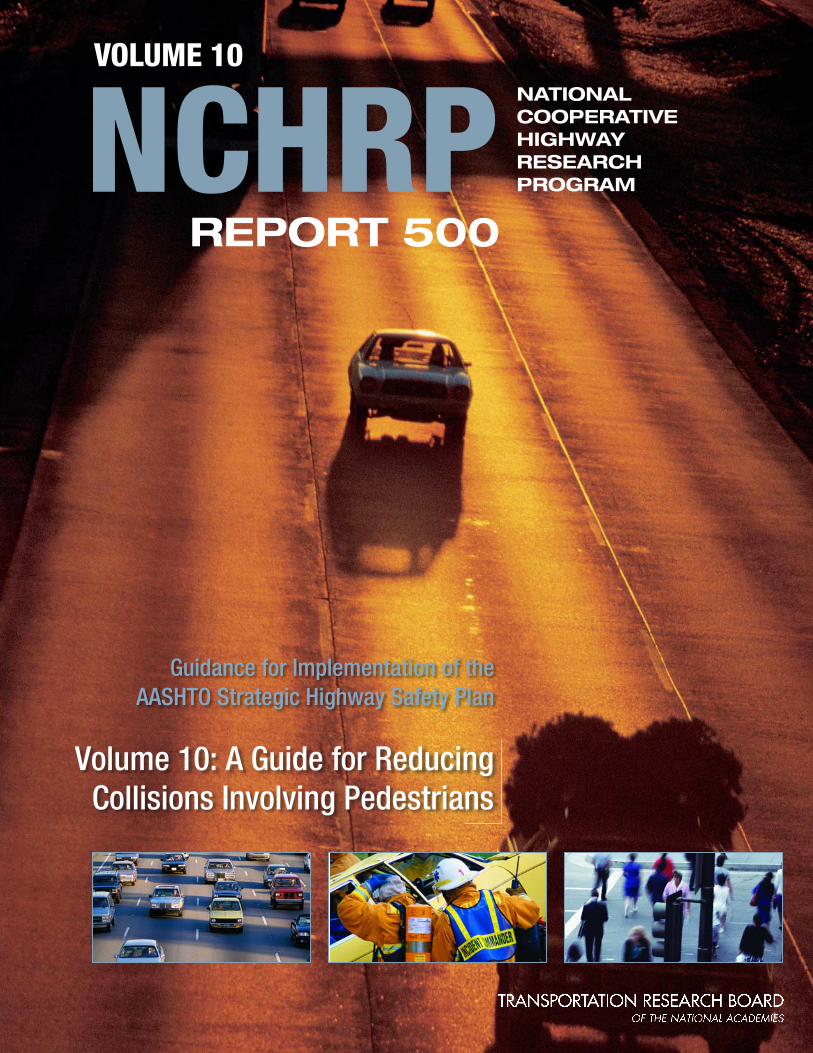
NATIONAL COOPERATIVE HIGHWAY RESEARCH PROGRAM NCHRP REPORT 500 VOLUME 10 Volume 10: A Guide for Reducing Collisions Involving Pedestrians Guidance for Implementation of the AASHTO Strategic Highway Safety Plan
Transcript
NATIONALCOOPERATIVE HIGHWAYRESEARCH PROGRAMNCHRP
REPORT 500
VOLUME 10
Volume 10: A Guide for Reducing Collisions Involving Pedestrians
Guidance for Implementation of theAASHTO Strategic Highway Safety Plan
TRANSPORTATION RESEARCH BOARD EXECUTIVE COMMITTEE 2004 (Membership as of January 2004)
OFFICERSChair: Michael S. Townes, President and CEO, Hampton Roads Transit, Hampton, VA Vice Chair: Joseph H. Boardman, Commissioner, New York State DOTExecutive Director: Robert E. Skinner, Jr., Transportation Research Board
MEMBERSMICHAEL W. BEHRENS, Executive Director, Texas DOTSARAH C. CAMPBELL, President, TransManagement, Inc., Washington, DCE. DEAN CARLSON, Director, Carlson Associates, Topeka, KSJOHN L. CRAIG, Director, Nebraska Department of RoadsDOUGLAS G. DUNCAN, President and CEO, FedEx Freight, Memphis, TNGENEVIEVE GIULIANO, Director, Metrans Transportation Center and Professor, School of Policy, Planning, and Development, USC,
Los AngelesBERNARD S. GROSECLOSE, JR., President and CEO, South Carolina State Ports AuthoritySUSAN HANSON, Landry University Professor of Geography, Graduate School of Geography, Clark UniversityJAMES R. HERTWIG, President, Landstar Logistics, Inc., Jacksonville, FLHENRY L. HUNGERBEELER, Director, Missouri DOTADIB K. KANAFANI, Cahill Professor of Civil Engineering, University of California, Berkeley RONALD F. KIRBY, Director of Transportation Planning, Metropolitan Washington Council of GovernmentsHERBERT S. LEVINSON, Principal, Herbert S. Levinson Transportation Consultant, New Haven, CTSUE MCNEIL, Director, Urban Transportation Center and Professor, College of Urban Planning and Public Affairs, University of
Illinois, ChicagoMICHAEL D. MEYER, Professor, School of Civil and Environmental Engineering, Georgia Institute of TechnologyKAM MOVASSAGHI, Secretary of Transportation, Louisiana Department of Transportation and DevelopmentCAROL A. MURRAY, Commissioner, New Hampshire DOTJOHN E. NJORD, Executive Director, Utah DOTDAVID PLAVIN, President, Airports Council International, Washington, DCJOHN REBENSDORF, Vice President, Network and Service Planning, Union Pacific Railroad Co., Omaha, NEPHILIP A. SHUCET, Commissioner, Virginia DOTC. MICHAEL WALTON, Ernest H. Cockrell Centennial Chair in Engineering, University of Texas, AustinLINDA S. WATSON, General Manager, Corpus Christi Regional Transportation Authority, Corpus Christi, TX
MARION C. BLAKEY, Federal Aviation Administrator, U.S.DOT (ex officio)SAMUEL G. BONASSO, Acting Administrator, Research and Special Programs Administration, U.S.DOT (ex officio)REBECCA M. BREWSTER, President and COO, American Transportation Research Institute, Smyrna, GA (ex officio)GEORGE BUGLIARELLO, Chancellor, Polytechnic University and Foreign Secretary, National Academy of Engineering (ex officio)THOMAS H. COLLINS (Adm., U.S. Coast Guard), Commandant, U.S. Coast Guard (ex officio)JENNIFER L. DORN, Federal Transit Administrator, U.S.DOT (ex officio)ROBERT B. FLOWERS (Lt. Gen., U.S. Army), Chief of Engineers and Commander, U.S. Army Corps of Engineers (ex officio)EDWARD R. HAMBERGER, President and CEO, Association of American Railroads (ex officio)JOHN C. HORSLEY, Executive Director, American Association of State Highway and Transportation Officials (ex officio)RICK KOWALEWSKI, Deputy Director, Bureau of Transportation Statistics, U.S.DOT (ex officio)WILLIAM W. MILLAR, President, American Public Transportation Association (ex officio) MARY E. PETERS, Federal Highway Administrator, U.S.DOT (ex officio)SUZANNE RUDZINSKI, Director, Transportation and Regional Programs, U.S. Environmental Protection Agency (ex officio)JEFFREY W. RUNGE, National Highway Traffic Safety Administrator, U.S.DOT (ex officio)ALLAN RUTTER, Federal Railroad Administrator, U.S.DOT (ex officio)ANNETTE M. SANDBERG, Federal Motor Carrier Safety Administrator, U.S.DOT (ex officio)WILLIAM G. SCHUBERT, Maritime Administrator, U.S.DOT (ex officio)ROBERT A. VENEZIA, Program Manager of Public Health Applications, National Aeronautics and Space Administration (ex officio)
NATIONAL COOPERATIVE HIGHWAY RESEARCH PROGRAM
Transportation Research Board Executive Committee Subcommittee for NCHRPMICHAEL S. TOWNES, Hampton Roads Transit, Hampton, VA
(Chair)JOSEPH H. BOARDMAN, New York State DOTGENEVIEVE GIULIANO, University of Southern California,
Los Angeles
JOHN C. HORSLEY, American Association of State Highway and Transportation Officials
MARY E. PETERS, Federal Highway Administration ROBERT E. SKINNER, JR., Transportation Research BoardC. MICHAEL WALTON, University of Texas, Austin
NATIONAL COOPERATIVE HIGHWAY RESEARCH PROGRAM
NCHRP REPORT 500
SUBJECT AREAS
Safety and Human Performance
Guidance for Implementation of the AASHTO Strategic Highway Safety Plan
Volume 10: A Guide for Reducing Collisions Involving Pedestrians
CHARLES V. ZEGEER
University of North Carolina Highway Safety Research CenterChapel Hill, NC
JANE STUTTS
University of North Carolina Highway Safety Research CenterChapel Hill, NC
HERMAN HUANG
Sprinkle ConsultingLutz, FL
MICHAEL J. CYNECKI
City of PhoenixPhoenix, AZ
RON VAN HOUTEN
Mount Saint Vincent UniversityHalifax, Nova Scotia
BARBARA ALBERSON
California Department of Health ServicesSacramento, CA
RONALD PFEFER
Maron Engineering, Ltd.Zikhron Yaacov, Israel
TIMOTHY R. NEUMAN
KEVIN L. SLACK
KELLY K. HARDY
CH2M HILLHerndon, VA
T R A N S P O R T A T I O N R E S E A R C H B O A R DWASHINGTON, D.C.
2004www.TRB.org
Research Sponsored by the American Association of State Highway and Transportation Officials in Cooperation with the Federal Highway Administration
NATIONAL COOPERATIVE HIGHWAY RESEARCH PROGRAM
Systematic, well-designed research provides the most effectiveapproach to the solution of many problems facing highwayadministrators and engineers. Often, highway problems are of localinterest and can best be studied by highway departmentsindividually or in cooperation with their state universities andothers. However, the accelerating growth of highway transportationdevelops increasingly complex problems of wide interest tohighway authorities. These problems are best studied through acoordinated program of cooperative research.
In recognition of these needs, the highway administrators of theAmerican Association of State Highway and TransportationOfficials initiated in 1962 an objective national highway researchprogram employing modern scientific techniques. This program issupported on a continuing basis by funds from participatingmember states of the Association and it receives the full cooperationand support of the Federal Highway Administration, United StatesDepartment of Transportation.
The Transportation Research Board of the National Academieswas requested by the Association to administer the researchprogram because of the Board’s recognized objectivity andunderstanding of modern research practices. The Board is uniquelysuited for this purpose as it maintains an extensive committeestructure from which authorities on any highway transportationsubject may be drawn; it possesses avenues of communications andcooperation with federal, state and local governmental agencies,universities, and industry; its relationship to the National ResearchCouncil is an insurance of objectivity; it maintains a full-timeresearch correlation staff of specialists in highway transportationmatters to bring the findings of research directly to those who are ina position to use them.
The program is developed on the basis of research needsidentified by chief administrators of the highway and transportationdepartments and by committees of AASHTO. Each year, specificareas of research needs to be included in the program are proposedto the National Research Council and the Board by the AmericanAssociation of State Highway and Transportation Officials.Research projects to fulfill these needs are defined by the Board, andqualified research agencies are selected from those that havesubmitted proposals. Administration and surveillance of researchcontracts are the responsibilities of the National Research Counciland the Transportation Research Board.
The needs for highway research are many, and the NationalCooperative Highway Research Program can make significantcontributions to the solution of highway transportation problems ofmutual concern to many responsible groups. The program,however, is intended to complement rather than to substitute for orduplicate other highway research programs.
Note: The Transportation Research Board of the National Academies, theNational Research Council, the Federal Highway Administration, the AmericanAssociation of State Highway and Transportation Officials, and the individualstates participating in the National Cooperative Highway Research Program donot endorse products or manufacturers. Trade or manufacturers’ names appearherein solely because they are considered essential to the object of this report.
Published reports of the
NATIONAL COOPERATIVE HIGHWAY RESEARCH PROGRAM
are available from:
Transportation Research BoardBusiness Office500 Fifth Street, NWWashington, DC 20001
The project that is the subject of this report was a part of the National Cooperative
Highway Research Program conducted by the Transportation Research Board with the
approval of the Governing Board of the National Research Council. Such approval
reflects the Governing Board’s judgment that the program concerned is of national
importance and appropriate with respect to both the purposes and resources of the
National Research Council.
The members of the technical committee selected to monitor this project and to review
this report were chosen for recognized scholarly competence and with due
consideration for the balance of disciplines appropriate to the project. The opinions and
conclusions expressed or implied are those of the research agency that performed the
research, and, while they have been accepted as appropriate by the technical committee,
they are not necessarily those of the Transportation Research Board, the National
Research Council, the American Association of State Highway and Transportation
Officials, or the Federal Highway Administration, U.S. Department of Transportation.
Each report is reviewed and accepted for publication by the technical committee
according to procedures established and monitored by the Transportation Research
Board Executive Committee and the Governing Board of the National Research
Council.
The National Academy of Sciences is a private, nonprofit, self-perpetuating society of distinguished schol-ars engaged in scientific and engineering research, dedicated to the furtherance of science and technology and to their use for the general welfare. On the authority of the charter granted to it by the Congress in 1863, the Academy has a mandate that requires it to advise the federal government on scientific and techni-cal matters. Dr. Bruce M. Alberts is president of the National Academy of Sciences.
The National Academy of Engineering was established in 1964, under the charter of the National Acad-emy of Sciences, as a parallel organization of outstanding engineers. It is autonomous in its administration and in the selection of its members, sharing with the National Academy of Sciences the responsibility for advising the federal government. The National Academy of Engineering also sponsors engineering programs aimed at meeting national needs, encourages education and research, and recognizes the superior achieve-ments of engineers. Dr. William A. Wulf is president of the National Academy of Engineering.
The Institute of Medicine was established in 1970 by the National Academy of Sciences to secure the services of eminent members of appropriate professions in the examination of policy matters pertaining to the health of the public. The Institute acts under the responsibility given to the National Academy of Sciences by its congressional charter to be an adviser to the federal government and, on its own initiative, to identify issues of medical care, research, and education. Dr. Harvey V. Fineberg is president of the Institute of Medicine.
The National Research Council was organized by the National Academy of Sciences in 1916 to associate the broad community of science and technology with the Academy’s purposes of furthering knowledge and advising the federal government. Functioning in accordance with general policies determined by the Acad-emy, the Council has become the principal operating agency of both the National Academy of Sciences and the National Academy of Engineering in providing services to the government, the public, and the scientific and engineering communities. The Council is administered jointly by both the Academies and the Institute of Medicine. Dr. Bruce M. Alberts and Dr. William A. Wulf are chair and vice chair, respectively, of the National Research Council.
The Transportation Research Board is a division of the National Research Council, which serves the National Academy of Sciences and the National Academy of Engineering. The Board’s mission is to promote innovation and progress in transportation through research. In an objective and interdisciplinary setting, the Board facilitates the sharing of information on transportation practice and policy by researchers and practitioners; stimulates research and offers research management services that promote technical excellence; provides expert advice on transportation policy and programs; and disseminates research results broadly and encourages their implementation. The Board’s varied activities annually engage more than 5,000 engineers, scientists, and other transportation researchers and practitioners from the public and private sectors and academia, all of whom contribute their expertise in the public interest. The program is supported by state transportation departments, federal agencies including the component administrations of the U.S. Department of Transportation, and other organizations and individuals interested in the development of transportation. www.TRB.org
www.national-academies.org
COOPERATIVE RESEARCH PROGRAMS STAFF FOR NCHRP REPORT 500
ROBERT J. REILLY, Director, Cooperative Research ProgramsCRAWFORD F. JENCKS, NCHRP ManagerCHARLES W. NIESSNER, Senior Program OfficerEILEEN P. DELANEY, Managing EditorELLEN M. CHAFEE, Assistant Editor
NCHRP PROJECT G17-18(3) PANELField of Traffic—Area of Safety
THOMAS E. BRYER, Camp Hill, PA (Chair)LEANNA DEPUE, Central Missouri State UniversityADELE DERBY, Alexandria, VABARBARA HARSHA, Governors Highway Safety Association, Washington, DCBRUCE IBARGUEN, Maine DOTMARGARET “MEG” MOORE, Texas DOTKIM F. NYSTROM, Nystrom Consulting, Gold River, CAPETER F. “PETE” RUSCH, FHWARUDY UMBS, FHWAANTHONY D. WYATT, North Carolina DOTJESSE BLATT, NHTSA Liaison RepresentativeRAY KRAMMES, FHWA Liaison RepresentativeKEN KOBETSKY, AASHTO Liaison RepresentativeRICHARD PAIN, TRB Liaison Representative
The goal of the AASHTO Strategic Highway Safety Plan is to reduce annual high-way fatalities by 5,000 to 7,000. This goal can be achieved through the widespreadapplication of low-cost, proven countermeasures that reduce the number of crashes onthe nation’s highways. This tenth volume of NCHRP Report 500: Guidance for Imple-mentation of the AASHTO Strategic Highway Safety Plan provides strategies that canbe employed to reduce the number of collisions involving pedestrians. The report willbe of particular interest to safety practitioners with responsibility for implementing pro-grams to reduce injuries and fatalities on the highway system.
In 1998, AASHTO approved its Strategic Highway Safety Plan, which was devel-oped by the AASHTO Standing Committee for Highway Traffic Safety with the assis-tance of the Federal Highway Administration, the National Highway Traffic SafetyAdministration, and the Transportation Research Board Committee on TransportationSafety Management. The plan includes strategies in 22 key emphasis areas that affecthighway safety. The plan’s goal is to reduce the annual number of highway deaths by5,000 to 7,000. Each of the 22 emphasis areas includes strategies and an outline of whatis needed to implement each strategy.
NCHRP Project 17-18(3) is developing a series of guides to assist state and localagencies in reducing injuries and fatalities in targeted areas. The guides correspond tothe emphasis areas outlined in the AASHTO Strategic Highway Safety Plan. Eachguide includes a brief introduction, a general description of the problem, the strate-gies/countermeasures to address the problem, and a model implementation process.
This is the tenth volume of NCHRP Report 500: Guidance for Implementationof the AASHTO Strategic Highway Safety Plan, a series in which relevant informa-tion is assembled into single concise volumes, each pertaining to specific types ofhighway crashes (e.g., run-off-road, head-on) or contributing factors (e.g., aggressivedriving). An expanded version of each volume, with additional reference materialand links to other information sources, is available on the AASHTO Web site athttp://transportation1.org/safetyplan. Future volumes of the report will be publishedand linked to the Web site as they are completed.
While each volume includes countermeasures for dealing with particular crashemphasis areas, NCHRP Report 501: Integrated Management Process to Reduce High-way Injuries and Fatalities Statewide provides an overall framework for coordinatinga safety program. The integrated management process comprises the necessary stepsfor advancing from crash data to integrated action plans. The process includes method-ologies to aid the practitioner in problem identification, resource optimization, and per-formance measurements. Together, the management process and the guides provide acomprehensive set of tools for managing a coordinated highway safety program.
This volume of NCHRP Report 500 was developed under NCHRP Project 17-18(3), the prod-uct of which is a series of implementation guides addressing the emphasis areas of AASHTO’sStrategic Highway Safety Plan. The project was managed by CH2M Hill, and the co-principalinvestigators were Ron Pfefer of Maron Engineering and Kevin Slack of CH2M Hill. TimothyNeuman of CH2M Hill served as the overall project director for the team. Kelly Hardy, also ofCH2M Hill, served as a technical specialist on the development of the guides.
The project team was organized around the specialized technical content contained in eachguide, and the team included nationally recognized experts from many organizations. The fol-lowing team of experts, selected based on their knowledge and expertise in this particularemphasis area, served as lead authors for the Pedestrian guide:
• Charles V. ZegeerUniversity of North Carolina Highway Safety Research Center
• Jane StuttsUniversity of North Carolina Highway Safety Research Center
Development of the volumes of NCHRP Report 500 utilized the resources and expertise ofmany professionals from around the country and overseas. Through research, workshops, andactual demonstration of the guides by agencies, the resulting documents represent best prac-tices in each emphasis area. The project team is grateful to the following list of people andtheir agencies for supporting the project through their participation in workshops and meetingsand additional reviews of the Pedestrian guide:
California Department ofHealth ServicesBarbara Alberson
California Department ofTransportationCraig CopelandRichard HaggstromKen McGuire
City of Seattle, WashingtonPeter Lagerwey
City of Tucson, ArizonaRichard Nassi
Federal HighwayAdministrationLeverson BoodlalAnn DoCarol Tan
Florida Department ofTransportationEd RiceDennis Scott
National Highway TrafficSafety AdministrationMaria Vegega
Orlando MetropolitanPlanning OrganizationMighk Wilson
Pennsylvania Department ofTransportationDave BachmanPatti MarshallGirish Modi
Sprinkle ConsultantsTheo Petritsch
U.S. Access BoardLois Thibault
Washington, District ofColumbiaHarry CepedaJohn FrankenhoffCarolyn Pollock
Wisconsin Department ofTransportationJohn Swissler
Washington StateDepartment ofTransportationRichard Anderson
I-1
SECTION I
Summary
Walking is a basic human activity, and almost everyone is a pedestrian at one time oranother. The 2001 edition of the AASHTO Green Book states that “pedestrians are a part ofevery roadway environment, and attention should be paid to their presence in rural as wellas urban areas“ (American Association of State Highway and Transportation Officials, 2001).It goes on to state, “. . . pedestrians are the lifeblood of our urban areas, especially in thedowntown and other retail areas” (p. 96).
Even though pedestrians are legitimate roadway users, they are frequently overlooked in thequest to build more sophisticated transportation systems. Whether building newinfrastructure or renovating existing facilities, it should be assumed that people will walk,and plans should be made to accommodate pedestrians. Where people aren’t walking, it isoften because they are prevented or discouraged from doing so. Either the infrastructure isinsufficient, has serious gaps, or there are safety hazards. Aesthetics (e.g., pleasant walkingenvironments that include trees, landscaping, displays of public art, etc.) and destinationswithin walking distances also play important roles in determining levels of walking.
Safety concerns can significantly influence a person’s decision to walk or use other modes oftransportation. However, understanding pedestrian safety issues has proven difficult forengineers and planners. Traditionally, safety problems have been identified by analyzingpolice crash reports, and improvements have been made only after crashes have occurred.Such methods are not sufficient to fully understand and effectively address pedestrian safetyconcerns. Waiting for crashes to warrant actions carries a high price, as pedestrian crashestend to be severe. Crash reports do not provide a complete picture of perceived safe orunsafe pedestrian environments and hence do not offer guidance on effective, proactivemeasures to promote a safe pedestrian environment.
Recent experience and research has shown that a comprehensive approach is most effectivein creating safer walking environments. Many pedestrian safety problems cannot be solvedsimply by addressing one of the “three Es” (engineering, education, enforcement) inisolation. Engineers, law enforcement, designers, planners, educators, and citizens should allplay a role in identifying and implementing effective countermeasures for improvingpedestrian safety.
There is also a need to take proactive measures to address pedestrian safety issues. Forexample, planners can host interactive public workshops, surveying pedestrians and drivers,and talking with police and traffic engineers to identify safety problems in an area beforecrashes occur. Pedestrian safety, both actual and perceived, and the provision of appropriatepedestrian infrastructure will influence how many people will walk and the number andtype of pedestrian crashes that will occur.
Finally, in making any decisions about program or countermeasure implementation,consideration should be given to the special characteristics and needs of the populationbeing targeted. This is especially true with respect to education or enforcementinterventions, but even road signs and pavement markings can be affected. People of
different cultures and ethnic backgrounds, non-English speaking populations, those withphysical impairments, and even children and the elderly may necessitate modifications tothe countermeasure to ensure that it reaches its intended target audience and has the desiredsafety benefits.
In recent years, walking has received increased attention as a mode of transportation thatshould be encouraged for a variety of reasons. On April 22, 1994, the U.S. Department ofTransportation presented its National Bicycling and Walking Study (NBWS) to the U.S.Congress, which, in addition to documenting the state of bicycling and walking in theUnited States, contained two overall goals:
Double the percentage of total trips made by bicycling and walking in the United States from7.9 percent to 15.8 percent of all travel trips1 and simultaneously reduce by 10 percent thenumber of bicyclists and pedestrians killed or injured in traffic crashes. (Zegeer, 1994)
Congress adopted the Study’s goals, effectively creating a directive to Federal transportationagencies to implement the Study’s nine-point Federal Action Plan with 60 specific actionitems for the Office of the Secretary, Federal Highway Administration, National HighwayTraffic Safety Administration, and Federal Transit Administration; and a five-point State andLocal Action Plan with a range of suggested activities for state and local agencies. Inaddition, Congress, prior to adoption of the NBWS, had vastly increased the amount ofFederal funding available for pedestrian projects with the adoption of the IntermodalSurface Transportation Efficiency Act (ISTEA) of 1991, and, later, the Transportation EquityAct for the 21st Century (TEA-21) (1998). Spending of federal transportation funds on thesetwo modes rose from $6 million in 1990 to more than $238 million in 1997.
While the number of annual pedestrian fatalities due to traffic accidents had generallydecreased across the United States over the latter part of the 1990s (about 13 percent overallfrom 1992 to 2002, per NHTSA Web site), that trend seems to have changed somewhat overthe early years of the new millennium (see Exhibit I-1). There were 71,000 pedestriansinjured in traffic crashes in 2002 (per NHTSA Web site).
The number of conflicts and fatalities remains high in many urban areas and for specificsegments of the population. In addition, results of travel surveys suggest that the observeddrop in pedestrian fatalities in recent years may simply reflect reduced exposure rather thanany gains in pedestrian safety.
The need to reduce pedestrian deaths and injuries (see Exhibit I-2), even in the face ofongoing efforts to increase levels of walking, continues to be an important goal for theengineering profession. Specific groups that do not or cannot drive primarily depend onwalking for transportation, including children, the elderly, and low-income populations.These groups are particularly in need of a safe walking environment to help lower their riskof injury and death.
SECTION I—SUMMARY
I-2
1 The National Bicycling and Walking Study (NBWS) target of doubling the percentage of trips made by bicycling and walkingfrom 7.9 percent to 15.8 percent was based on numbers collected in the 1990 Nationwide Personal Transportation Survey(NPTS). In 1990, a total of 18 billion walking trips and 1.7 billion bicycling trips were made representing 7.2 percent and 0.7percent respectively of all trips counted by the study.
SECTION I—SUMMARY
The U.S. Census is the most complete information on the percent of journey-to-work tripsmade by walking. For the 2000 U.S. Census, the percentage of journeys to work by foot was2.9 percent, or 3.8 million workers 16 years and over (Reschovsky, 2004). This is lower thanthe 1990 Census data, which showed 3.9 percent of workers 16 years and over, or 4.5 millionpeople, walking to work.
The Nationwide Personal Transportation Survey (NPTS), which measures travel of all kindsat the national level, also indicates there has been a decrease in the percent of trips made bywalking. In 1995, approximately 20 billion trips, or 5.4 percent of all trips, were made by
I-3
Ped
estr
ian
Fat
aliti
es
0
1,000
2,000
3,000
4,000
5,000
6,000
1994 1995 1996 1997 1998 1999 2000 2001 2002
Year
EXHIBIT I-1Pedestrians Killed in Crashes with Vehicles, 1994–2002 (Source: NHTSA Web site)
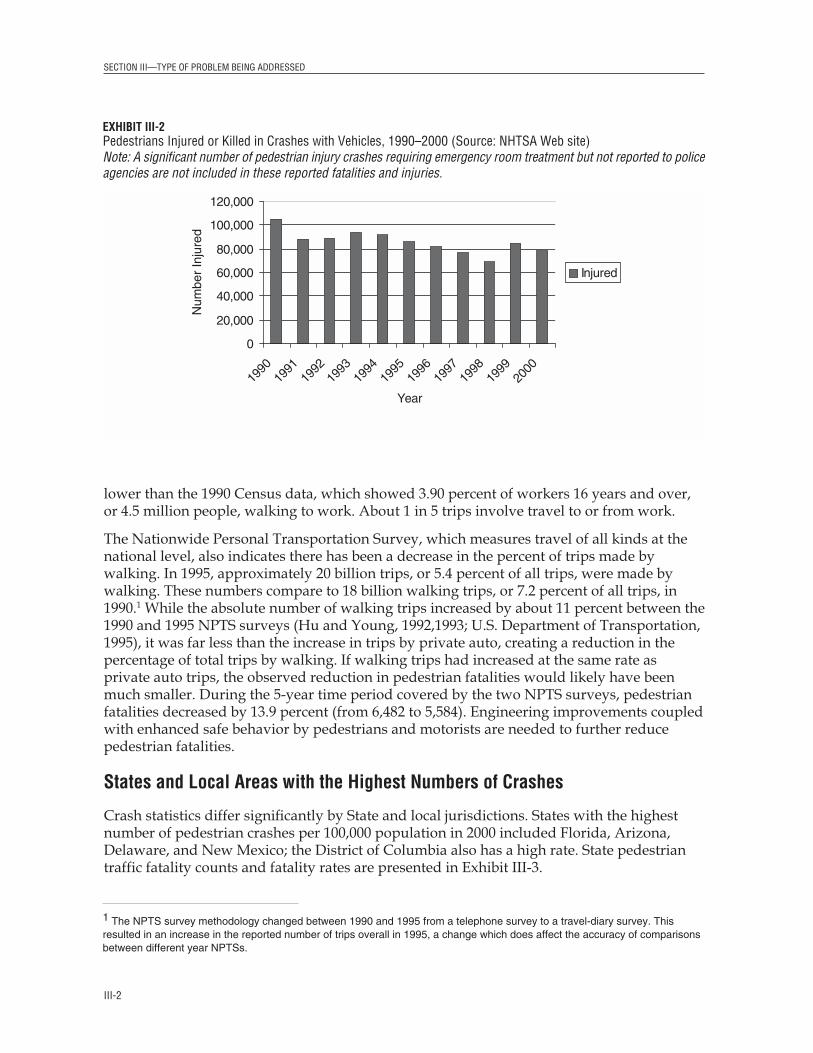
EXHIBIT I-2Pedestrians Injured or Killed in Crashes with Vehicles, 1990–2000 (Source: NHTSA Web site)Note: A significant number of pedestrian injury crashes requiring emergency room treatment but not reported to policeagencies are not included in these reported fatalities and injuries.
0
20,000
40,000
60,000
80,000
100,000
120,000
1990
1991
1992
1993
1994
1995
1996
1997
1998
1999
2000
Year
Num
ber
Inju
red
Injured
walking (U.S. Department of Transportation, 1995). These numbers compare to 18 billionwalking trips, or 7.2 percent of all trips, in 1990 (Hu and Young, 1992, 1993).2 While theabsolute number of walking trips increased by about 11 percent between the 1990 and 1995NPTS surveys, it was far less than the increase in trips by private auto, creating a reductionin the percentage of total trips by walking. If walking trips had increased at the same rate asprivate auto trips, the observed reduction in pedestrian fatalities would likely have beenmuch smaller. During the 5-year time period covered by the two NPTS surveys, pedestrianfatalities decreased by 13.9 percent (from 6,482 to 5,584). Engineering improvements coupledwith enhanced safe behavior by pedestrians and motorists are needed to further reducepedestrian fatalities.
The following is a list of requests (objectives) that transportation professionals are likely toface when working to provide pedestrian safety and mobility:
• Reduce the speed of motor vehicles• Improve sight distance and visibility for motor vehicles and pedestrians• Reduce pedestrian exposure to vehicular traffic• Improve pedestrian access and mobility• Improve pedestrian and motorist safety awareness and behavior
Each of these objectives can be accomplished through a variety of the 16 individualstrategies (treatments) presented in Exhibit I-3. Most strategies will work best when used atmultiple locations and in combination with other treatments.
In addition, many of the strategies (treatments) will accomplish two or more objectives. Thekey is to make sure that the right treatments are chosen to accomplish the desired effect.
SECTION I—SUMMARY
I-4
2 The NPTS survey methodology changed between 1990 and 1995 from a telephone survey to a travel-diary survey. Thisresulted in an increase in the reported number of trips overall in 1995, a change which does affect the accuracy of comparisonsbetween different year NPTSs.
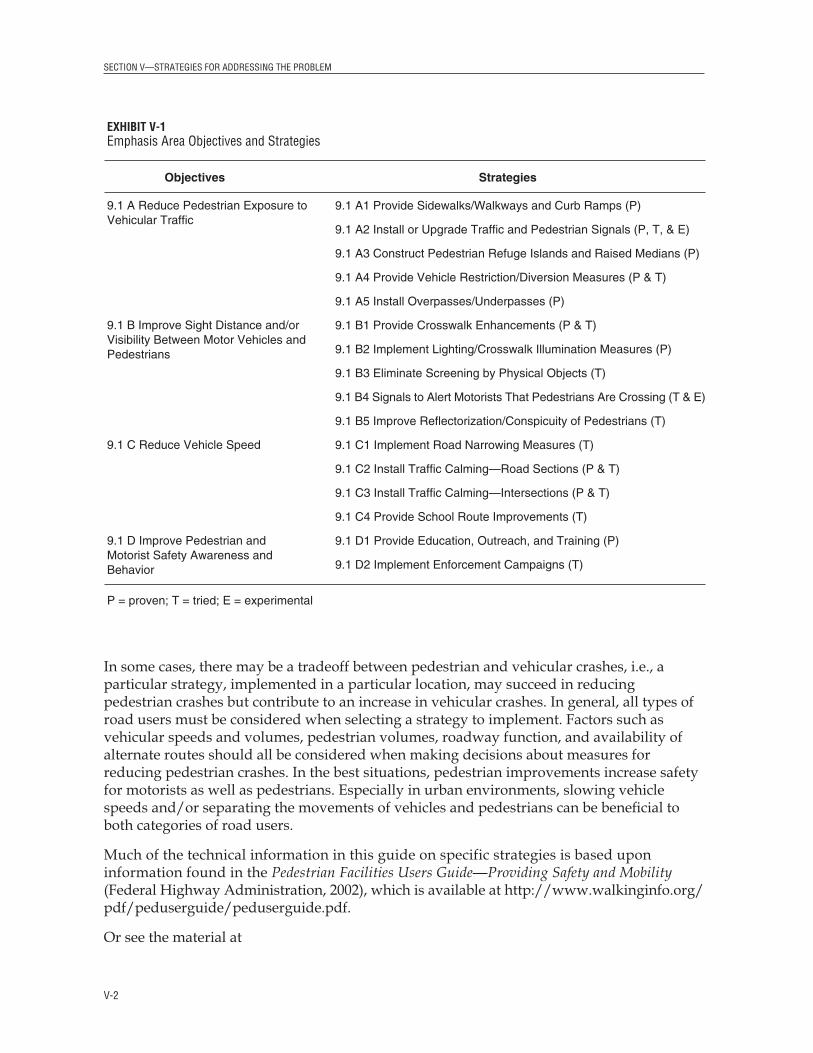
EXHIBIT I-3Emphasis Area Objectives and Strategies
Objectives Strategies
9.1 A Reduce Pedestrian Exposure toVehicular Traffic
9.1 B Improve Sight Distance and/or Visibility Between Motor Vehicles and Pedestrians
9.1 A1 Provide Sidewalks/Walkways and Curb Ramps
9.1 A2 Install or Upgrade Traffic and Pedestrian Signals
9.1 A3 Construct Pedestrian Refuge Islands and Raised Medians
9.1 A4 Provide Vehicle Restriction/Diversion Measures
9.1 B4 Signals to Alert Motorists That Pedestrians Are Crossing
9.1 B5 Improve Reflectorization/Conspicuity of Pedestrians
SECTION I—SUMMARY
I-5
EXHIBIT I-3 (Continued)Emphasis Area Objectives and Strategies
Objectives Strategies
9.1 C Reduce Vehicle Speed
9.1 D Improve Pedestrian and Motorist Safety Awareness and Behavior
9.1 C1 Implement Road Narrowing Measures
9.1 C2 Install Traffic Calming—Road Sections
9.1 C3 Install Traffic Calming—Intersections
9.1 C4 Provide School Route Improvements
9.1 D1 Provide Education, Outreach, and Training
9.1 D2 Implement Enforcement Campaigns
II-1
SECTION II
Introduction
Walking is a basic human activity, and almost everyone is a pedestrian at one time oranother. The 2001 edition of the AASHTO Green Book states that “pedestrians are a part ofevery roadway environment, and attention should be paid to their presence in rural as wellas urban areas“ (American Association of State Highway and Transportation Officials, 2001).It goes on to state, “. . . pedestrians are the lifeblood of our urban areas, especially in thedowntown and other retail areas” (p. 96).
Even though pedestrians are legitimate roadway users, they are frequently overlooked in thequest to build more-sophisticated transportation systems. Whether building new infrastructureor renovating existing facilities, it should be assumed that people will walk, and plans shouldbe made to accommodate pedestrians (Exhibit II-1). Where people aren’t walking, it is oftenbecause they are prevented or discouraged from doing so. Either the infrastructure isinsufficient, has serious gaps, or there are safety hazards. Aesthetics (e.g., pleasant walkingenvironments that include trees, landscaping, displays of public art, etc.) and destinationswithin walking distances also play important roles in determining levels of walking.
Safety concerns can significantly influence aperson’s decision to walk or use other modesof transportation. However, understandingpedestrian safety issues has proven difficultfor engineers and planners. Traditionally,safety problems have been identified byanalyzing police crash reports, andimprovements have been made only aftercrashes have occurred. Such methods are notsufficient to fully understand and effectivelyaddress pedestrian safety concerns. Waitingfor crashes to warrant actions carries a highprice, as pedestrian crashes tend to be severe.While analysis of crash reports is animportant and valuable activity, it does notprovide a complete picture of perceived safeor unsafe pedestrian environments and maynot offer the best guidance on effective,proactive, measures to promote a safepedestrian environment.
Recent experience and research has shownthat a comprehensive approach is mosteffective in creating safer walkingenvironments. Many pedestrian safetyproblems cannot be solved simply byaddressing one of the “three Es” (engineering,
EXHIBIT II-1Whether building new infrastructure or renovatingexisting facilities, it should be assumed that peoplewill walk, and plans should be made to accommodatepedestrians. (Photo by Dan Burden)
education, enforcement) in isolation. Engineers, law enforcement, designers, planners,educators, and citizens should all play a role in identifying and implementing effectivecountermeasures for improving pedestrian safety.
There is also a need to take proactive measures to address pedestrian safety issues. Forexample, planners can host interactive public workshops, survey pedestrians and drivers,and talk with police and traffic engineers to identify safety problems in an area before crashesoccur. Pedestrian safety, both actual and perceived, and the provision of appropriatepedestrian infrastructure will influence how many people will walk and the number andtype of pedestrian crashes that will occur.
Finally, in making any decisions about program or countermeasure implementation,consideration should be given to the special characteristics and needs of the populationbeing targeted. This is especially true with respect to education or enforcementinterventions, but even road signs and pavement markings can be affected. People ofdifferent cultures and ethnic backgrounds, non-English speaking populations, those withphysical impairments, and even children and the elderly may necessitate modifications tothe countermeasure to ensure that it reaches its intended target audience and has the desiredsafety benefits.
In recent years, walking has received increased attention as a mode of transportation thatshould be encouraged for a variety of reasons. On April 22, 1994, the U.S. Department ofTransportation presented its National Bicycling and Walking Study to the U.S. Congress,which, in addition to documenting the state of bicycling and walking in the United States,contained two overall goals:
• Double the percentage of total trips made by bicycling and walking in the United Statesfrom 7.9 percent to 15.8 percent of all travel trips1
• Simultaneously reduce by 10 percent the number of bicyclists and pedestrians killed orinjured in traffic crashes
Congress adopted the Study’s goals, effectively creating a directive to Federal transportationagencies to implement the Study’s Nine-Point Federal Action Plan with 60 specific actionitems for the Office of the Secretary, Federal Highway Administration, National HighwayTraffic Safety Administration, and Federal Transit Administration; and a Five-Point Stateand Local Action Plan with a range of suggested activities for state and local agencies. Inaddition, Congress, prior to adoption of NBWS, had vastly increased the amount of Federalfunding available for pedestrian projects with the adoption of the ISTEA of 1991, and, in1998, the TEA-21. Spending of federal transportation funds on these two modes rose from $6 million in 1990 to more than $238 million in 1997. Clearly, any agency charged withconstruction, operation, and maintenance of highway infrastructure must devote attention toaccommodating safe pedestrian activity.
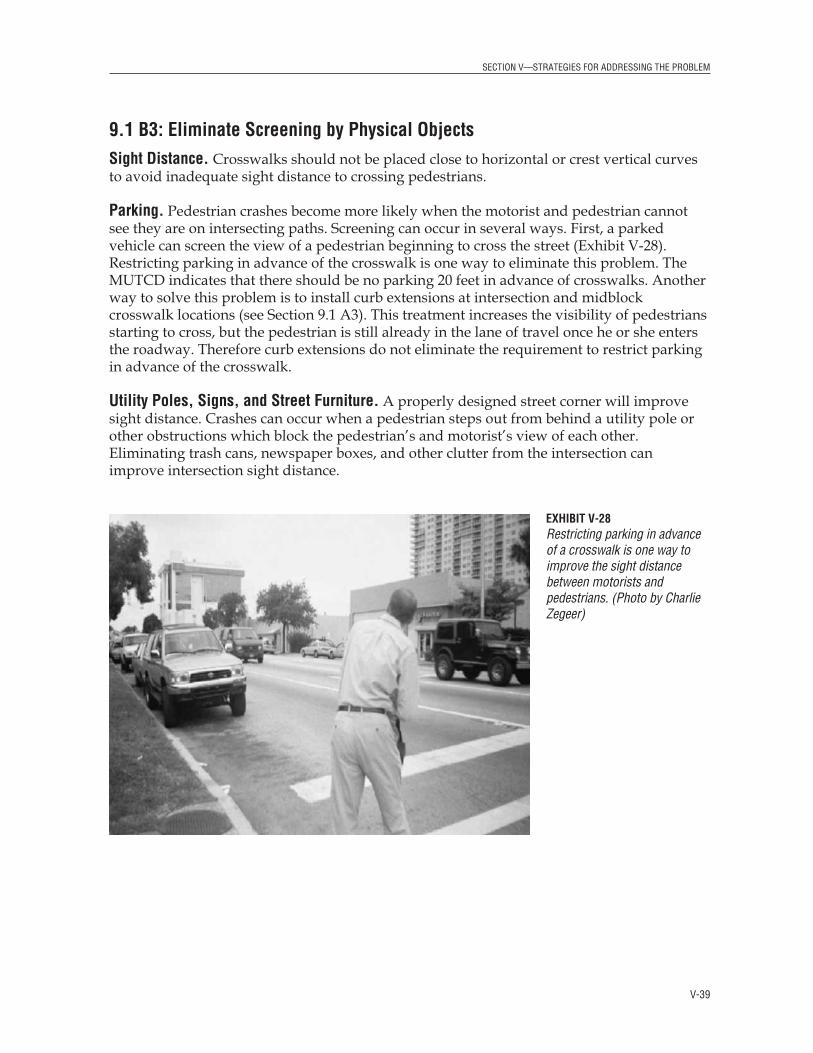
What progress has been made towards achieving NBWS’s goal of reducing injuries topedestrians and bicyclists by 10 percent? In 1993, the last year prior to the release of the
SECTION II—INTRODUCTION
II-2
1 The NBWS target of doubling the percentage of trips made by bicycling and walking from 7.9 percent to 15.8 percent wasbased on numbers collected in the 1990 NPTS. In 1990, a total of 18 billion walking trips and 1.7 billion bicycling trips weremade representing 7.2 percent and 0.7 percent respectively of all trips counted by the study.
SECTION II—INTRODUCTION
II-3
study, 5,649 pedestrians were killed in collisions with motor vehicles. In 2000, the last yearfor which data are available, the number of pedestrian fatalities had fallen to 4,739. Thesenumbers reflect a 16.6 percent decline in fatalities, which far exceeds the safety goals set byNBWS.
Unfortunately, this drop in pedestrian fatalities may reflect decreased walking activity asmuch as it does improved safety. According to both the U.S. Census and the NationwidePersonal Transportation Survey, the percentage of trips made by walking has declined overthe past decade. The U.S. Census indicates a decrease in the percent of walk-to-work tripsfrom 3.9 to 2.7 (1980 and 1990 U.S. Census), while NPTS indicates a decrease in percent of alltrips by walking from 7.2 to 5.4 (Hu and Young, 1992, 1993; U.S. Department ofTransportation, 1995). Clearly NBWS’s goal of increasing the percentage of trips made bywalking has not been achieved. When available, data from the 2000 Census and NPTSsurveys will help clarify any downward trends in walking activity. In the meantime, it isimportant to recognize that increased emphasis, as well as increased funding, is beingdevoted to promoting walking, making it especially critical that pedestrian safety issuesremain a high priority for State and local transportation officials.
ADA Design GuidelinesOne of the goals of the Americans with Disabilities Act (ADA) is to ensure that all people,including those with disabilities, have equal access to transportation. People with disabilitiesmay have physical limitations, impaired vision, impaired cognitive ability, or a combinationof disabilities, which is more common as a person grows older. Over 90 percent of thepopulation will experience a disability on a permanent or temporary basis at some point intheir lives.
This document is intended to be a guide for addressing traffic safety issues associated withpedestrians. It is not intended to be a design guide or to deal with accessibility. However, asthose who are doing design and working to create access for pedestrians of all types performtheir tasks, they should understand potential highway-safety issues involved.
Further details are contained within this guide relative to providing facilities for people withdisabilities. Specifically, such discussion is provided within the strategy of sidewalks andwalkways. Details on accessible pedestrian signals are given within the discussion of trafficand pedestrian signals.
More information can be found on ADA regulations from the following web sites:www.access-board.gov www.walkinginfo.org/de/index.htm fhwa.dot.gov/environment/bikeped/publications.htm
Other GuidelinesIn addition to this pedestrian guide, many state and local agencies develop their own designor planning guidelines that address pedestrian safety. Some of these exemplary guides canbe found at http://www.walkinginfo.org/rd/for_ped.htm#guide.
III-1
SECTION III
Type of Problem Being Addressed
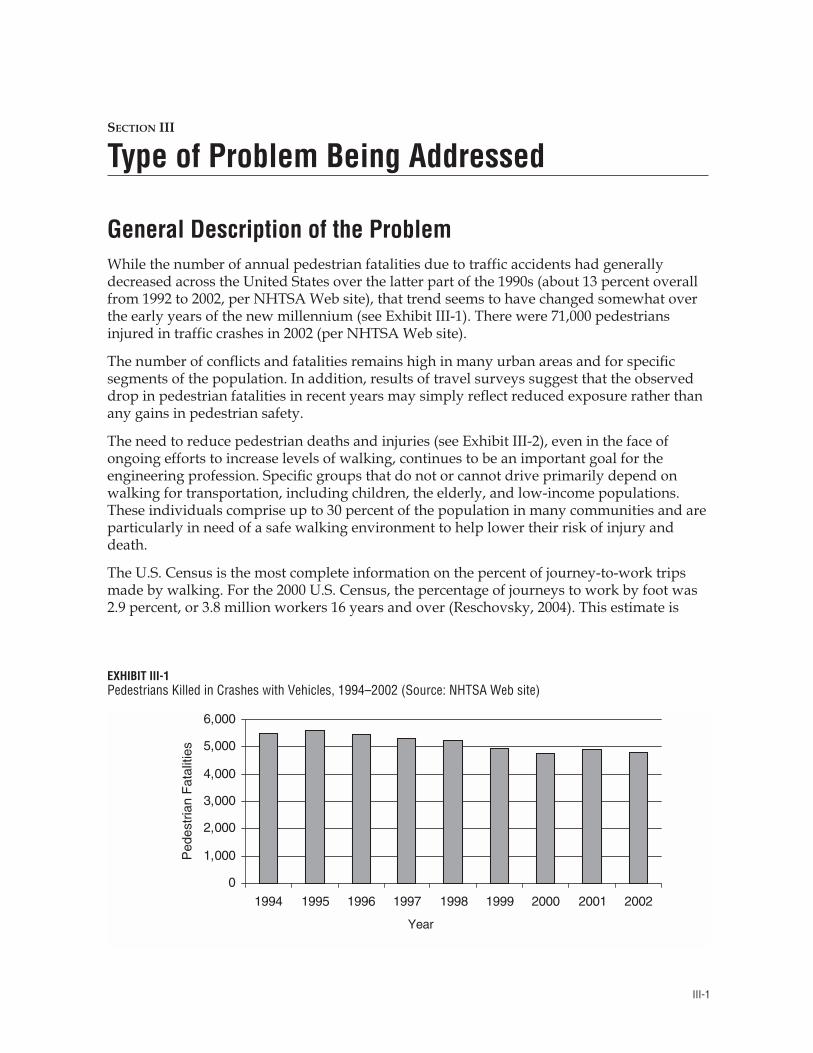
General Description of the ProblemWhile the number of annual pedestrian fatalities due to traffic accidents had generallydecreased across the United States over the latter part of the 1990s (about 13 percent overallfrom 1992 to 2002, per NHTSA Web site), that trend seems to have changed somewhat overthe early years of the new millennium (see Exhibit III-1). There were 71,000 pedestriansinjured in traffic crashes in 2002 (per NHTSA Web site).
The number of conflicts and fatalities remains high in many urban areas and for specificsegments of the population. In addition, results of travel surveys suggest that the observeddrop in pedestrian fatalities in recent years may simply reflect reduced exposure rather thanany gains in pedestrian safety.
The need to reduce pedestrian deaths and injuries (see Exhibit III-2), even in the face ofongoing efforts to increase levels of walking, continues to be an important goal for theengineering profession. Specific groups that do not or cannot drive primarily depend onwalking for transportation, including children, the elderly, and low-income populations.These individuals comprise up to 30 percent of the population in many communities and areparticularly in need of a safe walking environment to help lower their risk of injury anddeath.
The U.S. Census is the most complete information on the percent of journey-to-work tripsmade by walking. For the 2000 U.S. Census, the percentage of journeys to work by foot was2.9 percent, or 3.8 million workers 16 years and over (Reschovsky, 2004). This estimate is
EXHIBIT III-1Pedestrians Killed in Crashes with Vehicles, 1994–2002 (Source: NHTSA Web site)
Ped
estr
ian
Fat
aliti
es
0
1,000
2,000
3,000
4,000
5,000
6,000
1994 1995 1996 1997 1998 1999 2000 2001 2002
Year
SECTION III—TYPE OF PROBLEM BEING ADDRESSED
III-2
lower than the 1990 Census data, which showed 3.90 percent of workers 16 years and over,or 4.5 million people, walking to work. About 1 in 5 trips involve travel to or from work.
The Nationwide Personal Transportation Survey, which measures travel of all kinds at thenational level, also indicates there has been a decrease in the percent of trips made bywalking. In 1995, approximately 20 billion trips, or 5.4 percent of all trips, were made bywalking. These numbers compare to 18 billion walking trips, or 7.2 percent of all trips, in1990.1 While the absolute number of walking trips increased by about 11 percent between the1990 and 1995 NPTS surveys (Hu and Young, 1992,1993; U.S. Department of Transportation,1995), it was far less than the increase in trips by private auto, creating a reduction in thepercentage of total trips by walking. If walking trips had increased at the same rate asprivate auto trips, the observed reduction in pedestrian fatalities would likely have beenmuch smaller. During the 5-year time period covered by the two NPTS surveys, pedestrianfatalities decreased by 13.9 percent (from 6,482 to 5,584). Engineering improvements coupledwith enhanced safe behavior by pedestrians and motorists are needed to further reducepedestrian fatalities.
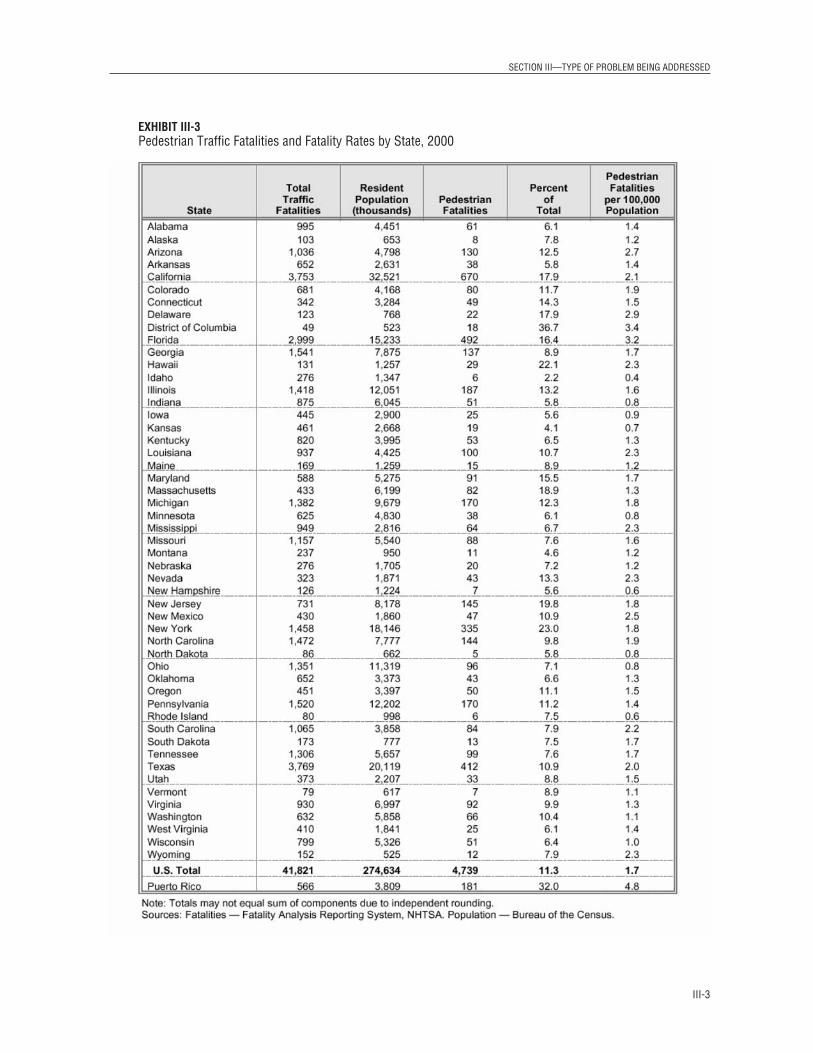
States and Local Areas with the Highest Numbers of Crashes
Crash statistics differ significantly by State and local jurisdictions. States with the highestnumber of pedestrian crashes per 100,000 population in 2000 included Florida, Arizona,Delaware, and New Mexico; the District of Columbia also has a high rate. State pedestriantraffic fatality counts and fatality rates are presented in Exhibit III-3.
1 The NPTS survey methodology changed between 1990 and 1995 from a telephone survey to a travel-diary survey. Thisresulted in an increase in the reported number of trips overall in 1995, a change which does affect the accuracy of comparisonsbetween different year NPTSs.
EXHIBIT III-2Pedestrians Injured or Killed in Crashes with Vehicles, 1990–2000 (Source: NHTSA Web site)Note: A significant number of pedestrian injury crashes requiring emergency room treatment but not reported to policeagencies are not included in these reported fatalities and injuries.
0
20,000
40,000
60,000
80,000
100,000
120,000
1990
1991
1992
1993
1994
1995
1996
1997
1998
1999
2000
Year
Num
ber
Inju
red
Injured
SECTION III—TYPE OF PROBLEM BEING ADDRESSED
III-3
EXHIBIT III-3Pedestrian Traffic Fatalities and Fatality Rates by State, 2000
Factors Affecting the Number and Severity of CrashesAlcohol Impairment
Alcohol impairment may be as serious a problem for pedestrians as it is for motor-vehicledrivers, although there is evidence the problem may be lessening, based upon fatal crashdata for the year 2000. From 1980 through 1987, 37 percent to 44 percent of fatally injuredpedestrians had a reported blood-alcohol concentration (BAC) of 0.10 or greater (FederalHighway Administration, 2002). In 1997, that figure was 29.5 percent, and in 2002 itdecreased to 21 percent (NHTSA Web site). Alcohol involvement in pedestrian crashescontinues to be a concern, however, due to the continued high percentage of either drivers orpedestrians who have some level of BAC. Alcohol involvement—either for the driver or thepedestrian or both—was reported in nearly one-half of all pedestrian fatalities (NHTSA Website). However, care should be taken in using these results, as NHTSA cautions that BACresults reported to the Fatality Analysis Reporting System (FARS) are from statemeasurements and many are untested. Also, it is not clear whether the drop in pedestrianfatalities involving alcohol-impaired pedestrians may be partly the result of less reporting ofalcohol involvement due to changes in police practices in 2000.
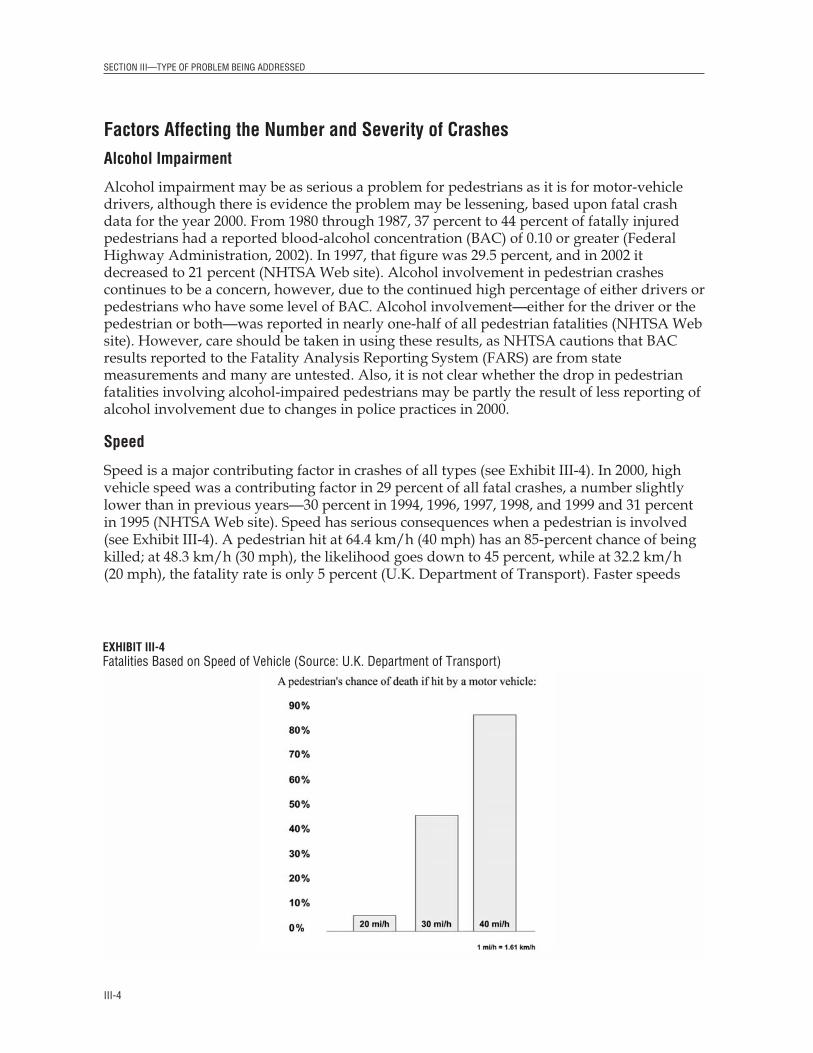
Speed
Speed is a major contributing factor in crashes of all types (see Exhibit III-4). In 2000, highvehicle speed was a contributing factor in 29 percent of all fatal crashes, a number slightlylower than in previous years—30 percent in 1994, 1996, 1997, 1998, and 1999 and 31 percentin 1995 (NHTSA Web site). Speed has serious consequences when a pedestrian is involved(see Exhibit III-4). A pedestrian hit at 64.4 km/h (40 mph) has an 85-percent chance of beingkilled; at 48.3 km/h (30 mph), the likelihood goes down to 45 percent, while at 32.2 km/h(20 mph), the fatality rate is only 5 percent (U.K. Department of Transport). Faster speeds
SECTION III—TYPE OF PROBLEM BEING ADDRESSED
III-4
EXHIBIT III-4Fatalities Based on Speed of Vehicle (Source: U.K. Department of Transport)
SECTION III—TYPE OF PROBLEM BEING ADDRESSED
also increase the likelihood of a pedestrian being hit. At higher speeds, motorists are lesslikely to see and react to a pedestrian, and are even less likely to be able to stop in time toavoid hitting one (Federal Highway Administration, 2000). Speed, however, is always a factorin crashes, regardless of whether it is illegal (i.e., above the posted speed limit) or not. Speedlimits that are set inappropriately high can also contribute to pedestrian crashes and injuries.
Types of Pedestrian CrashesIn order for engineers and planners to address specific pedestrian hazards and high-crashlocations, information is needed on where the pedestrian crashes occur (city, street, intersection,two-lane road, etc.), when they occur (time of day, day of week, etc.), characteristics of thevictims involved (age, gender, injury severity, etc.), and the events that precipitated the crash(child chasing ball onto road, motorist swerving around a parked car, etc.).
Where Crashes OccurArea Type
Pedestrian crashes occur most frequently in urban areas where both pedestrian activityand traffic volumes are greater than in rural areas. The National Safety Council estimatesthat 85.7 percent of all nonfatal pedestrian crashes in the United States occur in urbanareas and 14.3 percent occur in rural areas. However, 25 percent of pedestrian fatalitiesoccur in rural areas, where vehicle speeds are higher than on city streets (Zegeer et al.,1992, 1993). In addition, many rural areas have no sidewalks, paths, or shoulders to serveas separated pedestrian facilities, and no lighting to increase the visibility of pedestrians at nighttime.
Location Type
According to the NHTSA, “most pedestrian fatalities in 2000 occurred in urban areas(71 percent), at nonintersection locations (78 percent), in good weather conditions(91 percent), and at night (64 percent).” Additionally, “more than two-thirds (68 percent) ofthe 2000 pedestrian fatalities were males.” While all age groups are more likely to be killedat nonintersection locations, the numbers are higher for children primarily because of dart-outs into the street. Likewise, the oldest age groups are more likely to be struck atintersections since older pedestrians tend to cross at intersections more often than youngerones. Moreover, some older pedestrians have physical, visual, and/or hearing impairmentsthat place greater demand on intersection design (Zegeer et al., 1992). Studies have shownthat older pedestrians are particularly over-represented in crashes at intersections involvingvehicles turning left and right (National Highway Traffic Safety Administration, 1990b) (seeExhibit III-5 and Exhibit III-6).
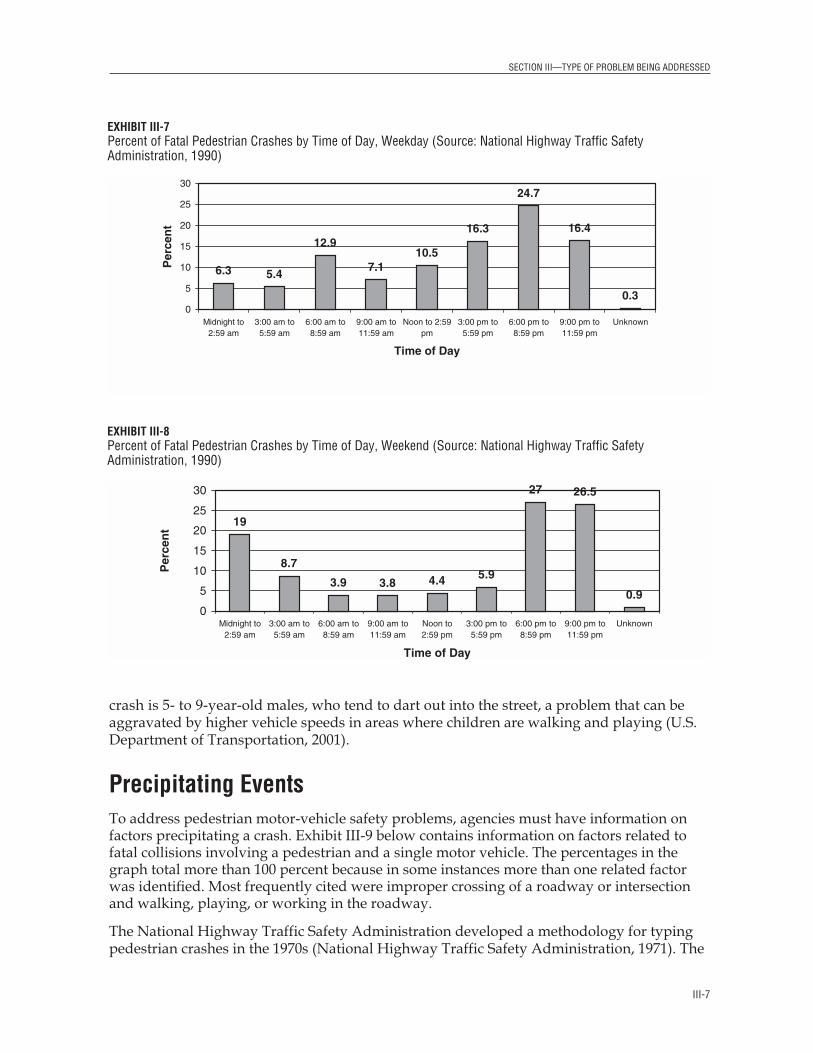
When Crashes OccurExhibit III-7 and Exhibit III-8 show the time of day for when crashes occur.
• Pedestrian crashes are most prevalent during morning and afternoon peak periods,when traffic as well as pedestrian volumes are highest (National Highway Traffic SafetyAdministration, 1990).
III-5
SECTION III—TYPE OF PROBLEM BEING ADDRESSED
III-6
Characteristics of the VictimsSpecific populations that are heavily represented in crash injury and fatality statistics arechildren under the age of 16 and older pedestrians. Both of these groups deserve specialattention because for many of them driving is not an option and, in the case of olderpedestrians that no longer drive, their numbers will increase dramatically as a result of the“graying of the population.” “Older pedestrians (ages 70+) accounted for 17 percent of allpedestrian fatalities and 6 percent of all pedestrians injured. The death rate for this group,both males and females, was 3.18 per 100,000 population—higher than any other agegroup” (NHTSA Web site). The pedestrian age group that is most likely to be involved in a
EXHIBIT III-5Percent of Pedestrian Crash Fatalities at Intersections (Approximately 22 Percent of All Fatalities) by Age, 2000(Source: Zegeer et al., 1993)
EXHIBIT III-6Percent of Pedestrian Crash Fatalities at Nonintersection Locations (Approximately 77 Percent of All Fatalities) byAge, 2000 (Source: Zegeer et al., 1993)
10.514.2 15.5 13.6
20.2 19.3
33.5 34.6
17.4
29.022.421.3
0
10
20
30
40
Under
55
-- 9
10 --
15
16 --
20
21 --
24
25 --
34
35 --
44
45 --
54
55 --
64
65 --
74
75 +
Unkno
wn
Age Group
Per
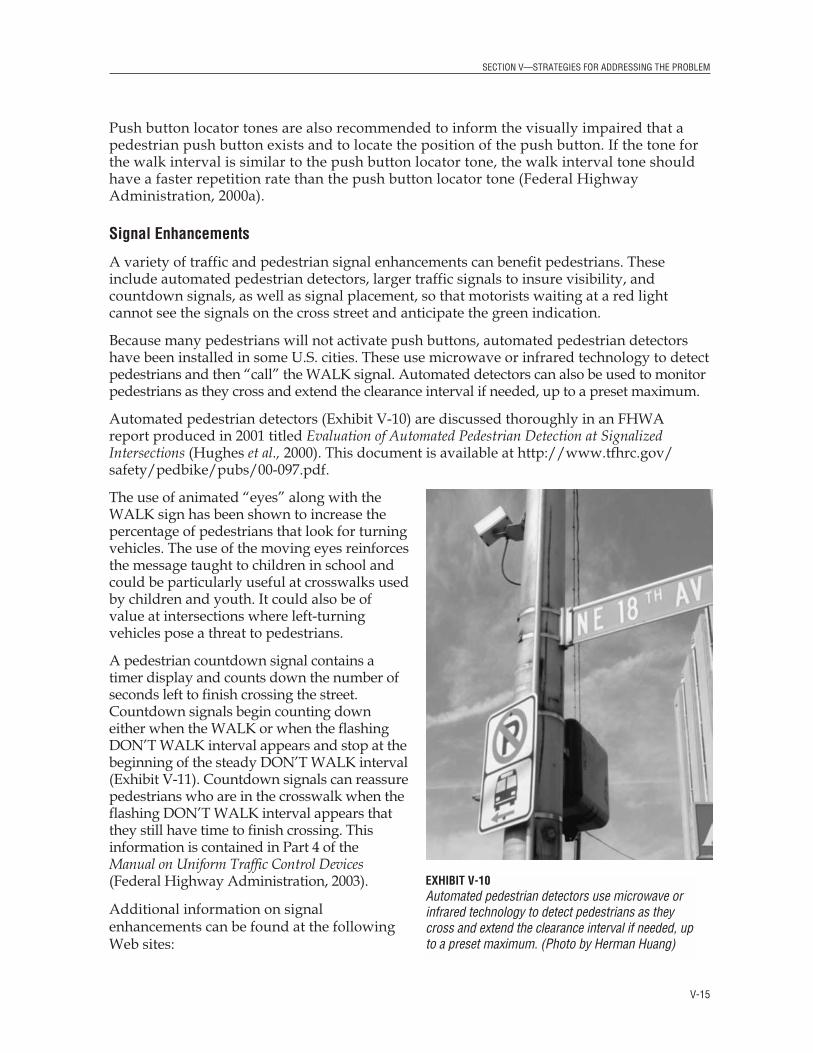
cen
t
88.877.1 84.5 79.1 80.1
70.5 66.5 65.255.1
86.085.078.0
020406080
100
Under
55
-- 9
10 --
15
16 --
20
21 --
24
25 --
34
35 --
44
45 --
54
55 --
64
65 --
74
75 +
Unkno
wn
Age Group
Per
cen
t
• Fatal pedestrian crashes occur most often late in the day, between 5 and 11 p.m., whenpeak periods, darkness, and alcohol use are factors (National Highway Traffic SafetyAdministration, 1990a).
• Child pedestrian fatalities are greatest in May, June, and July, perhaps due to an increasein outside activity (Zegeer et al., 1992).
• Older pedestrians are more likely to be struck during daylight hours, when they are alsomost likely to be exposed to traffic (Zegeer et al., 1993).
SECTION III—TYPE OF PROBLEM BEING ADDRESSED
crash is 5- to 9-year-old males, who tend to dart out into the street, a problem that can beaggravated by higher vehicle speeds in areas where children are walking and playing (U.S.Department of Transportation, 2001).
Precipitating EventsTo address pedestrian motor-vehicle safety problems, agencies must have information onfactors precipitating a crash. Exhibit III-9 below contains information on factors related tofatal collisions involving a pedestrian and a single motor vehicle. The percentages in thegraph total more than 100 percent because in some instances more than one related factorwas identified. Most frequently cited were improper crossing of a roadway or intersectionand walking, playing, or working in the roadway.
The National Highway Traffic Safety Administration developed a methodology for typingpedestrian crashes in the 1970s (National Highway Traffic Safety Administration, 1971). The
III-7
EXHIBIT III-7Percent of Fatal Pedestrian Crashes by Time of Day, Weekday (Source: National Highway Traffic SafetyAdministration, 1990)
6.3 5.4
12.9
7.110.5
16.3
24.7
16.4
0.30
5
10
15
20
25
30
Midnight to2:59 am
3:00 am to5:59 am
6:00 am to8:59 am
9:00 am to11:59 am
Noon to 2:59pm
3:00 pm to5:59 pm
6:00 pm to8:59 pm
9:00 pm to11:59 pm
Unknown
Time of Day
Per
cen
t
EXHIBIT III-8Percent of Fatal Pedestrian Crashes by Time of Day, Weekend (Source: National Highway Traffic SafetyAdministration, 1990)
19
8.7
3.9 3.8 4.4 5.9
27 26.5
0.90
5
10
15
20
25
30
Midnight to2:59 am
3:00 am to5:59 am
6:00 am to8:59 am
9:00 am to11:59 am
Noon to2:59 pm
3:00 pm to5:59 pm
6:00 pm to8:59 pm
9:00 pm to11:59 pm
Unknown
Time of Day
Per
cen
t
Key findings of this study, which pertained to both fatal and nonfatal crashes, included thefollowing:
• 41 percent of pedestrian crashes occurred at roadway intersections and an additional 8 percent at driveway or alley intersections
• Most frequent intersection crash types included vehicle turning at intersection (10 percent),intersection dash (7 percent), and driver violation at intersection (5 percent)
SECTION III—TYPE OF PROBLEM BEING ADDRESSED
III-8
EXHIBIT III-10Pedestrian Activity/Behavior That Preceded Fatal Crashes, 2000
EXHIBIT III-9Related Factors in Single Vehicle Fatal Pedestrian Crashes, 1998–2000 (Shankar, 2003)
30.326.8
14.2 12.88.8
2.7 1.64.8
27.9
0
5
10
15
20
25
30
35
Impropercrossing ofroadway orintersection
Walking,playing,
working, etc. inroadway
Failure to yieldright of way
Darting orrunning into
road
Not visible Inattentive(talking, eating,
etc.)
Failure to obeytraffic signal,officer, etc.
Other factors None reportedor unknown
Related Factor
Per
cen
t
25.5 29.8
14.29.6
2.6 1.8
27.3
12.7
05
101520253035
Walkingplaying,
working, etc. inroadway
Multiple threat Failure to yieldright of way
Darting orrunning into
road
Not visible(talking,
eating, etc.)
Failure to obeytraffic signs,signals, or
officer
None reported
Activity/Behavior
Per
cen
t
Inattentive
method was refined in the early 1990s and used to determine the crash types for more than5,000 pedestrian crashes in the States of California, Florida, Maryland, Minnesota, NorthCarolina, and Utah (Hunter et al., 1995; National Highway Traffic Safety Administration,1971) (see Exhibit III-10).
SECTION III—TYPE OF PROBLEM BEING ADDRESSED
• Half of all midblock crashes involved a pedestrian either darting into the intersectionwith the motorist view blocked or running into the intersection when the motorist’s viewwas not blocked
• 8 percent involved a pedestrian walking along the roadway, and in two-thirds of thesecrashes the pedestrian was walking with traffic when struck from behind
• Two-thirds (66 percent) of pedestrians were coded for at least one contributing factor totheir crash. Most frequently noted were running into the roadway (15 percent), failure toyield (12 percent), alcohol impairment (10 percent), stepping from between parkedvehicles (7 percent), and walking or running in the wrong direction, with traffic (5 percent)
• 55 percent of motorists were coded for at least one contributing factor to the crash; mostfrequently cited were hit-and-run (16 percent), failure to yield to pedestrian (15 percent),and improper backing (6 percent)
Crash types that were the most severe as measured by the percentage of pedestriansseriously injured or killed were
• Midblock, other (46.8 percent serious and fatal injury)• Disabled vehicle related (41.7 percent serious and fatal injury)• Walking along roadway (40.4 percent serious and fatal injury)• Driverless vehicle (37.8 percent serious and fatal injury)
Least severe crashes included
• Vehicle turning at intersection (18.4 percent serious and fatal injury)• Backing vehicle (22.5 percent serious and fatal injury)• Bus-related (22.7 percent serious and fatal injury)• Driver violation at intersection (27.8 percent serious and fatal injury)
Based upon these findings and additional research, 13 crash type groupings (12 specifictypes and 1 miscellaneous type) have been identified for use with crash data to identifysafety problems and corresponding countermeasures (see Exhibit III-11 for the 12 specifictypes). They can also be used to help educate safety professionals, as well as the generalpublic, about the types of situations that pose dangers to pedestrians. These crash types formthe basis for the Pedestrian and Bicycle Crash Analysis Tool software known as PBCAT(Harkey et al., 2000).
Appendix 1 presents a matrix of these 12 major crash types showing which strategies mightbe considered to help mitigate each crash type.
III-9
SECTION III—TYPE OF PROBLEM BEING ADDRESSED
III-10
Definitions of Pedestrian Crash Types Example
1. Midblock: Dart/Dash Definition: The pedestrian walked or ran into the roadway and was struck by a vehicle. The motorist’s view of the pedestrian may have been blocked until an instant before the impact, and/or the motorist may have been speeding.
2. Multiple Threat Definition: The pedestrian entered the traffic lane in front of stopped traffic and was struck by a vehicle traveling in the same direction as the stopped vehicle. The stopped vehicle may have blocked the sight distance between the pedestrian and the striking vehicle, and/or the motorist may have been speeding.
3. Mailbox or Other Midblock Definition: The pedestrian was struck while getting into or out of a stopped vehicle or while crossing the road to/from a mailbox, newspaper box, ice-cream truck, etc.
4. Failure to Yield at Unsignalized Location Definition: At an unsignalized intersection or midblock location, a pedestrian stepped into the roadway and was struck by a vehicle. The motorist failed to yield to the pedestrian and/or the pedestrian stepped directly into the path of the oncoming vehicle.
5. Bus-Related Definition: The pedestrian was struck by a vehicle either (1) by crossing in front of a commercial bus stopped at a bus stop, (2) going to or from a school bus stop, or (3) going to or from or waiting near a commercial bus stop.
6. Turning Vehicle at Intersection Definition: The pedestrian was attempting to cross at an intersection and was struck by a vehicle that was turning right or left.
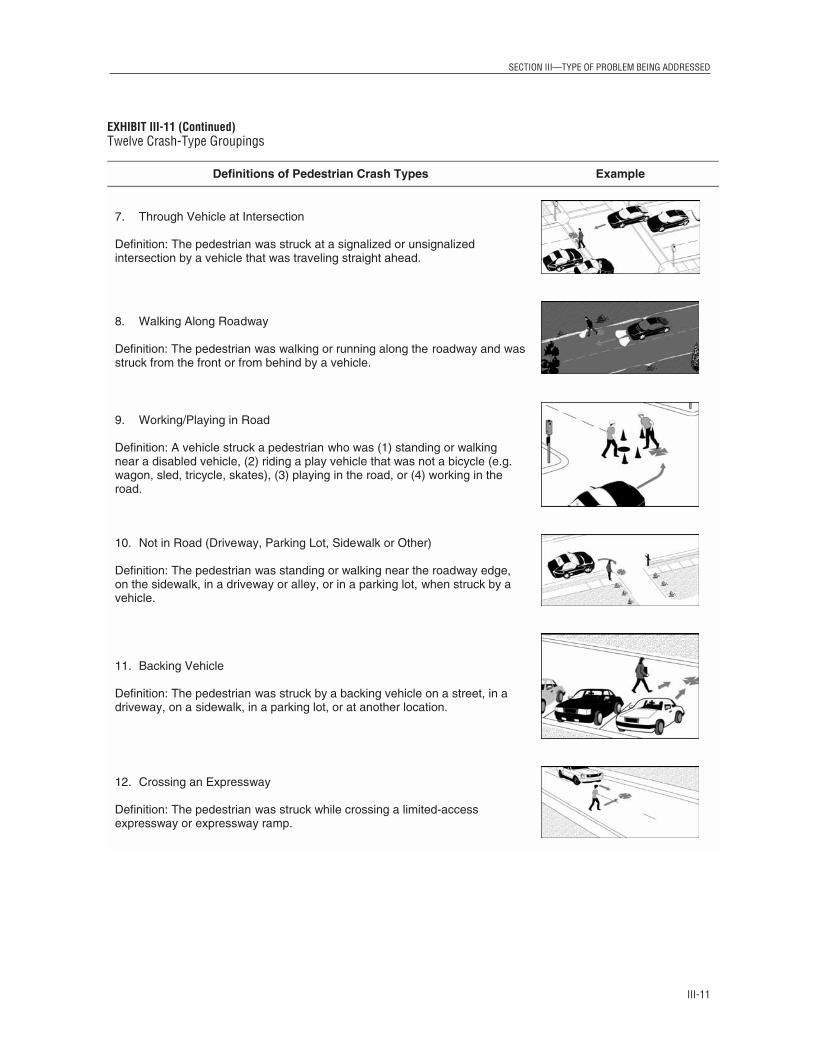
EXHIBIT III-11Twelve Crash-Type Groupings
SECTION III—TYPE OF PROBLEM BEING ADDRESSED
III-11
Definitions of Pedestrian Crash Types Example
7. Through Vehicle at Intersection Definition: The pedestrian was struck at a signalized or unsignalized intersection by a vehicle that was traveling straight ahead.
8. Walking Along Roadway Definition: The pedestrian was walking or running along the roadway and was struck from the front or from behind by a vehicle.
9. Working/Playing in Road Definition: A vehicle struck a pedestrian who was (1) standing or walking near a disabled vehicle, (2) riding a play vehicle that was not a bicycle (e.g. wagon, sled, tricycle, skates), (3) playing in the road, or (4) working in the road.
10. Not in Road (Driveway, Parking Lot, Sidewalk or Other) Definition: The pedestrian was standing or walking near the roadway edge, on the sidewalk, in a driveway or alley, or in a parking lot, when struck by a vehicle.
11. Backing Vehicle Definition: The pedestrian was struck by a backing vehicle on a street, in a driveway, on a sidewalk, in a parking lot, or at another location.
12. Crossing an Expressway Definition: The pedestrian was struck while crossing a limited-access expressway or expressway ramp.
Index of Strategies by ImplementationTimeframe and Relative Cost
Exhibit IV-1 classifies strategies according to the expected timeframe and relative cost for thisemphasis area. The implementation time will be dependent upon such factors as the agency’sprocedures, the extent of the educational or enforcement program, roadway-section length,street width, and other factors. The range of costs may also vary for some of these strategies,due to many of these same factors. Cost ranges are given in the detailed description of eachstrategy. The table is meant to reflect the most common application of each strategy. Astrategy may include several treatments, with different costs and timeframes.
EXHIBIT IV-1Classification of Strategies
Timeframe forRelative Cost to Implement and Operate
9.1 B4 Signals to alertmotorists that pedestriansare crossing
—
V-1
SECTION V
Strategies for Addressing the Problem
Objectives of the Emphasis AreaDeciding on the set of treatments that will provide the greatest safety benefits forpedestrians requires transportation and land-use planners, engineers, and communityleaders to engage in problem-solving. The problem-solving effort will often requireapplication of engineering judgment, as well as judgments based upon understanding of thecharacter and needs of the particular community.
Pedestrians face a variety of challenges when they walk along and across streets with motorvehicles. Communities are asking for help to “slow traffic down,” “make it safer to cross thestreet,” and “make the street more inviting to pedestrians.” An example of one city’spedestrian program may be found at http://www.seattle.gov/transportation/pedestrian.htm.
Tools are available to help those planning to improve pedestrian safety. The FHWA iscompleting the development of a software package called “PedSafe,” which will provideguidance on measures to improve, including a catalog of case studies. PedSafe may be foundat www.walkinginfo.org/de/pedsafe.
For citizens and citizen groups, there are resources such as the “Neighborhood WalkingGuide,” developed by the Pedestrian and Bicycle Information Center (PBIC). This Guideprovides detailed information on how to address common problems and includes furtherWeb links to technical information. The specific Web address of the Neighborhood WalkingGuide is: www.walkinginfo.org/cps/guide.htm.
The following is a list of requests (objectives) that transportation professionals are likely toface when working to reduce pedestrian/vehicle conflicts and improve pedestrian safetyand mobility:
1. Reduce pedestrian exposure to vehicular traffic2. Improve sight distance and visibility for motor vehicles and pedestrians3. Reduce the speed of motor vehicles4. Improve pedestrian and motorist safety awareness and behavior
Each of these objectives can be accomplished through a variety of the strategies (treatments)listed in Exhibit V-1. Most strategies will work best when used at multiple locations and incombination with other treatments. In addition, many of the strategies (treatments) willaccomplish two or more objectives. The key is to make sure that the right treatments arechosen to accomplish the desired effect.
A chart has been prepared (see Appendix 1) which links the strategies listed in Exhibit V-1 tothe specific crash types they are intended to address. In using the chart, it is important toremember that it is simply a guide. In all cases, good engineering judgment should beapplied when making decisions about what treatment will be best for a specific location.
SECTION V—STRATEGIES FOR ADDRESSING THE PROBLEM
V-2
In some cases, there may be a tradeoff between pedestrian and vehicular crashes, i.e., aparticular strategy, implemented in a particular location, may succeed in reducingpedestrian crashes but contribute to an increase in vehicular crashes. In general, all types ofroad users must be considered when selecting a strategy to implement. Factors such asvehicular speeds and volumes, pedestrian volumes, roadway function, and availability ofalternate routes should all be considered when making decisions about measures forreducing pedestrian crashes. In the best situations, pedestrian improvements increase safetyfor motorists as well as pedestrians. Especially in urban environments, slowing vehiclespeeds and/or separating the movements of vehicles and pedestrians can be beneficial toboth categories of road users.
Much of the technical information in this guide on specific strategies is based uponinformation found in the Pedestrian Facilities Users Guide—Providing Safety and Mobility(Federal Highway Administration, 2002), which is available at http://www.walkinginfo.org/pdf/peduserguide/peduserguide.pdf.
Or see the material at
EXHIBIT V-1Emphasis Area Objectives and Strategies
Objectives Strategies
9.1 A Reduce Pedestrian Exposure to Vehicular Traffic
9.1 B Improve Sight Distance and/or Visibility Between Motor Vehicles and Pedestrians
9.1 C Reduce Vehicle Speed
9.1 D Improve Pedestrian and Motorist Safety Awareness and Behavior
P = proven; T = tried; E = experimental
9.1 A1 Provide Sidewalks/Walkways and Curb Ramps (P)
9.1 A2 Install or Upgrade Traffic and Pedestrian Signals (P, T, & E)
9.1 A3 Construct Pedestrian Refuge Islands and Raised Medians (P)
9.1 A4 Provide Vehicle Restriction/Diversion Measures (P & T)
A program titled “PED SAFE” provides additional resources. See Appendix 2 for furtherdetails.
Details are provided on a wide variety of pedestrian safety, planning, and research topics atthe following Web address: http://www.walkinginfo.org. This Web site covers pedestrian-related crash analysis, in addition to strategies related to engineering, education, andenforcement.
Many jurisdictions will implement a combination of these in the context of a generalpedestrian safety plan. Some involve the implementation of committees that representengineering, enforcement, and educational disciplines and the agencies they serve. Somedetails regarding this, and the plans that they produce, are in Appendix 3.
Classification of StrategiesThe strategies in this guide were identified from a number of sources, including theliterature, contact with state and local agencies throughout the United States, and federalprograms. Some of the strategies are widely used, while others are used at a state or even alocal level. Some have been subjected to well-designed evaluations to prove theireffectiveness. On the other hand, it was found that many strategies, including some that arewidely used, have not been adequately evaluated.
The implication of the widely varying experience with these strategies, as well as the rangeof knowledge about their effectiveness, is that the reader should be prepared to exercisecaution in many cases, before adopting a particular strategy for implementation. To help thereader, the strategies have been classified into three types, each identified by letter symbolthroughout the guide:
Proven (P): Those strategies which have been used in one or more locations and for which properlydesigned evaluations have been conducted that show them to be effective. These strategies may beemployed with a good degree of confidence, but understanding that any application canlead to results that vary significantly from those found in previous evaluations. Theattributes of the strategies that are provided will help the user judge which are the mostappropriate for their particular situation(s).
Tried (T): Those strategies that have been implemented in a number of locations and may even beaccepted as standards or standard approaches, but for which there have not been found validevaluations. These strategies, while in frequent, or even general, use, should be applied withcaution, carefully considering the attributes cited in the Guide, and relating them to thespecific conditions for which they are being considered. Implementation can proceed withsome degree of assurance that there is not likely to be a negative impact on safety, and therevery likely will be a positive one. It is intended that as the experiences of implementation ofthese strategies continues under the AASHTO Strategic Highway Safety Plan initiative,appropriate evaluations will be conducted, so that effectiveness information can beaccumulated to provide better estimating power for the user and so that the strategy can beupgraded to a “proven” one.
V-3
Experimental (E): Those strategies that are ideas that have been suggested and that at least oneagency has considered sufficiently promising to try on a small scale in at least one location. Thesestrategies should be considered only after the others have proven not to be appropriate orfeasible. Even where they are considered, their implementation should initially occur using avery controlled and limited pilot study that includes a properly designed evaluationcomponent. Only after careful testing and evaluations show the strategy to be effectiveshould broader implementation be considered. It is intended that as the experiences of suchpilot tests are accumulated from various state and local agencies, the aggregate experiencecan be used to further detail the attributes of this type of strategy so that it can be upgradedto a “proven” one.
It is particularly difficult to evaluate the impacts of countermeasures on pedestrian crashes.Reasons include the following:
• Pedestrian crashes are even rarer events than vehicle crashes not involving pedestrians,making it difficult to assess impacts at a given location and over reasonable lengths of time
• Pedestrian-oriented street improvements are often done in conjunction with otherimprovements, making it difficult to separate the specific effects of the pedestrian-oriented strategies
As a result of these types of difficulties, evaluation work has often focused upon surrogatemeasures, primarily related to pedestrian and vehicle behaviors and conflicts. Althoughthese surrogates have not been solidly demonstrated to be linked to crash experience, theymay serve as interim indications of safety impacts, until more valid evaluations becomeavailable.
The needs of pedestrians should be considered in all work zone areas, in addition to motor-vehicle safety. The strategies described below do not address specifically the issues ofproviding for pedestrian safety in work zones. The reader should refer to the Work ZoneGuide for information.
The problem of pedestrians under the influence of alcohol will be addressed in the plannedguide on alcohol countermeasures. Since that guide is under development, Appendix 4 hasbeen provided in the interim.
Signs and pavement markings are not usually sufficient, unaided, to solve a seriouspedestrian safety problem. These devices have their place in providing helpful informationto pedestrians and/or motorists in certain situations, and they often are best used tosupplement other more substantial treatments. Details on signs, signals, and markings arecontained in the Manual on Uniform Traffic Control Devices.
When designing facilities for pedestrians, it is important to account for the interaction ofpedestrians with other road users. For example, large trucks may create special problems forpedestrians, such as trailer off-tracking while turning right (and possibly striking apedestrian standing on the sidewalk). Also, compared to other motor vehicles, some truckshave longer stopping distances, limited visibility (e.g., blind spots), and problems withnighttime visibility. Bicyclists also travel on roadways and sometimes conflict withpedestrians. In short, engineers and planners need to provide a roadway environment thatbalances the needs of all road users.
SECTION V—STRATEGIES FOR ADDRESSING THE PROBLEM
V-4
SECTION V—STRATEGIES FOR ADDRESSING THE PROBLEM
Related Strategies for Creating a Truly ComprehensiveApproachThe strategies listed above, and described in detail below, are those considered unique tothis emphasis area. However, to create a truly comprehensive approach to the highwaysafety problems associated with this emphasis area, there are related strategiesrecommended as candidates in any program planning process. These are of five types:
Public Information and Education Programs (PI&E)Many highway safety programs can be effectively enhanced with a properly designed PI&Ecampaign. The primary experience with PI&E campaigns in highway safety is to reach anaudience across an entire jurisdiction, or a significant part of it. However, it may be desiredto focus a PI&E campaign on a location-specific problem. While this is a relatively untriedapproach, as compared to area-wide campaigns, use of roadside signs and otherexperimental methods may be tried on a pilot basis. Within this guide, where the applicationof PI&E campaigns is deemed appropriate, it is usually in support of some other strategy. Insuch a case, the description for that strategy will suggest this possibility (see the attributearea for each strategy entitled “Associated Needs for, or Relation to, Support Services”). Inthis guide, since independent PI&E campaigns are deemed appropriate for the emphasisarea, the strategy is explained in detail (see Strategy 9.1 D1).
Enforcement of Traffic LawsWell-designed and -managed law-enforcement programs can have a significant positive effecton highway safety. It is well established, for instance, that an effective way to reduce crashesand their severity is to have jurisdiction-wide programs that enforce an effective law againstdriving under the influence (DUI), or driving without seatbelts. When that law is vigorouslyenforced, with well-trained officers, the frequency and severity of highway crashes can besignificantly reduced. This should be an important element in any comprehensive highwaysafety program. Enforcement programs are conducted at specific locations by the nature ofhow they must be performed. The effect (e.g., lower speeds, greater use of seatbelts, givingright-of-way to pedestrians, reduced red-light running, safer vehicles, and reduced impaireddriving) may occur at or near the specific location where the enforcement is applied.Coordinating the effort with an appropriate PI&E program can often enhance this effect.However, in many cases (e.g., speeding, pedestrian right-of-way, and seatbelt usage) theimpact is area-wide or jurisdiction-wide. The effect can be either positive (i.e., the desiredreductions occur over a greater part of the system) or negative (i.e., the problem moves toanother location as road users move to new routes where enforcement is not applied).
A pilot program is recommended when it is unclear how the enforcement effort may impactbehavior or where it is desired to try an innovative and untried method. Within this guide,the application of enforcement programs is often deemed appropriate in support of someother strategy. Many of those strategies can be targeted at either the whole system or aspecific location. In such cases, the description for that strategy will suggest this possibility(see the attribute area for each strategy entitled “Associated Needs for, or Relation to,Support Services”). For the pedestrian emphasis area, an independent enforcement programis deemed appropriate and the strategy is explained in detail. As additional guides are
V-5
completed for the AASHTO Plan, they may address the details regarding the design andimplementation of enforcement strategies. When that occurs, the appropriate links will beadded from this emphasis area guide.
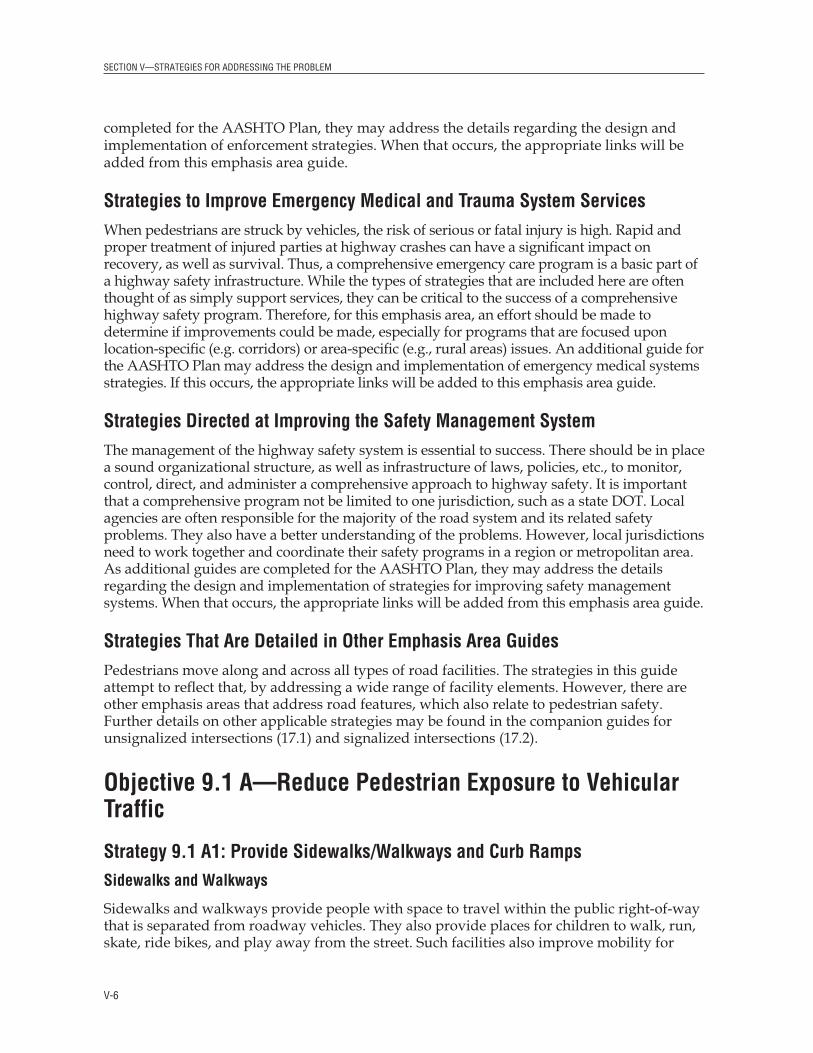
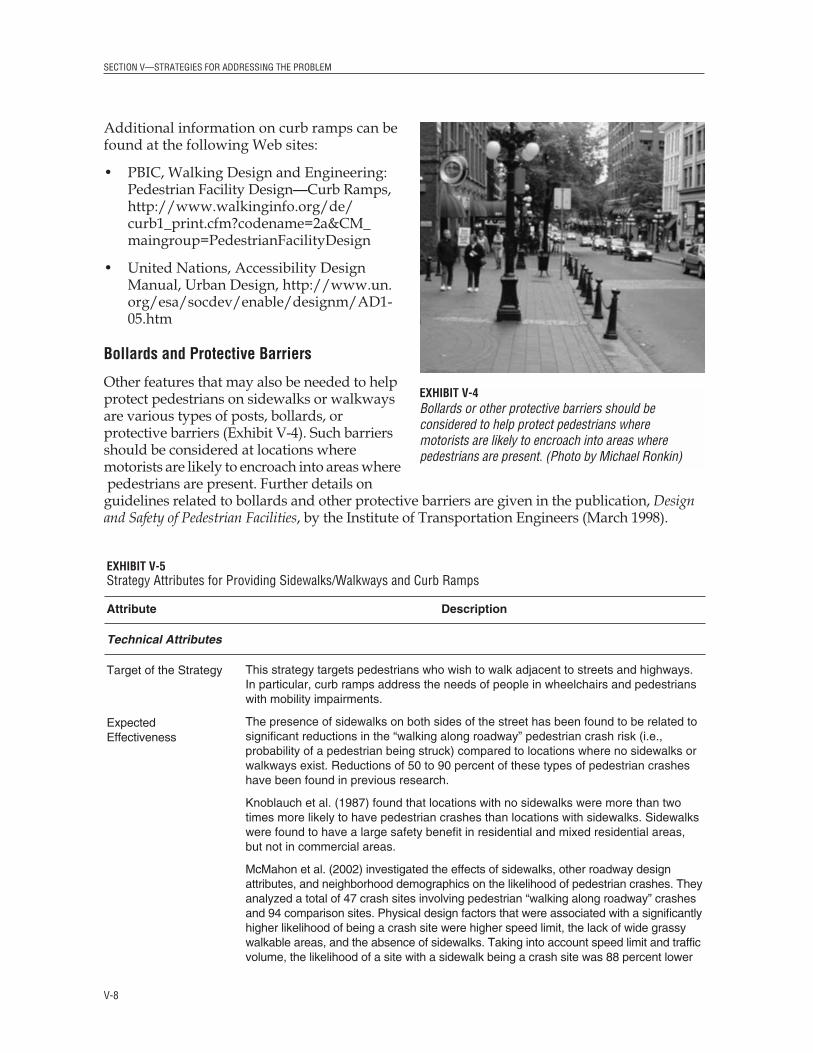
Strategies to Improve Emergency Medical and Trauma System ServicesWhen pedestrians are struck by vehicles, the risk of serious or fatal injury is high. Rapid andproper treatment of injured parties at highway crashes can have a significant impact onrecovery, as well as survival. Thus, a comprehensive emergency care program is a basic part ofa highway safety infrastructure. While the types of strategies that are included here are oftenthought of as simply support services, they can be critical to the success of a comprehensivehighway safety program. Therefore, for this emphasis area, an effort should be made todetermine if improvements could be made, especially for programs that are focused uponlocation-specific (e.g. corridors) or area-specific (e.g., rural areas) issues. An additional guide forthe AASHTO Plan may address the design and implementation of emergency medical systemsstrategies. If this occurs, the appropriate links will be added to this emphasis area guide.
Strategies Directed at Improving the Safety Management SystemThe management of the highway safety system is essential to success. There should be in placea sound organizational structure, as well as infrastructure of laws, policies, etc., to monitor,control, direct, and administer a comprehensive approach to highway safety. It is importantthat a comprehensive program not be limited to one jurisdiction, such as a state DOT. Localagencies are often responsible for the majority of the road system and its related safetyproblems. They also have a better understanding of the problems. However, local jurisdictionsneed to work together and coordinate their safety programs in a region or metropolitan area.As additional guides are completed for the AASHTO Plan, they may address the detailsregarding the design and implementation of strategies for improving safety managementsystems. When that occurs, the appropriate links will be added from this emphasis area guide.
Strategies That Are Detailed in Other Emphasis Area GuidesPedestrians move along and across all types of road facilities. The strategies in this guideattempt to reflect that, by addressing a wide range of facility elements. However, there areother emphasis areas that address road features, which also relate to pedestrian safety.Further details on other applicable strategies may be found in the companion guides forunsignalized intersections (17.1) and signalized intersections (17.2).
Objective 9.1 A—Reduce Pedestrian Exposure to VehicularTraffic
Strategy 9.1 A1: Provide Sidewalks/Walkways and Curb RampsSidewalks and Walkways
Sidewalks and walkways provide people with space to travel within the public right-of-waythat is separated from roadway vehicles. They also provide places for children to walk, run,skate, ride bikes, and play away from the street. Such facilities also improve mobility for
SECTION V—STRATEGIES FOR ADDRESSING THE PROBLEM
V-6
SECTION V—STRATEGIES FOR ADDRESSING THE PROBLEM
pedestrians and provide access for all types ofpedestrian travel to and from home, work,parks, schools, shopping areas, transit stops,etc. Walkways should be part of every newand renovated roadway, and every effortshould be made to retrofit streets thatcurrently do not have sidewalks or walkways(Exhibit V-2).
Examples of successful implementation ofsidewalks and walkways can be found at thefollowing Web sites:
• New York State Department of Transportation, http://www.dot.state.ny.us/pubtrans/bpfacilities.html#pa
• National Capital Planning Commission, http://www.ncpc.gov/actions/pdf/2002/MallWalkway_050202.pdf
Additional information on sidewalks and walkways can be found at PBIC, Walking Design andEngineering: Pedestrian Facility Design Treatments—Sidewalks and Walkways, http://www.walkinginfo.org/de/curb1.cfm?codename=1a&CM_maingroup=PedestrianFacilityDesign.
Curb Ramps
Requirements for curb ramps are provided by the U.S. Access Board, as detailed inwww.access-board.gov.
Curb ramps (also called wheelchair ramps) provide transition in elevation between the sidewalkand roadway for people using wheelchairs,strollers, walkers, crutches, handcarts, andbicycles, as well as for pedestrians withmobility impairments who have troublestepping up and down high curbs. While curbramps are needed on all types of streets,highest priority locations should be indowntown areas and on streets near transitstops, schools, parks, medical facilities,government agencies, shopping areas, and nearresidences with wheelchair users (Exhibit V-3).More details on design of sidewalks andwalkways, including curb ramps may befound in the FHWA report, Designing Sidewalksand Trails for Access, parts 1 and 2 (FederalHighway Administration, 1999, 2001).
Further discussion of design considerationsfor these may be found in Appendix 5.
V-7
EXHIBIT V-2Walkways should be part of every new and renovatedroadway. (Photo by Dan Burden)
EXHIBIT V-3Curb ramps provide transition in elevation between the sidewalk and the roadway for people usingwheelchairs, strollers, walkers, crutches, handcarts,and bicycles, as well as people who have troublestepping up and down high curbs. (Photo by MichaelRonkin)
Additional information on curb ramps can befound at the following Web sites:
• PBIC, Walking Design and Engineering:Pedestrian Facility Design—Curb Ramps,http://www.walkinginfo.org/de/curb1_print.cfm?codename=2a&CM_maingroup=PedestrianFacilityDesign
• United Nations, Accessibility DesignManual, Urban Design, http://www.un.org/esa/socdev/enable/designm/AD1-05.htm
Bollards and Protective Barriers
Other features that may also be needed to helpprotect pedestrians on sidewalks or walkwaysare various types of posts, bollards, orprotective barriers (Exhibit V-4). Such barriersshould be considered at locations where motorists are likely to encroach into areas wherepedestrians are present. Further details onguidelines related to bollards and other protective barriers are given in the publication, Designand Safety of Pedestrian Facilities, by the Institute of Transportation Engineers (March 1998).
SECTION V—STRATEGIES FOR ADDRESSING THE PROBLEM
V-8
EXHIBIT V-4Bollards or other protective barriers should beconsidered to help protect pedestrians where motorists are likely to encroach into areas wherepedestrians are present. (Photo by Michael Ronkin)
EXHIBIT V-5Strategy Attributes for Providing Sidewalks/Walkways and Curb Ramps
Attribute Description
Technical Attributes
Target of the Strategy
Expected Effectiveness
This strategy targets pedestrians who wish to walk adjacent to streets and highways.In particular, curb ramps address the needs of people in wheelchairs and pedestrianswith mobility impairments.
The presence of sidewalks on both sides of the street has been found to be related tosignificant reductions in the “walking along roadway” pedestrian crash risk (i.e.,probability of a pedestrian being struck) compared to locations where no sidewalks orwalkways exist. Reductions of 50 to 90 percent of these types of pedestrian crasheshave been found in previous research.
Knoblauch et al. (1987) found that locations with no sidewalks were more than twotimes more likely to have pedestrian crashes than locations with sidewalks. Sidewalkswere found to have a large safety benefit in residential and mixed residential areas,but not in commercial areas.
McMahon et al. (2002) investigated the effects of sidewalks, other roadway designattributes, and neighborhood demographics on the likelihood of pedestrian crashes. Theyanalyzed a total of 47 crash sites involving pedestrian “walking along roadway” crashesand 94 comparison sites. Physical design factors that were associated with a significantlyhigher likelihood of being a crash site were higher speed limit, the lack of wide grassywalkable areas, and the absence of sidewalks. Taking into account speed limit and trafficvolume, the likelihood of a site with a sidewalk being a crash site was 88 percent lower
SECTION V—STRATEGIES FOR ADDRESSING THE PROBLEM
V-9
EXHIBIT V-5 (Continued)Strategy Attributes for Providing Sidewalks/Walkways and Curb Ramps
Attribute Description
Keys to Success
Potential Difficulties
Appropriate Measuresand Data
Associated Needs
Organizational and Institutional Attributes
Organizational, Institutional, and Policy Issues
than a site without a sidewalk. Hence, the presence of a sidewalk clearly had a strongbeneficial effect of reducing the risk of “walking along roadway” pedestrian crashes.
When the design factors were controlled for, nongeometric factors that were associatedwith a significantly higher likelihood of being a crash site were high levels ofunemployment, older housing stock, lower proportions of families within households,and more single parents. The authors concluded that some neighborhoods might beespecially appropriate locations for installing sidewalks and other pedestrian treatments.
(See Appendix 6 for guidelines for sidewalk installation that resulted from the study.)
A key to successful sidewalks and walkways is careful planning in the subject neighborhoodor area. For example, a flat sidewalk with a cross slope of no more than 2 percentshould be provided across driveways that slope to the roadway to accommodatewheelchair users. The network of sidewalks and walkways should be well connected tomeet the needs of the community. More details on design of sidewalks and walkways,including curb ramps may be found in the FHWA report, Designing Sidewalks andTrails for Access, parts 1 and 2 (Federal Highway Administration, 1999, 2001).
All newly constructed and altered roadway projects should include curb ramps. It isrecommended that separate curb ramps be provided for each crosswalk at anintersection, wherever feasible, rather than having a single ramp at a corner for bothcrosswalks. This provides improved orientation for pedestrians, particularly for visuallyimpaired pedestrians. Similarly, tactile warnings are also important to alert pedestriansto the sidewalk/street edge. The ADA Standards for Accessible Design requires that astrip of truncated dome-type tactile warning be placed at the base of the crosswalk.
Agencies should upgrade existing sidewalks by first conducting audits of theirpedestrian facilities to make sure transit services, schools, public buildings, parks, etc. are accessible to pedestrians who use wheelchairs.
Agencies must overcome decades of street and road construction projects that may haveroutinely ignored the need for sidewalks and walkways. Pro-pedestrian policies andconstruction programs need to be approved and implemented to correct this problem.
A key performance measure is the frequency and percent of “walking along roadway”or midblock-crossing pedestrian crashes. The proportion of pedestrian traffic that iswalking in the roadway and crossing midblock may be a useful surrogate measure.The perceived convenience and safety that result from the provision of sidewalks andcurb ramps suggest using a count of the change in the pedestrian volume along aroute as an additional measure of success.
Process measures include the number of feet/miles of sidewalk/walkway and/or thenumber of new curb ramps which have been added (or upgraded).
A buffer zone is desirable and should be provided to separate pedestrian walkwaysand sidewalks from the street. The buffer zone width can vary according to the streettype and available right-of-way. In downtown or commercial districts, a street furniturezone is usually appropriate as a buffer zone. Parked cars and/or bicycle lanes canalso provide an acceptable buffer zone. In more suburban or rural areas, a landscapestrip is generally more suitable.
The ADA must be followed when constructing sidewalks, walkways, and curb ramps.For example, tactile patterns must be detectable to vision-impaired pedestrians.
(continued on next page)
Strategy 9.1 A2: Install or Upgrade Traffic and Pedestrian SignalsThis strategy includes six countermeasures: traffic signals, pedestrian signals, pedestriansignal timing, accessible pedestrian signals, signal enhancements, and right-turn-on-redrestrictions. Further detailed information is available in the Manual on Uniform Traffic ControlDevices for Streets and Highways (2000 MUTCD) (Federal Highway Administration, 2000a)and the ITE Traffic Control Devices Handbook, 2001, (2001b) Chapter 13, Pedestrians.
Traffic Signals
Traffic signals can create gaps in the traffic flow of sufficient size to allow pedestrians to crossthe street. Warrants for traffic signals are based upon the number of vehicles and pedestrianscrossing the intersection, along with other factors (Federal Highway Administration, 2000a).Judgment must also be used on a case-by-case basis. For example, if a new park or recreationalpath is built, there will be additional pedestrian activity, and the projected crossing demandshould be taken into account when deciding if a traffic signal is warranted. However, evenwhen warrants are met, the installation of a new traffic signal often results in an increase intotal crashes. Specifically, rear-end crashes may increase considerably, although there may be a
SECTION V—STRATEGIES FOR ADDRESSING THE PROBLEM
V-10
EXHIBIT V-5 (Continued)Strategy Attributes for Providing Sidewalks/Walkways and Curb Ramps
Attribute Description
Issues Affecting Implementation Time
Costs Involved
Training and OtherPersonnel Needs
Legislative Needs
Other Key Attributes
State and local design, planning, and zoning ordinances may need upgrading torequire sufficient right-of-way for sidewalks and other pedestrian facilities. Furtherinformation on designing sidewalks for better accessibility is found in DesigningSidewalks and Trails for Access (Federal Highway Administration, 1999, 2001).
Funding needs to be earmarked for sidewalk improvements. Proper planning ofpedestrian needs is also essential to set priorities for needed sidewalk installationsand enhancements. For more on funding, see http://www.ite.org/library/accessibleped.asp.
Costs for sidewalks will vary, depending upon factors such as width and materialsused. Typical costs for sidewalks and curb ramps are given in Appendix 7.
Training is needed in problem identification and in proper design and installationmethods. In addition to DOT personnel, anyone involved in the design, construction,or maintenance of streets and sidewalks (including planners, developers, designers,contractors, inspectors, and engineers) needs training on ADA requirements and theneed to provide access for pedestrians during street construction projects.
Some agencies have local ordinances requiring developers to install sidewalks alongall streets and highways that are adjacent to the developed property. Such ordinancesare important to help create a network of sidewalks and walkways for safe walkingwithin a community.
Legislation may be needed to prevent contractors and developers from blockingpedestrian access when working in urban areas.
Street furniture should be positioned on sidewalks to avoid restricting pedestrian flowand screening pedestrians from a driver’s view at crossing points.
SECTION V—STRATEGIES FOR ADDRESSING THE PROBLEM
decrease in angle collisions and also a decrease in overall crash severity. Traffic signals canalso create overall lower level of service for vehicles and pedestrians. Consideration mustalso be given to the possibility that traffic will divert to adjacent neighborhood streets to bypass delays associated with the signal.
Additional information on the use of traffic signals can be found at the following Web sites:
• PBIC, Walking Design and Engineering: Signals and Sign Treatments—Traffic Signals, http://www.walkinginfo.org/de/curb1.cfm?codename=37f&CM_maingroup=Signals%20and%20Signs
• City of Fort Collins, Colo., Department of Transportation, http://www.ci.fort-collins.co.us/traffic/signals.php
• City of Arlington, Va., Department of Public Works, http://www.co.arlington.va.us/dpw/traffic/signals/hb16.htm
Pedestrian Signals
Pedestrian signals should ideally be installedat all traffic signals in urban or suburbanareas. They are especially important atintersections with (1) multiphase trafficsignals, such as left-turn arrows and splitphases, (2) school crossings, and (3) double-right or double-left turns. They are alsoimportant at high-use midblock crossings andmultilane roads (Exhibit V-6).
Many pedestrians do not understand themeaning of the pedestrian signal indications,particularly the flashing DON’T WALK. Aninformational sign can be installed to tellpedestrians what they should do during theWALK, flashing DON’T WALK, and steadyDON’T WALK indications (Exhibit V-7).
Marked crosswalks should be used at allsignalized intersections and signalizedmidblock crossings to guide pedestrians tothe preferred crossing location. Crosswalksmay also discourage motorists fromencroaching into the pedestrian crossing area.Pedestrian signals need to also indicate thecrossing interval by audible and/or tactilemeans if pedestrians with visual impairmentsare to take advantage of them. While medianrefuge islands reduce the crossing distanceand are very helpful on wide streets, it ishighly desirable to give pedestrians enoughtime to cross the entire street.
V-11
EXHIBIT V-6Pedestrian signals should ideally be installed at alltraffic signals in urban and suburban areas. (Photo byDan Burden)
Additional information on pedestrian signals can be foundat the following Web sites:
• City of Fremont, Calif., http://www.ci.fremont.ca.us/Community/Traffic/PedestrianSignals.htm
• Washington State Department of Transportation,Pedestrian Signals, http://www.wsdot.wa.gov/biz/trafficoperations/traffic/pedsignals.htm
• FHWA, Office of Safety, Pedestrian Signals Q & A,http://safety.fhwa.dot.gov/fourthlevel/pdf/planning2.pdf
Pedestrian Signal Timing
At wide intersections, pedestrian crossing times oftendictate vehicle green splits and cycle lengths. As a result,minimum WALK (start) and flashing DON’T WALK(clearance) times are commonly used. The 2000 MUTCD
recommends a minimum WALK interval of 7 seconds. With such a short interval,pedestrians may only traverse one or two lanes before the flashing DON’T WALK appears.This may confuse or even panic pedestrians who do not understand the meaning of theflashing DON’T WALK. It is desirable to provide a longer WALK interval wheneverpractical. Timing clearance (i.e., flashing DON’T WALK) intervals to assume slowerwalking speeds than the standard 1.2 m/sec may also be appropriate, particularly atlocations where older pedestrians or children cross the street regularly. However, longerclearance intervals may result in the designer providing shorter walk times and/or longercycle lengths. The latter could lead to longer waits for pedestrians between crossingopportunities.
There are several pedestrian signal–timing schemes. The most common is standard (orconcurrent) timing, in which the WALK signal is displayed at the same time as the greenindication for parallel vehicular traffic. Under this timing scheme, right- and left-turningmotor vehicles may conflict with pedestrians crossing on the WALK signal (and manyturning motorists will not yield to pedestrians). Alternatives to standard timing are earlyrelease, late release, exclusive, and scramble timing.
An informational sign can tell pedestrians what they should do during each of thepedestrian signal phases (Exhibit V-7).
An early-release timing scheme displays the WALK signal for pedestrians while paralleltraffic still has a red signal. That is, pedestrians are “released” early and have a chance tobegin crossing and occupy the crosswalk before vehicles start turning right (or left) intotheir paths. With late release, parallel traffic gets the green signal first, while pedestrians stillhave the steady DON’T WALK signal. This scheme holds pedestrians back before
SECTION V—STRATEGIES FOR ADDRESSING THE PROBLEM
V-12
EXHIBIT V-7An informational sign can tellpedestrians what they should doduring each of the pedestrian signalphases.
SECTION V—STRATEGIES FOR ADDRESSING THE PROBLEM
“releasing” them, so that turning vehicles will presumably be gone by the time that theWALK signal appears; late release is only effective if there is not a constant stream of turningvehicles. At intersections where there is a very high volume of turning traffic, early-releasesignals are generally more appropriate.
With exclusive timing (sometimes referred to as the “scramble system”), all vehicular trafficis stopped, and pedestrians are allowed to cross in any crosswalk. The WALK signal isdisplayed for all crosswalks at the same time. With scramble timing, all vehicular traffic isstopped and pedestrians are allowed to cross in any crosswalk or diagonally across theintersection (Exhibit V-8). Exclusive-timing schemes are most appropriate at signalizedintersections with large pedestrian volumes (1,200 or more per day) and relatively lowmotor-vehicle speeds and volumes (e.g., central business districts and commercial centers).Because pedestrians often have to wait a long time for an exclusive signal, many will chooseto ignore the signal and cross when there is a gap in traffic. Another problem at signalizedintersections involves left-turn vehicles that turn on a green-ball indication and conflict withpedestrians who are crossing with the signal. In many cases, a solution is to provide aseparate protected left-turn phase for motorists. Pedestrians are given a DON’T WALKsignal when the left-turn arrow is displayed. When pedestrians have a WALK display, left-turning motorists have a red (no turn) indication.
The use of a short all-red interval (Exhibit V-8) can provide a better separation betweenmotorists and pedestrians.
Additional information on pedestrian signal timing can be found at the following Web sites:
• PBIC, Walking Design and Engineering: Signals and Sign Treatments—Update/ModifyPedestrian Signal Timing, http://www.walkinginfo.org/de/curb1.cfm?codename=39f&CM_maingroup=Signals%20and%20Signs
• University of Idaho, Basic Signal Timing Elements, http://www.webs1.uidaho.edu/niatt_labmanual/Chapters/signaltimingdesign/theoryandconcepts/BasicSignalTimingElements.htm
• City of Edgewood, Washington, http://www.ci.edgewood.wa.us/Cops/Safe%20Journey/Library/countermeasures/41.htm
V-13
EXHIBIT V-8With scramble timing, allvehicular traffic is stopped whilepedestrians are allowed to crossin any crosswalk or diagonallyacross the intersection. (Photo byDan Burden)
Accessible Pedestrian Signals (APS)
At signalized intersections, pedestrians who are blind or visually impaired typically start tocross the street when they hear a surge of traffic parallel to their direction of travel. Someintersection geometries and traffic conditions make it very difficult for visually impairedpersons to know when to cross. These include skewed or very wide intersections,intersections with split-phase signal timing, intersections with intermittent traffic, andintersections with pedestrian push buttons. (Visually impaired pedestrians may not realizethat they have to push a button, or they may have trouble finding the button).
Accessible pedestrian signals (APS) provide audible and/or vibrotactile informationcoinciding with visual pedestrian signals, to inform visually impaired pedestrians preciselywhen the WALK interval begins and when it is no longer safe to cross (Exhibit V-9).Pedestrians who know when the crossing interval begins will be able to complete theircrossing before the signal changes. Audible signals can also provide directional guidance,which is particularly useful at skewed or angled intersections and at wide multilane crossings.
The characteristics of different APS technologies are described in Accessible Pedestrian Signals(Bentzen and Tabor, 1998), which is available at http://www.access-board.gov/research&training/pedsignals/pedestrian.htm.
The Institute of Transportation Engineers provides a toolbox for accessible intersections athttp://www.ite.org/library/accessibleint.asp.
An interactive synthesis and guide to best practices on APS is given at http://www.walkinginfo.org/aps. The printed report and guide on APS are found at http://
Audible signals actuated by push buttons arethe most commonly used. These often emit achirp or “cuckoo” tone during the WALKinterval. The tones may alternate from oneside of the crossing to the other. A secondtype of APS consists of infrared or LEDtransmitters that emit a verbal message thatcan be heard with a hand-held receiver. Themessage may identify the pedestrian’slocation and direction of travel, give the nameof the street to be crossed, and provide realtime information about the WALK andDON’T WALK intervals. A third type of APSuses vibrotactile push buttons. By feeling thebutton, the pedestrian knows that the buttonhas been pushed and when the WALKinterval appears. Audible tones may be usedin conjunction with the vibrotactile buttons tolet the pedestrian know that a button must bepushed, where the button is located, andwhen the WALK interval appears.
SECTION V—STRATEGIES FOR ADDRESSING THE PROBLEM
V-14
EXHIBIT V-9Accessible pedestrian signals (APS) provide audibleand/or vibrotactile information to assist visuallyimpaired pedestrians on when to cross the street.(Photo by David Harkey)
SECTION V—STRATEGIES FOR ADDRESSING THE PROBLEM
Push button locator tones are also recommended to inform the visually impaired that apedestrian push button exists and to locate the position of the push button. If the tone forthe walk interval is similar to the push button locator tone, the walk interval tone shouldhave a faster repetition rate than the push button locator tone (Federal HighwayAdministration, 2000a).
Signal Enhancements
A variety of traffic and pedestrian signal enhancements can benefit pedestrians. Theseinclude automated pedestrian detectors, larger traffic signals to insure visibility, andcountdown signals, as well as signal placement, so that motorists waiting at a red lightcannot see the signals on the cross street and anticipate the green indication.
Because many pedestrians will not activate push buttons, automated pedestrian detectorshave been installed in some U.S. cities. These use microwave or infrared technology to detectpedestrians and then “call” the WALK signal. Automated detectors can also be used to monitorpedestrians as they cross and extend the clearance interval if needed, up to a preset maximum.
Automated pedestrian detectors (Exhibit V-10) are discussed thoroughly in an FHWA report produced in 2001 titled Evaluation of Automated Pedestrian Detection at SignalizedIntersections (Hughes et al., 2000). This document is available at http://www.tfhrc.gov/safety/pedbike/pubs/00-097.pdf.
The use of animated “eyes” along with theWALK sign has been shown to increase thepercentage of pedestrians that look for turningvehicles. The use of the moving eyes reinforcesthe message taught to children in school andcould be particularly useful at crosswalks usedby children and youth. It could also be ofvalue at intersections where left-turningvehicles pose a threat to pedestrians.
A pedestrian countdown signal contains atimer display and counts down the number ofseconds left to finish crossing the street.Countdown signals begin counting downeither when the WALK or when the flashingDON’T WALK interval appears and stop at thebeginning of the steady DON’T WALK interval(Exhibit V-11). Countdown signals can reassurepedestrians who are in the crosswalk when theflashing DON’T WALK interval appears thatthey still have time to finish crossing. Thisinformation is contained in Part 4 of the Manual on Uniform Traffic Control Devices(Federal Highway Administration, 2003).
Additional information on signalenhancements can be found at the followingWeb sites:
V-15
EXHIBIT V-10Automated pedestrian detectors use microwave orinfrared technology to detect pedestrians as theycross and extend the clearance interval if needed, upto a preset maximum. (Photo by Herman Huang)
• PBIC, Walking Design and Engineering:Signals and Sign Treatments—SignalEnhancements, http://www.walkinginfo.org/de/curb1.cfm?codename=40f&CM_maingroup=Signals+and+Signs&go.x=14&go.y=11
• City of Edgewood, Wash.,http://www.ci.edgewood.wa.us/Cops/Safe%20Journey/Library/countermeasures/42.htm
Right-Turn-on-Red (RTOR) Restrictions
In all 50 states and the District of Columbia,motorists may turn right on red at anyintersection, after coming to a full stop, unless aNO TURN ON RED sign (Exhibit V-12) prohibitsthe turn. RTOR restrictions can be limited tocertain hours of the day or can extend to allhours. The only exception is New York City,
where turning right on red is allowed only if a sign permits the turn. The Institute ofTransportation Engineers (1984) noted that relative to motor vehicles, allowing RTOR resultsin “substantial benefits in reduced energy consumption, positive environmental impacts,and reduced operational delays.”
RTOR can, however, increase crash risk for pedestrians. Motorists who stop at theintersection and look left to see if the road is clear sometimes do not look right beforeturning right. Therefore, they may not see pedestrians coming from the right. Preusser et al.(1981) found that right-turn crashes involving pedestrians increased slightly after RTOR
went into effect. Other studies concluded thatRTOR does not create a pedestrian safetyproblem (AASHTO, 1979; McGee, 1976). Also,many motorists do not come to a completestop as legally required.
The 2000 MUTCD identifies five conditionswhen the NO TURN ON RED sign may beused. Two of these conditions pertain topedestrians: (1) where an exclusive pedestrianphase exists; (2) where an unacceptablenumber of pedestrian conflicts result fromRTOR, especially conflicts involvingchildren, older pedestrians, or persons withdisabilities.
RTOR restrictions during the busiest times ofthe day may be sufficient at some locations.However, full-time restrictions of RTOR maybe needed near schools or in downtown areas
SECTION V—STRATEGIES FOR ADDRESSING THE PROBLEM
V-16
EXHIBIT V-11A pedestrian countdown signal shows the numberof seconds left for pedestrians to finish crossing the street. (Photo by Dan Burden)
EXHIBIT V-12Full-time restrictions of right-turn-on-red may beneeded at certain types of intersections. (Photo by Dan Burden)
SECTION V—STRATEGIES FOR ADDRESSING THE PROBLEM
with constant pedestrian activity; where sight distance is limited; where the intersection hasmore than four approach legs, or has a complex signal timing pattern; as well as where thereare high concentrations of seniors and persons with disabilities.
Prohibiting RTOR is a simple, low-cost countermeasure to implement. Together with aleading pedestrian interval, the signal changes can benefit pedestrians with minimal impacton traffic.
Additional information on RTOR restrictions can be found at the following Web site:
• PBIC, Walking Design and Engineering: Signals and Sign Treatments—RTORRestrictions, http://www.walkinginfo.org/de/curb1.cfm?codename=41f&CM_maingroup=Signals%20and%20Signs
V-17
EXHIBIT V-13Strategy Attributes for Installing or Upgrading Traffic and Pedestrian Signals
Attribute Description
Technical Attributes
Target(s)
Expected Effectiveness
Pedestrians and vehicles at signalized intersections, or at midblock locations, where asignificant volume of through or turning vehicular traffic is present.
Pedestrian Signal Timing
Early release was found to reduce the vehicle-pedestrian conflict rate by up to 95percent in St. Petersburg, Florida (Insurance Institute for Highway Safety, 1997).
Exclusive phasing for left turns and pedestrians has been associated withapproximately a 50-percent reduction in motor vehicle–pedestrian crashes ascompared to standard timing (Zegeer et al., 1982). Exclusive and scramble phaseseliminate conflicts with turning vehicles if pedestrians and motorists obey their signals.Wider intersections require longer cycle lengths.
Leading pedestrian intervals have been used successfully in New York City andelsewhere, and studies have demonstrated reduced conflicts for pedestrians(Insurance Institute for Highway Safety, 1997).
Zegeer et al. (1983) conducted a comprehensive study of the effects of pedestriansignal timing on pedestrian crashes. They analyzed 2,081 pedestrian crashes at 1,297signalized intersections in 15 U.S. cities. About 61 percent of the intersections hadconcurrent, exclusive, or other pedestrian signal timing schemes. They found that theuse of concurrent timing had no significant effect on pedestrian crashes, compared tolocations with no pedestrian signals. Exclusive (protected) phasing was associatedwith significantly fewer pedestrian crashes, compared to either concurrent timing or tono pedestrian signals. They suggested possible reasons as to why concurrent timingwas not effective: (1) Low levels of pedestrian compliance to signals, (2) False senseof security on the part of some pedestrians, (3) Lack of understanding of the WALKand flashing DON’T WALK signals, and (4) Infrequent use of pedestrian push buttonsto actuate the WALK signal.
Accessible Pedestrian Signals (APS)
The information conveyed by audible signals increases the attention of all pedestriansto traffic and may contribute to a reduction in pedestrian-vehicular conflicts and
(continued on next page)
SECTION V—STRATEGIES FOR ADDRESSING THE PROBLEM
V-18
EXHIBIT V-13 (Continued)Strategy Attributes for Installing or Upgrading Traffic and Pedestrian Signals
Attribute Description
Keys to Success
crashes at signalized intersections (Van Houten et al., 1997). It is widely believed inmany European countries, where audible signals are more widely used than in the UnitedStates, that the audible signals increase the speed at which most pedestrians initiatetheir crossings, thereby decreasing the necessary length of the pedestrian interval.Audible signals may also increase the safety of persons with cognitive disabilities.
However, two recent surveys of visually impaired pedestrians, as well as orientationand mobility specialists, found a number of problems. For example, visually impairedpedestrians may be unable to tell if a push button is present. They may have difficultyfinding the push button. The audible signal may not clearly indicate which crosswalkhas the WALK signal, or they may not be able to use the audible signal for guidanceas they cross the street (Bentzen et al., 2000; Carroll and Bentzen, 1999).
Signal Enhancements
Automated pedestrian detectors have been found to improve pedestrian compliancewith signals. They also reduce conflicts between pedestrians and motor vehicles(Hughes et al., 2000).
Countdown signals have been shown to result in fewer pedestrians still in thecrosswalk when the steady DON’T WALK signal appears (compared to sites withoutcountdown signals). However, countdown signals have had the undesired effect ofreducing pedestrian compliance (Huang and Zegeer, 2000)
Right-Turn-on-Red Restrictions
Zegeer and Cynecki (1986) found that about 21 percent of motorists violated NOTURN ON RED signs if given the opportunity. Twenty-three percent of RTORviolations resulted in a motor vehicle–pedestrian conflict. Illuminated NO TURN ON RED signs, NO TURN ON RED signs with a red ball underneath, and offset stopbars at intersections where right-turn-on-red is allowed were all effective in reducingrisk to pedestrians. The NO TURN ON RED sign with the red ball was more effectivethan the standard black and white NO TURN ON RED signs. For motorists making aright-turn-on-red, an offset stop-bar was found to increase compliance (i.e., making afull stop before turning right on red) and also reduced conflicts with cross-streettraffic. An electronic NO TURN ON RED sign that was actuated only during schoolcrossing times or other critical times was slightly more effective, but considerablymore costly, than traditional signs. In general, driver compliance was improved whenthe right-turn-on-red restriction was limited to peak pedestrian times, instead of alltimes.
Traffic and Pedestrian Signals
Signal cycles should be kept short (ideally 90 seconds maximum), to reducepedestrian delay. Pedestrians are very sensitive to delays, so that if they perceive along delay, they are likely to disobey the signal.
Pedestrian Signals and APS
Where pedestrian traffic is regular and frequent, pedestrian phases should come upautomatically. Pedestrian actuation should be used only when pedestrian crossingsare intermittent.
Ensure that signals are always visible to pedestrians, including those in the crosswalkand those waiting on the far side of the street.
If push buttons are used, they must be well signed and visible and within reach andoperable from a flat surface for all pedestrians, including those in wheelchairs.
SECTION V—STRATEGIES FOR ADDRESSING THE PROBLEM
V-19
EXHIBIT V-13 (Continued)Strategy Attributes for Installing or Upgrading Traffic and Pedestrian Signals
Attribute Description
Potential Difficulties
Appropriate Measuresand Data
Furthermore, it is desirable for the user to receive an audible feedback that the “call” hasbeen registered. Push buttons should be mounted approximately 1.1 m (3.5 ft) abovethe sidewalk, within 1.5 m (5 ft) of the extended crosswalk and within 3 m (10 ft) of theedge of the curb, shoulder, or pavement. If buttons are needed to cross both streets,they must be separated by at least 3 m (10 ft), and each button should be parallel tothe crosswalk to be used (Federal Highway Administration, 2003).
Locator tones on APS push buttons can provide guidance on the existence of apedestrian push button and help visually impaired pedestrians locate the button.
Pedestrian Signal Timing
Pedestrian signal timing changes should not have significant adverse effects onvehicle traffic operations.
Right-Turn-on-Red Restrictions
NO TURN ON RED signs should be installed adjacent to the signal indication on theright side of the street, so as to be clearly visible to right-turning motorists stopped inthe curb lane at the crosswalk. A PI&E effort, coordinated with an enforcement of theinstallations, will help establish conformity to the law.
Pedestrian Signal Timing
Longer WALK or pedestrian clearance intervals may require longer cycle lengths,which in turn can add to vehicular delay.
Exclusive and scramble timing usually create longer cycle lengths and longer waits forthe WALK signal. Thus, vehicle and pedestrian delay are increased.
With exclusive and scramble timing, it may not be possible to synchronize signals atadjacent intersections.
The benefits of alternative signal timing schemes may not extend to pedestrians withvision impairments.
Optimal signal timing, to accommodate phasing for left-turn movements or split-timingschemes, as well as an exclusive pedestrian phase, will usually require cycle lengthsof 120 seconds or more.
Added delay to vehicles may cause motorists to use neighborhood streets to bypassqueues or to change routes, which may create safety problems at other locations.
Since countdown pedestrian signals are not included in the 2000 MUTCD, permissionfor using them must be granted by the FHWA for those agencies that have adoptedthe Millennium Edition of the MUTCD.
Right-Turn-on-Red Restrictions
RTOR restrictions may result in more right-turn-on-green conflicts. The use of leadingpedestrian intervals can usually address this situation.
RTOR restrictions will increase delay at the intersection for motor vehicles.
The principal measures of effectiveness are vehicle-vehicle and vehicle-pedestriancrashes. Surrogate safety measures include conflicts between pedestrians and motorvehicles, pedestrian compliance with signals, the ability of pedestrians to finishcrossing by the end of the clearance interval, and motorist compliance with right-turn-on-red restrictions. Motorist delay and traffic volumes are measures of operational
(continued on next page)
Strategy 9.1 A3: Construct Pedestrian Refuge Islands and Raised MediansRaised pedestrian refuge islands, or medians at crossing locations along roadways, provideanother strategy to reduce exposure between pedestrians and motor vehicles. Refuge islandsand medians that are raised (i.e., not just painted) provide pedestrians more secure places ofrefuge during the street crossing. This simplifies the crossing maneuver for pedestrians bycreating the equivalent of two narrower one-way streets instead of one wide two-way street.State and local DOTs may choose to install raised medians and refuge islands not only forimproved pedestrian safety, but also to provide improved motor-vehicle safety. Adding araised median converts an undivided road to a divided road, which helps channel motorvehicles.
SECTION V—STRATEGIES FOR ADDRESSING THE PROBLEM
V-20
EXHIBIT V-13 (Continued)Strategy Attributes for Installing or Upgrading Traffic and Pedestrian Signals
Attribute Description
Associated Needs
Organizational and Institutional Attributes
Organizational, Institutional, and Policy Issues
Issues Affecting Implementation Time
Costs Involved
Training and OtherPersonnel Needs
Legislative Needs
Other Key Attributes
impact. Care should be taken to measure conditions at all locations potentiallyaffected by the changes in control.
Major changes in signal timing should be preceded with a public information campaignto avoid violating expectations of most drivers and to facilitate compliance. Acoordinated enforcement program will also help maximize the benefits of some ofthese changes.
The needs of pedestrians, bicyclists, and motorists need to be balanced whendesigning and operating intersections. For example, a design walking speed of 3ft/sec (instead of 4 ft/sec) means that the pedestrian clearance intervals will be longerand pedestrians will have more time to cross. However, vehicle delay and cyclelengths may increase, which could in turn result in more pedestrian delay.
At intersections where RTOR prohibitions are installed, there may be a need toprovide police enforcement to help insure motorist compliance.
It may take more than a year to implement these countermeasures. Traffic engineersoften conduct engineering studies to determine whether one or more of thesecountermeasures are warranted at a specific location. The availability of funds to coverthe costs of hardware, signs, installation, and maintenance depends on local and statefunding cycles. Innovative countermeasures such as automated detectors may requiresome additional time for adjustments to improve operations. Depending on local climaticconditions, installation may be feasible year-round or only during the warmer months.
Costs associated with this strategy will vary widely, depending upon thecountermeasure to be implemented and the conditions at the site. See Appendix 8 forspecific estimates of cost.
There do not appear to be any special personnel needs. Some training may be neededfor less commonly used countermeasures, such as automated pedestrian detectors.
The use of any device that is not contained in the MUTCD requires the approval of theFHWA.
None.
SECTION V—STRATEGIES FOR ADDRESSING THE PROBLEM
Raised Medians
“A median is defined as the portion of a divided highway separating the traveled way fortraffic in opposing directions” (AASHTO, 1994). Medians are either painted on the pavementor raised above it. Raised medians can serve as a place of refuge for pedestrians who cross astreet midblock or at an intersection location (Exhibit V-14). They may also provide space forlandscaping that can help to change the character of a street and reduce vehicle speeds.However, landscaping should not block sight distance between motorists and pedestrians.Raised medians allow pedestrians to concentrate on only one direction of traffic at a time.When considering raised medians, turning movements need to be carefully evaluated, so thatmotorists are not encouraged to travel on inappropriate routes, such as residential streets, ormake unsafe U-turns. Medians and islands that are only painted (i.e., not raised) do notprovide the same benefits as raised ones. Median crossings must be fully accessible by meansof curb ramps or cut-throughs. With medians, it is also important to ensure that there is enoughroom for wider sidewalks, bike lanes, and planting strips before proceeding with construction.While raised medians are not appropriate for all roadways (for example, they are generally notrecommended on higher-speed rural highways), on certain roadways they have been shownto reduce motor–vehicle, as well as pedestrian, crash rates. In Florida, for example, raisedmedians are frequently installed on suburban arterial streets to reduce crash rates.
See Florida Department of Transportation Median Handbook (Planning Division, 1997) formore explicit policy on raised medians: http://www.dot.state.fl.us/planning/systems/sm/accman/pdfs/mhb_2.pdf.
Additional information on the use of raised medians can be found at the following Web sites:
• PBIC, Walking Design and Engineering: Roadway Design—Raised Medians, http://www.walkinginfo.org/de/curb1.cfm?codename=12b&CM_maingroup=RoadwayDesign
• Iowa State Center for Transportation Research and Education, Access Management Toolkit,http://www.ctre.iastate.edu/Research/access/toolkit/17.pdf
V-21
EXHIBIT V-14Raised medians can serve as aplace of refuge for pedestrianswho cross a street midblock or atan intersection. (Photo by DanBurden)
Crossing Islands
Crossing islands, which are also known as center islands, refuge islands, pedestrian islands,or median slow points, are raised islands placed in the street at intersection or midblocklocations to help protect crossing pedestrians from motor vehicles (Exhibit V-15). Raisedcenter crossing islands will allow pedestrians to concentrate on (or cross) only one directionof traffic at a time; they can stop partway across the street and wait for an adequate gap intraffic before completing their crossing. Where crosswalks are installed at uncontrolledlocations (i.e., where no traffic signals or stop signs exist), raised crossing islands should beconsidered as a possible supplement to the crosswalk. Crossing islands are also appropriateat many signalized crossings. If there is adequate width and on-street parking, centercrossing islands can be used with curb extensions to create an improved pedestriancrossing.
Additional information on the use of crossing islands can be found at the following Web sites:
• PBIC, Walking Design and Engineering: Traffic Calming—Crossing Islands, http://www.walkinginfo.org/de/curb1.cfm?codename=21d&CM_maingroup=Traffic%20Calming
• City of Edgewood, Wash., http://www.ci.edgewood.wa.us/Cops/Safe%20Journey/Library/countermeasures/25.htm
SECTION V—STRATEGIES FOR ADDRESSING THE PROBLEM
V-22
EXHIBIT V-15Crossing islands are raised islands placed inthe street to help protect pedestrians frommotor vehicles. (Photo by Michael Ronkin)
SECTION V—STRATEGIES FOR ADDRESSING THE PROBLEM
V-23
EXHIBIT V-16Strategy Attributes for Constructing Pedestrian Refuge Islands and Raised Medians
Attribute Description
Technical Attributes
Target(s)
Expected Effectiveness
Keys to Success
Potential Difficulties
This strategy targets pedestrians who attempt to cross multilane arterial or collectorstreets.
The FHWA (Federal Highway Administration, 2002) found that the presence of araised median (or raised crossing island) was associated with a significantly lowerpedestrian crash rate at multilane crossing locations, with both marked and unmarkedcrosswalks. (See Strategy 9.1 B2 for a graph of findings.) In contrast, painted (notraised) medians and center two-way left-turn lanes did not offer significant safetybenefits to pedestrians on multilane roads, compared to no median at all. This articleis available at www.walkinginfo.org/rd/devices.htm#cros1.
Bowman and Vecellio (1994) compared undivided multilane roadways, two-way left-turn lanes, and raised-curb medians. In both central business district and suburbanlocations, the pedestrian crash rate was significantly higher on undivided arterials thanon arterials with raised medians.
After analyzing intersections in Stockholm and Malmö, Sweden, Gårder (1989)concluded that installing a refuge island decreased the pedestrian crash risk to two-thirds of what it was originally. However, the incidence of red-walking (i.e., thepercentage of pedestrians who arrive on a red signal but decide to cross the streetbefore the signal allows them to) was higher when a refuge island was present (15percent) than when there was no refuge island (10 percent).
Raised medians are most useful on arterial streets, where there are typically hightraffic volumes and multilane operation.
They should be designed to provide tactile cues for pedestrians with visualimpairments to indicate the border between the pedestrian refuge area and themotorized vehicle roadway. Also, islands should be designed to accommodatepedestrians in wheelchairs. Refer to Section 8-18 of the FHWA report DesigningSidewalks and Trails for Access: Part II of II (Federal Highway Administration, 2001)
Landscaped medians should not obstruct the visibility between pedestrians andapproaching motorists and should not include objects that represent a collision hazardto vehicles that may run onto the median.
Crossing islands should be illuminated, as well as highlighted with streetlights, signs,and/or reflectors, to ensure that motorists see them. Larger islands that are morevisible to motorists are less likely to be hit by a vehicle. An island can be made toappear larger through the use of pavement markings.
Continuous raised medians may not be appropriate in all situations. Sometimes,separating opposing traffic flow and eliminating left-turn friction can increase trafficspeeds. Medians may also take up space that can be better used for wider sidewalks,bicycle lanes, landscaping buffer-strips, or on-street parking. Medians may also causeproblems for emergency vehicles. At some locations, medians can be constructed insections, creating an intermittent rather than continuous median. Raised crossingislands at intersections or near driveways may affect left-turn access.
Raised, continuous median channelization may be opposed by businesses along acorridor as a perceived inhibitor to their business, with expected loss of revenue. Thiscan sometimes be mitigated through driveway consolidation (access management),allowing the median breaks to be minimized. Another strategy is to construct midblock
(continued on next page)
Strategy 9.1 A4 Provide Vehicle Restriction/Diversion MeasuresThis strategy involves the installation of physical features in the roadway to force or prohibitspecific motorist actions such as turns or through movements. These physical features createa visual impression that the street is not intended for through traffic. Signs such as “NoThrough Traffic” and “Dead End” are needed to advise drivers that they are approaching avehicle-restricted area. Restriction and diversion measures should be used sparingly and
SECTION V—STRATEGIES FOR ADDRESSING THE PROBLEM
V-24
EXHIBIT V-16 (Continued)Strategy Attributes for Constructing Pedestrian Refuge Islands and Raised Medians
Attribute Description
Appropriate Measures and Data
Associated Needs
Organizational and Institutional Attributes
Organizational, Institutional, and Policy Issues
Issues Affecting Implementation Time
Costs Involved
Training and Other Personnel Needs
Legislative Needs
Other Key Attributes
None Identified.
U-turns (i.e., the Michigan left turn; go to http://www.michiganhighways.org/indepth/michigan_left.html), so that businesses are easily accessible.
Pedestrian refuge islands may conflict with the need to provide open pavement forright-turning traffic with large turning paths. A right-turn slip lane can accommodatetrucks and other vehicles with large turning paths, but it needs to be well designed todiscourage high-speed vehicle turns and to improve the right-turning motorist’s view ofpedestrians.
Raised medians require landscape maintenance. They can also make utilityplacement and maintenance more difficult and complicate construction zone detours.
Performance measures include the number of crashes involving pedestrians crossing astreet. The installation of a median barrier may have safety benefits for vehicular trafficas well. Therefore, vehicular crashes should also be documented, especially thoserelated to left-turn and angle crashes at driveways. Operational impacts may also occurthat should be measured. Surrogate pedestrian safety measures include pedestrian-vehicular conflicts, pedestrians trapped in the middle of the road, and aborted crossings.
A public information campaign will help businesses and motorists prepare for changedtraffic conditions.
The DOT, or other public agencies that implement these changes, should involve allpotentially affected parties early in the planning process. Agencies may need todevelop new or revised policies regarding the use of these devices. Public hearingsmay be needed if driveway access will be restricted.
Implementation time may be affected by the amount of public involvement andcontroversy surrounding the proposed program This can occur during the planning,design, and funding acquisition processes.
The cost for pedestrian refuge islands and raised medians will vary widely, dependingupon the design, site conditions, and use of landscaping and whether the median canbe added as part of another street construction project. See Appendix 9 for estimatesof typical cost.
None identified.
None identified.
SECTION V—STRATEGIES FOR ADDRESSING THE PROBLEM
thoughtfully, since they can cause the vehicular problem to simply shift to another street.For most problem situations, traffic calming is the appropriate solution.
This strategy includes four countermeasures (see also FHWA’s Pedestrian Facilities UsersGuide (U.S. Department of Transportation, 2002), available at http://www.walkinginfo.org/pdf/peduserguide/peduserguide.pdf).
DivertersDiverters prevent certain through and/or turning movements at residential streetintersections. Exhibit V-17 illustrates four types of diverters. A diagonal diverter preventsthrough movements by forcing right or left turns. A star diverter consists of a star-shapedisland placed in the intersection to force right turns from each approach. A truncateddiagonal diverter has one end open, to allow additional turning movements. Other types ofisland diverters, such as a forced turn diverter, can be placed on one or more approach legs toprevent through movements and left turns, so that vehicles are forced to turn right.Pedestrian, bicycle, and emergency vehicle access, as well as stormwater drainage, should beaccommodated when designing diverters. If a street is a major bicycle corridor, considerationshould be given to constructing a diverter that still allows bicyclists to pass through, and ingeneral less-restrictive measures should be considered before installing diverters.
V-25
EXHIBIT V-17 Four of several types of diverters.
Additional information on the use of diverters can be found at the following Web sites:
• PBIC, Walking Design and Engineering: Traffic Management—Diverters, http://www.walkinginfo.org/de/curb1_print.cfm?codename=33e&CM_maingroup=TrafficManagement
• Fehr and Peers Transportation Consultants, Traffic Calming.Org, http://www.trafficcalming.org/toolbox/diag-divert.html
• Portland Department of Transportation, Traffic Calming, http://www.trans.ci.portland.or.us/trafficcalming/devices/Volume/DIVERTERS.HTM
A partial street closure involves physically closing or blocking one direction of motor-vehicletravel into or out of an intersection (Exhibit V-18). It could also block one entry point to atwo-way street (although after this point the street may remain two way). A partial streetclosure should always allow for easy access by pedestrians (including those in wheelchairs)and bicyclists, as well as emergency vehicles. The impact of a closure on traffic flow patternson the surrounding streets should be considered before implementing a partial street closureat the entrance to a neighborhood or area (Exhibit V-18).
Additional information on the use of partial street closure can be found at the following Web sites:
• PBIC, Walking Design and Engineering: Traffic Management—Partial Street Closure, http://www.walkinginfo.org/de/curb1_print.cfm?codename=35e&CM_maingroup=Traffic+Management&1.x=16&1.y=14
• City of Edgewood, Wash., http://www.ci.edgewood.wa.us/Cops/Safe%20Journey/Library/countermeasures/38.htm
EXHIBIT V-18A partial street closure involves physicallyclosing or blocking one direction ofmotor-vehicle travel into or out of anintersection. (Photo by Dan Burden)
SECTION V—STRATEGIES FOR ADDRESSING THE PROBLEM
Full Street Closure
With a full street closure, a physical barrier is installed to block a street to motor-vehicletraffic and provide some means for vehicles to turn around (Exhibit V-19). If a full streetclosure is done, it should always allow for easy access by pedestrians (including those inwheelchairs) and bicyclists. Emergency vehicles should also be able to access the street. Thiscan be done using an electronically operated barrier that permits large vehicles, but notpassenger cars, to traverse it. Alternatively, one can use ground-cover plantings thatemergency vehicles can easily traverse. Finally, surface drainage must be accommodated.
Additional information on the use of full street closure can be found at the following Web sites:
• PBIC, Walking Design and Engineering: Traffic Management—Full street closure,http://www.walkinginfo.org/de/curb1_print.cfm?codename=34e&CM_maingroup=Traffic+Management&1.x=10&1.y=14
• City of Palo Alto, Calif., http://www.cityofpaloalto.org/transportation/ntcp/appendix/item18.pdf
Pedestrian Street
There are two types of pedestrian streets: (1) those that eliminate motor-vehicle traffic(deliveries may be permitted during off-peak hours) and (2) those that allow some motor-vehicle traffic (often limited to buses or taxis) at very low speeds. A pedestrian street can bepart time, as in New Orleans, where removable barriers are used to close French-Quarterstreets to motorists at night. Pedestrian streets have been successful in places that arethriving and have high volumes of pedestrians.
There are several examples of successful pedestrian street implementation:
EXHIBIT V-19A full street closure shouldalways allow for easy access bypedestrians and bicyclists.(Photo by Dan Burden)
Additional information on the use of pedestrian streets can be found at the following Web sites:
• PBIC, Walking Design and Engineering: Traffic Management—Full street closure,http://www.walkinginfo.org/de/curb1_print.cfm?codename=36e&CM_maingroup=Traffic+Management&1.x=15&1.y=2
• Project for Public Spaces (PPS), Traffic Calming 101, http://www.pps.org/imagedb/category?gallery_id=829
SECTION V—STRATEGIES FOR ADDRESSING THE PROBLEM
V-28
EXHIBIT V-20Strategy Attributes for Providing Vehicle Restriction/Diversion Measures
Attribute Description
Technical Attributes
Target(s)
Expected Effectiveness
Keys to Success
Motor vehicles: These countermeasures are designed to reduce or eliminate motor-vehicle traffic on low-volume streets, especially cut-through traffic in neighborhoods.
General
Pedestrians benefit because they are exposed to fewer motor vehicles, which meansless risk of a crash, fewer conflicts, and a higher perception that it is safe to walkwithout being hit by a vehicle.
Street Closure
In Upsala, Sweden, streets were closed to vehicular traffic, one-way flow wasinstituted on bypass routes, and bus-only streets were implemented. Lovemark (1974)examined the impact of this area-wide traffic-restriction plan on pedestrian risk,defined as the probability of a collision that resulted in personal injury. The risk forpedestrians fell by 29 percent within the restricted area, but rose by 30 percentoutside the restricted area.
A study of street closures and other devices at 19 sites in London, England, found thatpedestrian crashes declined by 24 percent (Brownfield, 1980).
A. Any full or partial street-closures must be coordinated with local school officials (forbus service), sanitation, fire and police departments, and any other agency that needsto use the street to ensure services are maintained.
B. Those countermeasures that are permanent must be appropriate at all hours of theday and night.
C. These countermeasures should be part of an overall traffic management strategy.
D. When considering these measures, it is highly desirable to include the entireneighborhood in the decision-making process. This will allow input from the entireaffected area and will help prevent the level of road safety in one part of theneighborhood from being sacrificed to benefit another part. It is important to keepresidents and businesses informed on what is being proposed, how it can benefitthem, and what the likely tradeoffs are. A public-information and education program isthus important to the success of such projects. The affected residents and businessesshould be able to provide input so that their concerns can be addressed.
E. A test period should be used to identify, and make adjustments to, potentialproblems for residents and others in the adjacent areas, as well as emergency andschool access.
SECTION V—STRATEGIES FOR ADDRESSING THE PROBLEM
V-29
EXHIBIT V-20 (Continued)Strategy Attributes for Providing Vehicle Restriction/Diversion Measures
Attribute Description
Potential Difficulties
Appropriate Measures and Data
Associated Needs
Organizational and Institutional Attributes
Organizational, Institutional, and Policy Issues
Issues Affecting Implementation Time
General
The disadvantages of these countermeasures are their potential high cost, negativeimpact on emergency-vehicle response times, loss of convenient motor-vehicleaccess to some parts of a neighborhood, and diversion of traffic onto nearby streets.
Diverters
Diverters affect residents more than through traffic.
Street Closure
Full street closures will create extensive out-of-the-way travel for some residents andcan have negative economic effects on adjacent businesses. Partial street closureswill create out-of-the-way travel for some residents, but are less disruptive toneighborhood access, drainage, and emergency/large vehicle access.
Vehicle speeds may increase on streets that become one-way.
Pedestrian Street
Pedestrian streets, which are created with the intent of attracting people in decliningareas, have usually been unsuccessful.
The primary measure of effectiveness is frequency of crashes, both vehicle-vehicleand vehicle-pedestrian. The number of motor vehicles, number of conflicts betweenmotor vehicles and pedestrians, and vehicle speeds may also be used as safetysurrogates. Measures of safety should be assessed for nearby neighborhood-streetsegments affected by the diverted traffic and not just the targeted road segment.Operational impact measures include motorist delay and vehicle-miles of travel. Ifbusinesses are affected, any evaluation of program effectiveness must also take intoaccount economic losses or gains for these businesses.
The closure of one or more road segments has area-wide impact. A public informationcampaign is needed to make affected populations aware of the reasons for, andbenefits of, the program. In addition, an enforcement program will greatly enhance theeffort, especially during the introductory period for the changes.
Mechanisms are needed for including the entire neighborhood in the decision-makingprocess. Residents, area businesses, and schools, as well as local sanitation, fire,and police departments should be included in the process.
It may take 1 or more years to implement these countermeasures. Studies should beconducted to determine whether one or more of these countermeasures would behelpful at a specific location and to identify potential negative consequences. Theprocess includes working with affected residents, businesses, schools, the local policeand fire departments, and others to address their concerns. This public involvementprocess may take awhile, especially if the proposed countermeasures prove to becontroversial. The types of vehicle diversion, and the locations within a neighborhood,may need to be modified. The availability of funds to cover the costs of installationdepends upon local and state funding cycles.
(continued on next page)
Strategy 9.1 A5: Install Overpasses/UnderpassesPedestrian Overpasses and Underpasses
Pedestrian overpasses and underpasses (i.e., bridges and tunnels) allow for theuninterrupted flow of pedestrians separate from vehicular traffic (Exhibit V-21). Becausethese are high cost, require extensive time to implement, and are usually visually intrusive,they are primarily used as measures of last resort.
SECTION V—STRATEGIES FOR ADDRESSING THE PROBLEM
V-30
EXHIBIT V-20 (Continued)Strategy Attributes for Providing Vehicle Restriction/Diversion Measures
Attribute Description
Costs Involved
Training and Other Personnel Needs
Legislative Needs
Other Key Attributes
Costs will vary widely, depending upon the type of countermeasure chosen and theenvironment in which it is to be installed, including modifications needed toaccommodate drainage. Some typical costs are given in Appendix 10.
General
Training is needed on how to work with neighborhood groups and build a consensusfor a traffic mitigation plan.
Partial Street Closure
Police enforcement may be needed to prevent motorists from violating a partial streetclosure.
Police may be encouraged to enhance enforcement of a restriction if an ordinancewere passed that allowed for a reduced fine and no points for violating cut-throughtraffic restrictions that are not safety related. This might also help gain public supportfor the measures.
None.
EXHIBIT V-21Pedestrian overpasses andunderpasses allow for theuninterrupted flow of pedestriansseparate from vehicular traffic. (Photoby Yan Jai)
SECTION V—STRATEGIES FOR ADDRESSING THE PROBLEM
V-31
Attribute Description
Technical Attributes
Targets This strategy principally targets pedestrians who are faced with crossing a freeway or other high-speed, high-volume arterial street and is especially relevant at locations with high pedestrian volumes. Railroad tracks are also sometimes targeted for overpasses or underpasses.
Expected Effectiveness The effectiveness of these treatments depends largely upon the likelihood they will be used by most or all pedestrians who will cross the street. Reductions in pedestrian crashes of up to 90 percent have been found in Tokyo, Japan, after installing overpasses along with fencing to prevent at-grade crossings.
The effectiveness of pedestrian grade separation depends largely upon the proportion of pedestrians crossing at or near it that uses it. In turn, the level of use depends on convenience and walking distances compared with alternative crossing locations. Moore and Older (1965) found that most pedestrians will use an overpass if the walking time to use the overpass is the same (or less) as crossing at street level. However, if the walking time to use an overpass is 50 percent longer than crossing at street level, almost no one will use the overpass. This is illustrated in the figure below.
Accident Prevention Effects (Japan Road Association, 1969) reported the effects of 31 pedestrian overpasses in Tokyo, Japan, on pedestrian crashes. When the numbers of crashes within 100 meters of the overpasses during the 6-month periods before and after installation were compared, it was found that pedestrian-related crashes decreased by 91 percent. The number of crashes within 200 meters fell by 85 percent.
EXHIBIT V-22Strategy Attributes for Installing Overpasses and Underpasses
(continued on next page)
SECTION V—STRATEGIES FOR ADDRESSING THE PROBLEM
V-32
Attribute Description
Keys to Success As depicted above, studies have shown that many pedestrians will not use an overpass or underpass if they can cross at street level in about the same amount of time.
Overpasses work best when the topography allows for a structure without ramps (e.g., overpass over a below-grade freeway). Underpasses work best when designed to feel open and accessible. Pedestrians will generally not use these facilities if a more direct route is available. Tall fences and other pedestrian barriers are often used to channel pedestrians to use the overpass or underpass. However, these are not always effective, since pedestrians may cut the fence or simply go around the barriers and cross at driveways or intersections.
Ramps must be designed to accommodate pedestrians in wheelchairs and meet ADA standards. Stairs or elevators used to supplement the ramp will increase use while reducing the crossing time.
Some pedestrian bridges have included public art projects to improve their appearance and make them more appealing to the public.
Potential Difficulties Difficulties include obtaining funds for retrofitting or installing an overpass or underpass. Also, it is often difficult to ensure that pedestrians will use the facility without providing high fencing, and such fencing can be visually unappealing and not always effective (e.g. when pedestrians cut holes in the fence). Nearby residents and other property owners may find a pedestrian bridge "ugly," and some residents may complain of a loss of privacy.
The extensive ramps required by ADA often use sizable amounts of right-of-way on each side of the overpass.
Underpasses can have chronic drainage and associated debris problems if not properly designed and maintained. Crime, vandalism, and graffiti can also cause problems. Adequate lighting is essential.
Appropriate Measures and Data
Performance measures include the number or percent of crashes involving pedestrians crossing the street and the change in probability of being involved in a crash.
A surrogate safety measure is the percentage of pedestrians who use the facility compared to those crossing at street level.
Associated Needs Overpasses and underpasses must accommodate all persons, as required by the ADA. These measures include ramps or elevators. Extensive ramping will accommodate wheelchairs and bicyclists but results in long crossing distances that discourage use. High fences or other barriers may be needed to block pedestrians from crossing at street level.
Organizational and Institutional Attributes
Organizational, Institutional, and Policy Issues
State and many local DOTs have the organizational structure to implement this strategy. Overpasses and underpasses can either be retrofitted to existing roadways or included in the planning and design of new roads.
Issues Affecting Implementation Time
The time required to implement overpasses or underpasses is certainly affected by the ability and desire of the agency to obtain needed funding. Further, there is a need to satisfy ADA requirements, which can affect the schedule for implementation. Finally, significant time is required to design the structure and acquire any additional right-of-way for it.
EXHIBIT V-22 (Continued)Strategy Attributes for Installing Overpasses and Underpasses
SECTION V—STRATEGIES FOR ADDRESSING THE PROBLEM
Objective 9.1 B—Improve Sight Distance and/or VisibilityBetween Motor Vehicles and Pedestrians
Strategy 9.1 B1: Provide Crosswalk EnhancementsThe intent of marked crosswalks is to indicate the optimal or preferred locations forpedestrians to cross. They also help designate right-of-way and may encourage motorists toyield to pedestrians. Marked crosswalks arecommonly installed at signalizedintersections, as well as other high-volumepedestrian-crossing locations, such as schoolzones. Acceptable crosswalk marking patternsare given in the MUTCD. Marked crosswalksare desirable at some locations having regularpedestrian crossing activity (often inconjunction with other measures). In somecases, crosswalks can be raised and shouldoften be installed in conjunction with otherphysical roadway enhancements thatreinforce the crosswalk and/or reduce vehiclespeeds. It is sometimes useful to supplementcrosswalk markings with motorist warningsigns (Exhibit V-23). The report recommendsthat on multilane roads with traffic volumesabove about 12,000, more substantialpedestrian crossing treatments are needed tohelp pedestrians to cross them safely.
Another crosswalk enhancement sanctionedin the 2003 MUTCD is in-pavement flashinglights. Amber lights are embedded in thepavement on both sides of the crosswalk,oriented to face oncoming traffic. When thepedestrian activates the system, either by
V-33
Attribute Description
Cost Involved The cost for an overpass or underpass can range from $500,000 to $4 million, depending on site characteristics and right-of-way acquisition required.
Training and Other Personnel Needs
Designers must be trained regarding ADA requirements.
Legislative Needs None.
Other Key Attributes
Underpasses can also work very well for bicyclists, since cyclists gain speed going down, which then propels them up the other side.
EXHIBIT V-22 (Continued)Strategy Attributes for Installing Overpasses and Underpasses
EXHIBIT V-23It is sometimes useful to supplement crosswalkmarkings with motorist warning signs. (Photo byMichael Ronkin)
using a push button or through detection from an automated device, the lights begin to flashat a constant rate, warning the motorist that a pedestrian is in the vicinity of the crosswalkahead. There have been several municipalities that have implemented in-pavement lights,including the city of Kirkland, Washington, which successfully installed lights in 17 locationsin 1997. For more information see http://www.walkinginfo.org/pedsmart/plkirk.htm.
Marked crosswalks should only be used at locations with adequate visibility. Reasonableaccommodation should be made to make crossings convenient as well as safe.
Crosswalk markings should be visible to motorists, particularly at night, and should not beslippery or create tripping hazards (Exhibit V-24). Although granite and cobblestones areaesthetically appealing materials, they are generally not appropriate for crosswalks becausethey can cause tripping hazards and difficulties for wheelchairs. Stamped or colored concreteshould be accompanied with paint lines and have a nonstamped area in the center, betweenthe two strips of stamped concrete. Inlay tape is one of the best materials for markingcrosswalks because it is highly reflective, long lasting, slip resistant, and low maintenance.Both inlay tape and thermoplastic are more cost-effective in the long run than paint. Inlay tapeis recommended for new and resurfaced pavement, while thermoplastic may be a preferredoption on rough pavement surfaces. Crosswalk markings should be placed to include the curbramps, so that a wheelchair does not have to leave the crosswalk to access the ramp.
Recommended guidelines and priorities and/or enhancements for crosswalk installation atuncontrolled locations are available in the 2000 MUTCD and the Traffic Control DevicesHandbook (Institute of Transportation Engineers, 2001b) Chapter 13, Pedestrians. Theseguidelines are based upon a major nationwide study for FHWA (see Appendix C of FederalHighway Administration [2002]). Recommendations are also given for providing otherpedestrian crossing enhancements at uncontrolled locations with and without a markedcrosswalk.
SECTION V—STRATEGIES FOR ADDRESSING THE PROBLEM
V-34
EXHIBIT V-24Example of Crosswalk Marking Patterns (Note: Neither the solid crosswalk nor thedashed lines (which are common in Europe) are included in the 2000 MUTCD.)
SECTION V—STRATEGIES FOR ADDRESSING THE PROBLEM
V-35
Attribute Description
Technical Attributes
Target(s) This strategy is directed at pedestrians, to guide them to the best location to cross a high-volume, or wide, street when a signal is not present. Marked crosswalks may also serve to alert drivers of pedestrian crossing activity. (For signalized crossings, see Strategy 9.1 C3.)
Expected Effectiveness Zegeer et al. (2002) performed a study of 1,000 marked crosswalk sites and 1,000 matching unmarked sites in 30 U.S. cities.
The study found that on two-lane roads there was no statistical difference in pedestrian crash rate between a marked crosswalk with no supplementary treatments at an uncontrolled location and an unmarked crosswalk. On multilane roads with traffic volumes above about 12,000 vehicles per day, a marked crosswalk (without other substantial improvements) was associated with a significantly higher pedestrian crash rate (after controlling for other site factors) compared to an unmarked crosswalk (see exhibit below). One reason for the higher crash rate was an increase in "multiple-threat" crashes. This situation arises when a motorist stops to let a pedestrian cross and the pedestrian is struck by a motorist traveling in the same direction whose view of the pedestrian is blocked by the stopped vehicle (see Exhibit III-10). Another reason for the higher crash rates at marked crosswalk-locations was that pedestrians over 65 years old were much more likely to cross at these locations, and, compared to other age groups, these older pedestrians have a higher risk of being struck by cars.
0.120.17
0.63
1.37
0.17
0.74
0.12
0.25
0.15
0.28
0
0.17
0
0.2
0.4
0.6
0.8
1
1.2
1.4
1.6
u u u u u u
Type of Crossing
Ped
estr
ian
Cra
sh R
ate
(Ped
estr
ian
Cra
shes
per
Mill
ion
Cro
ssin
gs)
M= Marked
U= Unmarked
M UNo MedianAll ADT's2 Lanes
(914 Sites)
M UNo Raised Median
< 12,000 ADT3 to 8 Lanes(260 Sites)
M UNo Raised Median12,000-15,000 ADT
3 to 8 Lanes(149 Sites)
M U No Raised Median
> 15,000 ADT3 to 8 Lanes(417 Sites)
M URaised Median< 15,000 ADT3 to 8 Lanes
(87 Sites)
M URaised Median> 15,000 ADT3 to 8 Lanes(173 Sites)
Sig. = Significant DifferenceN.S. = No Significant Difference
Crosswalk Type
(p=0.62)*
N.S.
(p=0.00)
(p=0.02)
(p=0.87) (p=0.59)
N.S.
Sig.
Sig.
Sig.
N.S.
(p=0.004)
Pedestrian Crash Rates vs. Types of Crossing, Uncontrolled Approaches
EXHIBIT V-25Strategy Attributes for Providing Crosswalk Enhancements
(continued on next page)
SECTION V—STRATEGIES FOR ADDRESSING THE PROBLEM
V-36
Potential Difficulties Inconsistent or excessive use of marked crosswalks can result in confusion to both pedestrians and drivers, violate driver expectancies, and lead to disrespect for the control devices being used. It may also pose liability risks for the public agency.
Attribute Description
Appropriate Measures and Data
Measures of effectiveness include the number of pedestrians struck while crossing the street. Measures of driver and pedestrian behavior (e.g., near misses, conflicts, and violations of the crosswalk) may be used as safety surrogates. The proportion of pedestrians using the marked crosswalk may also be a measure of effectiveness.
Associated Needs A program to improve pedestrian crossings should be coordinated with an enforcement and public-information and education campaign (see Objective 9.1 D)
Organizational and Institutional
Organizational, Institutional, and Policy Issues
It is important to establish a sound policy for installing pedestrian crossing enhancements. The city of Seattle has implemented an excellent policy in this regard (check: http://www.seattle.gov/transportation/pedpolicy.htm). Also see material available at the following pedestrian web-site: http://www.walkinginfo.org/pdf/r&d/crosswalk_021302.pdf
Issues Affecting Implementation Time
Significant time will be required to prepare a truly comprehensive approach. Weather and season of the year may also affect the scheduling of adding or re-striping marked crosswalks. In general, it is possible that a program can be completed within a year.
Costs Involved $100 for standard striped crosswalk, $300 for a ladder crosswalk, and $3,000 for a patterned concrete crosswalk.
The same study revealed that raised medians were associated with significantly lower pedestrian crash rates on multilane roads compared to roads with no raised median. Again, older pedestrians had crash rates that were high relative to their crossing exposure. The figure above summarizes the study findings. The report's recommendations for adding crosswalks and other pedestrian crossing enhancements are contained in Appendix 11. Although there was no significant
Keys to Success Crosswalk locations should be convenient for pedestrians and should be accessible for pedestrians in wheelchairs.
Crosswalk markings, without related enhancements, are unlikely to increase pedestrian safety. Ideally, crosswalks should be used in conjunction with other measures, such as curb extensions, to improve the safety of the crossing, particularly on multilane roads with average daily traffic (ADT) above about 10,000.
Marked crosswalks should guide pedestrians to cross at locations where there is street lighting at night.
difference in the pedestrian crash rates for three-lane roads vs. those with four or more lanes, the report recommendations address each of these situations separately. For more details on this study, see Appendix 11 and the referenced report. The reader is also referred to the ITE Web site (http://www.ite.org/) for updated guidelines currently under development by the ITE Pedestrian and Bicycle Council, Subcommittee on Pedestrian Treatments at Uncontrolled Crossings.
Marked crosswalks are important for pedestrians with vision loss. Detectable warnings are needed to advise pedestrians with visual impairments where the curb ramp ends and the street begins. See also “Accessible Pedestrian Signals,” Strategy 9.1 A2. For more details, see section 4.4.2 of the report Designing Sidewalks and Trails for Access,Part II of II (Federal Highway Administration, 2001).
EXHIBIT V-25 (Continued)Strategy Attributes for Providing Crosswalk Enhancements
SECTION V—STRATEGIES FOR ADDRESSING THE PROBLEM
Strategy 9.1 B2: Implement Lighting/Crosswalk Illumination MeasuresGood placement of lighting and adequate lighting levels can enhance an environment forwalking, as well as increase pedestrian safety and security. Pedestrians often assume thatmotorists can see them at night, since the pedestrian can see the oncoming headlights.Therefore, emphasis is needed on providing the driver the help needed to see the pedestrianin time to stop.
In commercial areas with nighttime pedestrian activity, streetlights and building lights canenhance the visibility of pedestrians to motorists. It is best to place continuous streetlightsalong both sides of arterial streets to provide for consistent levels of lighting along aroadway. Nighttime pedestrian crossing areas should be properly illuminated. This includeslighting pedestrian crosswalks and approaches to the crosswalks (Exhibit V-26).
In commercial or downtown areas, pedestrian-level lighting may be placed over thesidewalks to improve pedestrian safety, security, and comfort. Mercury vapor, incandescent,or less-expensive high-pressure sodium lighting may be used for pedestrian-level lighting.Low-pressure sodium lights are more energy-efficient and create less light pollution, buttheir yellow color can “mask” the amber lights at traffic signals, and they are generally lesspopular with both pedestrians and drivers.
V-37
Attribute Description
Training and Other Personnel Needs
Training most importantly relates to which type of crossing enhancement to select under different traffic and roadway conditions.
Legislative Needs A set of laws are needed at the state and local level to support the proper relationship between pedestrians and vehicles on the roadway. The Model Uniform Vehicle Code (http://www.ncutlo.org) can serve as a resource. An example of a set of laws in Seattle, Washington may be found at http://www.seattle.gov/transportation/pedpolicy.htm. This location also links to a pictorial representation of the State of Washington law on crosswalks.
Other Key Attributes
None.
EXHIBIT V-25 (Continued)Strategy Attributes for Providing Crosswalk Enhancements
EXHIBIT V-26Nighttime pedestriancrossing areas should beproperly illuminated. (Photoby Dan Burden)
SECTION V—STRATEGIES FOR ADDRESSING THE PROBLEM
V-38
EXHIBIT V-27Strategy Attributes for Implementing Lighting/Crosswalk Illumination Measures
Attribute Description
Technical Attributes
Target
Expected Effectiveness
Keys to Success
Potential Difficulties
Appropriate Measures and Data
Associated Needs
Organizational and Institutional Attributes
Organizational, Institutional, and Policy Issues
Issues Affecting Implementation Time
Costs Involved
Training and Other Personnel Needs
Legislative Needs
Other Key Attributes
Legislative Needs
This strategy is directed at motorists who are driving at night in areas with pedestrianactivity.
In Perth, Australia, there were 62 percent fewer pedestrian crashes at night aftercrosswalks were floodlighted than before (Pegrum, 1972). The installation of acombined illumination and signing system for crosswalks in Israel reduced nighttimepedestrian crashes by 43 percent, while daylight crashes were relatively unchanged(Polus and Katz, 1978). Freedman et al. (1975) observed the impacts of improvedlighting on driver and pedestrian behavior in Philadelphia. It was found that pedestriansearch behavior improved significantly, and drivers appeared to be more aware ofcrosswalks.
Install lighting on both sides of wide streets and streets in commercial districts.Provide uniform lighting levels to avoid “dark spots.”
Difficulties include acquiring adequate funding to install new lighting in developingareas. Also, it should be noted that existing street lighting may be ineffective forpedestrians if it is too high or if trees block the light from reaching the sidewalk.
Measures of effectiveness for evaluating lighting improvements include the number ofnighttime pedestrian crashes and the percentage of all crashes that occur at night.Increased pedestrian activities and lower crime rates can also be used as measuresof improved conditions.
In addition to installing good-quality lighting, there is a need to provide regularmaintenance and monitoring of lighting levels.
It is important for state and local agencies to establish policies for lighting inpedestrian areas, as well as a procedure for identifying and implementing neededlighting improvements.
Many state DOTs have policies that limit or prohibit payment for lighting as part ofroad construction projects, leaving its funding as a local contribution.
Availability of funding for lighting improvements is a key issue affectingimplementation time. Also, local governments often prefer more expensive, decorativelighting versus the standard lighting provided by many state standards. Resolvingthese issues, including who pays for what, can delay lighting project completion.
Cost varies widely, depending upon the type of lighting fixtures, the location of thepower source, overhead versus underground power services, and service agreementwith local utility company.
Lighting improvements can be made by agency personnel or by private contract. Ineither case, experienced personnel are needed to design and install lightingimprovements. Monitoring and maintenance programs are needed, including nightinspections.
None.
The type of lighting (mercury vapor, incandescent, or high-pressure sodium) should beselected based on the needs for a given roadway situation.
SECTION V—STRATEGIES FOR ADDRESSING THE PROBLEM
9.1 B3: Eliminate Screening by Physical ObjectsSight Distance. Crosswalks should not be placed close to horizontal or crest vertical curvesto avoid inadequate sight distance to crossing pedestrians.
Parking. Pedestrian crashes become more likely when the motorist and pedestrian cannotsee they are on intersecting paths. Screening can occur in several ways. First, a parkedvehicle can screen the view of a pedestrian beginning to cross the street (Exhibit V-28).Restricting parking in advance of the crosswalk is one way to eliminate this problem. TheMUTCD indicates that there should be no parking 20 feet in advance of crosswalks. Anotherway to solve this problem is to install curb extensions at intersection and midblockcrosswalk locations (see Section 9.1 A3). This treatment increases the visibility of pedestriansstarting to cross, but the pedestrian is still already in the lane of travel once he or she entersthe roadway. Therefore curb extensions do not eliminate the requirement to restrict parkingin advance of the crosswalk.
Utility Poles, Signs, and Street Furniture. A properly designed street corner will improvesight distance. Crashes can occur when a pedestrian steps out from behind a utility pole orother obstructions which block the pedestrian’s and motorist’s view of each other.Eliminating trash cans, newspaper boxes, and other clutter from the intersection canimprove intersection sight distance.
V-39
EXHIBIT V-28Restricting parking in advanceof a crosswalk is one way toimprove the sight distancebetween motorists andpedestrians. (Photo by CharlieZegeer)
Vehicles Yielding Too Close to Crosswalk. This is documented to be the most dangeroustype of screening situation involving crosswalks. In this instance, a motorist stops so close tothe crosswalk that the stopped vehicle will block the view of other oncoming motorists inthe adjacent lane. If the pedestrian steps out from behind the yielding vehicle just as theother oncoming vehicle arrives at the crosswalk, a crash is likely to occur. There is asecondary danger that may occur in this situation. A vehicle following behind the yieldingvehicle could attempt to pass the stopped vehicle and will not see the pedestrian until it istoo late. Both types of crashes are very dangerous because the driver only sees thepedestrian at the last moment and therefore has little or no time to brake. The best way toaddress this problem is to install yield markings along with a sign instructing motorists toyield at the marking (Exhibit V-29). If the motorist stops sufficiently far back, it increasessight distance and markedly reduces the chance of a multiple-threat crash.
The use of advance markings also reduces the chance of a rear-end crash, which could resultwhen an inattentive driver crashes into the back of a vehicle that is yielding to a pedestrian.This type of crash can produce serious injuries not only to the vehicle occupants but also tothe pedestrian, if the front vehicle is pushed into the pedestrian as a result of the crash. Ifthere is sufficient separation between the yielding vehicle and the pedestrian, it may bepossible to avoid the pedestrian being involved in such a crash.
SECTION V—STRATEGIES FOR ADDRESSING THE PROBLEM
V-40
EXHIBIT V-29Installing advance yield markingsalong with a sign instructingmotorists to yield can reduce thechance of a pedestrian crash andalso reduce the likelihood of a rear-end collision. (Photo by MichaelRonkin)
EXHIBIT V-30Strategy Attributes for Reducing Screening by Physical Objects at Crosswalks
Attribute Description
Technical Attributes
Target
Expected Effectiveness
This strategy is directed at physical conditions which result in a pedestrian, who iscrossing the street, being screened from view.
Studies have shown that reducing visual screening by installing advance yieldingmarkings can produce large reductions in motor-vehicle/pedestrian conflicts at
SECTION V—STRATEGIES FOR ADDRESSING THE PROBLEM
V-41
EXHIBIT V-30 (Continued)Strategy Attributes for Reducing Screening by Physical Objects at Crosswalks
Attribute Description
Keys to Success
Potential Difficulties
Appropriate Measures
Associated Needs
Organizational and Institutional Attributes
Organizational Issues
Cost Involved
crosswalks (Van Houten et al., 2003, 2001c). Compliance with the markings has beenshown to be high (Nee and Hallenbeck, 2003; Van Houten et al., 2003, 2001c) andconflict reductions of between 76 percent and 77 percent have been reported (VanHouten et. al, 2003, 2001c).
A basic key to success is having a mechanism for identifying problem locations andprogramming improvements. This can be a combination of active agency field reviewalong with provision for input from law enforcement and the community.
Design guidelines and criteria are needed to help identify inadequate situations aswell as to arrive at effective improvements.
Where a new control, such as the advance yield marking, is to be employed, it will beimportant to educate the public on its meaning and appropriate behaviors toward it.
Physical constraints will sometimes make it infeasible to meet the desired standards.For example, markings for advance yield points on approaches to crosswalks may beplaced between 20 and 50 feet in advance of the crosswalk. Sometimes the locationsof intersections or driveways make optimal placement difficult. Another example iswhere the street and sidewalk network, along with traffic volumes, creates a naturalpedestrian crossing point at an undesirable curve location. In such cases, it will oftenbe expensive, or just infeasible, to change the alignment. Furthermore, theinconvenience to pedestrians that may result from a relocation of the crossing pointcould make it unacceptable. In such cases, other strategies may have to beemployed, including advance warning signs and flashers. As a final example, any timethere is elimination of parking, there may be strong resistance, depending upon thesurrounding land use and availability of alternative parking locations.
The primary measure of effectiveness would be the change in number of crashes, bytype, including crossing pedestrians and rear-end. Pedestrian-vehicle and vehicle-vehicle conflicts might be used as surrogates for early evaluation of a program.Process measures include the number of improvements made and the number ofpedestrians affected by the improvements made.
Advance crosswalk warning signs, electronic devices to alert motorists whenpedestrians are crossing, and raised pedestrian refuge islands work together withadvance yield markings to increase safety at crosswalks at multilane locations.
A public-information and education campaign may be needed to inform the public ofthe institution of new controls with which they may not be familiar.
It is often difficult to gain acceptance for a reduction in parking supply in urban areas.It is important to work closely with those merchants, or other users of adjacentdevelopment, who may be affected by a reduction in parking. Increased pedestrianflows may result from safer crossing conditions, potentially offsetting the loss ofmarket exposure that a merchant may experience from a small reduction in parking.
New design criteria and guides may be needed to provide a foundation forimplementing some of these strategies.
Cost components will primarily involve new signs and markings. Conditions may occurwhere some reconstruction of the roadway or relocation of street furniture may be
(continued on next page)
Strategy 9.1 B4: Signals to Alert Motorists That Pedestrians Are CrossingPedestrian-Activated Yellow Beacons. Research has demonstrated that the use of overheadpedestrian signs, with flashing beacons, increases driver yielding to pedestrians (FederalHighway Administration, 2000b, 2001; Van Houten et al., 1999b). However, the effects aremodest at best. There are two reasons why flashing beacons are not more effective inobtaining driver compliance at crosswalks. First, the use of yellow flashing warningbeacons is not specific to pedestrians. Hence, drivers might not expect a pedestrian whenthey see a flashing beacon. Second, if the beacon is timed for slower pedestrians, thepedestrian has often finished crossing when a driver approaches. Hence, the driver mayquickly conclude the pedestrian has finished crossing if a yielding vehicle or a parkedvehicle screens the view of the pedestrian. The first problem can be fixed by mounting thebeacon on a housing that contains the pedestrian symbol (Van Houten et al., 1999b). Thesecond problem is more difficult to remedy.
Electronic Signs That Indicate the Direction Pedestrians are Crossing. Data also show thatoverhead electronic LED pedestrian signs(Exhibit V-31) that show the driver thedirection the pedestrian is crossing andremind him or her to look for pedestriansis an effective way to increase driveryielding behavior (Nee and Hallenbeck,2003; Van Houten et al., 1999a). Onestudy compared this sign with a yellowflashing beacon at a site where bothdevices were installed (Van Houten et al.,1999a). The findings showed that theproportion of drivers that yielded topedestrians was always higher at timeswhen the electronic sign was activatedthan at times when the flashing beaconwas activated.
There are probably several good reasonswhy the electronic signs, which show the
SECTION V—STRATEGIES FOR ADDRESSING THE PROBLEM
V-42
EXHIBIT V-30 (Continued)Strategy Attributes for Reducing Screening by Physical Objects at Crosswalks
Attribute Description
Training and Other Personnel Needs
Legislative Needs
involved. In addition, there may be a cost associated with mounting an associatedPI&E campaign.
It will be important for agency staff and others who do this work for the agency to betrained in both identifying the conditions in the field under which the problems beingaddressed exist and how to redesign the site to eliminate the problem.
None
EXHIBIT V-31Electronic signs that show the direction that pedestrians are crossing is an effective way to increase driver yieldingbehavior. (Photo by Ron Van Houten)
SECTION V—STRATEGIES FOR ADDRESSING THE PROBLEM
direction the pedestrian is crossing, were more effective than the flashing beacon. First, thistype of sign is associated with pedestrians because it uses the pedestrian symbol to signalwhen a pedestrian is in the crosswalk. Second, it shows the direction the pedestrian iscrossing the street. This information helps the driver to better assess whether there is apedestrian crossing the street or whether the pedestrian has already finished crossing,because it cues the driver what to look for (someone crossing from the right or left). Hence, ifthe signal indicates someone is crossing from the right, and a vehicle is stopped in the laneon the driver’s right, or a delivery truck is parked on the driver’s right, the driver will bebetter warned to proceed cautiously until it is ascertained that the pedestrian is not beingscreened. Third, the device also signals when pedestrians are crossing from both directions.The LED pedestrian sign also has animated eyes to instruct the motorist to look for thepedestrian, or pedestrians, crossing from a particular direction.
In-Pavement Lighted Markers at Uncontrolled Crossings. Both sides of the crosswalk are linedwith encased raised pavement markers. Many treatments include LED strobe lighting in theraised pavement markings (Exhibit V-32). This system involves reinstallation each time the roadis resurfaced or affected by utility repairs. The markers tend to be seen only by the first vehiclein a platoon; and when there is also a high volume of traffic in the other direction, it limits adriver’s view of the entire crossing. Another disadvantage of in-pavement lighted markers isthat they do not show the direction the pedestrian is crossing or whether pedestrians arecrossing from both sides of the roadway. Studies in California and Washington State haveshown these signs to be effective, but similar results have not been obtained in Florida.
Other Measures at Uncontrolled Crossings. In addition to the measures discussed above,there are experimental measures where less is known about their real-world effects. Many ofthese measures are discussed in the 2001 report, Alternative Treatments for At-Grade PedestrianCrossings (Institute of Transportation Engineers, 2001a).
Exhibit V-33 shows acrosswalk on a multilane roadat a T-intersection. Thecrosswalk is installed along thepath between two bus shelterson the side of the intersectionwith the fewest conflicts withturning vehicles. Theinstallation includes electronicsigns indicating whenpedestrians are crossing (alongwith the direction they arecrossing), advance yieldmarkings reminding drivers toyield in advance of thecrosswalk, and a cut throughthe refuge island which forcespedestrians to look in thedirection of approachingvehicles before crossing thesecond half of the roadway.
V-43
EXHIBIT V-32In-pavement markers typically include LED strobe lighting in raisedpavement markings. (Photo by Michael Ronkin)
SECTION V—STRATEGIES FOR ADDRESSING THE PROBLEM
V-44
EXHIBIT V-33Crosswalk on a multilane road at a T-Intersection.
EXHIBIT V-34Strategy Attributes for Signals to Alert Motorists that Pedestrians Are Crossing
Attribute Description
Technical
Target
Expected Effectiveness
Keys to Success
This strategy is directed at drivers who are approaching a crosswalk wherepedestrians are crossing.
Studies have shown that alerting motorists when a pedestrian is crossing the streetcan increase yielding behavior and reduce conflicts between motorists andpedestrians (Nee and Hallenbeck, 2003; Van Houten and Malenfant, 2001; VanHouten et al., 1999b). Compliance with these signals varies from location to location.The electronic sign indicating the direction the pedestrian is crossing showsconsiderable promise.
A basic key to success is having a mechanism for identifying problem locations andprogramming improvements. This can be a combination of active agency field reviewalong with provision for input from law enforcement and the community.
Design guidelines and criteria are needed to help identify inadequate situations, aswell as to arrive at effective applications of the strategy.
SECTION V—STRATEGIES FOR ADDRESSING THE PROBLEM
V-45
EXHIBIT V-34 (Continued)Strategy Attributes for Signals to Alert Motorists That Pedestrians Are Crossing
Attribute Description
Potential Difficulties
Appropriate Measures
Associated Needs
Organizational and Institutional Attributes
Organizational Issues
Cost Involved
Training and Other Personnel Needs
Legislative Needs
Where a new control, such as this, is to be employed, it will be important to educatethe public on its meaning and appropriate behaviors toward it.
Adequate lighting is needed at the crosswalk in addition to these devices. This maynot always be available. However, evaluations are underway of some of these devicesthat can also illuminate the crosswalk from above.
Maintenance of these devices is critical. The more complex the device, the morethings that can go wrong. Maintenance personnel will need to be trained on thespecial repair requirements, and a program of monitoring will need to be established.
Unless a pedestrian symbol appears on the yellow-beacon installation, it may not beclear to the driver that the warning involves a pedestrian in the crosswalk.Furthermore, the beacon does not indicate in which direction the pedestrian iscrossing.
In-pavement lighted markers at uncontrolled crossings may not be effective underconditions having vehicle congestion.
The primary measure of effectiveness would be the change in the number of crashes,by type, including crossing pedestrians and rear-end. Pedestrian-vehicle and vehicle-vehicle conflicts might be used as surrogates for early evaluation of the program.Process measures include the number of improvements made and the number ofpedestrians affected by the improvements made.
Prohibited parking in advance of the crosswalk, advance yield markings, and raisedpedestrian refuge islands may be supplements, particularly at high-volume multilanesites.
New policies and criteria may be needed for selecting, designing, implementing, andmaintaining these devices.
This treatment is somewhat less expensive than a traffic signal and does notsignificantly impact motorist or pedestrian delay. If an overhead sign is selected,installation on a mast arm will reduce maintenance costs. Pedestrians get animmediate response when they are detected by an automatic sensor or press abutton signed “PRESS BUTTON TO ALERT MOTORISTS,” and the motorist needonly slow or stop long enough to let the pedestrian cross their portion of theroadway.
It will be important for agency staff and others who do this work for the agency to betrained in identifying the conditions in the field under which these devices areappropriate, how to design the installation, and how to properly maintain them.
None.
Strategy 9.1 B5: Improve Reflectorization/Conspicuity of PedestriansRetroreflective materials are required for roadwaymarkings such as crosswalks, stop lines, and lanemarkings. These materials reflect light from vehicleheadlights and from roadway illumination usingspecially designed glass beads. Vests and other clothingfor pedestrians have also been made with reflectivematerials (Exhibit V-35). Studies have found thatreflectorization can increase the visibility of apedestrian by a factor of five. However, someretroreflective clothing can lose its reflective propertiesafter repeated washings. Retroreflective material hasbeen used on shoes, backpacks, jackets, and otherclothing. The Standard Specification for NighttimePhotometric Performance of Retroreflective PedestrianMarkings for Visibility Enhancement is set by ASTMInternational (American Society for Testing andMaterials International, 2003). For access to ASTMstandards, visit the ASTM Web site, www.astm.org.
SECTION V—STRATEGIES FOR ADDRESSING THE PROBLEM
V-46
EXHIBIT V-35Reflectorized vests and other clothing forpedestrians can increase the visibility ofa pedestrian at night by a factor of five.
Attribute Description
Technical Attributes
Target This strategy is directed at pedestrians who are walking at night near motor-vehicle traffic.
Expected Effectiveness A study by Blomberg et al. (1984) investigated the effectiveness of countermeasures to improve the conspicuity of pedestrians and bicyclists. Nighttime field tests were conducted on baseline pedestrians (i.e., wearing a white tee shirt and blue jeans), walking on a test track, compared with pedestrians with dangle tags, a flashlight, jogger’s vest, and rings (retroreflective material on headband, wristbands, belt, and ankle bands). The detection and recognition distances are shown in the figure below. In a later 1994 study, Owens et al. (1994) conducted an experiment in which retro- reflective materials were placed on different body locations. Pedestrians wearing reflective materials on knees, waist, elbows, and shoulders were seen more readily. Authors stated that "biological motion" was an important part of detection and recognition by drivers. Seen at night, such motions of the reflectorized materials are more pronounced and are more readily interpreted as human motion.
Keys to Success The keys to success include the following:
Working with manufacturers of clothing or shoes to incorporate reflective materials.
EXHIBIT V-36Strategy Attributes for Improving Reflectorization/Conspicuity of Pedestrians
SECTION V—STRATEGIES FOR ADDRESSING THE PROBLEM
V-47
Retroreflective Materials Used by Pedestrians
224
532
1379
744 760
105144
316 322
436
0
200
400
600
800
1000
1200
1400
1600
Base Ped Dangle Tags Flashlight Jogging Vest Rings
Target
Fee
t
DetectionRecognition
Attribute Description
Pedestrians’ awareness that they are not always visible to motorists at night and that factors such as sun glare can interfere with their being detected during the daytime. An accompanying educational/awareness campaign on high risks for pedestrians at night and the need for providing retroreflective materials for pedestrians.
The availability of clothing with retroreflective material or retroreflective patchesconsidered stylish enough by the user to want to wear it.
Potential Difficulties There are difficulties to overcome, such as convincing people of the need to be more visible at night as pedestrians and that they should wear retroreflective clothing (e.g. jacket) when walking at night.
Appropriate Measures and Data
A reduction in the frequency of nighttime pedestrian crashes is a prime measure of effectiveness. A surrogate measure is the percentage of pedestrians wearing more visible or retroreflective clothing at night.
Associated Needs There is a need for an education/awareness campaign to convey the importance of being visible at night while walking near streets and highways and how to do increase visibility.
Organizational and Institutional Attributes
Organizational, Institutional, and Policy Issues
This strategy should also include programs for employees of construction companies, utility companies, or others that routinely work at night in or near the street system to encourage or mandate the use of reflectorization when in the work environment.
Issues Affecting Implementation Time
None.
Cost Involved Costs for retroreflective materials are minimal for a single person. The implementing agency may experience costs associated with a public-information and education campaign.
EXHIBIT V-36 (Continued)Strategy Attributes for Improving Reflectorization/Conspicuity of Pedestrians
(continued on next page)
Objective 9.1 C—Reduce Vehicle SpeedAs noted in Section III in the general description of the pedestrian crash problem, motor-vehicle speed is an important factor both in the occurrence of pedestrian crashes and theseverity of injury sustained by the pedestrian. A later strategy (Strategy 9.1 D2) addressesthe role of enforcement in reducing vehicle speeds. The strategies below all focus on speedreduction through roadway or engineering measures.
Road narrowing can reduce vehicle speeds along a roadway section and enhance pedestrianmovement and safety. Bicycle travel will also be enhanced, and bicyclist safety mightimprove when bicycle lanes are added.
Roadway narrowing can be achieved in several ways:
• By reducing lane widths (to 3.0 or 3.4 m [10 or 11 ft]) (excess pavement can be striped foruse as a bicycle lane or shoulder)
• Through travel lanes can be removed or converted into medians or bike lanes (seeExhibit V-37)
• The street can be narrowed by extending sidewalks and landscaped areas and/or byadding on-street parking within the former curb lines
If no sidewalks exist along the roadway, they normally should be added. If sidewalks exist,and there is adequate width, a landscaped buffer is desirable to provide a buffer areabetween pedestrians and motor vehicles.
Some roads have more travel lanes or pavement width than necessary and are difficult tocross largely because of their width. Reducing the number of lanes on a multilane roadwaywill reduce crossing distances for pedestrians and may also slow vehicle speeds. A goodexample of this measure is to reduce a four-lane undivided road to three lanes (e.g., one lanein each direction with a center turn lane). Such a road conversion, sometimes called a “roaddiet” can provide positive safety benefits to pedestrians and motorists.
SECTION V—STRATEGIES FOR ADDRESSING THE PROBLEM
V-48
Attribute Description
Training and Other Personnel Needs
None.
Legislative Needs None.
Other Key Attributes
None.
EXHIBIT V-36 (Continued)Strategy Attributes for Improving Reflectorization/Conspicuity of Pedestrians
SECTION V—STRATEGIES FOR ADDRESSING THE PROBLEM
Reducing the number of lanes may result in lower vehicle capacity and increased delay.However, the existence of significant levels of left-turn traffic can prevent a four-lane streetfrom realizing considerably lower delay, than for a three-lane section (two through lanesplus a center turn lane). This is because drivers waiting for an adequate gap to turn left, on afour-lane street, may cause delay to through traffic. Under most ranges of volume that havebeen tested, reducing from four lanes to three lanes results in minimal effects on level ofservice to vehicles. This is because left-turning vehicles use the center lane of a three–lanesection to wait to complete their maneuver.
For Average Daily Traffic (ADT) above approximately 20,000 vehicles per day (vpd) onthree-lane roads, traffic congestion may increase to the point of causing motorists to divert toalternative routes. This can create problems on the alternative routes, especially if they arethrough a residential neighborhood. An analysis should be done of the level of service todetermine whether the number of lanes on a roadway is appropriate.
This strategy is usually applied to a roadway section of significant length. There are alsospot narrowing improvements that may be implemented at intersection or midblocklocations. These include curb extensions and chokers, which are discussed underintersection traffic calming measures (Strategy 9.1 A3).
In deciding whether road narrowing measures are an appropriate strategy for reducingpedestrian crashes, one must always consider potential tradeoffs with respect to vehicularoperations and crashes. For example, lane narrowing can make heavy truck and/oremergency vehicle access difficult, and the addition of on-street parking can increase thenumber of backing-related crashes. Factors such as development type (urban, rural, etc.),vehicle mix (numbers and types of large trucks), vehicle speeds and volumes, pedestrianvolumes, roadway function, and availability of alternate routes should be considered whenevaluating this tradeoff.
Additional information on road narrowing measures can be found at the following Web sites:
V-49
EXHIBIT V-37This roadway section wasconverted from a four-lane undivided road to athree-lane road withsidewalks and bike lanes.(Photo by Dan Burden)
• PBIC, Walking Design and Engineering: Roadway Design—Road/Lane Narrowing,http://www.walkinginfo.org/de/curb1.cfm?codename=9b&CM_maingroup=Roadway%20Design
• Project for Public Spaces (PPS), Traffic Calming 101, http://www.pps.org/buildings/info/how_to/livememtraffic
SECTION V—STRATEGIES FOR ADDRESSING THE PROBLEM
V-50
EXHIBIT V-38Strategy Attributes for Implementing Road Narrowing Measures
Attribute Description
Technical Attributes
Target
Expected Effectiveness
Keys to Success
Potential Difficulties
Appropriate Measures and Data
Associated Needs
Roadway narrowing improvements have the objective of slowing vehicle speeds alongroutes where pedestrians may be crossing the street.
Lower vehicle speeds are associated with shorter stopping distances. Lower-speedvehicles are also more likely and more able to yield to a pedestrian. Narrowingroadways is believed to result in slower vehicle speeds and a corresponding reductionin pedestrian crashes. However, there are no valid evaluations of this presumption.
When narrowing a roadway or lane, one must consider the need to service trucks andschool buses, as well as provide access for emergency-service vehicles. On multilaneroadways, it may be desirable to narrow only the left lanes and leave the right laneswider, for use by larger vehicles and bicycles.
Before reducing the number of lanes, roadway capacity and other aspects of roadsafety need to be considered. Level of service analysis of intersections shouldconsider alternative treatments for the section of roadway. For example, a four-laneundivided road can be converted to one through-lane in each direction, with a centerleft-turn lane, or with a combination of raised median, left-turn lanes, and bicyclelanes. Turning lanes may not be needed at all intersections.
When considering road-narrowing measures, it is highly desirable to include the entireneighborhood in the decision-making process. This will allow input from the entireaffected area and will help prevent the level of road safety in one part of theneighborhood from being sacrificed to benefit another part. It is important to keepresidents and businesses informed of what is being proposed, how it can benefitthem, and what the likely tradeoffs are. A public-information and education program isthus important to the success of such projects. The affected residents and businessesshould be able to provide input so that their concerns can be addressed
Some traffic may divert to other local streets in neighborhoods. Also, narrowing aroadway can have adverse effects on bicyclists if insufficient space is designated fortheir travel.
Reduction in vehicle speed may be used as a surrogate measure of effectivenessalong a route that has undergone roadway narrowing. It may be desirable to use morethan one measure of speed (e.g., mean and 85th percentile, or proportion exceeding agiven speed). Reduction in crashes and/or crash severity involving crossingpedestrians is an ultimate measure of effectiveness. Pedestrian- and vehicle-volumedata are needed for estimating exposure and calculating crash rates.
Public-Information and education activities are needed, as noted above.
SECTION V—STRATEGIES FOR ADDRESSING THE PROBLEM
Strategy 9.1 C2: Install Traffic-Calming—Road SectionsContinued growth and decentralization throughout the United States have increased thevolume of vehicles on streets and highways. Many neighborhood residents and localofficials have expressed interest in undertaking traffic calming to reduce the speed andnumber of cars on their streets.
Traffic-calming encompasses a series of physical treatments that are meant to lower vehiclespeeds and volumes by creating the visual impression that certain streets are not intendedfor high-speed or “cut-through” traffic. Thus, traffic calming may improve conditions forpedestrians. While many of the road narrowing measures discussed under Strategy 9.1 A1can also effectively “calm” traffic along a section of roadway, the measures discussed underthis section have the broader goal of improving the overall safety and attractiveness of theroadway environment for pedestrians and bicyclists, including children and the elderly.
Traffic-calming measures are generally of two types: either they require motorists to changetheir direction of travel (i.e., move to the left or right), or they require motorists to changeelevation (i.e., go up and down). Traffic-calming treatments need to be well designed andbased upon information currently available about their applications and effects. Informationon U.S. experiences with various traffic-calming treatments can be found in ITE/FHWA’s
V-51
EXHIBIT V-38 (Continued)Strategy Attributes for Implementing Road Narrowing Measures
Attribute Description
Organizational and Institutional Attributes
Organizational, Institutional, and Policy Issues
Issues Affecting Implementation Time
Cost Involved
Training and Other Personnel Needs
Legislative Needs
Other Key Attributes
Legislative Needs
Lane widths must conform to national, state, and local guidelines. Narrowing lanesruns counter to many agencies’ design standards. A design exception may beneeded; in any event, there may be institutional reluctance to reduce lane width. Newpolicies may need to be developed.
Narrowing a roadway by reconstruction and addition of channelization may take aminimum of 2 years to achieve, due to the time to receive design and funding approvals.
Re-striping roadways, to have narrower lanes and/or fewer lanes is often done inconjunction with resurfacing and therefore results in little or no additional cost.
Costs will vary depending upon the manner in which the narrowing is achieved.Reconstruction that involves channelization will be much more costly thanreconstruction that only requires a change in pavement markings. The inclusion ofroad narrowing in the context of a broader reconstruction effort will minimize overallcosts. See Appendix 12 for estimates of cost for the use of pavement markings.
No particular training is needed to re-stripe roadways (e.g., after resurfacing projects)to narrow the width or reduce number of lanes.
None.
A typical three-lane configuration (two travel-lanes and a center turn-lane) also hassafety advantages for motorists. Through traffic can maintain a fairly constant speed,while left-turning drivers can enter the center turn lane to wait. (Federal HighwayAdministration, 2002)
Traffic Calming: State of the Practice (1999) (available online at http://www.ite.org/traffic/tcstate.htm#tcsop).
This strategy includes four traffic-calming measures that can be used along mid-blocksegments of local streets and some low-volume collector streets or commercial-area streets.More information can also be found in ITE/FHWA’s Traffic Calming: State of the Practice (1999)and in FHWA’s Pedestrian Facilities Users Guide (Federal Highway Administration, 2002).
When considering measures to reduce vehicle speeds on road sections, one important factorrelates to the placement of trees and other roadside features. The key factor is to balance theneeds of pedestrians, bicyclists, motorists, and transit vehicles with the operationalexpectations for a specific type of street and area. For example, placing trees relatively closeto the street might be acceptable, or even desirable, on low-speed, low-volumeneighborhood streets; high-speed arterial streets should typically have greater setbacks oftrees, utility poles, and other roadside objects to reduce the chance of fixed-object crashes.More discussion on this topic is given in the companion guides on tree crashes, run-off-roadcrashes, and utility pole crashes.
Serpentine Street
A serpentine street uses a winding pattern with built-in visual enhancements (Exhibit V-39).These allow through movement but not fast driving. Landscaping can be used to create a
park-like atmosphere. Serpentine street-design needs to be coordinated with drivewayaccess and parking. Where cost is a concern,lower-cost but equally effective traffic-calming strategies may be preferable.
Additional information on the use ofserpentine streets can be found at thefollowing Web sites:
• PBIC, Walking Design and Engineering:Traffic Calming—Serpentine Design,http://www.walkinginfo.org/de/curb1_print.cfm?codename=31d&CM_main-group=Traffic+Calming&1.x=7&1.y=6
• City of Palo Alto, Neighborhood TrafficCalming Program, http://www.cityofpaloalto.org/transportation/ntcp/
Chicane
A chicane consists of alternately placed curbextensions into the street (Exhibit V-40). Thisdesign creates a horizontal shift in traffic andalso narrows the traveled way down to onelane (or two narrow lanes). As a result,motorists are forced to slow down as theymaneuver through the chicane. Good
SECTION V—STRATEGIES FOR ADDRESSING THE PROBLEM
V-52
EXHIBIT V-39A serpentine street uses a winding pattern to slowdown vehicle speeds. (Photo by Cara Seiderman)
SECTION V—STRATEGIES FOR ADDRESSING THE PROBLEM
visibility can be maintained by planting onlylow shrubs or trees with high canopies. Thedesign of a chicane needs to ensure thatbicyclist safety and mobility are notdiminished. Also, like the serpentine streetabove, a chicane needs to be coordinated withdriveway access and parking.
Additional information on the use of chicanescan be found at the following Web sites:
• Project for Public Spaces (PPS), TrafficCalming 101, http://www.pps.org/buildings/info/how_to/livememtraffic
• PBIC, Walking Design and Engineering:Traffic Calming – Chicanes, http://www.walkinginfo.org/de/curb1_print.cfm?codename=22d&CM_maingroup=Traffic+Calming&1.x=5&1.y=5
• Quality of Life Collegeville, Traffic Calming, http://www.cwdnet.com/qlc/tc_narrowing.htm
• Fehr and Peers Transportation Consultants, Traffic Calming.Org, http://www.trafficcalming.org/toolbox/chicanes.html
• City of Los Altos, CA, Traffic Plan, http://www.ci.los-altos.ca.us/publicworks/trafficplan/41-44.pdf
Choker
Chokers are curb extensions thatnarrow a street by widening thesidewalks or planting strips(Exhibit V-41). The street isnarrowed from two lanes to onelane (or two narrow lanes).Motorists are forced to slow and,in some cases, allow anoncoming vehicle to pass. Theminimum width should be wideenough to accommodate fire andsanitation trucks.
Additional information on theuse of chokers can be found atthe following Web sites:
V-53
EXHIBIT V-40A chicane consists of alternatively placed curbextensions into the street which creates a horizontalshift in traffic and reduced vehicle speeds. (Photo byDan Burden)
EXHIBIT V-41Chokers narrow a street and force motorists to slow down. (Photo byDan Burden)
• Project for Public Spaces (PPS), Traffic Calming 101, http://www.pps.org/buildings/info/how_to/livememtraffic
• PBIC, Walking Design and Engineering: Traffic Calming—Choker, http://www.walkinginfo.org/de/curb1_print.cfm?codename=20d&CM_maingroup=Traffic+Calming&1.x=14&1.y=5
• Fehr and Peers Transportation Consultants, Traffic Calming.Org, http://www.trafficcalming.org/toolbox/chokers.html
Speed Humps and Speed Tables
The purpose of speed humpsis to reduce vehicle speeds.Speed humps should not beconfused with speed bumps,which are sometimes used inparking lots. A speed humpis an elongated hump with acircular-arc cross-section(round-top) or flat-top. Speedhumps generally do not havea negative effect on bikes andshould be built through anybike lanes present on theroadway so that motorists donot swerve into the bike laneto avoid the hump. Flat-topspeed humps are alsoreferred to as speed tables(Exhibit V-42).
Additional information on speed humps and speed tables can be found at the following Web sites:
• Project for Public Spaces (PPS), Traffic Calming 101, http://www.pps.org/buildings/info/how_to/livememtraffic
• PBIC, Walking Design and Engineering: Traffic Calming—Speed Hump, http://www.walkinginfo.org/de/curb1_print.cfm?codename=24d&CM_maingroup=Traffic+Calming&1.x=6&1.y=10
Woonerf is a Dutch word that translates as “living street.” It is typically used only onresidential streets. A woonerf is a space shared by pedestrians, bicyclists, and low-speedmotor vehicles. It is typically a narrow street without curbs or sidewalks. Vehicles areslowed by placing trees, planters, parking areas, and other obstacles in the street. Motoristsmust travel at very low speeds, below 10 mi/h. Thus, a woonerf creates a public space for
SECTION V—STRATEGIES FOR ADDRESSING THE PROBLEM
V-54
EXHIBIT V-42Flat-top speed humps are referred to as speed tables. (Photo by Dan Burden)
SECTION V—STRATEGIES FOR ADDRESSING THE PROBLEM
social and possibly commercialactivities, as well as a play areafor children (Exhibit V-43). Awoonerf identification sign isplaced at each street entrance. Itis important to allow access byfire trucks, school buses, andother service vehicles, if needed.
Additional information on theuse of woonerfs can be found atthe following Web sites:
• SWOV—Institute for Road Safety Research (Netherlands), http://www.swov.nl/. Clickon English. Search for SWOV publications. Search for traffic+calming Schagen. Followlinks to the report, Traffic Calming Schemes (van Schagen, 2003).
Other traffic calming countermeasures can be used at intersections. These are discussedunder Strategy 9.1 A3.
V-55
EXHIBIT V-43A woonerf is a “living street” that is shared by pedestrians, bicyclists,and low-speed motor vehicles. (Photo by Michael Ronkin)
EXHIBIT V-44Strategy Attributes for Installing Traffic Calming—Road Sections
Attribute Description
Technical Attributes
Target(s)
Expected Effectiveness
Motorists: These countermeasures seek to reduce the speed of motor-vehicle traffic,make the driver aware of the presence and priority of pedestrian traffic, and may helpreduce cut-through traffic.
Curb Extension or Bulbout
Anne Arundel County, Maryland, has used a combination of medians and bulboutsnear intersections. The medians narrow the traveled way and provide a shelteredstorage area, while the bulbouts force drivers to make a lateral deflection as theyenter the narrowed area. Medians with lateral deflection reduced the 85th-percentilespeeds by 2 to 5 mi/h (Walter, 1995).
In Ontario, Canada, Macbeth (1995) reported speed reductions on five raised andnarrowed intersections and seven midblock bulbouts, in conjunction with lowering thespeed limit to 30 km/h. The proportion of motorists who exceeded 30 km/h was 86percent before the devices were built, but only 20 percent afterwards.
(continued on next page)
SECTION V—STRATEGIES FOR ADDRESSING THE PROBLEM
V-56
EXHIBIT V-44 (Continued)Strategy Attributes for Installing Traffic Calming—Road Sections
Attribute Description
Keys to Success
In De Meern, Netherlands, two bulbouts were placed opposite one another to narrowthe width of the traveled way. A significant reduction in the 85th-percentile vehiclespeed was observed (Replogle, 1992).
Bulbouts had little effect on reducing vehicle speeds in two Australian cities, Keilor(Queensland) and Eltham (Victoria). However, in Concord, New South Wales, acomparison of a street with both bulbouts and marked parking lanes versus anuntreated street showed that the crash rate on the treated street was only one-third ofthat of the untreated street. It was not stated how many of these crashes involvedpedestrians, nor how the streets compared prior to treatment (Hawley et al., 1992).
Speed Humps and Speed Tables
Speed humps have been evaluated and found effective in many cities in terms ofreducing vehicle speeds. Eight studies were reviewed for this Guide and are listed inthe References section. These studies found that 85th-percentile speeds decreasedby 4 to 23 mi/h after the speed humps were installed. Fewer crashes occurred inOmaha, Nebraska, and Montgomery County, Maryland, as a result of adding speedhumps. Other studies did not address the effects of speed humps on crashes. Trafficvolumes fell by up to one half in three Australian cities and also fell in Bellevue,Washington. Traffic volumes remained constant in Agoura Hills, California, though.The other studies did not address traffic volumes. A more detailed review of thesestudies can be found in the Pedestrian Synthesis by Campbell et al. (2002). See alsoAppendix 13.
Very limited evaluations of crash impacts have been made of the other types ofmeasures being considered here. However, they are being implemented on theassumption that pedestrians benefit because motorists are traveling more slowly andtherefore have more time to react to the presence of pedestrians. This means less riskof a crash, fewer and less-severe conflicts, and perceptions of greater safety bypedestrians. These countermeasures are static, so they must be appropriate at allhours of the day and night.
It is important to apply these strategies along the types of streets for which they areintended, primarily low-volume residential and, occasionally, collector streets. Ideally,they should be applied area-wide rather than in one or two isolated spots. Residentinput and consensus is also a key to their success. In addition, adequate streetlighting is important.
Choker
In order to function effectively, the street must be narrowed enough so that two carsthat are approaching from opposite directions do not have enough room to pass.Emergency vehicles must be accommodated.
Woonerf
The design is intended to keep vehicle speeds below 10 mi/h, so that the street is safefor children. Woonerfs are typically low-volume, narrow neighborhood streets orspecially designated streets in downtown areas. They frequently have specialpavement texturing and are signed as special streets for pedestrians, as well as formotor vehicles. Speed humps may or may not be used on such streets. A woonerfmay be an exception to “normal accepted practice,” so revisions may need to bemade in local or state design policies.
These countermeasures should be used as part of an overall neighborhood strategy.It is highly desirable to include the entire neighborhood in the decision-makingprocess. It will help prevent the level of road safety in one part of the neighborhoodfrom being sacrificed to benefit another part. It is important to keep residents and
SECTION V—STRATEGIES FOR ADDRESSING THE PROBLEM
V-57
EXHIBIT V-44 (Continued)Strategy Attributes for Installing Traffic Calming—Road Sections
Attribute Description
Potential Difficulties
Appropriate Measures and Data
Associated Needs
Organizational and Institutional Attributes
Organizational, Institutional, and PolicyIssues
businesses informed of what is being proposed, how it can benefit them, and what thelikely tradeoffs are. A public-information and education program is thus important tothe success of such projects. The affected residents and businesses should have theopportunity to provide input into the change or reduction in access to ensure that thetradeoffs will be acceptable to them.
Traffic-calming devices are not a panacea, guaranteed to improve conditions forpedestrians. These devices, by themselves, cannot ensure that motorists will slow downand yield to pedestrians, nor that pedestrians will cross safely. Enforcement campaignscan be undertaken in conjunction with traffic calming (see Strategy 9.1 D2).
Moreover, traffic-calming devices have their disadvantages. For example, thesetreatments, if not designed properly, can hinder activities such as street cleaning andsnowplowing, may impede emergency vehicle access, and may affect drainage. A testperiod can be used to identify potential problems for residents, as well as emergencyand school access. Adjustments can then be made to take care of any unanticipatedproblems. Care should be taken that traffic is not diverted onto a parallel local street.The ITE/FHWA Traffic Calming (1999) and FHWA Pedestrian Facilities User Guide(2002) provide further information on such issues.
Chicane
Chicanes may reduce the ability to allow on-street parking.
Speed Humps and Speed Tables
Noise may increase, as vehicles slow down and go over the humps and tables.
Speed humps and speed tables may create drainage problems on some streets.
Speed humps can increase the cost and complexity of resurfacing streets, since theyeither need to be removed and replaced after resurfacing, or the old surface on eitherside of the hump must be ground out to maintain the same “hump effect.” Simplyresurfacing over the hump can create long-term street-drainage problems. Also,restriping of the humps must be closely coordinated with resurfacing, so that thehumps are not left unmarked for any period of time.
Speed humps can also be problematic for bicyclists if they are not well lit and shouldnever be used on an unlit down grade, where bicyclists are approaching the hump at ahigh rate of speed.
Motor-vehicle speed is a useful surrogate safety measure. Conflicts between motorvehicles and pedestrians may also be used as a surrogate measure of safety. Theprimary measure of effectiveness is crashes. The impact on motorist delay is anoperational measure of interest.
A public-information and education program may need to be conducted.
In addition to neighborhoods, other parties that may be affected include businesses,schools, the local fire and police departments, and others. These parties should alsobe included in the decision-making process.
Some agencies may have design policies or standards that do not include traffic-calming techniques or that would inhibit their use. New policies may be needed.
(continued on next page)
Strategy 9.1 C3: Install Traffic-Calming—IntersectionsContinued growth throughout the United States has increased the number of cars on streetsand highways. Many neighborhood residents and local officials have expressed interest intraffic-calming projects to reduce the number and speed of cars on their streets.
Traffic-calming encompasses a series of physical treatments that are meant to lower vehiclespeeds and volumes by creating the visual impression that certain streets are not intendedfor high-speed or “cut-through” traffic. Thus, traffic calming may improve conditions forpedestrians.
Traffic-calming treatments should be well designed and applied under appropriate conditions,to maximize their effectiveness. Local officials and engineers will benefit by maintaininginformation on the applications and their effects. Information on U.S. experiences with varioustraffic-calming treatments can be found in ITE’s Traffic Calming: State of the Practice (1999).
This strategy includes five traffic-calming measures that can be used at intersections:
SECTION V—STRATEGIES FOR ADDRESSING THE PROBLEM
V-58
EXHIBIT V-44 (Continued)Strategy Attributes for Installing Traffic Calming—Road Sections
Attribute Description
Issues Affecting Implementation time
Costs Involved
Training and Other Personnel Needs
Legislative Needs
Other Key Attributes
It may take 1 or more years to implement some of these countermeasures. This timereflects that required for conducting the necessary engineering studies, as well as fordeliberations and discussions with all stakeholders. Design and construction of suchmeasures can take place within a short timeframe as long as no additional right-of-way is needed. Speed humps or speed tables may be installed rather quickly, ifconsensus amongst residents exists.
Traffic engineers often conduct engineering studies to determine whether one or moreof these countermeasures are warranted at a specific location. The process includesworking with affected residents, businesses, schools, the local police and firedepartments, and others to address their concerns. This public involvement processmay take a while, especially if the proposed countermeasures prove to becontroversial. The types of traffic calming, and the locations within a neighborhood,may need to be modified. The availability of funds to cover the costs of installationdepends upon local and state funding cycles. Depending upon local climaticconditions, installation may be feasible year-round, or only during the warmer months.
Once the appropriate groundwork has been laid, speed humps can actually beinstalled fairly quickly. For example, in Glendale, Arizona, speed humps are typicallyplaced within 30 days, following receipt of a signed petition showing consensus. Thespeed of installation, coupled with their relatively low cost (see below), has made themthe most popular type of traffic-calming treatment requested.
Costs will vary depending upon the degree of new construction required and thespecific type of treatment being applied. For further details, see Appendix 14.
The cost to implement a woonerf design in retrofit may be quite high, but the marginalcost would be nominal if, instead, it was implemented as part of a new construction.
Agency personnel should understand traffic-calming measures so they can beappropriately selected and installed.
As with any traffic control measure, there has been litigation related to various traffic-calming devices. Having clear policies, guidelines, and practices for selection and useof various traffic-calming devices can help reduce litigation problems.
None.
SECTION V—STRATEGIES FOR ADDRESSING THE PROBLEM
Curb Radius Reduction
One of the common pedestrian crashtypes involves a pedestrian who isstruck by a right-turning vehicle at anintersection. Large curb radiiencourage motorists to make rightturns at higher speeds. Reducing thecurb radius creates a tighter turn andresults in motorists making right turnsat lower speeds (Exhibit V-45). Otherimportant benefits are shorter crossingdistances for pedestrians andimproved sight distances betweenpedestrians and motorists. However,large curb radii have been determinedto be helpful for older drivers (see theguide on crashes involving olderdrivers). Therefore, care should betaken when applying this strategy.Larger vehicles, such as fire trucks,school buses, moving vans, anddelivery trucks also need to beaccommodated.
There are sources providing information on appropriate design standards for curb radius:
• Salt Lake City Public Works Department, Division of Transportation, http://www.ci.slc.ut.us/transportation/Design/pdf/E1.g1.pdf
• Portland Department of Transportation, Pedestrian Design Guidelines, http://www.trans.ci.portland.or.us/DesignReferences/Pedestrian/SECTIONB.PDF
Additional information on the use of curb radius reduction can be found at the followingWeb sites:
• PBIC, Walking Design and Engineering: Roadway Design—Curb Radius Reduction,http://www.walkinginfo.org/de/curb1.cfm?codename=14b&CM_maingroup=RoadwayDesign
• City of Alameda, Calif., Traffic Calming Toolbox, http://www.ci.alameda.ca.us/publicworks/pdf/toolbox.pdf (last accessed April 22, 2004)
Mini-Circle
Mini-circles are raised circular islands constructed in the center of residential streetintersections. They are intended to reduce vehicle speeds by forcing motorists to maneuveraround them (Exhibit V-46). Mini-circles may be appropriate at intersections where trafficvolumes do not warrant a signal or STOP sign. A series of intersections along a local streetshould be treated as part of a neighborhood traffic improvement program. Tight curb radii
V-59
EXHIBIT V-45Reducing the curb radius creates a tighter turn and results inmotorists making right turns at lower speeds. (Photo by PeterLagerwey)
should accompany mini-circles, to discourage motorists from making high-speed right turns.Mini-circles with cuts in splitter islands make crossing easier for pedestrians, especiallythose in wheelchairs. Larger vehicles, such as fire trucks and school buses, can beaccommodated by creating a mountable curb on the outer portion of the circle. Mini-circlelandscaping should not block sight distance. Yield controls should be used.
Additional information on the use of mini-circles can be found at the following Web sites:
• PBIC, Walking Design and Engineering: Traffic Calming—Mini Circle, http://www.walkinginfo.org/de/curb1_print.cfm?codename=23d&CM_maingroup=Traffic+Calming&1.x=10&1.y=4
Curb extensions, also known as bulbouts or neckdowns, extend the sidewalk or curb line outinto the parking lane, thereby reducing the effective street width. These serve to shorten thepedestrian crossing distance, narrow the roadway, and improve the ability of pedestriansand motorists to see each other (Exhibit V-47). Curb extensions also prevent motorists fromparking in, or too close to, a crosswalk, or from blocking a curb ramp. Curb extensionsshould only be used where there is a parking lane. Larger vehicles, such as fire trucks andschool buses, need to be able to make right turns. On the other hand, it is not necessary thata vehicle be able to turn from a curb lane to another curb lane. Instead, vehicles can oftenencroach into adjacent lanes safely when traffic volumes and/or speeds are low. Streetfurniture and landscaping should not block sight distance. Curb extensions should bedesigned to facilitate adequate drainage.
Additional information on the use of curb extensions can be found at the following Web sites:
• PBIC, Walking Design and Engineering: Traffic Calming—Curb Extensions, http://www.walkinginfo.org/de/curb1_print.cfm?codename=19d&CM_maingroup=Traffic+Calming&1.x=6&1.y=9
SECTION V—STRATEGIES FOR ADDRESSING THE PROBLEM
V-60
EXHIBIT V-46Mini-Circles are raised circular islandsconstructed in the center of residentialintersections. (Photo by Dan Burden)
SECTION V—STRATEGIES FOR ADDRESSING THE PROBLEM
• Portland Department of Transportation, Traffic Calming, http://www.trans.ci.portland.or.us/trafficcalming/devices/Peds/CURBEXT.HTM
• City of Austin, Texas, http://www.ci.austin.tx.us/roadworks/curb.htm
Raised Intersection
Raised intersections are intended to slow all vehicular movements through the intersection.It is built by raising the entire intersection to the level of the sidewalk (Exhibit V-48). Thecrosswalks on each approach may also be elevated, so that pedestrians cross at the samelevel as the sidewalk, without the need for curb ramps. Raised crosswalks can be an urbandesign element through the use of special paving materials. Detectable warning strips markthe boundary between the sidewalk and the street for pedestrians with vision impairments.
V-61
EXHIBIT V-47Curb extensions extend the sidewalkor curb line out into the parking lane,thereby reducing the effective streetwidth. (Photo by Dan Burden)
EXHIBIT V-48Raised intersections are intended toslow all vehicle movements throughthe intersection. (Photo by DanBurden)
Additional information on the use of raised intersections can be found at the following Web sites:
• PBIC, Walking Design and Engineering: Traffic Calming—Raised Intersection, http://www.walkinginfo.org/de/curb1_print.cfm?codename=26d&CM_maingroup=Traffic+Calming&1.x=7&1.y=13
• Fehr and Peers Transportation Consultants, Traffic Calming.Org, http://www.trafficcalming.org/toolbox/raisedint.html
• City of Edgewood, Wash., http://www.ci.edgewood.wa.us/Cops/Safe%20Journey/Library/countermeasures/29-30.htm
Modern Roundabout
A modern roundabout is built with a large, often circular, raised island located in the centerof the intersection of a street with one or more crossing roadways (Exhibit V-49). Motoristsenter the circle, travel around in a counterclockwise direction, and then turn right onto thedesired street. All entering traffic yields (Yield signs placed on each approach) to vehiclesapproaching from within the roundabout. A roundabout is intended to be applied wherevehicular delay can be maintained at or below levels experienced under stop- and signal-control. Because of this, they can sometimes be installed on two-lane roadways in lieu of aroad widening to four lanes. More details on roundabouts may be found under Strategy 17.1F3 in the unsignalized intersections guide. In addition, the following Web sites providenumerous resources on the topic:
EXHIBIT V-49A modern roundabout isbuilt with a large, oftencircular, raised islandlocated in the center of theintersection of an arterialstreet with one or morecrossing roadways. (Photoby Dan Burden)
SECTION V—STRATEGIES FOR ADDRESSING THE PROBLEM
Design guidelines for pedestrian crossings at roundabouts are provided at the followingWeb site:
• FHWA, Office of Safety, http://safety.fhwa.dot.gov/roundaboutsummit/rndabtatt7.ppt
Modern roundabouts can be relatively friendly to pedestrians if they have “splitter” islandson each approach to the roundabout and are designed to slow traffic prior to entering theroundabout. The splitter islands can serve as a refuge for pedestrians and make crossingsafer. There is still, however, concern about safety for visually impaired pedestrians atroundabouts.
Accessible pedestrian signals and truncated domes placed at splitter islands can assistvisually impaired pedestrians with gap selection and “wayfinding.” In larger roundabouts,an off-road bicycle path may be necessary to allow bicyclists to use the pedestrian route.
Other traffic countermeasures can be used on midblock roadway sections. These arediscussed under Strategy 9.1 A4.
V-63
EXHIBIT V-50Strategy Attributes for Installing Traffic Calming—Intersections
Attribute Description
Technical Attributes
Target(s)
Expected Effectiveness
Motorists: These countermeasures are intended to reduce the speed of motor-vehicletraffic and make the driver aware of the presence and priority of pedestrian traffic.
General
Pedestrians are believed to benefit because motorists are traveling more slowly andwith a greater expectancy of the presence of pedestrians and therefore have moretime to react to their presence. This means potentially less risk of a crash, fewer andless-severe conflicts, and greater perceived safety for the pedestrian. Raisedintersections and curb extensions also improve sight distances between pedestriansand motorists and can help prevent vehicles from blocking the crosswalk.
Raised Intersection
The Australian “wombat” crossing usually consists of a raised crosswalk and bulbouts.It is designed to slow motorists, shorten pedestrian exposure to motor vehicles, andincrease pedestrian visibility to motorists. Wombat crossings have generally reduced85th-percentile vehicle speeds by about 40 percent (Hawley et al., 1992).
At one intersection in Cambridge, Massachusetts, about 10 percent of motoristsyielded to pedestrians crossing before a raised intersection was installed. The yieldrate increased to 55 percent after the raised intersection was installed (City ofCambridge, 2000).
Mini-Circle
Mini-circles have been found to reduce motor-vehicle crashes by an average of 90 percent in Seattle, Washington (Institute of Transportation Engineers, FederalHighway Administration, 1999).
Modern Roundabout
A before-and-after study of 8 roundabouts in the United States found that roundaboutsreduced the total number of crashes by 51 percent, and the number of injury crashes
(continued on next page)
SECTION V—STRATEGIES FOR ADDRESSING THE PROBLEM
V-64
EXHIBIT V-50 (Continued)Strategy Attributes for Installing Traffic Calming—Intersections
Attribute Description
Keys to Success
Potential Difficulties
by 73 percent (Jacquemart, 1998). These roundabouts had diameters of 121 ft or less.The sample of pedestrian crashes was not adequate for determining those effects.
Before-and-after studies in other countries have also found crash reductions. Forexample, a study of 73 roundabouts in Victoria, Australia, found that the rate of injurycrashes fell by 74 percent (Troutbeck, 1993). The number of injury crashes per yearfell by 78 percent at 83 roundabouts in France (Centre D’Etudes Techniques deL’Equipment de l’Ouest, 1986). In the Netherlands, a study of 181 roundabouts foundthat the total number of crashes fell by 51 percent, and the number of injury crashes,by 72 percent (Schoon and van Minnen, 1994). However, the specific impact onpedestrian safety was not determined.
As with the midblock traffic-calming treatments, adequate lighting is important forreducing nighttime collisions, including drivers running into the various treatments(mini-circles and curb extensions especially).
Curb Radius Reduction
Nearby land uses and types of road users should be considered when designingintersections so that curb radii are sized appropriately.
Mini-Circle
Signs should be installed to direct motorists to proceed around the right side of thecircle before passing through or making a left turn.
Mini-circles must be properly designed to slow vehicles and benefit pedestrians andbicyclists, without creating an obstacle for fire trucks, school buses, and other largevehicles.
Modern Roundabout
Street widths and available right-of-way need to be sufficient to accommodate aproperly designed roundabout.
On two-lane roadways, splitter islands at the approaches slow entering vehicles andallow pedestrians to cross one lane of traffic at a time.
The design speed of the vehicle entry, vehicle deflection around the roundabout, andthe vehicle exit must be approximately equal to be effective.
The reader is cautioned that traffic-calming devices are not a panacea that isguaranteed to improve conditions for pedestrians. These devices by themselves cannot ensure that motorists will slow down and yield to pedestrians, nor that pedestrianswill cross in the crosswalk. Enforcement and education campaigns can be undertakenin conjunction with traffic calming (See also Strategy 9.1.D2). Moreover, traffic-calming devices have their disadvantages. For example, these treatments can hinderactivities such as street cleaning and snowplowing, may impede emergency vehicleaccess, and may affect drainage.
Curb Radius Reduction
If a curb radius is made too small, large trucks or buses may ride over the curb,placing pedestrians at risk.
Mini-Circle
When traffic does not stop, it is harder for pedestrians with vision impairments to findan adequate gap to cross.
SECTION V—STRATEGIES FOR ADDRESSING THE PROBLEM
V-65
EXHIBIT V-50 (Continued)Strategy Attributes for Installing Traffic Calming—Intersections
Attribute Description
Appropriate Measures and Data
Associated Needs
Organizational and Institutional Attributes
Organizational, Institutional, and Policy Issues
Issues Affecting Implementation Time
Larger vehicles, such as fire trucks and school buses, may need to make left turns infront of the circle.
Modern Roundabout
To ensure adequate sight distances, and to allow room for cars exiting the roundaboutto yield/stop for pedestrians without blocking traffic flow on the roundabout,crosswalks may need to be placed some distance from the roundabout entry/exitpoints. Thus, pedestrians may need to travel out of their way to cross the intersectionsafely. However, proper design of roundabouts provides for pedestrians to cross atthe splitter islands, which can reduce crossing problems for most pedestrians. Careshould also be taken that landscaping is maintained (trimmed) to ensure adequatevisibility between motorists and pedestrians.
Roundabouts may be difficult for some pedestrians to cross, including persons withvisual impairments, young children, and the elderly
Bicyclists may not be able to share the road comfortably with motorists, unless thereis only one approach lane, speeds are slow, and traffic volumes are light tomoderate.
Roundabouts typically involve landscaping, with continued water and maintenanceneeds. Grass, decomposed granite, or brick pavers are generally unacceptable, sincethey do not incorporate a vertical element in the traffic-calming device. Trees, bushes,and other vertical elements make the roundabout visible to approaching drivers andless likely to be hit.
The primary measure of effectiveness is crashes and the severity of these crashes.Motor-vehicle speeds may be used as a surrogate measure of effectiveness. Othersurrogate measures include the number of motorists who yield to pedestrians,conflicts between motor vehicles and pedestrians, and motorist delay.
When considering traffic-calming measures, the entire neighborhood must be includedin the decision-making process. This may require a program of public information andeducation about the various devices, as well as their importance to neighborhoodsafety and livability. The affected residents should be able to provide input into thechange, or reduction in access, to ensure that the tradeoffs will be acceptable to them.
In addition to neighborhood residents, other parties that may be affected includebusinesses, schools, the local fire and police departments, and others. All theseparties should be included in the decision-making process.
New policies may be required for guiding the design and implementation of some ofthese strategies.
It may take 1 or more years to implement these countermeasures. Traffic engineersoften conduct engineering studies to determine whether one or more of thesecountermeasures should be used at a specific location. The process includes workingwith affected residents, businesses, schools, the local police and fire departments,and others, to address their concerns. This public-involvement process may take awhile, especially if the proposed countermeasures prove to be controversial. The
(continued on next page)
Strategy 9.1 C4: Provide School Route Improvements
A variety of roadway improvements are available to increase the safe travel of children inschool zones. Sidewalks or separated walkways are essential for a safe trip from home toschool on foot or by bike. Ideally, schools should be sited in locations where it is easy andsafe for students to walk or bike. If an elementary school is in an unsafe location (such asfronting a high-volume arterial street), it is virtually impossible to make the schoolpedestrian-trip safe and walkable. Conversely, a well-sited school will encourage higherlevels of walking and bicycling and contribute to reduced traffic congestion near theschool.
A new EPA study details the relationship between school location and travel choices. Formore information, see the publication titled Travel and Environmental Implications of SchoolSiting at http://www.epa.gov/smartgrowth/pdf/school_travel.pdf.
Other beneficial measures include well-trained adult crossing guards (Exhibit V-51), parkingprohibitions on approaches to intersections, increased child supervision, and the use of signsand markings (e.g., school advance warning sign and school speed limit sign). Schoolsshould develop “safe routes to school” plans (including creating school walking-route mapsthat can be sent home to parents) and work with local agencies to identify and correctproblem areas and locations. School administrators and parent-teacher organizations shouldeducate students and parents about school safety and access to and from school. Acombination of education, enforcement, and a well-designed street system are needed toencourage motorists to drive appropriately.
SECTION V—STRATEGIES FOR ADDRESSING THE PROBLEM
V-66
EXHIBIT V-50 (Continued)Strategy Attributes for Installing Traffic Calming—Intersections
Attribute Description
Costs Involved
Training and Other Personnel Needs
Legislative Needs
Other Key Attributes
types of traffic calming, and the locations within a neighborhood, may need to bemodified. The availability of funds to cover the costs of installation depends upon localand state funding cycles. Depending upon local climatic conditions, installation may befeasible year-round, or only during the warmer months.
Costs will vary, depending upon the type of improvement and the local conditions,especially if additional right-of-way is required. See Appendix 15 for further details.
Adequate training in the proper selection, design, and implementation of such devicesis needed. Training in consensus building and working with the public in groupmeetings is also helpful
None identified.
None identified.
SECTION V—STRATEGIES FOR ADDRESSING THE PROBLEM
One of the most frequently experienced operational problems in the vicinity of schoolsinvolves parents dropping off and picking up their children. There are two immediatesolutions to this problem: (1) there needs to be a clearly marked area, with adequate capacity,where parents are permitted to drop off and pick up their children, and (2) drop-off/pick-upregulations must be provided to parents on the first day of school. Drop-off areas must belocated away from where children on foot must cross streets or access points. Parent drop-offzones must also be adequate in length and separated from bus drop-off zones. If parents canbe trained properly at the start of the school year, they are likely to continue appropriatebehavior throughout the year.
This strategy could also include safer school-bus routing. Selection of safer school-bus stoplocations are important, since this can affect the number and types of streets children mustcross to get to the bus stop.
NHTSA has sponsored the development of a guide: Safe Routes to School; see http://www.nhtsa.dot.gov/people/injury/pedbimot/ped/saferouteshtml/overview.html.
This guide contains a comprehensive set of information, including guidelines, materials,curriculum ideas, and an assessment of the impact of traffic-calming measures.
These and other resources are cited and discussed further under Strategy 9.1 D1, “ProvideEducation, Outreach, and Training.”
In addition, several strategies in this guide address engineering approaches for providingsafe street crossings for pedestrians of all ages. In particular, the user is referred to Strategy9.1 B1, “Provide Crosswalk Enhancements,” Strategy 9.1 A2, “Install or Upgrade Traffic andPedestrian Signals,” and Strategy 9.1 B4 “Signals to Alert Motorists That Pedestrians AreCrossing.”
V-67
EXHIBIT V-51Well-trained adult crossing guards canbe an effective traffic control measure inschool zones. (Photo by Dan Burden)
SECTION V—STRATEGIES FOR ADDRESSING THE PROBLEM
V-68
EXHIBIT V-52Strategy Attributes for Providing School Route Improvements
Attribute Description
Technical Attributes
Target(s)
Expected Effectiveness
Keys to Success
Potential Difficulties
Appropriate Measures and Data
Associated Needs
This strategy is targeted toward motorists who drive through school zones (includingparents who drop their children off at school), children who walk or ride a bike toschool, and parents of school-age children.
There has been almost no evaluation of the overall effectiveness of these programswith regard to primary crash measures. However, the methods and procedures for thisstrategy are widely used and considered beneficial to safety.
Regulatory school flashers (SPEED LIMIT 25 MPH WHEN FLASHING) were found toreduce vehicle speeds by an average of about 4 mph (Zegeer et al., 1978), based on48 school-zone locations in Kentucky. Vehicle speeds were predominantly 35 to 45 miles per hour without the flasher. Only two of the 48 locations experienced speedreductions of 10 mph or more. At rural locations, speed variance (and thus, thepotential for rear-end crashes) increased during the flashing periods. Overall, only 18 percent of all motorists complied with the 25-mph speed limit. The presence ofcrossing guards was found to be the most effective measure in terms of motoristscomplying with the regulatory flashing speed limit sign. Police enforcement alsocontributed to improved motorist speed compliance.
For a longer-term solution, it is preferable to create a network where children can walkor bicycle safely to school. Safety must be a combined effort between local trafficofficials, school officials, police, parents, and students to be successful.
Barriers to be overcome include getting the cooperation of school officials toimplement an effective child-pedestrian safety-education program, coordination andfunding of a sufficient number of well-trained adult crossing guards, and obtainingselective-enforcement efforts near schools.
Child-pedestrian crash reduction in a neighborhood, or area of town or city, is theprimary measure of effectiveness. Surrogate measures include vehicle speeds inschool zones (particularly during morning or afternoon crossing time) and the numberof children walking or bicycling to school.
Proper training and monitoring of adult crossing guards is essential. Guards shouldalso be equipped with a bright and reflective safety vest and a STOP paddle.
Increased police enforcement in school zones may be needed, particularly insituations where drivers are speeding and/or not yielding to children in crosswalks.
Public-information and education campaigns and methods are needed to ensure thatparents know safe routes to school and how to properly drop off and pick up theirchildren at the school. Education is also needed to teach children how to cross safely.
A community in western Canada provides Internet-based information on trips toschool, see http://www.mapleridge.org/community/school_district/safe_route_school.html.
Clark County, Nevada, provides GIS based maps which can be used to plan saferoutes to school (see http://www.accessclarkcounty.com/Pubworks/Neighborhood/School_Safe_Route.htm).
The Los Altos School District uses a walkability checklist to improve school safety; see http://www.nhtsa.dot.gov/people/injury/buses/GTSS/case5.html.
SECTION V—STRATEGIES FOR ADDRESSING THE PROBLEM
Objective 9.1 D—Improve Pedestrian and Motorist SafetyAwareness and Behavior
Strategy 9.1 D1: Provide Education, Outreach, and TrainingAn educational strategy should do much more than provide information—the goal is tomotivate a change in specific behaviors to reduce the risk of pedestrian injuries. The mostsuccessful educational messages encourage people to think about their own travel attitudesand behaviors and help them to make informed (i.e., better) choices (Exhibit V-53). The ways
V-69
EXHIBIT V-52 (Continued)Strategy Attributes for Providing School Route Improvements
Attribute Description
Organizational and Institutional Attributes
Organizational, Institutional, and Policy Issues
Issues Affecting Implementation Time
Costs Involved
Training and Other Personnel Needs
Legislative Needs
Other Key Attributes
See also Strategy 9.1 D1, Provide Education, Outreach, and Training.
Parents and school officials need to be involved in developing safe-route-to-schoolplans and in identifying barriers to safe walking and bicycling. Other issues includewho will pay for adult crossing guards and for needed engineering improvements.
Budget issues affect the implementation of various countermeasures in school zones.Organizing the stakeholders and getting their cooperation can also consumesignificant time.
Costs depend upon the school-zone treatment selected.
Adult crossing guards must be well trained to be effective, and a system should be inplace for monitoring their performance. Student guards must also receive propertraining and monitoring.
In some states and local jurisdictions, increased legislative support may be needed tostrengthen laws and increase penalties for breaking laws related to children’s safetravel to and from school
None identified
EXHIBIT V-53The most successful educational messagesencourage people to think about their owntravel attitudes and behaviors and help themmake better choices. (Photo by Dan Burden)
in which travel attitudes and behavior are influenced are now being referred to as “soft”policies, in contrast to “hard” policies that force change (e.g., changes in infrastructure ortraffic laws). An integrated, multidisciplinary approach that links hard and soft policies andaddresses both pedestrians and drivers has the greatest chance of success.
For example, if a jurisdiction were to install new countdown pedestrian signals at acongested intersection, an effective public awareness campaign would explain how thecountdown sequence works and would also try to convince pedestrians of the personalbenefit derived in complying with the new countdown signals. Drivers would need to betargeted with a complementary message that stresses how this new technology couldimprove their interaction with pedestrians and the consequences if they do not practice morecautious behaviors. In other words, it would address a key decision-making question forboth pedestrian and driver: Is this worth changing my behavior?
A comprehensive coordinated program incorporates both broad approaches and targetedcampaigns.
Broad Approaches1
There are a number of educational strategies that can be conducted with modest resources orwithin existing resources. Many of these focus on ongoing actions at the state level but canbe adapted for use in local agencies as well. They include the following:
• Highlight pedestrian features when introducing new infrastructure—Seizeopportunities to create public awareness. For example: Redding, California, built a newpedestrian bridge, conducted a media campaign, and held public events to commemoratethe new bridge. More importantly, the city used this as an avenue to discuss the value oflinking pedestrian-friendly destinations—raising the profile on a new asset in thecommunity and encouraging residents to use it.
• Improve pedestrian data—Re-examine existing data to better describe the nature of theproblem. For example, the California Department of Transportation (Caltrans) reframedits pedestrian injury problem by stating that pedestrians represented only 2 percent of itsconstituency, but they represented nearly 20 percent of the roadway fatalities. Caltranshas cultivated partners, such as public health and emergency medical services, to helpthem to more fully describe pedestrian crash circumstances and their associated costs.For further information on improving data, refer to Bicycle and Pedestrian Data: Sources,Needs, and Gaps, available on The Bureau of Transportation Statistics Web site athttp://www.bts.gov/publications/bicycle_and_pedestrian_data/.
• Conduct internal campaigns within the organization to build staff support forpedestrian safety programs—Incorporate pedestrian safety issues wherever appropriate,such as inviting proponents for alternative modes to exhibit or present issues at staffmeetings, generate in-house newsletter articles that cite successes, address as appropriatein strategic planning, etc.
SECTION V—STRATEGIES FOR ADDRESSING THE PROBLEM
V-70
1 Adapted from A Model for Changing Travel Attitudes and Behaviour, produced by the INPHORMM project, December 1998.INPHORMM is a research project funded by the Commission of the European Communities, Directorate General for Transport.
SECTION V—STRATEGIES FOR ADDRESSING THE PROBLEM
• Incorporate pedestrian safety messages into public relations efforts—Draft newsreleases, disseminate fact sheets for local elected officials, incorporate pedestrian issuesinto reports or policy documents, or launch new grant programs with a press event thathighlights the importance of pedestrians as part of the road-user mix.
• Develop relationships with sister state agencies and statewide consumer groups—Provide leadership by convening a task force or conducting an ad hoc meeting to discussissues in common and to share current and potential activities that merit collaboration.Pedestrian safety is of interest to many governmental agencies as well as constituencygroups (e.g., Departments of Public Health, Motor Vehicles, Education, Aging, StatePolice, as well as state auto clubs, senior mobility advocates, etc.).
• Market alternative travel modes—Place emphasis on alternative modes for employeeswithin the organization. Ensure that there are employee transportation coordinators,provide information on ride sharing and incentives for walking as part of commute, etc.
The following Web site offers tips on marketing alternative modes for travel to work:
Choosing the most effective educational strategy depends on the objectives, the audience,and the messages to be conveyed, as well as what funding is available for this effort. Acritical first step is determining who the audience will be. Is the program reaching out toindividuals to change personal practices; to organizations and institutions, such as localschool districts, to change their policies; or to an even broader audience, such as when theprogram is working to create a shift in how pedestrians are viewed by the community-at-large? Even within a given level, the type of educational strategy selected depends on howready the targeted group is to make a change. For example, a very different message isneeded to create awareness in someone who has never contemplated letting his or herchildren walk to school versus someone who feels that walking to school is an importantactivity and simply wants to know more about safer routes to and from the campus.
The following section briefly describes three different approaches. They work best in concertand are more powerful when they are part of a long-term program versus a project designedto achieve some immediate short-term changes.
Public Awareness Campaigns
These “lay the groundwork” for subsequent pedestrian safety initiatives, increasing thelikelihood of their success. They also garner public support and begin the process ofchanging public attitudes toward pedestrian safety issues. Good public awarenesscampaigns will increase knowledge and motivate changes in behavior.
The Federal Highway Administration recently launched a broad-based Pedestrian SafetyCampaign aimed at (1) sensitizing drivers to the fact that pedestrians are legitimate roadusers and should always be expected on or near the roadway, (2) educating pedestriansabout minimizing risks to their safety, and (3) developing program materials to explain orenhance the operation of pedestrian facilities, such as crosswalks and pedestrian signals. A
V-71
Pedestrian Safety Campaign Toolkit containing a planning guide, TV and radio public serviceannouncements, posters, brochures, cinema slides, press releases, and newspaper articles isbeing made available to safety practitioners and pedestrian advocates who have theresources to implement a campaign. For further information, see the campaign Web site athttp://safety.fhwa.dot.gov/pedcampaign.
Other examples of public awareness campaigns may be found in Appendix 16.
Campaigns to Targeted Groups and Settings
Educational materials that target specific groups (school age children, older adults,motorists) or specific settings (school zones, crosswalks, or pediatricians’ offices) most oftenare intended to change knowledge and behaviors. Since behaviors generally do not changeeasily, and since the audience itself is always changing (e.g., preschoolers growing intoschool age children, adults becoming new parents), these campaigns generally should beconsidered ongoing efforts that need to be institutionalized within the organizations andcommunities. Examples of targeted pedestrian education campaigns include Safe Routes toSchool and The Walkability Checklist. These and other campaigns are highlighted inAppendix 16.
Individual Campaigns
Like targeted campaigns, individual campaigns usually target a specific audience. However,they differ in that the audience is reached through an intermediary. For example,pediatricians may be recruited to educate parents about the dangers posed by vehiclesbacking out of driveways, or school safety guards may be asked to instruct children in safecrossing behavior. The intervention actually occurs at a one-on-one level. Examples ofindividual level pedestrian safety education materials are A Message for Parents of PreschoolChildren and Rules of the Road for Grandchildren: Safety Tips (see Appendix 16 for details).
In summary, these three approaches—general public awareness, targeted campaigns, andindividual campaigns—provide a range of options for increasing knowledge and forchanging attitudes and behaviors that will strengthen pedestrian safety programs in localcommunities.
SECTION V—STRATEGIES FOR ADDRESSING THE PROBLEM
V-72
Attribute Description
Technical Attributes
Target Educational measures are directed at both drivers and pedestrians to improve their behavior and compliance to laws and ordinances.
Effects of Willie Whistle Educational Campaign on Pedestrian Accidents (Source: Blomberg et al., 1983)
EXHIBIT V-54Strategy Attributes for Providing Education, Outreach, and Training
SECTION V—STRATEGIES FOR ADDRESSING THE PROBLEM
V-73
Attribute Description
Expected Effectiveness Numerous studies have been conducted to evaluate efforts of educational programs on pedestrian behavior. For example, the NHTSA film on WILLIE WHISTLE (Blomberg et al., 1983) is aimed at grades kindergarten through 3 and teaches children the safe way to cross streets. After extensive testing in Los Angeles, Columbus, and Milwaukee, an observed reduction in dart and dash crashes by more than 30 percent among 4- to 6-year-old children was attributed to the film (exhibit below).
A 15-minute follow-up educational film called And Keep On Looking (Preusser and Lund, 1988) was later developed by NHTSA to convey street crossing advice to older children (grades 4 through 7) such as crossing busy streets, safety in parking lots, and crossing at signalized locations. The effectiveness of this film was examined through testing in Connecticut, Seattle, and Milwaukee. In a 2-year test in Milwaukee of the film’s effects, the number of 9- to 12-year olds involved in pedestrian crashes decreased by more than 20 percent. Positive results were also found in Seattle in terms of children’s observed behavior and in Connecticut through retained information after viewing the film.
NHTSA is currently evaluating the effectiveness of a comprehensive pedestrian safety program being conducted in Miami/Dade County, Florida, involving education, enforcement, and engineering approaches to increasing pedestrian safety.
In general, although specific education programs might be shown to change targeted behaviors, attitudes, or knowledge levels—and even crashes in large-scale evaluations such as those described above—they are viewed by NHTSA as important components in pedestrian safety initiatives even if they have not been formally evaluated and proven effective. This is because of the important role they play in increasing public awareness and complementing engineering and enforcement activities.
EXHIBIT V-54 (Continued)Strategy Attributes for Providing Education, Outreach, and Training
(continued on next page)
SECTION V—STRATEGIES FOR ADDRESSING THE PROBLEM
V-74
EXHIBIT V-54 (Continued)Strategy Attributes for Providing Education, Outreach, and Training
Attribute Description
Keys to Success The keys to success are to make pedestrian education an ongoing component of traffic safety education activities; to implement comprehensive, long-term programs; and to use appropriate, well-designed, educational programs and materials for pedestrians and motorists in conjunction with engineering and enforcement programs. Hiring a public information firm, or working with the public-information office within the agency, can help ensure that appropriate materials are developed and appropriate contacts are made when working with the media. In addition, care must be taken to develop programs and materials that are appropriate and effective for the particular ethnic or cultural group, age level, etc. being targeted.
The focus should be on developing materials that people want, need, and will use more than once. An example would be high-quality neighborhood walking and bicycling maps that incorporate educational messages.
Potential Difficulties It may be difficult to make the necessary contacts and secure the support needed to ensure a comprehensive educational program. Also, care must be taken in developing safety messages that are targeted to the major pedestrian crash causesand in identifying the best approaches (Public Service Announcements [PSAs], educating drivers, classroom training, parental education, etc.) for delivering the identified message to the targeted audience. With school-based traffic-safety education programs, there may also be difficulty getting into established school curriculums.
Appropriate Measures and Data
Frequency of crashes between motorists and pedestrians (especially of the type targeted by the program) is the primary safety measure. Surrogate safety measures include conflicts between pedestrians and vehicles; observed behaviors by motorists (e.g. failing to yield to pedestrians in crosswalks, speeding) and pedestrians (e.g. violating the pedestrian signal); as well as changes in knowledge and attitudes (for example, measured by safety surveys).
Associated Needs Identifying and arranging the appropriate vehicles for the educational program requires involvement of specific members of the community, such as the media, local schools, and the health community (e.g., pediatricians and family physicians).
Organizational and Institutional Attributes
Organizational, Institutional, and Policy Issues
A successful public information program will require the cooperation of several organizations and institutions. A coordinating council, or other type of group, might be needed to oversee the effort.
Issues Affecting Implementation Time
Education messages directed at school children are most effective if targeted just before high-crash months, so that fall and early spring are typically appropriate times for such messages.
The time to implement a program depends upon such factors as the availability of materials, the number of agencies and organizations to be involved, and the size of the target population.
Cost Involved Costs vary widely, depending upon the type of educational program.
Training and Other Personnel Needs
Staff should be appropriately trained to conduct the program. Specialists in education and marketing will be needed.
Legislative Needs None.
SECTION V—STRATEGIES FOR ADDRESSING THE PROBLEM
Useful Web Sites
The Pedestrian and Bicycle Information Center (PBIC), a national clearinghouse forinformation about health and safety, engineering, advocacy, education, enforcement, andaccess and mobility—http://www.walkinginfo.org/.
National Highway Traffic Safety Administration’s pedestrian safety programs—http://www.nhtsa.dot.gov/people/injury/pedbimot/ped/. Also, http://www.nhtsa.dot.gov/safecommunities/.
Pedestrian Safety Roadshow. FHWA web site. http://safety.fhwa.dot.gov/roadshow/walk/(last accessed April 22, 2004)
The Association of Pedestrian and Bicycle Professionals (APBP)—http://www.apbp.org.Provides online resources and publications, links to other Web sites.
Partnership for a Walkable America—http://www.walkableamerica.org/. DownloadWalkable America Checklist. Also, http://www.iwalktoschool.org (official Web site ofInternational Walk to School Day).
Bureau of Transportation Statistics—U.S. DOT provides information on bicycle, pedestrian,and crash data—http://www.bts.gov
Strategy 9.1 D2: Implement Enforcement Campaigns
Police enforcement is essential to preserve pedestrian right-of-way and promote a safeenvironment for pedestrians. A combination of well-publicized enforcement campaigns,strategically installed traffic signs and devices, and public education programs caneffectively increase driver awareness of the obligation to share the roadway with pedestriansand bicyclists. Police enforcement of the traffic code is also the most potent means of givingcredibility to traffic control devices and traffic safety educational programs (Exhibit V-55).Traffic safety educational programs can sensitize and inform the general public of the needand benefits of observing traffic regulations. Unfortunately, knowing what to do and why todo it is often not enough. Good and bad driving behavior is much more a function of directand immediate consequences that follow driver behavior.
Police forces throughout the United States have a long history of enforcing the law as itpertains to speeding, driving under the influence, and red-light running. They havedeveloped very effective ways to observe, measure, and apprehend drivers who engage inthese behaviors. Their observation and measurement procedures and accompanying deviceshave been validated, are socially acceptable, and are generally well accepted for evidentiary
V-75
Attribute Description
None identified.
Other Key Attributes
EXHIBIT V-54 (Continued)Strategy Attributes for Providing Education, Outreach, and Training
purposes. This may not be the case when it comes to the enforcement of crosswalk laws.Enforcement of right-of-way legislation presents a more daunting challenge for most policeforces. The nature of the offense (not yielding to pedestrians, for example) appears at firstglance to be a more subjective infraction of a shared responsibility. Police departments maynot assign priority to enforcement of pedestrian right-of-way laws and/or may not provideofficers adequate training in the enforcement of these laws.
Enforcement can increase driver compliance at crosswalks, increase driver awarenessand/or mindfulness of pedestrians, and give credibility to engineering interventions. SeeAppendix 17 and Appendix 18 for details on example enforcement programs. Someadditional considerations for conducting an enforcement campaign are found in Appendix19. Some of the enforcement effort needed will require special legislation to establish thebasis for the enforcement actions. Model ordinances have been developed to helpcommunities adopt the necessary legal infrastructure. Further details on these ordinancescan be found in Appendix 20. Information on enforcement related to pedestrian safety mayalso be found at www.walkinginfo.org/. In addition to special enforcement activitiesdirected at improving motorists yielding to pedestrians in marked and unmarkedcrosswalks, law enforcement officials should also be encouraged to strictly enforce speedlimit laws in locations where pedestrian traffic is high and/or where analysis of crash datasuggests that speeding may be a contributing factor in pedestrian crashes.
Downtown business areas, shopping centers, school zones, college campuses, hospitals,senior centers, parks and recreation facilities, etc. are all locations that may warrant specialattention by law enforcement officials to discourage speeding and encourage properbehavior for yielding to pedestrians crossing roadways. Locations where red-light runningposes a risk to pedestrians should also be targeted for special enforcement, includingconsideration of automated (photo) enforcement where law allows.
SECTION V—STRATEGIES FOR ADDRESSING THE PROBLEM
V-76
EXHIBIT V-55Police enforcement is essential topreserve pedestrian right-of-way andpromote a safe environment forpedestrians. (Photo by MichaelRonkin)
SECTION V—STRATEGIES FOR ADDRESSING THE PROBLEM
V-77
EXHIBIT V-56Strategy Attributes for Implementing Enforcement Campaigns
Attribute Description
Technical Attributes
Target
Expected Effectiveness
Keys to Success
This strategy is primarily directed at motorists who fail to give pedestrians proper right-of-way at crosswalks. It also targets some of the most serious risk-taking trafficviolations by pedestrians.
No quantitative studies are known that have determined the specific effect of varioustypes of police enforcement on pedestrian-related traffic injuries and fatalities. Theeffect of enforcement alone on pedestrian crashes is difficult to quantify because ofthe multitude of factors that affect pedestrian crashes. For most jurisdictions,pedestrian injuries and fatalities occur at a wide variety of crosswalks and atfrequencies that do not permit the establishment of causal relationships betweenthose crashes and enforcement operations.
Enforcement programs increase the percentage of motorists yielding to pedestriansand also motorist awareness of pedestrians. They can also target drivers that arespeeding or those that pass vehicles that are yielding to pedestrians.
Malenfant and Van Houten (1989) measured large increases in yielding behavior in threeCanadian cities employing enforcement complemented with educational outreach andseveral engineering interventions. Although safety may have been greatly influenced bythe engineering interventions, the enforcement component increased yielding behavior.Exhibit V-57 shows the increase in yielding behavior produced in three cities.
More recently, this program has been applied to increase yielding behavior in MiamiBeach, Florida. Data collected to date show that yielding has increased in both corridorsfollowing the introduction of the program and that maintenance strategies are working tomaintain the increase in yielding behavior. Data also indicated that enforcement ofpedestrian right-of-way at marked crosswalks at uncontrolled locations generalized toother crosswalks. Generalization was noted at (1) uncontrolled locations whereenforcement had not been scheduled, (2) crosswalks at traffic signals that did not receiveenforcement, and (3) intersections at uncontrolled locations without crosswalk markings.
Britt et al. (1995) reported similar findings from an enforcement campaign on motoristcompliance with new stricter crosswalk laws in Washington State. The new policyencouraged officers to write two tickets for motorist violations to every jaywalkingcitation. Evaluating willingness of drivers to stop at uncontrolled intersections forpedestrians before and after the enforcement campaign, researchers found thatmotorists were much more likely to stop in areas made up of multifamily housing unitsand small retail businesses than in nonresidential areas.
It should be noted that enforcement can yield fast results in small, tight-knitcommunities. To produce similar results in larger communities requires a moresustained effort over a longer period of time.
To be effective, police enforcement campaigns must be well planned and organized.They also must be sensitive to the special needs and characteristics of theneighborhood, age group, ethnic group, etc. being targeted by the campaign.
In the case of enforcement of pedestrian right-of-way at crosswalks, participatingpolice officers need to be trained beforehand, since this type enforcement is unliketypical enforcement operations. Police officers should have senior staff support. It isbest to work in a small team. Police authorities should inform prosecutors and judgesprior to introducing the campaign, as well as promote media and public support.Pedestrian safety enforcement operations should focus on the more serious violations ofboth drivers and pedestrians. Most often this will mean giving priority to enforcement of
(continued on next page)
SECTION V—STRATEGIES FOR ADDRESSING THE PROBLEM
V-78
EXHIBIT V-56 (Continued)Strategy Attributes for Implementing Enforcement Campaigns
Attribute Description
Potential Difficulties
Appropriate Measures and Data
Associated Needs
Organizational and Institutional Attributes
Organizational, Institutional, and Policy Issues
Issues Affecting Implementation Time
Cost Involved
driver behavior. In the beginning stages, enforcement operations should be scheduledvery frequently and gradually reduced, but sustained over the long term, particularly atproblematic locations. Police forces without a history of such enforcement operationsshould begin with warnings and enforcement flyers before introducing citations. Finally,enforcement of pedestrian violations should be kept for last, or until a large majority ofdrivers maintain a high level of yielding to pedestrians at crosswalks.
Police enforcement can result in public relations problems if it is not well planned andif officers are not properly trained for this special type of operation. Other problems willarise if the enforcement team does not have the full support of senior policeadministrators, political officials, and the media.
Reducing pedestrian-related traffic crashes is the ultimate objective of the enforcementoperations. However, such crashes are distributed over a large area and typically at lowfrequency at a given location. They cannot be used to evaluate specific enforcementprocedures. Appropriate measures should focus on higher-frequency pedestrian-safety-related behaviors, such as yielding to pedestrians at crosswalks, speeding by drivers atcrosswalks, and drivers stopping too close to, or in, crosswalks. Other safety-relatedbehaviors that occur at sufficiently high frequency to evaluate the effectiveness of anenforcement operation include the frequency of pedestrians thanking drivers that yieldright-of-way, stepping into traffic without warning, and crossing against the walk signal.
Valuable components to support police enforcement include clearly marked crosswalkswith advance crosswalk signs; prompting signs for pedestrians; and, if possible, largefeedback signs to inform the public of the campaign and of the implied surveillance.Public education (e.g., using a 20-minute lesson plan for school-aged pupils) andinformation flyers for the general public (especially the elderly) have the potential togreatly enhance the visibility and required public support for police enforcement ofcrosswalks.
The establishment of a “Triple E” committee (Education, Enforcement, andEngineering), to develop and direct the effort, significantly increases the probability ofsuccess of any of these initiatives. Representation should include city or countyadministrators, their public relations departments, the police or sheriffs’ departments,engineering departments, neighborhood associations, and crossing guards. Policeenforcement operations must be well understood, and they should not work inisolation, but as integral members of a strong, well-organized, multidisciplinarymunicipal or county Triple E team.
Although enforcement of pedestrian right-of-way at crosswalks can be introduced at anytime, enforcement campaigns are most timely just prior to summer holidays when thenumber of school-aged children on roadways increases. It is also timely to introducesuch campaigns at the beginning of a new school year, when kindergarten and firstgraders are at greater risk because of their inexperience at getting to and from school.
Furthermore, if a Triple E committee is to be organized, a planning process followed,and a new PI&E campaign created to accompany it, the entire venture could take atleast 1 year before implementation can start.
Cost varies, depending on the type, intensity, and duration of the enforcement effort.Some state governors’ highway safety offices may provide grants for targetedenforcement programs, e.g., at schools or to stop red-light running.
SECTION V—STRATEGIES FOR ADDRESSING THE PROBLEM
V-79
EXHIBIT V-56 (Continued)Strategy Attributes for Implementing Enforcement Campaigns
Attribute Description
Training and Other Personnel Needs
Other Key Attributes
Police training is needed regarding the proper procedures to carry out theenforcement campaign.
None.
EXHIBIT V-57Illustration of motorist yielding behavior from pedestrian enforcement program
VI-1
SECTION VI
Guidance for Implementation of the AASHTOStrategic Highway Safety Plan
Outline for a Model Implementation ProcessExhibit VI-1 gives an overview of an 11-step model process for implementing a program ofstrategies for any given emphasis area of the AASHTO Strategic Highway Safety Plan. Aftera short introduction, each of the steps is outlined in further detail.
EXHIBIT VI-1
AAS HT O Strategic High wa y Sa fety PlanMo de l Implem entation Process
SECTION VI—GUIDANCE FOR IMPLEMENTATION OF THE AASHTO STRATEGIC HIGHWAY SAFETY PLAN
VI-2
Purpose of the Model ProcessThe process described in this section is provided as a model rather than a standard. Manyusers of this guide will already be working within a process established by their agency orworking group. It is not suggested that their process be modified to conform to this one.However, the model process may provide a useful checklist. For those not having a standardprocess to follow, it is recommended that the model process be used to help establish anappropriate one for their initiative. Not all steps in the model process need to be performed atthe level of detail indicated in the outlines below. The degree of detail and the amount of workrequired to complete some of these steps will vary widely, depending upon the situation.
It is important to understand that the process being presented here is assumed to be conductedonly as a part of a broader, strategic-level safety management process. The details of thatprocess, and its relation to this one, may be found in a companion guide. (The companionguide is a work in progress at this writing. When it is available, it will be posted online athttp://transportation1.org/safetyplan.)
Overview of the Model ProcessThe process (see Exhibit VI-1, above) must be started at top levels in the lead agency’sorganization. This would, for example, include the CEO, DOT secretary, or chief engineer, as appropriate. Here, decisions will have been made to focus the agency’s attention andresources on specific safety problems based upon the particular conditions and characteristicsof the organization’s roadway system. This is usually, but not always, documented as aresult of the strategic-level process mentioned above. It often is publicized in the form of a“highway safety plan.” Examples of what states produce include Wisconsin DOT’s StrategicHighway Safety Plan (see Appendix A) and Iowa’s Safety Plan (available at http://www.iowasms.org/toolbox.htm).
Once a “high-level” decision has been made to proceed with a particular emphasis area, thefirst step is to describe, in as much detail as possible, the problem that has been identified inthe high-level analysis. The additional detail helps confirm to management that the problemidentified in the strategic-level analysis is real and significant and that it is possible to dosomething about it. The added detail that this step provides to the understanding of theproblem will also play an important part in identifying alternative approaches for dealingwith it.
Step 1 should produce endorsement and commitments from management to proceed, atleast through a planning process. With such an endorsement, it is then necessary to identifythe stakeholders and define their role in the effort (Step 2). It is important at this step to identify a range of participants in the process who will be able to help formulate acomprehensive approach to the problem. The group will want to consider how it can drawupon potential actions directed at
• Driver behavior (legislation, enforcement, education, and licensing),• Engineering,
SECTION VI—GUIDANCE FOR IMPLEMENTATION OF THE AASHTO STRATEGIC HIGHWAY SAFETY PLAN
• Emergency medical systems, and• System management.
With the establishment of a working group, it is then possible to finalize an understandingof the nature and limitations of what needs to be done in the form of a set of programpolicies, guidelines, and specifications (Steps 3 and 4). An important aspect of this isestablishing targets for crash reduction in the particular emphasis area (Step 3). Identifyingstakeholders, defining their roles, and forming guidelines and policies are all elements ofwhat is often referred to as “chartering the team.” In many cases, and in particular whereonly one or two agencies are to be involved and the issues are not complex, it may bepossible to complete Steps 1 through 4 concurrently.
Having received management endorsement and chartered a project team—the foundationfor the work—it is now possible to proceed with project planning. The first step in this phase(Step 5 in the overall process) is to identify alternative strategies for addressing the safetyproblems that have been identified while remaining faithful to the conditions established inSteps 2 through 4.
With the alternative strategies sufficiently defined, they must be evaluated against oneanother (Step 6) and as groups of compatible strategies (i.e., a total program). The results of the evaluation will form the recommended plan. The plan is normally submitted to theappropriate levels of management for review and input, resulting ultimately in a decision onwhether and how to proceed (Step 7). Once the working group has been given approval toproceed, along with any further guidelines that may have come from management, thegroup can develop a detailed plan of action (Step 8). This is sometimes referred to as an“implementation” or “business” plan.
Plan implementation is covered in Steps 9 and 10. There often are underlying activitiesthat must take place prior to implementing the action plan to form a foundation for whatneeds to be done (Step 9). This usually involves creating the organizational, operational,and physical infrastructure needed to succeed. The major step (Step 10) in this processinvolves doing what was planned. This step will in most cases require the greatestresource commitment of the agency. An important aspect of implementation involvesmaintaining appropriate records of costs and effectiveness to allow the plan to beevaluated after-the-fact.
Evaluating the program, after it is underway, is an important activity that is oftenoverlooked. Management has the right to require information about costs, resources, andeffectiveness. It is also likely that management will request that the development teamprovide recommendations about whether the program should be continued and, if so, whatrevisions should be made. Note that management will be deciding on the future for anysingle emphasis area in the context of the entire range of possible uses of the agency’sresources. Step 11 involves activities that will give the desired information to managementfor each emphasis area.
To summarize, the implementation of a program of strategies for an emphasis area can becharacterized as an 11-step process. The steps in the process correspond closely to a 4-phaseapproach commonly followed by many transportation agencies:
VI-3
• Endorsement and chartering of the team and project (Steps 1 through 4),• Project planning (Steps 5 through 8),• Plan implementation (Steps 9 and 10), and• Plan evaluation (Step 11).
Details about each step follow. The Web-based version of this description is accompanied bya set of supplementary material to enhance and illustrate the points.
The model process is intended to provide a framework for those who need it. It is notintended to be a how-to manual. There are other documents that provide extensive detail regarding how to conduct this type of process. Some general ones are covered inAppendix B and Appendix C. Others, which relate to specific aspects of the process, arereferenced within the specific sections to which they apply.
SECTION VI—GUIDANCE FOR IMPLEMENTATION OF THE AASHTO STRATEGIC HIGHWAY SAFETY PLAN
VI-4
SECTION VI—GUIDANCE FOR IMPLEMENTATION OF THE AASHTO STRATEGIC HIGHWAY SAFETY PLAN
Implementation Step 1: Identify and Define the Problem
General DescriptionProgram development begins with gathering data and creating and analyzing information.The implementation process being described in this guide is one that will be done in thecontext of a larger strategic process. It is expected that this guide will be used when thestrategic process, or a project-level analysis, has identified a potentially significant problemin this emphasis area.
Data analyses done at the strategic level normally are done with a limited amount of detail.They are usually the top layer in a “drill-down” process. Therefore, while those previousanalyses should be reviewed and used as appropriate, it will often be the case that furtherstudies are needed to completely define the issues.
It is also often the case that a core technical working group will have been formed by the lead agency to direct and carry out the process. This group can conduct the analysesrequired in this step, but should seek, as soon as possible, to involve any other stakeholderswho may desire to provide input to this process. Step 2 deals further with the organizationof the working group.
The objectives of this first step are as follows:
1. Confirm that a problem exists in this emphasis area.
2. Detail the characteristics of the problem to allow identification of likely approachesfor eliminating or reducing it.
3. Confirm with management, given the new information, that the planning andimplementation process should proceed.
The objectives will entail locating the best available data and analyzing them to highlighteither geographic concentrations of the problem or over-representation of the problemwithin the population being studied.
Identification of existing problems is a responsive approach. This can be complemented by aproactive approach that seeks to identify potentially hazardous conditions or populations.
For the responsive type of analyses, one generally begins with basic crash records that aremaintained by agencies within the jurisdiction. This is usually combined, where feasible,with other safety data maintained by one or more agencies. The other data could include
• Roadway inventory,
• Driver records (enforcement, licensing, courts), or
• Emergency medical service and trauma center data.
To have the desired level of impact on highway safety, it is important to consider thehighway system as a whole. Where multiple jurisdictions are responsible for various partsof the system, they should all be included in the analysis, wherever possible. The bestexample of this is a state plan for highway safety that includes consideration of the extensive
VI-5
mileage administered by local agencies. To accomplish problem identification in this mannerwill require a cooperative, coordinated process. For further discussion on the problemidentification process, see Appendix D and the further references contained therein.
In some cases, very limited data are available for a portion of the roads in the jurisdiction.This can occur for a local road maintained by a state or with a local agency that has verylimited resources for maintaining major databases. Lack of data is a serious limitation to thisprocess, but must be dealt with. It may be that for a specific study, special data collectionefforts can be included as part of the project funding. While crash records may be maintainedfor most of the roads in the system, the level of detail, such as good location information,may be quite limited. It is useful to draw upon local knowledge to supplement data,including
• Local law enforcement,
• State district and maintenance engineers,
• Local engineering staff, and
• Local residents and road users.
These sources of information may provide useful insights for identifying hazardouslocations. In addition, local transportation agencies may be able to provide supplementarydata from their archives. Finally, some of the proactive approaches mentioned below may beused where good records are not available.
Maximum effectiveness often calls for going beyond data in the files to include specialsupplemental data collected on crashes, behavioral data, site inventories, and citizen input.Analyses should reflect the use of statistical methods that are currently recognized as validwithin the profession.
Proactive elements could include
• Changes to policies, design guides, design criteria, and specifications based uponresearch and experience;
• Retrofitting existing sites or highway elements to conform to updated criteria (perhapswith an appropriate priority scheme);
• Taking advantage of lessons learned from previous projects;
• Road safety audits, including on-site visits;
• Safety management based on roadway inventories;
• Input from police officers and road users; and
• Input from experts through such programs as the NHTSA traffic records assessmentteam.
The result of this step is normally a report that includes tables and graphs that clearlydemonstrate the types of problems and detail some of their key characteristics. Such reports
SECTION VI—GUIDANCE FOR IMPLEMENTATION OF THE AASHTO STRATEGIC HIGHWAY SAFETY PLAN
VI-6
SECTION VI—GUIDANCE FOR IMPLEMENTATION OF THE AASHTO STRATEGIC HIGHWAY SAFETY PLAN
VI-7
should be presented in a manner to allow top management to quickly grasp the key findingsand help them decide which of the emphasis areas should be pursued further, and at whatlevel of funding. However, the report must also document the detailed work that has beendone, so that those who do the later stages of work will have the necessary background.
Specific Elements1. Define the scope of the analysis
1.1. All crashes in the entire jurisdiction1.2. A subset of crash types (whose characteristics suggest they are treatable, using
strategies from the emphasis area)1.3. A portion of the jurisdiction1.4. A portion of the population (whose attributes suggest they are treatable using
strategies from the emphasis area)2. Define safety measures to be used for responsive analyses
2.1. Crash measures2.1.1. Frequency (all crashes or by crash type)2.1.2. Measures of exposure2.1.3. Decide on role of frequency versus rates
2.3. Other measures2.3.1. Citizen complaints2.3.2. Marks or damage on roadway and appurtenances, as well as crash
debris3. Define measures for proactive analyses
3.1. Comparison with updated and changed policies, design guides, designcriteria, and specifications
3.2. Conditions related to lessons learned from previous projects3.3. Hazard indices or risk analyses calculated using data from roadway
inventories to input to risk-based models 3.4. Input from police officers and road users
4. Collect data4.1. Data on record (e.g., crash records, roadway inventory, medical data, driver-
licensing data, citations, other)4.2. Field data (e.g., supplementary crash and inventory data, behavioral
observations, operational data)4.3. Use of road safety audits, or adaptations
5. Analyze data5.1. Data plots (charts, tables, and maps) to identify possible patterns, and
concentrations (See Appendixes Y, Z and AA for examples of what somestates are doing)
5.2. Statistical analysis (high-hazard locations, over-representation of contributingcircumstances, crash types, conditions, and populations)
5.3. Use expertise, through road safety audits or program assessment teams5.4. Focus upon key attributes for which action is feasible:
5.4.1. Factors potentially contributing to the problems5.4.2. Specific populations contributing to, and affected by, the problems5.4.3. Those parts of the system contributing to a large portion of the
problem6. Report results and receive approval to pursue solutions to identified problems (approvals
being sought here are primarily a confirmation of the need to proceed and likely levels of resourcesrequired)
6.1. Sort problems by type6.1.1. Portion of the total problem6.1.2. Vehicle, highway/environment, enforcement, education, other
driver actions, emergency medical system, legislation, and systemmanagement
6.1.3. According to applicable funding programs6.1.4. According to political jurisdictions
6.2. Preliminary listing of the types of strategies that might be applicable6.3. Order-of-magnitude estimates of time and cost to prepare implementation
plan6.4. Listing of agencies that should be involved, and their potential roles
(including an outline of the organizational framework intended for theworking group). Go to Step 2 for more on this.
SECTION VI—GUIDANCE FOR IMPLEMENTATION OF THE AASHTO STRATEGIC HIGHWAY SAFETY PLAN
VI-8
SECTION VI—GUIDANCE FOR IMPLEMENTATION OF THE AASHTO STRATEGIC HIGHWAY SAFETY PLAN
VI-9
Implementation Step 2: Recruit Appropriate Participants forthe Program
General DescriptionA critical early step in the implementation process is to engage all the stakeholders that maybe encompassed within the scope of the planned program. The stakeholders may be fromoutside agencies (e.g., state patrol, county governments, or citizen groups). One criterion forparticipation is if the agency or individual will help ensure a comprehensive view of theproblem and potential strategies for its resolution. If there is an existing structure (e.g., a StateSafety Management System Committee) of stakeholders for conducting strategic planning, itis important to relate to this, and build on it, for addressing the detailed considerations ofthe particular emphasis area.
There may be some situations within the emphasis area for which no other stakeholders maybe involved other than the lead agency and the road users. However, in most cases, carefulconsideration of the issues will reveal a number of potential stakeholders to possibly beinvolved. Furthermore, it is usually the case that a potential program will proceed better inthe organizational and institutional setting if a high-level “champion” is found in the leadagency to support the effort and act as a key liaison with other stakeholders.
Stakeholders should already have been identified in the previous step, at least at a level to allow decision makers to know whose cooperation is needed, and what their potentiallevel of involvement might be. During this step, the lead agency should contact the keyindividuals in each of the external agencies to elicit their participation and cooperation. Thiswill require identifying the right office or organizational unit, and the appropriate people ineach case. It will include providing them with a brief overview document and outlining for them the type of involvement envisioned. This may typically involve developinginteragency agreements. The participation and cooperation of each agency should besecured to ensure program success.
Lists of appropriate candidates for the stakeholder groups are recorded in Appendix K. Inaddition, reference may be made to the NHTSA document at http://www.nhtsa.dot.gov/safecommunities/SAFE%20COMM%20Html/index.html, which provides guidance onbuilding coalitions.
Specific Elements1. Identify internal “champions” for the program2. Identify the suitable contact in each of the agencies or private organizations who is
appropriate to participate in the program3. Develop a brief document that helps sell the program and the contact’s role in it by
3.1. Defining the problem3.2. Outlining possible solutions3.3. Aligning the agency or group mission by resolving the problem3.4. Emphasizing the importance the agency has to the success of the effort
SECTION VI—GUIDANCE FOR IMPLEMENTATION OF THE AASHTO STRATEGIC HIGHWAY SAFETY PLAN
VI-10
3.5. Outlining the organizational framework for the working group and otherstakeholders cooperating on this effort
3.6. Outlining the rest of the process in which agency staff or group members arebeing asked to participate
3.7. Outlining the nature of commitments desired from the agency or group forthe program
3.8. Establishing program management responsibilities, including communicationprotocols, agency roles, and responsibilities
3.9. Listing the purpose for an initial meeting4. Meet with the appropriate representative
4.1. Identify the key individual(s) in the agency or group whose approval isneeded to get the desired cooperation
4.2. Clarify any questions or concepts4.3. Outline the next steps to get the agency or group onboard and participating
5. Establish an organizational framework for the group5.1. Roles5.2. Responsibilities
SECTION VI—GUIDANCE FOR IMPLEMENTATION OF THE AASHTO STRATEGIC HIGHWAY SAFETY PLAN
General DescriptionThe AASHTO Strategic Highway Safety Plan established a national goal of saving 5,000 to7,000 lives annually by the year 2003 to 2005. Some states have established statewide goalsfor the reduction of fatalities or crashes of a certain degree of severity. Establishing anexplicit goal for crash reduction can place an agency “on the spot,” but it usually providesan impetus to action and builds a support for funding programs for its achievement.Therefore, it is desirable to establish, within each emphasis area, one or more crash reductiontargets.
These may be dictated by strategic-level planning for the agency, or it may be left to thestakeholders to determine. (The summary of the Wisconsin DOT Highway Safety Plan inAppendix A has more information.) For example, Pennsylvania adopted a goal of 10 percentreduction in fatalities by 2002,1 while California established a goal of 40 percent reduction in fatalities and 15 percent reduction in injury crashes, as well as a 10 percent reduction inwork zone crashes, in 1 year.2 At the municipal level, Toledo, Ohio, is cited by the U.S.Conference of Mayors as having an exemplary program. This included establishing specificcrash reduction goals (http://www.usmayors.org/uscm/uscm projects_services/health/traffic/best_traffic initiative_toledo.htm). When working within an emphasis area, it may bedesirable to specify certain types of crashes, as well as the severity level, being targeted.
There are a few key considerations for establishing a quantitative goal. The stakeholdersshould achieve consensus on this issue. The goal should be challenging, but achievable. Itsfeasibility depends in part on available funding, the timeframe in which the goal is to beachieved, the degree of complexity of the program, and the degree of controversy the programmay experience. To a certain extent, the quantification of the goal will be an iterative process.If the effort is directed at a particular location, then this becomes a relatively straightforwardaction.
Specific Elements1. Identify the type of crashes to be targeted
1.1. Subset of all crash types1.2. Level of severity
2. Identify existing statewide or other potentially related crash reduction goals3. Conduct a process with stakeholders to arrive at a consensus on a crash reduction goal
3.1. Identify key considerations3.2. Identify past goals used in the jurisdiction3.3. Identify what other jurisdictions are using as crash reduction goals3.4. Use consensus-seeking methods, as needed
VI-11
1 Draft State Highway Safety Plan, State of Pennsylvania, July 22, 19992 Operations Program Business Plan, FY 1999/2000, State of California, Caltrans, July 1999
Implementation Step 4: Develop Program Policies,Guidelines, and Specifications
General DescriptionA foundation and framework are needed for solving the identified safety problems. Theimplementation process will need to be guided and evaluated according to a set of goals,objectives, and related performance measures. These will formalize what the intended resultis and how success will be measured. The overlying crash reduction goal, established in Step 3, will provide the context for the more specific goals established in this step. The goals, objectives, and performance measures will be used much later to evaluate what isimplemented. Therefore, they should be jointly outlined at this point and agreed to by all program stakeholders. It is important to recognize that evaluating any actions is animportant part of the process. Even though evaluation is not finished until some time afterthe strategies have been implemented, it begins at this step.
The elements of this step may be simpler for a specific project or location than for acomprehensive program. However, even in the simpler case, policies, guidelines, andspecifications are usually needed. Furthermore, some programs or projects may require thatsome guidelines or specifications be in the form of limits on directions taken and types ofstrategies considered acceptable.
Specific Elements1. Identify high-level policy actions required and implement them (legislative and
administrative)2. Develop goals, objectives, and performance measures to guide the program and use for
assessing its effect2.1. Hold joint meetings of stakeholders2.2. Use consensus-seeking methods2.3. Carefully define terms and measures2.4. Develop report documenting results and validate them
3. Identify specifications or constraints to be used throughout the project3.1. Budget constraints3.2. Time constraints3.3. Personnel training3.4. Capacity to install or construct3.5. Types of strategies not to be considered or that must be included3.6. Other
SECTION VI—GUIDANCE FOR IMPLEMENTATION OF THE AASHTO STRATEGIC HIGHWAY SAFETY PLAN
VI-12
SECTION VI—GUIDANCE FOR IMPLEMENTATION OF THE AASHTO STRATEGIC HIGHWAY SAFETY PLAN
Implementation Step 5: Develop Alternative Approaches toAddressing the Problem
General DescriptionHaving defined the problem and established a foundation, the next step is to find ways toaddress the identified problems. If the problem identification stage has been done effectively(see Appendix D for further details on identifying road safety problems), the characteristicsof the problems should suggest one or more alternative ways for dealing with the problem.It is important that a full range of options be considered, drawing from areas dealing withenforcement, engineering, education, emergency medical services, and system managementactions.
Alternative strategies should be sought for both location-specific and systemic problems thathave been identified. Location-specific strategies should pertain equally well to addressinghigh-hazard locations and to solving safety problems identified within projects that arebeing studied for reasons other than safety.
Where site-specific strategies are being considered, visits to selected sites may be in order ifdetailed data and pictures are not available. In some cases, the emphasis area guides willprovide tables that help connect the attributes of the problem with one or more appropriatestrategies to use as countermeasures.
Strategies should also be considered for application on a systemic basis. Examples include
1. Low-cost improvements targeted at problems that have been identified as significant inthe overall highway safety picture, but not concentrated in a given location.
2. Action focused upon a specific driver population, but carried out throughout thejurisdiction.
3. Response to a change in policy, including modified design standards.
4. Response to a change in law, such as adoption of a new definition for DUI.
In some cases, a strategy may be considered that is relatively untried or is an innovativevariation from past approaches to treatment of a similar problem. Special care is needed toensure that such strategies are found to be sound enough to implement on a wide-scalebasis. Rather than ignoring this type of candidate strategy in favor of the more “tried-and-proven” approaches, consideration should be given to including a pilot-test component tothe strategy.
The primary purpose of this guide is to provide a set of strategies to consider for eliminatingor lessening the particular road safety problem upon which the user is focusing. As pointedout in the first step of this process, the identification of the problem, and the selection ofstrategies, is a complex step that will be different for each case. Therefore, it is not feasible to provide a “formula” to follow. However, guidelines are available. There are a number oftexts to which the reader can refer. Some of these are listed in Appendix B and Appendix D.
VI-13
In addition, the tables referenced in Appendix G provide examples for linking identifiedproblems with candidate strategies.
The second part of this step is to assemble sets of strategies into alternative “programpackages.” Some strategies are complementary to others, while some are more effectivewhen combined with others. In addition, some strategies are mutually exclusive. Finally,strategies may be needed to address roads across multiple jurisdictions. For instance, apackage of strategies may need to address both the state and local highway system to havethe desired level of impact. The result of this part of the activity will be a set of alternative“program packages” for the emphasis area.
It may be desirable to prepare a technical memorandum at the end of this step. It woulddocument the results, both for input into the next step and for internal reviews. The latter islikely to occur, since this is the point at which specific actions are being seriously considered.
Specific Elements1. Review problem characteristics and compare them with individual strategies,
considering both their objectives and their attributes1.1. Road-user behavior (law enforcement, licensing, adjudication)1.2. Engineering1.3. Emergency medical services1.4. System management elements
2. Select individual strategies that do the following:2.1. Address the problem2.2. Are within the policies and constraints established2.3. Are likely to help achieve the goals and objectives established for the program
3. Assemble individual strategies into alternative program packages expected to optimizeachievement of goals and objectives
3.1. Cumulative effect to achieve crash reduction goal3.2. Eliminate strategies that can be identified as inappropriate, or likely to be
ineffective, even at this early stage of planning4. Summarize the plan in a technical memorandum, describing attributes of individual
strategies, how they will be combined, and why they are likely to meet the establishedgoals and objectives
SECTION VI—GUIDANCE FOR IMPLEMENTATION OF THE AASHTO STRATEGIC HIGHWAY SAFETY PLAN
VI-14
SECTION VI—GUIDANCE FOR IMPLEMENTATION OF THE AASHTO STRATEGIC HIGHWAY SAFETY PLAN
Implementation Step 6: Evaluate Alternatives and Select a Plan
General Description
This step is needed to arrive at a logical basis for prioritizing and selecting among thealternative strategies or program packages that have been developed. There are severalactivities that need to be performed. One proposed list is shown in Appendix P.
The process involves making estimates for each of the established performance measures forthe program and comparing them, both individually and in total. To do this in a quantitativemanner requires some basis for estimating the effectiveness of each strategy. Where solidevidence has been found on effectiveness, it has been presented for each strategy in theguide. In some cases, agencies have a set of crash reduction factors that are used to arrive ateffectiveness estimates. Where a high degree of uncertainty exists, it is wise to use sensitivityanalyses to test the validity of any conclusions that may be made regarding which is the beststrategy or set of strategies to use. Further discussion of this may be found in Appendix O.
Cost-benefit and cost-effectiveness analyses are usually used to help identify inefficient orinappropriate strategies, as well as to establish priorities. For further definition of the twoterms, see Appendix Q. For a comparison of the two techniques, see Appendix S. Aspects offeasibility, other than economic, must also be considered at this point. An excellent set ofreferences is provided within online benefit-cost guides:
• One is under development at the following site, maintained by the American Society ofCivil Engineers: http://ceenve.calpoly.edu/sullivan/cutep/cutep_bc_outline_main.htm
• The other is Guide to Benefit-Cost Analysis in Transport Canada, September 1994,http://www.tc.gc.ca/finance/bca/en/TOC_e.htm. An overall summary of thisdocument is given in Appendix V.
In some cases, a strategy or program may look promising, but no evidence may be availableas to its likely effectiveness. This would be especially true for innovative methods or use ofemerging technologies. In such cases, it may be advisable to plan a pilot study to arrive at aminimum level of confidence in its effectiveness, before large-scale investment is made or alarge segment of the public is involved in something untested.
It is at this stage of detailed analysis that the crash reduction goals, set in Step 3, may berevisited, with the possibility of modification.
It is important that this step be conducted with the full participation of the stakeholders. If theprevious steps were followed, the working group will have the appropriate representation.Technical assistance from more than one discipline may be necessary to go through more complex issues. Group consensus will be important on areas such as estimates ofeffectiveness, as well as the rating and ranking of alternatives. Techniques are available toassist in arriving at consensus. For example, see the following Web site for an overview:http://web.mit.edu/publicdisputes/practices/cbh ch1.html.
VI-15
Specific Elements1. Assess feasibility
1.1. Human resources1.2. Special constraints1.3. Legislative requirements1.4. Other1.5. This is often done in a qualitative way, to narrow the list of choices to be
studied in more detail (see, for example, Appendix BB)2. Estimate values for each of the performance measures for each strategy and plan
2.1. Estimate costs and impacts 2.1.1. Consider guidelines provided in the detailed description of strategies
in this material2.1.2. Adjust as necessary to reflect local knowledge or practice 2.1.3. Where a plan or program is being considered that includes more than
one strategy, combine individual estimates 2.2. Prepare results for cost-benefit and/or cost-effectiveness analyses2.3. Summarize the estimates in both disaggregate (by individual strategy) and
aggregate (total for the program) form3. Conduct a cost-benefit and/or cost-effectiveness analysis to identify inefficient, as well as
dominant, strategies and programs and to establish a priority for the alternatives3.1. Test for dominance (both lower cost and higher effectiveness than others)3.2. Estimate relative cost-benefit and/or cost-effectiveness3.3. Test productivity
4. Develop a report that documents the effort, summarizing the alternatives considered and presenting a preferred program, as devised by the working group (for suggestionson a report of a benefit-cost analysis, see Appendix U).
4.1. Designed for high-level decision makers, as well as technical personnel whowould be involved in the implementation
4.2. Extensive use of graphics and layout techniques to facilitate understandingand capture interest
4.3. Recommendations regarding meeting or altering the crash reduction goalsestablished in Step 3.
SECTION VI—GUIDANCE FOR IMPLEMENTATION OF THE AASHTO STRATEGIC HIGHWAY SAFETY PLAN
VI-16
SECTION VI—GUIDANCE FOR IMPLEMENTATION OF THE AASHTO STRATEGIC HIGHWAY SAFETY PLAN
Implementation Step 7: Submit Recommendations for Actionby Top Management
General Description The working group has completed the important planning tasks and must now submit theresults and conclusions to those who will make the decision on whether to proceed further.Top management, at this step, will primarily be determining if an investment will be madein this area. As a result, the plan will not only be considered on the basis of its merits forsolving the particular problems identified in this emphasis area (say, vis-à-vis otherapproaches that could be taken to deal with the specific problems identified), but also itsrelative value in relation to investments in other aspects of the road safety program.
This aspect of the process involves using the best available communication skills toadequately inform top management. The degree of effort and extent of use of media shouldbe proportionate to the size and complexity of the problem being addressed, as well as thedegree to which there is competition for funds.
The material that is submitted should receive careful review by those with knowledge inreport design and layout. In addition, today’s technology allows for the development ofautomated presentations, using animation and multimedia in a cost-effective manner.Therefore, programs involving significant investments that are competing strongly forimplementation resources should be backed by such supplementary means forcommunicating efficiently and effectively with top management.
Specific Elements1. Submit recommendations for action by management
1.1. “Go/no-go” decision1.2. Reconsideration of policies, guidelines, and specifications (see Step 3)1.3. Modification of the plan to accommodate any revisions to the program
framework made by the decision makers2. Working group to make presentations to decision makers and other groups, as needed
and requested3. Working group to provide technical assistance with the review of the plan, as requested
3.1. Availability to answer questions and provide further detail3.2. Assistance in conducting formal assessments
VI-17
Implementation Step 8: Develop a Plan of Action
General DescriptionAt this stage, the working group will usually detail the program that has been selected forimplementation. This step translates the program into an action plan, with all the detailsneeded by both decision makers, who will have to commit to the investment of resources,and those charged with carrying it out. The effort involves defining resource requirements,organizational and institutional arrangements needed, schedules, etc. This is usually done inthe form of a business plan, or plan of action. An example of a plan developed by a localcommunity is shown in Appendix X.
An evaluation plan should be designed at this point. It is an important part of the plan. Thisis something that should be in place before Step 9 is finished. It is not acceptable to wait untilafter the program is completed to begin designing an evaluation of it. This is because dataare needed about conditions before the program starts, to allow comparison with conditionsduring its operation and after its completion. It also should be designed at this point, toachieve consensus among the stakeholders on what constitutes “success.” The evaluation isused to determine just how well things were carried out and what effect the program had.Knowing this helps maintain the validity of what is being done, encourages future supportfrom management, and provides good intelligence on how to proceed after the program iscompleted. For further details on performing evaluations, see Appendix L, Appendix M, andAppendix W.
The plan of action should be developed jointly with the involvement of all desiredparticipants in the program. It should be completed to the detail necessary to receive formalapproval of each agency during the next step. The degree of detail and complexity requiredfor this step will be a function of the size and scope of the program, as well as the number ofindependent agencies involved.
Specific Elements 1. Translation of the selected program into key resource requirements
1.1. Agencies from which cooperation and coordination is required1.2. Funding1.3. Personnel1.4. Data and information1.5. Time1.6. Equipment1.7. Materials1.8. Training1.9. Legislation
2. Define organizational and institutional framework for implementing the program2.1. Include high-level oversight group2.2. Provide for involvement in planning at working levels2.3. Provide mechanisms for resolution of issues that may arise and disagreements
that may occur2.4. Secure human and financial resources required
SECTION VI—GUIDANCE FOR IMPLEMENTATION OF THE AASHTO STRATEGIC HIGHWAY SAFETY PLAN
VI-18
SECTION VI—GUIDANCE FOR IMPLEMENTATION OF THE AASHTO STRATEGIC HIGHWAY SAFETY PLAN
3. Detail a program evaluation plan3.1. Goals and objectives3.2. Process measures3.3. Performance measures
3.3.1. Short-term, including surrogates, to allow early reporting of results3.3.2. Long-term
3.4. Type of evaluation3.5. Data needed3.6. Personnel needed3.7. Budget and time estimates
4. Definition of tasks to conduct the work4.1. Develop diagram of tasks (e.g., PERT chart)4.2. Develop schedule (e.g., Gantt chart)4.3. For each task, define
4.3.1. Inputs4.3.2. Outputs4.3.3. Resource requirements4.3.4. Agency roles4.3.5. Sequence and dependency of tasks
5. Develop detailed budget5.1. By task5.2. Separate by source and agency/office (i.e., cost center)
6. Produce program action plan, or business plan document
VI-19
Implementation Step 9: Establish Foundations forImplementing the Program
General DescriptionOnce approved, some “groundwork” is often necessary to establish a foundation forcarrying out the selected program. This is somewhat similar to what was done in Step 4. Itmust now be done in greater detail and scope for the specific program being implemented.As in Step 4, specific policies and guidelines must be developed, organizational andinstitutional arrangements must be initiated, and an infrastructure must be created for theprogram. The business plan or action plan provides the basis (Step 7) for this. Once again,the degree of complexity required will vary with the scope and size of the program, as wellas the number of agencies involved.
Specific Elements1. Refine policies and guidelines (from Step 4)2. Effect required legislation or regulations3. Allocate budget4. Reorganize implementation working group5. Develop program infrastructure
5.1. Facilities and equipment for program staff5.2. Information systems5.3. Communications5.4. Assignment of personnel5.5. Administrative systems (monitoring and reporting)
6. Set up program assessment system6.1. Define/refine/revise performance and process measures6.2. Establish data collection and reporting protocols6.3. Develop data collection and reporting instruments6.4. Measure baseline conditions
SECTION VI—GUIDANCE FOR IMPLEMENTATION OF THE AASHTO STRATEGIC HIGHWAY SAFETY PLAN
VI-20
SECTION VI—GUIDANCE FOR IMPLEMENTATION OF THE AASHTO STRATEGIC HIGHWAY SAFETY PLAN
Implementation Step 10: Carry Out the Action Plan
General DescriptionConditions have been established to allow the program to be started. The activities ofimplementation may be divided into activities associated with field preparation forwhatever actions are planned and the actual field implementation of the plan. The activitiescan involve design and development of program actions, actual construction or installationof program elements, training, and the actual operation of the program. This step alsoincludes monitoring for the purpose of maintaining control and carrying out mid- and post-program evaluation of the effort.
Specific Elements1. Conduct detailed design of program elements
1.1. Physical design elements1.2. PI&E materials1.3. Enforcement protocols1.4. Etc.
2. Conduct program training3. Develop and acquire program materials4. Develop and acquire program equipment5. Conduct pilot tests of untested strategies, as needed6. Program operation
6.1. Conduct program “kickoff”6.2. Carry out monitoring and management of ongoing operation
6.2.1. Periodic measurement (process and performance measures)6.2.2. Adjustments as required
6.3. Perform interim and final reporting
VI-21
Implementation Step 11: Assess and Transition the Program
General DescriptionThe AASHTO Strategic Highway Safety Plan includes improvement in highway safetymanagement. A key element of that is the conduct of properly designed programevaluations. The program evaluation will have been first designed in Step 8, which occursprior to any field implementation. For details on designing an evaluation, please refer toStep 8. For an example of how the New Zealand Transport Authority takes this step as animportant part of the process, see Appendix N.
The program will usually have a specified operational period. An evaluation of both theprocess and performance will have begun prior to the start of implementation. It may alsocontinue during the course of the implementation, and it will be completed after theoperational period of the program.
The overall effectiveness of the effort should be measured to determine if the investmentwas worthwhile and to guide top management on how to proceed into the post-program period. This often means that there is a need to quickly measure programeffectiveness in order to provide a preliminary idea of the success or need for immediatemodification. This will be particularly important early in development of the AASHTOStrategic Highway Safety Plan, as agencies learn what works best. Therefore, surrogates forsafety impact may have to be used to arrive at early/interim conclusions. These usuallyinclude behavioral measures. This particular need for interim surrogate measures should bedealt with when the evaluation is designed, back in Step 8. However, a certain period,usually a minimum of a couple of years, will be required to properly measure theeffectiveness and draw valid conclusions about programs designed to reduce highwayfatalities when using direct safety performance measures.
The results of the work is usually reported back to those who authorized it and thestakeholders, as well as any others in management who will be involved in determining thefuture of the program. Decisions must be made on how to continue or expand the effort, if atall. If a program is to be continued or expanded (as in the case of a pilot study), the results ofits assessment may suggest modifications. In some cases, a decision may be needed toremove what has been placed in the highway environment as part of the program because ofa negative impact being measured. Even a “permanent” installation (e.g., rumble strips)requires a decision regarding investment for future maintenance if it is to continue to beeffective.
Finally, the results of the evaluation using performance measures should be fed back into aknowledge base to improve future estimates of effectiveness.
Specific Elements1. Analysis
1.1. Summarize assessment data reported during the course of the program1.2. Analyze both process and performance measures (both quantitative and
qualitative)
SECTION VI—GUIDANCE FOR IMPLEMENTATION OF THE AASHTO STRATEGIC HIGHWAY SAFETY PLAN
VI-22
SECTION VI—GUIDANCE FOR IMPLEMENTATION OF THE AASHTO STRATEGIC HIGHWAY SAFETY PLAN
1.3. Evaluate the degree to which goals and objectives were achieved (usingperformance measures)
1.4. Estimate costs (especially vis-à-vis pre-implementation estimates)1.5. Document anecdotal material that may provide insight for improving future
programs and implementation efforts1.6. Conduct and document debriefing sessions with persons involved in the
program (including anecdotal evidence of effectiveness and recommendedrevisions)
2. Report results3. Decide how to transition the program
3.1. Stop3.2. Continue as is3.3. Continue with revisions3.4. Expand as is3.5. Expand with revisions3.6. Reverse some actions
4. Document data for creating or updating database of effectiveness estimates
VI-23
VII-1
SECTION VII
Key References
American Association of State Highway and Transportation Officials. A Policy on GeometricDesign of Highways and Streets. Washington, D.C., 1994.
American Association of State Highway and Transportation Officials. A Policy on GeometricDesign of Highways and Streets. Washington, D.C., 2001.
American Association of State Highway and Transportation Officials. Task Force Right-Turn-on-Red. Safety and Delay Impacts of Right-Turn-on-Red. Washington, DC, 1979.
American Society for Testing and Materials. Standard No. ASTM1501-99e1, StandardSpecification for Nighttime Photometric Performance of Retroreflective Pedestrian Markings forVisibility Enhancement. West Conshohocken, PA, 2003. For access to ASTM standards, visitthe ASTM website, www.astm.org.
Bentzen, B., J. Barlow, and L. Franck. Addressing Barriers to Blind Pedestrians at SignalizedIntersections. ITE Journal, September 2000.
Bentzen, B. L., and L.S. Tabor. Accessible Pedestrian Signals. The Access Board. Washington,D.C., 1998: Available online at http://www.access-board.gov/research&training/pedsignals/pedestrian.htm (last accessed April 23, 2004).
Blomberg, R.D., A. Hale and D.F. Preusser. Conspicuity for Pedestrians and Bicyclists: Definitionof the Problem, Development and Test of Countermeasures. Report No. DOT HS 806 563. NHTSA.Washington, D.C., 1984.
Blomberg, R.D., D.F. Preusser, A. Hale, and W.A. Leaf. Experimental Field Test of ProposedPedestrian Safety Messages. Highway Traffic Safety Administration, Washington, D.C., 1983.
Bowman, B.L., J.J. Fruin, and C.V. Zegeer. Planning, Design, and Maintenance of PedestrianFacilities, Report No. FHWA-IP-88-019, Federal Highway Administration, 1988.
Bowman, B.L., and R.L. Vecellio. Effects of Urban and Suburban Median Types on BothVehicular and Pedestrian Safety. Transportation Research Record 1445. TRB, National ResearchCouncil, Washington, D.C., 1994, pp. 169-179.
Britt, J., A. Bergman, and J. Moffat. Law Enforcement, Pedestrian Safety, and DriverCompliance with Crosswalk Laws: Evaluation of a Four-Year Campaign in Seattle.Transportation Research Record 1485. TRB, National Research Council, Washington, D.C., 1995.
Bronx ‘Safe Routes To School’ Campaign Blazes New Path, Transportation AlternativesMagazine, September/October 1998, pp. 12-13. Available online at http://www.transalt.org/press/magazine/985SepOct/12-13saferoutes.html (last accessed April 6, 2004).
Brownfield, D.J. Environmental Areas: Interim Report on a Before-After Accident Study,Traffic Engineering and Control, Vol. 21, No. 5, May 1980.
SECTION VII—KEY REFERENCES
VII-2
Campbell, B., C. Zegeer, H. Huang, and M. Cynecki. Pedestrian Safety Research in the U.S.Federal Highway Administration, Washington, D.C., 1999.
Campbell, B., C. Zegeer, H. Huang, and M. Cynecki. A Review of Pedestrian Safety Research inthe U.S. Submitted to Federal Highway Administration, March 2002.
Carroll, J., and B. Bentzen. American Council of the Blind Survey of Signalized IntersectionAccessibility. The Braille Forum, Volume 38, 1999, pp. 11-15.
Centre D’Études Techniques de l’Equipment de l’Ouest. Evolution de la Sécurité Sur LesCarrefours Giratoires. Centre D’Etudes Techniques de l’Equipment de l’Ouest, Nantes,France. 1986.
City of Cambridge, MA. Preliminary Results: Effects of Columbia Street Traffic Calming Projecton Driver Behavior, 2000.
Clarke, A., and M.J. Dornfeld. Traffic Calming, Auto-Restricted Zones and Other TrafficManagement Techniques - Their Effects on Bicycling and Pedestrians. Case Study No. 19. NationalBicycling and Walking Study. Publication No. FHWA-PD-93-028. Federal HighwayAdministration, Washington, DC. January 1994.
Cleven, A.M., and R.D. Blomberg. Incorporating Consideration of Bicyclists and Pedestrians intoEducation Programs. Case Study #12 for the National Bicycling and Walking Study. FHWA-PD-92-036. U.S. Department of Transportation, 1992.
Cline, E. Design of Speed Humps...Or The Kinder, Gentler Speed Hump. Presented at the45th California Symposium on Transportation Issues. May 12-14, 1993.
Duperrex, O., I. Roberts, and F. Bunn. Safety Education of Pedestrians for Injury Prevention.(Cochrane Review). The Cochrane Library, 2, 2002.
Engwicht, D. What Is Second-Generation Traffic-Calming? Creative CommunitiesInternational. Available online at http://www.lesstraffic.com/Articles/Traffic/SGTC.htm(last accessed April 06, 2004).
Federal Highway Administration. An Evaluation of High-Visibility Crosswalk Treatments—Clearwater, Florida. M. Nitzburg and R. L. Knoblauch. McLean, VA, 2001. Available online at http://www.walkinginfo.org/task_orders/to_11/clearwtr.PDF (last accessedApril 23, 2004).
Federal Highway Administration. Designing Sidewalks and Trails for Access. Part I of II: Review of Existing Guidelines and Practices. P.W. Axelson, D.A. Chesney, D.V. Galvan, J.B.Kirschbaum, P.E. Longmuir, C. Lyons, and K.M. Wong. FHWA, Washington, D.C., 1999.Available online at http://www.fhwa.dot.gov/environment/bikeped/access-1.htm (lastaccessed June 10, 2004).
Federal Highway Administration. Designing Sidewalks and Trails for Access. Part II of II: Review of Existing Guidelines and Practices. J.B. Kirschbaum, P.W. Axelson, P.E. Longmuir,K.M. Mispagel, J.A. Stein, and D.A. Yamada. FHWA, Washington, D.C., 2001. Availableonline at http://www.fhwa.dot.gov/environment/sidewalk2/ (last accessed June 10, 2004).
SECTION VII—KEY REFERENCES
Federal Highway Administration. Manual on Uniform Traffic Control Devices for Streets andHighways (MUTCD). Report No. FHWA-SA-89-006. Washington, DC, 2000a.
Federal Highway Administration. Manual on Uniform Traffic Control Devices for Streets and Highways. FHWA. Washington, D.C. 2003.
Federal Highway Administration. The Effects of Innovative Pedestrian Signs at UnsignalizedLocations: A Tale of Three Treatments. Huang H.F., C.V. Zegeer, R. Nassi, and B. Fairfax.McLean, VA, 2000b. Available online at http://www.walkinginfo.org/task_orders/to_11/3signs00.pdf (last accessed April 23, 2004).
Federal Highway Administration. Pedestrian Facilities User Guide: Providing Safety andMobility. Zegeer, C., C. Seiderman, P. Lagerwey, M. Cynecki, M. Ronkin, and R. Schneider.McLean, VA, 2002. Available online at http://www.walkinginfo.org/pdf/peduserguide/peduserguide.pdf. (last accessed April 23, 2004).
Federal Highway Administration. Pedestrian/Bicyclist Safety Resource Set (CD-ROM).FHWA-SA-00-005. U.S. Department of Transportation, FHWA, 2000c. Ordering informationavailable at http://safety.fhwa.dot.gov/fourthlevel/newprod.htm.
Federal Highway Administration. Pedestrian/Bicyclist Crash Analysis Tool. Softwaredescription and ordering information available online at http://www.walkinginfo.org/pc/pbcat.htm.
Federal Highway Administration Pedestrian Safety Web site. Available online athttp://www.fhwa.dot.gov/safety/fourthlevel/ped.htm.
Florida Department of Transportation. Florida School Crossing Guard Training Guidelines.Available online at http://www.dot.state.fl.us/Safety/ped_bike/brochures/pdf/xingguard.pdf.
Freedman, M., M.S. Janoff, B.W. Koth, and W. McCunney. Fixed Illumination for PedestrianProtection. Report No. FHWA-RD-76-8, Federal Highway Administration, 1975.
Gårder, Per. Pedestrian Safety at Traffic Signals. Accident Analysis and Prevention. Vol. 21, No.5, 1989, pp. 435-444.
Gliewe R., M. Limbourg, and B. Pappritz. German Examples of Safer Routes to School. Paperpresented at the Road Safety Education Conference in York, United Kingdom, June 1998.Available online at http://www.uni-essen.de/~qpd400/texte.ml/york.html (last accessedApril 7, 2004).
Greatrix, G., and J. Smithies. Factors Which Affect the Conspicuity of Pedestrians. Availableonline at http://www.spods.co.uk/~greatrix/Pubs2.htm (last accessed April 23, 2004).
Harkey, D., J. Mekemson, M. Chen, and K. Krull, Pedestrian and Bicycle Crash Analysis Tool(PBCAT) User’s Manual. Report No. FHWA-RD-99-192. FHWA. Washington, DC, June 2000.
Hawley, L., C. Henson, A. Hulse, and R. Brindle. Towards Traffic Calming: A Practitioners’Manual of Implemented Local Area Traffic Management and Blackspot Devices. Publication No. CR126. Federal Office of Road Safety. Canberra, Australian Capital Territory, Australia. 1992.
VII-3
Hoxie, R.E., L.Z. Rubenstein, H. Hoenig, and B.R. Gallagher, The Older Pedestrian. Journal ofthe American Geriatric Society, Vol. 42, No. 4, 1994, pp. 444-450.
Hu, P.F. and J. Young. 1990 Nationwide Personal Transportation Survey: Summary of TravelTrends. Report No. FHWA-PL-92-027. Washington, D.C. U.S. DOT, FHWA, March 1992.Available at http://npts.ornl.gov/npts/1990/.
Hu, P.F. and J. Young. 1990 NPTS Databook. Nationwide Personal Transportation Survey. ReportNo. FHWA-PL-94-010A.Washington, D.C. U.S. DOT, FHWA, November 1993.
Huang, H., and C. Zegeer. The Effects of Pedestrian Countdown Signals in Lake Buena Vista.Prepared for the Florida Department of Transportation, November 2000.
Hughes, R., H. Huang, C. Zegeer, and M. Cynecki. Evaluation of Automated PedestrianDetection at Signalized Intersections. Report No. FHWA-RD-00-097. Federal HighwayAdministration, McLean, VA, 2000.
Hunter, W., J. Stutts, W. Pein, and C. Cox. Pedestrian and Bicycle Crash Types of the Early 1990’s,Report No. FHWA-RD-95-163. Federal Highway Administration. Washington, D.C., 1995.
Institute of Transportation Engineers. Alternative Treatments for At-Grade Pedestrian Crossings.N. Lalani and the ITE Pedestrian and Bicycle Task Force. Institute of TransportationEngineers, Washington, D.C., 2001a.
Institute of Transportation Engineers. Design and Safety of Pedestrian Facilities: A RecommendedPractice. Institute of Transportation Engineers, Washington, D.C., March 1998.
Institute of Transportation Engineers. Guidelines for Prohibition of Turns on Red. ITEJournal, Vol. 54, No. 2, February 1984, pp. 17-19.
Institute of Transportation Engineers. Traditional Neighborhood Development Street DesignGuidelines: Recommended Practice. Institute of Transportation Engineers, Washington, D.C., 1999.
Institute of Transportation Engineers, Federal Highway Administration. Traffic Calming:State of the Practice. Institute of Transportation Engineers, Washington, D.C., August 1999.
Institute of Transportation Engineers. Pedestrians. In Chapter 13, Traffic Control DevicesHandbook, 2001, J. Pline, ed. Institute of Transportation Engineers, Washington, D.C., 2001b.
Insurance Institute for Highway Safety. Three-Second Head Start Gives PedestriansAdvantage at Intersections. Status Report, Vol. 32, No. 7, August 30, 1997, p.5.
Jacquemart, G. NCHRP Synthesis 264: Modern Roundabout Practice in the United States.National Cooperative Highway Research Program. Synthesis of Highway Practice 264. TRB,National Research Council, Washington, D.C., 1998.
Japan Road Association. Accident Prevention Effects of Road Safety Devices: Annual Report. 1969.
Karplus, K. Guidelines for Choosing a Safe Bicycle Route to School. Available online athttp://www.cse.ucsc.edu/~karplus/bike/safe-route-to-school.html (last accessed April 06, 2004).
SECTION VII—KEY REFERENCES
VII-4
SECTION VII—KEY REFERENCES
Klik, M., and A. Faghri. A Comparative Evaluation of Speed Humps and Deviations.Transportation Quarterly. Vol. 47, No. 3, July 1993, pp. 457-469.
Knoblauch, R.L., B.H. Tustin, S.A. Smith, and M.T. Pietrucha. Investigation of Exposure-BasedPedestrian Accident Areas: Crosswalks, Sidewalks, Local Streets, and Major Arterials. Report No.FHWA/RD-87-038. Federal Highway Administration, Washington, D.C., 1987.
Loughery, D.A., and M. Katzman. Montgomery County, Maryland Speed Hump ProgramEvaluation Report. Prepared for presentation to the Montgomery County Council. January 1998.
Lovemark, O. Pedestrians in Town Centers: A Summary of Some Research Projects. PedestrianSafety Project Report No. 27, North American Treaty Organization Committee on theChallenge of Modern Society, National Highway Traffic Safety Administration, March 1974.
Macbeth, A. Balliol Street. In Traffic Calming 1995. Proceedings from 21 papers. OntarioTraffic Conference. November 1995.
Malenfant, L., and R. Van Houten. Increasing the Percentage of Drivers Yielding toPedestrians in Three Canadian Cities with a Multifaceted Safety Program. Health EducationResearch. Vol. 5, 1989, pp. 274-279.
McDonald, P.E., and J.R. Jarvis. The Use of Road Humps on Residential Streets in the Shire ofCorio. ARRB Internal Report. AIR 335-2. Australian Road Research Board. 1981.
McGee, H.W. Accident Experience with Right-Turn-on-Red. Transportation Research Record644. TRB, National Research Council, Washington, D.C., 1976, pp. 66-75.
McMahon, P.J., A.J. Khattak, C. Duncan, J.R. Stewart, and C.V. Zegeer. An Analysis ofFactors Contributing to “Walking along Roadway” Crashes: Research Study and Guidelines for Sidewalks and Walkways. Report No. FHWA-RD-01-101. Federal HighwayAdministration, 2002.
Moore, R.I., and Older, S.J., Pedestrians and Motorists are Compatible in Today’s World.Traffic Engineering, Institute of Transportation Engineers, Washington, D.C., 1965.
National Highway Traffic Safety Administration. Fatal Accident Reporting System 1989: ADecade of Progress. Washington D.C., 1990a.
National Highway Traffic Safety Administration. General Estimates System 1989: A Review ofInformation on Police-Reported Traffic Crashes in the United States. Washington, D.C., 1990b.
National Highway Traffic Safety Administration. National Drunk and Drugged Driving (3D)Prevention Month Program Planner. Available online at http://www.nhtsa.dot.gov/people/outreach/safesobr/17qp/contents.html.
National Highway Traffic Safety Administration. Pedestrian Safety: The Identification ofPrecipitating Factors and Possible Countermeasures. Report No. FH-11-73/2. Washington, DC, 1971.
National Highway Traffic Safety Administration. Pedestrian Safety Toolkit. 1999. User Manual,1998; Resource Catalog, 1998. Available online at http://safety.fhwa.dot.gov/fourthlevel/pdf/G014-031ResourceCatalog.pdf.
VII-5
National Highway Traffic Safety Administration. Traffic Safety Facts. National HighwayTraffic Safety Administration, Washington, D.C., 2000.
National Highway Traffic Safety Administration. Zone Guide for Pedestrian Safety ShowsHow to Make Systematic Improvements. Traffic Tech, No. 181, May 1998. Available online athttp://safety.fhwa.dot.gov/fourthlevel/crashtype_p.htm.
National Highway Traffic Safety Administration Region 9 Pedestrian and Bicycle SafetyWeb site. Available at http://www.nhtsa.dot.gov/nhtsa/whatis/regions/Region09/09pedbike.html, 5 February 2004.
Nee, J., and M.E Hallenbeck. A Motorist and Pedestrian Behavioral Analysis Relating toPedestrian Safety Improvements. Final Report. Research Project T1803, Task 16 PedestrianSafety Prepared for the Washington State Transportation Commission by the WashingtonState Transportation Center. 2003.
NHTSA Web site. Fatality Analysis Reporting System (FARS). Available online athttp://www-fars.nhtsa.dot.gov/main.cfm (last accessed April 23, 2004).
Owens, D.A., R.J. Antonoff, and E.L. Francis. Biological Motion and Nighttime PedestrianConspicuity. Human Factors, Vol. 36, No. 4, 1994, pp. 718, 732.
Pegrum, B.V. The Application of Certain Traffic Management Techniques and Their Effect on RoadSafety. National Road Safety Symposium, March 1972.
Planning Division. Median Handbook. Florida Department of Transportation, Tallahassee, FL,1997. Available online at http://www.dot.state.fl.us/planning/systems/sm/accman/pdfs/mhb_2.pdf (last accessed April 23, 2004).
Polus, A., and A. Katz. An Analysis of Nighttime Pedestrian Accidents at SpeciallyIlluminated Crosswalks. Accident Analysis and Prevention, Vol. 10, No. 3, September 1978.
Preusser, D.F., W.A. Leaf, K.B. Debartla, and R.D. Blomberg. The Effects of Right-Turn-on-Redon Pedestrian and Bicycle Accidents. Report No. NHTSA-DOT/HS-806/182. Dunlap andAssociates, Inc., Darien, Connecticut, 1981.
Preusser, D.F., and A.K. Lund. And Keep on Looking: A Film To Reduce Pedestrian CrashesAmong 9 to 12 Year Olds. Journal of Safety Research, 19(4), 1988, pp. 177-195.
Pucher, J., and L. Dijkstra. Making Walking and Cycling Safety: Lessons from Europe.Transportation Quarterly 54(3), 25-50. Summer 2000.
Replogle, Michael. Bicycle and Pedestrian Policies and Programs in Asia, Australia, and NewZealand. Case Study 17. National Bicycling and Walking Study. Report No. FHWA-PD-93-016. Federal Highway Administration. Washington, D.C., April 1992.
Reschovsky, C. Journey to Work: 2000. Census 2000 Brief. US Department of Commerce, CensusBureau, Washington, D.C., March 2004. Available online at http://www.census.gov/prod/2004pubs/c2kbr-33.pdf (last accessed April 23, 2003).
Richardson, E., and J.R. Jarvis. The Use of Road Humps on Residential Streets in the City ofStirling, Western Australia. ARRB Internal Report. AIR 335-3. Australian Road ResearchBoard. 1981.
SECTION VII—KEY REFERENCES
VII-6
SECTION VII—KEY REFERENCES
Roberts, I., T. Ashton, R. Dunn, and T. Lee-Joe. Preventing Child Pedestrian Injury:Pedestrian Education or Traffic Calming? Australian Journal of Public Health, Vol. 18, 1994, pp.209-212.
Schieber, R.A., and M.E. Vegega. National Strategies for Advancing Child Pedestrian Safety.Centers for Disease Control and Prevention and National Highway Traffic SafetyAdministration, October 2001. Available online at http://www.cdc.gov/ncipc/pedestrian/.
Schieber, R.A., and M.E.Vegega, eds. Reducing Childhood Pedestrian Injuries: Summary of aMultidisciplinary Conference. Injury Prevention, Supplement I, 8, June 2002.
Schoon, C., and J. van Minnen. The Safety of Roundabouts in the Netherlands. SWOV Institutefor Road Safety Research. Traffic Engineering and Control. 1994.
Shankar, U. Pedestrian Roadway Fatalities. National Highway Traffic Safety Administration.Report No. DOT HS 809 456. Washington, D.C., 2003. Available online at http://www-nrd.nhtsa.dot.gov/pdf/nrd-30/NCSA/Rpts/2003/809-456.pdf (last accessed April 23, 2004).
Snyder, M.B., and R.L. Knoblauch. Pedestrian Safety: The Identification of Precipitating Factors andPossible Countermeasures. Report No. DOT-FH-11-7312. U.S. Department of Transportation,Washington, D.C., 1971.
Troutbeck, R.J. Capacity and Design of Roundabouts in Australia. Transportation ResearchRecord 1398. TRB, National Research Council, Washington, D.C., 1993, pp. 68-74.
U.K. Department of Transport. Killing Speed and Saving Lives. London. 1987.
U.S. Access Board and the Federal Highway Administration. Accessible Rights-of-Way: ADesign Guide. Washington, D.C. Available online at http://www.access-board.gov/publications/PROW%20Guide/PROWGuide.htm (last accessed May 19, 2004).
U.S. Department of Transportation, 1995 Nationwide Personal Transportation Survey. Bureau ofTransportation Statistics, Washington, D.C., 1995.
U.S. Department of Transportation. National Bicycling and Walking Study Five Year StatusReport. Federal Highway Administration, Washington, D.C., 1999.
U.S. Department of Transportation, Federal Highway Administration, National Bicycling andWalking Study: Case Study No. 12, Incorporating Consideration of Bicyclists and Pedestrians intoEducation Programs. Publication No. FHWA 343 120, 85904. Washington, D.C., 1993.
University of Michigan Transportation Research Institute. The Institute has listed severalreferences on pedestrian visibility on their Web site at http://www.umich.edu/~industry/pedvis.html.
Van Houten, R., B. Blasch, and J.E.L. Malenfant. Use of Animated Eyes in Pedestrian SignalsIncreases WALK Sign Recognition Distance of Low Vision Pedestrians. Journal ofRehabilitation Research and Development, Vol. 38, 2001a, pp. 443-448.
Van Houten, R., K. Healey, J.E. Malenfant, and R.A. Retting. Use of Signs and 1999 Symbols toIncrease the Efficacy of Pedestrian Activated Flashing Beacons at Crosswalks. TransportationResearch Record 1638. TRB, National Research Council, Washington, D.C., 1999a, pp. 92-95.
VII-7
Van Houten, R., and Malenfant, L. The Influence of Signs Prompting Motorists to Yield 50 feet (15.5 m) before Marked Crosswalks on Motor Vehicle-Pedestrian Conflicts atCrosswalks with Pedestrian Activated Flashing Lights. Accident Analysis and Prevention, 24,1992, pp. 217-225.
Van Houten, R., J. Malenfant, J. Van Houten, and R. Retting. Using Auditory PedestrianSignals to Reduce Pedestrian and Vehicle Conflicts. Transportation Research Record 1578. TRB,National Research Council, Washington, D.C., 1997.
Van Houten, R., and Malenfant, J.E.L. ITS Animated LED Signals Alert Drivers to PedestrianThreats. ITE Journal, 71, 2001, pp. 42-47.
Van Houten, R., J.E.L. Malenfant, and R. Steiner. Scanning “Eyes” Symbol as Part of theWALK Signal: Examination Across Several Intersection Geometries and Timing Parameters.Transportation Research Record 1773, 2001b, pp. 75-81.
Van Houten, R., D. McCusker, S. Huybers, J.E.L. Malenfant, and D. Rice-Smith. AdvanceYield Markings and Fluorescent Yellow Green Ra 4 Signs at Crosswalks with UncontrolledApproaches. Transportation Research Record 1818. TRB, National Research Council,Washington, D.C., 2003, pp. 119-124.
Van Houten, R., McCusker, D., and Malenfant, J.E.L. (2001). Advance Yield Markings:Reducing Motor Vehicle-Pedestrian Conflicts at Multilane Crosswalks with UncontrolledApproach. Transportation Research Record 1773. TRB, National Research Council, Washington,D.C., 2001c, pp. 69-74.
Van Houten, R., R.A. Retting, J. Van Houten, C.M. Farmer, and J.E.L. Malenfant. Use ofAnimation in LED Pedestrian Signals to Improve Pedestrian Safety. ITE Journal, Vol. 69,1999b, pp. 30-38
Van Schagen, I., ed. Traffic Calming Schemes: Opportunities and Implementation Strategies.Report No. R-2003-22. SWOV Institute for Road Safety Research. Leidschendam, TheNetherlands, 2003. Available online at www.swov.nl (last accessed April 23, 2004).
Walter, C. E. Suburban Residential Traffic Calming. ITE Journal, Vol. 65, No. 9, September1995, pp. 44-48.
Zegeer, C.V. The National Bicycling and Walking Study: Transportation Choices for a ChangingAmerica. Final Report. USDOT, FHWA. Washington, D.C., 1994.
Zegeer, C.V., and M.J. Cynecki. Methods of Increasing Pedestrian Safety at Right-Turn-on-RedIntersections, Final Report. Report No. FHWA/IP-86/10, Federal Highway Administration,Washington, D.C., 1986.
Zegeer, C., J.H. Havens, and R. Deen. Speed Reductions in School Zones. TransportationResearch Record 597. TRB, National Research Council, Washington, D.C., 1978, pp. 39-40.
Zegeer, C.V., K.S. Opiela, and M.J. Cynecki. Pedestrian Signalization Alternatives. Report No.FHWA/RD-83/102. Federal Highway Administration, Washington, D.C., 1983.
SECTION VII—KEY REFERENCES
VII-8
SECTION VII—KEY REFERENCES
Zegeer, C.V., K.S. Opiela, and M.J. Cynecki. Effect of Pedestrian Signals and Signal Timingon Pedestrian Accidents. Transportation Research Record 847, TRB, National Research Council,Washington, D.C., 1982, pp. 62-72.
Zegeer, C.V., J.R. Stewart, H.F. Huang, and P.A. Lagerwey. Safety Effects of Marked vs.Unmarked Crosswalks at Uncontrolled Locations - Executive Summary and RecommendedGuidelines. Report No. FHWA-RD-01-075. Federal Highway Administration, McLean, VA,March 2002, http://www.walkinginfo.org/pdf/r&d/crosswalk_021302.pdf.
Zegeer, C., J. Stutts, and W. Hunter. Pedestrian and Bicycle, Volume VI: Safety Effectiveness ofHighway Design Features. Report No. FHWA-RD-91-049. FHWA, Washington, DC, 1992.
Zegeer, C., J. Stutts, H. Huang, M. Zhou, and E. Rodgman. Analysis of Elderly PedestrianAccidents and Recommended Countermeasures. Transportation Research Record 1405. TRB,National Research Council, Washington, DC, 1993, pp. 56-63.
VII-9
A-1
Appendixes
The following appendixes are not published in this report. However, they are available online athttp://transportation1.org/safetyplan..
1 Matrix of Pedestrian Crash Types and Corresponding Strategies2 PEDSAFE Case Studies Available On-Line3 Triple E Committees4 Countermeasures Used to Prevent Pedestrian Alcohol Deaths5 Guidelines for Sidewalk and Curb Ramp Design6 Guidelines for New Sidewalk and Walkway Installation7 Typical Costs for Sidewalks and Curb Ramps8 Costs of Typical Traffic and Pedestrian Signal Upgrades9 Costs of Typical Pedestrian Refuge Islands and Raised Medians
10 Typical Costs for Vehicle Restriction/Diversion Measures11 Key Results of a Major Study of Crosswalk Safety12 Cost Considerations for Road Narrowing Using Pavement Markings13 Details on Evaluations of Speed Humps14 Cost Estimates for Common Traffic Calming Actions for Road Sections15 Typical Costs for Traffic Calming Installations at Intersections16 Public Awareness Campaigns17 CERS Enforcement Program18 Redmond, Washington Police Department Pedestrian Right-of-Way Enforcement Program19 Considerations for Implementing a Pedestrian Enforcement Program20 Model Municipal and County Pedestrian Ordinances
A Wisconsin Department of Transportation 2001 Strategic Highway Safety PlanB Resources for the Planning and Implementation of Highway Safety ProgramsC South African Road Safety ManualD Comments on Problem DefinitionE Issues Associated with Use of Safety Information in Highway Design: Role of Safety in
Decision MakingF Comprehensive Highway Safety Improvement ModelG Table Relating Candidate Strategies to Safety Data ElementsH What is a Road Safety Audit?I Illustration of Regression to the MeanJ Fault Tree AnalysisK Lists of Potential StakeholdersL Conducting an EvaluationM Designs for a Program EvaluationN Joint Crash Reduction Programme: Outcome MonitoringO Estimating the Effectiveness of a Program During the Planning StagesP Key Activities for Evaluating Alternative ProgramQ Definitions of Cost-Benefit and Cost-EffectivenessR FHWA Policy on Life Cycle Costing
APPENDIXES
A-2
S Comparisons of Benefit-Cost and Cost-Effectiveness AnalysisT Issues in Cost-Benefit and Cost-Effectiveness AnalysesU Transport Canada Recommended Structure for a Benefit-Cost Analysis ReportV Overall Summary of Benefit-Cost Analysis Guide from Transport CanadaW Program Evaluation-Its Purpose and NatureX Traffic Safety Plan for a Small DepartmentY Sample District-Level Crash Statistical SummaryZ Sample Intersection Crash SummariesAA Sample Intersection Collision DiagramBB Example Application of the Unsignalized Intersection Guide
Abbreviations used without definitions in TRB publications:
AASHO American Association of State Highway OfficialsAASHTO American Association of State Highway and Transportation OfficialsAPTA American Public Transportation AssociationASCE American Society of Civil EngineersASME American Society of Mechanical EngineersASTM American Society for Testing and MaterialsATA American Trucking AssociationsCTAA Community Transportation Association of AmericaCTBSSP Commercial Truck and Bus Safety Synthesis ProgramFAA Federal Aviation AdministrationFHWA Federal Highway AdministrationFMCSA Federal Motor Carrier Safety AdministrationFRA Federal Railroad AdministrationFTA Federal Transit AdministrationIEEE Institute of Electrical and Electronics EngineersITE Institute of Transportation EngineersNCHRP National Cooperative Highway Research ProgramNCTRP National Cooperative Transit Research and Development ProgramNHTSA National Highway Traffic Safety AdministrationNTSB National Transportation Safety BoardSAE Society of Automotive EngineersTCRP Transit Cooperative Research ProgramTRB Transportation Research BoardU.S.DOT United States Department of Transportation