60
Effectiveness of Behavioral Highway Safety Countermeasures NATIONAL COOPERATIVE HIGHWAY RESEARCH PROGRAM NCHRP REPORT 622

Effectiveness of Behavioral Highway Safety Countermeasures
NATIONALCOOPERATIVE HIGHWAYRESEARCH PROGRAMNCHRP
REPORT 622

TRANSPORTATION RESEARCH BOARD 2008 EXECUTIVE COMMITTEE*
OFFICERS
CHAIR: Debra L. Miller, Secretary, Kansas DOT, Topeka VICE CHAIR: Adib K. Kanafani, Cahill Professor of Civil Engineering, University of California, Berkeley EXECUTIVE DIRECTOR: Robert E. Skinner, Jr., Transportation Research Board
MEMBERS
J. Barry Barker, Executive Director, Transit Authority of River City, Louisville, KYAllen D. Biehler, Secretary, Pennsylvania DOT, HarrisburgJohn D. Bowe, President, Americas Region, APL Limited, Oakland, CALarry L. Brown, Sr., Executive Director, Mississippi DOT, JacksonDeborah H. Butler, Executive Vice President, Planning, and CIO, Norfolk Southern Corporation, Norfolk, VAWilliam A.V. Clark, Professor, Department of Geography, University of California, Los AngelesDavid S. Ekern, Commissioner, Virginia DOT, RichmondNicholas J. Garber, Henry L. Kinnier Professor, Department of Civil Engineering, University of Virginia, CharlottesvilleJeffrey W. Hamiel, Executive Director, Metropolitan Airports Commission, Minneapolis, MNEdward A. (Ned) Helme, President, Center for Clean Air Policy, Washington, DCWill Kempton, Director, California DOT, SacramentoSusan Martinovich, Director, Nevada DOT, Carson CityMichael D. Meyer, Professor, School of Civil and Environmental Engineering, Georgia Institute of Technology, AtlantaMichael R. Morris, Director of Transportation, North Central Texas Council of Governments, ArlingtonNeil J. Pedersen, Administrator, Maryland State Highway Administration, BaltimorePete K. Rahn, Director, Missouri DOT, Jefferson CitySandra Rosenbloom, Professor of Planning, University of Arizona, TucsonTracy L. Rosser, Vice President, Corporate Traffic, Wal-Mart Stores, Inc., Bentonville, ARRosa Clausell Rountree, Executive Director, Georgia State Road and Tollway Authority, AtlantaHenry G. (Gerry) Schwartz, Jr., Chairman (retired), Jacobs/Sverdrup Civil, Inc., St. Louis, MOC. Michael Walton, Ernest H. Cockrell Centennial Chair in Engineering, University of Texas, AustinLinda S. Watson, CEO, LYNX–Central Florida Regional Transportation Authority, OrlandoSteve Williams, Chairman and CEO, Maverick Transportation, Inc., Little Rock, AR
EX OFFICIO MEMBERS
Thad Allen (Adm., U.S. Coast Guard), Commandant, U.S. Coast Guard, Washington, DCJoseph H. Boardman, Federal Railroad Administrator, U.S.DOTRebecca M. Brewster, President and COO, American Transportation Research Institute, Smyrna, GAPaul R. Brubaker, Research and Innovative Technology Administrator, U.S.DOTGeorge Bugliarello, Chancellor, Polytechnic University of New York, Brooklyn, and Foreign Secretary, National Academy of Engineering,
Washington, DCSean T. Connaughton, Maritime Administrator, U.S.DOTLeRoy Gishi, Chief, Division of Transportation, Bureau of Indian Affairs, U.S. Department of the Interior, Washington, DCEdward R. Hamberger, President and CEO, Association of American Railroads, Washington, DCJohn H. Hill, Federal Motor Carrier Safety Administrator, U.S.DOTJohn C. Horsley, Executive Director, American Association of State Highway and Transportation Officials, Washington, DCCarl T. Johnson, Pipeline and Hazardous Materials Safety Administrator, U.S.DOTJ. Edward Johnson, Director, Applied Science Directorate, National Aeronautics and Space Administration, John C. Stennis Space Center, MSThomas J. Madison, Jr., Administrator, Federal Highway Administration, U.S.DOT William W. Millar, President, American Public Transportation Association, Washington, DCNicole R. Nason, National Highway Traffic Safety Administrator, U.S.DOTJames S. Simpson, Federal Transit Administrator, U.S.DOTRobert A. Sturgell, Acting Administrator, Federal Aviation Administration, U.S.DOTRobert L. Van Antwerp (Lt. Gen., U.S. Army), Chief of Engineers and Commanding General, U.S. Army Corps of Engineers, Washington, DC
*Membership as of September 2008.

TRANSPORTAT ION RESEARCH BOARDWASHINGTON, D.C.
2008www.TRB.org
N A T I O N A L C O O P E R A T I V E H I G H W A Y R E S E A R C H P R O G R A M
NCHRP REPORT 622
Subject Areas
Safety and Human Performance
Effectiveness of Behavioral Highway Safety Countermeasures
David F. PreusserAllan F. WilliamsJames L. Nichols
Julie TisonNeil K. Chaudhary
PREUSSER RESEARCH GROUP, INC.Trumbull, CT
Research sponsored by the American Association of State Highway and Transportation Officials in cooperation with the Federal Highway Administration

NATIONAL COOPERATIVE HIGHWAYRESEARCH PROGRAM
Systematic, well-designed research provides the most effective
approach to the solution of many problems facing highway
administrators and engineers. Often, highway problems are of local
interest and can best be studied by highway departments individually
or in cooperation with their state universities and others. However, the
accelerating growth of highway transportation develops increasingly
complex problems of wide interest to highway authorities. These
problems are best studied through a coordinated program of
cooperative research.
In recognition of these needs, the highway administrators of the
American Association of State Highway and Transportation Officials
initiated in 1962 an objective national highway research program
employing modern scientific techniques. This program is supported on
a continuing basis by funds from participating member states of the
Association and it receives the full cooperation and support of the
Federal Highway Administration, United States Department of
Transportation.
The Transportation Research Board of the National Academies was
requested by the Association to administer the research program
because of the Board’s recognized objectivity and understanding of
modern research practices. The Board is uniquely suited for this
purpose as it maintains an extensive committee structure from which
authorities on any highway transportation subject may be drawn; it
possesses avenues of communications and cooperation with federal,
state and local governmental agencies, universities, and industry; its
relationship to the National Research Council is an insurance of
objectivity; it maintains a full-time research correlation staff of
specialists in highway transportation matters to bring the findings of
research directly to those who are in a position to use them.
The program is developed on the basis of research needs identified
by chief administrators of the highway and transportation departments
and by committees of AASHTO. Each year, specific areas of research
needs to be included in the program are proposed to the National
Research Council and the Board by the American Association of State
Highway and Transportation Officials. Research projects to fulfill these
needs are defined by the Board, and qualified research agencies are
selected from those that have submitted proposals. Administration and
surveillance of research contracts are the responsibilities of the National
Research Council and the Transportation Research Board.
The needs for highway research are many, and the National
Cooperative Highway Research Program can make significant
contributions to the solution of highway transportation problems of
mutual concern to many responsible groups. The program, however, is
intended to complement rather than to substitute for or duplicate other
highway research programs.
Published reports of the
NATIONAL COOPERATIVE HIGHWAY RESEARCH PROGRAM
are available from:
Transportation Research BoardBusiness Office500 Fifth Street, NWWashington, DC 20001
and can be ordered through the Internet at:
http://www.national-academies.org/trb/bookstore
Printed in the United States of America
NCHRP REPORT 622
Project 17-33ISSN 0077-5614ISBN: 978-0-309-11754-8Library of Congress Control Number 2008909235
© 2008 Transportation Research Board
COPYRIGHT PERMISSION
Authors herein are responsible for the authenticity of their materials and for obtainingwritten permissions from publishers or persons who own the copyright to any previouslypublished or copyrighted material used herein.
Cooperative Research Programs (CRP) grants permission to reproduce material in thispublication for classroom and not-for-profit purposes. Permission is given with theunderstanding that none of the material will be used to imply TRB, AASHTO, FAA, FHWA,FMCSA, FTA, or Transit Development Corporation endorsement of a particular product,method, or practice. It is expected that those reproducing the material in this document foreducational and not-for-profit uses will give appropriate acknowledgment of the source ofany reprinted or reproduced material. For other uses of the material, request permissionfrom CRP.
NOTICE
The project that is the subject of this report was a part of the National Cooperative HighwayResearch Program conducted by the Transportation Research Board with the approval ofthe Governing Board of the National Research Council. Such approval reflects theGoverning Board’s judgment that the program concerned is of national importance andappropriate with respect to both the purposes and resources of the National ResearchCouncil.
The members of the technical committee selected to monitor this project and to review thisreport were chosen for recognized scholarly competence and with due consideration for thebalance of disciplines appropriate to the project. The opinions and conclusions expressedor implied are those of the research agency that performed the research, and, while they havebeen accepted as appropriate by the technical committee, they are not necessarily those ofthe Transportation Research Board, the National Research Council, the AmericanAssociation of State Highway and Transportation Officials, or the Federal HighwayAdministration, U.S. Department of Transportation.
Each report is reviewed and accepted for publication by the technical committee accordingto procedures established and monitored by the Transportation Research Board ExecutiveCommittee and the Governing Board of the National Research Council.
The Transportation Research Board of the National Academies, the National ResearchCouncil, the Federal Highway Administration, the American Association of State Highwayand Transportation Officials, and the individual states participating in the NationalCooperative Highway Research Program do not endorse products or manufacturers. Tradeor manufacturers’ names appear herein solely because they are considered essential to theobject of this report.


CRP STAFF FOR NCHRP REPORT 622
Christopher W. Jenks, Director, Cooperative Research ProgramsCrawford F. Jencks, Deputy Director, Cooperative Research ProgramsCharles W. Niessner, Senior Program OfficerEileen P. Delaney, Director of PublicationsMaria Sabin Crawford, Assistant Editor
NCHRP PROJECT 17-33 PANELField of Traffic—Area of Safety
Susan Herbel, Cambridge Systematics, Inc., Heathrow, FL (Chair)Ronald Lipps, Maryland State Highway Administration, Hanover, MDEdward B. Crowell, Georgia Motor Trucking Association, Smyrna, GASteve L. Eagan, New Mexico DOT, Santa Fe, NMBarbara Harsha, Governors Highway Safety Association, Washington, DCJames H. Hedlund, Highway Safety North, Ithaca, NYMarsha Lembke, North Dakota DOT, Bismarck, NDJ. Scott Osberg, AAA Foundation for Traffic Safety, Washington, DCRobert L. Thompson, Iowa Governor’s Traffic Safety Bureau, Des Moines, IATerecia W. Wilson, South Carolina DOT, Columbia, SCElizabeth A. Baker, NHTSA LiaisonThomas “Tom” Granda, FHWA LiaisonJohn E. Balser, Other LiaisonRichard Pain, TRB Liaison
C O O P E R A T I V E R E S E A R C H P R O G R A M S

This report presents the findings of a research project to develop a framework and guid-ance for estimating the costs and benefits of emerging, experimental, untried, or unprovenbehavioral highway safety countermeasures. This report will be of particular interest tosafety practitioners responsible for the development and implementation of the state’sStrategic Highway Safety Plan.
In 2006, the U.S. DOT reported 42,642 fatalities and nearly 3 million injuries resultingfrom highway crashes nationwide. The National Highway Traffic Safety Administration(NHTSA) estimates that highway crashes cost society more than $230 billion a year. Toreduce injuries, fatalities, and other costs, billions of dollars are invested every year to engi-neer and construct improved and safer infrastructure, enforce traffic safety laws, andeducate users of the nation’s highway system on safe practices.
Each year, hundreds of millions of these dollars are spent on behavioral highway safetycountermeasures without sufficient knowledge of their benefits. The lack of sound infor-mation on the efficacy and costs of behavioral safety countermeasures such as public aware-ness campaigns, new safety program start-ups, and enforcement programs impedes effec-tive decision making.
With limited resources and the duty to ensure public accountability in the use of fundsavailable for behavioral highway safety programs, there is a need to provide decision mak-ers with additional information to determine the countermeasures that will result in thegreatest reductions of crashes, injuries, and fatalities.
Under NCHRP Project 17-33, “Effectiveness of Behavioral Highway Safety Counter-measures,” researchers at the Preusser Research Group, Inc., developed a framework andguidance for estimating the costs and benefits of emerging, experimental, untried, orunproven behavioral highway safety countermeasures.
The researchers reviewed the behavioral countermeasures included in the report: Coun-termeasures that Work: A Highway Safety Countermeasure Guide for State Highway Offices.This report was prepared for the NHTSA by the Governors Highway Safety Association.The 104 countermeasures in the report were divided into four groups: proven to be effec-tive, likely to be effective, unlikely to be effective or the effects are unknown, and known tohave negative consequences. Effectiveness estimates were developed for a number of theproven to be effective countermeasures.
The report includes a classification scheme to estimate the effectiveness of counter-measures that are believed “likely” to work but for which evaluation evidence is not yetavailable, as well as emerging and developing countermeasures that have not yet been fullyimplemented or evaluated. Guidelines are presented for estimating when countermeasureswithin each of these classifications are likely to be cost effective.
F O R E W O R D
By Charles W. NiessnerStaff OfficerTransportation Research Board

C O N T E N T S
1 Summary
2 Chapter 1 Introduction
3 Chapter 2 Countermeasures
5 Chapter 3 Countermeasure Classification5 Changing Driver Behavior5 Cautions about the Countermeasures6 Countermeasure Categories9 Summary
10 Chapter 4 Estimation of Highway Loss10 Target Group Size—Fatal Injury10 Target Group Size—Nonfatal Injury11 Cost of Fatal and Nonfatal Injury
13 Chapter 5 Estimation of Savings13 Median State13 Countermeasure Effectiveness15 Proven Countermeasures
18 Chapter 6 Estimation of Cost to Implement Countermeasures18 Political Capital18 Resource Allocation19 User Pay19 Direct Cost
22 Chapter 7 Using this Guide22 1. Identify Proven Injury Reducing Countermeasures
That Can Be Implemented24 2a. Use Countermeasures That Are Likely To Be Effective24 2b. Consider Proven Countermeasures with No Effectiveness Estimates25 3. Avoid Countermeasures with Unknown and Unlikely Effectiveness25 4. Do No Harm26 Selection of Countermeasures27 Shift in Strategy28 New and Emerging Countermeasures28 Conclusion
29 References

33 Appendix A Unknown/Uncertain/Unlikely Countermeasures
36 Appendix B Effectiveness Estimates for Twenty-Three Proven Countermeasures
49 Appendix C Countermeasures Likely to Work
50 Appendix D Proven Countermeasures With No Crash or Injury Reduction Calculations

S U M M A R Y
The goal of this project is to assist states in selecting programs, projects, and activities thathave the greatest potential for the reduction of highway death and injury. The specificobjectives are as follows:
Produce a manual for application of behavioral highway safety countermeasures and develop a frame-work and guidance for estimating the costs and benefits of emerging, experimental, untried, or unprovenbehavioral highway safety countermeasures.
There are 104 countermeasures in Countermeasures That Work: A Highway Safety Counter-measure Guide for State Highway Safety Offices (NHTSA, 2007b). Of these, 34 have been“proven” effective. These countermeasures should be implemented whenever feasible, practi-cal, and politically acceptable. Many involve little direct cost either because the primary effortinvolves passage of a law (e.g., universal mandatory motorcycle helmet law, bicycle helmet lawfor children, primary seat belt law, graduated driver licensing) or because they are revenue neu-tral “user pay” (e.g., alcohol interlock, speed cameras, and red-light cameras). Some counter-measures rated Proven do involve direct costs for their implementation. Benefit/cost calcula-tions indicate that most will produce a positive benefit/cost ratio for most states (e.g., boosterseat promotions, sobriety checkpoints, short-term high-visibility belt use enforcement).
Estimated effectiveness for 54 of the 104 countermeasures is rated as Unlikely/Uncertainor Unknown. Three countermeasures have actually been shown to have negative conse-quences. All of these countermeasures should be avoided at least until more evidencebecomes available.
In between the Proven countermeasures and the Unlikely/Uncertain/Unknown, fall13 countermeasures that are believed “likely” to work but for which evaluation evidence isnot yet available, as well as emerging and developing countermeasures that have not yet beenfully implemented, let alone evaluated. This report provides the following classificationscheme to estimate the effectiveness of these measures:
1. Voluntary action (countermeasures that are designed to train, educate, or request somebehavior);
2. Law or regulation (require the behavior);3. Laws plus enhancements (high-visibility enforcement of the law); and4. Sanctions and treatments of offenders.
Guidelines are presented for estimating when countermeasures within each of these clas-sifications are likely to be cost effective.
Effectiveness of Behavioral Highway Safety Countermeasures
1

2
A significant part of highway safety program activities isdevoted to behavioral countermeasures. These include theentire driver control system—from training and licensing tolaws and enforcement and sometimes culminating in finesand sanctions. Given the enormous cost of crashes and theimportance of driver behavior in highway loss reduction, it isimportant that behavioral countermeasures be implementedas effectively as possible.
It is a challenge to accomplish this goal. Driver behavior canbe changed, although this is not easily accomplished. Some be-havioral countermeasures are effective; others, including somethat are popular and widely used, are not effective. There aremany complexities in assessing behavioral countermeasures.Some that may not be effective on their own (e.g., certain pub-lic information programs) can be an essential feature whencombined with other elements. Some programs that may bedescribed the same way (e.g., public information/educationprograms encouraging bicycle helmet use) can be widely differ-ent in ways that make one program effective, another not.Moreover, among measures that are effective, there is a widerange in how much they reduce the problem, depending onthe effect size (e.g., a 5% versus a 25% reduction in highwaydeaths), the size of the population to which the measure applies,and the expected duration of the effect. There also can be widedifferences in program costs, both monetary and nonmonetary.
All of these issues, as well as others, are covered in this re-port. The intention is to develop a roadmap for states, a bestpractices guide for the use and assessment of behavioralcountermeasures. In doing so, all such countermeasures thatare used or could be used by states are considered, and infor-mation on the cost and/or effectiveness is indicated whenavailable.
Chapter 2 provides background information on counter-measures and Chapter 3 lists behavioral countermeasures bylogical groupings in terms of the behavior change approachused. Countermeasures within each group are separated intothose that work in terms of reducing the highway safety prob-lem, and those that do not or for which the evidence is un-certain or unknown. In subsequent chapters, the cost benefitparameters for proven effective countermeasures are calcu-lated and analyses of why certain programs work and othersdo not are presented and draw on behavior change principlesderived from the scientific literature.
This report aims to provide states with a framework for anevaluation of their current program in terms of countermea-sures in use and those that might be used. The delineation ofbehavior change principles indicating what works and whatdoes not also provides a means of assessing the likely contri-bution of emerging, experimental, untried, or unproven be-havioral safety measures.
C H A P T E R 1
Introduction

3
Behavioral countermeasures considered in this documentare derived primarily from Countermeasures That Work:A Highway Safety Countermeasure Guide for State HighwaySafety Offices (NHTSA, 2007b). The report was intended toinclude all countermeasures relevant to state programs in thefollowing areas: alcohol-impaired driving, safety belts, ag-gressive driving and speeding, distracted and fatigued driving,motorcycle safety, young drivers, and elderly drivers. Ex-cluded are measures already in place in every state (e.g., 0.08blood alcohol concentration [BAC] laws). The original reportdid not include countermeasures involving pedestrians andbicycles, but they have been added for the 2007 update of thatdocument. The present report includes these countermea-sures, with some adjustments (e.g., booster seat promotions,a new type of program, was added).
The effectiveness of each countermeasure listed in Coun-termeasures That Work was assessed in terms of reductions incrashes or injuries, or improvements in some intermediatemeasure, such as arrests or successful prosecutions. The rat-ing categories were defined as follows:
• Proven—consistent positive evidence from several high-quality evaluations,
• Likely—balance of evidence from high-quality evaluationsor other sources,
• Uncertain—limited and ambiguous evidence,• Unknown—no high-quality evaluation evidence, or• Varies—different methods of implementing the counter-
measure produce different results.
The Varies rating was usually applied when there were dis-cretely different types of approaches in use (e.g., the coun-termeasure “alcohol sanctions” included license suspension,fines, and jail). These separate actions have been consid-ered individually in this NCHRP report. Considering sepa-rate actions individually in other cases has resulted in the
elimination of the Varies rating. Otherwise, the Hedlundeffectiveness ratings have been retained, with occasionaladjustments and updates. For example, CountermeasuresThat Work (NHTSA, 2007b) included studies through June2006; since that time, there has been enough new informationon passenger restrictions for teenage drivers to rate them asProven.
In total, there are 104 separate countermeasures: 33 in thealcohol area; 13 for young drivers; 11 for occupant restraints;10 for pedestrians; 9 each for bicycles and motorcycles; 7 forelderly drivers, and 6 each for distracted/fatigued drivers andfor aggressive drivers/speeding.
Countermeasures That Work (NHTSA, 2007b) also includedinformation on implementation costs, which is used as a start-ing point in the present analyses. The cost ratings are definedas follows:
• High—requires extensive new facilities, staff, equip-ment, or publicity, or makes heavy demands on currentresources;
• Medium—requires some additional staff time, equipment,facilities, and/or publicity; and
• Low—can be implemented with current staff, perhapswith training; limited costs for equipment, facilities, andpublicity.
Information in Countermeasures That Work was presentedby topic area (alcohol-impaired driving, safety belts, etc.).This NCHRP report cuts across topic areas. Here, counter-measures are classified according to their behavioral changetechnique (e.g., education, laws, enforcement). This reportalso extends the Hedlund work in providing metrics for thecountermeasures classified as Proven. That is, where possi-ble, an indication of the effect size of the countermeasure isprovided (e.g., 10% crash reduction), as well as the targetpopulation and likely duration of the effect. Information on
C H A P T E R 2
Countermeasures

monetary costs, including benefit/cost ratios, is also providedwhenever possible.
One problem encountered in conducting this researchwas that high-quality evidence concerning effectiveness isoften lacking. Ideally, for every countermeasure in use,it should be known if it was effective. That is not the case.Of the more than 100 countermeasures considered, about
half are rated as Uncertain or Unknown. However, boththe uncertains and the unknowns can be assessed in termsof whether they are likely to work, based on the princi-ples derived from those countermeasures known to workand known to be ineffective. This same procedure can beused to gauge the likely contribution of new and untriedcountermeasures.
4

5
Behavioral change techniques used in highway safetycountermeasures basically fall into one of the following fourcategories:
1. Voluntary action (public information, education, massmedia, training);
2. Laws, regulations, policies;3. Laws plus enhancements (enforcement plus publicity); or4. Sanctions and treatments (fines, points, jail, alcohol school,
license suspension).
Changing Driver Behavior
There are many issues and challenges that need to be con-sidered with respect to changing driver behavior. One issue isthat safe driving practices and protective behaviors (such ashelmet use) have to be practiced on each trip. Measures thathave only a short-term effect with no lasting behavioral changecontribute little. Long-term effects are much harder to achievethan immediate ones, and some behaviors are more difficultto implement than others. For example, converting motor-cyclists to helmet use requires them to purchase a helmet andalways wear it, which may seem uncomfortable and intrusive.Potential users may be opposed to helmet use for intellectualand emotional reasons. In comparison, wearing an alreadyavailable seat belt, which is less intrusive than a helmet, shouldbe an easy sell.
In general, most people know what they are supposed to doon the highway in terms of safe driving practices; it is not amatter of lack of knowledge. What people actually do, how-ever, is guided by attitudes, motivations, lifestyle factors, andassumptions about risk. Veteran drivers have well-developedhabits that pose a challenge to change. Moreover, from riskperception research it is known that in very familiar activitiessuch as driving, there is a tendency to minimize the possibil-ity of bad outcomes as a way of allaying personal concerns(Douglas, 1985). People underestimate risks that are supposed
to be under their control, insulating themselves by creating“illusory zones of immunity” around everyday activities(Jasanoff, 1998). This sense of subjective immunity is bol-stered by the belief of most people that their own driving skillsare superior (Williams, Paek, and Lund, 1995). Crashes happen,but to other drivers; the highway safety problem is a problem ofthe other driver. We want those other drivers to behave on thehighways since they are a threat to us and, in that context, safetymessages are for them, not us. In general, people have an opti-mistic bias, thinking that they are less likely than others to suf-fer misfortunes (Maibach and Holtgrave, 1995). Therefore, it isnot surprising that this so-called “third-person effect” is foundin a number of health realms. People viewing health messagesbelieve the message is for others, not themselves (Davison,1983). This is likely to be even more of a factor in regard tohighway safety, given the psychological tendency of peopleto protect themselves by minimizing the possibility of harmto themselves resulting from the everyday activity of driving.
Finally, crashes, especially those that produce injuries, areextremely rare events per mile driven. Speeding, driving whileimpaired, running red lights, and other dangerous and illegalbehaviors generally have no downside. In this sense, driversare rewarded every time they complete a trip involving theseactions. All of these factors, taken together, pose significantbarriers to influencing driving behavior.
That said, some groupings can be expected to have moreeffective countermeasures than others. For example, laws aregenerally more effective than requesting voluntary actions interms of producing behavior change; enhanced laws should bemore effective than laws alone. Within each of the four cate-gories, however, some countermeasures work and some do not.
Cautions About theCountermeasures
As indicated earlier, one issue in determining the effec-tiveness of a countermeasure is that one type of program or
C H A P T E R 3
Countermeasure Classification

approach involving that specific countermeasure may work,and another may not. This can happen in all four of thecountermeasure groupings. For example, in the laws area, itis possible that a law that works in one state will not work inanother, since laws (e.g., seat belt laws, administrative licenserevocation [ALR] laws) vary in terms of coverage and penal-ties. In the laws/enhancements area, enforcement programscan vary in intensity and duration, and may be differentiallyeffective. In the treatment/sanctions area, alcohol treatmentprograms can differ markedly. However, this is most likely tobe an issue in the grouping for voluntary actions only whereprograms promoting a specific action can vary widely, rang-ing from a passive public information campaign based onmaterials sent through the mail to multiple face-to-face in-teractions involving sophisticated behavior change models,and possibly involving other inputs. The latter may work; theformer may not.
Another warning concerning effectiveness ratings wasraised in Countermeasures That Work (NHTSA, 2007b),namely that evaluation studies generally examine and reporton high-quality implementations of countermeasures, so thatthe effectiveness data are likely to show the maximum effectthat can be realized. That is, the countermeasure in questionmay not work, or work as well, with lesser efforts. Also, itshould be noted that while a particular approach may notwork by itself, it may facilitate acceptance of an approach thatwill reduce injury (e.g., public information and education[PI&E] may affect public acceptance making passage of a lawmore likely).
The remainder of this chapter will discuss each counter-measure category in turn, along with the criteria derived thatdistinguish effective and ineffective countermeasures withinthat category. Then, each countermeasure within that groupwill be rated as follows:
• Proven effective;• Likely to be effective;• Effectiveness is Unknown/Uncertain/Unlikely; or• In a few cases, Proven Not to Work.
Countermeasure Categories
Class 1: Voluntary Action
A popular approach in the behavioral field has been to urgepeople to take appropriate actions through public informa-tion, educational programs, mass media, and training usedalone. Given the barriers to change discussed earlier, it is noteasy to change driver behavior in this manner. This subject istreated extensively in Public Information and Education in thePromotion of Highway Safety (Williams, 2007a), which formsthe basis for the following discussion.
Most of the countermeasures in the Voluntary ActionGroup involve communications. Historically, many ofthese efforts have been of poor quality, consisting of passivemessaging, sloganeering, exhorting people to do—or notdo—some behavior, and delivered to an undifferentiatedaudience over the short term. The simplistic assumption isthat if individuals are made aware of behaviors that willenhance their personal health or safety and urged to adoptthese behaviors, they will do so. Seemingly logical, thissequence of events is unlikely to happen. It is well establishedthat information-only programs are unlikely to work, espe-cially when most of the audience already knows what to do.Therefore, highway safety messages conveyed in signs, pam-phlets, brochures, on buttons, etc. may increase awareness ofthe health issue being addressed and reinforce social values,but are unlikely to have any effect on behavior. Behaviors thatare particularly difficult to change, such as getting a motor-cyclist to buy and use a helmet, are least likely to be affectedby advice or urgings to do so.
Lecture-oriented education programs that are information-only in nature also are likely to be ineffective, as are short-term programs and messages delivered only once or twice.Extreme fear or scare techniques also are likely to have nomore than a short-term emotional effect, especially whendirected at adolescents.
Programs recommending driver behavior that are morelikely to be effective include public information programsthat involve careful pre-testing of messages to make sure themessage is relevant to the group being addressed and care-ful delineation of the target group to make sure the messagesreach the target group in sufficient intensity over time.These are the aspects involved in successful social market-ing programs. In the education arena, some success (mostlyin other health areas) has been achieved through programsusing theory-based behavior change models, and interactivemethods to teach skills to resist social influence through roleplaying, behavior rehearsal, group discussion, and othermeans.
However, even high-quality public information andeducation programs rarely work by themselves to change in-dividual behavior, although their contribution can be criti-cally important when combined with other prevention efforts(e.g., in support of law enforcement or as part of broadercommunity programs). According to the research literature(Williams, 2007a), programs involving voluntary actionsthat work on their own include those targeting children,whereas programs targeting teenagers or adults are not likelyto work. Unlike adults, children do not have well-developedsafety behavior patterns and so are more amenable tochange. Programs also work that communicate healthknowledge not previously known. One example of this is theshift of children from front to rear seats to avoid air bag
6

inflation dangers, a “new” knowledge that was largely drivenby public education programs. Programs where the com-municator has some control over resources or over theaudience also are more likely to be successful. These wouldinclude employer programs, parents influencing their chil-dren, and alcohol servers influencing patrons. Finally, high-quality public information and education programs thatare part of broad-based community programs have alsobeen successful.
The 38 voluntary action countermeasures (the largest groupof any of the four categories) are listed below, sorted accordingto their effectiveness rating. Note that this group also includesthree items that research has clearly shown do not work toreduce crashes and, in fact, can increase them: novice drivereducation (when that education leads to licensure at an agewhich is younger than would otherwise be the case withoutthe education), skid training for novices, and traffic viola-tor school in lieu of penalties. Regarding the category ofUnknown/Uncertain/Unlikely, see Appendix A for the ration-ale and references to further separate this group into: (+) somebasis for thinking that it might work; (0) unknown or noopinion; and (−) some basis for thinking that the counter-measure will not work.
Proven
• School pedestrian training for children;• Programs to get parents to put children in rear seats;• Booster seat promotions; and• Child bicycle helmet promotions.
Likely
• Responsible beverage service and• Parent guiding teen licensing.
Unknown/Uncertain/Unlikely
• Child pedestrian supervision training for caregivers (+);• Child safety clubs (+);• Bicycle education for children (+);• School-based alcohol education programs to reduce drink-
ing and driving (0);• PI&E for elderly drivers (−);• PI&E for low belt users (+);• Motorcycle education and training courses (−);• Formal driver education courses for elderly drivers (−);• Bike fairs, rodeos (+);• Driver training about sharing the road with bicycles (−);• Teaching bike rules/safety in driver education (−);• Education encouraging bicyclists to increase their con-
spicuity (−);
• Education to encourage pedestrians to increase their con-spicuity (−);
• Driver education in regard to pedestrians (−);• Programs to teach driver awareness about motorcyclists (−);• PI&E about driver fatigue (−);• PI&E about distracted driving (−);• PI&E on sleep disorders for general population and phy-
sicians (−);• Employer programs for shift workers, medical interns (+);• Alternative transportation for alcohol-impaired drivers (+);• Designated driver programs (0);• Motorcycle helmet use promotion programs (−);• PI&E on drinking and motorcycling (−);• Education to encourage motorcyclists to increase their
conspicuity (−);• Programs to help police detect impaired motorcyclists (0);• Communications and outreach regarding impaired pe-
destrians (−);• Extreme fear and scare tactics in youth programs, e.g., fake
deaths, mock funerals (−);• High school driver education (not leading to early learning/
licensing) (0); and• School bus training for children (+).
Proven Not to Work
• High school driver education (leading to early learning/licensing);
• Advanced driver education, skid training; and• Traffic violator school in lieu of penalties.
Class 2: Laws, Regulations, Policies
Many of the demonstrable gains in changing behavior inways that reduce motor vehicle injuries have come throughlaws and regulations. The power of laws is illustrated by theabrupt changes in behavior that occur coincident with theirintroduction. For example, on the day British Columbia’sseat belt use law went into effect, belt use was 30 percentagepoints higher than it had been 24 hrs earlier (Williams andRobertson, 1979).
Not all laws work, however. Laws that work best incorpo-rate elements associated with high deterrent capabilities.That is, they are well known to the public, and they areenforceable laws, based on easily observable behavior andobjective criteria (e.g., motorcycle helmet use laws). Thisleads to the expectation that not complying with the law willresult in apprehension and sanctioning. Also advantageousare laws where enforcement is done not only by the police,but by parents (e.g., bicycle helmet laws for children, or grad-uated licensing laws for adolescents). Department of MotorVehicles (DMV) rules that have to be followed, and ordinances
7

and other across-the-board policies also are more likely towork. Policies work that force changes that result in positiveoutcomes. For example, motorcycle helmet laws force ridersto wear a helmet.
Laws less likely to work on their own are those that are notwell known, or for which the behavior is not easily observ-able by police and therefore not easily enforced (e.g., opencontainer laws). Laws that apply only to a portion of the pop-ulation performing the behavior (e.g., motorcycle helmetlaws that apply only to young motorcyclists) are difficult tomake effective, especially when the penalties are weak. Lawswhere the criteria are not explicit also are less likely to besuccessful (e.g., aggressive driving, fatigue, and distracteddriving laws).
Proven
• Bike helmet laws for children;• Graduated driver licensing (GDL);• Extended learner permit;• Night restrictions (for young drivers);• Passenger restrictions (for young drivers);• Administrative license revocation laws;• BAC test refusal penalties;• Primary seat belt law;• Speed limits;• Motorcycle helmet laws; and• Reduced speed limit regarding pedestrians (proven in
Europe).
Likely
• Ice cream vendor ordinance;• Local primary seat belt laws;• Adult bike helmet laws;• License renewal policies for elderly drivers; and• License actions for underage alcohol violations.
Unknown/Uncertain/Unlikely
• General cell phone laws (+);• Open container laws (0);• Lower BAC limit for repeaters (+);• Cell phone laws as part of graduated licensing (+);• Belt use as part of graduated licensing (+);• Motorcycle licensing laws, especially in regard to having a
valid license (0);• Belt laws with significant exclusions (0);• Keg registration laws (0);• Medical advisory boards for elderly drivers (0);• Aggressive driving laws (−);• Driver fatigue and distracted driving laws (−);
• Referral of elderly drivers to licensing agencies (+);• Licensing screening and testing for elderly drivers (+); and• Licensing restrictions for elderly drivers (+).
Class 3: Laws Plus Enhancements
If the public to whom the law applies is not aware of thelaw, or there is little enforcement, or little perceived enforce-ment, positive effects of laws can be diminished or eliminated.Thus, the effects of laws can be enhanced by special enforce-ment programs, publicity about the law and its enforcement,and—in some cases—by special equipment such as passivealcohol sensors to enhance enforcement. When one or moreof these elements is combined with laws that are easily enforce-able, success is likely. Success is less likely when laws are noteasily enforceable because the criteria for enforcement arevague or the behavior is difficult to observe.
Proven
• Sobriety checkpoints;• Saturation patrols for alcohol-impaired driving;• Preliminary breath test devices;• Passive alcohol sensors;• Short, high-visibility belt law enforcement;• Automated enforcement for speed, red light running;• Mass media support of alcohol enforcement or other
programs;• PI&E supporting enforcement of seat belt laws; and• Community programs, including age 21 enforcement.
Likely
• Integrated enforcement (alcohol, seat belts, speeding);• Zero-tolerance enforcement;• Vendor compliance checks for age 21 enforcement; and• Sustained seat belt enforcement.
Unknown/Uncertain/Unlikely
• Aggressive driving enforcement (+);• GDL enforcement (+);• Enforcement of pedestrian rules targeted to drivers and
pedestrians (−);• Enforcement of bike rules (−); and• Enforcement against unapproved motorcycle helmets (+).
Class 4: Sanctions and Treatments
Special penalties and treatments also can supplementlaws. Sanctions that are well known to violators, have a high
8

probability of being imposed, and have a high degree of in-trusiveness (i.e., involve a real amount of money or time) aremost likely to work. If there is low intrusiveness, if sanctionsare not well known to violators, are unlikely to be applied, orif the penalty is not very meaningful, success is unlikely.
Proven
• Aggressive driving, speeding penalties (e.g., suspension,warning letters);
• Restrictions on plea bargains;• Court monitoring;• Mandatory attendance at alcohol treatment;• Close monitoring of DUIs;• Alcohol interlocks;• Brief interventions—alcohol;• License plate impoundment;• Vehicle immobilization; and• Vehicle impoundment.
Likely
• Increased belt use law penalties and• Simplifying and streamlining DUI statutes.
Unknown/Uncertain/Unlikely
• Vehicle forfeiture (+);• GDL penalties (0);• Driving under the influence (DUI) fines (0);• DUI jail (0);• High BAC sanctions (+); and• DWI (driving while intoxicated) courts (+).
Summary
Overall, 45% of the 104 countermeasures are consideredeffective (33% proven; 12% likely). By comparison, the other55% are less likely to work. This assessment is based on thefact that evidence for effectiveness is uncertain or unknownand/or the criteria for what is likely to work are not met(52%), or because research indicates that these countermea-sures increase crashes (3%).
The following percentage of countermeasures are ratedProven or Likely to work in each class of countermeasures:
• Sixteen percent of Class 1: Voluntary Action;• Fifty-three percent of Class 2: Laws, Regulations, Policies;• Seventy-two percent of Class 3: Laws Plus Enhancements;
and• Sixty-seven percent of Class 4: Sanctions and Treatments.
By topic area, there are differences in expected effective-ness. Effectiveness is most likely in the occupant restraintgroup where 82% of the countermeasures are rated Provenor Likely; followed by alcohol (67%); aggressive driving/speeding (50%); young drivers (38%); bicycles (33%); pedes-trians (30%); elderly drivers (14%); motorcycles (11%); anddistracted/fatigued drivers (none at this time).
How effective are those countermeasures rated as Proven orLikely? Ideally, for all countermeasures rated as Proven, and formany rated as Likely, it would be possible to derive a numericalestimate of the effect size, the expected percentage reduction ininjuries. However, it is not always possible to estimate this num-ber. Of the 47 countermeasures rated as Proven or Likely, abouthalf of the outcomes relate not to reductions in crashes or in-juries, but to some intermediate measure (e.g., reductions in re-cidivism, increases in arrests or convictions, decreased drinking,increases in seat belt use). It is possible to estimate the impact ofincreases in seat belt use to decreases in injuries, but for manyother intermediate measures, there is no credible way to do so.There also are a few cases where the expected effect relates tocrashes or injuries, but not enough information is available toextract a numerical estimate of the effect.
In addition to the effect size, there are other importantfactors in determining the overall impact of any countermea-sure. One of these factors is the size of the population affected.For example, a measure affecting the general populationcan have more impact than one affecting a specific subgroup(e.g., teenage drivers only). Another is the expected duration ofthe effect. For example, although the effects of laws can varyover time, depending on such factors as the amount of public-ity and enforcement, their permanence gives them an advantagecompared with programs that are one-time efforts. Durationcan also refer to the length of time the positive effects of a pol-icy last on individuals affected, for example, license suspension.
9

10
This chapter presents the estimated highway loss associ-ated with the target groups for which countermeasures havebeen developed. Highway loss can arise from both fatal andnonfatal injury. Property damage is not considered herebecause it is a relatively small proportion of all loss and is notconsistently reported across the states.
Target Group Size—Fatal Injury
The countermeasures reviewed cover differing groups ofroad users and differing numbers of fatal and injury victims.For instance, some involve nonmotorists (pedestrians andcyclists), others involve alcohol, speed, motorcycles, belt use,teen drivers, etc. The size of each of these target groups variessubstantially. Table 1 indicates the number of fatalities asso-ciated with each of the target groups and the percentage of allfatalities that each group represents.
Note that the groups are not mutually exclusive. For in-stance, a single crash could involve a 16-year-old driver, dis-tracted, at night, who had been drinking.
Target Group Size—Nonfatal Injury
Fatalities are only part, and typically not even the majorpart, of overall highway loss. We estimate, based on Blincoe,Seay, Zaloshnja et al. (2002), that for every motor-vehicle-related fatality, there are 126 associated injuries (of any sever-ity). This figure refers to the overall injury-to-fatality ratio(i.e., 126/1). There is substantial variance in this ratio as afunction of the target population. For instance, motorcyclistsand pedestrians have different injury-to-fatality (i.e., injury/death) ratios than do occupants of passenger vehicles.
To estimate the injury/death ratio for each target groupand then use such ratios to determine target group costs basedon the Blincoe et al. report, this ratio was first calculated foreach target population based on General Estimates System(GES) data for 2004–2006. The ratio for each subgroup was
then divided by the ratio for all persons to provide an adjust-ment factor. For example, if the GES injury/death ratio forpedestrians was 21/1 and the ratio for all groups combinedwas 85/1, then the relative size of the injury/death ratiofor pedestrians was 0.25 that of the overall group (i.e., 21/1 ÷85/1 = 0.25). This proportion (0.25) was then used to adjustthe overall injury/death ratio calculated from the Blincoe et al.report (2002). Thus, if the pedestrian injury/death ratio was0.25 of the overall injury/death ratio in the GES data set,then it was assumed to be 0.25 the overall injury/death ratioin the data used by Blincoe (126/1). Therefore, multiplying0.25 by 126/1, the overall injury/death ratio from the Blincoedataset resulted in an adjusted 31/1 ratio, which was usedto estimate costs associated with both deaths and injuries.Adjusted ratios for various target groups are shown in Table 2.Taking pedestrians as an example, the final column in thetable for adjusted ratios was obtained by determining whatproportion of the all persons ratio is comprised of the pedes-trian ratio shown in the column for GES ratio relative to allpersons (hence: 21/85 = 0.25), and adjusting the Blincoe et al.ratio by that factor to provide the data in the last column(125.95 × 0.25 = 31.49).
The last column of Table 2 indicates the injury/fatalityratio used to estimate the benefits for each Proven counter-measure. Rounding, the first ratio shown is 126/1, which rep-resents the overall ratio calculated across all target groups.The next ratio is 31/1 for pedestrians (used in the previousexample). Based on this procedure, motorcyclists have aninjury/fatality ratio of 35/1. Both pedestrians and motor-cyclists are “unprotected” road users. The result is that thesepersons are far more likely to sustain fatal injury, as comparedwith a nonfatal injury, given that a crash has occurred. At theopposite end of the range are child occupants of passengervehicles. They are highly protected by the car and by the factthat they are often in the back seat, sometimes in a child re-straint device. Their injury/fatality ratio is 656/1, indicatingthat fatal injury in the event of a crash is far less likely than
C H A P T E R 4
Estimation of Highway Loss

nonfatal injury. All of the remaining target groups fall some-where between these two extreme values.
Cost of Fatal and Nonfatal Injury
The Blincoe et al. (2002) report estimates the cost of fatal-ities and injuries of varying severity. Nichols and Ledingham(2008) use Blincoe’s 1994 and 2000 base-year figures and in-terpolate estimates for other years. For the year 2007, Nichols
estimates the cost of each fatality at $1,115,820 and the aver-age cost of Maximum Abbreviated Injury Scale (MAIS) 2 to5 injuries at $2,686,417 (cost of total MAIS 2 to 5 injuries perunit fatality). Using Nichols’ method and figures, the averagecost of 126 MAIS 1 to 5 injuries per unit fatality was estimatedto be $3,780,038 in 2007. This overall cost was then convertedto an average cost-per-injury estimate that, combined with the(adjusted) injury/death ratios for the various crash cate-gories, was used to estimate total costs for MAIS 1 to 5 injuries
11
Fatality Analysis Reporting System
(FARS) 2006
Crashes involving No. of fatalities
Percentage of all
fatalities Description
All persons 42,642 100.00 All motor-vehicle-related fatalities Pedestrians 4,784 11.22 All pedestrian fatalities Distracted 4,246 9.96 Fatalities involving distracted drivers (drowsy excluded) Drowsy 1,344 3.15 Fatalities involving drowsy drivers Speed 11,518 27.01 Speed related, speed violation, or excessive speed fatalities
Aggressive 11,684 27.40Fatalities involving speeding, reckless driving, road rage, aggressive driving
Alcohol related 17,602 41.28 Fatalities involving drivers with BAC .01 Teen drivers 2,291 5.37 Fatalities involving 16- and 17-year-old drivers in passenger vehicles 16-year-old drivers 880 2.06 Fatalities involving 16-year-old drivers in passenger vehicles Elderly drivers 3,135 7.35 Fatalities involving drivers age 75 and over in passenger vehicles Motorcycles 4,654 10.91 All motorcyclist fatalities Nighttime 15,194 35.63 All fatalities occurring between 9 P.M. and 6 A.M.Child in car 993 2.33 Children 0-12 in passenger vehicles Front seat occupants 26,715 62.65 Outboard front seat occupant of passenger vehicles ages 13 and up
Bicycles 770 1.81 All bicyclist fatalities
Table 1. Percentage of fatalities associated with various types of crashes.
GES 2004–2006
Crashes inv olv ing No. of
Injuries No. of
Fatalitie s
Injury - to-
fatality rati o
GES ratio relativ e to
all persons Adjusted
ratios All persons 7,719,076 90,612 85 Blincoe’s ratio: 125.95 Pedestrians 183,659 8,640 21 0.25 31.49Distracted 1,951,355 12,315 158 1.86 234.28 Drowsy 276,000 5,464 51 0.59 74.68 Speed 1,812,245 30,628 59 0.69 87.48 Aggressive 1,867,291 30,731 61 0.71 89.84 Alcohol related 600,415 19,008 32 0.37 46.70 Teen drivers 787,101 4,884 161 1.89 238.28 16-year-old drivers 334,031 1,843 181 2.13 267.96 Elderly drivers (75+) 468,402 7218 65 0.76 95.95 Motorcycles 229,522 9,827 23 0.27 34.53 Nighttime 1,290,607 28,915 45 0.52 65.99 Child in car 413,146 931 444 5.21 656.15 Front seat occupants 5,886,027 55,710 106 1.24 156.21 Bicycles 125,599 1,745 72 0.84 106.41
Table 2. Adjusted fatality-to-injury ratio by crash type.

associated with a given number of deaths. For 2007, the esti-mated cost of each fatality is $1,115,820 and the average unitcost of MAIS 1 to 5 injuries was $30,238, as indicated inTable 3.
The sources of the costs differ depending on whether in-juries are fatal. For fatal injuries, 82% of the $1,115,820 is lostproductivity, 2% is from medical and emergency service costs,and 15% is from other costs (e.g., legal fees, insurance). Fornonfatal injuries (MAIS 1 to 5), 45% of the costs ($30,238) isdue to lost productivity, 35% is associated with medical andemergency services, and 20% represents other costs. For anygiven countermeasure, the percentage of cost savings fallinginto each category is dependent on the injury-to-fatality ratio.For example, the savings from a pedestrian countermeasurewould have lower medical savings because a higher propor-tion of the victims were fatally injured. Whereas a counter-measure focusing on teens would be expected to have a higherproportion of the savings coming from medical costs as ahigher proportion of the victims being “saved” were non-fatally injured.
Note that costs for fatalities after year 2000 were extrapo-lated from the rate of change from 1994 to 2000 (Blincoe,Seay, Zaloshnja et al., 2002). An alternative method for mak-ing this estimation would have been to use changes in theconsumer product index from the Bureau of Labor Statistics(www.bls.gov). Using that approach, the estimated cost of adeath in 2007 would have been 1.03 times the estimated costshown in Table 3 (i.e., it would be $1,149.344, rather than the$1,115,820 shown). This latter number would, of course, pro-vide a higher estimate of costs. In the “typical” state with600 deaths, the costs associated with deaths (alone) would beabout $689.7 million, rather than $669.5 million, or an addi-tional $20 million. In this scenario, total costs (deaths andinjuries) associated with 600 deaths in the “typical” statewould be $2.975 billion, rather than $2.955 billion as esti-mated in Chapter 5.
None of these costs include grief, pain, and suffering. Al-though enormous, the latter costs are difficult to quantify.Thus, the estimated costs used in this report focus on moredirect and measurable costs associated with fatalities andnonfatal injuries. Also, as mentioned previously, propertydamage (a relatively small portion of overall highway loss) isnot included.
In summary, the societal cost of each fatality in 2007 is(conservatively) estimated to be $1,115,820, and the averagecost of each MAIS 1 to 5 injury is estimated to be $30,238.These unit estimates are used to determine the total costs ofdeaths and associated injuries for each subgroup examined inthis report. Again, these estimates are likely to be very con-servative. The costs of pain, grief, and suffering, for example,are not included. If included, it is likely that they would in-crease these estimates by approximately 300%.
12
* Blincoe et al. base years
Cost
Year Average MAIS 1-5
Per unit fatality
1994* $10,721 $822,330 1995 $12,223 $844,906 1996 $13,724 $867,482 1997 $15,225 $890,059 1998 $16,726 $912,635 1999 $18,228 $935,211 2000* $19,729 $957,787 2001 $21,230 $980,363 2002 $22,731 $1,002,939 2003 $24,233 $1,025,516 2004 $25,734 $1,048,092 2005 $27,235 $1,070,668 2006 $28,737 $1,093,244 2007 $30,238 $1,115,820
Table 3. Estimated costsassociated with each deathand MAIS 1-5 injury by year.

13
Savings, or estimated benefits, from any highway safetymeasure are calculated based on three factors as follows:
1. The number of fatalities and injuries resulting from crashesaddressed by the countermeasure (based on number ofdeaths in the target group and on an estimate of the num-ber of injuries per death avoided),
2. The estimated percentage reduction produced by thecountermeasure, and
3. The estimated cost of each fatality and injury avoided.
Dollar values associated with a fatality and dollar valuesassociated with an injury were derived in the last section. Thissection begins with those dollar values and then relates themto the dollar “savings” that might be derived from the success-ful implementation of a given countermeasure in the medianstate as described in the following section.
Median State
There were 42,642 motor-vehicle-related fatalities in theUnited States in 2006 (NHTSA, 2007a). The median numberof fatalities per state was 630. To estimate the costs incurredby a typical state, the researchers assume each state to have600 fatalities a year and use that assumption as a basis forexample calculations. States with 1,200 fatalities per yearwould multiply all cost/savings estimates by two. States with300 fatalities per year would divide by two.
Estimates for this “median” or “typical” state are shown inTable 4. This state experiences an overall loss of $2.955 billiondollars per year. That loss, based on the national distributionof fatalities and injuries, is largely accounted for by threetarget groups: (1) front seat occupants of passenger vehicles;(2) speed; and (3) alcohol-impaired driving. Also shown inTable 4 are dollar savings that could be achieved if crashesrepresented by each of these respective target groups could bereduced by some specified amount, say 10%, 30%, or 50%. It
immediately becomes apparent that, even using our conser-vative estimates, the costs associated with crashes are verylarge for any target group. Even small reductions in crashes ina major target group will result in tens of millions of dollarsin direct economic savings to the state.
States can increase the precision with respect to the num-bers shown in Table 4 by determining the actual number offatal victims in the state within each target group. For ex-ample, instead of taking the national average of 11% of allfatalities being pedestrians, states can use their own numberof pedestrian fatalities per year. In order to arrive at a stableestimate for smaller target groups, most states will likelyhave to calculate an average number of deaths across severalyears. Two or three years of data should be sufficient formost states; as many as five years may be needed for smallerstates.
Countermeasure Effectiveness
The estimated effectiveness of a countermeasure was basedon research and evaluation studies for that countermeasure.These effectiveness estimates for 23 Proven countermeasures,along with a brief statement regarding relevant research cita-tions, are detailed in Appendix B. When estimated effectswere reported as a range, the lowest estimate of effectivenesswas used. For instance, if the fatal and/or injury reductionassociated with a given countermeasure as based on threehigh-quality evaluation studies was 10%, 12%, and 16%, re-spectively, then the 10% figure was used in the calculation ofsavings.
Use of the lowest effectiveness number, although perhapstoo conservative in some cases, should allow states to makebenefit/cost decisions without the need to assume that theirimplementation would be “exemplary” or “extraordinary” ascompared to previously demonstrated effective efforts. Statesplanning an “exemplary” implementation can recalculatetheir benefit estimates based on the middle or high estimate.
C H A P T E R 5
Estimation of Savings

If estimated effectiv eness is 10% 20% 30% 40% 50%
Target Cost for
example state
Percen t of all
fatalities then resulting estimated sav ings are: All fatalities and injuries $2,954,577,660 100 $295,457,766 $590,915,532 $886,373,298 $1,181,831,064 $1,477,288,830
Fatalities and injuries involving alcohol-impaired drivers $537,848,587 35.46 $53,784,859 $107,569,717 $161,354,576 $215,139,435 $268,924,294
Alcohol-related involving drivers with previous DWI convictions $41,509,775 2.74 $4,150,978 $8,301,955 $12,452,933 $16,603,910 $20,754,888 Alcohol-related $626,096,874 41.28 $62,609,687 $125,219,375 $187,829,062 $250,438,750 $313,048,437
Belt use: unbelted front seat outboard occupant, passenger vehicle $1,082,328,300 30.89 $108,232,830 $216,465,660 $324,698,490 $432,931,320 $541,164,150 School-aged pedestrians $3,750,385 0.30 $375,039 $750,077 $1,125,116 $1,500,154 $1,875,193 Unhelmeted bicy clists ages 12 and under $4,512,100 0.17 $451,210 $902,420 $1,353,630 $1,804,840 $2,256,050 Bicy clists age 12 and under $4,573,075 0.18 $457,308 $914,615 $1,371,923 $1,829,230 $2,286,538 Unhelmeted bicy clists age 13 and up $39,572,340 1.52 $3,957,234 $7,914,468 $11,871,702 $15,828,936 $19,786,170 Teen drivers $268,232,054 5.37 $26,823,205 $53,646,411 $80,469,616 $107,292,822 $134,116,027 Underage drivers with BAC .01 $99,061,459 6.53 $9,906,146 $19,812,292 $29,718,438 $39,624,584 $49,530,730 Speed related $609,535,127 27.01 $60,953,513 $121,907,025 $182,860,538 $243,814,051 $304,767,564 Elderly drivers (75+) $177,202,538 7.35 $17,720,254 $35,440,508 $53,160,761 $70,881,015 $88,601,269
Table 4. Median state fatality and cost estimates.

Estimating the potential cost savings associated with any ofthe Proven countermeasures (for which an effect size is pro-vided) is a relatively straightforward algebraic calculationwhen the following parameters are known:
1. The target group size (i.e., the number of fatalities andinjuries in crashes addressed by the countermeasure);
2. The estimated effectiveness of the countermeasure(i.e., the percentage reduction produced by the counter-measure); and
3. The estimated dollar value of each fatality and injuryavoided.
Example
The first countermeasure shown in Appendix B is SchoolPedestrian Training for Children. The target population forthis countermeasure is pedestrian crash victims, ages 6 to 12.This target group comprised 0.303% of all fatalities (129 of42,642) in 2006. Based on this proportion, our “typical” statewith 600 annual fatalities might expect that 1.82 of its totalnumber of victims would be pedestrians 6 to 12 years of age.Based on the last column of Table 2, the estimated injury/fatality ratio for pedestrians is 31.4/1. Thus, this typical statemight expect 57 (MAIS 1-5) injuries annually, in addition tothe 1.82 fatalities.
Based on the estimated unit costs of $1,115,820 per fatalityand $30,238 per MAIS 1-5 injury (see Table 3), the total costassociated with 1.82 deaths and 57 injuries among childpedestrians would be $3,750,385 per year in this typical state.Again, these estimates should be considered to be conserva-tive. They make no adjustment for pain and suffering andthey make no adjustments for age of the victim. The life of anelderly victim, using this estimation procedure, is consideredto be equally valuable to that of a child, a teenager, the parentof a child, or anyone else. That is, the costs reported here areaverages across all ages.
The results of known evaluations of child pedestrian train-ing (see Appendix B) suggest that such training can reducechild pedestrian injury by about 12%. Applying this effect size
as a 12% reduction in the $3,750,385 cost estimate associatedwith child pedestrian deaths and injuries yields an estimatedsaving of $450,046.
Can the typical state with 600 fatalities conduct childpedestrian training statewide for $450,046 or less? If theanswer to this question is yes, then this countermeasure willbe cost effective. That is, the benefit will exceed the cost. Evenif the answer is no on a statewide basis, the state may decideto limit implementation of the countermeasure to those juris-dictions, typically urban, where child pedestrian crashes aremost common. This should substantially reduce implemen-tation costs while retaining much of the benefit.
Proven Countermeasures
Similar calculations are possible for 23 of the Proven coun-termeasures. Such calculations, detailed in Appendix B, aresummarized in Tables 5 through 8. The savings possible fromthese 23 countermeasures for a typical state with 600 fatali-ties range from $450,046 (for school pedestrian training) to$121,907,025 (for automated enforcement).
Table 5 provides cost-savings estimates for the two Provenvoluntary action countermeasures for which crash/death/injury reduction estimates are available. It suggests that an esti-mated savings of $450,046 would be associated with an effec-tive pedestrian countermeasure and a savings of $6,140,394would be associated with an effective booster seat program.Note that both of these countermeasures involve children,teachers, and parents. With regard to adult behavior, the lit-erature suggests that education and information can be effec-tive only when it is used in support of some other measure,such as enforcement or sanctions. It is not likely to be effectivewhen it is used alone.
Finally, unless there is some form of mass media commu-nications effort associated with the programs in Table 5, orthere is a plan for implementing these countermeasures widelyacross the state or across the majority of communities withinthe state, these measures are likely to have only a specific effect.That is, their impact will be limited to those targets wheresuch programs are implemented (e.g., in a specific school or
15
Countermeasures Target population Name Cost* Description No. of
fatalitiesNo. of
injuries
Highwayloss ($)
Reduction(%)
Savings($)
Schoolpedestriantraining for children
Low Pedestrians ages 6 to 12
2 57 $3,750,385 12% $450,046
Booster seat promotions
Medium Children ages 4 to 8 not in booster seat
4 2,530 $80,794,661 8% $6,140,394
*Cost column is from NHTSA (2007b).
Table 5. Voluntary actions.

community). For these countermeasures to result in a generaleffect, one that is likely to measurably reduce deaths and in-juries, they must be broadly implemented across the stateand, a plan for doing so should be considered along with theiradoption.
Table 6 lists the nine Proven countermeasures for laws,regulations, or policies. The estimated savings associated withthese countermeasures ranges from $557,915 for a child bike
helmet law to $75,762,981 for a primary belt law. Each ofthese measures, if publicized, is likely to result in a general,rather than a specific, effect. That is, each is likely to affect alarge portion of the target population across the state and, assuch, is likely to produce measurable reductions in deathsand injuries.
These countermeasures have three important advantages.First, implementation of a law can often be done at relatively
16
Countermeasures Target population Name Cost Description No. of
fatalitiesNo. of
injuries
Highway loss ($)
Reduction(%)
Savings ($)
Bike helmet laws for children
Medium Unhelmeted bikers under age 12
1 91 $3,719,434 15% $557,915
Graduateddriver licensing
Medium 16-year-old drivers
12 3,318 $114,143,621 20% $22,828,724
Extendedlearner permit
Low 16-year-old drivers
12 3,318 $114,143,621 22% $25,111,597
Nightrestrictions
Low 16-year-old driversnighttimecrashes
4 954 $32,816,291 50% $16,408,146
Passengerrestrictions
Low 16-year-old drivers w/ teen passengers
7 1,900 $65,373,165 33% $21,573,144
Administrativelicenserevocation
High Impaired drivers
213 9,936 $537,848,587 13% $69,920,316
Primary seat belt law
Low Unbelted front seat occupants
185 28,954 $1,082,328,300 7% $75,762,981
Motorcycle helmet law
Low Motorcyclists 65 2,261 $141,442,973 20% $28,288,595
Reduced speed limits (for pedestriansafety)
Low Pedestrians in 60km/h (37 mph) urban zones
16 489 $32,154,461 25% $ 8,038,615
Table 6. Laws, regulations, and policies.
Countermeasures Target population Name Cost Description No. of
fatalitiesNo of
injuries
Highway loss ($)
Reduction(%)
Savings ($)
Sobrietycheckpoints
High Impaired drivers
213 9,936 $537,848,587 20% $107,569,717
Short, high-visibility belt law enforcement
High Unbelted front seatoccupants
185 28,954 $1,082,328,300 3% $27,274,673
Automatedenforcement:speed cameras
High Speeding drivers
162 14,177 $609,535,127 20% $121,907,025
Mass media to support alcohol enforcement or other program
High Impaired drivers
213 100 $537,848,587 13% $69,920,316
Communityprogram including age-21enforcement
High Drinking drivers under age 21
39 1,830 $99,061,459 10% $9,906,146
Table 7. Laws plus enhancements.

modest cost. Second, there is some permanence to their im-pact (i.e., once a safety measure becomes law it tends to remainlaw). Thus, it is often true that these are one-time costs withbenefits seen year after year thereafter. Third, all laws have thepotential for general, rather than specific, effects. Unlike aneducation program (or an unpublicized sanction), for whichexposure tends to be limited, laws potentially affect everyonewithin the jurisdiction covered by them. Two of the require-ments for laws to be effective are that they are enforced andthat they (both the law and the enforcement) are publicized.Thus, the costs of enforcement and publicity should also beconsidered when adopting any of these laws.
Table 7 lists the five Proven countermeasures for laws plusenhancements. The estimated savings associated with thesecountermeasures range from $9,906,146 for communityprograms including age-21 enforcement to $107,569,717 forsobriety checkpoints and $121,907,025 for automated enforce-ment. Like laws, each of these countermeasures, if fully imple-mented and publicized, has a strong potential for providing
a general effect and, as such, each is likely to result in mea-surable reductions in deaths and injuries.
These countermeasures are characterized by a very highpayoff. However, they can also involve high implementationcosts. For instance, in order for sobriety checkpoints to realizetheir full potential, they need to be implemented across theentire jurisdiction throughout the year. That is because theirimplementation needs to convince all (or at least most) mo-torists that they have a very real chance of being arrestedshould they choose to drink and drive. Available data suggestthat drivers resume their typical drinking and driving behav-ior when checkpoints are discontinued. Still, $107 million isa very large savings for the “typical” state with 600 fatalities,and this countermeasure should receive serious consideration.
Table 8 lists the six Proven countermeasures for sanctionsand treatments. The estimated savings associated with thesecountermeasures range from $2,905,684 for mandatory atten-dance at alcohol treatment programs to $30,819,910 for licensesuspensions for poor and aggressive driving records.
17
Countermeasures Target populationName Cost Description No. of
fatalitiesNo. of
injuries
Reduction(%)
Aggressive driving: license suspension
Medium Drivers w/ previousspeedingconvictions
47 4,250 17%
Aggressive driving:individualmeetings
Medium Drivers w/ previousspeedingconvictions
47 4,250 8%
Aggressive driving: group meetings
Medium Drivers w/ previousspeedingconvictions
47 4,250 5%
Aggressive driving: warning letters
Medium Drivers w/ previousspeedingconvictions
47 4,250 4%
Mandatoryattendance at alcoholtreatmentprograms
Medium DUI-convicted drivers in alcohol-relatedcrashes
16 767 7%
Alcoholinterlocks (when installed)
Medium DUI-convicted drivers in alcohol-relatedcrashes
16 767
Highwayloss ($)
$181,293,587
$181,293,587
$181,293,587
$181,293,587
$41,509,775
$41,509,775 37%
Savings ($)
$30,819,910
$14,503,487
$9,064,679
$7,251,743
$2,905,684
$15,358,617
Table 8. Sanctions and treatments.

18
Final decisions as to whether a state may choose to imple-ment a given countermeasure—or not—often will depend onthe cost of implementation versus the expected benefit fromimplementation. Expected benefits are covered in the previ-ous chapter. This chapter will address the issue of cost ofimplementation.
Cost may be thought of as falling into four general areas:political capital, resource allocation, user pay, and direct cost.Benefit/cost ratios typically are based on the direct cost to thestate highway safety office (SHO) of implementing a givencountermeasure. However, direct cost is not the only cost.Very often direct cost is not even the most significant cost orconsideration when selecting a given countermeasure forimplementation.
Political Capital
Each state will make an assessment of what is doable—andnot doable—each year in their highway safety plan. This de-termination becomes a judgment call that can only be madeat the state level. Is a mandatory motorcycle helmet law pos-sible given the current legislature? How about a primary seatbelt law or an upgrade to the graduated licensing law? Whatcan realistically be accomplished and what initiatives should begiven priority? In general, most SHOs work toward a priori-tized and limited set of objectives for each legislative session,rather than pursuing an omnibus list of possible new legisla-tive initiatives.
Direct costs associated with passing and implementing leg-islation, although generally modest, are nonetheless real, andneed to be considered as a bill moves forward and passageappears likely. For instance, Oregon estimated that adminis-trative costs associated with implementing their new GDL lawwere $150,000. They also estimated that the crash reductionbenefit to the state of Oregon was nearly $11 million, resultingin a benefit/cost ratio of 73/1. That is, there was a $73 savingsfor every dollar invested. Benefit/cost ratios of this magnitude
would be expected from most of the proven legal and regula-tory countermeasures, although such ratios are rarely the de-ciding factor on whether to pass such legislation.
Political capital also refers to the tolerance and acceptance ofthe general public for highway safety initiatives. The generalpopulation has come to expect holiday crackdowns on drunkdriving, speed, and aggressive driving. Would they welcomeautomated speed enforcement? How about automated speedenforcement around school zones?
Political capital is a real, yet largely nonquantifiable, cost.Most of the law and policy countermeasures listed as Provenand considered effective in the previous section cost little interms of dollars and their benefit/cost ratios are enormous.Yet, they may require a large amount of political capital and,as such, may be out of reach at this time in some states.
Resource Allocation
States that have prioritized speeding as the number oneenforcement issue will not be spending much time on red-light running. There are only so many officers and overtimehours that an enforcement agency can fill. Similarly, if theSHO is inundating media outlets with child safety messages,these same outlets will not also be receptive to a drunk driv-ing campaign at the same time. Or, if SHO staff have beentasked with community outreach, it is not likely that they willalso be available for the development of other programs. Sim-ilarly, if sister state agencies and nonprofit organizations arebeing asked to focus on one campaign, they may not be ableto assist in other areas as well.
Many of the resources available to a state office are neitherrenewable nor expandable. They are fixed and, once deployed,will not be available for some other effort in any specifiedtime period. The “cost” of deploying these resources in pursuitof one goal is the potential for missing the opportunity topursue some other goal. Although these costs are real, likepolitical costs, they are difficult to quantify. Such costs are
C H A P T E R 6
Estimation of Cost to Implement Countermeasures

minimized by deploying these nonrenewable resources inpursuit of those countermeasures that will produce the great-est reduction in highway loss.
A common phrase is: If I can save one life, it will all beworth it. Perhaps, but SHOs do not have this luxury. If theydeploy a measure that saves one life rather than deploying ameasure that could have saved three lives, using the sametime and money, then they have, in effect, killed two people.
User Pay
A large proportion of the cost, and—not incidentally—thebenefit, for implementing highway safety initiatives is borneby the client or the user of that initiative. Such costs are quan-tifiable, yet they rarely enter into consideration of whether toimplement a selected countermeasure. Parents, not the state,are the ones who most often purchase a child restraint, boosterseat, or bike helmet. Convicted drunk drivers are the oneswho most often pay for their alcohol assessment, rehabilita-tion, or vehicle interlock. Only a small proportion of the costsfor both child safety and alcohol sanctioning programs areborne by the state. As such, these programs need only mar-ginal effectiveness in order to be very cost effective.
Another source of user pay is the fines that violators paywhen convicted of speeding, red-light running, and otherviolations. Fines that are collected typically go to the state,county, or municipal General Fund. Fees collected are oftenused to support the court and the rest of the adjudication sys-tem. We do not have a tradition of counting General Fundrevenue as an offset for the cost of countermeasure imple-mentation. In fact, our tradition is the opposite. We attemptto build a wall between the revenue generated from ticket writ-ing and the agency performing the service. We do not want thepublic to feel that the police will profit from writing a ticket.
What is the benefit/cost ratio from writing tickets? It maybe quite large, particularly if the ticket writing results in morerevenue to the General Fund than the agency and adjudica-tion costs associated with the activity. Either way, it is not anumber that we generally include in our benefit/cost ratios,nor is it one that we are likely to include in such calculationsin the foreseeable future.
Automated speed enforcement and red-light runningcameras are a clear exception. Here, we want to know theimplementation and operation costs of the systems and wewant to know that the fines generated will cover these costs.The expectation is that these systems will be at least revenueneutral. That is, they will generate a sufficient amount of finerevenue to cover their implementation and maintenancecosts. If successful, and if they reduce crashes, their benefit/cost ratio will be very large. A Government AccountabilityOffice (GAO) report (2003), found that photo enforcementprogram revenues were lower than program costs in three
jurisdictions, while revenues in two other jurisdictions ex-ceeded program costs. It seems likely that both technologies,automated speed and red-light running, are now sufficientlydeveloped such that a jurisdiction can implement either oneas revenue neutral and/or with excess revenue devoted tosome worthwhile purpose such as education.
Automated speed enforcement and red-light running haveone additional important feature that sets them apart fromofficer-dependent ticket writing. The fine is assessed againstthe vehicle, not against the driver. Thus, no drivers will havetheir drivers license suspended or insurance increased if theirvehicle is photographed violating the law. While this effect isnot necessarily desirable from a general deterrence point ofview, it is an important distinction that has made such pro-grams acceptable in some communities.
Direct Cost
Last, but not least, is the issue of direct cost. That is, coun-termeasures that consume real dollars from highway safety,enforcement, or other budgets and need to be weighed againstbenefits to justify the expenditures. Surprisingly, there arerelatively few Proven countermeasures that fall into this cate-gory. With regard to the countermeasures discussed through-out the remainder of this chapter, cost estimates are drawnfrom original documents that documented their effectiveness(and costs) and from experience with ongoing programs.These estimates are clearly imprecise and, as such, need to beviewed as only a starting point for planning purposes. Actualcost estimates for a given program implemented in a givenstate and in a given year have often come primarily fromthe grants awarded by the states. The following subsectionsare intended only to outline costs that have been reported inthe past, based on existing research reports.
School Pedestrian Training for Children
Most of the available “programs in a box” that are orientedtoward a particular grade level are low cost and easy to im-plement. Per-student costs for school pedestrian trainingmaterials range from less than one dollar to two dollars.Statewide coverage for a first-year K-6 program might cost$500,000 to $800,000 for a “typical” state with 600 fatalities.As was suggested earlier, estimated savings from such aprogram would be $450,046, suggesting that the effort wouldhave a negative return on investment. However, most of thecosts outlined are first-year costs which, if amortized overseveral years, would bring subsequent year costs down to amuch lower level. Moreover, the program could be targetedto only those urban areas that have a substantial child pedes-trian safety problem, further reducing implementation costsand providing the potential for a positive benefit/cost ratio.
19

Booster Seat Promotions
It is likely that a comprehensive booster seat programwould involve a large number of entities and activities suchas the following: a community coalition of agencies and orga-nizations to promote booster seat use; a citizen advisory groupof parents and caregivers to provide feedback on campaignmessages and materials; development of strategies to ensurecommunity involvement; community education; newspaperarticles; organization and group newsletter articles; a boosterseat website; tip sheets, brochures, and flyers in multiple lan-guages; a telephone information line for parents; resource kitsfor preschools and health care providers; radio and TV publicservice announcements; educational programs to addressbarriers to booster set use; discount booster seat coupons($10 off); car seat training program and in-services for healthcare providers, child care providers and educators, law en-forcement, EMS personnel, and advocates.
Direct costs for such an effort, for the typical 600-fatalitystate, could range from a low of $300,000 (assuming substan-tial donated time and effort from cooperating agencies) to asmuch as $800,000 (assuming paid media and coupons to low-income families). As indicated, estimated savings from sucha program would be $6,140,394 suggesting that the effortwould have a benefit/cost ratio (i.e., return on investment)ranging from 8/1 to 20/1. That is, a return of $8 to $20 wouldbe expected from each dollar invested.
Sobriety Checkpoints
The most recent documented, comprehensive statewidesobriety checkpoint program was implemented in Connecticutin 2003 (Zwicker, Chaudhary, Maloney et al., 2007). The stateused paid media in support of a statewide program of sobri-ety checkpoints. Costs for this program were approximately$1.25 per resident of the state. So, if a typical 600-fatality statehad a population of 5 million people, then the program mightcost $6.25 million (about $7 million, adjusted for inflation).As computed earlier, estimated savings from such a programwould be $107,569,717, resulting in a benefit/cost ratio of 15/1.That is, a return of $15 would be expected from each dollarinvested.
Short, High-Visibility Belt Law Enforcement
A comprehensive Click It or Ticket (CIOT) Program hasgenerally included paid media ($300,000 to $500,000); at leastone law enforcement liaison to recruit enforcement agencyparticipation ($100,000 per year, minimum); plus enforce-ment grants to police agencies (possibly $200,000 to $500,000for an average-size state). Total costs should range fromabout $600,000 to just over $1 million. As computed earlier,
estimated savings from such a program would be $27,274,673suggesting that the effort would have a benefit/cost return oninvestment of 27/1 to 45/1. That is, a return of $27 to $45would be expected from each dollar invested.
Mass Media Supporting Alcohol Enforcement
Eight mass media studies that showed positive effects werereviewed by the Task Force on Community Preventive Ser-vices, a group supported by the Centers for Disease Controland Prevention (CDC). Cost information was provided for twoof these mass media programs. Based on 1997 U.S. dollars,a Victoria, Australia, campaign cost $403,174 per month inits first 23 months for advertisement development, support-ing media, media placement, and concept research. Estimatedsavings from medical costs, productivity losses, pain and suf-fering, and property damage were $8,324,532 per month,with $3,214,096 of this being for averted medical costs. Thus,the benefit/cost ratio, as computed from this Australian pro-gram, would be approximately 20/1.
In the United States, a six-month campaign was conductedin Kansas. It used paid media (in Wichita) and public serviceannouncements (in Kansas City). Total costs were estimatedto be $454,000, and $322,660 in these two cites, respectively.Included were costs for planning and evaluation, messageproduction, and media scheduling. Total savings from avertedcosts of insurance administration, premature funerals, legaland court expenses, medical payments, property damage, re-habilitation, and employers’ losses were estimated at $3,431,305for the Wichita campaign, and $3,676,399 for Kansas City.The benefit/cost ratio, as computed from these numbers,would be approximately 8/1 for Wichita and 11/1 for KansasCity.
Community Programs IncludingAge-Twenty-One Enforcement
Massachusetts conducted comprehensive safety programsin six communities beginning in 1988. Each community im-plemented age-21 minimum drinking age (MDA) enforcementas part of a broader endeavor including efforts to reducespeeding and increase seat belt use. Costs in 1988 dollars wereapproximately $1 per person per year. Funds were used to payfor a coordinator, added police enforcement, other programactivities, and the purchase of materials. In addition, eachcommunity included substantial voluntary efforts. Whatwould such a program cost today? It is estimated thatapproximately $2 to $3 per person would be required and, ascomputed earlier, estimated savings from such a programwould be nearly $10 million. Here, the costs of such an effortwould be roughly equal to the savings.
20

States wishing to pursue such a comprehensive communityeffort should consider primarily targeting communities thathave an identified under-age drinking problem. Such pro-grams are routinely implemented, for instance, in collegetowns and vacation destinations frequented by young per-sons. In this way, the program effort and resources are con-centrated in communities that would benefit most from aneffective program.
Individual Meetings, Group Meetings,and Warning Letters
Benefit/cost evaluations of individual meetings, groupmeetings, and warning letters have been reported in studiesconducted by the California DMV. These studies suggestedthat all three approaches may be cost effective, although thewarning letter consistently provides a higher benefit/cost
ratio than the other two approaches. Although the warningletter produces the smallest reduction in crashes (4% versus5% for group meetings and 8% for individual meetings) itcan be implemented at the lowest cost.
It is estimated that a warning letter program can be imple-mented at a cost of approximately $2 per letter. The typical600-fatality state might issue approximately 200,000 speedingtickets per year. Thus, if a warning letter was sent to everyviolator, the cost of the program would be approximately$400,000. The benefit (see Appendix B) is estimated at$7,251,743 for a benefit/cost ratio of approximately 36/1. Thecost of a group meeting program is estimated at approximately$30 per attendee, and the cost of an individual meeting isestimated at $100. Thus, neither of these two approaches wouldbe particularly cost effective if applied to every speed violator.Likely because of these higher costs, states have generally re-served these intensive interventions for multiple offenders.
21

22
The overall goal of this project is to help states allocatetheir money effectively. This chapter summarizes the infor-mation developed thus far into guidelines for doing so, asfollows:
1. It is critically important to focus on countermeasures thathave been proven to be effective (i.e., Proven countermea-sures); that can be accomplished within existing financialand political constraints; and that will provide the greatestbenefit/cost return on invested resources.
2. It is appropriate to examine those countermeasures thatare judged Likely to be effective, even though there may notyet be firm evidence that they reduce crash injury. Some ofthese may be quite appropriate for inclusion in your high-way safety plan, although it may be necessary to conductadditional evaluations of their effectiveness, since cur-rently available data are not definitive.
3. To the extent possible, a state should avoid countermea-sures that are unlikely to be effective or for which theeffects are unknown (i.e., Unknown/Uncertain/Unlikelyeffective countermeasures). This will be quite a challengesince nearly half of the 104 listed countermeasures are inthis category. To the extent countermeasures in thisgroup are considered, priority should be given to thosewith plus (+) ratings, indicating there is some basis sug-gesting they may work, although not enough to place themin the Likely group.
4. It is important to stay away from measures that areknown to have negative consequences (i.e., those ProvenNot to Work). This may also be difficult due to commonlyaccepted views of such actions (e.g., providing driver ed-ucation as a more expedient way to license young novicedrivers).
5. A state may want to explore newly developing, innovativecountermeasures that are untried. Guidelines are suggestedfor how to assess such new countermeasures.
1. Identify Proven InjuryReducing CountermeasuresThat Can Be Implemented
There are 23 countermeasures that are rated as Provenand for which injury reduction estimates are available (see Appendix B). Any of these measures that have notyet been implemented in a given state should be consid-ered first for inclusion in a state’s highway safety plan.The countermeasures in this Proven classification are asfollows:
1. School pedestrian training,2. Booster seat programs,3. Bike helmet law for children,4. Motorcycle helmet use law,5. Primary seat belt law,6. Short, high-visibility belt law enforcement,7. GDL,8. Extended learners permit,9. Night restrictions for young novice drivers,
10. Passenger restrictions for young novice drivers,11. Administrative license revocation,12. Mass media in support of alcohol (or other) enforcement,13. Mandatory attendance at alcohol treatment programs,14. Sobriety checkpoints,15. Alcohol safety interlocks,16. Multi-component community programs to address under-
age drinking,17. Speed cameras (automated speed enforcement),18. Red-light cameras (automated red-light enforcement),19. License suspension,20. Individual meetings for traffic violators,21. Group meetings for traffic violators,22. Warning letters for traffic violators, and23. Reduced speed limits (for pedestrian safety).
C H A P T E R 7
Using this Guide

It is recognized that it may not be feasible to implementsome of these measures at the present time. There may bepolitical, legal, or financial constraints that make currentimplementation difficult, if not impossible. Alternatively, im-plementation may not be possible at the present time becausethe likely quality or intensity of activity that your state can pro-vide is not sufficient to fully implement the countermeasure.
For example, in the Voluntary Action Group, booster seatpromotions and parent management programs are rated asProven, but this rating is based on programs that are of veryhigh quality. Successful programs in these areas have beenquite sophisticated, involving techniques associated withmore effective PI&E programs (e.g., interactive methods, in-puts from multiple sources, long-term programs, financialincentives, etc.). Lesser-quality programs that are short term,or that are based on didactic approaches or posters in schools,for example, are not likely to increase booster seat use, or toinfluence parents to better manage their teenagers’ drivingpractices. In general, every PI&E program proposed, whetherit is used alone or in conjunction with other measures, needscareful formative evaluation and development to ensure thatit is of sufficiently high quality and that it is based on behav-ior change principles.
There is a second-level judgment to be made as well. PI&Eprograms that work tend to have high development andimplementation costs, and one consideration in funding suchprograms is whether or not they are intended to be repeated.For example, a booster seat program run one time in onecommunity may increase use, but can it be repeated and/orsustained, and is it a program that other communities canadopt? This is somewhat of a Catch-22 situation, because inorder to work, such a program may have to be so extensive andthorough (with associated costs) that it is outside the reach ofother communities. On the other hand, there are more modestPI&E programs for children, such as the Willy Whistle pro-gram for teaching young children how to cross streets, thathave modest costs associated with them and could readily beapplied in school systems across the state. Still, it shouldbe remembered that the savings associated with effectiveprograms are substantial and that high-cost programsthat produce substantial effects can be a stimulus for othersuch programs. There have been demonstration programs,for example, that have had high costs but that have also be-come models for other, often large-scale, effective efforts. Forexample, the seat belt enforcement program in Elmira, NewYork, was a high-cost effort, but it demonstrated that vigor-ous enforcement of belt use laws could be done with highpublic acceptance. This paved the way for the North CarolinaCIOT Program and eventually led to the nationwide launchof high-intensity belt use enforcement programs (i.e., thenational CIOT mobilizations).
Another issue that must be considered in selecting Provencountermeasures is how long the program must be maintainedto be effective or cost effective. This is a major considerationfor some of the programs in the Laws Plus EnhancementsGroup. For example, sobriety checkpoints are a proven tech-nique, but to work they have to be sustained over time. Ifcheckpoints are run for just a short period of time, such asduring a single holiday period, they are likely to have little orno long-term effect. Short-term media bursts to supplementlaws also have very limited effects.
In establishing an effective countermeasure program(and selecting countermeasures for that program), it is alsoimportant to take advantage of favorable trends. Graduatedlicensing provides a good example of a trend that is bothpopular and effective at the present time. Research is now avail-able that has established the importance of the core elementsof graduated licensing (extended learner permit, night andpassenger restrictions, are all rated Proven). Some states do nothave these provisions or have weak versions of them. Estab-lishing or upgrading the key provisions of GDL is an impor-tant step forward. Because of the current trend of activitiesand public support, this may be an opportune time for a stateto assess and upgrade its novice driver GDL program.
Some countermeasures are both highly cost effective andhighly controversial. Automated speed and red-light enforce-ment provides a case in point, especially in reference tospeed cameras. Controlling high speeds is an important goal,and speed cameras are a proven countermeasure in accom-plishing this goal. It is important to note, however, thatcommunity programs involving camera technology can bedesigned in ways that are publicly acceptable. Such programsexist in Scottsdale, Arizona; Charlotte, North Carolina; andMontgomery County, Maryland, and can be used as models.General guidelines also are available for conducting speed-control programs that are effective and acceptable, using suchtechniques as focusing on “extreme” speeders and speedingin school zones (Harsha and Hedlund, 2007).
Some highly effective countermeasures simply may not bepossible given existing state law or political climate. Sobrietycheckpoints, for instance, are not legal in some states, anda motorcycle helmet law or a primary seat belt law simplymay be out of reach given the current legislature.
The result of this process will be the selection of Provencountermeasures for inclusion within the state’s highwaysafety plan that can be accomplished within the political,legal, and financial conditions that currently exist withinthe state. In addition, to be effective, the state must recognizethat these countermeasures must share two characteristics:(1) that they can be implemented; and (2) that they can beimplemented to the level necessary to achieve crash and in-jury reduction.
23

Implementation, in some cases, need not be statewide.Urban jurisdictions will have a greater need for pedestriancountermeasures than their rural counterparts; rural areasmay be more concerned with speeding than are urban areas;college communities will be more concerned with underagedrinking than other parts of the state. Problem identification(i.e., identification of the who, what, when, where, and whyof any particular target group of fatal and nonfatal injuries)should be used to cost effectively deploy programs.
2a. Use Countermeasures That Are Likely To Be Effective
Thirteen of the 104 countermeasures are listed as Likely tobe effective. Each of these countermeasures fits within theeffectiveness guidelines for its classification (i.e., VoluntaryAction; Laws; Laws Plus Enhancements; or Sanctions andTreatments Groups). This means that, based on what has beenseen with other similar countermeasures, these countermea-sures should be effective, if properly or fully implemented.These Likely to be effective countermeasures include the fol-lowing (references are provided in Appendix C):
1. Responsible beverage service;2. Parent guiding teen licensing;3. Ice cream vendor ordinances;4. Local primary seat belt laws or ordinances;5. Adult bicycle helmet laws;6. License renewal policies for elderly drivers;7. License actions for underage alcohol violations;8. Integrated enforcement (e.g., alcohol, seat belts, speeding);9. Zero-tolerance enforcement;
10. Vendor compliance checks for age-21 enforcement;11. Sustained seat belt enforcement;12. Increased belt use law penalties; and13. Simplifying and streamlining DUI statutes.
Each of these Likely countermeasures has been imple-mented in one or more jurisdictions in the past and most havebeen evaluated with positive results. However, the evaluationsof these countermeasures have typically focused on intermedi-ate measures of effectiveness (e.g., number of bicycle helmetsdistributed, number of drinks served, number of arrests, in-creases in seat belt use, etc.), often within limited areas ofa state or community. These countermeasures may be pre-sumed to be effective, although the full benefit they provide asmeasured by injury reduction is not fully established.
It is suggested that Likely countermeasures be consideredside by side with Proven countermeasures for which benefitinformation is not available. Both tend to positively impactsome intermediate measure of highway safety that should,eventually, reduce injury.
2b. Consider ProvenCountermeasures with No Effectiveness Estimates
There are some countermeasures that are Proven yet theevaluation evidence does not provide estimates of crash re-duction. These countermeasures are discussed and refer-enced in Appendix D.
1. Speed limits,2. BAC test refusal penalties,3. Saturation patrols for alcohol-impaired driving,4. Preliminary breath test devices,5. Passive alcohol sensors,6. Restrictions on plea bargaining,7. Court monitoring,8. Brief interventions (alcohol),9. Vehicle immobilization,
10. Vehicle impoundment,11. Close monitoring of DUIs,12. PI&E supporting belt law enforcement, and13. Child bicycle helmet promotions.
Speed limits, or more particularly, “rational speed limits,”can limit the number of speed violators and reduce thevariance between vehicles traveling at the fastest speeds andvehicles traveling more slowly on a particular stretch of road.This will make speed-related crashes less likely. However,there is no direct formula for creating a crash reduction esti-mate. Moreover, for most jurisdictions, the number of milesof roadway for which rational speed limits are applicable islimited. Therefore, statewide implementation of this coun-termeasure is not possible. This should be viewed as a localcountermeasure.
As indicated, the next four countermeasures on the listshown above all deal with increasing the arrest rate of drink-ing drivers and/or collecting more complete evidence. Each ofthese should be thought of as enhancements to the process offinding, arresting, and prosecuting offenders. Obviously,improvements in the process are desirable and this process hasstrong general deterrence potential. However, as above, thereis no direct formula for creating a crash reduction estimate.
The next group of six countermeasures on the list deal withincreasing the probability of conviction and the severity ofsanction for drinking drivers. Certainty and severity of sanc-tion are the desirable goal. However, again, there is no directformula for creating a crash reduction estimate from thesecountermeasures.
Child bicycle helmet promotions increase use to varyingdegrees, but do not yield estimates of injury reductions. Sim-ilarly, PI&E in support of belt law enforcement can increaseuse but does not readily convert to injury reductions.
24

Decisions to implement these countermeasures will needto be made without direct estimates of their potential crashreduction benefits. Many will play an important role in thedevelopment of a highway safety plan. However, final deci-sions will need to be made on identified need for processimprovements and judgment as to how these measures maybe used to fill those needs.
3. Avoid Countermeasureswith Unknown and Unlikely Effectiveness
Many of the Unknown/Uncertain/Unlikely countermea-sures are in the Voluntary Action Group. The education andinformation approach that characterizes these countermea-sures is popular. This group involves more than one-third ofall the countermeasures. It has, by far, the highest percentageof countermeasures of unproven effectiveness (84%).
Many voluntary action programs have long been known tobe ineffective, but their popularity remains. Exhorting peopleto take some preferred health action for their own benefit iseasy to do and gives the appearance of doing somethingimportant for society; sometimes these efforts are referred toas feel-good programs. A somewhat cynical appraisal of thissituation was presented by Stone (1989, p. 891), who notedthat “. . . health education is cheap, generally uncontrover-sial, and safe: if it works, the politicians take the credit, and ifit does not, the target population takes the blame.” In thiscontext, the following conclusions of Williams (2007a, p. 9)bear repeating:
Never assume that a PI&E program will be successful. In fact,most PI&E programs do not lead to a measurable reduction incrashes or injuries. . . . Never assume that a PI&E program willdo no harm. Some well-meaning educational programs, albeit avery few, actually lead to more crashes and injuries. Moreover,the implementation of a program that does not work will limitthe amount of resources available for programs that can make adifference.
Avoidance of ineffective countermeasures is by no meanslimited to the voluntary action group, but applies to the otherthree groups as well. Passing laws that have limited publicacceptability or that are not readily enforceable are two ex-amples. Enforceability is a key issue. Much current attentionin the United States has been given to distracted, fatigued,and aggressive driving. However, enacting laws against thesebehaviors, although it may be a popular approach, is likelyto have little effect because they are difficult for police toenforce.
Laws against hand-held cell phones constitute a separatedistracted driving issue. General cell phone laws are listed ashaving uncertain impact. The behavior is observable by police,
but the evidence indicates minimal decreases in use unless thelaw is enforced (McCartt, Hellinga, and Geary, 2006). How-ever, research has indicated that the distraction is the cellphone call itself, not whether it is hands free or hands on.
States choosing to implement countermeasures in theUnlikely/Unknown group need to emphasize those listedwith plus (+) ratings. Whatever the choice, states will needto conduct a comprehensive evaluation and take correctiveaction at the first sign of trouble. Again, resources spent formeasures that do not work will limit the resources availablefor things that will work.
4. Do No Harm
Some programs with potentially negative effects (ProvenNot to Work) have become popular. For instance, programsthat teach teenagers advanced driving maneuvers, typicallyhow to handle skids. The logic here is that standard drivereducation courses generally concentrate on basic drivingskills. However, it is known that graduates of these courses areprone to being involved in crashes that reflect driving inex-perience (e.g., running off the road and not being able torecover) so it is important to teach new drivers skills that willhelp them avoid these types of crashes. That is the premise,but research in Scandinavia and the United States has foundthat skid courses have a negative effect. Drivers who take thesecourses—especially young males—have more crashes thanuntrained drivers (Jones, 1993; Glad, 1988). This is perhapsbecause of the age factor. That is, drivers who get this train-ing may become overconfident and drive more aggressively,showing off to their friends, etc. (see Williams and Ferguson,2004). Despite these research findings, skid courses offered bymanufacturers, police organizations, and others have prolif-erated in recent years in the United States.
Another example is offering traffic violator school, in lieuof fines and points on the license. The “in lieu of” qualifier isimportant here. These schools have not been shown to pro-vide a safety benefit that outweighs the benefits provided bytraditional “fine and point” sanctions (Peck and Gebers, 1991;McCartt and Solomon, 2004). School in addition to fines andpoints is a different matter and can be effective.
A third example is driver education that speeds the processof young driver licensing or programs that provide a “time dis-count” for their completion (i.e., earlier licensure for thosewho have taken driver education). Speeding the licensureprocess and therefore increasing exposure to crashes at an earlyage has, repeatedly, been shown to increase the number ofyoung driver crash involvements (Vernick, Li, Ogaitis, et al.,1999; Roberts, Kwan, and Cochrane Injuries Group, 2006;Mayhew, 2007). Any “value added” that the completion ofdriver education may provide does not outweigh the negativeeffects of licensing teens at a younger age.
25

Selection of Countermeasures
The relative effectiveness of various countermeasures andcountermeasure groups has been described, along with con-siderations regarding their selection. This informationshould be considered by HSOs in the development of theirhighway safety plans. The next step is to actually selectcountermeasures from these lists of potential countermea-sures. One way to begin is to first identify total highwayloss, as well as the proportion of that loss represented byeach target group for which a Proven countermeasure canbe implemented.
Table 9 shows the total fatal and nonfatal highway loss fora typical 600-fatality state. This table represents nationalaverages.
Table 9 can, and probably should, be generated specifi-cally for your state based on your fatality data. Small statesshould average the last 5 years; large states might use the last3 years. The advantage to averaging across several years isthat it provides a more statistically stable estimate for eachtarget group. The disadvantage associated with using toomany prior years, however, is that the further back in timea state goes, the less representative the numbers will be ofits current situation. This is particularly important if thestate has recently implemented an important, potentiallyimpacting countermeasure, such as a primary belt law,the effects of which are only apparent for the recent past(e.g., the last 18 months).
Even if a state does not use its own data averaged across thelast few years, it will still need to scale Table 9 to reflect itsannual number of fatalities. Thus, if a state has 1,200 fatalities
per year, then all of the figures in Table 9 need to be doubled.States with 300 fatalities need to cut the figures in Table 9 byhalf. Scaling is easily accomplished by taking your number offatalities (say 450); dividing by 600 (450/600 = 0.75); thenmultiplying this number (0.75) times every dollar estimate inthe table. Similarly, a state with 750 fatalities would get a mul-tiplier of 1.25 (750/600 = 1.25).
The next step, after the dollar estimates in Table 9 havebeen adjusted for your state, is to array the potentially viablecountermeasures against the respective target groups.
Twenty-three Proven countermeasures are described inAppendix B, along with percent crash reduction estimates.Each has an intended target group and each indicates the expected effectiveness when fully and properly imple-mented. Simply array the countermeasures against the ap-propriate target group; then go to the last column in the table(total highway loss) and multiply the total by the expectedlevel of effectiveness. The result is the expected benefit foryour state. For example, alcohol-impaired drivers cost thetypical 600-fatality state $537,874,321 per year. Sobrietycheckpoints that are implemented across the state for thefull year, with full media support, would be expected to pro-vide a 20% injury reduction. Multiply 20% by $537,874,321(or your state’s adjusted total cost of deaths and injuries)to calculate the estimated savings, which in this case is$107 million.
Sobriety checkpoints were selected as the first examplesince they are one of the most expensive countermeasures astate might consider. Proven countermeasures that can beimplemented at relatively less cost include child bike hel-met law, GDL, extended learner permit, night restrictions,
26
Type of highway lossCrashes involving
Fatal injuries
Nonfatal injuries Fatal Nonfatal Total
All persons 600 75572 $669,492,000 $2,285,140,088 $2,954,632,088Pedestrians 67 2116 $75,110,214 $63,971,882 $139,082,096
Distracted 60 13997 $66,663,455 $423,239,815 $489,903,270 Drowsy 19 1412 $21,101,197 $42,704,002 $63,805,199Speed 162 14178 $180,836,003 $428,711,216 $609,547,219
Aggressive 164 14770 $183,442,252 $446,600,914 $630,043,166Alcohol related 248 11583 $276,723,360 $350,234,416 $626,957,776
Alcohol impaired 213 9937 $237,404,168 $300,470,153 $537,874,321Teen drivers 32 7681 $35,969,377 $232,263,878 $268,233,255
Age-16 drivers 12 3318 $13,816,260 $100,328,595 $114,144,855Elderly drivers 44 4232 $49,220,426 $127,978,295 $177,198,721
Motorcycles 65 2245 $72,528,300 $67,871,854 $140,400,154Nighttime 214 14109 $238,550,290 $426,621,478 $665,171,767
Child in car 14 9168 $15,590,393 $277,215,254 $292,805,648Front seat occupants 376 58720 $419,433,394 $1,775,583,025 $2,195,016,419
Bicycles 11 1153 $12,089,228 $34,859,723 $46,948,950
Table 9. Fatal and nonfatal highway loss for typical 600-fatality state.

passenger restrictions, license suspension, and warning letters.Countermeasures that can be implemented at comparativelylittle direct cost to the state (e.g., offender-pay counter-measures) include mandatory attendance at alcohol treat-ment, alcohol interlocks, and red-light running cameras. Allof these efforts should be given serious consideration in thedevelopment of a state highway safety plan. Cost benefitratios for these countermeasures, if calculated, would beenormous.
Next, there are several countermeasures for which thebenefit/cost ratio measured in terms of dollars is large butthat may be difficult to implement given the current politicalclimate. These countermeasures include universal mandatorymotorcycle helmet law, primary seat belt law, speed cameras,and reduced speed limit. Each of these countermeasures, ifnot already in place, should be implemented as soon as it isfeasible to do so.
Several countermeasures fall between these two cost ex-tremes. These include child pedestrian training, booster seatpromotions, high-visibility enforcement, ALR, mass mediain support of alcohol enforcement, community programsfor under age 21 enforcement, individual meetings, andgroup meetings. For each of these, it will be necessary for astate to estimate its own costs for “fully” implementingthese programs. Once the costs have been estimated, thebenefit/cost ratio can be estimated using the expected effec-tiveness (shown in Appendix B) and the cost data shown inTable 9.
A state may conclude that it would be better served by im-plementing a program on a regional basis instead of statewide.All of the benefit and implementation cost numbers can bescaled accordingly just by entering the total number of deathsfor that region, relative to those of the “typical” state (to get anestimate of total costs) and then entering the number of deathsfor the targeted population in the region involved. Programsthat may fall into this category of regional or sub-group im-plementation include child pedestrian safety (urban), red-lightrunning (urban and suburban), community under age-21enforcement (college towns), and reduced speed limit forpedestrians (urban).
This exercise will result in a series of countermeasures thatthe state intends to include in its highway safety plan. At leastsome of these countermeasures will be accompanied bybenefit/cost estimates. Other countermeasures may beimplemented with little cost or on a user-pay basis such thatthe benefit/cost ratio is not relevant.
Note that all of the selected countermeasures—Proven,Proven without injury reduction estimates, and Likely—canbe assessed with respect to the target groups listed in Table 9.Measures attempting to deal with a large target group will befavored, other things being equal, over measures dealing witha much smaller target group.
Shift in Strategy
It should be noted that the above strategy for countermea-sure selection differs from current guidelines. Currently, therecommended approach is to (1) conduct problem identifi-cation, (2) identify priority areas, (3) formulate goals andobjectives for each priority area, then (4) select countermea-sures that will lead to the accomplishment of those goals.
The present analysis suggests that this is not the optimalapproach. Specifically, it is highly likely that there will be noeffective and cost-effective countermeasures available to achievesignificant impact in some program/problem areas. Even if apotentially effective countermeasure is available, it may notbe possible to implement that countermeasure at this time. Forinstance, it may not be possible at this time to enact a univer-sal mandatory helmet law for all motorcycle riders. Or, in yourstate it may not be possible to conduct sobriety checkpoints.Similarly, speed cameras, a primary seat belt law, or restrictionson plea bargaining may not be viable options at this time.
The present analysis suggests that the availability of effective/cost-effective countermeasures that can realistically be imple-mented at this time is a major limiting factor. Highway safetyplans should attempt to avoid objectives that are unattainable,given current technology and political climate. Rather, theyshould focus funds and other resources primarily on thoseobjectives that can be addressed. Therefore, the strategy rec-ommended in this document is for the state to (1) conductproblem identification (as above), (2) identify priority areas(as above), (3) identify cost-effective countermeasures thatcan be implemented, and then and only then (4) formulaterealistic objectives based on the expected effectiveness of theidentified countermeasures.
Consider, for instance, the objectives of the health caredelivery system, which includes doctors, hospitals, medicalinsurance companies, etc. This system is presented with arange of medical conditions. Some of these conditions can betreated, given current technology, and some cannot. The ob-jective of the system is to treat those that can be treated. Thebest that can be accomplished for the remainder is to attemptto deal with the symptoms since the underlying problem cannot be solved given current medical technology. The limitingfactor is the availability of a course of treatment. Although thedesire may be to cure everyone, the system can only realisti-cally cure those medical conditions that are treatable now, atthis time, in this place, with available technology.
Similarly, although highway safety professionals may wishto save everyone, they can only realistically deal with thosedeaths and injuries for which there is an available counter-measure that can be implemented in their state, at this time.This list of effective countermeasures is the limiting factorand, as such, it is the driving consideration in the develop-ment of a highway safety plan.
27

New and EmergingCountermeasures
The final highway safety plan will leave some target groupsthat are not well addressed by the selected countermeasures.This could lead to the possibility that the state may have aninterest in pursuing countermeasures that are not yet fullydeveloped, let alone implemented and evaluated. Such newcountermeasure development may take the form of an unso-licited proposal from some vested constituency or it may resultfrom innovative efforts from staff or perhaps serendipitouseffects from other ongoing efforts.
The potential impact of new and emerging countermea-sures should immediately be assessed by first classifying themas: Voluntary Action; Laws, Regulations, Policies; Laws PlusEnhancements; or Sanctions and Treatments. Then, applyingthe same principles as we have for known existing counter-measures, the state can estimate how the implementation ofsuch countermeasures is likely to affect the fatality, injury,and cost aspects of its traffic safety problem. Some of the mostimportant characteristics, requirements, and opportunitiesassociated with the above listed categories are as follows:
• Voluntary Action– Must be of high quality and intensity;– Works best when:
� Targeting children;� Allowing communicator some control over audience;� Communicating new knowledge; and� Serving as part of some larger community-based effort.
• Laws, Regulations, Policies– Must be well known to the public;– Must be enforceable, based on easily observable and
objective criteria; and– Must apply to entire targeted population, not to just a
subset of the population.• Laws Plus Enhancements
– Enhancement must be well publicized;– May involve special equipment to aid officers, prosecu-
tors, probation officers, etc.; and– Generally involves intense selective and concentrated
enforcement.• Sanctions and Treatments
– Sanction must be well known to violators;– There must be an immediacy and certainty to imposi-
tion of the sanction; and
– There should be a high degree of intrusiveness to theviolator (either through penalty or extent of mandatedtreatment).
New countermeasures that fit with the above guidelinesand/or are similar in design to countermeasures that areknown to be effective are much more likely to work thanmeasures that do not conform to these guidelines. Note thatthe majority of countermeasures that have ever been triedhave not stood the test of time. Most have not met their ob-jectives. Some have had negative consequences. States imple-menting new and untried efforts must evaluate progress andtake corrective action including halting those countermea-sures that are not producing the desired behavioral change. Itis important to redeploy resources to effective programs assoon as possible.
Conclusion
This report has focused on moving resources from ineffec-tive and/or marginally effective countermeasures to thosewith the largest benefit/cost payoff. Sometimes, there areother goals and objectives that need to be considered for atleast a portion of available highway safety dollars.
It may be found, for instance, that a particular counter-measure is not likely to work alone, nor will it enhance theimpact of another measure, but it could aid in the recruit-ment of additional advocates and, as such, facilitate adoptionof something that does work. One example is the networkingand outreach that occurred just prior to the enactment of seatbelt use laws. There is little evidence that such activity mea-surably increased seat belt use, but there are indications thatit led to the public awareness and acceptability of seat beltlaws before and after enactment. Perhaps the “take one” pam-phlet, police overtime, or out-of-state training (and associ-ated travel) should be funded, if it is not very expensive andif it will help cement ties between highway safety and someother key agency.
There will always be a fine line between implementingProven countermeasures, satisfying key constituencies, anddeveloping new countermeasures to meet emerging issues.This guide focuses on Proven strategies in the hope that stateswill shift resources as much as is reasonably possible and pru-dent to countermeasures that work and away from counter-measures that don’t work or are unlikely to work given ourcurrent understanding of behavioral change strategies.
28

29
Aeron-Thomas, A.S. and Hess, S. (2005). “Red Light Cameras for thePrevention of Road Traffic Crashes (Review).” The Cochrane Data-base of Systematic Reviews, 2, Art. No. CD003862.pub2. Hoboken,N.J.: John Wiley & Sons Ltd.
Agent, K.R., Steenbergen, L., Pigman, J.G., Kidd, P.S., McCoy, C., andPollack, S.H. (1998). “Impact of the Partial Graduated LicensingProgram in Kentucky on Teen Motor Vehicle Crashes.” Trans-portation Research Record 1779 (54-61), Washington, D.C.: Trans-portation Research Board.
Baker, S.P., Chen, L., and Li, G. (2007). Nationwide Review of GraduatedDriver Licensing. Washington DC: AAA Foundation for TrafficSafety.
Beirness, D.J. and Marques, P.R. (2004). “Alcohol Ignition InterlockPrograms.” Traffic Injury Prevention 5(3), 309–316.
Bergman, A.B., Rivara, F.P., Richards, D.D., and Rogers, L.W. (1990).“The Seattle Children’s Bicycle Helmet Campaign.” American Jour-nal of Diseases of Children, 144, 727–731.
Blincoe, L., Seay, A., Zaloshnja, E., Miller, T., Romano, E., Luchter, S.,and Spicer, R. (2002). The Economic Impact of Motor Vehicle Crashes,2000. DOT HS 809 446, Washington, D.C.: National Highway Traf-fic Safety Administration.
Blomberg, R.D., Preusser, D.F., Hale, A., Leaf, W.A. (1983). Experi-mental Field Test of Proposed Pedestrian Safety Messages, Vol 2: ChildMessages. Washington, D.C.: Federal Highway Administration.
Braver, E.R., Whitfield, R., and Ferguson, S.A. (1998). “Seating Positionand Children’s Risk of Dying in Motor Vehicle Crashes. Injury Pre-vention 4, 181–187.
Braver, E.R., Kufera, J.A., Volpini, K.D., Lawpoolsri, S., Joyce, J.J.,Alexander, M.Y., and Ellison-Potter, P. (2007). Persuasion andLicensure: A Randomized Controlled Intervention Trial to IncreaseLicensure Rates among Maryland Motorcycle Owners. Traffic InjuryPrevention, 8, 39–46.
Britt, J.W., Bergman, A.B., Moffat, J. (1995). “Law Enforcement, Pedes-trian Safety, and Driver Compliance with Crosswalk Laws: Evalu-ation of a Four-Year Campaign in Seattle.” Transportation ResearchRecord, 1485, 160–167.
Cameron, M.H., Vulcan, A.P., Finch, C.F., and Newstead, S.V. (1994).“Mandatory Bicycle Helmet Use Following a Decade of HelmetPromotion in Victoria, Australia—An Evaluation.” AccidentAnalysis & Prevention 26(3), 325–337.
Century Council (2003). “Hardcore Drunk Driving: A Sourcebook ofPromising Strategies.” Laws & Programs. Washington, D.C.: TheCentury Council.
Chaudhary, N. and Solomon, M.G. (under review). Evaluation of Al-abama, Michigan, and New Jersey Safety Belt Law Change to PrimaryEnforcement. Washington, D.C.: National Highway Traffic SafetyAdministration.
D’Amico, E.J. and Fromme, K. (2002). “Brief Intervention for Adoles-cent Risk-Taking Behavior.” Addiction 97, 563–574.
Davis, J.W., Bennink, L.D., Pepper, D.R., Parks, S.N., Lemaster, D.M.,Townsend, R.N. (2006). “Aggressive Traffic Enforcement: A Simpleand Effective Injury Prevention Program.” Journal of Trauma 60,972–977.
Davison, W.P. (1983). “The Third-Person Effect in Communication.”Public Opinion Quarterly 47, 1–15.
DeJong, W. and Wallack, L. (1999). A Critical Perspective on the DrugCzar’s Antidrug Media Campaign.” Journal of Health Communica-tion 4, 155–160.
DeYoung, D.K. (1998). An Evaluation of the General Deterrent Effectsof Vehicle Impoundment on Suspended and Revoked Drivers inCalifornia. RSS-98-180. Sacramento, CA: California Department ofMotor Vehicles.
DeYoung, D.K. (1997). An Evaluation of the Specific Deterrent Effect onVehicle Impoundment on Suspended, Revoked, and Unlicensed Driversin California. DOT HS 808 727.Washington, D.C.: Department ofTransportation, National Highway Traffic Safety Administration.
Dill, P., Wells-Parker, E., and Soderstrom, C.A. (2004). “The EmergencyCare Setting for Screening and Intervention for Alcohol Use Prob-lems among Injured and High-Risk Drinking Drivers: A Review.”Traffic Injury Prevention 5, 278–291.
Ditter, S.M., Elder, R.W., Shults, R.A., Sleet, D.A., Compton, R., andNichols, J.L. (2005). “Effectiveness of Designated Driver Programsfor Reducing Drinking and Driving and Alcohol-Involved Crashes:A Systematic Review.” American Journal of Preventive Medicine,28 (5S), 280–287.
D’Onofrio, G. and Degutis, L.C. (2002). “Preventive Care in The Emer-gency Department: Screening and Brief Intervention for AlcoholProblems in the Emergency Department: A Systematic Review.”Academic Emergency Medicine 5, 627–638.
Douglas, M. (1985). Risk Acceptability According to the Social Sciences.New York: NY: Russell Sage Foundation.
Dragutinovic, N. and Twisk, D. (2006). The Effectiveness of Road SafetyEducation: A Literature Review. SWOV Institute for Road SafetyResearch, Leidschendam, The Netherlands.
Durbin, D.R., Elliott, M.R., Winston, F.K. (2003). “Belt-PositioningBooster Seats and Reduction in Risk of Injury among Children in
References

Vehicle Crashes.” Journal of the American Medical Association289(21), 2835–2840.
Ehiri, J., King, W., Ejere, H.O.D., Mouzon, P. (2006). Effects of Interven-tions to Increase Use of Booster Seats in Motor Vehicles for 4-8-Year-Olds. AAA Foundation for Traffic Safety. Washington, D.C.
Elder, R.W., Nichols, J.L., Shults, R.A., Sleet, D.A., Barrios, L.C.,Compton, R. and the Task Force on Community Preventive Ser-vices (2005). “Effectiveness of School-Based Programs for Re-ducing Drinking and Driving and Riding with Drinking Drivers.”American Journal of Preventive Medicine 28 (5S), 288–297.
Elder, R.W., Shults, R.A., Sleet, D.A., Nichols, J.L., Thompson, R.S.,Rajab, W., and Task Force on Community Services (2004). “Effec-tiveness of Mass Media Campaigns for Reducing Drinking andDriving and Alcohol-Involved Crashes.” American Journal of Pub-lic Health 27(1), 57–65.
Elder, R.W., Shults, R.A., Sleet, D.A., Nichols, J.L., Zaza, S., andThompson, R.A. (2002). “Effectiveness of Sobriety Checkpointsfor Reducing Alcohol-Involved Crashes.” Traffic Injury Prevention3, 266–274.
Elliott, B.K. (2005). The Use of Threat (Fear) to Reduce Adolescent Risk Tak-ing: A Literature Review. Prepared for VicRoads, Victoria, Australia.
Farmer, C.M. and Williams, A.F. (2005). “Effect on Fatality Risk ofChanging from Secondary to Primary Seat Belt Enforcement.”Journal of Safety Research, 36, 189–194.
Ferguson, S.A., Preusser, D.F., Lund, A.K., Zador, P.L., and Ulmer, R.G.(1995). “Daylight Saving Time and Motor Vehicle Crashes: The Re-duction in Pedestrian and Vehicle Occupant Fatalities.” AmericanJournal of Public Health 85(1), 92–95.
Ferguson, S.A., Wells, J.K., and Lund, A.K. (1995). “The Role of PassiveAlcohol Sensors in Detecting Alcohol-Impaired Drivers at SobrietyCheckpoints. Alcohol, Drugs and Driving 11, 23–30.
Fieldwick, R. and Brown, R.J. (1987). “The Effect of Speed Limits onRoad Casualties.” Traffic Engineering and Control 28(12): 635–640.
General Accounting Office (1991). Highway Safety: Motorcycle HelmetLaws Save Lives and Reduce Costs to Society. Washington D.C.
Ginsberg, G.M. and Silverberg, D.S. (1994). “A Cost-Benefit Analysis ofLegislation for Bicycle Safety Helmets in Israel.” American Journalof Public Health 84, 653–656.
Glad, A. (1988). Phase 2 Driver Education, Effect on Accident Risk. Oslo,Norway: Transport Institute.
Glassbrenner, D. (2005). Safety Belt Use in 2005: Use Rates in the Statesand Territories. DOT HS 809 970. Washington, D.C.: NationalHighway Traffic Safety Administration.
Goodwin, A.H. and Foss, R.D. (2004). “Graduated Driver LicensingRestrictions: Awareness, Compliance, and Enforcement in NorthCarolina.” Journal of Safety Research 35, 37–374.
Goodwin, A.H., Wells, J.K., Foss, R.D., and Williams, A.F. (2006). “En-couraging Compliance with Graduated Licensing Restrictions.”Journal of Safety Research 37, 343–351.
Government Accountability Office (2003). Traffic Enforcement: Fund-ing of Automatic Red-Light and Speed Camera Enforcement Tech-nologies, Report No. GAO-03-408R, Washington, D.C.
Grant, D. and Rutner, S.M. (2004). The Effect of Bicycle Helmet Legis-lation on Bicycling Fatalities. Journal of Policy Analysis and Man-agement 23(3), 595–611.
Greene, J.G. (2003). “Battling DUI. A Comparative Analysis of Check-points and Saturation Patrols.” FBI Law Enforcement Bulletin72(1), 1–6.
Gregersen, N.P. and Nolen, S. (1994). “Children’s Road Safety and theStrategy of Voluntary Safety Clubs.” Accident Analysis & Prevention26, 463–470.
Grube, J.W. and Stewart, K. (2004). Preventing Impaired Driving UsingAlcohol Policy. Traffic Injury Prevention 5, 199–207.
Guerin, P. (2002). Evaluation of the Bernalillo County MetropolitanDWI/Drug Court. Albuquerque, NM: University of New MexicoInstitute for Social Research.
Hale, A., Blomberg, R.D., and Preusser, D.F. (1978). ExperimentalField Test of the Model Ice Cream Ordinance in Detroit. DOT HS803 410. Washington, D.C.: National Highway Traffic SafetyAdministration.
Harsha, B. and Hedlund, J. (2007). “Changing American’s Cultureof Speed on the Roads.” Improving Traffic Safety Culture in theUnited States, AAA Foundation for Traffic Safety, Washington,D.C., 257–272.
Hedlund, J.H., Preusser, D.F., and Shults, R.A. (2004). “A ResearchAgenda for Increasing Safety Belt Use in the United States.” Journalof Safety Research 35, 231–235.
Hingson, R., McGovern, T., Howland, J., Hereen, T., Winter, M.and Zakocs, R. (1996). “Reducing Alcohol-Impaired Driving inMassachusetts: The Saving Lives Program.” American Journal ofPublic Health 86, 791–797.
Hingson, R., Heeren, T., and Winter, M. (1998). “Effects of Maine’s0.05% Legal Blood Alcohol Level for Drivers with DWI Convic-tions.” Public Health Reports 113, 440–446.
Holder, H.D. and Wagenaar, A.C. (1994). Mandated server train-ing and reduced alcohol-involved traffic crashes: a time seriesanalysis of the Oregon experience. Accident Analysis & Preven-tion, 26, 89–97.
Holder, H.D., Gruenewald, P.J., Ponicki, W.R., Treno, A.J., Grube,J.W., Saltz, et al. (2000). Effect of Community Interventions onHigh-Risk Drinking and Alcohol-Related Injuries. Journal of theAmerican Meidcal Association 284, 2341–2347.
Houston, D.J. and Richardson, L.E. (2006). “Getting Americans toBuckle Up: The Efficacy of State Seat Belt Laws,” Accident Analysis& Prevention 37, 1114–1120.
Ivers, R. (in preparation). Cochrane Review of Motorcycle Education andTraining Programs. The George Institute, Sydney NSW, Australia.
Jasanoff, S. (1998). “The Political Science of Risk Perception.” Reliabil-ity Engineering and System Safety 59, 91–99.
Jones, B. (1993). The Effectiveness of Skid Training for Teenage NoviceDrivers in Oregon. Salem OR: Drive and Motor Vehicle Services.
Jones, R.K. and Lacey, J.H. (2001). Alcohol and Highway Safety 2001: AReview of the State of Knowledge. DOT HS 809 383. Washington,D.C.: National Highway Traffic Safety Administration.
Jones, R.K., Joksch, H.C., and Lacey, J.H. (1995). Summary Report:Field Test of Combined Speed, Alcohol, and Safety Belt Strategies.DOT HS 808 242. Washington, D.C.: National Highway TrafficSafety Administration.
Jones, R.K., Wiliszowski, C.H., and Lacey, J.H. (1996). Evaluation ofAlternative Programs for Repeat DWI Offenders. DOT HS 808 493.Washington, D.C.: National Highway Traffic Safety Administration.
Jones, R.K., and Rodriguez-Iglesias, C. (2004). Evaluation of Lower BACLimits for Convicted DUI Offenders in Maine. Publication No. DOTHS 809 827. Washington D.C.: National Highway Traffic SafetyAdministration.
Kiger, S.M., Lestina, D.C., and Lund, AK. (1993). “Passive Alcohol Sen-sors in Law Enforcement Screening for Alcohol-Impaired Drivers.”Alcohol, Drugs and Driving 9, 7–18.
Kua, A., Korner-Bitensky, N., Desrosiers, J., Man-Son-Hing, M.,and Marshall, S. (2007). “Older Driver Retraining: A SystematicReview of Evidence of Effectiveness.” Journal of Safety Research38, 81–90.
30

Lacey, J.H., Jones, R.K., and Anderson, E.W. (2000). Evaluation of aFull-Time Ride Service Program: Aspen, Colorado’s Tipsy Taxi Service.Publication No. DOT HS 809 155. Washington D.C.: NationalHighway Traffic Safety Administration.
Lacey, J., Fell, J.C., Cosgrove, L. et al., (2005). Tennessee’s CombinedSafety Belt and Impaired Driving Campaign in 2003 Yields Mixed Re-sults. Research Note. Washington D.C.: National Highway TrafficSafety Administration.
Lapham, S.C., Kapitual, L.R., C’de, B., McMillan, G.P. (2006). “Im-paired Driving Recidivism among Repeat Offenders Following anIntensive Court-Based Intervention.” Accident Analysis & Preven-tion, 38, 162–169.
Macdonald, J.M., Morral, A.R., Raymond, B., Eibner, C. (2007). “TheEfficacy of the Rio Hondo DUI Court: A 2-Year Field Experiment.”Evaluation Review 31, 4–23.
Maibach, E., Holtgrave, D.R. (1995). Advances in Public Health Com-munication. Annual Review of Public Health 16 219–238.
Masten, S.V. and Peck, R.C. (2004). “Problem Driver Remediation:A Meta-Analysis of the Driver Improvement Literature.” Journal ofSafety Research 35, 403–405.
Mayhew, D.R. and Simpson, H.M. (2001). Effectiveness and Role ofDriver Education and Training in a Graduated Licensing System.Ottawa, ON: Traffic Injury Research Foundation.
Mayhew, D.R., Simpson, H.M., Desmond, K., and Williams, A.F. (2003).“Specific and Long-Term Effects of Nova Scotia’s Graduated Li-censing Program.” Traffic Injury Prevention 4, 91–97.
Mayhew, D.R. (2007). “Driver Education and Graduated Licensing inNorth America: Past, Present, and Future.” Journal of Safety Re-search 38, 229–235.
McCartt, A.T., Hellinga, L.A., and Geary, L.L. (2006). “Cell Phonesand Driving: Review of the Research.” Traffic Injury Prevention7, 89–106.
McCartt, A.T. and Hellinga, L.A. (2007). Longer-Term Effects ofWashington, D.C. Law on Drivers’ Hand-Held Cell Phone Use.Traffic Injury Prevention 8, 199–204.
McCartt, A.T. and Solomon, M.G. (2004). “Tracking Traffic Citationsthrough Court Adjudications to Posting to Public Driver Records.”Traffic Injury Prevention 5, 93–100.
McCartt, A.T., Northrup, V.S. (2004). Effects of Enhanced Sanctionsfor High-BAC DWI Drivers on Case Dispositions and Rates ofRecidivism. Traffic Injury Prevention 5, 270–277.
McCartt, A.T., Leaf, W.A., Witkowski, T.L., and Solomon, M.G. (2001).Evaluation of the Aggression Suppression Program, Milwaukee, WI.DOT HS 809 395. Washington, D.C.: National Highway TrafficSafety Administration.
Moyer, A., Finney, J.W., Swearingen, C.E., and Vergun, P. (2002).“Brief Interventions for Alcohol Problems: A Meta-Analytic Re-view of Controlled Investigations In Treatment-Seeking and Non-Treatment-Seeking Populations.” Addiction 97, 279–292.
Morrisey, M.A. and Grabowski, D.C. (2005). “State Motor Vehicle Lawsand Older Drivers.” Health Economics 14, 407–419.
National Transportation Safety Board (2000). Actions to Reduce Fatali-ties, Injuries, and Crashes Involving the Hard Core Drinking Driver.NTSB/SR-00/01. Washington, D.C.
National Highway Traffic Safety Administration (2002). “AggressionSuppression Program in Milwaukee Reduces Crashes and ChangesMotorist Behavior.” Traffic Safety Facts: Traffic Tech No. 289.Washington, D.C.
National Highway Traffic Safety Administration (2007a). 2006 TrafficSafety Facts FARS/GES: Annual Report TSF06. Washington, D.C.:National Center for Statistics and Analysis.
National Highway Traffic Safety Administration (2007b). Counter-measures That Work: A Highway Safety Countermeasure Guide forState Highway Safety Offices. Washington, D.C.: National HighwayTraffic Safety Administration, DOT HS 810 710.
Nichols, J.A. and Ledingham, K.L. (2008). “The Impact of Legislation,Enforcement, and Sanctions on Safety Belt Use.” Research ResultsReport 601. National Cooperative Highway Research Program.Washington, D.C.: Transportation Research Board.
Owsley, C., McGwin, G., Phillips, J.M., McNeal, S.F., and Stalvey, B.T.(2004). Impact of an Education Program on the Safety of High-Risk, Visually Impaired, Older Drivers.” American Journal of Pre-ventive Medicine 26, 222–229.
Peck, R.C. and Gebers, M.A. (1991). The Traffic Safety Impact ofTraffic Violator School Citation Dismissals. California Departmentof Motor Vehicles, Division of Program and Administration,Sacramento, CA.
Pilkington, P. and Kinra, S. (2005). “Effectiveness of Speed Cameras inPreventing Road Traffic Collisions and Related Casualties: System-atic Review.” British Medical Journal 330(7487), 331–334.
Preston, B. (1990). “The Safety of Walking and Cycling in Different Coun-tries.” In Tolley, R. (ed.), The Greening of Urban Transport: Planningfor Cycling and Walking in Western Cities. London: Bellhaven Press.
Roberts, I., Kwan, I., and the Cochrane Injuries Group Driver Educa-tion Reviewers (2006). “School-Based Driver Education for thePrevention of Traffic Crashes.” The Cochrane Database of System-atic Reviews 2006, No. 2.
Robinson, D.L. (1996). “Head Injuries and Bicycle Helmet Laws.”Accident Analysis & Prevention 28(4), 463–475.
Ross, H.L. (1987). “Administrative License Revocation in New Mexico:An Evaluation.” Law and Policy 9, 5–16.
Ross, H.L. (1991). Administrative License Revocation for Drunk Drivers:Options and Choices in Three States. Washington, D.C.: AAA Foun-dation for Traffic Safety.
Ross, H.L., Simon, S., and Cleary, J. (1995). License Plate Impoundmentfor Multiple Offender Drunk Drivers. Adelaide, Australia: NHMRCRoad Accident Research Unit, University of Adelaide.
Rothschild, M.L., Nastin, B., and Miller, T.W. (2006). “Reducing Alcohol-Impaired Driving Crashes through the Use of Social Marketing.”Accident Analysis & Prevention 38, 1218–1230.
Scuffham, P., Alsop, J., Cryer, C., and Langley, J.D. (2000). “Head In-juries and Bicycle Helmet Laws.” Accident Analysis & Prevention32(4), 565–573.
Shinar, D. (1992). “Impact of Court Monitoring on the Adjudication ofDriving While Intoxicated (DWI).” Accident Analysis & Prevention24, 167–179.
Shope, J.T., Elliott, M.R., Raghunathan, T.E., and Waller, P.F. (2001).“Long-Term Follow-Up of a High School Alcohol Misuse Preven-tion Program’s Effect of Student’s Subsequent Driving.” AlcoholismClinical and Experimental Research 25(3), 403–410.
Shope, J.T. (2007). “Graduated Driver Licensing: Review of EvaluationResults since 2002.” Journal of Safety Research 38(2), 165–176.
Shults, R.A., Elder, R.W., Sleet, D.A., and Nichols, J.L. (2001). “Reviewsof Evidence Regarding Interventions to Reduce Alcohol-ImpairedDriving.” American Journal of Preventive Medicine 21(4S), 66–88.
Simons-Morton, B. (2007). “Parent Involvement in Novice Teen Driving:Rationale, Evidence of Effects, and Potential for Enhancing Grad-uated Driver Licensing Effectiveness.” Journal of Safety Research38(2), 193–202.
Solomon, M.G., Ulmer, R.G., and Preusser, D.F. (2002). Evaluation ofClick It or Ticket Model Programs. DOT HS 809 498. Washington,D.C.: National Highway Traffic Safety Administration.
31

Solomon, M.G. and Chaffe, R.H.B., (2006). May 2004 “Click it orTicket” Safety Belt Mobilization Evaluation. Final Report, contractDTNH22-99-D-25099. Washington D.C.: National Highway Traf-fic Safety Administration.
Staplin, L. and Lococo, K.H. (2003). Model Driver Screening and Evalu-ation Program, vol. 3: Guidelines for Motor Vehicle Administrators.DOT HS 809 581. Washington, D.C.: National Highway TrafficSafety Administration.
Staplin, L., Lococo, K.H., Gish, K.W., and Decina, L.E. (2003). ModelDriver Screening and Evaluation Program, Vol 2: Maryland PilotOlder Driver Study. DOT HS 809 583. Washington, D.C.: NationalHighway Traffic Safety Administration.
Stewart, K. (1999). Strategies to Reduce Underage Alcohol Use: Typologyand Brief Overview. Washington D.C.: Office of Juvenile Justice andDelinquency Prevention, U.S. Department of Justice.
Stone, D. (1989). “Upside-Down Prevention.” Health Service JournalJuly 20, 1989, 890–891.
Stuster, J. (2004). Aggressive Driving Enforcement: Evaluation of TwoDemonstration Programs. DOT HS 809 707, Washington, D.C.:National Highway Traffic Safety Administration.
Stuster, J., Burns, M., and Fiorentino, D. (2002). Open Container Lawsand Alcohol Involved Crashes: Some Preliminary Data. PublicationNo. DOT HS 809 426, Washington D.C.: National Highway TrafficSafety Administration.
Transportation Research Board (2006). “Safety Impacts and Other Im-plications of Raised Speed Limits on High-Speed Roads.” NCHRPResearch Results Digest 303. Washington, D.C.
Ulmer, R.G., Ferguson, S.A., Williams, A.F., and Preusser, D.F. (2001).“Teenage Crash Reduction Associated with Delayed Licensing inConnecticut.” Journal of Safety Research 32, 31–41.
Ulmer, R.G., Shabanova, V.I., and Preusser, D.F. (2001). Evaluation ofUse and Lose Laws, DOT HS 809 285, Washington, D.C.: NationalHighway Traffic Safety Administration.
Van Houten, R., Van Houten, J., and Malenfant, J.E. (2007). “Impact ofa Comprehensive Safety Program on Bicycle Helmet Use AmongMiddle-School Children.” Journal of Applied Behavioral Analysis40(2), 239–247.
Vernick, J.S., Li, G., Ogaitis, S., MacKenzie, E.J., Baker, S.P., Gielen, A.C.(1999). “Effects of High School Driver Education on Motor VehicleCrashes, Violations, and Licensure.” American Journal of PreventiveMedicine, 16, 40–46.
Vernon, D.D., Diller, E., Cook, L., Reading, J., and Dean, J.M. (2001).Further Analysis of Drivers Licensed with Medical Conditions inUtah. DOT HS 809 211. Washington, D.C.: National HighwayTraffic Safety Administration.
Voas, R., and Tippetts, A.S. (1990). “Evaluation of Treatment of Mon-itoring Programs for Drunken Drivers.” Journal of Traffic Medicine18, 15–26.
Voas, R.B. and Tippetts, A.S. (1999). The Relationship of Alcohol SafetyLaws to Drinking Drivers in Fatal Crashes. Washington, D.C.: U.S.Department of Transportation, National Highway Traffic SafetyAdministration.
Voas, R.B., Tippetts, A.S., and Taylor, E. (1997). “Temporary VehicleImmobilization: Evaluation of a Program in Ohio.” AccidentAnalysis & Prevention 29(5), 627–634.
Voas, R.B., Tippetts, A.S., and Taylor, E. (1998). “Temporary VehicleImpoundment in Ohio: a Replication and Confirmation.” AccidentAnalysis & Prevention 30(5), 651–655.
Wagenaar, A.C., Zobek, T.S., and Williams, G.D. (2000). Effects of DWIControl Efforts: A Systematic Review of the Literature from 1960-1991.Minneapolis MN: University of Minnesota, School of Public Health.
Walz, F.H., Hoefliger, M., and Fehlmann, W. “Speed Limit Reductionfrom 60 to 50 Km/H and Pedestrian Injuries.” Proceedings of theTwenty-Seventh Stapp Car Crash Conference, October 17–19,1983. San Diego, California. SAE Technical Paper 831625. 1983.pp. 311–318.
Wells-Parker, E., Banger-Drowns, R., McMillen, R., and Williams, M.(1995). “Final Results from a Meta-Analysis of Remedial Interven-tions with Drink-Drive Offenders.” Addiction 90, 907–926.
West, R., Sammons, P., and West, A. (1993). “Effects of a Traffic Clubon Road Safety Knowledge and Self-Reported Behaviour of YoungChildren and Their Parents.” Accident Analysis & Prevention 25,609–618.
Wilk, A.I., Jensen, N.M., and Havighurst, T.C. (1997). “Meta-Analysisof Randomized Control Trials Addressing Brief Interventions inHeavy Alcohol Drinkers.” Journal of General Internal Medicine 12,174–283.
Williams, A.F. (2007a). “Public Information and Education in the Pro-motion of Highway Safety.” Research Results Digest 322, NationalCooperative Highway Research Program, Washington, D.C.
Williams, A.F. (2007b). “Contribution of the Components of Gradu-ated Licensing to Crash Reductions.” Journal of Safety Research38(2), 177–184.
Williams, A.F. and Ferguson, S.A. (2004). “Driver Education Renais-sance? Why We Need Evidenced-Based Highway Safety Policy.”Injury Prevention 10, 4–7.
Williams, A.F., Paek, N.N., and Lund, A.K. (1995). “Factors that Driv-ers Say Motivate Safe Driving Practices.” Journal of Safety Research26(2), 199–224.
Williams, A.F. and Robertson, L.S. (1979). “Observed Daytime Seat BeltUse in Vancouver before and after the British Columbia Seat BeltUse Law.” Accident Analysis and Prevention 15, 161–165.
Willis, C., Lybrand, S., and Bellamy, N. (2004). “Alcohol ignitioninterlock programs for reducing drink driving recidivism(Review).” Cochrane Database of Systematic Reviews, Issue 3, Art.No. CD004168.
Wood, T. and Milne, P. (1988). “Head Injuries to Pedal Cyclists and thePromotion of Helmet Use in Victoria, Australia.” Accident Analy-sis & Prevention 20(3), 177–186.
Zador P., Lund, A., and Weinberg, K. (1989). “Fatal crash involvementand laws against alcohol-impaired driving.” Journal of PublicHealth Policy 10, 467–485.
Zwicker, T.L., Hedlund, J., and Northrup, V.S. (2005). BreathTest Refusals in DWI Enforcement: An Interim Report. DOTHS 809 876. Washington DC: National Highway Traffic SafetyAdministration.
Zwicker, T., Chaudhary, N., Maloney, S., and Squeglia, R. (2007). Con-necticut’s 2003 Impaired-Driving High-Visibility Enforcement Cam-paign. DOT HS 810 689. Washington, D.C.: National HighwayTraffic Safety Administration.
32

33
Countermeasures shown in the text as Unknown/Uncertain/Unlikely were further rated as: + some basis for thinkingthey should work; − some basis for thinking they will notwork; and 0 unknown whether or not they will work. Themain criterion for this rating was the research evidence.There may be no research evidence at all, there are caseswhere the weight of evidence tips the scale toward a + or −rating, and there are cases where the available research evi-dence does not allow a judgment. The second criterion, usedin the absence of research evidence, involved whether thecountermeasure has characteristics associated with success-ful or unsuccessful measures. For example, in the VoluntaryAction Group, programs targeting children would be con-sidered likely to work.
Voluntary Action
+ Child pedestrian supervision training for caregivers(research lacking; has characteristics associated withsuccessful programs).
+ Child safety clubs (the mostly European research basedoes not have clear-cut findings; has characteristicsassociated with successful programs) (West, Sammons,and West, 1993; Gregersen and Nolen, 1994; Dragutinovicand Twisk, 2006).
+ Bicycle education for children (research lacking; hascharacteristics associated with successful programs).
0 School-based alcohol education programs to reducedrinking and driving (insufficient evidence from re-search; does not have characteristics associated with suc-cessful programs) (Stewart, 1999; Elder, Nichols, Shultset al., 2005; Shope, Elliott, Raghunathan et al., 2001;D’Amico and Fromme, 2002).
− PI&E for elderly drivers (no relevant evaluations; doesnot have characteristics associated with successfulprograms).
+ PI&E for low belt users (weight of evidence suggests thehigh-quality programs can increase belt use) (Solomonand Chaffe, 2006).
− Motorcycle education and training courses (weight of re-search evidence suggests no effects on crashes) (Mayhewand Simpson, 2001; Ivers, in progress).
− Formal driver education courses for elderly drivers (weightof evidence suggests no effects on crashes) (Owsley,McGwin, Phillips et al., 2004; Kua, Korner-Bitensky,Desrosiers et al., 2007).
+ Bike fairs, rodeos (no relevant research; has characteris-tics associated with successful programs).
− Driver training about sharing the road with bicycles(no relevant research; does not have characteristicsassociated with successful programs).
− Teaching bike rules/safety in driver education (no rele-vant research; does not have characteristics associatedwith successful programs).
− Education encouraging bicyclists to increase their con-spicuity (no relevant research; does not have character-istics associated with successful programs).
− Education to encourage pedestrians to increase theirconspicuity (no relevant research; does not have charac-teristics associated with successful programs).
− Driver education in regard to pedestrians (no relevantresearch; does not have characteristics associated withsuccessful programs).
− Programs to teach driver awareness about motorcyclists(no relevant research; does not have characteristicsassociated with successful programs).
− PI&E about driver fatigue (no relevant research; doesnot have characteristics associated with successfulprograms).
− PI&E about distracted driving (no relevant research;does not have characteristics associated with successfulprograms).
A P P E N D I X A
Unknown/Uncertain/UnlikelyCountermeasures
− PI&E on sleep disorders for general population andphysicians (no relevant research; does not have charac-teristics associated with successful programs).
+ Employer programs for shift workers, medical interns(insufficient research; has characteristics associated withsuccessful programs).
+ Alternative transportation for alcohol-impaired drivers(weight of evidence suggests positive effects) (Lacey,Jones, and Anderson, 2000; Rothschild, Nastin, andMiller, 2006).
0 Designated driver programs (research evidence incon-clusive; does not have characteristics associated withsuccessful programs) (Ditter, Elder, Shults et al., 2005).
− Motorcycle helmet use promotion programs (no rele-vant research; does not have characteristics associatedwith successful programs).
− PI&E regarding drinking and motorcycling (no relevantresearch; does not have characteristics associated withsuccessful programs).
− Education to encourage motorcyclists to increase theirconspicuity (no relevant research; does not have charac-teristics of successful programs).
0 Programs to help police detect impaired motor-cyclists (no relevant research; facilitates the enforce-ment process).
− Communications and outreach regarding impairedpedestrians (no relevant research; does not have charac-teristics associated with successful programs).
− Extreme fear and scare tactics in youth programs (no rel-evant research; has characteristics thought not to be as-sociated with successful programs) (Elliott, 2005; DeJongand Wallack, 1999).
0 High school driver education (not leading to early learning/licensing).
+ School bus training for children (no relevant research;has characteristics associated with successful programs).
Laws, Regulations, and Policies
+ General cell phone laws (mixed research evidence, short-term effects that may or may not last depending onenforcement and publicity; has characteristics associ-ated with successful laws) (McCartt, Hellinga, and Geary,2006; McCartt and Hellinga, 2007).
0 Open container laws (scant evidence; does not have char-acteristics associated with successful laws) (Stuster,Burns, and Fiorentino, 2002).
+ Lower BAC limit for repeaters (weight of evidence sug-gests positive results) (Hingson, Heeren, and Winter,1998; Jones and Rodriguez-Iglesias, 2004).
+ Cell phone laws as part of graduated licensing (limitedresearch evidence).
+ Belt use as part of graduated licensing (limited researchevidence) (Goodwin, Wells, Foss et al., 2006).
0 Motorcycle licensing laws, especially in regard to havinga valid license (some limited evidence that programscan increase licensure) (Braver, Kufera, and Volpiniet al., 2007).
0 Comprehensive belt laws versus laws with significant ex-ceptions (no relevant research, e.g., on extent to whichbelt laws that cover rear passengers increase belt use; doesnot have characteristics associated with successful laws).
0 Keg registration laws (positive but inconclusive evidencethey reduce crash rates; does not have characteristics as-sociated with successful laws) (Grube and Stewart, 2004).
0 Medical advisory boards for elderly drivers (no relevantstudies; some likelihood that medical advisory boardscan assist licensing agencies in evaluating people withmedical conditions/functional limitations affectingdriving ability).
− Aggressive driving laws (no relevant research; does nothave characteristics associated with successful laws).
− Driver fatigue and distracted driving laws (no relevantresearch; does not have characteristics associated withsuccessful laws).
+ Referring elderly drivers to licensing agencies (limitedresearch; likelihood that states establishing and publi-cizing referral procedures will increase referrals).
+ Elderly licensing screening and testing (limited research;likelihood that model guidelines can identify with rea-sonable accuracy those whose driving should be cur-tailed) (Staplin and Lococo, 2003; Staplin, Lococo, Gishet al., 2003).
+ Elderly licensing restrictions (weight of evidence suggestsrestrictions lower crash risk) (Vernon, Diller, Cook et al.,2001).
Laws Plus Enhancements
+ Aggressive driving enforcement (weight of evidence sug-gests positive effects) (McCartt, Leaf, Witkowski et al.,2001; NHTSA, 2002; Stuster, 2004; Davis, Bennink,Pepper et al., 2006).
+ GDL enforcement (weight of evidence suggests positivethough limited effects) (Goodwin, Wells, Foss et al.,2006).
− Enforcement of pedestrian rules (for both drivers andpedestrians; limited research); one study showed noeffect on driver yielding; does not have characteristicsassociated with successful programs (Britt, Bergman,and Moffat, 1995).
− Enforcement of bike rules (for both bikers and drivers)(no relevant research; does not have characteristics as-sociated with successful programs).
34

+ Enforcement against unapproved motorcycle helmets(no relevant research; has characteristics associated withsuccessful programs).
Sanctions and Treatments
+ Vehicle forfeiture (no relevant research; has characteris-tics associated with successful sanctions).
0 GDL penalties (limited unsupportive research; doesnot have characteristics associated with successful
sanctions) (Goodwin and Foss, 2004; Williams,2007b).
0 DUI fines (limited evidence suggests no effects in reduc-ing alcohol-impaired driving) (Century Council, 2003).
0 DUI jail (weight of evidence suggests no positive effects)(Wagenaar, Zobek, and Williams, 2000).
+ High BAC sanctions (limited evidence suggests positiveeffects on recidivism) (McCartt and Northrup, 2004).
+ DWI courts (results are mixed, some positive, some not)(Guerin, 2002).
35

36
Class 1: Voluntary Action
School Pedestrian Training for Children: Estimated effect 12% reduction in child pedestrian injuries (Blomberg, Preusser,Hale et al., 1983); applicable population: elementary school pedestrians; effects limited unless program is ongoing (low cost).
The effect of this countermeasure is an estimated 12% reduction in child pedestrian injuries. Its primary target is school-agedchildren, which we define as children between 6 and 12 years of age. The pedestrian fatality-to-injury ratio will be used in allcalculations.
School-aged pedestrian fatalities represent 0.3% of all fatalities, resulting in an estimated 2 fatalities per state. As there are anestimated 31 injuries per fatality, the example state is estimated to have 57 child pedestrian injuries per year, for a total estimatedcost of $3,750,385. School pedestrian training for children has an estimated 12% reduction in injuries, resulting in savings of$450,046.
A P P E N D I X B
Effectiveness Estimates for Twenty-ThreeProven Countermeasures
Booster Seat Promotions: Effect varies according to type of program and baseline use. Programs have involved education directedat children, parents, or physicians, delivered through traditional channels or via home visits; plus discounts for booster seat purchase.Increases in booster seat use have been reported: from 61 to 75%, 0 to 22%, 43 to 67%; 13 to 26% (Ehiri, King, Ejere et al., 2006).Durbin, Elliott, Winston et al. (2003) estimate a 59% reduction in injury for children in a booster seat rather than an adult seat belt;applicable population: children ages 4-8 not traveling in booster seats; effects limited to duration of program (medium cost).
Booster seat promotions increase use by 13% and the effect of putting children in booster seats rather than adult seat belts isan estimated 59% reduction in injuries. Thus, this countermeasure reduces injuries by an estimated 8%. Its primary target is
Table B1. Estimated savings for school pedestrian training countermeasure.
Total fatalities 42,642
Child pedestrian fatalities (U.S.) 129
% total fatalities (U.S.) 0.303%
Median fatalities (state) 600
Est. child ped. fatalities (state) 1.82
Pedestrian Death-to-Injury Ratio 31.43
ESTIMATED SAVINGS FOR AN EXAMPLE STATE
No. $ Fatalities $ Injuries $ Total
Fatalities 1.82 $ 2,025,338
School pedestrian training Injuries 57 $ 1,725,047 $ 3,750,385
Reduction Loss reduced by: 12%
Fatalities 1.60 $ 1,782,298
Injuries 50.2 $ 1,518,041 $ 3,300,339
Savings $ 450,046

37
Total fatalities 42,642
Fatals child occ age 4-8 not in seat 274
% total fatalities 0.643%
Median fatalities (state) 600
Est. children occ. 4-8 fatals (state) 3.86
Child occupants death-to-injury ratio 656.15
ESTIMATED SAVINGS FOR AN EXAMPLE STATE
No. $ Fatalities $ Injuries $ Total
Fatalities 3.86 $4,301,881
Booster seat programs Injuries 2,530 $76,492,780 $80,794,661
Reduction Loss reduced by: 8%
Fatalities 3.56 $3,974,938
Injuries 2,337.4 $70,679,328 $74,654,266
Savings $ 6,140,394
Table B2. Estimated savings for booster seat programs countermeasure.
children between 4 and 8 not traveling in booster seats in passenger vehicles. The child occupant fatality-to-injury ratio will beused in all calculations.
Children 4 to 8 not traveling in booster seats represent 0.6% of all fatalities, resulting in an estimated 4 fatalities per state. Asthere are an estimated 656 injuries per fatality, the example state is computed to have 2,530 injuries per year, for a total estimatedcost of $80,794,661. Booster seat programs have an estimated 8% reduction in injuries, resulting in savings of $6,140,394.
Class 2: Laws, Regulations, Policies
Bike Helmet Laws for Children: Grant and Rutner (2004) estimate a 15% reduction in child bicyclist fatalities attributable tobike helmet laws; applicable population: child bikers under age 12; permanent effects (medium cost).
The effect of this countermeasure is an estimated 15% reduction in fatalities. Its primary target is bicyclists under the ageof 12. The bicyclist fatality-to-injury ratio will be used in all calculations.
Cyclists under age 12 not wearing a helmet represent 0.1% of all fatalities, resulting in an estimated 1 fatality per state. As thereare an estimated 106 injuries per fatality, the example state is computed to have 91 injuries per year, for a total estimated cost of$3,719,434. Bike helmet laws for cyclists under age 12 have an estimated 15% reduction in fatalities, resulting in savings of $557,519.
Total fatalities 42,642
Bicyclists under 12, no helmet 61
% total fatalities 0.143%
Median fatalities (state) 600
Est. child cyclist fatalities (state) 0.86
Cyclist death-to-injury ratio 106.41
ESTIMATED SAVINGS FOR AN EXAMPLE STATE
No. $ Fatalities $ Injuries $ Total
Fatalities 0.86 $ 957,718
Bike helmet law for children Injuries 91 $ 2,761,716 $ 3,719,434
Reduction Loss reduced by: 15%
Fatalities 0.73 $ 814,060
Injuries 77.6 $ 2,347,459 $ 3,161,519
Savings $ 557,915
Table B3. Estimated savings for child bike helmet law countermeasure.

Graduated Driver Licensing (GDL): For three-stage systems, 20-40% reduction in crashes (Shope, 2007; Baker, Chen, and Li,2007); applicable population: 16-year-old drivers; permanent effects (medium cost).
The effect of this countermeasure is an estimated 20% reduction in crashes involving 16-year-old drivers. Its primary targetis 16-year-old drivers. The 16-year-old driver fatality-to-injury ratio will be used in all calculations.
Sixteen-year-old drivers are involved in 2% of all fatalities, resulting in an estimated 12 fatalities per state. As there are anestimated 268 injuries per fatality, the example state is computed to have 3,318 injuries per year, for a total estimated cost of$114,143,621. GDL has an estimated 20% reduction in crashes, resulting in savings of $22,828,724.
38
Total fatalities 42,642
Fatalities involving 16 y/o driver 880
% total fatalities 2.064%
Median fatalities (state) 600
Est. fatals inv. 16 y/o drivers (state) 12.38
Death-to-injury ratio inv 16 y/o driver 267.96
ESTIMATED SAVINGS FOR AN EXAMPLE STATE
No. $ Fatalities $ Injuries $ Total
Fatalities 12.38 $13,816,260 GDL – 3 stages
Injuries 3,318 $ 100,327,361 $114,143,621
Loss reduced by: 20%
Fatalities 9.91 $11,053,008
Reduction
Injuries 2,654.3 $ 80,261,889 $ 91,314,897
Sa vi ngs $ 22,828,724
Table B4. Estimated savings for GDL countermeasure.
Total fatalities 42,642
Fatalities involving 16 y/o driver 880
% total fatalities 2.064%
Median fatalities (state) 600
Est. fatals inv. 16 y/o drivers (state) 12.38
Death-to-injury ratio involving 16 y/o driver 267.96
ESTIMATED SAVINGS FOR AN EXAMPLE STATE
No. $ Fatalities $ Injuries $ Total
Fatalities 12.38 $13,816,260 Extended learner permit Injuries 3,318 $100,327,361 $114,143,621
Loss reduced by 22% Fatalities 9.66 $10,776,683
Reduction
Injuries 2,588 $ 78,255,342 $ 89,032,024
Savings $ 25,111,597
Table B5. Estimated savings for extended learner permit countermeasure.
Extended Learner Permit: Reduction of 22-33% in 16-year-old crashes if minimum permit age 16 and 6-month minimumholding period (Agent, Steenbergen, Pigman et al., 1998; Ulmer, Ferguson, Williams et al., 2001; Mayhew, Simpson, Desmondet al., 2003); applicable population: 16-year-old drivers; permanent effects (low cost).
The effect of this countermeasure is an estimated 22% reduction in crashes involving 16-year-old drivers if the minimum permitage is 16 with a 6-month minimum holding period. Its primary target is 16-year-old drivers. The 16-year-old driver fatality-to-injury ratio will be used in all calculations.
Sixteen-year-old drivers are involved in 2% of all fatalities, resulting in an estimated 12 fatalities per state. As there are anestimated 268 injuries per fatality, the example state is computed to have 3,318 injuries per year, for a total estimated cost of$114,143,621. The extended learner permit has an estimated 22% reduction in crashes, resulting in savings of $25,111,597.

39
Night Restrictions: On average, 50% reduction in nighttime crashes (9 P.M. to 6 A.M.) (Williams, 2007b); applicablepopulation: 16-year-old drivers; permanent effects (low cost).
The effect of this countermeasure is an estimated 50% reduction in nighttime crashes (9 P.M. to 6 A.M.) involving 16-year-old drivers. Its primary target is 16-year-old drivers. The 16-year-old driver fatality-to-injury ratio will be used in allcalculations.
Nighttime fatalities involving 16-year-old drivers represent 0.6% of all fatalities, resulting in an estimated 4 fatalities per state.As there are an estimated 268 injuries per fatality, the example state is computed to have 954 injuries per year, for a total esti-mated cost of $32,816,291. The nighttime (9 P.M. to 6 A.M.) restrictions have an estimated 50% reduction in nighttime crashes,resulting in savings of $16,408,146.
Total fatalities 42,642
Fatalities involving 16 y/o drivers in nighttime crashes 253 % total fatalities 0.593%
Median fatalities (state) 600
Estimated fatalities involving 16 y/o drivers in nighttime crashes (state) 3.56
Death-to-injury ratio involving 16 y/o drivers 267.96
ESTIMATED SAVINGS FOR AN EXAMPLE STATE
No. $
Fatalities $ Injuries $ Total
Fatalities 3.56 $3,972,175 Night restrictions (9 P.M. to 6 A.M.) Injuries 954 $28,844,116 $32,816,291
Loss reduced by: 50% Fatalities 1.78 $1,986,087
Reduction
Injuries 477.0 $14,422,058 $16,408,146
Savings $16,408,146
Table B6. Estimated savings for night restrictions countermeasure.
Total fatalities 42,642 Fatalities involving 16 y/o drivers with teen passengers 504% total fatalities 1.182% Median fatalities (state) 600
Est. fatalities involving 16 y/o drivers with teen passenger (state) 7.09 Death-to-injury ratio involving 16 y/o drivers 267.96
ESTIMATED SAVINGS FOR AN EXAMPLE STATE
No.$
Fatalities $ Injuries $ Total
Fatalities 7.09 $7,912,949 Passenger restrictions Injuries 1,900 $57,460,216 $65,373,165
Loss reduced by: 33% Fatalities 4.75 $5,301,676
Reduction
Injuries 1,273.2 $38,498,345 $43,800,020
Savings $21,573,144
Table B7. Estimated savings for passenger restrictions countermeasure.
Passenger Restrictions: About a 33% reduction in 16-year-old fatal crashes in which teen passengers are injured or killed(Williams, 2007b); applicable population: 16-year-old drivers, permanent effects (low cost).
The effect of this countermeasure is an estimated 33% reduction in 16-year-old driver fatal crashes in which a teen passengerwas injured or killed. Its primary target is 16-year-old drivers with teen passengers. The 16-year-old driver fatality-to-injury ratiowill be used in all calculations.

40
Total fatalities 42,642
Fatalities involving alcohol-impaired drivers 15,121 % total fatalities 35.460%
Median fatalities (state) 600
Estimated alcohol-impaired related fatalities (state) 212.76 Alcohol-related death-to-injury ratio 46.7
ESTIMATED SAVINGS FOR AN EXAMPLE STATE
No. $ Fatalities $ Injuries $ Total
Fatalities 212.76 $237,404,168 Administrative license revocation Injuries 9,936 $300,444,419 $537,848,587
Loss reduced by: 13% Fatalities 185.10 $206,541,626
Reduction
Injuries 8,644.3 $261,386,645 $467,928,271
Savings $ 69,920,316
Table B8. Estimated savings for administrative license revocation countermeasure.
Total fatalities 42,642
Front seat occupants unbelted 13,173 % total fatalities 30.892% Median fatalities (state) 600
Estimated front seat occupant fatalities (state) 185.35
Front seat occupants >13 death-to-injury ratio 156.21
ESTIMATED SAVINGS FOR AN EXAMPLE STATE No. $ Fatalities $ Injuries $ Total
Fatalities 185.35 $206,819,992 Primary seat belt law Injuries 28,954 $875,508,308 $1,082,328,300
Loss reduced by: 7% Fatalities 172.38 $192,342,593
Reduction
Injuries 26,927.1 $814,222,726 $1,006,565,319
Savings $ 75,762,981
Table B9. Estimated savings for primary seat belt law countermeasure.
Fatalities involving 16-year-old drivers with teen passenger(s) represent 1% of all fatalities, resulting in an estimated 7 fatali-ties per state. As there are an estimated 268 injuries per fatality, the example state is computed to have 1,900 injuries per year,for a total estimated cost of $65,373,165. The passenger restrictions have an estimated 33% reduction in the above describedcrashes, resulting in savings of $21,573,144.
Administrative License Revocation Law: Reduction of 13-15% in alcohol-related crashes (Wagenaar, Zobek, and Williams,2000; Ross, 1987, 1991; Zador, Lund, and Weinberg, 1989; Voas and Tippetts, 1999); applicable population: alcohol-impaireddrivers; permanent effects (high cost).
The effect of this countermeasure is an estimated 13% reduction in alcohol-related crashes. Its primary target is alcohol-impaired drivers (BAC ≥ .08). The alcohol related fatality-to-injury ratio will be used in all calculations.
Fatalities involving alcohol-impaired drivers represent 35% of all fatalities, resulting in an estimated 213 fatalities per state. As thereare an estimated 47 injuries per fatality, the example state is computed to have 9,936 injuries per year, for a total estimated cost of$537,848,587. Administrative license revocation law has an estimated 13% reduction in crashes, resulting in savings of $69,920,316.
Primary Seat Belt Law: Reduction of 7-8% in fatalities (Farmer and Williams, 2005; Chaudhary and Solomon, under review);applicable population: front seat occupants in passenger vehicles; permanent effects (low cost).

41
The effect of this countermeasure is an estimated 7% reduction in fatalities. Its primary target is unbelted front seat outboardoccupants of passenger vehicles (age 13 and up). The front seat occupant fatality-to-injury ratio will be used in all calculations.
Unbelted front seat occupants age 13 and over represent 31% of all fatalities, resulting in an estimated 185 fatalities per state. Asthere are an estimated 156 injuries per fatality, the example state is computed to have 28,954 injuries per year, for a total estimatedcost of $1,082,328,300. Primary seat belt law has an estimated 7% reduction in fatalities, resulting in savings of $75,762,981.
Motorcycle Helmet Use Law: Reduction of 20-40% in fatalities (GAO, 1991); applicable population: motorcyclists; perma-nent effects (low cost).
The effect of this countermeasure is an estimated 20% reduction in fatalities. Its primary target is motorcyclists. The motor-cyclist fatality-to-injury ratio will be used in all calculations.
Total fatalities 42,642
Motorcyclists (all) 4654
% total fatalities 10.914%
Median fatalities (state) 600
Est. motorcyclist fatalities (state) 65.48
Motorcyclist death-to-injury ratio 34.53
ESTIMATED SAVINGS FOR AN EXAMPLE STATE
No. $ Fatalities $ Injuries $ Total
Fatalities 65.48 $73,069,175 Universal helmet use law Injuries 2,261 $ 68,373,798 $ 141,442,973
Loss reduced by: 20% Fatalities 52.39 $58,455,340
Reduction
Injuries 1,809.0 $ 54,699,038 $ 113,154,379
Savings $ 28,288,595
Table B10. Estimated savings for universal helmet use law countermeasure.
Total fatalities 42,642
Ped. fatalities in 60km/h urban zones 1,106
% total fatalities 2.594%
Median fatalities (state) 600
Estimated pedestrian fatalities in 60 km/h urban zones (state) 15.56
Pedestrian death-to-injury ratio 31.43
ESTIMATED SAVINGS FOR AN EXAMPLE STATE
No. $ Fatalities $ Injuries $ Total
Fatalities 15.56 $17,364,527 Reduced speed limit Injuries 489 $14,789,935 $32,154,461
Loss reduced by: 25% Fatalities 11.67 $13,023,395
Reduction
Injuries 366.8 $11,092,451 $24,115,846
Savings $ 8,038,615
Table B11. Estimated savings for reduced speed limit countermeasure.
Motorcyclists represent 11% of all fatalities, resulting in an estimated 65 fatalities per state. As there are an estimated 35 injuriesper fatality, the example state is computed to have 2,261 injuries per year, for a total estimated cost of $141,442,973. Universalhelmet laws for motorcyclists have an estimated 20% reduction in fatalities, resulting in savings of $28,288,595.
Reduced Speed Limit: Reduction of 25-30% in pedestrian fatalities associated with a reduction in speed limit from 60 km/hto 50 km/h in urban areas (Fieldwick and Brown, 1987; Preston, 1990; Walz, Hoefliger, and Fehlmann, 1983); applicable popu-lation: pedestrians of all ages in urban areas; permanent effects (low cost).
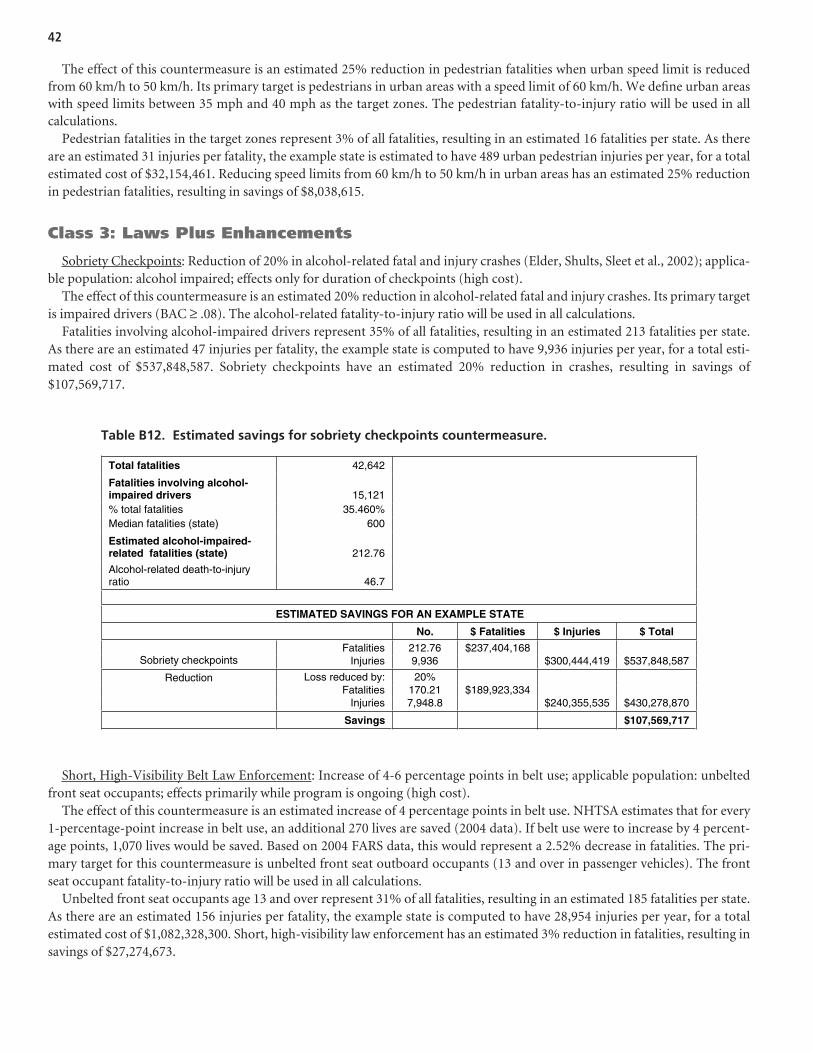
Short, High-Visibility Belt Law Enforcement: Increase of 4-6 percentage points in belt use; applicable population: unbeltedfront seat occupants; effects primarily while program is ongoing (high cost).
The effect of this countermeasure is an estimated increase of 4 percentage points in belt use. NHTSA estimates that for every1-percentage-point increase in belt use, an additional 270 lives are saved (2004 data). If belt use were to increase by 4 percent-age points, 1,070 lives would be saved. Based on 2004 FARS data, this would represent a 2.52% decrease in fatalities. The pri-mary target for this countermeasure is unbelted front seat outboard occupants (13 and over in passenger vehicles). The frontseat occupant fatality-to-injury ratio will be used in all calculations.
Unbelted front seat occupants age 13 and over represent 31% of all fatalities, resulting in an estimated 185 fatalities per state.As there are an estimated 156 injuries per fatality, the example state is computed to have 28,954 injuries per year, for a totalestimated cost of $1,082,328,300. Short, high-visibility law enforcement has an estimated 3% reduction in fatalities, resulting insavings of $27,274,673.
The effect of this countermeasure is an estimated 25% reduction in pedestrian fatalities when urban speed limit is reducedfrom 60 km/h to 50 km/h. Its primary target is pedestrians in urban areas with a speed limit of 60 km/h. We define urban areaswith speed limits between 35 mph and 40 mph as the target zones. The pedestrian fatality-to-injury ratio will be used in allcalculations.
Pedestrian fatalities in the target zones represent 3% of all fatalities, resulting in an estimated 16 fatalities per state. As thereare an estimated 31 injuries per fatality, the example state is estimated to have 489 urban pedestrian injuries per year, for a totalestimated cost of $32,154,461. Reducing speed limits from 60 km/h to 50 km/h in urban areas has an estimated 25% reductionin pedestrian fatalities, resulting in savings of $8,038,615.
Class 3: Laws Plus Enhancements
Sobriety Checkpoints: Reduction of 20% in alcohol-related fatal and injury crashes (Elder, Shults, Sleet et al., 2002); applica-ble population: alcohol impaired; effects only for duration of checkpoints (high cost).
The effect of this countermeasure is an estimated 20% reduction in alcohol-related fatal and injury crashes. Its primary targetis impaired drivers (BAC ≥ .08). The alcohol-related fatality-to-injury ratio will be used in all calculations.
Fatalities involving alcohol-impaired drivers represent 35% of all fatalities, resulting in an estimated 213 fatalities per state.As there are an estimated 47 injuries per fatality, the example state is computed to have 9,936 injuries per year, for a total esti-mated cost of $537,848,587. Sobriety checkpoints have an estimated 20% reduction in crashes, resulting in savings of$107,569,717.
42
Total fatalities 42,642
Fatalities involving alcohol-impaired drivers 15,121 % total fatalities 35.460% Median fatalities (state) 600
Estimated alcohol-impaired-related fatalities (state) 212.76
Alcohol-related death-to-injury ratio 46.7
ESTIMATED SAVINGS FOR AN EXAMPLE STATE
No. $ Fatalities $ Injuries $ Total
Fatalities 212.76 $237,404,168 Sobriety checkpoints Injuries 9,936 $300,444,419 $537,848,587
Loss reduced by: 20% Fatalities 170.21 $189,923,334
Reduction
Injuries 7,948.8 $240,355,535 $430,278,870
Savings $107,569,717
Table B12. Estimated savings for sobriety checkpoints countermeasure.

43
Total fatalities 42,642
Unbelted front seat occupants fatalities 13,173 % total fatalities 30.892% Median fatalities (state) 600
Est. unbelted front seat occupant fatalities (state) 185.35
Front seat occupants >13 death-to-injury ratio 156.21
ESTIMATED SAVINGS FOR AN EXAMPLE STATE
No. $ Fatalities $ Injuries $ Total
Fatalities 185.35 $206,819,992 Short, high-visibility belt law enforcement Injuries 28,954 $875,508,308 $1,082,328,300
Loss reduced by: 3% Fatalities 180.68 $201,608,129
Reduction
Injuries 28,224.3 $853,445,498 $1,055,053,627
Savings $ 27,274,673
Table B13. Estimated savings for short, high-visibility belt law enforcement countermeasure.
Automated Enforcement for Speed, Red Light Running: Speed cameras: on average, 20-40% reduction in crashes, based onstudies in Canada, Australia, and Europe (Pilkington and Kinra, 2005); red-light cameras: 16% reduction in all injury crashes,24% reduction in right-angle crashes, no significant increase in rear-end crashes (Aeron-Thomas and Hess, 2005); applicablepopulations: drivers running red lights or speeding; permanent effects where used (high cost).
The effect of this countermeasure (speed cameras) is an estimated 20% reduction in crashes. Its primary target is speed-relatedcrashes. The speed-related fatality-to-injury ratio will be used in all calculations.
Total fatalities 42,642
Speed-related fatalities 11,518
% total fatalities 27.011%
Median fatalities (state) 600 Est. speed-related fatalities (state ) 162.07
Speed-related death-to-injury ratio 87.48
ESTIM AT ED SA VINGS FOR AN EXA MPLE ST AT E
No. $ Fatalities $ Injuries $ Total
Fatalities 162.07 $180,836,003 Speed cameras Injuries 14,177 $ 428,699,124 $609,535,127
Loss reduced by: 20% Fatalities 129.65 $144,668,803
Reduction
Injuries 11,342.0 $ 342,959,299 $487,628,102
Sa vi ngs $121,907,025
Table B14. Estimated savings for speed cameras countermeasure.
Speed-related fatalities represent 27% of all fatalities, resulting in an estimated 162 fatalities per state. As there are an estimated87 injuries per fatality, the example state is computed to have 14,177 injuries per year, for a total estimated cost of $609,535,127.Speed cameras have an estimated 20% reduction in crashes, resulting in savings of $121,907,025.
Mass Media Supporting Alcohol Enforcement (Top-Line Programs): Reduction of 13% in alcohol-related crashes, with thecaution that this is based on top-line programs (Elder, Shults, Sleet et al., 2002); applicable population: alcohol-impaired driv-ers; effects while program ongoing (high cost).
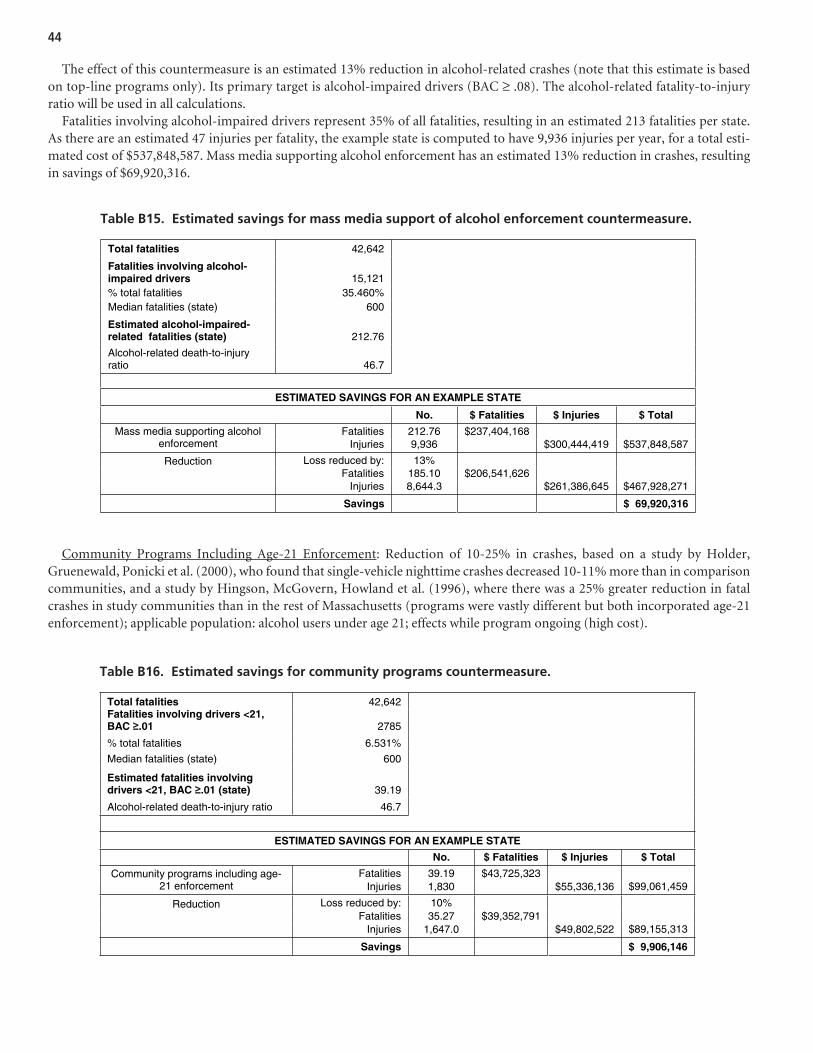
Community Programs Including Age-21 Enforcement: Reduction of 10-25% in crashes, based on a study by Holder,Gruenewald, Ponicki et al. (2000), who found that single-vehicle nighttime crashes decreased 10-11% more than in comparisoncommunities, and a study by Hingson, McGovern, Howland et al. (1996), where there was a 25% greater reduction in fatalcrashes in study communities than in the rest of Massachusetts (programs were vastly different but both incorporated age-21enforcement); applicable population: alcohol users under age 21; effects while program ongoing (high cost).
The effect of this countermeasure is an estimated 13% reduction in alcohol-related crashes (note that this estimate is basedon top-line programs only). Its primary target is alcohol-impaired drivers (BAC ≥ .08). The alcohol-related fatality-to-injuryratio will be used in all calculations.
Fatalities involving alcohol-impaired drivers represent 35% of all fatalities, resulting in an estimated 213 fatalities per state.As there are an estimated 47 injuries per fatality, the example state is computed to have 9,936 injuries per year, for a total esti-mated cost of $537,848,587. Mass media supporting alcohol enforcement has an estimated 13% reduction in crashes, resultingin savings of $69,920,316.
44
Total fatalities 42,642
Fatalities involving alcohol-impaired drivers 15,121 % total fatalities 35.460% Median fatalities (state) 600
Estimated alcohol-impaired-related fatalities (state) 212.76
Alcohol-related death-to-injury ratio 46.7
ESTIMATED SAVINGS FOR AN EXAMPLE STATE
No. $ Fatalities $ Injuries $ Total
Fatalities 212.76 $237,404,168 Mass media supporting alcohol enforcement Injuries 9,936 $300,444,419 $537,848,587
Loss reduced by: 13% Fatalities 185.10 $206,541,626
Reduction
Injuries 8,644.3 $261,386,645 $467,928,271
Savings $ 69,920,316
Table B15. Estimated savings for mass media support of alcohol enforcement countermeasure.
Total fatalities 42,642 Fatalities involving drivers <21, BAC .01 2785
% total fatalities 6.531%
Median fatalities (state) 600
Estimated fatalities involving drivers <21, BAC .01 (state) 39.19
Alcohol-related death-to-injury ratio 46.7
ESTIMATED SAVINGS FOR AN EXAMPLE STATE
No. $ Fatalities $ Injuries $ Total
Fatalities 39.19 $43,725,323 Community programs including age-21 enforcement Injuries 1,830 $55,336,136 $99,061,459
Loss reduced by: 10% Fatalities 35.27 $39,352,791
Reduction
Injuries 1,647.0 $49,802,522 $89,155,313
Savings $ 9,906,146
Table B16. Estimated savings for community programs countermeasure.

45
The effect of this countermeasure is an estimated 10% reduction in crashes. Its primary target is drivers under 21 withBAC ≥ .01. The alcohol-related fatality-to-injury ratio will be used in all calculations.
Fatalities involving drivers under 21 with BAC ≥ .01 represent 7% of all fatalities, resulting in an estimated 39 fatalities perstate. As there are an estimated 47 injuries per fatality, the example state is computed to have 1,830 injuries per year, for a totalestimated cost of $99,061,459. Community programs including age-21 enforcement have an estimated 10% reduction in crashes,resulting in savings of $9,906,146.
Class 4: Sanctions and Treatments
Aggressive Driving/Speeding Penalties: Crash reduction effects for license suspension 17%, individual meetings 8%, groupmeetings 5%, and warning letters 4% (Masten and Peck, 2004); applicable population: apprehended traffic violators; effects whilesanctions are in force, may not last (medium cost).
These countermeasures’ primary target is apprehended traffic violators. For this project, we will define the target as driverswith previous speeding convictions since data regarding previous aggressive driving convictions are not available in FARS.
License Suspension (Medium Cost)
The effect of this countermeasure is an estimated 17% reduction in crashes. Its primary target is drivers with previous speed con-victions involved in aggressive-driving-related crashes. The aggressive driving fatality-to-injury ratio will be used in all calculations.
Aggressive-driving-related fatalities involving drivers with previous speed convictions represent 8% of all fatalities, resultingin an estimated 47 fatalities per state. As there are an estimated 90 injuries per fatality, the example state is computed to have4,250 injuries per year, for a total estimated cost of $181,293,587. License suspension has an estimated 17% reduction in crashes,resulting in savings of $30,819,910.
Total fatalities 42,642
Fatalities involving aggressive drivers with prev. speed conv. 3,362 % total fatalities 7.884%
Median fatalities (state) 600
Est. fatalities involving prev. speed conv. (state) 47.31
Aggressive driving death-to-injury ratio 89.84
ESTIMATED SAVINGS FOR AN EXAMPLE STATE
No. $ Fatalities $ Injuries $ Total
Fatalities 47.31 $52,784,393 License suspension Injuries 4,250 $128,509,194 $181,293,587
Loss reduced by: 17% Fatalities 39.26 $43,811,047
Reduction
Injuries 3,527.4 $106,662,631 $150,473,678
Savings $ 30,819,910
Table B17. Estimated savings for license suspension countermeasure.
Individual Meetings (Low Cost)
The effect of this countermeasure is an estimated 8% reduction in crashes. Its primary target is apprehended traffic violatorsinvolved in aggressive-driving-related crashes. The aggressive driving fatality-to-injury ratio will be used in all calculations.
Aggressive-driving-related fatalities involving drivers with previous speed convictions represent 8% of all fatalities, resultingin an estimated 47 fatalities per state. As there are an estimated 90 injuries per fatality, the example state is computed to have4,250 injuries per year, for a total estimated cost of $181,293,587. Individual meetings have an estimated 8% reduction in crashes,resulting in savings of $14,503,487.

46
Total fatalities 42,642
Fatalities involving aggressive drivers with prev. speed conv. 3,362 % total fatalities 7.884% Median fatalities (state) 600
Est. fatalities involving prev. speed conv. (state) 47.31
Aggressive driving death-to-injury ratio 89.84
ESTIMATED SAVINGS FOR AN EXAMPLE STATE
No. $ Fatalities $ Injuries $ Total
Fatalities 47.31 $52,784,393 Individual meetings Injuries 4,250 $128,509,194 $181,293,587
Loss reduced by: 8% Fatalities 43.52 $48,561,642
Reduction
Injuries 3,909.9 $118,228,458 $166,790,100
Savings $ 14,503,487
Table B18. Estimated savings for individual meetings countermeasure.
Group Meetings (Medium Cost)
The effect of this countermeasure is an estimated 5% reduction in crashes. Its primary target is apprehended traffic violatorsinvolved in aggressive-driving-related crashes. The aggressive driving fatality-to-injury ratio will be used in all calculations.
Aggressive-driving-related fatalities involving drivers with previous speed convictions represent 8% of all fatalities, resultingin an estimated 47 fatalities per state. As there are an estimated 90 injuries per fatality, the example state is computed to have4,250 injuries per year, for a total estimated cost of $181,293,587. Group meetings have an estimated 5% reduction in crashes,resulting in savings of $9,064,679.
Total fatalities 42,642
Fatalities involving aggressive drivers with prev. speed conv. 3,362 % total fatalities 7.884% Median fatalities (state) 600
Est. fatalities involving prev. speed conv. (state) 47.31
Aggressive driving death-to-injury ratio 89.84
ESTIMATED SAVINGS FOR AN EXAMPLE STATE
No. $ Fatalities $ Injuries $ Total
Fatalities 47.31 $52,784,393 Group meetings Injuries 4,250 $128,509,194 $181,293,587
Loss reduced by: 5% Fatalities 44.94 $50,145,174
Reduction
Injuries 4,037.4 $122,083,734 $172,228,908
Savings $ 9,064,679
Table B19. Estimated savings for group meetings countermeasure.
Warning Letters (Medium Cost)
The effect of this countermeasure is an estimated 4% reduction in crashes. Its primary target is apprehended traffic violators involved in aggressive-driving-related crashes. The aggressive driving fatality-to-injury ratio will be used in all calculations.

47
Total fatalities 42,642
Fatalities involving aggressive drivers with prev. speed conv. 3,362 % total fatalities 7.884% Median fatalities (state) 600 Est. fatalities involving prev. speed convictions (state) 47.31
Aggressive driving death-to-injury ratio 89.84
ESTIMATED SAVINGS FOR AN EXAMPLE STATE
No. $ Fatalities $ Injuries $ Total
Fatalities 47.31 $52,784,393 Warning letters Injuries 4,250 $128,509,194 $181,293,587
Loss reduced by: 4% Fatalities 45.41 $50,673,018
Reduction
Injuries 4,079.9 $123,368,826 $174,041,844
Savings $ 7,251,743
Table B20. Estimated savings for warning letters countermeasure.
Mandatory Attendance at Alcohol Treatment Programs: Reduction in alcohol-related crashes, 7-9% on average (Wells-ParkerBanger-Drowns, McMillen et al., 1995); applicable population: DUI-convicted population; effect duration unknown (medium cost).
The effect of this countermeasure is an estimated 7% reduction in alcohol-related crashes. Its primary target is drivers withprevious DWI convictions involved in alcohol-related crashes (i.e., BAC ≥ .01). The alcohol-related fatality-to-injury ratio willbe used in all calculations.
Alcohol-related fatalities involving drivers with previous DWI represent 3% of all fatalities, resulting in an estimated16 fatalities per state. As there are an estimated 47 injuries per fatality, the example state is computed to have 767 injuriesper year, for a total estimated cost of $41,509,775. Alcohol treatment programs have an estimated 7% reduction in crashes,resulting in savings of $2,905,684.
Total fatalities 42,642
Alcohol-related fatalities involving drivers with previous DWI 1,167 % total fatalities 2.737% Median fatalities (state) 600 Est. alcohol-related fatalities inv. drivers with prev. DWI (state) 16.42 Alcohol related death-to-injury ratio 46.7
ESTIMATED SAVINGS FOR AN EXAMPLE STATE
No. $ Fatalities $ Injuries $ Total
Fatalities 16.42 $18,322,245 Alcohol treatment program Injuries 767 $23,187,530 $41,509,775
Loss reduced by: 7% Fatalities 15.27 $17,039,688
Reduction
Injuries 713.2 $21,564,403 $38,604,090
Savings $ 2,905,684
Table B21. Estimated savings for alcohol treatment program countermeasure.
Aggressive-driving-related fatalities involving drivers with previous speed convictions represent 8% of all fatalities, resultingin an estimated 47 fatalities per state. As there are an estimated 90 injuries per fatality, the example state is computed to have4,250 injuries per year, for a total estimated cost of $181,293,587. Warning letters have an estimated 4% reduction in crashes,resulting in savings of $7,251,743.

48
Total fatalities 42,642
Alcohol-related fatalities inv. drivers with previous DWI 1,167% total fatalities 2.737% Median fatalities (state) 600
Est. alcohol-related fatalities inv. drivers with prev. DWI (state) 16.42
Alcohol related death-to-injury ratio 46.7
ESTIMATED SAVINGS FOR AN EXAMPLE STATE
No. $ Fatalities $ Injuries $ Total
Fatalities 16.42 $18,322,245 Alcohol interlock Injuries 767 $23,187,530 $41,509,775
Loss reduced by: 37% Fatalities 10.34 $11,543,014
Reduction
Injuries 483.1 $14,608,144 $26,151,158
Savings $15,358,617
Table B22. Estimated savings for alcohol interlock countermeasure.
Alcohol Interlocks: Reduction of 37-90% in recidivism (Willis, Lybrand, and Bellamy, 2004; Beirness and Marques, 2004); appli-cable population: DUI convicted population; duration of effect limited to period when interlock is present (medium cost).
The effect of this countermeasure is an estimated 37% reduction in recidivism. Its primary target is drivers with previous DWIconvictions involved in alcohol-related crashes. The assumption is that 37% of previously convicted drivers with an installedalcohol interlock system would not drink and drive, and thus would not be involved in alcohol-related crashes. The alcohol-related fatality-to-injury ratio will be used in all calculations.
Alcohol-related fatalities involving drivers with previous DWI represent 3% of all fatalities, resulting in an estimated16 fatalities per state. As there are an estimated 47 injuries per fatality, the example state is estimated to have 767 alcohol-related injuries per year, for a total estimated cost of $41,509,775. Alcohol interlocks for convicted DWI drivers have an esti-mated 37% reduction in recidivism, resulting in savings of $15,358,617.

49
Voluntary Action
Responsible beverage service (Shults, Elder, Sleet et al.,2001; Holder, Gruenewald, Ponicki et al., 2000)
Parents guiding teen licensing (Simons-Morton, 2007)
Laws, Regulations, Policies
Ice cream vendor ordinance (Hale, Blomberg, and Preusser,1978)
Local primary seat belt laws (NHTSA, 2007b)Adult bike helmet laws (Ginsberg and Silverberg, 1994;
Robinson, 1996; Scuffham, Alsop, Cryer et al., 2000)License renewal policies (Morrisey and Grabowski, 2005)
for drivers 85 and older with in-person renewalLicense actions for underage alcohol violations (Ulmer,
Ferguson, Williams et al. 2001)
Laws Plus Enhancements
Integrated enforcement (Jones, Joksch, and Lacey, 1995;Hingson, McGovern, Howland et al., 1996)
Zero-tolerance enforcement (Jones and Lacey, 2001)Vendor compliance checks for age-21 enforcement (Stewart,
1999)Sustained seat belt enforcement (Hedlund, Preusser, and
Shults, 2004; Glassbrenner, 2005)
Sanctions and Treatments
Increased belt use law penalties (Houston and Richardson,2006)
Simplifying and streamlining DUI statutes (no referencesbut has obvious potential for producing a more effectiveand efficient DUI control system)
A P P E N D I X C
Countermeasures Likely to Work

Voluntary Action
Child bicycle helmet promotions: (Wood and Milne, 1988;Bergman, Rivara, Richards et al., 1990; Van Houten,Van Houten, and Malenfant, 2007). All studies based onhigh-quality community programs.
Laws, Regulations, Policies
BAC test refusal penalties: Produces fewer refusals (Zwicker,Hedlund, and Northrup, 2005), which may increaseDUI convictions.
Speed limits: Clear evidence that raised speed limits onhigh-speed roads increase fatalities; lowered speed lim-its reduce fatalities (TRB, 2006).
Laws Plus Enhancements
Saturation patrols for alcohol-impaired driving: Increasearrests (Greene, 2003; Century Council, 2003), althoughnumber estimates not available; no studies of effects oncrashes.
Preliminary breath test devices: Increase arrests to un-known extent; effect on crashes unclear (Century Coun-cil, 2003).
Passive alcohol sensors: Increase arrests at checkpoints andpossibly increase general deterrence (Kiger, Lestina, andLund, 1993; Ferguson, Wells, and Lund, 1995); effectson crashes unclear.
PI&E supporting enforcement of seat belt laws: Paid adver-tising increases belt use. Solomon, Ulmer, and Preusser
(2002) found that belt use increased by 8.6% in statesthat used paid advertising extensively in their enforce-ment campaigns, 2.4% across four states that used lim-ited paid advertising, and 0.5% in states that used nopaid advertising.
Sanctions and Treatments
Restrictions on plea bargains: Convictions are increased,recidivism may also be reduced (NTSB, 2000). No nu-merical estimates available.
Court monitoring: Cases less likely to be dismissed, morelikely to be guilty judgments (Shinar, 1992); more stud-ies needed to derive numerical estimates.
Close monitoring of DUIs: There are many types, e.g., in-tensive supervision, home confinement with electronicmonitoring, dedicated detention facilities, individualjudicial oversight. Reductions in recidivism, numericalestimates not established (Voas and Tippetts, 1990;Lapham, Kapitual, C’de et al., 2006; Jones, Wiliszowski,and Lacey, 1996).
Brief interventions—alcohol: Reduces drinking and self-reported driving after drinking (D’Onofrio and Degutis,2002; Moyer, Finney, Swearingen et al., 2002; Wilk,Jensen, and Havighurst, 1997); some evidence of crashreductions (Dill, Wells-Parker, and Soderstrom, 2004).
License plate impoundment: Reduces recidivism; numericalestimates not established.
Vehicle immobilization, vehicle impoundment: Reducesrecidivism; numerical estimates not established (Voas,Tippetts, and Taylor, 1997, 1998; DeYoung, 1997, 1998).
A P P E N D I X D
Proven Countermeasures With No Crashor Injury Reduction Calculations
50

Abbreviations and acronyms used without definitions in TRB publications:
AAAE American Association of Airport ExecutivesAASHO American Association of State Highway OfficialsAASHTO American Association of State Highway and Transportation OfficialsACI–NA Airports Council International–North AmericaACRP Airport Cooperative Research ProgramADA Americans with Disabilities ActAPTA American Public Transportation AssociationASCE American Society of Civil EngineersASME American Society of Mechanical EngineersASTM American Society for Testing and MaterialsATA Air Transport AssociationATA American Trucking AssociationsCTAA Community Transportation Association of AmericaCTBSSP Commercial Truck and Bus Safety Synthesis ProgramDHS Department of Homeland SecurityDOE Department of EnergyEPA Environmental Protection AgencyFAA Federal Aviation AdministrationFHWA Federal Highway AdministrationFMCSA Federal Motor Carrier Safety AdministrationFRA Federal Railroad AdministrationFTA Federal Transit AdministrationIEEE Institute of Electrical and Electronics EngineersISTEA Intermodal Surface Transportation Efficiency Act of 1991ITE Institute of Transportation EngineersNASA National Aeronautics and Space AdministrationNASAO National Association of State Aviation OfficialsNCFRP National Cooperative Freight Research ProgramNCHRP National Cooperative Highway Research ProgramNHTSA National Highway Traffic Safety AdministrationNTSB National Transportation Safety BoardSAE Society of Automotive EngineersSAFETEA-LU Safe, Accountable, Flexible, Efficient Transportation Equity Act: A Legacy for Users (2005)TCRP Transit Cooperative Research ProgramTEA-21 Transportation Equity Act for the 21st Century (1998)TRB Transportation Research BoardTSA Transportation Security AdministrationU.S.DOT United States Department of Transportation


