Bull, D., Barton, J., Thomsen, O., Butler, R., Rhead, A. T., Fletcher, A., & Potter, K. D. (2017). Reshaping the testing pyramid: Utilisation of data-rich NDT techniques as a means to develop a 'high fidelity' component and sub- structure testing methodology for composites. Paper presented at 21st International Conference on Composite Materials, ICCM 2017, Xi'an, China. Peer reviewed version Link to publication record in Explore Bristol Research PDF-document University of Bristol - Explore Bristol Research General rights This document is made available in accordance with publisher policies. Please cite only the published version using the reference above. Full terms of use are available: http://www.bristol.ac.uk/pure/about/ebr-terms brought to you by CORE View metadata, citation and similar papers at core.ac.uk provided by Explore Bristol Research
Transcript
Bull, D., Barton, J., Thomsen, O., Butler, R., Rhead, A. T., Fletcher, A., &Potter, K. D. (2017). Reshaping the testing pyramid: Utilisation of data-richNDT techniques as a means to develop a 'high fidelity' component and sub-structure testing methodology for composites. Paper presented at 21stInternational Conference on Composite Materials, ICCM 2017, Xi'an, China.
Peer reviewed version
Link to publication record in Explore Bristol ResearchPDF-document
University of Bristol - Explore Bristol ResearchGeneral rights
This document is made available in accordance with publisher policies. Please cite only the publishedversion using the reference above. Full terms of use are available:http://www.bristol.ac.uk/pure/about/ebr-terms
brought to you by COREView metadata, citation and similar papers at core.ac.uk
21st International Conference on Composite Materials
Xi’an, 20-25th August 2017
RESHAPING THE TESTING PYRAMID: UTILISATION OF DATA-
RICH NDT TECHNIQUES AS A MEANS TO DEVELOP A 'HIGH
FIDELITY' COMPONENT AND SUB-STRUCTURE TESTING
METHODOLOGY FOR COMPOSITES
D. J. Bull1, J. M. Dulieu-Barton
1, O. T. Thomsen
1, R. Butler
2, A. T. Rhead
2, T. A. Fletcher
2 and K. D.
Potter3
1 Faculty of Engineering and the Environment, University of Southampton, University Road, SO17
1AE, UK 2 Department of Mechanical Engineering, University of Bath, Claverton Down, Bath, BA2 7AY, UK 3 ACCIS (Advanced Composites Centre for Innovation and Science), University of Bristol, Queen’s
Building, University Walk, Bristol, BS8 1TR, UK
Keywords: Composite structures, non-destructive testing, thermal stress analysis, digital image
correlation, X-ray computed tomography
ABSTRACT
A key issue in the certification of composite structures is the heavy reliance on ‘coupon level’ tests
that do not always translate well to the sub-structure, component and full scale structural behaviour
within a ‘building block’ or ‘testing pyramid’ framework. This has a strong bearing on the certification
process as many of the design allowables and failure predictions are determined from the behaviour of
coupon specimens. The overarching aim of this work is to develop an understanding into the
behaviour of composites at the larger sub-component scales, which better represent the in-service
behaviour of these structures, reducing the reliance on extensive coupon level testing. This requires
non-destructive testing (NDT) methods that are scalable to large components. This study investigates
the feasibilities of Thermoelastic Stress Analysis (TSA) and Digital Image Correlation (DIC) as
scalable strain based NDT methods that provide full-field information to study the effects of defects on
structural composite components. Both techniques are successfully demonstrated showing their
capability for detecting the detrimental effects of fibre waviness (wrinkles) on a thick non-generic
composite component. X-ray computed tomography (CT) is used to validate the observations made
with the two strain based NDT techniques.
1 INTRODUCTION
The certification of composite structures is heavily reliant on the ‘building block’ or ‘testing pyramid’
framework. With this approach, most tests and design allowables are determined from extensive
coupon testing. Unfortunately, coupon tests are not always representative of the true in-service
conditions of a component and in most cases, do not always translate well to larger scales [1, 2].
Hence, there is a significant weakness in the testing pyramid, and one that adds considerable time and
costs to the certification and development process.
The aim of the work described here is to reduce the need for extensive coupon level testing and instead
focus on developing an understanding of composite behaviour at the element and sub-component
scales that are more relevant to the in-service conditions. Developing understanding at the sub-
structural or component level is necessary for validating virtual testing methods [3] and for statistical
analysis of how components respond to manufacturing defects and environmental damage. Hence the
proposed approach is much more relevant than coupon tests. In the long term, building an approach for
suitable assessment of sub-structures would enable “certification by simulation” enabling accelerated
certification approaches, which in turn means reducing the requirements for extensive experiments [4,
5]. To achieve the ambitious aim, it is necessary to define suitable experiments that provide the
necessary details of the material behaviour incorporated at a structural length scales.
D. J. Bull, J. M. Dulieu-Barton, O. T. Thomsen, R. Butler, A. T. Rhead, T. Fletcher, K. D. Potter and R. A. Smith
The present investigation assesses the capabilities of thermoelastic stress analysis (TSA) and digital
image correlation (DIC) in identifying the effect of ply waviness on the performance of a non-generic
aerospace component. TSA and DIC are full-field imaging techniques that provide information on the
surface strains and are scalable to such large components. TSA [6] is based on the measurement of a
small change in temperature which is directly related to the stress [7, 8]. The magnitude and phase of
the temperature change are obtained by lock-in processing; the phase data has been shown to reveal
damage [7, 9]. DIC [10] tracks the movement of a surface speckle pattern to obtain displacements and
strains. Despite successful use in composite applications, little work has been done on the application
of TSA and DIC to sub-surface defects such as ply waviness, particularly on thick and large scale
composite components. Hence, the feasibility of adopting TSA and DIC for assessing the effects of
sub-surface behaviour is a key outcome of the present study.
The key benefit of TSA and DIC techniques is their capability for obtaining the material behaviour
local to defects (e.g. stress/strain concentrations [11, 12]) and therefore provide an indicator of how
detrimental the defect is, often before damage progresses. A further advantage of the two techniques is
that the data can be obtained rapidly, as the damage progresses in a loaded component, particularly
TSA, which can be done in practically real time. This complements other NDT methods such as
ultrasound [13] and X-ray computed tomography (CT) [14] that can identify subsurface defects, but
cannot directly deliver information related to strain local to features and defects. Ultrasound and CT
scans can be deployed during testing but at present the tests must be interrupted [15-17]. In addition,
both ultrasound and X-ray CT are relatively slow and hence may require prior knowledge of the
damage location to reduce inspection times. Nonetheless, both ultrasound and CT approaches are
important to establish the initial defect conditions which serve as inputs for models, and to understand
the evolution of damage progression [18]. In this work, CT is used to establish the initial defect shapes
and locations and the associated evolving delamination damage that was incurred with increasing load
until final failure, to validate the findings of the TSA and DIC. Ultrasound has also been performed, as
well as high-fidelity finite element modelling to predict failure; these aspects of work (ultrasound and
virtual testing) will be presented in a later paper.
2 MATERIALS AND METHODS
2.1 Test component
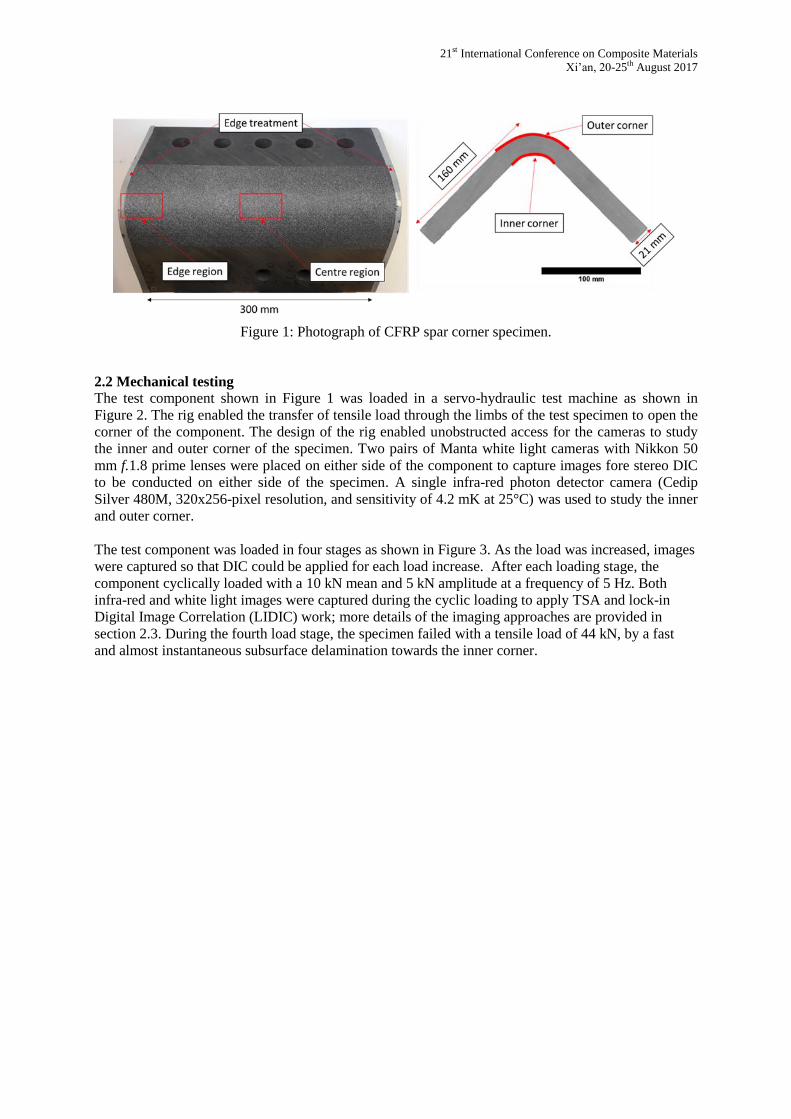
Figure 1 shows the test component, which is representative of part of the corner of a wing spar. Figure
1 also shows dimensions of the CFRP component along with terminology used to describe features of
component. The component was 300 mm long with a 160 mm limb length. The thickness of the
component was ~21 mm along half of the length, with a linear taper that transitioned from 21 to 15
mm along the other half of the length. The wrinkle defect is along the inner corner located at the
centre region. Edge treatment, as undertaken in a previous study [19], was applied to prevent damage
initiation from the free edge. To facilitate TSA and DIC work, a thin layer of matt black spray paint
was applied to the inner and outer corners of the component followed fine distribution of white paint
speckles. This led to speckle density of ~6 speckles per mm2 and an average speckle size of 8.9 pixels
per speckle.
21st International Conference on Composite Materials
Xi’an, 20-25th August 2017
Figure 1: Photograph of CFRP spar corner specimen.
2.2 Mechanical testing
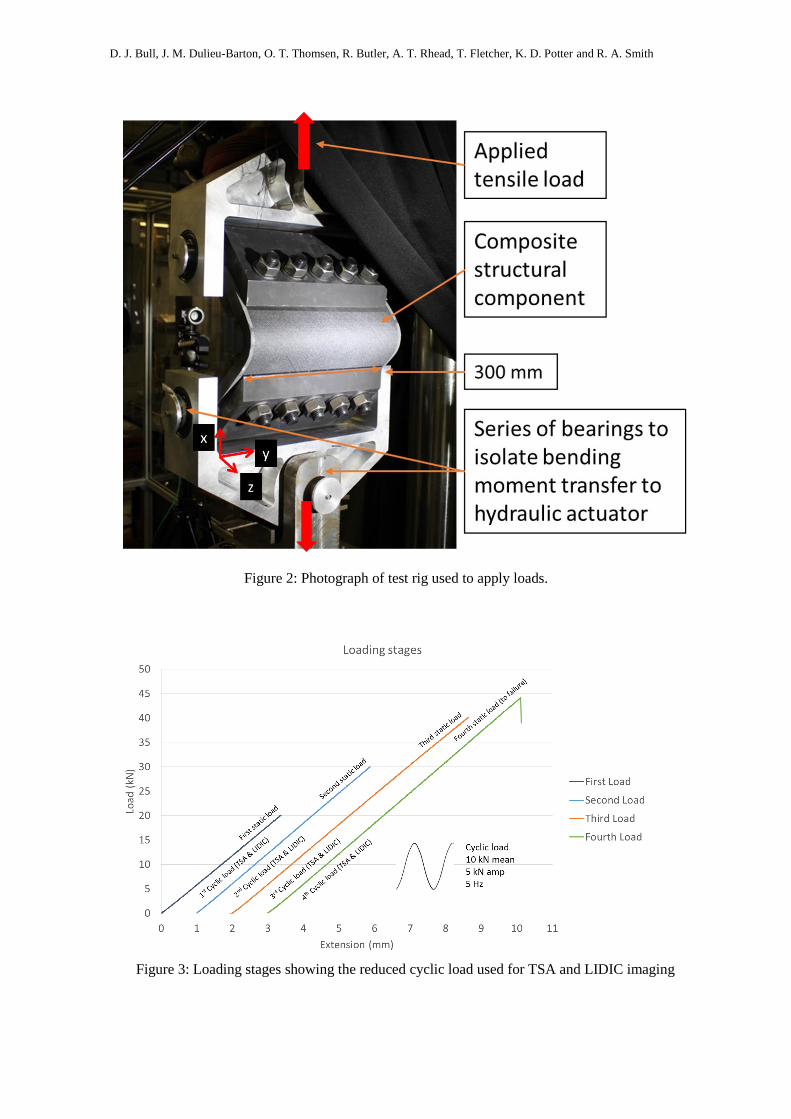
The test component shown in Figure 1 was loaded in a servo-hydraulic test machine as shown in
Figure 2. The rig enabled the transfer of tensile load through the limbs of the test specimen to open the
corner of the component. The design of the rig enabled unobstructed access for the cameras to study
the inner and outer corner of the specimen. Two pairs of Manta white light cameras with Nikkon 50
mm f.1.8 prime lenses were placed on either side of the component to capture images fore stereo DIC
to be conducted on either side of the specimen. A single infra-red photon detector camera (Cedip
Silver 480M, 320x256-pixel resolution, and sensitivity of 4.2 mK at 25°C) was used to study the inner
and outer corner.
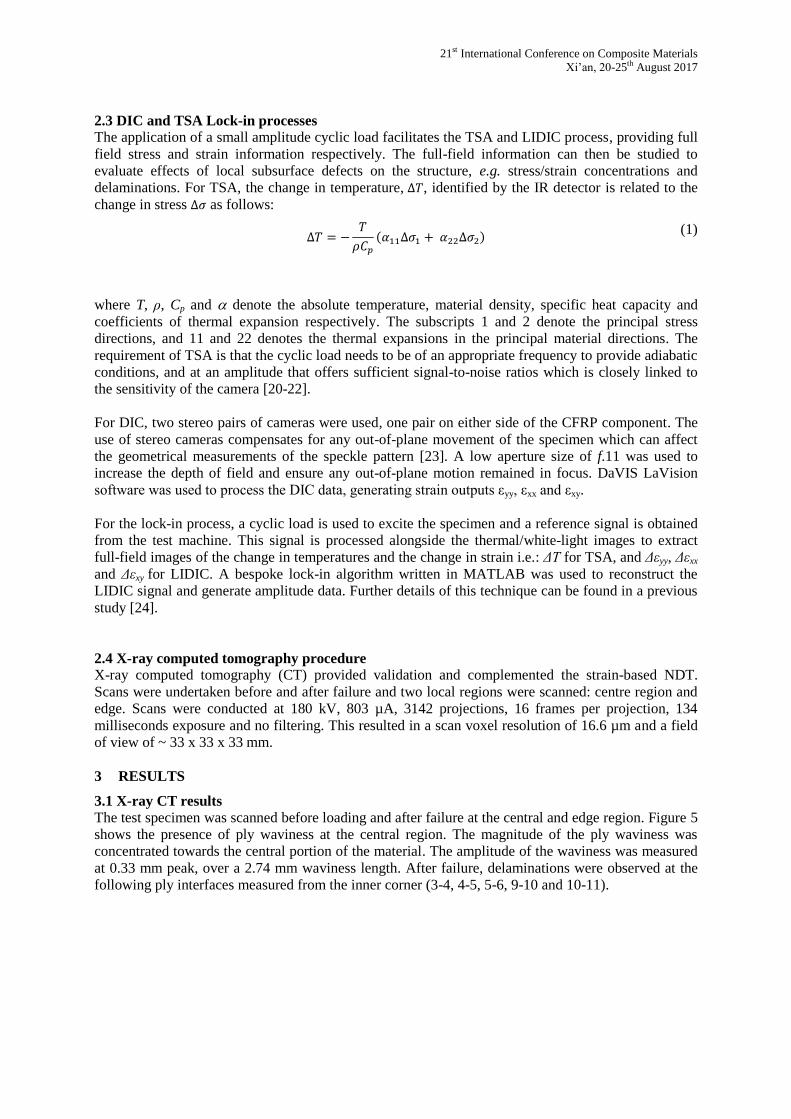
The test component was loaded in four stages as shown in Figure 3. As the load was increased, images
were captured so that DIC could be applied for each load increase. After each loading stage, the
component cyclically loaded with a 10 kN mean and 5 kN amplitude at a frequency of 5 Hz. Both
infra-red and white light images were captured during the cyclic loading to apply TSA and lock-in
Digital Image Correlation (LIDIC) work; more details of the imaging approaches are provided in
section 2.3. During the fourth load stage, the specimen failed with a tensile load of 44 kN, by a fast
and almost instantaneous subsurface delamination towards the inner corner.
D. J. Bull, J. M. Dulieu-Barton, O. T. Thomsen, R. Butler, A. T. Rhead, T. Fletcher, K. D. Potter and R. A. Smith
Figure 2: Photograph of test rig used to apply loads.
Figure 3: Loading stages showing the reduced cyclic load used for TSA and LIDIC imaging
21st International Conference on Composite Materials
Xi’an, 20-25th August 2017
2.3 DIC and TSA Lock-in processes
The application of a small amplitude cyclic load facilitates the TSA and LIDIC process, providing full
field stress and strain information respectively. The full-field information can then be studied to
evaluate effects of local subsurface defects on the structure, e.g. stress/strain concentrations and
delaminations. For TSA, the change in temperature, ∆𝑇, identified by the IR detector is related to the
change in stress ∆𝜎 as follows:
∆𝑇 = −𝑇
𝜌𝐶𝑝
(𝛼11∆𝜎1 + 𝛼22∆𝜎2) (1)
where T, ρ, Cp and denote the absolute temperature, material density, specific heat capacity and
coefficients of thermal expansion respectively. The subscripts 1 and 2 denote the principal stress
directions, and 11 and 22 denotes the thermal expansions in the principal material directions. The
requirement of TSA is that the cyclic load needs to be of an appropriate frequency to provide adiabatic
conditions, and at an amplitude that offers sufficient signal-to-noise ratios which is closely linked to
the sensitivity of the camera [20-22].
For DIC, two stereo pairs of cameras were used, one pair on either side of the CFRP component. The
use of stereo cameras compensates for any out-of-plane movement of the specimen which can affect
the geometrical measurements of the speckle pattern [23]. A low aperture size of f.11 was used to
increase the depth of field and ensure any out-of-plane motion remained in focus. DaVIS LaVision
software was used to process the DIC data, generating strain outputs εyy, εxx and εxy.
For the lock-in process, a cyclic load is used to excite the specimen and a reference signal is obtained
from the test machine. This signal is processed alongside the thermal/white-light images to extract
full-field images of the change in temperatures and the change in strain i.e.: ΔT for TSA, and Δεyy, Δεxx
and Δεxy for LIDIC. A bespoke lock-in algorithm written in MATLAB was used to reconstruct the
LIDIC signal and generate amplitude data. Further details of this technique can be found in a previous
study [24].
2.4 X-ray computed tomography procedure
X-ray computed tomography (CT) provided validation and complemented the strain-based NDT.
Scans were undertaken before and after failure and two local regions were scanned: centre region and
edge. Scans were conducted at 180 kV, 803 µA, 3142 projections, 16 frames per projection, 134
milliseconds exposure and no filtering. This resulted in a scan voxel resolution of 16.6 µm and a field
of view of ~ 33 x 33 x 33 mm.
3 RESULTS
3.1 X-ray CT results
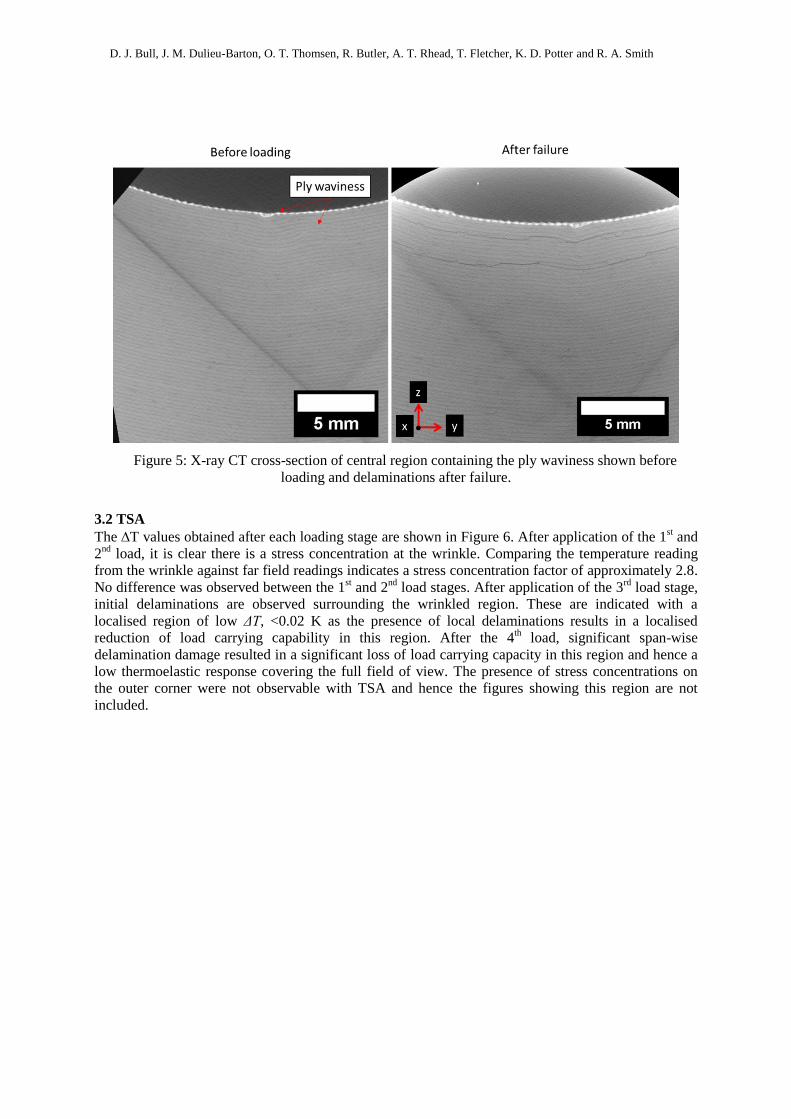
The test specimen was scanned before loading and after failure at the central and edge region. Figure 5
shows the presence of ply waviness at the central region. The magnitude of the ply waviness was
concentrated towards the central portion of the material. The amplitude of the waviness was measured
at 0.33 mm peak, over a 2.74 mm waviness length. After failure, delaminations were observed at the
following ply interfaces measured from the inner corner (3-4, 4-5, 5-6, 9-10 and 10-11).
D. J. Bull, J. M. Dulieu-Barton, O. T. Thomsen, R. Butler, A. T. Rhead, T. Fletcher, K. D. Potter and R. A. Smith
Figure 5: X-ray CT cross-section of central region containing the ply waviness shown before
loading and delaminations after failure.
3.2 TSA
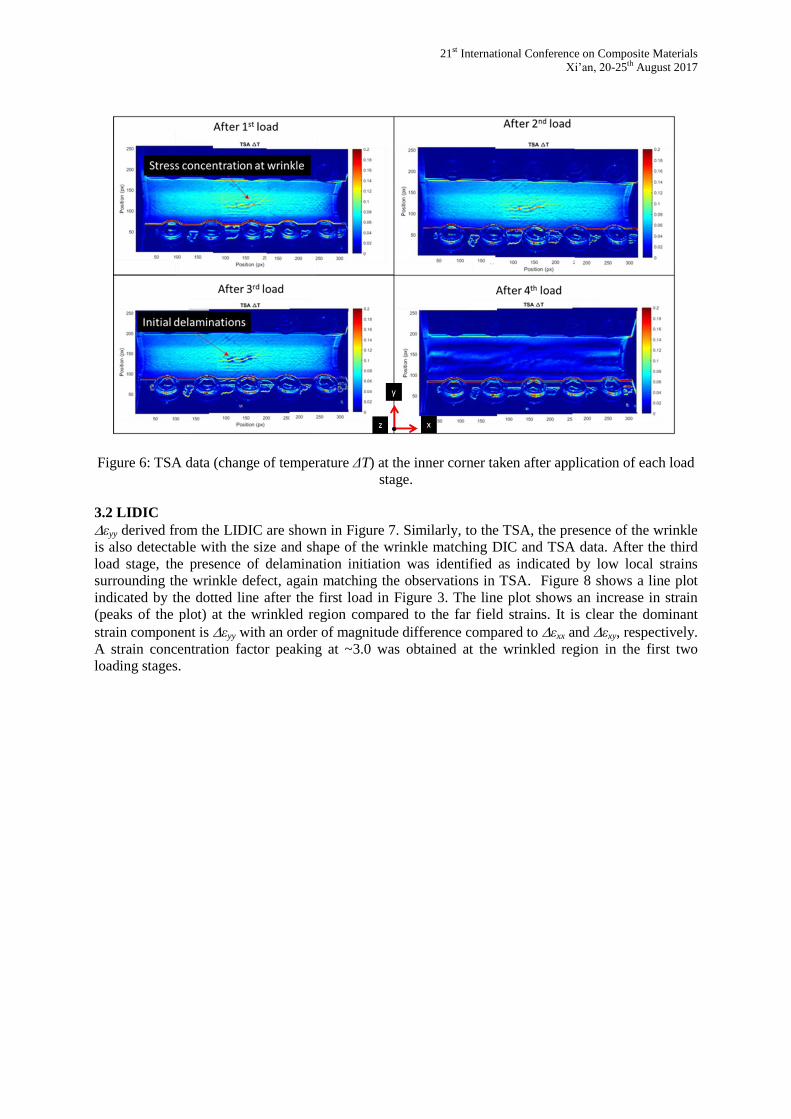
The T values obtained after each loading stage are shown in Figure 6. After application of the 1st and
2nd
load, it is clear there is a stress concentration at the wrinkle. Comparing the temperature reading
from the wrinkle against far field readings indicates a stress concentration factor of approximately 2.8.
No difference was observed between the 1st and 2
nd load stages. After application of the 3
rd load stage,
initial delaminations are observed surrounding the wrinkled region. These are indicated with a
localised region of low ΔT, <0.02 K as the presence of local delaminations results in a localised
reduction of load carrying capability in this region. After the 4th load, significant span-wise
delamination damage resulted in a significant loss of load carrying capacity in this region and hence a
low thermoelastic response covering the full field of view. The presence of stress concentrations on
the outer corner were not observable with TSA and hence the figures showing this region are not
included.
21st International Conference on Composite Materials
Xi’an, 20-25th August 2017
Figure 6: TSA data (change of temperature ΔT) at the inner corner taken after application of each load
stage.
3.2 LIDIC
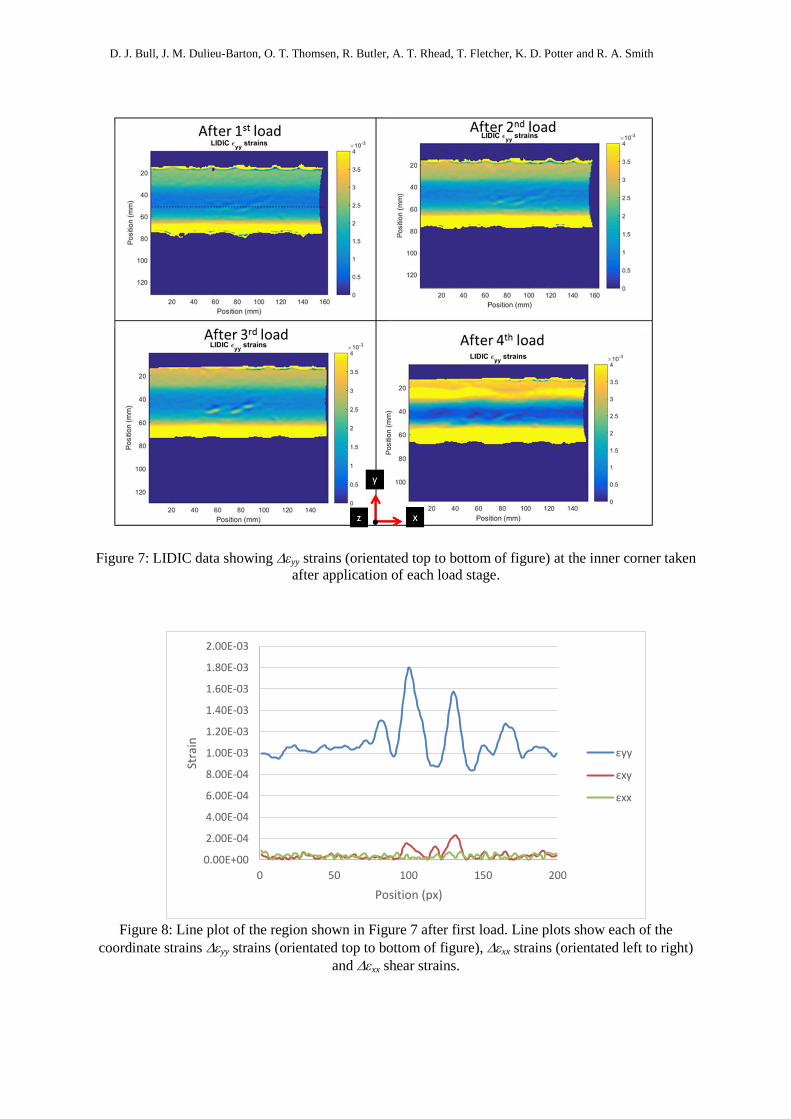
εyy derived from the LIDIC are shown in Figure 7. Similarly, to the TSA, the presence of the wrinkle
is also detectable with the size and shape of the wrinkle matching DIC and TSA data. After the third
load stage, the presence of delamination initiation was identified as indicated by low local strains
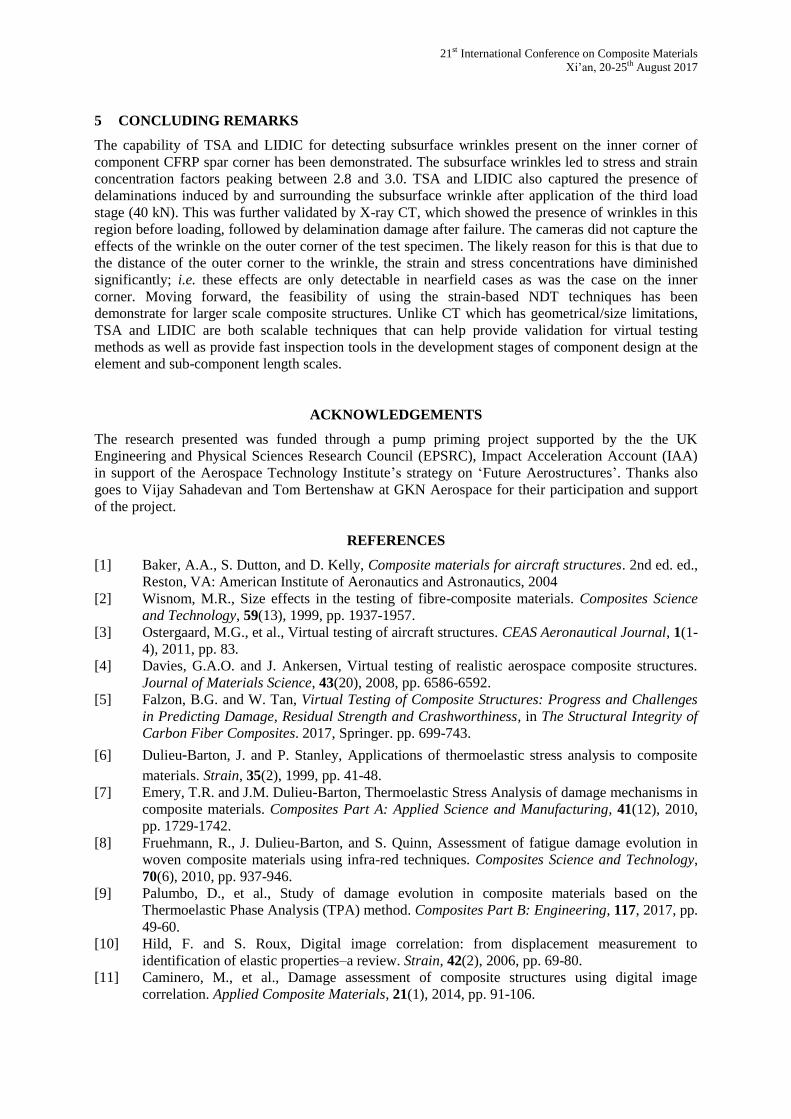
surrounding the wrinkle defect, again matching the observations in TSA. Figure 8 shows a line plot
indicated by the dotted line after the first load in Figure 3. The line plot shows an increase in strain
(peaks of the plot) at the wrinkled region compared to the far field strains. It is clear the dominant
strain component is εyy with an order of magnitude difference compared to εxx and εxy, respectively.
A strain concentration factor peaking at ~3.0 was obtained at the wrinkled region in the first two
loading stages.
D. J. Bull, J. M. Dulieu-Barton, O. T. Thomsen, R. Butler, A. T. Rhead, T. Fletcher, K. D. Potter and R. A. Smith
Figure 7: LIDIC data showing εyy strains (orientated top to bottom of figure) at the inner corner taken
after application of each load stage.
Figure 8: Line plot of the region shown in Figure 7 after first load. Line plots show each of the
coordinate strains εyy strains (orientated top to bottom of figure), εxx strains (orientated left to right)
and εxx shear strains.
0.00E+00
2.00E-04
4.00E-04
6.00E-04
8.00E-04
1.00E-03
1.20E-03
1.40E-03
1.60E-03
1.80E-03
2.00E-03
0 50 100 150 200
Stra
in
Position (px)
εyy
εxy
εxx
21st International Conference on Composite Materials
Xi’an, 20-25th August 2017
5 CONCLUDING REMARKS
The capability of TSA and LIDIC for detecting subsurface wrinkles present on the inner corner of
component CFRP spar corner has been demonstrated. The subsurface wrinkles led to stress and strain
concentration factors peaking between 2.8 and 3.0. TSA and LIDIC also captured the presence of
delaminations induced by and surrounding the subsurface wrinkle after application of the third load
stage (40 kN). This was further validated by X-ray CT, which showed the presence of wrinkles in this
region before loading, followed by delamination damage after failure. The cameras did not capture the
effects of the wrinkle on the outer corner of the test specimen. The likely reason for this is that due to
the distance of the outer corner to the wrinkle, the strain and stress concentrations have diminished
significantly; i.e. these effects are only detectable in nearfield cases as was the case on the inner
corner. Moving forward, the feasibility of using the strain-based NDT techniques has been
demonstrate for larger scale composite structures. Unlike CT which has geometrical/size limitations,
TSA and LIDIC are both scalable techniques that can help provide validation for virtual testing
methods as well as provide fast inspection tools in the development stages of component design at the
element and sub-component length scales.
ACKNOWLEDGEMENTS
The research presented was funded through a pump priming project supported by the the UK
Engineering and Physical Sciences Research Council (EPSRC), Impact Acceleration Account (IAA)
in support of the Aerospace Technology Institute’s strategy on ‘Future Aerostructures’. Thanks also
goes to Vijay Sahadevan and Tom Bertenshaw at GKN Aerospace for their participation and support
of the project.
REFERENCES
[1] Baker, A.A., S. Dutton, and D. Kelly, Composite materials for aircraft structures. 2nd ed. ed.,
Reston, VA: American Institute of Aeronautics and Astronautics, 2004
[2] Wisnom, M.R., Size effects in the testing of fibre-composite materials. Composites Science
and Technology, 59(13), 1999, pp. 1937-1957.
[3] Ostergaard, M.G., et al., Virtual testing of aircraft structures. CEAS Aeronautical Journal, 1(1-
4), 2011, pp. 83.
[4] Davies, G.A.O. and J. Ankersen, Virtual testing of realistic aerospace composite structures.
Journal of Materials Science, 43(20), 2008, pp. 6586-6592.
[5] Falzon, B.G. and W. Tan, Virtual Testing of Composite Structures: Progress and Challenges
in Predicting Damage, Residual Strength and Crashworthiness, in The Structural Integrity of
Carbon Fiber Composites. 2017, Springer. pp. 699-743.
[6] Dulieu‐Barton, J. and P. Stanley, Applications of thermoelastic stress analysis to composite
materials. Strain, 35(2), 1999, pp. 41-48.
[7] Emery, T.R. and J.M. Dulieu-Barton, Thermoelastic Stress Analysis of damage mechanisms in
composite materials. Composites Part A: Applied Science and Manufacturing, 41(12), 2010,
pp. 1729-1742.
[8] Fruehmann, R., J. Dulieu-Barton, and S. Quinn, Assessment of fatigue damage evolution in
woven composite materials using infra-red techniques. Composites Science and Technology,
70(6), 2010, pp. 937-946.
[9] Palumbo, D., et al., Study of damage evolution in composite materials based on the
Thermoelastic Phase Analysis (TPA) method. Composites Part B: Engineering, 117, 2017, pp.
49-60.
[10] Hild, F. and S. Roux, Digital image correlation: from displacement measurement to
identification of elastic properties–a review. Strain, 42(2), 2006, pp. 69-80.
[11] Caminero, M., et al., Damage assessment of composite structures using digital image
correlation. Applied Composite Materials, 21(1), 2014, pp. 91-106.
D. J. Bull, J. M. Dulieu-Barton, O. T. Thomsen, R. Butler, A. T. Rhead, T. Fletcher, K. D. Potter and R. A. Smith
[12] Elhajjar, R., R. Haj-Ali, and B.-S. Wei, An infrared thermoelastic stress analysis investigation
for detecting fiber waviness in composite structures. Polymer-Plastics Technology and
Engineering, 53(12), 2014, pp. 1251-1258.
[13] Smith, R.A., et al. Ultrasonic tracking of ply drops in composite laminates. in AIP Conference
Proceedings. 2016. AIP Publishing.
[14] Bull, D., et al., A comparison of multi-scale 3D X-ray tomographic inspection techniques for