71
N.E.A 2 .R.

N.E.A2.R.

Welcome to N.E.A2.R.
Vision:
ESC – Region 19 provides key guidance and support in all things related to Evaluation, Assessment, Accountability, and Research.

N.E.A2.R.• We will meet twice a semester and once in the summer.
• September
• November
• February
• April
• July

N.E.A2.R.• Agenda
• Domain 2 and 3 Updates
• ATAC feedback and input
• MOU’s and Data Sharing
• Assessment Updates
• Questions and Needs

HB 22 A-F Accountability
T H E S C H O O L P R O G R E S S D O M A I N

School Progress: Growth
6
School Progress
Closing
The Gaps
Student
Achievement

School Progress: Two Aspects to Progress
Part A: Student Growth Part B: Relative Performance
7

School Progress: Two Aspects to Progress
Part A: Student Growth Part B: Relative Performance
8

STAAR: Test Inclusion Methodology
99
• Includes all tests (STAAR with and
without accommodations and STAAR
Alternate 2) combined
• Combines reading and mathematics
• Uses STAAR Progress Measure
• Includes ELs (except in their first year
in US schools)
• Uses same STAAR Progress Measure
for ELs and non-Els
• Because the first STAAR tests are given
in third grade, we can’t assess growth
using the STAAR Progress Measure until
fourth grade.
• In high school, there are limitations to
measuring growth with STAAR. It can
only possibly be done for 9th graders
who take Algebra I, and then only for 9th and 10th graders taking English I or
English II. At this point, only Relative
Performance will be analyzed in high
school.
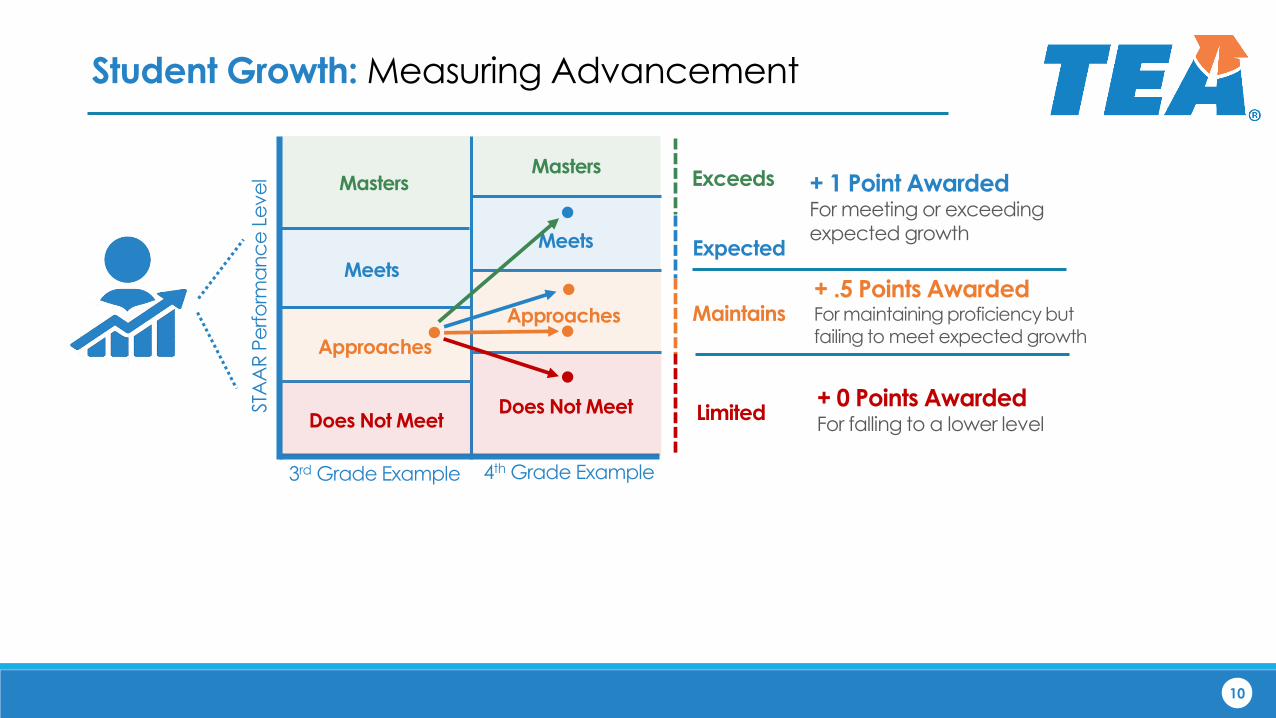
Student Growth: Measuring Advancement
STA
AR
Pe
rfo
rma
nc
e L
eve
l
3rd Grade Example 4th Grade Example
Does Not MeetDoes Not Meet
Approaches
Approaches
Meets
Meets
MastersMasters
Exceeds
Expected
+ 1 Point AwardedFor meeting or exceeding
expected growth
+ .5 Points AwardedFor maintaining proficiency but failing to meet expected growth
+ 0 Points AwardedFor falling to a lower level
Maintains
Limited
1010

Student Growth: Percentage of Students Gaining
Does Not Meet Grade Level
Approaches Grade Level
Meets Grade Level
Masters Grade Level
Does Not Meet Grade Level
Met/Exceeded
Growth Measure = 1 pt
Did not meet = 0 pts
Met/Exceeded
Growth Measure = 1 pt
Did not meet = .5 pts
1 pt 1 pt
Approaches Grade Level
Met/Exceeded
Growth Measure = 1 pt
Did not meet = 0 pts
Met/Exceeded
Growth Measure = 1 pt
Did not meet = .5 pts
1 pt 1 pt
Meets Grade Level
0 pts 0 pts 1 pt 1 pt
Masters Grade Level
0 pts 0 pts 0 pts 1 pt
11
Current Year
Pre
vio
us
Ye
ar

Student Growth: Percentage of Students Gaining
Does Not Meet Grade Level
Approaches Grade Level
Meets Grade Level
Masters Grade Level
Does Not Meet Grade Level
Met/Exceeded
Growth Measure = 1 pt
Did not meet = 0 pts
Met/Exceeded
Growth Measure = 1 pt
Did not meet = .5 pts
1 pt 1 pt
Approaches Grade Level
Met/Exceeded
Growth Measure = 1 pt
Did not meet = 0 pts
Met/Exceeded
Growth Measure = 1 pt
Did not meet = .5 pts
1 pt 1 pt
Meets Grade Level
0 pts 0 pts 1 pt 1 pt
Masters Grade Level
0 pts 0 pts 0 pts 1 pt
Current Year
Pre
vio
us
Ye
ar
1212
No Points
• Does Not Meet to Does Not Meet(without meeting
growth expectations)
• Approaches to Does Not Meet(without meeting growth expectations)
• Meets to Does Not Meet
• Meets to Approaches
• Masters to
Does Not Meet
• Masters to Approaches
• Masters to Meets

Student Growth: Percentage of Students Gaining
Does Not Meet Grade Level
ApproachesGrade Level
Meets Grade Level
Masters Grade Level
Does Not Meet Grade Level
Met/Exceeded
Growth Measure = 1 pt
Did not meet = 0 pts
Met/Exceeded
Growth Measure = 1 pt
Did not meet = .5 pts
1 pt 1 pt
ApproachesGrade Level
Met/Exceeded
Growth Measure = 1 pt
Did not meet = 0 pts
Met/Exceeded
Growth Measure = 1 pt
Did not meet = .5 pts
1 pt 1 pt
Meets Grade Level
0 pts 0 pts 1 pt 1 pt
Masters Grade Level
0 pts 0 pts 0 pts 1 pt
Pre
vio
us
Ye
ar
1313
Half Point
• Does Not Meet to Approaches(without meeting
growth expectations)
• Approaches to Approaches(without meeting growth expectations)
Current Year

Student Growth: Percentage of Students Gaining
Does Not Meet Grade Level
ApproachesGrade Level
Meets Grade Level
Masters Grade Level
Does Not Meet Grade Level
Met/Exceeded
Growth Measure = 1 pt
Did not meet = 0 pts
Met/Exceeded
Growth Measure = 1 pt
Did not meet = .5 pts
1 pt 1 pt
Approaches Grade Level
Met/Exceeded
Growth Measure = 1 pt
Did not meet = 0 pts
Met/Exceeded
Growth Measure = 1 pt
Did not meet = .5 pts
1 pt 1 pt
Meets Grade Level
0 pts 0 pts 1 pt 1 pt
Masters Grade Level
0 pts 0 pts 0 pts 1 pt
Pre
vio
us
Ye
ar
1414
One Point• Does Not Meet to
Approaches(meeting/exceeding growth expectations)
• Approaches to Approaches(meeting/exceeding growth expectations)
• Does Not Meet to Meets
• Does Not Meet to Masters
• Approaches to Meets
• Approaches to Masters
• Meets to Meets
• Meets to Masters
• Masters to Masters
• Does Not Meet to Does Not Meet(meeting/exceeding growth expectations)
• Approaches to Does Not Meet(meeting/exceeding growth expectations)
Current Year

15
Student Growth: Sample Calculation
One Hundred Students
• Each with reading and mathematics results
for last year and this year
• Denominator = 200 STAAR Progress Measures
?
200

16
Student Growth: Sample Calculation
No Points
• Does Not Meet to Does Not Meet
(without meeting growth expectations)
• Approaches to Does Not Meet
(without meeting growth expectations)
• Masters to Meets
Previous Year Current Year Count of Tests
20
15
14
49
+
+
17
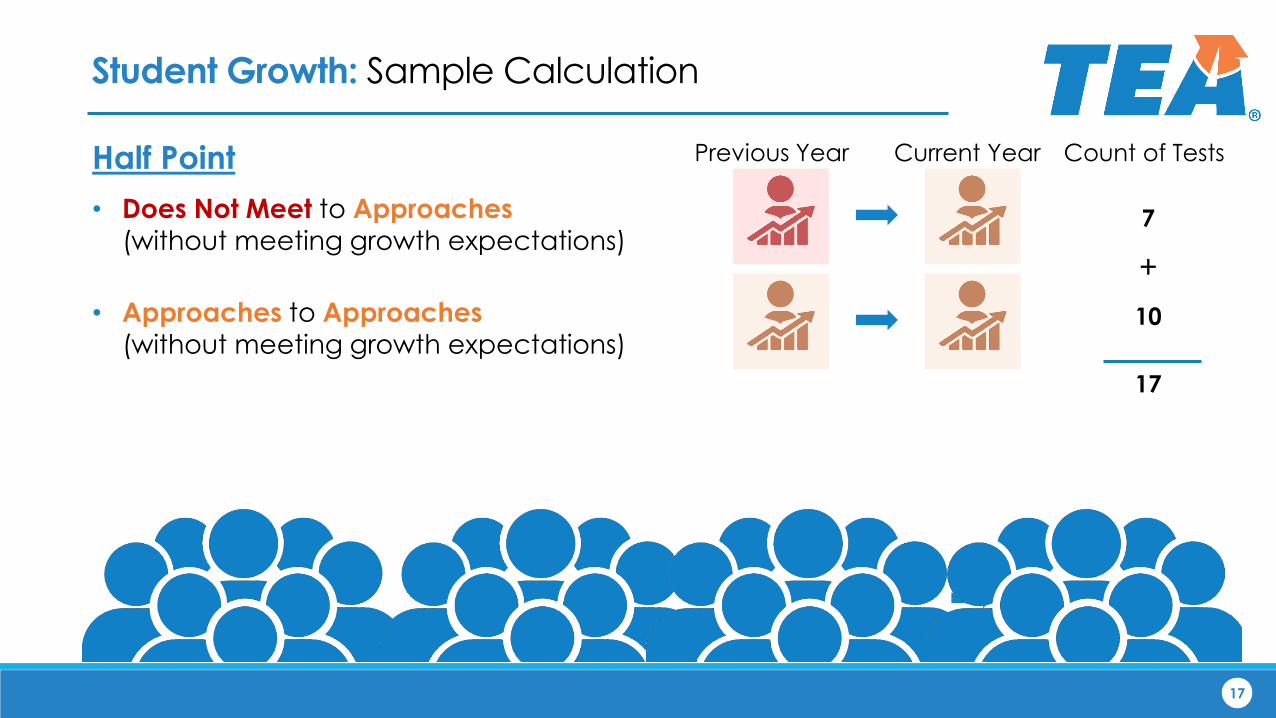
Student Growth: Sample Calculation
Half Point
• Does Not Meet to Approaches
(without meeting growth expectations)
• Approaches to Approaches
(without meeting growth expectations)
7
10
17
+
Previous Year Current Year Count of Tests

18
Student Growth: Sample Calculation
One Point
• Does Not Meet to Does Not Meet
(meeting/exceeding growth expectations)
• Approaches to Does Not Meet
(meeting/exceeding growth expectations)*
• Approaches to Approaches(meeting/exceeding growth expectations)
*Very rare but statistically possible
23
7
+
22
+
52
Previous Year Current Year Count of Tests

19
Student Growth: Sample Calculation
One Point
• Meets to Meets
• Meets to Masters
• Masters to Masters
33
32
82
+
17
+
Previous Year Current Year Count of Tests

20
Student Growth: Sample Calculation
(49× 0)+(17 × .5) +(52 × 1) +(82× 1)
200=
142.5
20071=
In this case, we loosely conclude that 71% of students have gained a
year academically. Technically, however, this is the percentage of tests
taken, with some adjustment for maintaining proficiency.
49 results that earned no points
17 results that
earned half a point134 results that earned one point

School Progress Domain: Feedback Opportunities
21
• New approach to growth
• Additional ways to measure
growth in high school
• Percentage of students who
need to grow to constitute
▪ Excellent performance
▪ Minimally acceptable performance
Part A Scores: Frequency by Campus Type
Elementary
(4,219)
Middle School
(1,653)
K–12
(334)
District
(1,203)
Quantile Part A Score (based on modeling data from 2017 accountability)
100% (Max) 100 96 100 100
99% 88 85 87 86
95% 84 81 83 79
90% 82 78 80 77
75% (Q3) 78 75 76 73
50% (Med) 73 70 70 70
25% (Q1) 68 65 64 66
10% 63 61 59 62
5% 59 59 56 59
1% 52 54 45 49
0% (Min) 34 41 0 24

Common Questions: School Progress Domain, Part A
22
Q: Is there no additional credit for meeting or
exceeding growth at the Meets and
Masters levels?
A: Students at Meets or Masters are given the
same one point as students who show
growth at Does Not Meet and
Approaches.
Q: Slide 14 shows an example of a student
who falls from Approaches Grade Level
one year to Does Not Meet the next year
and still meets STAAR Progress Measure
expectations. Can this really happen?
A: It’s very rare, but, statistically, it’s possible
when a student skips a grade. Our
modelling with 2017 data produced ten
such instances in the entire state.
Q: Why are high schools only scored on relative
performance? Is there no growth measure for
high school?
A: The relatively few STAAR Progress Measures for
high school make them an unreliable measure
of a high school’s progress with students. But
the STAAR Progress Measure scores will be
available on TAPR.

School Progress: Two Aspects to Progress
Part A: Student Growth Part B: Relative Performance
23

Stu
de
nt A
ch
ieve
me
nt
Do
ma
in S
co
re fo
r A
ll St
ud
en
ts
% Economically Disadvantaged Students
Higher Levels of Student
Achievement
Higher Rates ofEconomically
Disadvantaged Students
Relative Performance: Measuring School Progress
2424
Includes STAAR, CCMR, and graduation rates for districts and campuses that have that data

Stu
de
nt A
ch
ieve
me
nt
Do
ma
in S
co
re fo
r A
ll St
ud
en
ts
% Economically Disadvantaged Students
Higher Levels of Student
Achievement
Higher Rates ofEconomically
Disadvantaged Students
Relative Performance: Measuring School Progress
2525
Includes STAAR, CCMR, and graduation rates for districts and campuses that have that data

Stu
de
nt A
ch
ieve
me
nt
Do
ma
in S
co
re fo
r A
ll St
ud
en
ts
% Economically Disadvantaged Students
Higher Levels of Student
Achievement
Higher Rates ofEconomically
Disadvantaged Students
A campus with fewer economically disadvantaged students on average has higher levels of student achievement.
A campus with more economically
disadvantaged students tends to have
lower levels of student achievement.
Relative Performance: Measuring School Progress
2626
Includes STAAR, CCMR, and graduation rates for districts and campuses that have that data

Stu
de
nt A
ch
ieve
me
nt
Do
ma
in S
co
re fo
r A
ll St
ud
en
ts
% Economically Disadvantaged Students
Higher Levels of Student
Achievement
Higher Rates ofEconomically
Disadvantaged Students
A campus with fewer economically disadvantaged students on average has higher levels of student achievement.
A campus with more economically
disadvantaged students tends to have
lower levels of student achievement.
Relative Performance: Measuring School Progress
2727
Includes STAAR, CCMR, and graduation rates for districts and campuses that have that data

Stu
de
nt A
ch
ieve
me
nt
Do
ma
in S
co
re fo
r A
ll St
ud
en
ts
% Economically Disadvantaged Students
Higher Levels of Student
Achievement
Higher Rates ofEconomically
Disadvantaged
Relative Performance: Measuring School Progress
A
BCD
F
2828

Common Questions: School Progress Domain
29
Q: Does the Student Achievement domain
score (y-axis in relative performance)
include CCMR and graduation rates?
A: Yes, for schools that have that data.
Q: House Bill 22 specifically says that the method
used to evaluate performance should provide
for the mathematical possibility that all districts
and campuses receive an A, but this looks like
a forced distribution that guarantees a set
percentage of schools will get Ds and Fs.
A: Once the cut points are set using 2016–17
accountability data, the cut points will stay
fixed for five years. That way any district or
campus will be able to earn an A.

Relative Performance: Measuring School Progress
3030
• Scatter plot of each district and
campus (by campus type)
comparing
▪ Student Achievement domain
score
▪ Percentage of students who are
economically disadvantaged
• Trendline showing average
relationships
• Sliding cut points for campuses and
districts based on
▪ Student Achievement domain
score
▪ Percentage of students who are
economically disadvantaged
• Cut points for each grade based on
bands below and above the average
line
• Separate cut points
▪ Elementary Schools
▪ Middle Schools
▪ High Schools/K–12
▪ AEAs
• Cut points based on slope-intercept
form
▪ Based on 2016–17 performance
▪ Intended to stay fixed for five years
• Cut points will be known before ratings
release

Relative Performance: Sample Calculation
3131
• 𝑦 = 𝑚𝑥 + 𝑏
▪ 𝑦 is the predicted Student
Achievement domain score.
▪ 𝑥 is the percentage of students who
are economically disadvantaged.
▪ 𝑚 is the slope of the trendline.
▪ 𝑏 is the distance from the trendline (what decides the grade); it is based
on average variance from trendline.
• Sample Middle School
▪ 94.4% economically disadvantaged (𝑥)
▪ 𝑦 = –.15666(𝑥) + 45.789
▪ 𝑦 = –.15666(94.4) + 45.789
▪ 𝑦 = –14.79 + 45.789
▪ Predicted Student Achievement domain score (𝑦 ) = 31
▪ Actual Student Achievement domain
score: 25
▪ Score in relative performance: D

School Progress Domain: Feedback Opportunities
32
• New approach to growth
• Additional ways to measure
growth in high school
• Percentage of students who
need to grow to constitute
▪ Excellent performance
▪ Minimally acceptable performance
• Combining two parts
▪ Best of
▪ Weighted average
▪ Average
• For Part B, what is the right cut
points for
▪ Excellent performance
▪ Unacceptable performance

3333
Questions and Feedback
Feedback
https://www.surveymonkey.com/r/5RBLDFM
Resources
• http://tea.texas.gov/A-F
• http://tea.texas.gov/accountability
• (512) 463-9704

HB 22 A-F Accountability
T H E C L O S I N G TH E G A P S D O M A I N

Closing the Gaps: Ensuring Educational Equity
35
Closing
The Gaps
Student
Achievement
School
Progress

Closing the Gaps: Ensuring Educational Equity
x
Race/Ethnicity Special EducationEnglish
Learners (ELs)Continuously Enrolled
and Mobile
All Students
36
EconomicallyDisadvantaged
x
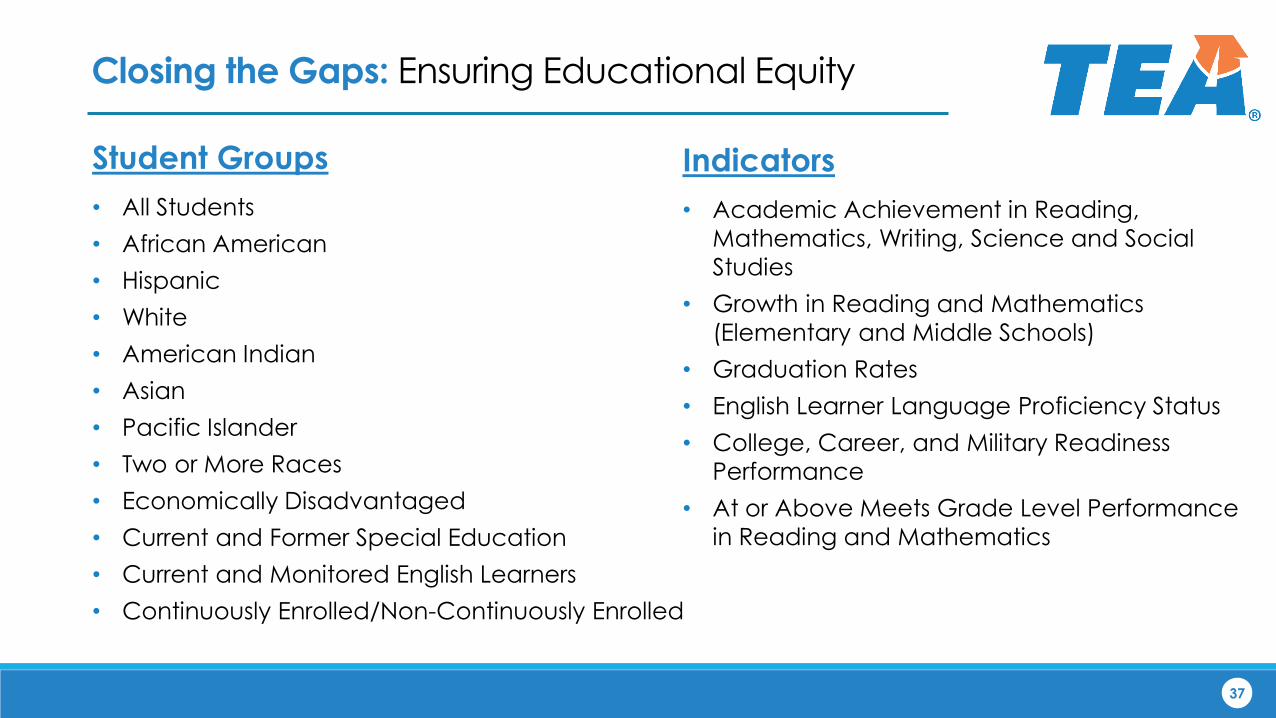
Closing the Gaps: Ensuring Educational Equity
37
Student Groups
• All Students
• African American
• Hispanic
• White
• American Indian
• Asian
• Pacific Islander
• Two or More Races
• Economically Disadvantaged
• Current and Former Special Education
• Current and Monitored English Learners
• Continuously Enrolled/Non-Continuously Enrolled
Indicators
• Academic Achievement in Reading,
Mathematics, Writing, Science and Social
Studies
• Growth in Reading and Mathematics
(Elementary and Middle Schools)
• Graduation Rates
• English Learner Language Proficiency Status
• College, Career, and Military Readiness
Performance
• At or Above Meets Grade Level Performance
in Reading and Mathematics

Closing the Gaps: Student Groups
38
Current and Former Special Education
• Defined by HB 22
• Formerly receiving special education services
▪ The student was reported in PEIMS the preceding year as enrolled at the campus and participating in a special
education program.
▪ The student is reported (PEIMS and STAAR answer
documents) as enrolled at the campus in the current year
and not participating in a special education program.
▪ Current modeling shows that this affects approximately 110
districts and six campuses when a the minimum-size criteria
of 25 is applied.
Feedback
Opportunity
For how many years in
the past should we
check for participation
in special education?

Closing the Gaps: Student Groups
39
Continuously Enrolled and Non-Continuously Enrolled
• Not defined by HB 22
• Districts
▪ Grades 4–12: Enrolled at a district in the fall snapshot in the current school year and each of the three previous years
▪ Grade 3: Enrolled at a district in the fall snapshot in the
current school year and each of the previous two years
• Campuses
▪ Grades 4–12: Enrolled at a campus in the fall snapshot in the
current school year and in the same district in each of the three
previous years
▪ Grade 3: Enrolled at a campus in the fall snapshot in the current
school year and in the same district each of the previous two
years
Feedback
Opportunity
Should we use an
alternate definition? If
so, what?

Closing the Gaps: Continuously Enrolled in District
40
2017
10th Grade
2016
9th Grade
2015
8th Grade
2014
7th Grade
Continuously Enrolled

Closing the Gaps: Continuously Enrolled in District
41
2017
10th Grade
2016
9th Grade
2015
8th Grade
2014
Non-Continuously Enrolled

Closing the Gaps: Continuously Enrolled in District
42
2017
3rd Grade
2016
2nd Grade
2015
1srt Grade
Continuously Enrolled

Closing the Gaps: Continuously Enrolled in District
43
2017
3rd Grade
2016 2015
1st Grade
Non-Continuously Enrolled

Closing the Gaps: Continuously Enrolled in District
44
2017
10th Grade
2016
9th Grade
2015
8th Grade
2014
7th Grade
Continuously Enrolled

Closing the Gaps: Continuously Enrolled in District
45
2017
10th Grade
2016
9th Grade
2015
8th Grade
2014
Non-Continuously Enrolled

Closing the Gaps: Continuously Enrolled in District
46
2017
3rd Grade
2016
2nd Grade
2015
1st Grade
Continuously Enrolled

Closing the Gaps: Continuously Enrolled in District
47
2017
3rd Grade
2015
1st Grade
Non-Continuously Enrolled

Closing the Gaps: Student Groups
48
Current and Monitored ELs
• Allowed by ESSA
• Current ELs
• ELs through their fourth year of monitoring.
Feedback
Opportunities
• Should we monitor
for four years? Only
two?
• Should we report
current and
monitored ELs
separately?

Closing the Gaps: Indicators
49
Academic Achievement
• STAAR performance (percentage at or above Approaches Grade Level)
• Targets by subject area
▪ English Language Arts/Reading
▪ Mathematics
▪ Writing
▪ Science
▪ Social Studies
• Targets stable for five years
• Safe Harbor/Required Improvement applied
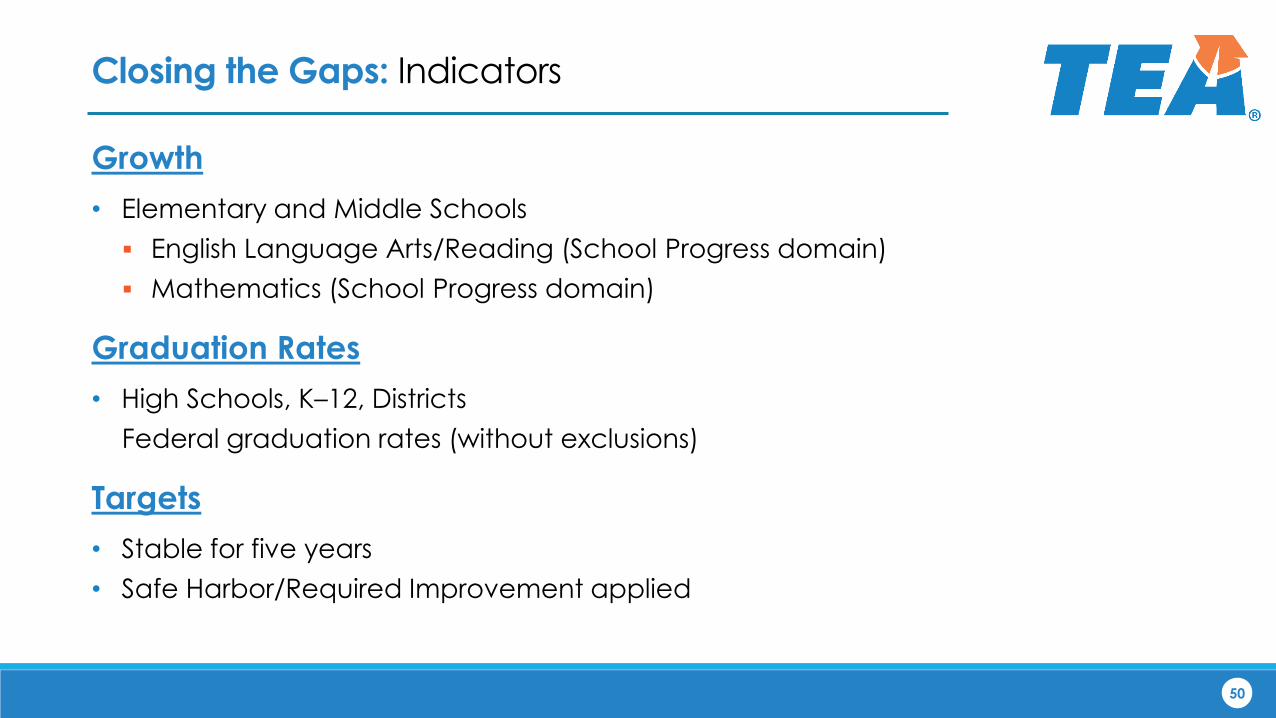
Closing the Gaps: Indicators
50
Growth
• Elementary and Middle Schools
▪ English Language Arts/Reading (School Progress domain)
▪ Mathematics (School Progress domain)
Graduation Rates
• High Schools, K–12, Districts
Federal graduation rates (without exclusions)
Targets
• Stable for five years
• Safe Harbor/Required Improvement applied

Closing the Gaps: Indicators
51
English Language Proficiency Status
• TELPAS Progress Rate
• Current ELs
Feedback Opportunity
Should we wait on TELPAS
given changes in test this
year? This would involve
different standards within
a 5 year window.

Closing the Gaps: Indicators
52
School Quality or Student Success
• High Schools, K–12, and Districts
College, Career, and Military Readiness (Student Achievement domain)
• Targets stable for five years
• Safe Harbor/Required Improvement applied
• Elementary and Middle Schools STAAR Grade 3–8 Performance
▪ Reading (percentage at or above Meets Grade Level)
▪ Mathematics (percentage at or above Meets Grade Level)
• Targets stable for five years
• Safe Harbor/Required Improvement applied

Closing the Gaps: Ensuring Educational Equity
Student Group Achievement Target % of Student Groups
that meet target
Overall
Grade
53
Feedback Opportunity
Percentage of student groups doesn’t
count degree of challenge in any
group. Should we attempt a more
complicated formula? And should we
weight a given cell type more than
others?

Closing the Gaps: Aligning Accountability Systems
54
Closing
The Gaps

Closing the Gaps: Sample Status Report
55

Closing the Gaps: Sample Status Report
56
All African
Students American Hispanic White
Ac
ad
em
ic A
ch
iev
em
en
t
STAAR Performance Status (Percentage at or above Approaches Grade Level)
Target 80.0% 80.0% 80.0% 80.0%
Reading Y Y Y Y
Mathematics Y Y Y Y
Writing Y Y Y Y
Science Y Y Y Y
Social Studies Y Y Y Y
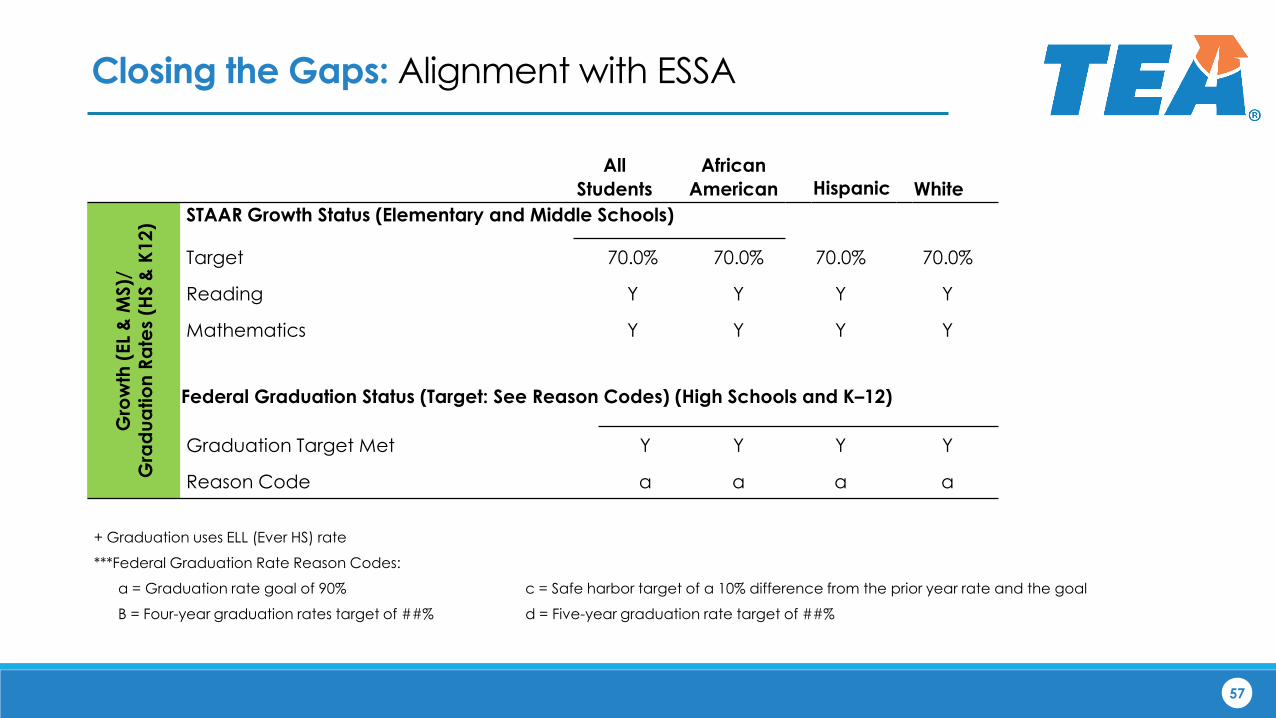
Closing the Gaps: Alignment with ESSA
57
All African
Students American Hispanic White
Gro
wth
(EL
& M
S)/
Gra
du
atio
n R
ate
s (H
S &
K1
2)
STAAR Growth Status (Elementary and Middle Schools)
Target 70.0% 70.0% 70.0% 70.0%
Reading Y Y Y Y
Mathematics Y Y Y Y
Federal Graduation Status (Target: See Reason Codes) (High Schools and K–12)
Graduation Target Met Y Y Y Y
Reason Code a a a a
+ Graduation uses ELL (Ever HS) rate
***Federal Graduation Rate Reason Codes:
a = Graduation rate goal of 90% c = Safe harbor target of a 10% difference from the prior year rate and the goal
B = Four-year graduation rates target of ##% d = Five-year graduation rate target of ##%

Closing the Gaps: Alignment with ESSA
58
ELL
(Current)
ELP
English Learner Language Progress
42.0%
TELPAS Progress Rate Target Y
TELPAS Progress Rate

Closing the Gaps: Progress of ELs
59
• EL Progress reflects an English Learner’s progress towards
achieving English language proficiency.
• Data source is TELPAS results.
• Accountability subset rule is applied.
• A student is considered having made the EL Progress if
▪ he/she advances by at least one score of the composite
rating from the prior year to the current year, or
▪ his/her result is “Advanced High.”
• If the prior year composite rating is not available, second or third
year prior are used.
• The minimum size is 25.
• Small number analysis is applied if there are fewer than 25 current EL students.

Closing the Gaps: Alignment with ESSA
60
All African
Students American Hispanic White
Sc
ho
ol Q
ua
lity
or
Stu
de
nt
Su
cc
ess College, Career, and Military Readiness Performance Status (High Schools and K–12)
Target 40.0% 40.0% 40.0% 40.0%
College, Career, and Military Readiness Y Y Y Y
STAAR Grade 3–8 Reading and Mathematics Performance (at or above Meets Grade Level Standard) (Elementary and Middle Schools)
Target 45.0% 45.0% 45.0% 45.0%
Reading Y Y Y Y
Mathematics Y Y Y Y
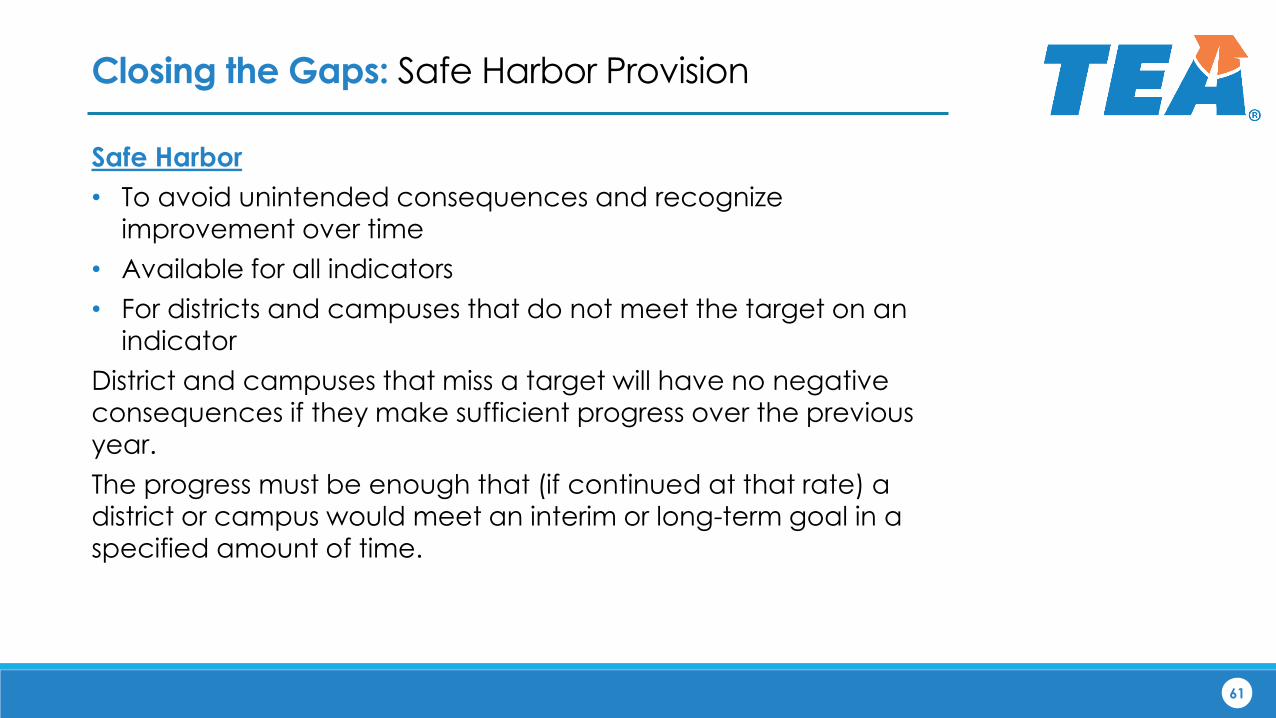
Closing the Gaps: Safe Harbor Provision
61
Safe Harbor
• To avoid unintended consequences and recognize
improvement over time
• Available for all indicators
• For districts and campuses that do not meet the target on an
indicator
District and campuses that miss a target will have no negative consequences if they make sufficient progress over the previous
year.
The progress must be enough that (if continued at that rate) a
district or campus would meet an interim or long-term goal in a
specified amount of time.

Example One Calculation
• Last year’s result missed the target by 35 points (80 – 45 = 35)
• Because the years to meet goal is 5, this
campus must improve its score for this
indicator by 7 points each year (35 5 = 7).
• This year’s score is 8 points better than last year’s (53 – 45 = 8)
• Safe harbor is invoked.
• There are no negative consequences of
missing that target for this indicator.
Closing the Gaps: Safe Harbor Calculation
62
Variables
• Last year’s result
• This year’s result
• Goal (interim or long term)
• Years to meet goal
Example One Scenario
Performance on mathematics STAAR by
students in special education
• Last year’s score (45)
• This year’s score (53)
• Goal (interim) (80)
• Years to meet goal (5)

Closing the Gaps: Safe Harbor Calculation
63
Example Two Scenario
Performance on mathematics STAAR by
students in special education
• Last year’s score (60)
• This year’s score (61)
• Goal (long term) (90)
• Years to meet goal (15)
Example Two Calculation
• Last year’s result missed the target by 30 points (90 – 60 = 30)
Example Two Calculation (cont.)
• Because the years to meet goal is 15, this
campus must improve its score for this
indicator by 2 points each year (30 15 = 2).
• This year’s score is 1 points better than last year’s (61 – 60 = 1)
• Safe harbor is not invoked.
• There are negative consequences of missing
that target for this indicator.
Feedback Opportunity
Should we apply the same standard
for expectation to all student groups,
given safe harbor rules?

Closing the Gaps: Data Modeling
64
Percentage of Elementary Schools Meeting Achievement Target
With Safe Harbor (Five-Year Target)Without Safe Harbor With Safe Harbor (Fifteen-Year Target)
Group Frequency Percent
00–20% 2009 46.29
21–40% 720 16.59
41–60% 549 12.65
61–80% 479 11.04
81–100% 583 13.43
Group Frequency Percent
00–20% 691 15.92
21–40% 970 22.35
41–60% 995 22.93
61–80% 878 20.23
81–100% 806 18.57
Group Frequency Percent
00–20% 887 20.44
21–40% 993 22.88
41–60% 909 20.94
61–80% 784 18.06
81–100% 767 17.67

Closing the Gaps: Data Modeling
65
Percentage of Middle Schools Meeting Achievement Target
Group Frequency Percent
00–20% 903 54.63
21–40% 248 15.00
41–60% 225 13.61
61–80% 154 9.32
81–100% 123 7.44
Group Frequency Percent
00–20% 130 7.86
21–40% 290 17.54
41–60% 505 30.55
61–80% 417 25.23
81–100% 311 18.81
Group Frequency Percent
00–20% 249 15.06
21–40% 387 23.41
41–60% 434 26.26
61–80% 334 20.21
81–100% 249 15.06
With Safe Harbor (Five-Year Target)Without Safe Harbor With Safe Harbor (Fifteen-Year Target)

Closing the Gaps: Data Modeling
66
Percentage of High Schools Meeting Achievement Target
Group Frequency Percent
00–20% 169 13.29
21–40% 288 22.64
41–60% 369 29.01
61–80% 242 19.03
81–100% 204 16.04
Group Frequency Percent
00–20% 24 1.89
21–40% 102 8.02
41–60% 315 24.76
61–80% 486 38.21
81–100% 345 27.12
Group Frequency Percent
00–20% 34 2.67
21–40% 137 10.77
41–60% 351 27.59
61–80% 444 34.91
81–100% 306 24.06
With Safe Harbor (Five-Year Target)Without Safe Harbor With Safe Harbor (Fifteen-Year Target)

Closing the Gaps: Alignment with ESSA
67
Identification of Schools: Comprehensive Support and Improvement
• Lowest-performing five percent of campuses based on overall A–F grade
• High schools with less than 67 percent graduation rate
• Certain targeted schools that do not improve in a specified time
• Beginning in summer 2018 based on 2017–18 data
• Updated at least every three years thereafter
Feedback
Opportunity
Should we identify
these schools every
year or every three
years?

Closing the Gaps: Sample Status Report
68

Closing the Gaps: Alignment with ESSA
69
Identification of Schools: Targeted Support and Improvement
• Three consecutive years of missing a target in the same student group on the same
indicator
• Summer 2019 based on 2017, 2018, and 2019 dataz
All African
Students American Hispanic White
Targ
ete
d C
am
pu
s D
ete
rmin
atio
n
Multi-Year Performance Status
Consecutive Years Missing Performance Target
Reading 0 0 0 0
Mathematics 0 0 0 0
Multi-Year Growth Status
Consecutive Years Missing Growth Target
Reading 0 0 0 0
Mathematics 0 0 0 0
Multi-Year Graduation Status
Consecutive Years Missing Graduation Target 0 0 0 0
Multi-Year English Learner Language Proficiency Status
Multi-Year Student Success Status
Consecutive Years Missing Performance Target
STAAR Grade 3- 8 Reading and Mathematics Performance (at or above Meets Grade Level Standard) (Elementary and Middle Schools)
Mathematics
Reading 0 0 0 0
College, Career, and Military Readiness 0 0 0 0
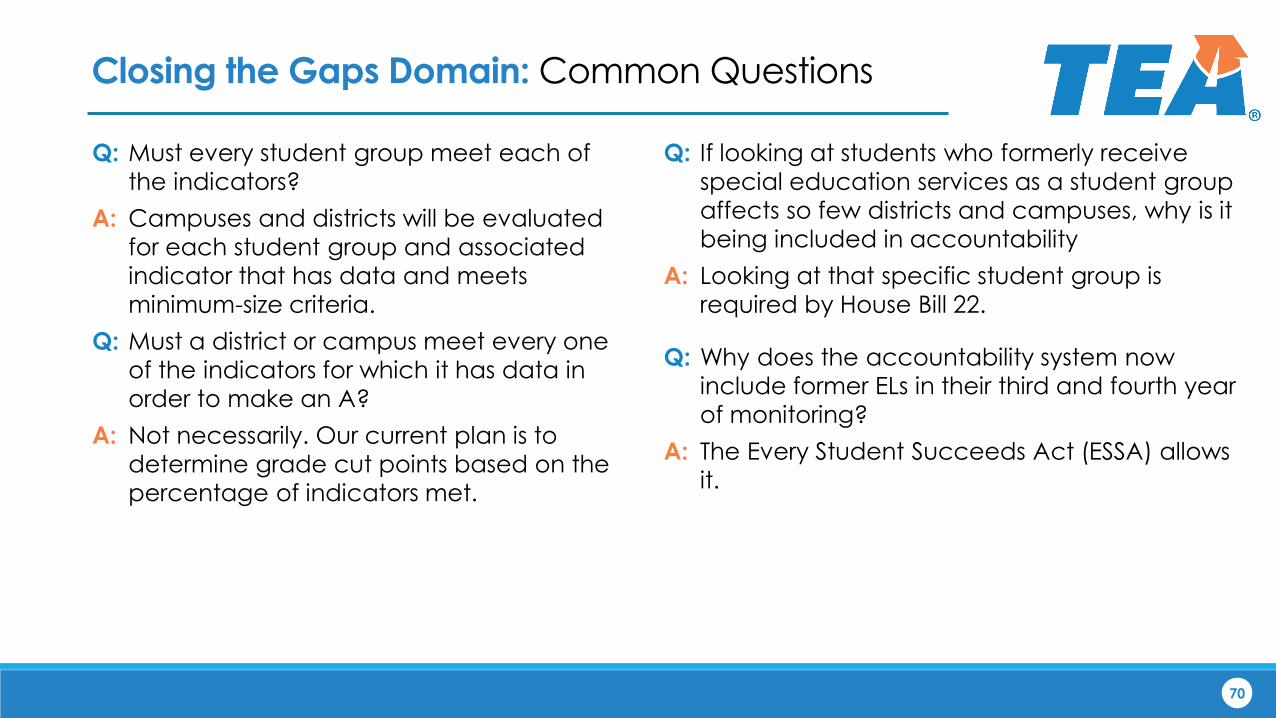
Closing the Gaps Domain: Common Questions
70
Q: Must every student group meet each of
the indicators?
A: Campuses and districts will be evaluated
for each student group and associated
indicator that has data and meets
minimum-size criteria.
Q: Must a district or campus meet every one
of the indicators for which it has data in
order to make an A?
A: Not necessarily. Our current plan is to
determine grade cut points based on the
percentage of indicators met.
Q: If looking at students who formerly receive
special education services as a student group
affects so few districts and campuses, why is it
being included in accountability
A: Looking at that specific student group is
required by House Bill 22.
Q: Why does the accountability system now
include former ELs in their third and fourth year
of monitoring?
A: The Every Student Succeeds Act (ESSA) allows
it.

7171
Questions and Feedback
Feedback
• https://www.surveymonkey.com/r/9RWRPZ5
Resources
• http://tea.texas.gov/A-F
• http://tea.texas.gov/accountability
• (512) 463-9704


