AbstractWe aimed to quantitatively assess a possible difference of the neointimal quality between biodegradable polymer- (BP-) and durable polymer drug-eluting stents (DP-DESs). We conducted a single-center all-comer prospective cohort study: the RESTORE registry (UMIN000033009). All patients who received successful OCT examination at planned 3-month follow-up after DES implantation were analyzed. Study population was divided into 2 groups, BP-DES versus DP-DES groups. We evaluated standard OCT variables, coverage percent, and the quantitative light property values including light intensity, attenuation, and backscatter. We performed OCT analyses of 121 lesions in 98 patients (BP-DES 55 lesions in 51 patients vs. DP-DES 66 lesions in DP-DES 53 patients). Lesion and procedural characteristics were overall well-balanced between both groups. At 3-month follow-up, neointimal thickness (BP-DES 49.3 [38.2, 57.7] µm versus DP-DES 54.7 [45.1, 70.7] µm, p = 0.059) and coverage percent (BP-DES 94.5 [89.8, 97.0]% vs. DP-DES 95.8 [91.1, 98.1]%, p = 0.083) did not significantly differ. Light intensity of superficial neointima in the BP-DES was lower than that in the DP-DES, whereas that of deep neointima did not differ between both groups. Both superficial and deep neointima of the BP-DES presented significantly lower light attenuation and backscatter than those of the DP-DES did. Almost complete coverage at 3 months in both contemporary BP- and DP-DES would support the ultra-short DAPT strategy in the upcoming decade. Neverthe-less, there was a significant difference in the neointimal characteristics on OCT light property 3 months after BP- versus DP-DES implantation.Trial Registration UMIN000033009.
The contemporary biodegradable polymer DES (BP-DES) has thinner struts and an abluminal very thin coat of biode-gradable polymer which is fully absorbed in 3–4 months in a synchronous way with the drug. Abluminal coating tech-nology of the contemporary BP-DESs, Synergy™ (Boston Scientific Corporation, Natick, MA, USA) and Ultimaster™ (Terumo Corp., Tokyo, Japan) is expected to enhance the early neointimal coverage. Animal study suggested that the technology may promote a more complete and quick heal-ing process with these stents in acute phase [1]. An imag-ing study of the Ultimaster™ BP-DES in human presented
The International Journal of Cardiovascular Imaging
1 3
almost complete coverage of struts at 3-month follow-up on optical coherence tomography (OCT) [2], which might represent the expected early vessel healing. However, precise imaging data of these theoretical benefits of the contempo-rary BP-DES including strut coverage and neointimal quality in comparison with the current durable polymer DES (DP-DES) is still scarce [3].
Several studies reported the usefulness of OCT light intensity, light attenuation and light backscatter to charac-terize the tissue components of coronary artery [4]. In a histological study, it was demonstrated that the increased light attenuation and light backscatter were associated with lipid-rich plaque and macrophages, while increased light intensity was related to tissue maturity [4–6].
We aimed to assess a possible difference of the neointimal coverage and its quality between BP- and DP-DESs by a quantitative light property analysis on OCT.
Materials and methods
Study design and population
Study design was a single-center prospective cohort study: the RESTORE registry (UMIN000033009). In the RESTORE registry, all patients treated with current DES are planned to perform follow-up imaging evaluation 3 months and 24 months (± 1 month) after the index pro-cedure with OCT and coronary angioscopy. The 3-month results of coronary angioscopy were reported elsewhere [7]. In the present acute-phase OCT analysis, all patients who received successful OCT examination at planned 3 months follow-up (± 1 month) after the DES implantation in the native coronary artery irrespective of clinical presentation (silent myocardial ischemia, stable or unstable angina, ST elevation myocardial infarction, or non-ST elevation myo-cardial infarction) without any earlier event of stent failure were analyzed. Synergy™ and Ultimaster™ were defined as BP-DESs, while Resolute™ zotarolimus-eluting stent (Medtronic CardioVascular, CA, USA), Xience™ cobalt chromium everolimus-eluting stent (Abbott Vascular, Santa Clara, CA, USA) were categorized as DP-DESs. Written informed consent was obtained from all enrolled patients. This study was approved by the Osaka Police Hospital Ethi-cal Committee.
Procedure
Percutaneous coronary intervention (PCI) strategy was left to the discretion of the individual operators. Dual antiplatelet therapy (DAPT, aspirin and P2Y12 inhibitor) was encour-aged to keep at least 6 months after the PCI. All patients and
treating physicians were asked to adhere to the Guideline of the Japanese Society of Cardiology in terms of tobacco usage, exercise, healthy food intake, maintenance of an ade-quate body weight, and medications for the achievement of target blood lipid concentrations, and blood pressure control.
OCT analysis
Angiographic and OCT imaging follow-up was conducted 3 months after the index procedure. OCT assessment of the stented coronary segment was performed using the OPTIS® console and the Dragonfly® catheter (both Abbott Vascular, Santa Clara, CA, USA). The off-line OCT measurements were performed with QCU-CMS software (version 4.69; Leiden University Medical Center, Leiden, the Netherlands) by independent investigators (TK, YS, SN, and SS). With adjustment for the pullback speed, the analysis of continu-ous cross-sections was performed at each 1 mm longitu-dinal interval within the treated segment. Lumen contour was defined as the continuous interface between a blood and non-blood structure. The endoluminal metallic stent contour was delineated by a curvilinear interpolation connecting the midpoints of the endoluminal leading edge of the reflec-tive border. The abluminal stent contour was automatically drawn by simulating the virtual contour of the struts. After identifying all struts in a cross-section, the abluminal stent contour was delineated by a curvilinear interpolation con-necting the middle points of the abluminal edge of virtual metallic struts. Thickness of the virtual strut was determined by the reported strut thickness of each stent type (Synergy 74 µm, Ultimaster 80 µm, Xience 81 µm, Resolute Onyx 81 µm, Resolute Integrity 91 µm).
In the current study, light property analysis was addition-ally performed to investigate the neointimal quality quantita-tively. The dedicated software (QCU-CMS software version 4.69) was employed for the quantitative light property analy-sis of the vessel wall. The software was used to calculate the attenuation and backscattering coefficients based on a depth-resolved model [8]. The following parameters were analyzed within the neointimal area of interest defined with the contours delineated by the investigators: light intensity (no unit), (2) light attenuation (mm− 1), and (3) backscatter (no unit). The light intensity indicates the amount of light signal detected at a certain location in the vessel wall based on reflection and backscatter. The light attenuation, esti-mated as the depth-resolved attenuation coefficient in this study, indicates how fast the light signal is decayed. It is the rate of exponential decreasing intensity related to the light propagation depth. Concretely, the total incident light power I0 is decreased to be I0/e at depth 1/µt. The backscatter, estimated as the depth-resolved backscattering coefficient in this study, is related to the efficiency of tissue scattering
The International Journal of Cardiovascular Imaging
1 3
the light backwards [8]. The neointimal area of interest was assessed separately as the following two parts: (1) superficial neointima (delineated by the luminal contour and the inter-polated contour connecting the endoluminal edges of struts [endoluminal stent contour]), (2) deep neointima (delineated by the endoluminal and abluminal stent contours, excluding strut area) (Fig. 1). Each parameter was computed at every cross-section as an average in the area of interest. The analy-sis of continuous cross-sections was performed at each 1 mm longitudinal interval within the stented segment. The mean value in each stent lesion was calculated as a lesion level data. The reproducibility of the neointimal analysis depends only on the contour delineation since the software is fully automatic. The reproducibility of the OCT standard analysis with the current software was published elsewhere [9].
Statistical analysis
Study population was divided into 2 groups, BP-DES (Syn-ergy™ and Ultimaster™) versus DP-DES (Xience™, Reso-lute Integrity™ and Resolute Onyx™) groups. Normality of data distribution was tested by the Kolmogorov-Smirnov test. Data are expressed as mean ± SD or median and inter-quartile range. Group means for continuous variables with normal and non-normal distributions were compared using Student’s t-tests and Mann–Whitney U tests, respectively. Categorical variables were compared using the Pearson’s chi-square test or Fischer’s exact test, as appropriate. Mixed linear model with an assumed Gaussian distribution was used for the comparisons of continuous light property
variables to take into an account the clustered nature of > 1 strut, > 1 cross section, > 1 lesion analyzed from the same patients which might result in unknown correlations among measurements within the clusters. All statistical analyses were performed with SPSS (version 24.0.0, IBM, New York).
Results
Study population
A total of 110 patients with 133 lesions (mean age 66.8 ± 9.9 years) were enrolled from May 2016 to April 2018 (BP-DES 59 patients 63 lesions vs. DP-DES 57 patients 70 lesions). Six patients had both BP-DES and DP-DES. Eight lesions in 8 patients and 4 lesions in 4 patients were excluded due to insufficient OCT image quality in the BP-DES and DP-DES groups, respectively. As a result, we performed OCT analyses of 121 lesions in 98 patients (BP-DES 55 lesions in 51 patients vs. DP-DES 66 lesions in DP-DES 53 patients) (Fig. 2). The median invasive imag-ing follow-up time was 102 days after the index procedure. Table 1 shows patient and lesion demographics, risk fac-tors, and medication. Serum profiles including low-density lipoprotein cholesterol, high-density lipoprotein cholesterol, and triglycerides were not different between both groups. Lesion and procedural characteristics were overall well-balanced(Table 2). Approximately half of the lesions were
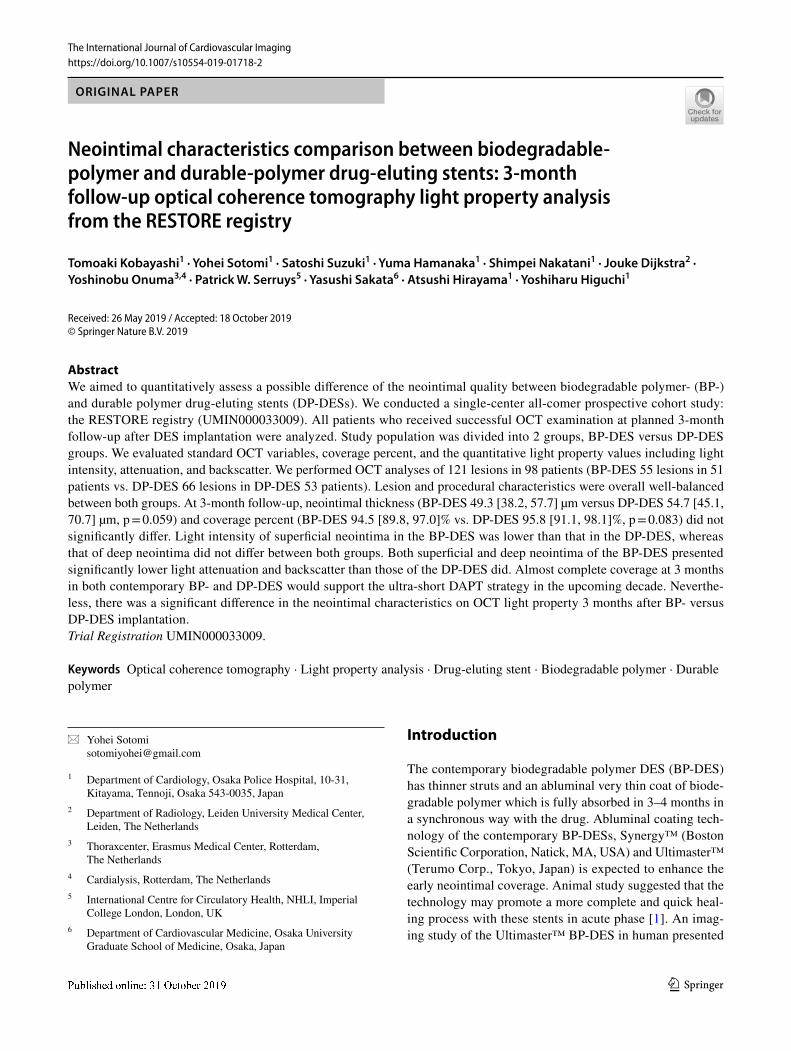
Fig. 1 Neointimal area compartments analyzed by optical coherence tomography. Image example of OCT at three-month follow-up for BP-DES and DP-EES (A). Lumen contour (blue), endoluminal (red) and abluminal (green) stent contours were delineated semi-automat-ically (B). The neointimal area of interest was assessed separately as
the following two parts: (1) superficial neointima (delineated by the luminal contour and the interpolated contour connecting the endo-luminal edges of struts [endoluminal stent contour]) (yellow area in c); (2) deep neointima (delineated by the endoluminal and abluminal stent contours, excluding strut area) (blue area in C)
The International Journal of Cardiovascular Imaging
1 3
left anterior descending artery. Only pre-dilatation balloon diameter was significantly larger in the DP-DES group than in the BP-DES group.
OCT findings at 3‑month follow‑up
Table 3 summarizes the OCT results. Lumen area was com-parable between both groups. Endoluminal stent area was also comparable. The abluminal stent area of DP-DES was
significantly larger than that of BP-DES. Neointimal thick-ness (BP-DES 49.3 [38.2, 57.7] µm vs. DP-DES 54.7 [45.1, 70.7] µm, p = 0.059) and coverage percent (coverage %; BP-DES 94.5 [89.8, 97.0] % vs. DP-DES 95.8 [91.1, 98.1] %, p = 0.083) did not significantly differ between both groups.
Neointimal characteristics on light property analysis
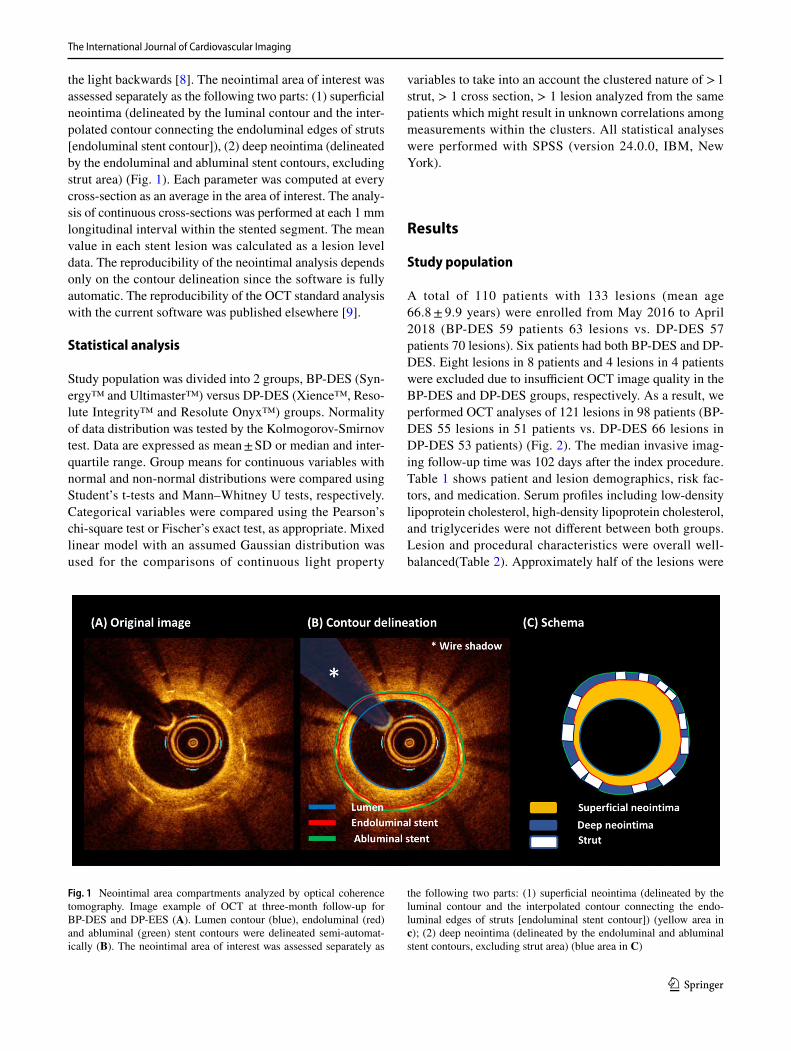
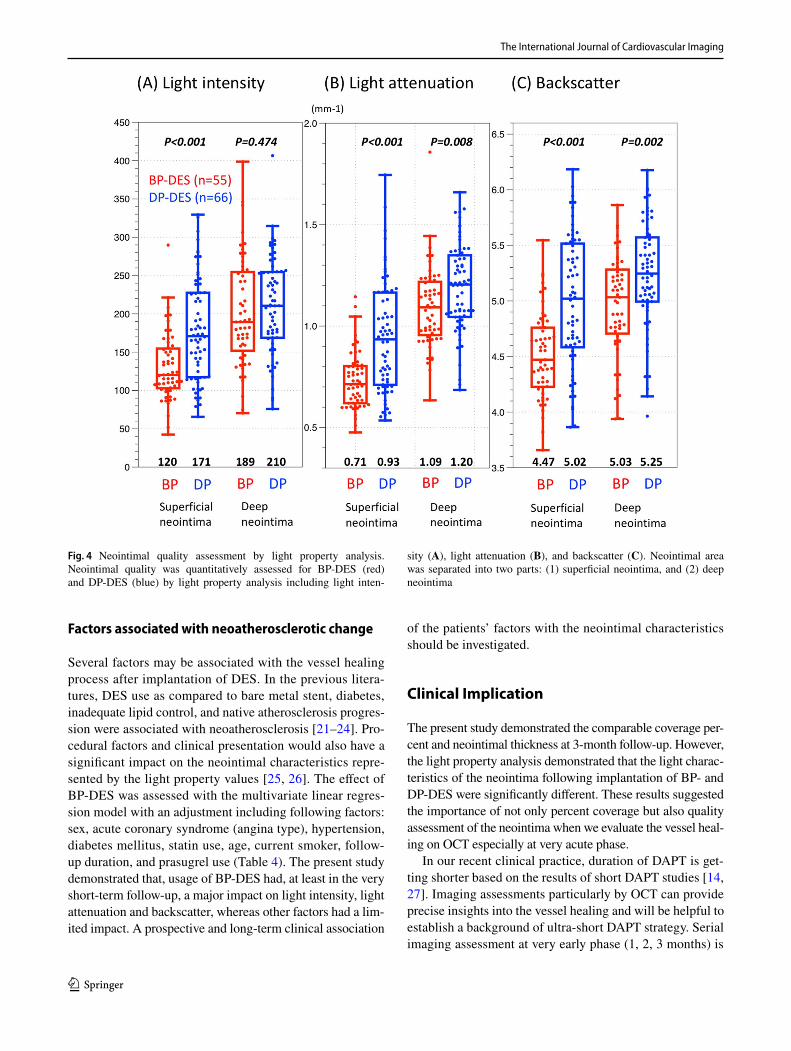
Table 3 and Fig. 3 summarizes the results of OCT analysis. Light intensity of superficial neointima in the BP-DES group was lower than that in the DP-DES group (120.2 [102.9, 154.8] vs. 170.9 [117.6, 227.4], p < 0.001), whereas deep neointima in the BP-DES showed comparable to that in the DP-DES. (189.3 [151.9, 254.7] vs. 210.5 [168.8, 254.6], p = 0.474). Light attenuation of both superficial and deep neointima in the BP-DES group was significantly lower as compare to the DP-DES group (superficial; 0.71 [0.62, 0.80] mm− 1 vs. 0.93 [0.71, 1.16] mm− 1, p < 0.001: deep; 1.09 [0.96, 1.22] vs. 1.20 [1.05, 1.34] mm− 1, p = 0.008). Backscatter of superficial and deep neointima in the BP-DES was also significantly lower than that in the DP-DES group (superficial; 4.47 [4.23, 4.76] vs. 5.02 [4.59, 5.51], p < 0.001: deep; 5.03 [4.71, 5.28] vs. 5.25 [5.00, 5.57] p = 0.002).
Influencing factors of the neointimal optical characteristics at 3‑month follow‑up
To investigate the factors associated with the light character-istics of the superficial neointima, multivariate analysis was
Fig. 2 Patient flowchart. A total of 110 patients with 133 lesions were enrolled from May 2016 to April 2018. Sufficient image quality of OCT was obtained in 121 lesions out of 133 lesions (90.9%). As a result, a total of 98 patients with 121 lesions were analyzed (biode-gradable polymer-DES 55 lesions in 51 patients vs. durable polymer-DES 66 lesions in 53 patients). *Six patients had both BP-DES and DP-DES. OCT optical coherence tomography, DES drug-eluting stent
Table 1 Patients’ characteristics
Data are expressed as mean ± standard deviation, median [interquartile range], and number (percentage)a Six patients had both BP-DES and DP-DES
BP-DES DP-DES p valueN = 51 patientsa N = 53 patientsa
The International Journal of Cardiovascular Imaging
1 3
conducted using linear regression analysis (Table 4). BP-DES usage was significantly and strongly associated with lower intensity, lower attenuation, and lower backscatter.
Discussion
Main findings of the present study can be summarized as follows: (1) At 3-month follow-up, neointimal thickness and coverage % were not significantly different between the BP- and the DP-DES groups; (2) light intensity of superficial neointima in the BP-DES was lower than that in the DP-DES, whereas that of deep neointima did not differ between both groups; (3) both superficial and deep neointima of the BP-DES presented significantly lower light attenuation and backscatter as compared to that of the DP-DES.
Strut coverage in the BP‑ and the DP‑DES
The present study demonstrated the comparable cover-age percent between BP-DES and DP-DES, which was in line with the previous reports. At 3-month follow-up, the Ultimaster™ BP-DES and the Synergy™ BP-DES achieved similar strut coverage percent of 95.2% and
94.5%, respectively [2, 10, 11], while the Xience™ DP-DES and the Resolute™ DP-DES also showed the cover-age percent of 94.5% and 93.8%, respectively [12, 13]. Both previous and the present studies showed comparable neointimal coverage percent after implantation of the con-temporary BP- and DP-DESs assessed by OCT. Neverthe-less, recent clinical trials (STOP DAPT 2, SENIOR, etc.) have proved the feasibility of ultra-short dual antiplatelet therapy (1-month DAPT), implying that the OCT coverage might not be a suitable surrogate for the vessel healing after stent implantation [14]. Not only neointimal cover-age percent but also objective quality assessment of the neointima would be necessary in order to assess the vessel healing status more appropriately (Fig. 4).
Interpretation of the light properties
The present study demonstrated the different neointimal characteristic between BP- and DP-DES with the dedi-cated software. We validated the software with histology and demonstrated consistently similar relationship on tissue characteristics with previous reports [4–6]. Light intensity is positively correlated with maturation of the neointimal tissue [15]. In animal and human autopsy specimens, mature
Fig. 3 Imaging examples. Image examples of light property analysis are presented. The dedicated software full-automatically computed, based on the original image (A–D), three components of light property analysis (1) light intensity, (2) light attenuation and (3) backscatter
The International Journal of Cardiovascular Imaging
1 3
neointimal tissue with a predominance of smooth muscle cells show higher greyscale signal intensity values and lower attenuation/backscatter values. Immature tissue with fiber rich extracellular matrix, infrequent smooth muscle cells, interspersed inflammatory cells, and fibrin show lower sig-nal intensity values and lower attenuation/backscatter. Lipid-rich plaque and necrotic core exhibit strong light attenuation and backscatter with low intensity values [4–6]. Macrophage infiltration and erythrocytes indicate high intensity with high attenuation due to their lipid components [15].
It might be challenging to interpret the current results based on the previous validation data since no validation data was available in the very early phase like ours. There-fore, we can have only speculative interpretation of the cur-rent findings as follows. In the present study, the DP-DES had higher light intensity and higher light attenuation/back-scatter values than the BP-DES. High light intensity with high attenuation/backscatter might be interpreted as mac-rophage infiltration or thrombus with erythrocytes whose membranes contain a large amount of lipid (40%) [16, 17]. Angioscopic observation of the current cohort provided the numerically higher rate of thrombus in the DP-DES than in the BP-DES (25% vs. 21%, p = 0.357), which might sup-port this interpretation [7]. Biological responses in stented
arteries can be divided into three different time phases [18, 19]: (1) thrombosis/acute inflammation, (2) granulation tis-sue, and (3) tissue remodeling phase. Theoretical change of the light property values is illustrated in Fig. 5. BP-DES showed lower light intensity and lower light attenuation/backscatter values than DP-DES did. Different light intensity and attenuation/backscatter between the DP-DES and the BP-DES might indicate that, at 3 months after stent implan-tation, the BP-DES might be in a slightly advanced phase as compared with the DP-DES. Note that the changes of light property values presented in Fig. 5 is theoretical and speculative. Further validation data in acute phase would be warranted to interpret our results appropriately. The only thing we can say from the current results is that there may be some significant differences in the neointimal character-istics 3 months after DES implantation. Whether the current “statistically” significant difference has a clinical impact is also yet to be investigated. The recent meta-analysis com-paring “long-term” clinical data of the BP- and the DP-DES demonstrated similar clinical outcomes between both groups [20]. However, clinical relevance of the current results with very-short term rather than long-term outcomes would be of more interest in the current ultra-short DAPT era. The present study did not have enough power to assess this point.
Table 4 Determinants of light intensity, attenuation, and backscatter on OCT at 3-month follow-up
The linear regression analysis on light property of the superficial neointima was performed
The International Journal of Cardiovascular Imaging
1 3
Factors associated with neoatherosclerotic change
Several factors may be associated with the vessel healing process after implantation of DES. In the previous litera-tures, DES use as compared to bare metal stent, diabetes, inadequate lipid control, and native atherosclerosis progres-sion were associated with neoatherosclerosis [21–24]. Pro-cedural factors and clinical presentation would also have a significant impact on the neointimal characteristics repre-sented by the light property values [25, 26]. The effect of BP-DES was assessed with the multivariate linear regres-sion model with an adjustment including following factors: sex, acute coronary syndrome (angina type), hypertension, diabetes mellitus, statin use, age, current smoker, follow-up duration, and prasugrel use (Table 4). The present study demonstrated that, usage of BP-DES had, at least in the very short-term follow-up, a major impact on light intensity, light attenuation and backscatter, whereas other factors had a lim-ited impact. A prospective and long-term clinical association
of the patients’ factors with the neointimal characteristics should be investigated.
Clinical Implication
The present study demonstrated the comparable coverage per-cent and neointimal thickness at 3-month follow-up. However, the light property analysis demonstrated that the light charac-teristics of the neointima following implantation of BP- and DP-DES were significantly different. These results suggested the importance of not only percent coverage but also quality assessment of the neointima when we evaluate the vessel heal-ing on OCT especially at very acute phase.
In our recent clinical practice, duration of DAPT is get-ting shorter based on the results of short DAPT studies [14, 27]. Imaging assessments particularly by OCT can provide precise insights into the vessel healing and will be helpful to establish a background of ultra-short DAPT strategy. Serial imaging assessment at very early phase (1, 2, 3 months) is
Fig. 4 Neointimal quality assessment by light property analysis. Neointimal quality was quantitatively assessed for BP-DES (red) and DP-DES (blue) by light property analysis including light inten-
sity (A), light attenuation (B), and backscatter (C). Neointimal area was separated into two parts: (1) superficial neointima, and (2) deep neointima
The International Journal of Cardiovascular Imaging
1 3
required to elucidate the vessel healing process of the con-temporary DES. Quantitative light property analysis would be useful and advantageous over visual assessment to evalu-ate the quality of tissue coverage.
Study strength and limitation
The methodology we employed in the present analysis was highly objective and reproducible, making the results repro-ducible and reliable. However, some limitations should to be acknowledged. First, study design was a single center observational study and the sample size was relatively small, albeit the well-balanced patient demographics. Second, only one time point assessment (3 months) could not provide in-depth insights into the difference in progression of neointi-mal coverage between BP- and DP-DES. Third, difference amongst the analyzed stents [Synergy™, Ultimaster™,
Xience™, Resolute Integrity™, and Resolute Onyx™] is not only the polymer degradation type but also strut design, strut shape, strut material, strut thickness, polymer coating type (abluminal coating, circumferential coating), poly-mer degradation speed, drug type, drug releasing speed, drug concentration, etc. These confounders were not fully adjusted in the present analysis. Along the same lines, both BP-DES and DP-DES still keep polymer at 3 months follow-up, although the bioresorption process presumably influence on the neointimal characteristics. Lastly, the direct impact of these findings on clinical outcome remains to be elucidated. We plan to assess the light property of the neointima again at the chronic phase (2 years) in the RESTORE registry and evaluate clinical impacts of this imaging surrogates on 2-year outcomes. Due to the inherent limitations of the cur-rent study design, the results would be hypothesis-generating and should be interpreted with caution. Further prospective
Fig. 5 Theoretical change of the light property values in acute phase. Vascular healing process following vessel injury by metal-lic stent implantation was previously reported based on the autopsy data [18, 19]. The vessel healing process can be divided into 3 dif-ferent phases: (1) thrombosis/acute inflammation, (2) granulation tis-sue, and (3) tissue remodeling phase. Considering the predominant cellular components in each phase, we can speculate the theoretical changes of the light property values as follows: Phase 1: Thrombo-sis/acute inflammation (1–30 days) Endothelium injury by stent implantation leads to the response of the activation of platelets and their deposition at the site of the lesion, with recruitment of circu-lating leucocytes. The platelet/fibrin/erythrocyte deposition occurs in the first 24–48 hours. Acute inflammatory cells can be identified within the platelet/fibrin aggregates around the stent struts. Erythro-cyte contains a large amount of lipid in its membrane (40%) [16]. In this phase, thrombus with erythrocytes and inflammatory cells would indicate high intensity with high attenuation. Phase 2: Granulation tissue (14–90 days) The endothelial cells proliferate and migrate over the injured areas while smooth muscle cells and macrophages replace the fibrin clot with granulation tissue. The newly formed vascularized
tissue includes macrophages which are responsible for phagocytosis of cell debris as well as secretion of growth factors, chemokines and cytokines. Light intensity and attenuation/backscatter would theoreti-cally decrease in this phase. Phase 3: Tissue remodeling phase (3–9 months) The hallmark of this phase is the modification of smooth muscle cells activated by growth factors/cytokines produced by the injured endothelium and media, platelets, and infiltrated inflamma-tory cells as well as by the compressive forces generated in the ves-sel wall by the stent placement along with low shear stress induced by stent struts. Neointimal smooth muscle cells proliferate during 3–9 months with production of varying amount of extracellular matrix. The first phase of matrix formation is the formation of provisional matrix which is formed by the plasma proteins such as fibrin, fibrin-ogen, and fibronectin. In early phase, fiber rich extracellular matrix, infrequent smooth muscle cells, and interspersed inflammatory cells would show lower signal intensity values and lower attenuation/back-scatter. In late phase, mature neointimal tissue with a predominance of smooth muscle cells would show higher greyscale signal intensity values and lower attenuation/backscatter values
The International Journal of Cardiovascular Imaging
1 3
randomized trials would be warranted to obtain a robust conclusion.
Conclusion
Almost complete coverage at 3 months in both contemporary BP- and DP-DES would support the ultra-short DAPT strat-egy in the upcoming decade. Nevertheless, there was a sig-nificant difference in the neointimal characteristics on OCT light property 3 months after BP- vs. DP-DES implantation. Further prospective randomized trials should be conducted to re-evaluate the current hypothesis-generating results and to investigate the clinical significance of the present imag-ing results.
Compliance with ethical standards
Conflict of interest Y. Sotomi, S. Nakatani, and Y. Higuchi received speaker honoraria from Abbott Vascular Japan, Boston Scientific Ja-pan, TERUMO, Cardinal Health, and Medtronic. Y. Onuma and P. Serruys are members of the Advisory Board for Abbott Vascular.A. Hirayama reports grants and personal fees from Boston Scientific Japan, Abbott Vascular Japan, Japan Lifeline, and Medtronic. Y. Sakata reports grants and personal fees from Daiichi-Sankyo, Bayer, Boehringer Ingelheim, and Bristol-Myers Squibb. The authors have no other relevant affiliations or financial involvement with any organi-zation or entity with a financial interest in or financial conflict with the subject matter or materials discussed in the manuscript apart from those disclosed.
References
1. Tellez A, Seifert PS, Donskoy E, Sushkova N, Pennington DE, Milewski K, Krueger CG, Kaluza GL, Eppihimer MJ, Huibregtse BA, Dawkins KD, Granada JF (2014) Experimental evaluation of efficacy and healing response of everolimus-eluting stents in the familial hypercholesterolemic swine model: a comparative study of bioabsorbable versus durable polymer stent platforms. Coron Artery Dis 25(3):198–207. https ://doi.org/10.1097/mca.00000 00000 00009 9
2. Chevalier B, Smits PC, Carrie D, Mehilli J, Van Boven AJ, Regar E, Sawaya FJ, Chamie D, Kraaijeveld AO, Hovasse T, Vlachojan-nis GJ (2017) Serial assessment of strut coverage of biodegrad-able polymer drug-eluting stent at 1, 2, and 3 months after stent implantation by optical frequency domain imaging: the DISCOV-ERY 1TO3 study (evaluation with ofdi of strut coverage of terumo new drug eluting stent with biodegradable polymer at 1, 2, and 3 months). Circ Cardiovasc Interv. https ://doi.org/10.1161/circi nterv entio ns.116.00480 1
4. Sotomi Y, Onuma Y, Liu S, Asano T, Eggermont J, Katagiri Y, Cavalcante R, de Winter RJ, Wykrzykowska JJ, Brugaletta S, Raber L, Sabate M, Windecker S, Dijkstra J, Serruys PW (2018) Quality difference of neointima following the implantation of everolimus-eluting bioresorbable scaffolds and metallic stents in patients with ST-elevation myocardial infarction: quantitative assessments by light intensity, light attenuation, and backscatter on optical coherence tomography in the TROFI II trial. EuroInt-ervention 14 (6):678–685. https ://doi.org/10.4244/eij-d-17-00884
5. Imanaka T, Fujii K, Hao H, Shibuya M, Saita T, Kawakami R, Fukunaga M, Kawai K, Tamaru H, Miki K, Horimatsu T, Sum-iyoshi A, Nishimura M, Hirota S, Masuyama T, Ishihara M (2016) Ex vivo assessment of neointimal characteristics after drug-elut-ing stent implantation: Optical coherence tomography and histo-pathology validation study. Int J Cardiol 221:1043–1047. https ://doi.org/10.1016/j.ijcar d.2016.07.110
6. Xu C, Schmitt JM, Carlier SG, Virmani R (2008) Characteriza-tion of atherosclerosis plaques by measuring both backscattering and attenuation coefficients in optical coherence tomography. J Biomed Optics 13(3):034003. https ://doi.org/10.1117/1.29274 64
7. Suzuki S, Sotomi Y, Kobayashi T, Hamanaka Y, Nakatani S, Shio-jima I, Sakata Y, Hirayama A, Higuchi Y (2019) Early vessel healing after implantation of biodegradable-polymer and durable-polymer drug-eluting stent: 3-month angioscopic evaluation of the RESTORE registry. Int J Cardiovasc Imaging. doi:https ://doi.org/10.1007/s1055 4-019-01580 -2
8. Liu S, Sotomi Y, Eggermont J, Nakazawa G, Torii S, Ijichi T, Onuma Y, Serruys PW, Lelieveldt BPF, Dijkstra J (2017) Tissue characterization with depth-resolved attenuation coefficient and backscatter term in intravascular optical coherence tomography images. J Biomed Optics 22(9):1–16. https ://doi.org/10.1117/1.Jbo.22.9.09600 4
9. Nakatani S, Sotomi Y, Ishibashi Y, Grundeken MJ, Tateishi H, Tenekecioglu E, Zeng Y, Suwannasom P, Regar E, Radu MD, Raber L, Bezerra H, Costa MA, Fitzgerald P, Prati F, Costa RA, Dijkstra J, Kimura T, Kozuma K, Tanabe K, Akasaka T, Di Mario C, Serruys PW, Onuma Y (2016) Comparative analysis method of permanent metallic stents (XIENCE) and bioresorbable poly-L-lactic (PLLA) scaffolds (Absorb) on optical coherence tomog-raphy at baseline and follow-up. EuroIntervention 12 (12):1498–1509. https ://doi.org/10.4244/eijy1 5m10_03
10. Barbato E, Salinger-Martinovic S, Sagic D, Beleslin B, Vrolix M, Neskovic AN, Jagic N, Verheye S, Mehmedbegovic Z, Wijns W (2015) A first-in-man clinical evaluation of Ultimaster, a new drug-eluting coronary stent system: CENTURY study. EuroInt-ervention 11 (5):541–548. https ://doi.org/10.4244/eijy1 4m08_06
11. de la Torre Hernandez JM, Tejedor P, Camarero TG, Duran JM, Lee DH, Monedero J, Laso FS, Calderon MA, Veiga G, Zueco J (2016) Early healing assessment with optical coherence tomog-raphy of everolimus-eluting stents with bioabsorbable polymer (synergy) at 3 and 6 months after implantation. Catheter Cardio-vasc Interv 88(3):E67–E73. https ://doi.org/10.1002/ccd.26299
12. Kim S, Kim JS, Shin DH, Kim BK, Ko YG, Choi D, Cho YK, Nam CW, Hur SH, Jang Y, Hong MK (2013) Comparison of early strut coverage between zotarolimus- and everolimus-eluting stents using optical coherence tomography. Am J Cardiol 111(1):1–5. https ://doi.org/10.1016/j.amjca rd.2012.08.037
13. Konishi A, Iwasaki M, Shinke T, Otake H, Takaya T, Osue T, Nishio R, Kinutani H, Kuroda M, Takahashi H, Terashita D, Shite J, Hirata KI (2018) Favorable early vessel healing after everoli-mus-eluting stent implantation: 3-, 6-, and 12-month follow-up of optical coherence tomography. J Cardiol 72(3):193–199. https ://doi.org/10.1016/j.jjcc.2018.04.005
14. Varenne O, Cook S, Sideris G, Kedev S, Cuisset T, Carrie D, Hovasse T, Garot P, El Mahmoud R, Spaulding C, Helft G, Diaz Fernandez JF, Brugaletta S, Pinar-Bermudez E, Mauri Ferre
The International Journal of Cardiovascular Imaging
1 3
J, Commeau P, Teiger E, Bogaerts K, Sabate M, Morice MC, Sinnaeve PR (2018) Drug-eluting stents in elderly patients with coronary artery disease (SENIOR): a randomised single-blind trial. Lancet 391(10115):41–50. https ://doi.org/10.1016/s0140 -6736(17)32713 -7
15. Malle C, Tada T, Steigerwald K, Ughi GJ, Schuster T, Nakano M, Massberg S, Jehle J, Guagliumi G, Kastrati A, Virmani R, Byrne RA, Joner M (2013) Tissue characterization after drug-eluting stent implantation using optical coherence tomography. Arterio-sclerosis, thrombosis, and vascular biology 33 (6):1376–1383. doi:https ://doi.org/10.1161/atvba ha.113.30122 7
16. Nayak BS, Beharry VY, Armoogam S, Nancoo M, Ramadhin K, Ramesar K, Ramnarine C, Singh A, Singh A, Nwachi KU, Tee-lucksing S, Mathura R, Roberts L (2008) Determination of RBC membrane and serum lipid composition in Trinidadian type II diabetics with and without nephropathy. Vasc Health Risk Manag 4(4):893–899
17. Kolodgie FD, Gold HK, Burke AP, Fowler DR, Kruth HS, Weber DK, Farb A, Guerrero LJ, Hayase M, Kutys R, Narula J, Finn AV, Virmani R (2003) Intraplaque hemorrhage and progression of coronary atheroma. N Engl J Med 349(24):2316–2325. https ://doi.org/10.1056/NEJMo a0356 55
18. Chaabane C, Otsuka F, Virmani R, Bochaton-Piallat ML (2013) Biological responses in stented arteries. Cardiovasc Res 99(2):353–363. https ://doi.org/10.1093/cvr/cvt11 5
19. Nakano M, Virmani R (2015) Histopathology of vascular response to drug-eluting stents: an insight from human autopsy into daily practice. Cardiovasc Interv Ther 30(1):1–11. https ://doi.org/10.1007/s1292 8-014-0281-5
20. Kobayashi T, Sotomi Y, Suzuki S, Suwannasom P, Nakatani S, Morino Y, Ako J, Kozuma K, Hirayama A, Sakata Y, Higuchi Y (2019) Five-year clinical efficacy and safety of contemporary thin-strut biodegradable polymer versus durable polymer drug-eluting stents: a systematic review and meta-analysis of 9 rand-omized controlled trials. Cardiovasc Interv Therap. https ://doi.org/10.1007/s1292 8-019-00613 -w
21. Jang JY, Kim JS, Shin DH, Kim BK, Ko YG, Choi D, Jang Y, Hong MK (2015) Favorable effect of optimal lipid-lowering ther-apy on neointimal tissue characteristics after drug-eluting stent implantation: qualitative optical coherence tomographic analysis. Atherosclerosis 242(2):553–559. https ://doi.org/10.1016/j.ather oscle rosis .2015.08.014
22. Hong YJ, Jeong MH, Choi YH, Park SY, Rhew SH, Kim SS, Jeong YW, Jeong HC, Cho JY, Jang SY, Lee KH, Park KH, Sim
DS, Yoon NS, Yoon HJ, Kim KH, Park HW, Kim JH, Ahn Y, Cho JG, Park JC (2014) Relation between renal function and neoin-timal tissue characteristics after drug-eluting stent implantation: virtual histology-intravascular ultrasound analysis. J Cardiol 64(2):98–104. https ://doi.org/10.1016/j.jjcc.2013.11.019
23. Taniwaki M, Windecker S, Zaugg S, Stefanini GG, Baumgartner S, Zanchin T, Wenaweser P, Meier B, Juni P, Raber L (2015) The association between in-stent neoatherosclerosis and native coronary artery disease progression: a long-term angiographic and optical coherence tomography cohort study. Eur Heart J 36(32):2167–2176. https ://doi.org/10.1093/eurhe artj/ehv22 7
24. Vergallo R, Yonetsu T, Uemura S, Park SJ, Lee S, Kato K, Jia H, Abtahian F, Tian J, Hu S, Lee H, McNulty I, Prasad A, Yu B, Zhang S, Porto I, Biasucci LM, Crea F, Jang IK (2013) Cor-relation between degree of neointimal hyperplasia and incidence and characteristics of neoatherosclerosis as assessed by optical coherence tomography. Am J Cardiol 112(9):1315–1321. https ://doi.org/10.1016/j.amjca rd.2013.05.076
25. Sotomi Y, Onuma Y, Dijkstra J, Eggermont J, Liu S, Tenekecio-glu E, Zeng Y, Asano T, de Winter RJ, Popma JJ, Kozuma K, Tanabe K, Serruys PW, Kimura T (2016) Impact of implanta-tion technique and plaque morphology on strut embedment and scaffold expansion of polylactide bioresorbable scaffold- insights from ABSORB Japan Trial. Circ J 80(11):2317–2326. https ://doi.org/10.1253/circj .CJ-16-0818
26. Sotomi Y, Tateishi H, Suwannasom P, Dijkstra J, Eggermont J, Liu S, Tenekecioglu E, Zheng Y, Abdelghani M, Cavalcante R, de Winter RJ, Wykrzykowska JJ, Onuma Y, Serruys PW, Kimura T (2016) Quantitative assessment of the stent/scaffold strut embedment analysis by optical coherence tomography. Int J Cardiovasc Imaging 32(6):871–883. https ://doi.org/10.1007/s1055 4-016-0856-6
27. Naidu SS, Krucoff MW, Rutledge DR, Mao VW, Zhao W, Zheng Q, Wilburn O, Sudhir K, Simonton C, Hermiller JB (2012) Contemporary incidence and predictors of stent thrombosis and other major adverse cardiac events in the year after XIENCE V implantation: results from the 8,061-patient XIENCE V United States study. JACC Cardiovasc Interv 5(6):626–635. https ://doi.org/10.1016/j.jcin.2012.02.014
Publisher’s Note Springer Nature remains neutral with regard to jurisdictional claims in published maps and institutional affiliations.