43
Report No. 19850 NEPAL Country Assistance Evaluation November 1, 1999 Operations Evaluation Department
Report No. 19850
NEPAL
Country Assistance Evaluation
November 1, 1999
Operations Evaluation Department
Abbreviations and Acronyms
ADB Asian Development BankBOP Balance of PaymentsCAE Country Assistance EvaluationCAS Country Assistance StrategyCECI Canadian Center for International Studies and CorporationCIAA Commission of Investigation of Abuse of AuthorityDEI Development Effectiveness IndexESAF Enhanced Structural Adjustment FacilityESW Economic and Sector WorkFIAS Foreign Investment Advisory ServiceGDF Global Development FinanceGDP Gross Domestic ProductGNP Gross National ProductHMG His Majesty’s Government of NepalID Institutional DevelopmentIDA International Development AssociationIFC International Finance CorporationIMF International Monetary FundIRIS Center for Institutional Reform and the Informal SectorLIL Learning and Innovation LoanMW MegawattNCP Nepali Congress PartyNEA National Electrical AuthorityNGO Non-Governmental OrganizationNTC Nepal Telecommunications CorporationNWSC Nepal Water Supply CorporationOED Operations Evaluation DepartmentPAR Performance Audit ReportPBD Planning and Budgeting DepartmentPFP Policy Framework PaperPHN Population, Health, and NutritionSAARC South Asian Association for Regional CooperationSAL Structural Adjustment LoanSAR South Asia RegionSDR Special Drawing RightsT&V Training and VisitTA Technical AssistanceUNCED United Nations Conference on Environment and DevelopmentUNDP United Nations Development ProgramUSAID United States Agency for International DevelopmentWDI World Development Indicators
Director-General, Operations Evaluation : Mr. Robert PicciottoDirector, Operations Evaluation Dept. : Ms. Elizabeth McAllisterManager, OEDCR : Mr. Ruben LamdanyTask Manager : Mr. Asita De Silva
The World BankWashington, D.C. 20433
U.S.A.Office of the Director-General
Operations Evaluation
November 1, 1999
MEMORANDUM TO THE EXECUTIVE DIRECTORS AND THE PRESIDENT
NEPAL - COUNTRY ASSISTANCE EVALUATION
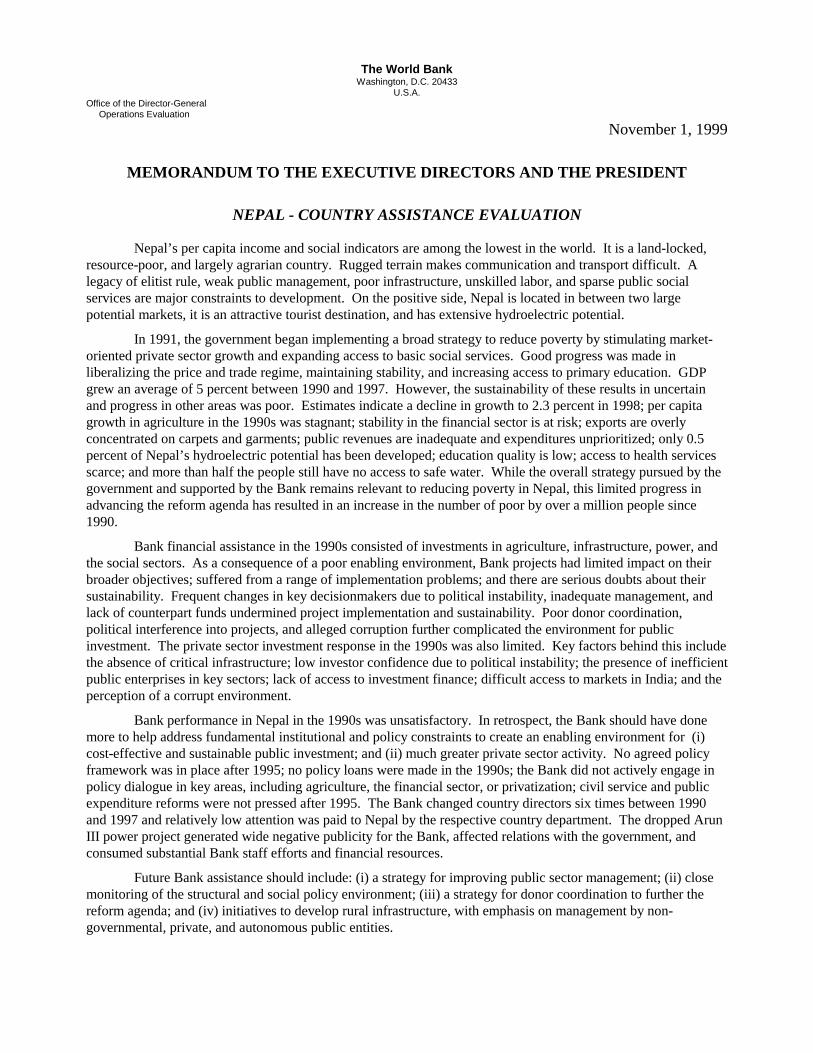
Nepal’s per capita income and social indicators are among the lowest in the world. It is a land-locked,resource-poor, and largely agrarian country. Rugged terrain makes communication and transport difficult. Alegacy of elitist rule, weak public management, poor infrastructure, unskilled labor, and sparse public socialservices are major constraints to development. On the positive side, Nepal is located in between two largepotential markets, it is an attractive tourist destination, and has extensive hydroelectric potential.
In 1991, the government began implementing a broad strategy to reduce poverty by stimulating market-oriented private sector growth and expanding access to basic social services. Good progress was made inliberalizing the price and trade regime, maintaining stability, and increasing access to primary education. GDPgrew an average of 5 percent between 1990 and 1997. However, the sustainability of these results in uncertainand progress in other areas was poor. Estimates indicate a decline in growth to 2.3 percent in 1998; per capitagrowth in agriculture in the 1990s was stagnant; stability in the financial sector is at risk; exports are overlyconcentrated on carpets and garments; public revenues are inadequate and expenditures unprioritized; only 0.5percent of Nepal’s hydroelectric potential has been developed; education quality is low; access to health servicesscarce; and more than half the people still have no access to safe water. While the overall strategy pursued by thegovernment and supported by the Bank remains relevant to reducing poverty in Nepal, this limited progress inadvancing the reform agenda has resulted in an increase in the number of poor by over a million people since1990.
Bank financial assistance in the 1990s consisted of investments in agriculture, infrastructure, power, andthe social sectors. As a consequence of a poor enabling environment, Bank projects had limited impact on theirbroader objectives; suffered from a range of implementation problems; and there are serious doubts about theirsustainability. Frequent changes in key decisionmakers due to political instability, inadequate management, andlack of counterpart funds undermined project implementation and sustainability. Poor donor coordination,political interference into projects, and alleged corruption further complicated the environment for publicinvestment. The private sector investment response in the 1990s was also limited. Key factors behind this includethe absence of critical infrastructure; low investor confidence due to political instability; the presence of inefficientpublic enterprises in key sectors; lack of access to investment finance; difficult access to markets in India; and theperception of a corrupt environment.
Bank performance in Nepal in the 1990s was unsatisfactory. In retrospect, the Bank should have donemore to help address fundamental institutional and policy constraints to create an enabling environment for (i)cost-effective and sustainable public investment; and (ii) much greater private sector activity. No agreed policyframework was in place after 1995; no policy loans were made in the 1990s; the Bank did not actively engage inpolicy dialogue in key areas, including agriculture, the financial sector, or privatization; civil service and publicexpenditure reforms were not pressed after 1995. The Bank changed country directors six times between 1990and 1997 and relatively low attention was paid to Nepal by the respective country department. The dropped ArunIII power project generated wide negative publicity for the Bank, affected relations with the government, andconsumed substantial Bank staff efforts and financial resources.
Future Bank assistance should include: (i) a strategy for improving public sector management; (ii) closemonitoring of the structural and social policy environment; (iii) a strategy for donor coordination to further thereform agenda; and (iv) initiatives to develop rural infrastructure, with emphasis on management by non-governmental, private, and autonomous public entities.

29
Contents
1. Nepal’s Development Strategy in the 1990s ...................................................................... 1
2. Bank Objectives and Assistance ........................................................................................ 2
3. The Bank’s Contribution to Development ........................................................................ 3
4. Outcome: Unsatisfactory ..................................................................................................... 5
5. Institutional Development Impact: Modest....................................................................... 5
6. Sustainability: Uncertain .................................................................................................... 6
7. Bank Performance: Unsatisfactory .................................................................................... 7
8. Borrower Performance: Unsatisfactory ............................................................................ 9
9. Implications for Bank Assistance ...................................................................................... 9
10. Current CAS ...................................................................................................................... 10
Annex A: Annex Tables.............................................................................................................. 11
Table 1. Nepal: Key Economic Indicators, 1990-1996 ........................................................... 13
Table 2. Key Economic Indicators: Nepal and Comparator Countries, 1992-96.................... 14
Table 3. Nepal: Debt Indicators .............................................................................................. 16
Table 4. Nepal: Structure of Exports........................................................................................ 16
Table 5. Nepal: Poverty Trends................................................................................................ 17
Table 6. Composition of External Aid Disbursed to Nepal in 1996 ........................................ 17
Table 7. Sectoral Distribution of Aid to Nepal, 1993-1996..................................................... 18
Table 8. World Bank Activities in Nepal by Sector, FY90-FY98 ........................................... 19
Table 9. OED Project Performance Ratings for Nepal ............................................................ 21
Table 10. Factors Influencing Project Outcomes (among projects evaluated since 1994) ....... 22
Table 11. Active Projects in Nepal (as of July 1998) ............................................................... 23
Table 12. Nepal: Comparative Lending Indicators among Completed Projects....................... 24
Table 13. Performance of Active Projects in Nepal................................................................. 24
Table 14. Bank Assistance Cost Indicators.............................................................................. 24
This report was written by Asita De Silva (Evaluation Officer). Comments on drafts of the report werereceived from Luis Ramirez, René Vandendries, Osvaldo Feinstein, Patrick Grasso, Helen Abadzi, RidleyNelson, Susan Stout, Wendy Jarvie, John Eriksson, Nigel Roberts, Giovanna Prennushi, and NabilMoukarbel (Bank Group staff). The report also incorporates comments from Hans Rothenbühler (CountryDirector for Nepal), Peter Nicholas (Country Anchor for Nepal), and the Ministry of Finance of theGovernment of Nepal. Barbara Yale and Norma Namisato provided administrative assistance.
30
ii
Contents (cont.)
Table 15. Level of ESW: Nepal and Regional Countries ....................................................... 25
Table 16. List of Formal ESW on Nepal, FY90-FY98 ............................................................ 26
Table 17. Bank Management for Nepal: 1990 - 1997............................................................. 27
Table 18. Development Effectiveness Index - Nepal and Other SAR Countries..................... 28
Annex B: References................................................................................................................... 29
Attachment: Report from CODE.............................................................................................. 32

1
1. Nepal’s Development Strategy In The 1990s
1.1 Background. Nepal is one of the ten poorest countries in the world, with a per capita income ofUS$210. It has a largely agrarian economy, with over 40 percent of GDP attributable to agriculture(compared to an average of 29 percent in South Asia) and over 80 percent of the people relying onagriculture for their livelihoods. Nepal is landlocked, has limited mineral resources, and has a very ruggedterrain that makes transport and communication difficult. Ninety percent of its people live in 4,000 villagesscattered across the country. Close proximity to India has limited Nepal’s ability to pursue independenttrade and industrial policies in the past. Weak public management, a low skills base, political instability,and the recent emergence of an armed insurgency hamper development progress. On the positive side,Nepal’s closest neighbors—India and China—are two of the largest potential markets in the world; Nepalhas abundant water resources, extensive hydroelectric potential, and is an attractive tourist destination.
1.2 Limited early progress. After the end of Nepal’s self-imposed isolation in the early 1950s, initialdevelopment plans focused on public sector manufacturing, import substitution, and infrastructuredevelopment, mainly in the Katmandu valley. These efforts yielded economic growth that only justexceeded population growth through the 1970s. Expansionary fiscal policies in the early 1980s to accelerategrowth failed to stimulate a supply response and resulted in a macroeconomic crisis by 1985. In 1986,Nepal launched a stabilization and adjustment program (supported by the Bank/IMF) aimed at restoringprudent fiscal and monetary policies and setting the economy on a sustainable growth path. By the late1980s, stability was restored and liberalization of the trade and industrial regime had begun.
1.3 Broad strategy adopted in the 1990s. In 1990, the partyless Panchayat system was ended and inMay 1991, a new democratically elected government began implementing a broad set of reforms aimed atreducing poverty through market-oriented growth and social sector investments to develop human capital.The strategy was supported by an IMF facility (Oct 1992); substantial grants and loans from bilateral donorsand the Asian Development Bank; and the Bank’s country assistance strategy (CAS), as outlined below.Main elements of the program were (i) promoting efficient private sector activity; (ii) gradual withdrawal ofthe public sector from commercial and industrial activity; (iii) prudent macroeconomic policy; (iv) improvedpublic sector management; (iv) development of Nepal’s limited resource base; (v) public investment inhuman capital, power, and infrastructure; (vi) decentralization of decision-making; and (vii) environmentalprotection. Growth sectors were expected to be agriculture, manufacturing, tourism, and hydropower.
1.4 Halting progress on reform agenda. Good progress was made toward these objectives in the early1990s, due to both a committed Nepali government and liberalization in India. Price controls on mostproducts were removed, industrial licensing eliminated, quantitative barriers removed, tariffs consolidatedand reduced, convertibility on the current account allowed, and interest rates liberalized. Public enterprisereform and privatization commenced and public expenditure on health and education increased. However,in 1994, the incumbent government lost support and there has since been a succession of five unstablecoalition or minority governments, none lasting for more than a year and a half. None of the successivegovernments radically altered the direction of economic policy, allowing most market-oriented initiatives toremain in place. However, the fragility of successive governments slowed advancement of the reformagenda.
1.5 Positive early results, although of questionable sustainability and inadequate to reduce poverty.Results of market reforms and human capital development measures of the early 1990s are visible. Exports -driven by carpets and garments - grew an average of 20 percent per year in the 1990s and increased as ashare of GDP from 10 percent in 1990 to 22 percent in 1996. Manufacturing grew 12 percent a year andcredit to the private sector doubled from 13 percent of GDP in 1990 to 25 percent in 1996. Inflation wasmaintained around 10 percent and the external and fiscal deficits (after grants) restricted to 8 percent and 6percent of GDP respectively. Gross primary enrollment rose from 80 percent in 1985 to 110 percent in
2
1993. Between 1990 and 1997, GDP grew an average of 5 percent a year. However, as discussed below, thesustainability of these results is uncertain and they in themselves have not been enough to make a dent inNepal’s pervasive poverty. Estimates indicate a decline in GDP growth to 1.9 percent in 1998. Incomedistribution worsened, with the Gini coefficient rising from 0.24 in 1985 to 0.34 in 1996 (UNDP). Illiteracydecreased from 77 percent in 1980 to 64 percent in 1995, but remains among the highest in the world. Lifeexpectancy is the lowest in SAR. Less than half the people have access to safe water, compared to a 77percent average in SAR. The total number of poor has risen by over a million people since 1996.
2. Bank Objectives And Assistance
2.1 Bank objectives. Bank strategy in the 1990s, as reported to the Board in CAS documents, aimed tosupport most elements of the government’s broad poverty alleviation strategy. Objectives were to help: (i)maintain macroeconomic stability; (ii) increase investment in human resources; (iii) improve public resourcemanagement; (vi) stimulate the private sector; (v) improve infrastructure; (vi) increase agriculturalproductivity; and (vii) develop hydroelectric potential. The Bank also sought to help preserve Nepal’snatural resource base and better integrate women into development. Lessons from the past incorporated intothe strategy to improve project performance included enhancing donor coordination, strengthening projectimplementation capacity, and including NGO participation. OED’s view is that these objectives remainappropriate to reducing poverty in Nepal. However, as discussed below, not enough progress was madetoward them to have set Nepal on a more advanced and sustainable course in reducing poverty.
2.2 Lending operations since 1990. Lending to Nepal in the 1990s was lower than in the past andconsisted largely of infrastructure and agriculture investment operations. Between FY90 and FY98, 13projects were approved, worth SDR 387 million in commitments. This volume was considerably lower thanthat of the prior nine years (FY81-89), during which 34 projects were approved for SDR 631million. Sectordistribution by commitment in the 1990s was 39 percent infrastructure, 34 percent agriculture, 15 percentsocial sectors, and 12 percent power sector (a distribution similar to that of the preceding nine years). Thereare presently 15 active projects in the portfolio, of which 47 percent are at risk or potentially at risk. IFC hashad a limited portfolio in Nepal, having approved 8 investments to date, mainly in tourism and power.
2.3 Policy interventions and ESW. Policy Framework Paper (PFP) agreements between the Bank, IMF,and government were in place until 1995. In early 1996, a PFP was discussed but no agreement was reachedand no framework has been in place since the lapse of the last ESAF agreement in 1995. The 1996 CAS’slending triggers were partly based on PFP targets and became meaningless when the PFP failed tomaterialize. The IMF plans to initiate ESAF discussions later in 1998, but no dates have been specified asyet. No policy-based loans were made in the 1990s. Preparation of the Arun III power project includedconditions on expenditure prioritization and civil service reform. No further action was taken by the Bankafter the project was dropped in 1995. The Bank did not engage in significant policy dialogue in thefinancial sector, agriculture, or privatization after the end of the SAL II operation in 1992. Since FY90, theBank completed 18 formal ESW reports. Topics included secondary education, fiscal reform, infrastructuredevelopment, civil service reform, water supply and sanitation, agriculture, and overall economic progress.FIAS produced diagnostic studies on the foreign investment environment in FY97 and FY93.
2.4 Performance of completed projects. Between FY90 and FY98, 26 projects exited the Bank’s Nepalportfolio, accounting for US$604 million in net disbursements (1996 US$). Of this amount 82 percentsupported projects with satisfactory outcomes. This percentage exceeds Bank-wide and SAR outcomes of76 percent satisfactory over the same period as well as the 67 percent satisfactory ratings for all completedprojects in Nepal prior to FY90. However, performance is declining: 93 percent of projects approvedbetween 1981 and 1985 were satisfactory, compared to 66 percent of projects approved between 1986 and1993. Among projects completed in the 1990s 27 percent of original commitments were cancelled, the

3
highest in the region. Average completion delay per project was 31 months, compared to 27 in Pakistan, 25in Bangladesh, and 20 in Sri Lanka. Institutional development impact ratings were 28 percent substantial,somewhat below SAR and Bank-wide averages of 31 percent and 38 percent respectively, but higher thanpre-1990 ratings in Nepal of 23 percent substantial. Sustainability of projects in Nepal indicate a markedlylow performance, with only 16 percent of projects being likely to be sustainable, compared to SAR andBank-wide averages of 55 percent and 59 percent respectively. The average Development EffectivenessIndex for projects in Nepal was the lowest in SAR (see Annex Table 18). Bank performance ratings foridentification, appraisal, and supervision were close to SAR averages. As discussed below, however, ratingsfor Borrower performance in preparation, implementation, and compliance were well below regional andBank-wide norms.
3. The Bank’s Contribution To Development
3.1 Macroeconomic stability maintained, although fragile. Despite frequent government changes after1994 and limited policy involvement of the Bank and IMF, macroeconomic stability was largely maintainedin the 1990s, due to tight fiscal and monetary policies, stability in India, and large aid inflows. However,sustainability is uncertain due to weak fiscal revenues; increasing donor fatigue (see below); and thevulnerability of the market for carpets and garments, which account for 85 percent of merchandise exports.
3.2 Limited progress in the financial sector. Two major public-controlled banks have a 70 percent shareof the financial sector; interest rate spreads are high at 6 – 10 percent; and the formal sector is estimated toaccount for just 16 percent of total credit (the rest being met by informal lenders). Poor portfolio quality andhigh loan to deposit ratios in the dominant banks threaten stability in the system. The FY92 SAL IIcontained conditions to re-capitalize and restructure the banks, but the restructuring measures did not takeplace and there was subsequently no further activity. In effect, by enabling the re-capitalization of the twobanks without ensuring their reform, the Bank facilitated postponement of reforms in the banking sector.
3.3 Unsustainable interventions in agriculture. In agriculture (the largest sector in the Bank’sportfolio), four out of nine completed projects had unsatisfactory outcomes, just two had substantial IDimpact, and only one was considered likely to be sustainable. According to evaluations, the impact ofresearch and extension projects was limited because they did not respond to farmers needs, the T&V systemwas unsuited to the hills, and there were weak linkages between research and extension and poor motivationin public agencies. In irrigation, early projects failed to yield reliable water systems, mainly because theydid not involve farmers in the project or ensure appropriate cost-recovery mechanisms. Later projectsincorporated these lessons and emphasized beneficiary involvement, cost-recovery, and private irrigationschemes. Results of these efforts remain to be seen. The FY89 SAL contained conditions to open thefertilizer market to private traders. However, political resistance frustrated these efforts and no furtheraction was taken. Overall, although over 80 percent of the people depend on agriculture for their livelihoods,annual growth in the sector was just 2.6 percent in the 1990s, only marginally above the rate of populationgrowth.
3.4 Undeveloped power generation capacity. Bank contributions in power included construction of theMarsyangdi power plant, establishment of the Nepal Electricity Authority (NEA), and TA to screen and rankpower sites. However, the 400MW Arun III project, under preparation since the early 1980s was dropped in1995 due to its expected adverse fiscal impact, lack of implementation capacity, and the withdrawal of otherdonors. After this, the Bank supported efforts to create an environment for private development ofhydropower and improve the electricity distribution network. Private investors have responded to theliberalized regime – for example, IFC is participating in two projects that will increase capacity by nearly100MW. However, uncertain access to markets in India and inefficiencies in NEA appear to be keyremaining constraints for the power sector in Nepal. Until India’s electricity market is rationalized,including privatization of utilities and removal of subsidies, the risk of major investment in hydropower is
4
high. Only limited progress was seen in strengthening NEA. Poor service, price controls, and the high coststhat it incurs increase the risks for private investors and are key obstacles to expanding local access toelectricity. To date, only 293 MW out of Nepal’s estimated 43,000MW economically viable hydro-powerpotential has been developed and 85 percent of the people remain without access to electricity.
3.5 Slow progress in the health sector. The Bank had one project in the health sector, the FY94Population and Family Health (PHN) project. A health sector review, expected in FY99 will be the firstESW of the 1990s. Slow progress in preparing the PHN project reflected the government’s view thatadequate grant funding was available in the sector, making it reluctant to borrow from the Bank. The Bank’sposition was that other donors were failing to address critical institutional and policy constraints. However,the Bank’s efforts have not addressed some of these constraints. At present, more than 40 percent of healthexpenditures are allocated to tertiary health care. The PHN project lagged in its first three years aftereffectiveness until mid-1997, when the Bank threatened to cancel the project. The government then madesome key managerial appointments and restrained from interfering in project activities and the project isnow expected to achieve its objectives. The experience indicated the extent to which project success relieson government commitment to achieving project objectives.
3.6 Effective contribution in primary education, although limited impact in other areas. Seven Bankprojects were under implementation in education in the 1990s: three in basic and four in higher education.An ESW report in FY95 addressed major constraints to improving access and quality in secondaryeducation. With strong government commitment, the Bank’s projects in primary education had a significantimpact on moving the agenda forward and expanding primary school coverage. However, despite Bankefforts, the prospects of rationalizing budgetary allocations and management in higher education remainpoor due to lack of will among university management and political leaders. In secondary education, theneed to move two university grades to secondary education is recognized as important by the government,but efforts have been frustrated by poor cooperation between agencies as well as anticipated adversepolitical impacts.
3.7 Weak utility and poor project design hampered water supply interventions. Three Bank-financedprojects or components of projects aimed to increase safe water coverage. Projects suffered from inadequateengagement of user groups; excess government interference; lack of cost recovery mechanisms; andinsufficient capacity in the public water utility to meet its investment and operational responsibilities.Efforts to build capacity in the utility saw little progress and an ongoing water supply project was recentlyamended to contract out some of the utility’s operations. An FY97 rural water project is attempting toovercome some of these obstacles by creating a new social fund-type institution to manage demand-drivenconstruction of safe water schemes. At present, less than 50 percent of the people have access to safe water,well short of the 75 percent target established by the government and the Bank in the early 1990s.
3.8 Some progress in transport, although sustainability a concern. In transport, Bank assistancefocused on building and maintaining the core road network. Progress was made, although implementationwas slow due to cumbersome decision-making processes and lack of technical and managerial expertise inthe construction industry. As in other investment operations, sustainability remains a central concern.Neither Bank project was considered likely to be sustainable due to uncertain government commitment andlack of results-oriented maintenance spending. Bank-financed TA helped develop a Priority Investment Planthat provides a strategic framework for investment in the sector and made some gains in strengtheningcapacity in the Department of Roads. With strong government demand, the Bank now has on-going andproposed pilot projects to help develop road construction and maintenance capacity at the district level.Other donors are active in building roads at the community level. One key lesson learned by the Bank andgovernment in the 1990s was that basic, low quality roads built with labor-intensive processes best suitNepal’s needs, given fiscal constraints and low volumes of traffic, rather than the higher standard roadspreviously. At present, many villages remain several days walk from the nearest road and poor transportremains a major constraint to growth and greater access to basic social services in Nepal.

5
3.9 Effective contribution in telecom. While overall telephone coverage in Nepal continues to be low,some progress was seen in the sector. Two Bank projects were active in the 1990s and a further is presentlybeing prepared. Under the FY85 Telecom IV project, all physical targets were exceeded and the projecthelped establish a telephone network covering 73 of Nepal’s 75 districts. The on-going FY92 Telecom Vproject aimed to further expand coverage, improve quality, and establish the grounds for privatization. Todate, some 240,000 new lines have been added (compared to SAR estimates of 140,000) and the project ison target to achieve all its objectives. Most importantly, the public telecom company has consistentlymaintained good cost-recovery levels and is financially sustainable. Relative success in telecom is partlyattributed to the presence of committed high-level officials in the sector; restrained interference intomanagement of the utility; and the same set of officials consistently working in the sector.
4. Outcome: Unsatisfactory
4.1 Slow progress toward objectives. The broad poverty reduction strategy adopted by the governmentand supported by the Bank in the 1990s remains relevant to reducing poverty in Nepal. However, whileadvances were made toward some of the key intermediate objectives—particularly in liberalizing the priceand trade regime, maintaining macroeconomic stability, and expanding access to primary education—onbalance progress in implementing the strategy has been poor. Outcomes in most areas of Bank assistance—agriculture, the financial sector, power, health, education quality, water supply, transportation, and publicsector management—were unsatisfactory. Nepal saw good GDP and export growth between 1990 and 1996,due to the liberalization and stability in India and the impact of international garment quotas that causedmanufacturers to locate in Nepal. However, there has been insufficient progress in removing fundamentalinstitutional and policy constraints to help consolidate this progress and as a result Nepal is presently in aprecarious position: growth is declining; export markets are threatened; and there are serious concerns as tothe sustainability of the macroeconomic position.
4.2 Inadequate private supply response. In the long-term, the success of the strategy being pursued bythe government and supported by the Bank depends on a strong private sector supply response—inagriculture, power, tourism, or manufacturing—that will generate employment and income earningopportunities and increase public revenues. In the 1990s, this response was largely limited to carpets andgarments—both of which have vulnerable markets. Agro-processing, which is likely to be a key linkbetween the predominantly subsistence production of the present and a modern manufacturing sector, hasnot emerged. Agriculture, which remains the mainstay of the majority, has stagnated and the vast potentialfor power generation has not been exploited. The absence of critical infrastructure and low investorconfidence due to political instability are key factors behind this outcome. Other factors deterringinvestment include the presence of inefficient public enterprises in key sectors (i.e. banking, aviation,fertilizer); lack of access to investment finance due to the inefficient banking system and low savings;difficult access to markets in India; uncertain legal recourse for businesses; remaining anti-export biases inthe trade regime; insecure property ownership rights; and the perception of a corrupt political environment.
5. Institutional Development Impact: Modest
5.1 Some achievements, although limited efforts in public sector management after Arun III. Nearly allBank investment operations contained components to help build the administrative capacity of publicagencies concerned. Institutional development impact ratings in completed projects, at 28 percentsubstantial, were considerably higher than in Sri Lanka (14 percent) and Bangladesh (16 percent) and abovethe 23 percent among projects completed prior to 1990. An agenda for civil service reform was prepared inFY93 and fiscal expenditure studies were produced in FY92 and FY94 as part of the preparation for Arun

6
III. However, after cancellation of the project, the Bank lost its leverage and the agenda was notaggressively pursued. A public expenditure review is planned in FY99 to re-establish a dialogue with thegovernment. Meanwhile, the same problems that afflicted Nepal’s public sector in 1990 remain today.Expenditures are over-stretched and unprioritized, revenues are low, and budgeting is increasinglyunrealistic. The civil service, in turn remains “politicized, demoralized, uninspired, inefficient andineffective” (ADB, 1998). Inadequate project administration remains a central cause of poor outcomes inBank-financed operations. A key requirement to improve the performance of public institutions is reformingcivil service staffing procedures. Efforts to strengthen existing agencies through training and expatriatecounterparts have been consistently undermined by conditions that encourage high turnover, low motivation,and poor performance. Politicization of public agencies, overlapping ministries and agencies, and poorcoordination among them further undermine public service delivery. Extensive efforts to decentralizedecision-making authority, led by UNDP, have been frustrated by central political resistance that preventsfinancial resources going to the district level.
6. Sustainability: Uncertain
6.1 Poor project sustainability. Only 16 percent of projects completed in Nepal in the 1990s are likelyto be sustainable, compared to an SAR average of 55 percent and a Bank-wide average of 59 percent. Thispoor result raises serious questions as to the value of Bank-financed investments. Main causes of lowsustainability include inadequate fiscal management, a low emphasis on operation and maintenance, lack ofbeneficiary involvement, ineffective public administration, and wavering commitment on the part of thegovernment. While Bank projects have increasingly involved beneficiaries in projects, these other majorproblems persist. To promote project sustainability, one approach will be to rely on community groups andNGOs to build and operate infrastructure through social fund-type interventions – in cases where this ispossible. In the longer-term, progress in expenditure management and civil service reform, stronger politicaldetermination, and growth in public revenues will be essential to ensure sustainable public investment.
6.2 Over-dependence on external aid, lack of export diversification, potential banking crisis. On abroader level, the sustainability of Nepal’s current position is threatened by a number of factors. Externalaid financed 60-80 percent of Nepal’s annual development budgets in the 1990s and accounted for over 10percent of GDP. As the bulk of external assistance is on grant and concessional terms, Nepal’s debt serviceposition has not reached unsustainable levels: the debt service ratio in the 1990s was between 8 percent and11 percent, compared to the 20 percent point considered unsustainable. However, the growing sense of aid-fatigue among official donors raises the possibility of reduced aid levels, with consequent implications forNepal’s development budget. Improved performance in implementing projects is likely to be needed toensure continued high aid flows. Export diversification, particularly by taking advantage of recentlyimproved access to SAARC markets, will also be essential to promote sustainability. The financial sector isunder strain due to the lack of liquidity, bad portfolios, and poor lending practices of the two big banks. Aclose review and steps to address these circumstances are clearly warranted.
6.3 Poverty is the main threat to the environment, although sources of growth are also threats. It isapparent that each of the major expected sources of growth—agriculture, hydroelectric power, tourism, andmanufacturing—all pose some threat to the environment. Rapid urbanization of a few centers in the Teraiand Katmandu valley has also created high pollution indexes. However, poverty poses the biggest threat toland degradation and deforestation. Due to the absence of alternative energy sources, forests account forabout 80 percent of Nepal’s total energy consumption. UNCED estimates that 11 percent of the forest land isin a degraded state while another 26 percent has less than 40 percent crown cover. Community-based effortsunder an on-going Bank-financed forestry project are reported to be helping reverse the decline in forestcover in parts of the hills. In general, the Bank was fairly diligent in the 1990s in building in safeguards inits projects to prevent depletion of natural resources and this emphasis will have to be maintained.
7
7. Bank Performance: Unsatisfactory
7.1 Limited policy focus in a poor policy environment. In retrospect, in the 1990s, the Bank focused toomuch on implementing its investment projects in infrastructure, agriculture, and power in a very difficultenvironment and not enough on helping ensure the presence of a conducive policy environment to supportboth sustainable public investment as well as much greater private sector activity. In seven out of nineprojects evaluated since 1994, the sector policy environment was considered to be not supportive of projectimplementation. After 1995, Nepal had no agreed macro framework with the Bank or IMF; no policy-basedloans were made in the 1990s; despite a succession of investment projects, policy involvement in agriculturewas low; civil service and fiscal management reforms were not pressed after Arun III; dialogue in thefinancial sector and privatization lapsed for a good part of the 1990s; and dialogue in health and highereducation was largely ineffective. As a consequence, of the poor environment, while most completed Bank-financed projects had satisfactory outcomes, (i) the contribution of these interventions toward their broaderobjectives was limited; and (ii) the sustainability of benefits created is highly questionable.
7.2 General low level of activity. Along with gaps in the policy dialogue, there was a generally lowlevel of Bank activity in Nepal in the 1990s. The number of ESW reports was low, with only one report andthe CAS produced in the last three years. Lending between FY90-98 was 40 percent below that of FY81-89and only one project was approved between FY95 and FY98. Arun III seems to have monopolized theattention of senior staff and the Resident Mission until 1995. There are views among Bank staff thatintegration of Nepal into the same department as India in 1995 led to the neglect of Nepal as internalincentives encouraged Bank staff to work on India. Combining the three SAR divisions into two is alsothought to have resulted in a loss of institutional memory when staff working on Nepal left the department.The country director for Nepal changed six times in the 1990s. Since 1997, this situation has improved withthe establishment of an independent country department for Nepal and location of the country director in thefield. Bank activity in the social sectors was constrained by the government’s reluctance to borrow and thepresence of numerous other donors in these areas.
7.3 Narrow Bank focus in agriculture. In agriculture, in particular, Bank assistance tended to focus atthe project-level rather than on stimulating broader changes necessary to create an enabling environment foragricultural growth and diversification. Interventions concentrated on improving public research andextension to intensify traditional food-crop production (rice, maize, and wheat) and until recently on largepublic sector irrigation schemes. The need for a much more diverse production of cash crops in the hills dueto their topography and a range of micro-climatic variations was not emphasized. After the FY89 SAL II,the Bank took no measures to help rationalize food, fertilizer, or interest rates subsidies that distort marketproduction incentives. The critical obstacle to agricultural growth and diversification represented by lack ofrural roads was also not fully integrated into the Bank’s agriculture strategy. Until road access improves,access to markets and inputs, linkages with agro-industry, and the inflow of food will remain limited.
7.4 Controversial performance under Arun III. The dropped Arun III project generated wide negativepublicity for the Bank, strained relations with the government for a period thereafter, and consumedsubstantial Bank staff efforts and financial resources. The two-phase 400 MW project was a high risk andonly marginally viable operation. The proposed first phase would have increased generation capacity by200 MW at an estimated cost of 15 percent of Nepal’s development expenditures between FY94 and FY00.There were high risks that the government would be unable to sustain local tariff increases necessary to keepthe project viable; to mitigate the social and environmental impacts of the project; and to prevent crowdingout of social expenditures. The project would also have pre-empted the current alternate strategy involvingsmaller projects that help build local technical capacity. These issues were highlighted by interest groups ina public campaign against the project. Given the high level of risk and the only marginal benefits likely toaccrue from the project, the Bank canceled the project in 1995.

8
7.5 Uncoordinated aid along with aid fatigue. Poor donor coordination is an issue that has frequentlyarisen in the design and implementation of projects in Nepal. In 1996, there were 52 major donors in Nepal,including 20 multilateral and 15 bilateral donors. In water and sanitation, there were 26 different donors,disbursing 6 percent of total aid. The audit of the SAL II project found that “jurisdictional disputes”between UNDP and IDA over the provision of TA to improve expenditure management resulted in theinitiative being dropped. According to a 1998 Netherlands Development Organization evaluation of its aidprogram, “several donor agencies were sometimes involved in the same area, hardly knowing what eachother was doing”. Recently, key donors have warned of reduced aid flows in the absence of improvementsin public sector management in Nepal. In May 1998, Japan threatened to cut its aid budget by more than 10percent in the absence of improvements in project management and budgeting. In July, a visiting ADBdirector suggested that assistance to Nepal may be reduced due to poor project performance and increasedcompetition for ADB resources from regional countries. UNDP has expressed similar sentiments.
7.6 Positive efforts to integrate gender issues. Nepal is one of few countries where life expectancy forwomen is lower than that of men. Legal and social discrimination includes restricted access to property andcredit. Both the government and the Bank have been aware of the need to integrate women into developmentand taken steps to do so. For example, government policy is to provide free textbooks for girls throughgrade five, two years more than for boys. The Bank’s agriculture projects aimed to increase women’s accessto extension services and irrigation, while water supply projects directly benefited women by reducing timespent on collecting water. Bank projects also emphasized the recruitment of female teachers, healthworkers, and extension agents to help improve women’s access to these services. However, while Nepaldoes not have strict religious restrictions on women, progress in integrating women into development isconstrained by cultural traditions. As an example, parliamentary opponents of a bill to confer equal propertyrights on women claim that the bill will “destroy the social fabric.” Lack of rural infrastructure is a majorconstraint to women’s development, causing extensive amounts of their time to be spent collecting firewoodand water.
7.7 Sparse but sound economic and sector work. As indicated above, Bank ESW in Nepal wasrelatively sparse and no work was done in several key sectors, including health or agriculture (a 1997 ADBstudy filled this void). Nevertheless, the ESW that was produced was of good quality. As examples, theFY97 Economic Update provides a comprehensive view of what Nepal needs to do to change its poor recordto date. The FY94 infrastructure strategy paper elucidated a clear set of priorities that remain relevant todate. Good quality reports in fiscal management were produced in FY92 and FY94 in support Arun III. Themain issue has been the lack of follow-through on the recommendations of the various reports.
7.8 Good move toward participatory operation. During the 1990s, Bank operations made significantefforts to better include beneficiaries in projects. In irrigation, extension, forestry, and rural water supply,Bank projects abandoned the failed earlier top-down approaches in favor of participatory project design andimplementation. Preparation of the current CAS has included broad consultations with stakeholders,including through a village immersion program for Bank staff and the country director.
7.9 Bank costs driven up by Arun III and PHN project. Bank cost indicators do not indicate majordeviations from norms, with the exception of the PHN and dropped projects. Average completion costs perproject between FY90-97 was 2.1staff years, compared to 1.8 in Sri Lanka, 2.8 in Pakistan, and 3.00 in SAR.A notable outlier in preparation costs was the FY94 PHN project discussed above, which commencedpreparation in the early 1980s and took 1,024 staff weeks to prepare, compared to an average of 130 staffweeks per project in the PHN sector. Average time spent on supervision per project in Nepal was 0.35 staffyears, compared to 0.4 in SAR. However, the average cost per dropped project was US$423,000, comparedto US$147,000 in SAR. This figure was driven up by the dropped Arun III project, which cost the Bankover US$2 million. Average cost of an ESW report was US$187,000, compared to US$178,000 in SAR.
9
8. Borrower Performance: Unsatisfactory
8.1 Some achievements, especially between 1991 and 1994. Strong commitment by the governmentbetween 1991 and 1994 resulted in significant progress in liberalizing the trade and price regime andremoving regulatory barriers to investment. In addition, macroeconomic stability was maintainedthroughout the 1990s (albeit buttressed by high levels of aid). Consistent commitment by successivegovernments was also seen in primary education. More recently, in 1998, the government has showndetermination to improve the revenue situation by implementing a value added tax, despite vocal oppositionfrom parts of the business community. However, in the 1990s, commitment was not consistent acrosssectors, implementation of policy reforms slowed after 1994, and performance in project implementation hasbeen very poor.
8.2 Poor performance in projects. Among projects completed in the 1990s, Borrower preparation wassatisfactory in just 40 percent (compared to an average of 81 percent in SAR); implementation performancewas satisfactory in only 38 percent (70 percent in SAR); and compliance with loan covenants wassatisfactory in 52 percent (70 percent in SAR). Lack of commitment, shown through failure to providecounterpart funding or appoint key staff was a key factor behind implementation delays and poorsustainability. Lack of political will to proceed with reforms in fiscal management, banking, privatization,and civil service staffing is also apparent. Evaluations also indicate that projects suffered from mis-directedpolitical interference into project activities.
8.3 Fluctuating ownership of reforms. The relatively short time span of each government since 1994 iswidely seen as a key factor behind slow progress in advancing the overall poverty reduction agenda. In thepast four years, there have been 5 different prime ministers, while 121 different members of parliament havebecome ministers at some point. While none of the successive governments reversed market-orientedreforms, some initiatives such as privatization and reduced subsidies to public enterprises have sloweddown. Reports from the Bank and other donors indicate that frequent changes of government and seniorcivil service officials had a critical negative impact on project implementation, on the performance of thecivil service in general, and on the ability to implement long-term and difficult policy reforms.
8.4 Corruption is an issue. There is a widespread view that corruption and unaccountability in publicinstitutions causes a leakage of public funds and results in adverse political interference into developmentprojects. A study commissioned by the Bank and conducted by IRIS on corruption in rural works found thatcorruption was endemic and widespread, with estimates of amounts being siphoned at over 50 percent. Akey question to be answered is to what extent corruption in Nepal deters potential local and foreign privatesector investors. At the national level, Nepal has two anti-corruption agencies – the Auditor General’sOffice and the Commission of Investigation of Abuse of Authority (CIAA), tasked with collecting evidenceand prosecuting cases of alleged fraud. These institutions, however, have lacked either the teeth or the willnecessary to succeed in these tasks. The CIAA has lost all 25 of the corruption cases it filed with theSupreme Court, due to lack of evidence. Sustainable progress against corruption will require reforms in thecivil service that enable better remuneration and motivation of public service employees. In his speech atthe 1998 Annual Meetings, the Governor for Nepal stated that his government was “committed to addressingthe problem of corruption” and requested cooperation of the Bank in dealing with the issue.
9. Implications For Bank Assistance
9.1 Business as usual will not work. For Nepal to progress more rapidly toward sustainable growth andpoverty reduction, new measures are required to improve the quality of its public investments and to expandprivate sector activity. The upcoming CAS should include:

10
• An investment lending program conditioned on improvements in public sector management. Bank-financed investments are likely to continue to be unsustainable and have limited impact on their broaderobjectives in the absence of real improvements in the performance of the civil service, expendituremanagement, and governance. It is recommended that: (i) clear lending triggers be established andstrictly adhered to; (ii) intensive dialogue and ESW focus on these issues; and (iii) adaptable programlending where strong government commitment is required for its continuation be utilized.
• Close monitoring of the structural and social policy environment. An emphasis should be placed ondefining and realizing a conducive policy environment for increased private sector activity and improvedaccess to social services. ESW should support reform in the financial sector, an improved competitiveenvironment through privatization of key enterprises, and intra-sectoral re-orientation of publicexpenditures toward basic social services. A monitorable policy framework agreement between theBank, IMF and government should be re-established.
• A strategy for donor coordination to further the policy reform agenda. Recent unilateral warnings bykey donors of reduced aid flows reflect a growing consensus that in the absence of key policy changes,donor assistance to Nepal will continue to fall short of its potential impact. The Bank should take a leadin coordinating the donor approach to help build government ownership and advance essential reforms.
• Initiatives in rural infrastructure, using non-traditional approaches where possible. Poor infrastructure,particularly in rural areas, remains an immediate constraint to growth and wider access to basic socialservices. Given current weaknesses in public sector management, the Bank should work with theauthorities and other donors to develop a multi-faceted strategy to build and maintain infrastructure bystrengthening capacity at the central level as well as promoting management by non-governmental,private, and autonomous public entities. A greater use of LILs to help develop these approaches wouldfacilitate rapid expansion of the infrastructure development program as government ownershipimproves.
10. Current CAS
10.1 The current CAS incorporates lessons of the Bank’s past experience in Nepal and reflects broadstakeholder consultation. The strategy emphasizes: (i) beneficiary and private sector participation in projectimplementation; (ii) closer cooperation with donors to bring about improved governance; and (iii) linkage oflending levels to improvements in public sector management, financial sector reform, privatization,decentralization, and governance. These priorities conform to the recommendations made in this CAE. TheCAS matrix provides a good set of outcome indicators that will support future evaluation of the assistancestrategy. The CAS could spell out more clearly the respective priority areas of major donors.
Reflections of a former Resident Representative in Nepal
The Bank has never done that well in Nepal—it is a very difficult place to obtain results and requires a kind ofstamina and clarity of vision that we never really deployed in Nepal's case . . . . Where I felt we were weakest, apartfrom our unwillingness to confront the Government when it mattered, was in our reluctance to get to grips withinstitutional and capacity problems—and our unwillingness to choose a few strategic areas/issues and to concentrate ourefforts on them. Both of these things are necessary if we are to see the translation of good policy ideas and projectdesigns into action, and if we are to see positive action sustained over time. I always felt that we had the potential to bevery effective in Nepal, provided that we decentralized authority to the field, put key international staff in the ResidentMission, funded supervision and policy dialogue first and new lending as a residual, and kept our nerve. I still thinkthis; that we can be the agency that really counts in Nepal—and can live up to the expectations of the Nepalese, whocontinue to give us the benefit of the doubt. Nigel Roberts (former Resident Representative in Nepal), commenting on adraft of this CAE, November 1998.

11
ANNEXES
12
Annex A: Annex Tables
Table 1. Nepal: Key Economic Indicators, 1990-1996
Table 2. Key Economic Indicators: Nepal and Comparator Countries, 1992-96
Table 3. Nepal: Debt Indicators
Table 4. Nepal: Structure of Exports
Table 5. Nepal: Poverty Trends
Table 6. Composition of External Aid Disbursed to Nepal in 1996
Table 7. Sectoral Distribution of Aid to Nepal, 1993-1996
Table 8. World Bank Activities in Nepal by Sector, FY90-FY98
Table 9. OED Project Performance Ratings for Nepal
Table 10. Factors Influencing Project Outcomes (among projects evaluated since 1994)
Table 11. Active Projects in Nepal (as of July 1998)
Table 12. Nepal: Comparative Lending Indicators among Completed Projects
Table 13. Performance of Active Projects in Nepal
Table 14. Bank Assistance Cost Indicators
Table 15. Level of ESW: Nepal and Regional Countries
Table 16. List of Formal ESW on Nepal, FY90-FY98
Table 17. Bank Management for Nepal: 1990 - 1997
Table 18. Development Effectiveness Index - Nepal and Other SAR Countries
29
Annex BPage 1 of 3
Annex B: References
The research for the Nepal CAE was conducted between July and September 1998. The CAE drawson performance audit reports; project/implementation completion reports; staff appraisal reports;President’s memorandum; supervision reports; policy framework papers; country assistance strategies; andinterviews with past and present Bank staff. Other references include:
Abadzi, Helen, Reforming Higher Secondary Education in South Asia: The Case of Nepal, ReportNo. IDP-109, World Bank, May 1993.
Asian Development Bank, Technical Assistance for Action Plan on Civil Service Reform, Fact-finding Mission Report, June 1998.
CECI, Action Visits to Nepal: An Essential Element of Grassroots Income Generation Projects,CECI DIT, Vol 11, No. 2, November 1995.
CECI, Improving Education in Rural Nepal, CECI-Nepal, July 1997
Danish Ministry of Foreign Affairs, Nepal: Strategy for Danish-Nepalese DevelopmentCooperation, 1998.
FIAS, Attracting Foreign Direct Investment to Nepal’s Infrastructure, World Bank Group,June 1998.
FIAS, Foreign Investment Environment Study in Nepal: A Diagnostic Study, World Bank Group,September 1992.
FIAS, Nepal: Investment Incentives, Capital Repatriation, and Dispute Resolution, World Bank Group,May 1997.
Gharana, K.K.G., Trends and Issues in Poverty Alleviation in Nepal, The Economic Journal ofNepal, Vol. 18, No.1 Issues 69, January-March 1995.
Hachhethu, Krishna, Nepal in 1996: Experimenting with a Coalition Government, Asian Survey,Vol. XXXVII No. 2, February 1997.
IFC, Nepal Country Strategy, March 11, 1998.
IMF, Recent Economic Developments, Staff Reports, Economic Reviews, various years.
IRIS, IRIS in Nepal, 1997.
Karan, Pradyumna and Hiroshi Ishii, Nepal: A Himalayan Kingdom in Transition, United NationsUniversity Press, 1996.
Khadka, N. A Study of the Impact of Aid on Nepal’s Economy, Economia Internazionale, November1996.
Khadka, N., Foreign Aid to Nepal: Donor Motivations in the Post- Cold War Period, Asian Survey,Vol. XXXVII, No. 11, November 1997.

30
Annex BPage 2 of 3
Khanal, Y.N., Nepal in 1997: Political Stability Eludes, Asian Survey, Vol. XXXVIII, No. 2February 1998.
Nepal Foreign Investment Promotion Division, Foreign Investment Opportunities, Ministry ofIndustry, 1998.
Nepal Rastra Bank, Economic Report, various years.
Nepal Trade Promotion Center, Nepal: Overseas Trade Statistics FY1995/96.
Netherlands Development Assistance, SNV-Nepal, 1985-1995, Evaluation Report, 1998
Osada, Hiroshi and Hiroaki Sano, The Future Challenges for Nepalese Economy: Focused on DebtServicing Capacity, OECF Journal of Development Assistance Vol3, No. 2 , 1998.
Paudyal, S.B., Tourism Development in Nepal in the Context of Regional Perspective, TheEconomic Journal of Nepal, Vol. 20, No. 3, Issue 79, July-September 1997.
Shakya, Kushum, Causes of Low Female Life Expectancy in Nepal, The Economic Journal ofNepal, Vol. 18, No. 2. Issue 70, April-June 1995.
Sharma, Kishor, Impact of Policy Reforms on Manufacturing Growth in Nepal, Asian Survey,Vol XXXVII, No. 6, June 1997.
Sharma, Vishnu P., Economic Reform: Theoretical Consideration and its Macro Impact onNepalese Economy, The Economic Journal of Nepal, Vol. 20, No. 2, Issue 78, April-June 1997.
“The Independent,” various articles.
“The Kathmandu Post,” various articles.
“The Rising Nepal,” various articles.
UNDP, Nepal: Development Cooperation Report, 1996
UNDP, First Country Cooperation Framework (CCF) for Nepal (1997-2001), 1997.
UNDP, National Human Development Report: Nepal, 1998.
UNDP, UNDP in Nepal, 1998.
USAID, Congressional Presentation for Nepal, 1997, 1998, 1999.
US Embassy in Nepal, Doing Business in Nepal, March 1998.
World Bank, Nepal: Employment and the Labor Force: The Coming Crisis, Report No.14580-NEP, June 9, 1995.
World Bank, Nepal: Maintaining Structural Reforms and Managing Public Resources, Report No.8352-NEP, March 30, 1990.

31
Annex BPage 3 of 3
World Bank, Nepal: Non-financial Public Enterprises Sector Report, Report No. 9076-NEP,January 16, 1991.
World Bank, Nepal: Civil Service Reform – An Agenda for Action, Report No 12063-NEP,June 1993.
World Bank, Nepal: Critical Issues in Secondary Reform and Options for Reform, Report No.12243-NEP, August 26, 1994.
World Bank, Nepal: Relieving Poverty in a Resource Scarce State, Report No. 8635-NEP,August 15, 1990.
World Bank, Nepal: Selected Issues in Infrastructure Development, Report No. 11800-NEP,May 10, 1993.
World Bank, Nepal: Social Sector Strategy Review, Report No. 7498-NEP, April 1989.
World Bank, Nepal: 1997 Economic Update: The Challenge of Accelerating Economic Growth,Report No. 17034-NEP, November 11, 1997.
World Bank, Nepal: Agricultural Sector Review, Report No. 7693-NEP, March 20, 1990.
World Bank, Nepal: Fiscal Restructuring and Public Resource Management in the Nineties,Report No. 12281-NEP, March 17, 1994.
World Bank, Nepal: Policies for Improving Growth and Alleviating Poverty, Report No. 7418-NEP,October 14, 1988.
World Bank, Nepal: Arun III Proposed Hydroelectric Project & Restructuring of IDA Credit 2029,Inspection Panel Investigation Report, June 21, 1995.
World Bank, Report on an Audit of the Bank’s Resident Mission in Nepal: Operational Functions,Internal Auditing Department, August 7, 1995.
World Bank, Report on an Audit of the Bank’s resident Mission in Nepal: Financial andAdministrative Operations, Internal Auditing Department, June 29, 1995.
World Trade Organization, Nepal: Trade-Related Technical Assistance Needs-Assessment andIntegrated Responses by IMF, ITC, UNCTAD, UNDP, World Bank, and WTO, Committee on Trade andDevelopment, November 24, 1997.
32Attachment
12/14/1998
Report fromCODE
Committee on Development Effectiveness
Nepal: Country Assistance Note
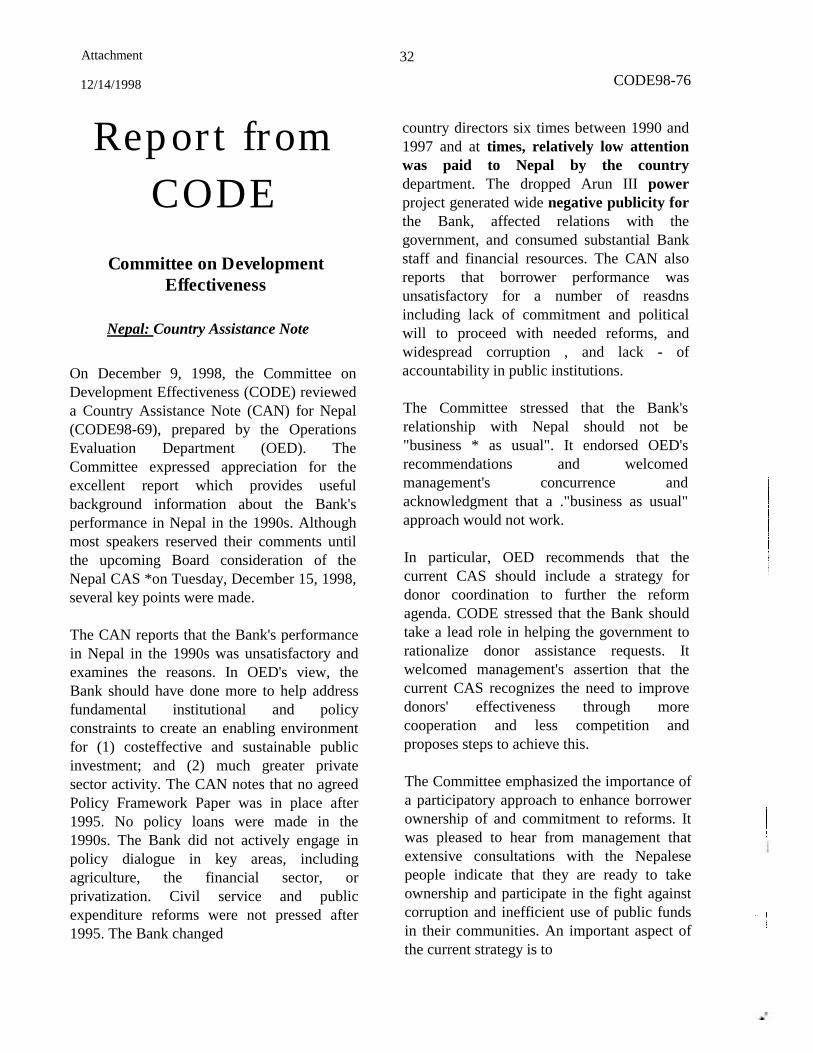
On December 9, 1998, the Committee onDevelopment Effectiveness (CODE) revieweda Country Assistance Note (CAN) for Nepal(CODE98-69), prepared by the OperationsEvaluation Department (OED). TheCommittee expressed appreciation for theexcellent report which provides usefulbackground information about the Bank'sperformance in Nepal in the 1990s. Althoughmost speakers reserved their comments untilthe upcoming Board consideration of theNepal CAS *on Tuesday, December 15, 1998,several key points were made.
The CAN reports that the Bank's performancein Nepal in the 1990s was unsatisfactory andexamines the reasons. In OED's view, theBank should have done more to help addressfundamental institutional and policyconstraints to create an enabling environmentfor (1) costeffective and sustainable publicinvestment; and (2) much greater privatesector activity. The CAN notes that no agreedPolicy Framework Paper was in place after1995. No policy loans were made in the1990s. The Bank did not actively engage inpolicy dialogue in key areas, includingagriculture, the financial sector, orprivatization. Civil service and publicexpenditure reforms were not pressed after1995. The Bank changed
CODE98-76
country directors six times between 1990 and1997 and at times, relatively low attentionwas paid to Nepal by the countrydepartment. The dropped Arun III powerproject generated wide negative publicity forthe Bank, affected relations with thegovernment, and consumed substantial Bankstaff and financial resources. The CAN alsoreports that borrower performance wasunsatisfactory for a number of reasdnsincluding lack of commitment and politicalwill to proceed with needed reforms, andwidespread corruption , and lack - ofaccountability in public institutions.
The Committee stressed that the Bank'srelationship with Nepal should not be"business * as usual". It endorsed OED'srecommendations and welcomedmanagement's concurrence andacknowledgment that a ."business as usual"approach would not work.
In particular, OED recommends that thecurrent CAS should include a strategy fordonor coordination to further the reformagenda. CODE stressed that the Bank shouldtake a lead role in helping the government torationalize donor assistance requests. Itwelcomed management's assertion that thecurrent CAS recognizes the need to improvedonors' effectiveness through morecooperation and less competition andproposes steps to achieve this.
The Committee emphasized the importance ofa participatory approach to enhance borrowerownership of and commitment to reforms. Itwas pleased to hear from management thatextensive consultations with the Nepalesepeople indicate that they are ready to takeownership and participate in the fight againstcorruption and inefficient use of public fundsin their communities. An important aspect ofthe current strategy is to
33
12/14/1998
bring resources closer to the people to mobilize and empower communities.
Noting OED's recommendation that the Bank's lending program should be conditioned on improvements in public sector management, the Committee stressed the need for capacity building in the civil service. It welcomed management's statement that capacity building is an integral part of the proposed strategy. The Committee noted management's statement that in providing technical assistance for capacity building, the Bank must pay adequate attention to existing local capacities and institutions.
CODE98-76 The Committee agreed with OED recommendation that an emphasis should be placed on defining and realizing a conducive policy environment for increased private sector activity and improved access to social services. It noted management's assertion that the Bank was taking steps to address this issue through initiatives such as a major public expenditure review and an increased pace of work in the financial sector.
Jan PiercyChairperson

34
WB18929O:\PREM\Betty\NEPALCAE_finall.DOC
June 20, 2001 1:05 PM

TABLE 1: NEPAL: KEY ECONOMIC INDICATORS, 1990 - 1996
Indicator 1990 1991 1992 1993 1994 1995 1996Average1965-1979
Average1980-1989
Average1990-1996
GDP growth (annual %) 4.7 6.3 4.0 3.8 8.2 3.4 5.3 2.3 4.1 5.1GNP per capita growth (annual %) 2.2 3.5 1.3 1.1 5.4 0.8 1.8 0.0 1.4 2.3GNP per capita, Atlas method (current US$) 210 210 200 200 200 210 210 98 173 206GNP per capita, PPP (current international $) 820 870 920 950 1020 1060 1090 595 961Population growth (annual %) 2.5 2.6 2.6 2.7 2.7 2.8 2.7 2.2 2.6 2.7Agriculture, value added (% of GDP) 51.6 48.6 45.9 43.3 43.1 41.8 42.0 67.6 56.0 45.2Manufacturing, value added (% of GDP) 6.1 6.9 9.0 9.0 9.5 9.5 9.7 3.9 5.2 8.6Services, etc., value added (% of GDP) 32.1 33.6 33.3 35.4 35.2 35.5 35.3 22.3 29.8 34.3Exports of goods and services (% of GDP) 10.5 11.8 16.0 18.1 23.9 24.2 22.5 7.7 11.4 18.1Imports of goods and services (% of GDP) 21.1 23.1 26.3 27.7 31.6 34.6 37.1 11.1 20.1 28.8International tourism, receipts (% of total exports) 28.7 28.8 19.3 23.2 17.8 11.0 13.0 18.5 20.3International tourism, growth in number of arrivals 6.3 14.9 14.0 -12.0 11.2 11.0 11.3 4.7 8.1Manufactured exports (% of merchandise exports) 83.5 80.7 82.8 84.3 .. 98.8 .. 27.2 52.7 86.0Current account balance (% of GDP) -8.4 -9.3 -7.9 -7.9 -5.6 -7.8 -12.8 -0.3 -5.8 -8.5Resource balance (% of GDP) -10.6 -11.3 -10.3 -9.6 -7.7 -10.4 -14.6 -3.4 -8.7 -10.6Agriculture, value added (annual % growth) 5.8 2.2 -1.1 -0.6 7.6 -0.3 4.4 0.8 3.6 2.6Manufacturing, value added (annual % growth) 9.8 17.7 32.0 6.2 12.3 2.0 5.0 4.0 12.1Services, etc., value added (annual % growth) 3.4 9.9 6.4 7.2 7.2 5.6 6.4 5.0 6.6Exports of goods and services (annual % growth) 2.6 25.6 49.2 25.1 39.6 0.2 0.5 6.4 20.4Aid (% of central government expenditures) 70.7 74.3 73.9 60.7 75.8 58.9 46.0 40.6 58.6 65.8Aid (% of GNP) 11.6 12.0 12.3 9.5 10.9 9.7 8.9 4.8 9.6 10.7Aid (% of gross domestic investment) 64.1 58.8 59.1 41.8 49.6 42.5 38.8 30.4 49.9 50.7Aid per capita (current US$) 22.9 23.5 22.0 17.9 21.6 20.3 18.2 5.7 16.3 20.9World Bank Aid (% of total aid)Money and quasi money (M2) as % of GDP 29.7 30.8 30.2 32.3 33.7 35.8 36.2 12.7 25.4 32.7Money and quasi money growth (annual %) 18.5 22.7 20.7 24.8 18.1 15.6 12.2 17.8 19.6 18.9Inflation, consumer prices (annual %) 8.2 15.6 17.1 7.5 8.3 7.6 9.4 6.9 10.8 10.5Credit to private sector (% of GDP) 12.8 13.7 13.7 14.9 18.6 22.8 24.6 3.7 9.9 17.3
Domestic credit prov. by banking sector (% of GDP) 28.9 29.2 28.2 29.2 29.9 34.6 36.0 6.3 25.8 30.8
Gross domestic savings (% of GDP) 7.9 9.6 10.8 13.5 14.7 13.0 8.6 6.3 10.7 11.2Gross domestic investment (% of GDP) 18.4 20.8 21.2 23.1 22.4 23.4 23.2 9.7 19.4 21.8Gross international reserves in months of imports 5.5 6.2 6.7 7.8 6.9 5.0 4.5 10.0 5.2 6.1Private investment (% of GDFI) 53.1 61.9 64.7 68.4 68.2 68.8 67.8 71.2 57.3 64.7Total debt service (% of exports goods and services) 15.4 12.6 10.4 9.0 7.7 7.7 7.7 2.0 7.4 10.1Overall budget deficit, including grants (% of GDP) -6.8 -8.2 -6.7 -6.0 -3.7 -4.6 -5.1 -2.3 -6.2 -5.9Expenditure, total (% of GDP) 17.2 18.9 16.8 17.0 14.7 17.5 20.1 10.8 17.4 17.5Current revenue, excluding grants (% of GDP) 8.4 8.6 8.7 8.3 9.5 10.7 12.2 6.6 8.5 9.5Tax revenue (% of GDP) 7.0 6.8 6.6 6.8 7.7 9.1 10.4 5.6 7.0 7.8Trade (% of GDP) 31.6 34.9 42.3 45.7 55.5 58.8 59.6 18.9 31.6 46.9Foreign direct investment, net inflows (% of GDI) 0.9 0.3 0.5 0.7 0.8 0.8 1.9 0.0 0.1 0.8Illiteracy rate, adult total (% of people 15+) 74.4 .. .. .. .. 72.5 .. 84.2 78.5 73.4Immunization, DPT (% of child. under 12 months) 80.0 74.0 72.0 68.0 77.0 65.0 .. 6.0 36.0 72.7Life expectancy at birth, total (years) 53.6 .. 54.6 .. .. 56.3 56.8 43.2 48.7 55.3Mortality rate, infant (per 1,000 live births) 101.2 .. 96.0 .. .. 87.6 84.8 160.8 120.3 92.4Safe water (% of population with access) .. 44.0 .. .. .. 48.0 .. 5.0 17.2 46.0Sanitation (% of population with access) 20.0 .. .. .. .. 20.0 .. 0.5 20.0School enrollment, primary (% gross) 108.0 108.0 111.0 110.0 .. .. .. 55.7 83.0 109.3Population density (people per sq km) 131.3 134.7 138.3 142.0 146.0 150.0 154.1 84.2 114.2 142.3Urban population (% of total) 8.9 9.2 9.5 9.7 10.0 10.3 10.6 4.5 7.6 9.7
Source: WDI
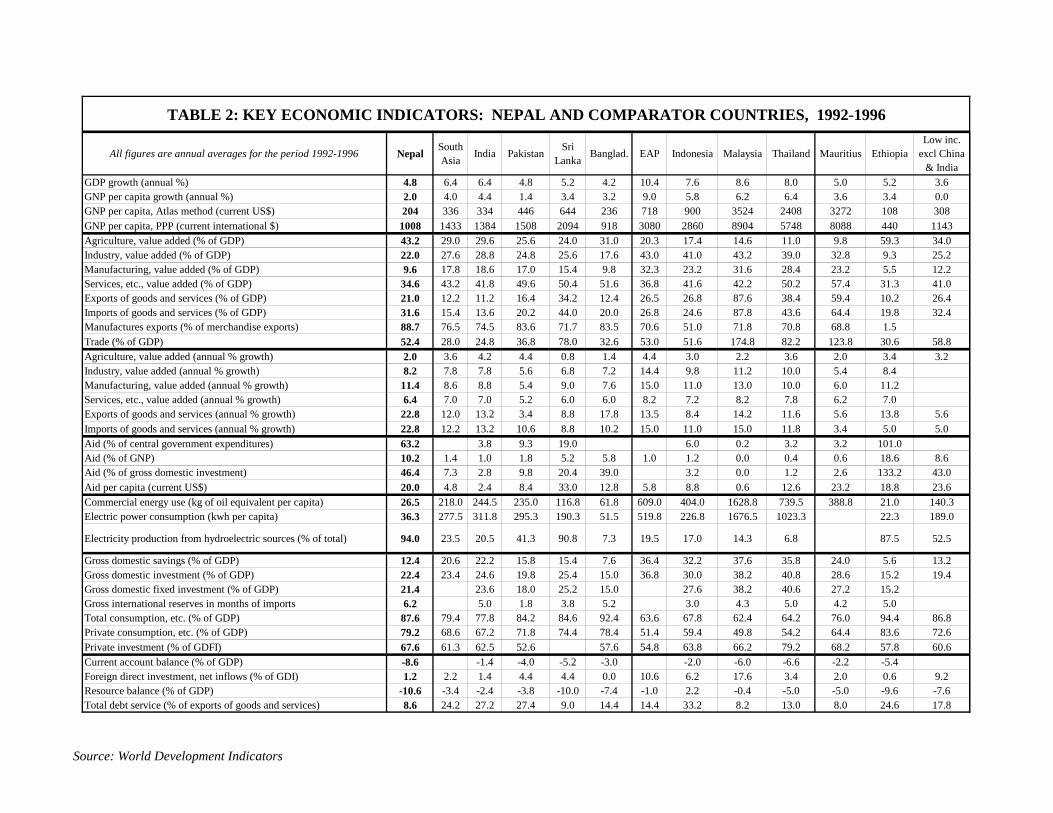
TABLE 2: KEY ECONOMIC INDICATORS: NEPAL AND COMPARATOR COUNTRIES, 1992-1996
All figures are annual averages for the period 1992-1996 NepalSouthAsia
India PakistanSri
LankaBanglad. EAP Indonesia Malaysia Thailand Mauritius Ethiopia
Low inc.excl China
& IndiaGDP growth (annual %) 4.8 6.4 6.4 4.8 5.2 4.2 10.4 7.6 8.6 8.0 5.0 5.2 3.6GNP per capita growth (annual %) 2.0 4.0 4.4 1.4 3.4 3.2 9.0 5.8 6.2 6.4 3.6 3.4 0.0GNP per capita, Atlas method (current US$) 204 336 334 446 644 236 718 900 3524 2408 3272 108 308GNP per capita, PPP (current international $) 1008 1433 1384 1508 2094 918 3080 2860 8904 5748 8088 440 1143Agriculture, value added (% of GDP) 43.2 29.0 29.6 25.6 24.0 31.0 20.3 17.4 14.6 11.0 9.8 59.3 34.0Industry, value added (% of GDP) 22.0 27.6 28.8 24.8 25.6 17.6 43.0 41.0 43.2 39.0 32.8 9.3 25.2Manufacturing, value added (% of GDP) 9.6 17.8 18.6 17.0 15.4 9.8 32.3 23.2 31.6 28.4 23.2 5.5 12.2Services, etc., value added (% of GDP) 34.6 43.2 41.8 49.6 50.4 51.6 36.8 41.6 42.2 50.2 57.4 31.3 41.0Exports of goods and services (% of GDP) 21.0 12.2 11.2 16.4 34.2 12.4 26.5 26.8 87.6 38.4 59.4 10.2 26.4Imports of goods and services (% of GDP) 31.6 15.4 13.6 20.2 44.0 20.0 26.8 24.6 87.8 43.6 64.4 19.8 32.4Manufactures exports (% of merchandise exports) 88.7 76.5 74.5 83.6 71.7 83.5 70.6 51.0 71.8 70.8 68.8 1.5Trade (% of GDP) 52.4 28.0 24.8 36.8 78.0 32.6 53.0 51.6 174.8 82.2 123.8 30.6 58.8Agriculture, value added (annual % growth) 2.0 3.6 4.2 4.4 0.8 1.4 4.4 3.0 2.2 3.6 2.0 3.4 3.2Industry, value added (annual % growth) 8.2 7.8 7.8 5.6 6.8 7.2 14.4 9.8 11.2 10.0 5.4 8.4Manufacturing, value added (annual % growth) 11.4 8.6 8.8 5.4 9.0 7.6 15.0 11.0 13.0 10.0 6.0 11.2Services, etc., value added (annual % growth) 6.4 7.0 7.0 5.2 6.0 6.0 8.2 7.2 8.2 7.8 6.2 7.0Exports of goods and services (annual % growth) 22.8 12.0 13.2 3.4 8.8 17.8 13.5 8.4 14.2 11.6 5.6 13.8 5.6Imports of goods and services (annual % growth) 22.8 12.2 13.2 10.6 8.8 10.2 15.0 11.0 15.0 11.8 3.4 5.0 5.0Aid (% of central government expenditures) 63.2 3.8 9.3 19.0 6.0 0.2 3.2 3.2 101.0Aid (% of GNP) 10.2 1.4 1.0 1.8 5.2 5.8 1.0 1.2 0.0 0.4 0.6 18.6 8.6Aid (% of gross domestic investment) 46.4 7.3 2.8 9.8 20.4 39.0 3.2 0.0 1.2 2.6 133.2 43.0Aid per capita (current US$) 20.0 4.8 2.4 8.4 33.0 12.8 5.8 8.8 0.6 12.6 23.2 18.8 23.6Commercial energy use (kg of oil equivalent per capita) 26.5 218.0 244.5 235.0 116.8 61.8 609.0 404.0 1628.8 739.5 388.8 21.0 140.3Electric power consumption (kwh per capita) 36.3 277.5 311.8 295.3 190.3 51.5 519.8 226.8 1676.5 1023.3 22.3 189.0
Electricity production from hydroelectric sources (% of total) 94.0 23.5 20.5 41.3 90.8 7.3 19.5 17.0 14.3 6.8 87.5 52.5
Gross domestic savings (% of GDP) 12.4 20.6 22.2 15.8 15.4 7.6 36.4 32.2 37.6 35.8 24.0 5.6 13.2Gross domestic investment (% of GDP) 22.4 23.4 24.6 19.8 25.4 15.0 36.8 30.0 38.2 40.8 28.6 15.2 19.4Gross domestic fixed investment (% of GDP) 21.4 23.6 18.0 25.2 15.0 27.6 38.2 40.6 27.2 15.2Gross international reserves in months of imports 6.2 5.0 1.8 3.8 5.2 3.0 4.3 5.0 4.2 5.0Total consumption, etc. (% of GDP) 87.6 79.4 77.8 84.2 84.6 92.4 63.6 67.8 62.4 64.2 76.0 94.4 86.8Private consumption, etc. (% of GDP) 79.2 68.6 67.2 71.8 74.4 78.4 51.4 59.4 49.8 54.2 64.4 83.6 72.6Private investment (% of GDFI) 67.6 61.3 62.5 52.6 57.6 54.8 63.8 66.2 79.2 68.2 57.8 60.6Current account balance (% of GDP) -8.6 -1.4 -4.0 -5.2 -3.0 -2.0 -6.0 -6.6 -2.2 -5.4Foreign direct investment, net inflows (% of GDI) 1.2 2.2 1.4 4.4 4.4 0.0 10.6 6.2 17.6 3.4 2.0 0.6 9.2Resource balance (% of GDP) -10.6 -3.4 -2.4 -3.8 -10.0 -7.4 -1.0 2.2 -0.4 -5.0 -5.0 -9.6 -7.6Total debt service (% of exports of goods and services) 8.6 24.2 27.2 27.4 9.0 14.4 14.4 33.2 8.2 13.0 8.0 24.6 17.8
Source: World Development Indicators

All figures are annual averages for the period 1992-1996 NepalSouthAsia
India PakistanSri
LankaBanglad. EAP Indonesia Malaysia Thailand Mauritius Ethiopia
Low inc.excl China
& IndiaOverall budget deficit, including grants (% of GDP) -5.4 -6.8 -6.0 -7.3 -7.2 1.0 1.8 2.4 -1.2 -6.5Expenditure, total (% of GDP) 17.4 17.6 16.4 24.0 27.4 12.0 16.2 25.0 15.8 22.6 18.0Current revenue, excluding grants (% of GDP) 9.8 13.8 13.2 18.5 19.6 10.3 17.6 27.2 18.6 21.4 11.5Military expenditure (% of central government expenditure) 6.3 13.0 26.5 15.8 9.5 8.0 11.3 16.5 1.5 15.0Credit to private sector (% of GDP) 19.2 25.0 25.4 27.2 24.0 20.4 84.2 51.4 117.3 115.4 43.8 17.8 17.6Lending interest rate (%) 13.0 15.3 17.0 14.6 14.6 16.6 20.2 8.6 16.0 19.0 13.0 21.3Domestic credit provided by banking sector (% of GDP) 31.6 49.0 50.8 53.0 35.4 30.4 87.2 50.4 122.0 114.4 61.8 50.6 36.4Inflation, consumer prices (annual %) 10.0 9.4 10.8 11.0 3.4 8.8 4.2 4.8 7.2 5.6Money and quasi money (M2) as % of GDP 33.6 44.8 40.8 30.4 34.2 42.0 80.0 73.0 69.2 41.4Money and quasi money growth (annual %) 18.4 16.8 19.6 17.4 12.8 22.8 22.3 15.4 14.4 13.8Export duties (% of exports) 1.4 0.0 0.0 0.0 0.3 0.0 1.2 0.0 1.2 3.0Import duties (% of imports) 9.6 26.8 29.6 25.8 11.0 6.3 3.8 3.8 8.0 16.4 15.0Tax revenue (% of GDP) 8.2 10.6 10.0 13.5 17.4 9.0 15.4 20.8 16.6 18.4 8.0Taxes on goods and services (% of current revenue) 39.8 37.4 30.8 32.0 51.2 26.5 29.8 23.2 40.2 24.2 23.5
Taxes on income, profits and capital gains (% of current rev.) 10.0 14.2 20.8 15.0 13.6 34.0 49.2 34.6 29.6 12.8 26.0
Taxes on international trade (% of current revenue) 28.0 24.6 23.4 25.8 20.4 14.8 4.6 13.2 16.6 38.2 21.5International tourism, expenditures (% of total imports) 8.2 2.4 1.2 4.8 3.0 3.2 3.0 3.8 3.0 4.2 6.2 1.4 4.0Arrivals/population 1.6 0.3 0.2 0.3 2.1 0.1 2.4 2.1 34.9 10.6 36.4 0.2 0.9International tourism, receipts (% of total exports) 16.8 6.2 7.4 1.2 5.4 0.8 7.2 10.2 4.4 11.2 17.0 5.0 4.0International tourism, number of arrivals (growth) 7.1 5.0 6.6 0.0 -10.9 8.2 11.1 14.5 1.0 2.2 4.2 5.5 12.4Public spending on education, total (% of GNP, UNESCO) 3.0 3.0 4.0 3.0 2.0 3.0 1.3 5.3 4.0Pupil-teacher ratio, primary 39.0 61.7 63.7 50.0 28.7 24.0 23.0 20.0 19.3 21.0 29.0 40.0School enrollment, primary (% gross) 110.5 98.0 100.3 71.5 110.0 92.0 115.0 114.3 91.0 92.0 106.3 27.0 80.5Health expenditure per capita (current US$) 9.0 12.0 5.0 17.0 85.0 111.0Illiteracy rate, adult female (% of females 15+) 86.0 64.0 62.0 76.0 13.0 74.0 24.0 22.0 22.0 8.0 21.0 75.0 55.0Illiteracy rate, adult male (% of males 15+) 59.0 38.0 35.0 50.0 7.0 51.0 9.0 10.0 11.0 4.0 13.0 55.0 36.0Illiteracy rate, adult total (% of people 15+) 73.0 51.0 48.0 62.0 10.0 62.0 17.0 16.0 17.0 6.0 17.0 65.0 46.0Immunization, measles (% of children under 12 months) 67.7 83.0 85.7 66.0 85.0 92.0 89.7 89.3 81.3 76.7 84.5 25.3 61.0Life expectancy at birth, total (years) 56.0 61.3 62.0 62.7 72.7 57.7 68.0 64.0 71.6 69.0 70.7 48.3 55.7Mortality rate, infant (per 1,000 live births) 89.7 77.0 69.3 91.0 16.7 80.3 41.5 52.3 12.0 35.3 18.3 113.3 91.0Safe water (% of population with access) 48.0 77.0 81.0 60.0 46.0 81.5 84.0 62.0 89.0 81.0 98.0 27.0Sanitation (% of population with access) 20.0 29.0 29.0 30.0 52.0 35.0 30.0 51.0 92.5 78.5 100.0 10.0Population density (people per sq km) 146.0 255.4 307.4 164.0 276.2 906.2 106.6 105.4 59.8 114.8 546.6 55.5 38.4Population growth (annual %) 3.0 2.0 2.0 3.0 1.0 2.0 1.0 2.0 2.0 1.0 1.0 1.8 2.6Urban population (% of total) 10.0 26.0 26.6 33.8 22.0 17.8 30.6 34.2 52.8 19.6 41.0 15.0 27.6
Source: World Development Indicators

TABLE 3. NEPAL: DEBT INDICATORS
1990 1991 1992 1993 1994 1995 1996
Concessional debt/Total debt (EDT) (%) 89 91 92 93 92 95 96
Current account balance (US$m) -305 -344 -275 -296 -225 -343 -569
Debt service (TDS)/Exports of goods and services (XGS) (%) 15 13 11 9 8 8 8
Exports of goods and services (XGS) (US$m) 463 529 651 775 1,072 1,206 1,111
Foreign direct investment, net inflows (US$m) 6 2 4 6 7 8 19.2
Grants, excluding technical cooperation (US$m) 143 142 158 146 170 171 146
Gross national product (GNP) (US$m) 3,695 3,770 3,540 3,840 4,123 4,484 4,521
Imports of goods and services (MGS) (US$m) 766 868 933 1,081 1,302 1,555 1,686
Interest (INT)/Exports of goods and services (XGS) (%) 6 6 5 4 3 3 3
Interest (INT)/GNP (%) 1 1 1 1 1 1 1
Multilateral debt/Total debt (EDT) (%) 77 79 80 79 78 81 82
Reserves (RES)/Imports of goods and services (MGS) (months) 6 6 7 8 7 5 5
Reserves (RES)/Total debt (EDT) (%) 22 26 29 35 32 27 26
Short-term debt/Total debt (EDT) (%) 2 1 0 1 3 1 1
Technical cooperation grants (US$m) 109 117 127 146 143 143 145
Total debt (EDT)/Exports of goods and services (XGS) (%) 354 335 277 259 217 199 217
Total debt (EDT)/GNP (%) 44 47 51 52 56 54 53
Workers' remittances, received (US$m) 61 65 54 66 70 101 78
Source: GDF
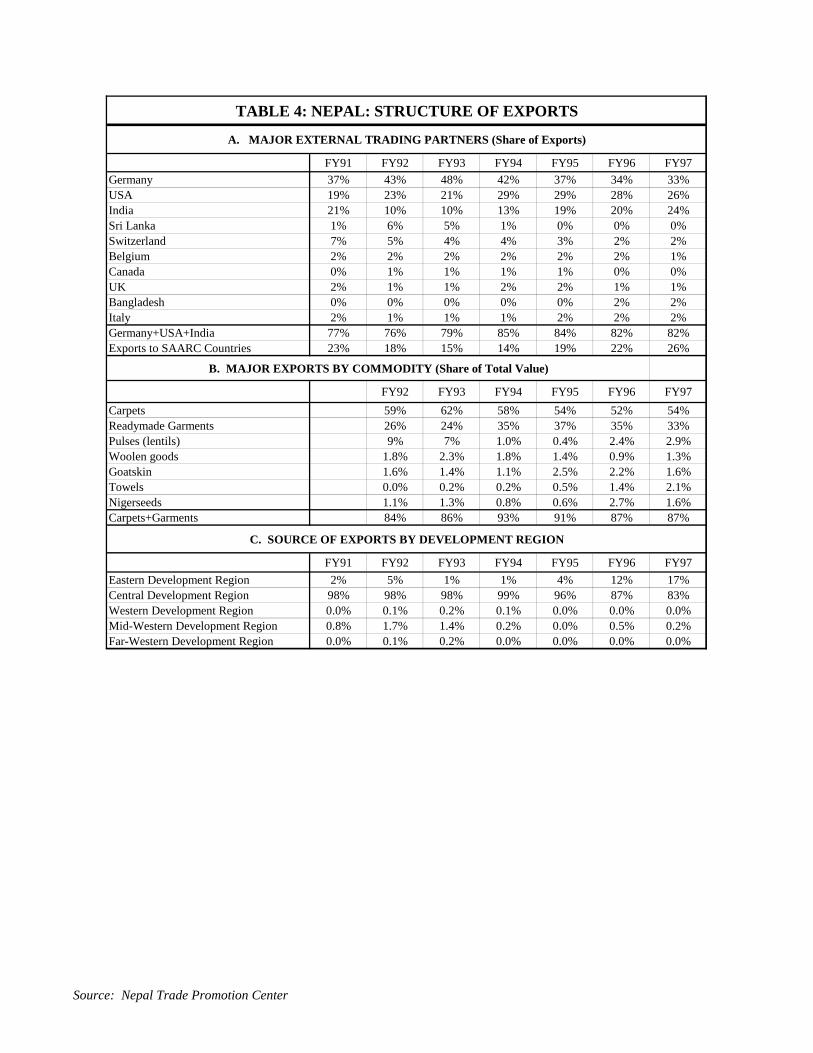
TABLE 4: NEPAL: STRUCTURE OF EXPORTS
A. MAJOR EXTERNAL TRADING PARTNERS (Share of Exports)
FY91 FY92 FY93 FY94 FY95 FY96 FY97
Germany 37% 43% 48% 42% 37% 34% 33%USA 19% 23% 21% 29% 29% 28% 26%India 21% 10% 10% 13% 19% 20% 24%Sri Lanka 1% 6% 5% 1% 0% 0% 0%Switzerland 7% 5% 4% 4% 3% 2% 2%Belgium 2% 2% 2% 2% 2% 2% 1%Canada 0% 1% 1% 1% 1% 0% 0%UK 2% 1% 1% 2% 2% 1% 1%Bangladesh 0% 0% 0% 0% 0% 2% 2%Italy 2% 1% 1% 1% 2% 2% 2%Germany+USA+India 77% 76% 79% 85% 84% 82% 82%Exports to SAARC Countries 23% 18% 15% 14% 19% 22% 26%
B. MAJOR EXPORTS BY COMMODITY (Share of Total Value)
FY92 FY93 FY94 FY95 FY96 FY97
Carpets 59% 62% 58% 54% 52% 54%Readymade Garments 26% 24% 35% 37% 35% 33%Pulses (lentils) 9% 7% 1.0% 0.4% 2.4% 2.9%Woolen goods 1.8% 2.3% 1.8% 1.4% 0.9% 1.3%Goatskin 1.6% 1.4% 1.1% 2.5% 2.2% 1.6%Towels 0.0% 0.2% 0.2% 0.5% 1.4% 2.1%Nigerseeds 1.1% 1.3% 0.8% 0.6% 2.7% 1.6%Carpets+Garments 84% 86% 93% 91% 87% 87%
C. SOURCE OF EXPORTS BY DEVELOPMENT REGION
FY91 FY92 FY93 FY94 FY95 FY96 FY97
Eastern Development Region 2% 5% 1% 1% 4% 12% 17%Central Development Region 98% 98% 98% 99% 96% 87% 83%Western Development Region 0.0% 0.1% 0.2% 0.1% 0.0% 0.0% 0.0%Mid-Western Development Region 0.8% 1.7% 1.4% 0.2% 0.0% 0.5% 0.2%Far-Western Development Region 0.0% 0.1% 0.2% 0.0% 0.0% 0.0% 0.0%
Source: Nepal Trade Promotion Center

TABLE 5. NEPAL: POVERTY TRENDS
YearPercent of population below the
poverty line
Estimatednumber of
poor(million)
Averageannual
increase (%)Source
Rural (%) Urban (%) Nepal (%)
1977 37.2 17 36.2 5.5 NPC
1986 43.1 19.2 41.4 7.2 3.4% MPHBS
1996 46.6 17.8 44.6 9.2 2.8% NLSS
Source: UNDP/World Bank

TABLE 6. COMPOSITION OF EXTERNAL AID DISBURSED TONEPAL IN 1996
A. SHARE OF TOTAL AID DISBURSED, BY SECTOR (1996)Sector Percent of Total Number of Donors
Agriculture, Forestry, and Fisheries 14% 23Area Development 7% 23Communications 5% 9Development Administration 2% 12Disaster Preparedness 2% 2Economic Management 3% 7Education 14% 25Energy 11% 14Health 8% 25Humanitarian and Relief 4% 13Industry 1% 8Natural Resources 9% 18Social Development (incl. water and sanitation) 6% 26Trade (incl. tourism) 1% 7Transport (roads and air) 14% 10
B. SHARE OF LOANS VS. GRANTS (1996)Aid Terms Share
Percent Loans 34%Percent Grants 66%
C. NUMBER AND SHARE OF DONORS, BY DONOR TYPE (1996)
Donor Type Number of DonorsShare of
DisbursementsMultilateral Donors 20 46%Bilateral Donors 15 49%INGOs 17 5%TOTAL 52 100%
D. MAJOR INDIVIDUAL DONORS IN 1996 (Share of total disbursements)Donor Share of Total
Asian Development Bank 18%Japan 16%IDA 16%UN System (excl. IDA) 11%Denmark 6%UK 6%USA 5%Germany 4%Others 16%
Source: UNDP

TABLE 7: SECTORAL DISTRIBUTION OF AID TO NEPAL, 1993 - 1996
Disbursements in 000US$ Percentage share
1993 1994 1995 1996 1993 1994 1995 1996Average
1993-1996Transport (roads and air) 52,269 93,528 69,410 53,869 14% 20% 16% 14% 16%Agriculture, Forestry , and Fisheries 61,279 76,686 55,293 53,937 16% 16% 13% 14% 15%Energy 32,406 56,284 30,010 44,286 8% 12% 7% 11% 10%Natural Resources 43,808 41,320 34,419 35,280 11% 9% 8% 9% 9%Education 23,878 31,587 39,435 54,302 6% 7% 9% 14% 9%Health 33,825 33,059 27,120 30,558 9% 7% 6% 8% 7%Area Development 22,599 22,783 24,913 26,037 6% 5% 6% 7% 6%Social Development (incl. water and sanitation) 28,307 29,566 15,939 22,011 7% 6% 4% 6% 6%Humanitarian and Relief 22,336 17,614 36,699 16,572 6% 4% 9% 4% 6%Communications 8,489 21,578 29,417 18,643 2% 5% 7% 5% 5%Economic Management 11,629 22,582 21,171 13,545 3% 5% 5% 3% 4%Industry 20,041 8,528 17,573 4,778 5% 2% 4% 1% 3%Disaster Preparedness 14,678 10,746 18,651 6,492 4% 2% 4% 2% 3%Development Administration 6,447 7,980 7,963 7,183 2% 2% 2% 2% 2%Trade (incl tourism) 925 2,848 3,193 4,294 0% 1% 1% 1% 1%
TOTAL AID DISBURSED TO NEPAL 382,916 476,689 431,206 391,787 100% 100% 100% 100% 100%
Source: UNDP
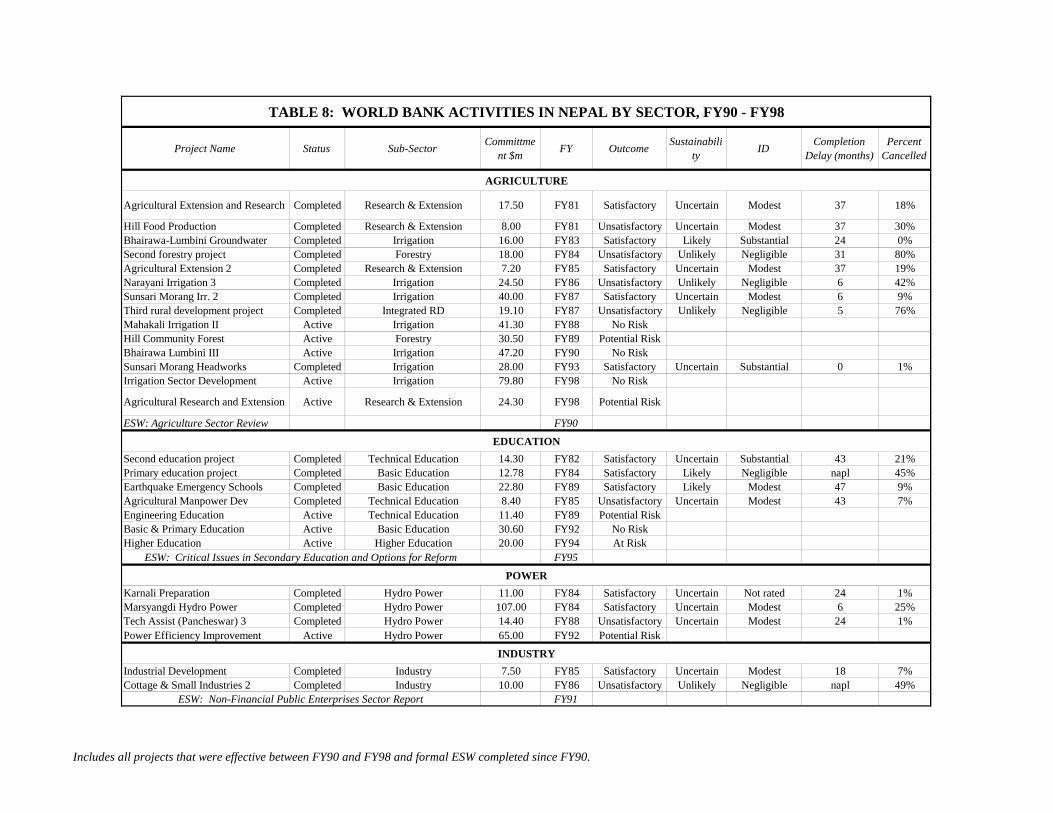
TABLE 8: WORLD BANK ACTIVITIES IN NEPAL BY SECTOR, FY90 - FY98
Project Name Status Sub-SectorCommittme
nt $mFY Outcome
Sustainability
IDCompletion
Delay (months)Percent
Cancelled
AGRICULTURE
Agricultural Extension and Research Completed Research & Extension 17.50 FY81 Satisfactory Uncertain Modest 37 18%
Hill Food Production Completed Research & Extension 8.00 FY81 Unsatisfactory Uncertain Modest 37 30%Bhairawa-Lumbini Groundwater Completed Irrigation 16.00 FY83 Satisfactory Likely Substantial 24 0%Second forestry project Completed Forestry 18.00 FY84 Unsatisfactory Unlikely Negligible 31 80%Agricultural Extension 2 Completed Research & Extension 7.20 FY85 Satisfactory Uncertain Modest 37 19%Narayani Irrigation 3 Completed Irrigation 24.50 FY86 Unsatisfactory Unlikely Negligible 6 42%Sunsari Morang Irr. 2 Completed Irrigation 40.00 FY87 Satisfactory Uncertain Modest 6 9%Third rural development project Completed Integrated RD 19.10 FY87 Unsatisfactory Unlikely Negligible 5 76%Mahakali Irrigation II Active Irrigation 41.30 FY88 No RiskHill Community Forest Active Forestry 30.50 FY89 Potential RiskBhairawa Lumbini III Active Irrigation 47.20 FY90 No RiskSunsari Morang Headworks Completed Irrigation 28.00 FY93 Satisfactory Uncertain Substantial 0 1%Irrigation Sector Development Active Irrigation 79.80 FY98 No Risk
Agricultural Research and Extension Active Research & Extension 24.30 FY98 Potential Risk
ESW: Agriculture Sector Review FY90
EDUCATION
Second education project Completed Technical Education 14.30 FY82 Satisfactory Uncertain Substantial 43 21%Primary education project Completed Basic Education 12.78 FY84 Satisfactory Likely Negligible napl 45%Earthquake Emergency Schools Completed Basic Education 22.80 FY89 Satisfactory Likely Modest 47 9%Agricultural Manpower Dev Completed Technical Education 8.40 FY85 Unsatisfactory Uncertain Modest 43 7%Engineering Education Active Technical Education 11.40 FY89 Potential RiskBasic & Primary Education Active Basic Education 30.60 FY92 No RiskHigher Education Active Higher Education 20.00 FY94 At Risk
ESW: Critical Issues in Secondary Education and Options for Reform FY95
POWER
Karnali Preparation Completed Hydro Power 11.00 FY84 Satisfactory Uncertain Not rated 24 1%Marsyangdi Hydro Power Completed Hydro Power 107.00 FY84 Satisfactory Uncertain Modest 6 25%Tech Assist (Pancheswar) 3 Completed Hydro Power 14.40 FY88 Unsatisfactory Uncertain Modest 24 1%Power Efficiency Improvement Active Hydro Power 65.00 FY92 Potential Risk
INDUSTRY
Industrial Development Completed Industry 7.50 FY85 Satisfactory Uncertain Modest 18 7%Cottage & Small Industries 2 Completed Industry 10.00 FY86 Unsatisfactory Unlikely Negligible napl 49%
ESW: Non-Financial Public Enterprises Sector Report FY91
Includes all projects that were effective between FY90 and FY98 and formal ESW completed since FY90.

Project Name Status Sub-SectorCommittme
nt $mFY Outcome
Sustainability
IDCompletion
Delay (months)Percent
Cancelled
ESW: Employment and the Labor Force: The Coming Crisis FY95
BROAD POLICY REFORMS
Structural Adj. 2 Completed Multisector 60.00 FY89 Satisfactory Uncertain Modest napl 0%ESW: Maintaining Structural Reforms and Managing Public Resources FY90
ESW: Relieving Poverty in a Resource Scarce Economy FY91ESW: 1997 Economic Update: The Challenge of Accelerating Economic
GrowthFY98
PUBLIC SECTOR MANAGEMENT
Second technical assistance project Completed Public Sector Management 6.00 FY83 Satisfactory Likely Substantial 47 5%ESW: Public Resource Management in a Resource Scarce Economy FY92
ESW: Civil Service Reform: An Agenda for Action FY93ESW: Fiscal Restructuring and Public Resource Management in the 1990's FY94
OIL AND GAS
Petroleum Exploration Promotion Completed Oil & Gas 9.20 FY82 Satisfactory Uncertain Modest 61 29%
HEALTH
Population and Health Active PHN 26.70 FY94 Potential Risk
INFRASTRUCTURE
Telecommunications 4 Completed Telecommunications 22.00 FY85 Satisfactory Likely Substantial 49 6%Telecoms V Active Telecommunications 55.00 FY92 No RiskHighway 3 Completed Transportation 47.50 FY85 Satisfactory Uncertain Substantial 61 8%Road Flood Rehabilitation Completed Transportation 15.50 FY88 Unsatisfactory Uncertain Modest 37 22%Arun 3 Access Road Completed Transportation 32.80 FY89 Not rated Not rated Not rated napl 100%Road Maint and Rehabilitation Active Transportation 50.50 FY94 No RiskMultimodal Transit Active Transportation 23.50 FY98 No RiskMunicipal Dev & Housing Recon. Completed Urban Development 41.50 FY89 Unsatisfactory Uncertain Modest 6 49%
Urban Water and Sanitation Rehab Active Water Supply and Sanitation 60.00 FY91 At Risk
Rural Water and Sanitation Active Water Supply and Sanitation 18.30 FY97 No Risk
ESW: Water Supply and Sanitation Sector Issues Paper FY93ESW: Expenditures in the Road Sector FY93
ESW: Infrastructure Development FY93ESW: Selected Issues in Infrastructure
DevelopmentFY94
Includes all projects that were effective between FY90 and FY98 and formal ESW completed since FY90.

TABLE 9: OED PROJECT PERFORMANCE RATINGS FOR NEPAL
Sector/Subsector NoTotal
disbursed(1996 US$)
Percent oftotal
PercentSAT (by
no.)
PercentSAT (by
amt)
PercentLIK Sust.
PercentSUB ID
PercentSAT Bank
Ident.
PercentSAT Bank
Appr.
PercentSAT Bank
Superv.
PercentSAT Borr.
Prep.
PercentSAT Borr.
Impl.
PercentSAT Borr.
Compl.
PercentARPP DOSAT at exit
Lending to Nepal, exit years 1990-97 26 604 52% 64% 82% 16% 28% 94% 73% 74% 40% 38% 52% 89%Lending to Nepal, exit years 1977-89 27 565 48% 63% 67% 44% 23% 74% 74% 51% napl napl napl 97%All lending to Nepal (1977 -1997) 53 1,169 100% 64% 74% 26% 29% 93% 72% 69% 38% 44% 43% 93%
PROJECTS EXITING THE PORTFOLIO BETWEEN 1990 AND 1997By Sector
Agriculture 9 165 27% 56% 77% 15% 31% 89% 78% 89% 27% 33% 71% 80%Education 4 62 10% 75% 83% 54% 29% 83% 83% 100% 83% 100% 84% 100%Electric Power & Other Energy 3 147 24% 67% 89% 0% 0% 100% 100% 11% 0% 0% 0% 100%Industry 2 16 3% 50% 59% 0% 0% 59% 59% 59% 100% 59% 59% 59%Multisector 1 68 11% 100% 100% 0% 0% 100% 0% 100% 0% 0% 0% 100%Oil & Gas 1 10 2% 100% 100% 0% 0% 100% 100% 100% napl napl napl 100%Public Sector Management 1 9 1% 100% 100% 100% 100% 100% 100% 100% napl napl napl 100%Telecommunications 1 28 5% 100% 100% 100% 100% 100% 100% 100% 100% 100% 100% 100%Transportation 3 74 12% 50% 81% 0% 81% 100% 81% 100% 100% 81% 100% 100%Urban Development 1 24 4% 0% 0% 0% 0% 100% 0% 100% napl 0% 100% 0%
By Approval PeriodFY81 - FY85 15 354 59% 80% 93% 20% 41% 97% 93% 68% 48% 54% 50% 97%FY86 - FY93 11 249 41% 40% 66% 10% 11% 90% 45% 83% 30% 21% 54% 78%
SAR Region CountriesBangladesh 42 2,577 10% 74% 80% 40% 16% 90% 61% 70% 81% 52% 40% 94%India 91 17,652 68% 69% 77% 59% 35% 89% 68% 82% 82% 74% 78% 87%Pakistan 44 4,193 16% 70% 69% 51% 29% 87% 72% 73% 79% 68% 57% 94%Sri Lanka 26 1,042 4% 75% 73% 61% 14% 93% 61% 73% 91% 66% 69% 94%SAR Region 235 26,082 100% 71% 76% 55% 31% 89% 68% 79% 81% 70% 70% 89%
Other RegionsAFR Region 582 24,453 17% 55% 64% 30% 25% 85% 66% 74% 65% 59% 52% 78%EAP Region 308 31,372 21% 83% 89% 81% 50% 93% 80% 84% 92% 84% 81% 97%ECA Region 126 15,648 11% 78% 77% 63% 44% 91% 83% 89% 86% 73% 66% 88%LCR Region 312 38,516 26% 71% 73% 64% 40% 87% 65% 75% 78% 65% 69% 93%MNA Region 176 11,067 8% 69% 72% 46% 30% 84% 68% 79% 75% 63% 62% 93%Bank-wide 1739 147,139 100% 68% 76% 59% 38% 89% 71% 79% 80% 70% 68% 90%
Source: OED Database
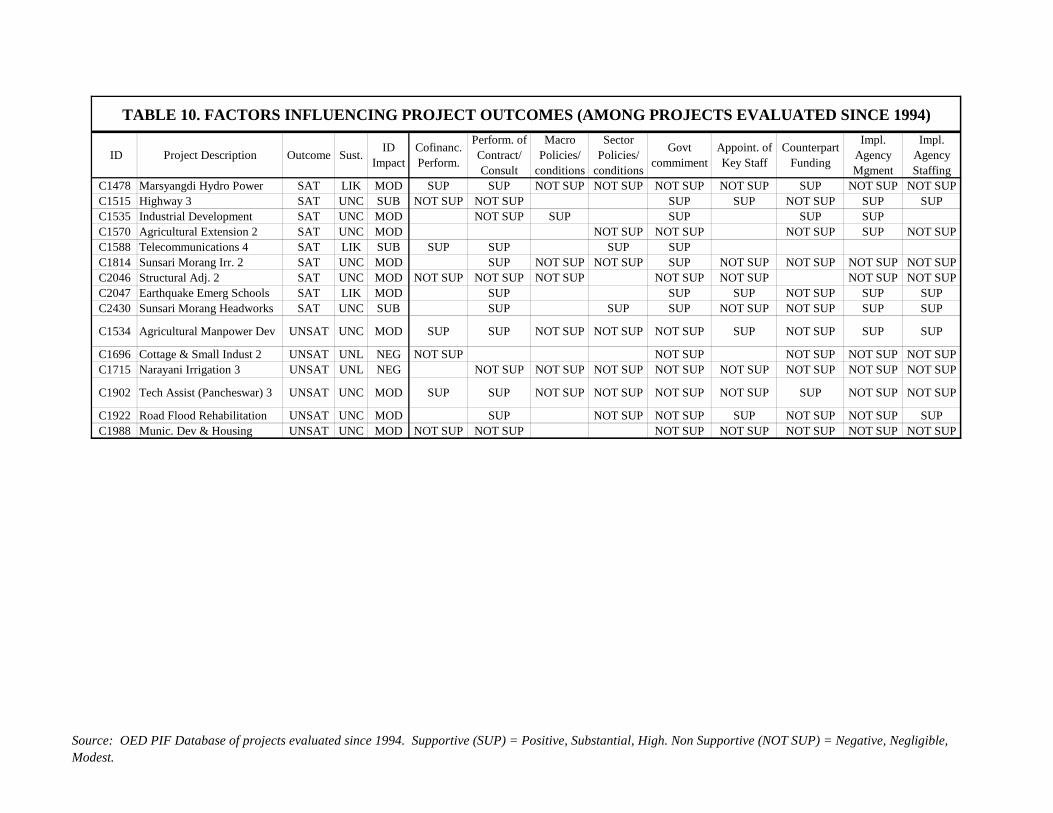
TABLE 10. FACTORS INFLUENCING PROJECT OUTCOMES (AMONG PROJECTS EVALUATED SINCE 1994)
ID Project Description Outcome Sust.ID
ImpactCofinanc.Perform.
Perform. ofContract/Consult
MacroPolicies/
conditions
SectorPolicies/
conditions
Govtcommiment
Appoint. ofKey Staff
CounterpartFunding
Impl.AgencyMgment
Impl.AgencyStaffing
C1478 Marsyangdi Hydro Power SAT LIK MOD SUP SUP NOT SUP NOT SUP NOT SUP NOT SUP SUP NOT SUP NOT SUPC1515 Highway 3 SAT UNC SUB NOT SUP NOT SUP SUP SUP NOT SUP SUP SUPC1535 Industrial Development SAT UNC MOD NOT SUP SUP SUP SUP SUPC1570 Agricultural Extension 2 SAT UNC MOD NOT SUP NOT SUP NOT SUP SUP NOT SUPC1588 Telecommunications 4 SAT LIK SUB SUP SUP SUP SUPC1814 Sunsari Morang Irr. 2 SAT UNC MOD SUP NOT SUP NOT SUP SUP NOT SUP NOT SUP NOT SUP NOT SUPC2046 Structural Adj. 2 SAT UNC MOD NOT SUP NOT SUP NOT SUP NOT SUP NOT SUP NOT SUP NOT SUPC2047 Earthquake Emerg Schools SAT LIK MOD SUP SUP SUP NOT SUP SUP SUPC2430 Sunsari Morang Headworks SAT UNC SUB SUP SUP SUP NOT SUP NOT SUP SUP SUP
C1534 Agricultural Manpower Dev UNSAT UNC MOD SUP SUP NOT SUP NOT SUP NOT SUP SUP NOT SUP SUP SUP
C1696 Cottage & Small Indust 2 UNSAT UNL NEG NOT SUP NOT SUP NOT SUP NOT SUP NOT SUPC1715 Narayani Irrigation 3 UNSAT UNL NEG NOT SUP NOT SUP NOT SUP NOT SUP NOT SUP NOT SUP NOT SUP NOT SUP
C1902 Tech Assist (Pancheswar) 3 UNSAT UNC MOD SUP SUP NOT SUP NOT SUP NOT SUP NOT SUP SUP NOT SUP NOT SUP
C1922 Road Flood Rehabilitation UNSAT UNC MOD SUP NOT SUP NOT SUP SUP NOT SUP NOT SUP SUPC1988 Munic. Dev & Housing UNSAT UNC MOD NOT SUP NOT SUP NOT SUP NOT SUP NOT SUP NOT SUP NOT SUP
Source: OED PIF Database of projects evaluated since 1994. Supportive (SUP) = Positive, Substantial, High. Non Supportive (NOT SUP) = Negative, Negligible,Modest.

TABLE 11. ACTIVE PROJECTS IN NEPAL (as of July 1998)
Proj. Name FY Risk StatusTask Manager
NameMajor Sector
ApprovalDate
Loan$m
Cofinance$m
Cofinancers
MAHAKALI IRRIG. II 1988 No Risk MYINT Agriculture 6/15/1988 41.3HILL COMMUNITY FORES 1989 Potential Risk HILL Agriculture 5/30/1989 30.5 7.4 DANIDA ($6.9m), UNDP ($0.5m)
ENGINEERING EDUC. 1989 Potential Risk PANTH Education 6/22/1989 11.4 12.5 CIDA ($4m), Swiss ($8.5m)
BHAIRAWA LUMBINI III 1990 No Risk MYINT Agriculture 5/29/1990 47.2
URB WATER & SAN REHAB 1991 At Risk LEGRAINWater Supply andSanitation
5/7/1991 60 3.4 UNDP ($3.4m)
POWER EFF IMPROVEMEN 1992 Potential Risk CEYHANElectrical Power andOther Energy
3/26/1992 65 14.7France ($5.1m), Germany ($4.2m), NordicDF ($5.4m)
BASIC & PRIMARY EDUC 1992 No Risk JERIA Education 4/21/1992 30.6 63ADB ($20.2m), DANIDA ($10m), GrantFacility/PHRD - Japan ($1.6m), Japan($13.4m), UNDP($7m), UNICEF ($10.8m)
TELECOMS. V 1992 No Risk CRUZAT Telecommunications 5/12/1992 55 37.5DANIDA (18m), Finnish IDA ($11m),Japan ($8.5m)
HIGHER EDUCATION 1994 At Risk SINCLAIR Education ######## 20POPULATION & HEALTH 1994 Potential Risk DUZA PHN 4/12/1994 26.7
ROAD MAINT.& REHAB. 1994 No Risk HOBAN Transportation 3/15/1994 50.5 16.2 UK ($12.4), Swiss ($2.8), UNDP ($1m)
RURAL WS& SANITATION 1997 No Risk LEGRAINWater Supply andSanitation
9/3/1996 18.3
AGRI RES & EXTENSION 1998 Potential Risk SEREJSKI Agriculture 8/26/1997 24.3IRRIG SECTOR DEVT 1998 No Risk MYINT Agriculture ######## 79.8MULTIMODAL TRANSIT 1998 No Risk HANSEN Transportation ######## 23.5
Source: MIS

TABLE 12: COMPARATIVE LENDING INDICATORS AMONG COMPLETED PROJECTS
Indicator Nepal Sri Lanka Bangladesh Pakistan IndiaSAR
RegionBank-Wide
No. of projects (exit years 1991 - 1996) 25 26 42 44 91 235 1739
Net amount disbursed (1996$m) 576 1,049 2,577 4,193 17,652 26,082 147,139
Average completion delay (months) 31 20 25 27 42 27 21
Percent of commitments cancelled (%) 27% 20% 23% 10% 25% 23% 15%
Average project size (before cancellations) ($m) 23.7 40.3 61.4 85.4 202.0 100.0 81.4
Source: OED
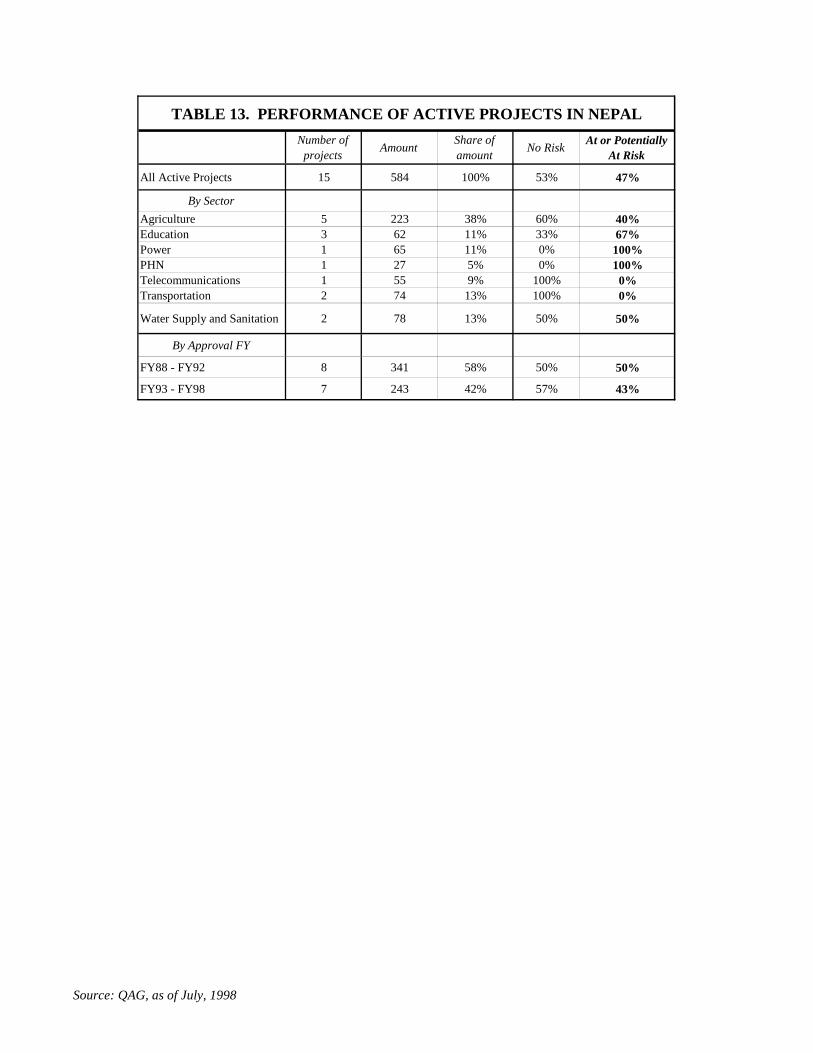
TABLE 13. PERFORMANCE OF ACTIVE PROJECTS IN NEPAL
Number ofprojects
AmountShare ofamount
No RiskAt or Potentially
At Risk
All Active Projects 15 584 100% 53% 47%
By Sector
Agriculture 5 223 38% 60% 40%Education 3 62 11% 33% 67%Power 1 65 11% 0% 100%PHN 1 27 5% 0% 100%Telecommunications 1 55 9% 100% 0%Transportation 2 74 13% 100% 0%
Water Supply and Sanitation 2 78 13% 50% 50%
By Approval FY
FY88 - FY92 8 341 58% 50% 50%
FY93 - FY98 7 243 42% 57% 43%
Source: QAG, as of July, 1998

TABLE 14. BANK ASSISTANCE COST INDICATORS
AverageCompletion
Cost (SYs perproject)
Averagecompletioncost ($ per
project)
Supervisionintensity: (Direct
cost inputs/ No. ofprojects under
supervision in $)
Supervisionintensity: (SYinputs/No. ofprojects under
supervision in SYs)
Averagestaffweeks per
droppedproject (SWs)
Average costper droppedproject ($)
Cost per ESWreport ($)
PeriodAverage
FY90-FY97Average
FY90-FY97Average FY90-
FY98Average FY90-FY98
AverageFY92-FY98
Average FY92-FY98
AverageFY90-FY98
Bank-wide 2.3 328,084 52,252 0.32 32.5 89,304 133,477
Africa 2.2 313,679 55,934 0.34 30.4 79,558 111,726
South Asia 3.0 401,453 57,888 0.40 57.0 147,242 178,087
Bangladesh 4.5 555,583 65,427 0.51 51.5 110,162 166,422
India 2.9 385,584 53,823 0.43 61.3 154,032 287,610
Nepal 2.1 280,491 51,537 0.35 146.8 423,845 187,304
Pakistan 2.8 389,809 55,265 0.39 39.0 117,010 119,703
Sri Lanka 1.8 273,163 44,103 0.27 34.4 89,029 133,774
Source: PBD
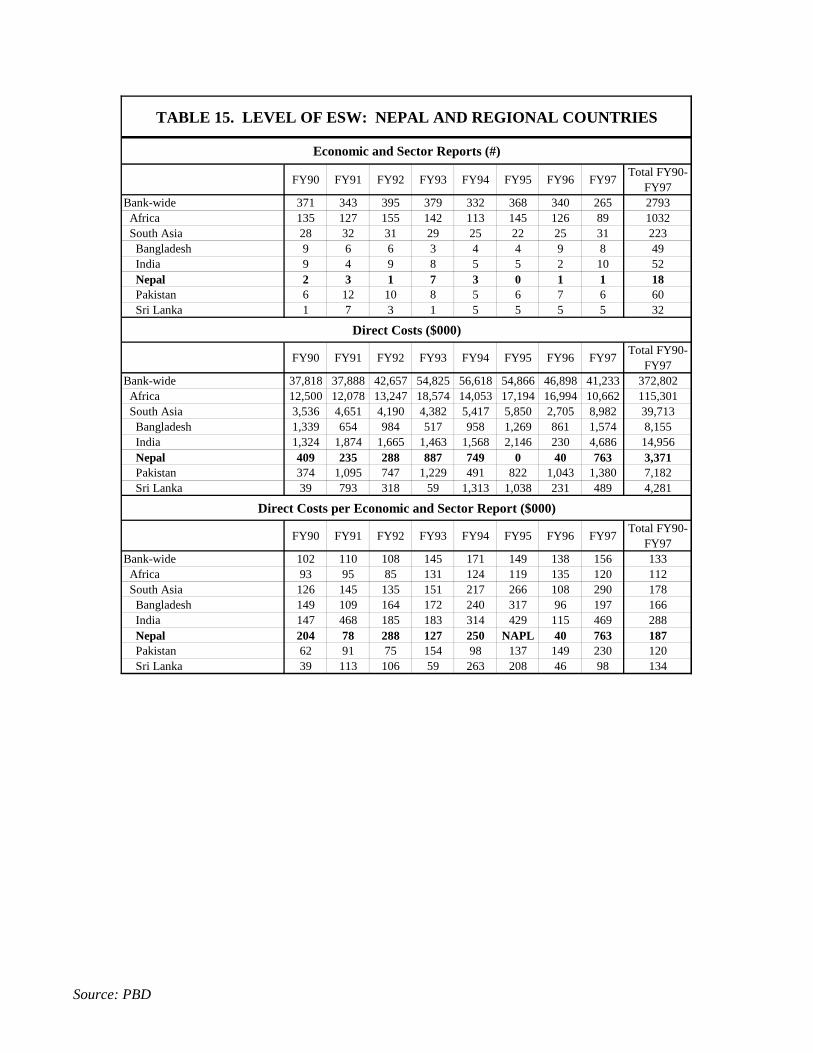
TABLE 15. LEVEL OF ESW: NEPAL AND REGIONAL COUNTRIES
Economic and Sector Reports (#)
FY90 FY91 FY92 FY93 FY94 FY95 FY96 FY97Total FY90-
FY97Bank-wide 371 343 395 379 332 368 340 265 2793
Africa 135 127 155 142 113 145 126 89 1032South Asia 28 32 31 29 25 22 25 31 223
Bangladesh 9 6 6 3 4 4 9 8 49India 9 4 9 8 5 5 2 10 52Nepal 2 3 1 7 3 0 1 1 18Pakistan 6 12 10 8 5 6 7 6 60Sri Lanka 1 7 3 1 5 5 5 5 32
Direct Costs ($000)
FY90 FY91 FY92 FY93 FY94 FY95 FY96 FY97Total FY90-
FY97Bank-wide 37,818 37,888 42,657 54,825 56,618 54,866 46,898 41,233 372,802
Africa 12,500 12,078 13,247 18,574 14,053 17,194 16,994 10,662 115,301South Asia 3,536 4,651 4,190 4,382 5,417 5,850 2,705 8,982 39,713
Bangladesh 1,339 654 984 517 958 1,269 861 1,574 8,155India 1,324 1,874 1,665 1,463 1,568 2,146 230 4,686 14,956Nepal 409 235 288 887 749 0 40 763 3,371Pakistan 374 1,095 747 1,229 491 822 1,043 1,380 7,182Sri Lanka 39 793 318 59 1,313 1,038 231 489 4,281
Direct Costs per Economic and Sector Report ($000)
FY90 FY91 FY92 FY93 FY94 FY95 FY96 FY97Total FY90-
FY97Bank-wide 102 110 108 145 171 149 138 156 133
Africa 93 95 85 131 124 119 135 120 112South Asia 126 145 135 151 217 266 108 290 178
Bangladesh 149 109 164 172 240 317 96 197 166India 147 468 185 183 314 429 115 469 288Nepal 204 78 288 127 250 NAPL 40 763 187Pakistan 62 91 75 154 98 137 149 230 120Sri Lanka 39 113 106 59 263 208 46 98 134
Source: PBD

TABLE 16: LIST OF FORMAL ESW ON NEPAL, FY90-FY98
FY98
17034 ER 11/11/97 Nepal - 1997 Economic update: the challenge of accelerating economic growth
FY97
FY96
(15508 CAS 04/30/96 Nepal - Country assistance strategy)
FY95
14580 SR 06/09/95 Nepal - Employment and the labor force : the coming crisis
12243 SR 08/26/94 Nepal - Critical issues in secondary education and options for reform
FY94
12281 ER 03/17/94 Nepal - Fiscal restructuring and public resource management in the nineties
11800 SR 02/01/94 Selected issues in infrastructure development - Nepal
FY93
12063 SR 06/01/93 Civil service reform : an agenda for action - Nepal
11479 SR 02/01/93 Water supply and sanitation sector issues paper - Nepal
10988 SR 01/01/93 Nepal - Expenditures in the road sector
11565 SR 12/01/92 Nepal - Infrastructure development
FY92
10324 ER 03/01/92 Nepal - Public resource management in a resource scarce economy
FY91
9076 SR 01/01/91 Nepal - Nonfinancial public enterprises sector report
8635 ER 08/01/90 Nepal - Relieving poverty in a resource-scarce economy
FY90
8352 ER 03/30/90 Nepal - Maintaining structural reforms and managing public resources
7693 SR 03/01/90 Nepal - Agricultural sector review

TABLE 17: BANK MANAGEMENT FOR NEPAL: 1990 - 1997
Year Vice President Country DirectorCountry Operations
Division ChiefResident Representative
1990 Attila Karaosmanoglu Shinji Asanuma Yukon Huang Nigel Roberts
1991 Attila Karaosmanoglu Jochen Kraske Yukon Huang Nigel Roberts
1992 Attila Karaosmanoglu Ann Hamilton Yukon Huang Nigel Roberts
1993 D. Joseph Wood Ann Hamilton Fred Kilby Joe Manickavagasam
1994 D. Joseph Wood Ann Hamilton Fred Kilby Joe Manickavagasam
1995 D. Joseph Wood Heinz Vergin Pradeep Mitra Joe Manickavagasam
1996 D. Joseph Wood Robert Drysdale Luis Ernesto Derbez Joe Manickavagasam
1997 Mieko Nishimizu Hans Rothenbühler Luis Ernesto Derbez Hans Rothenbühler (CD)
1998 Mieko Nishimizu Hans Rothenbühler Roberto Zagha Hans Rothenbühler (CD)
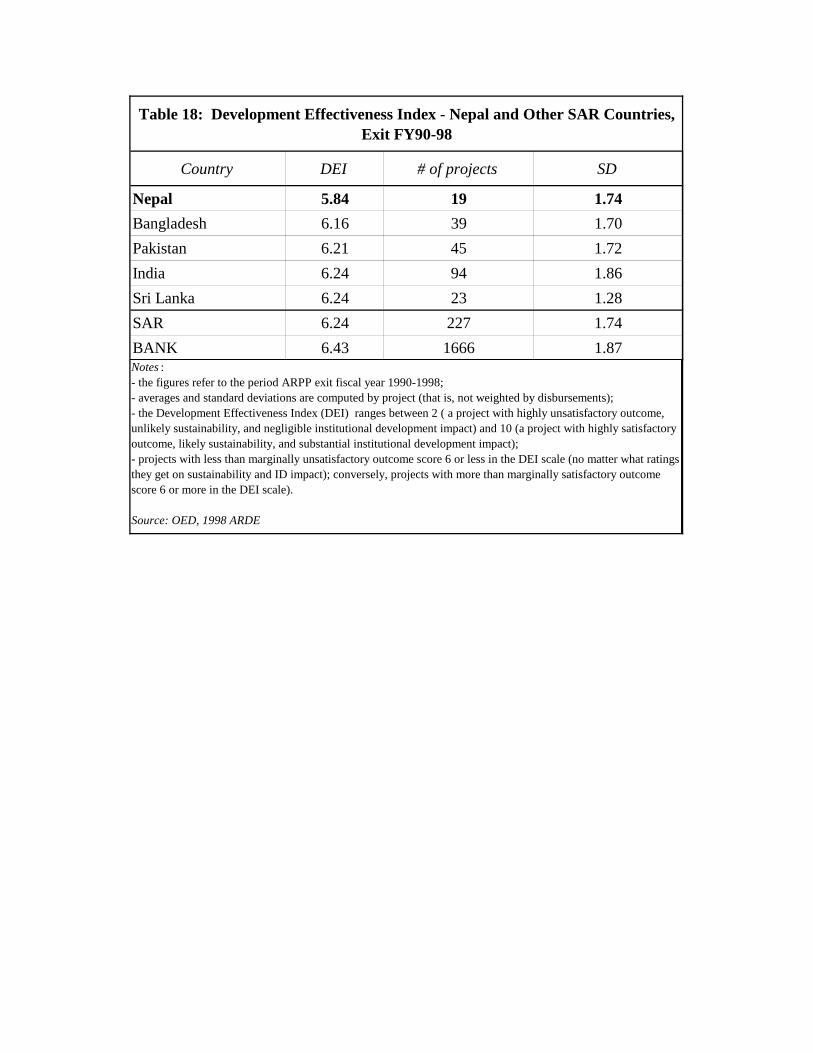
Table 18: Development Effectiveness Index - Nepal and Other SAR Countries,Exit FY90-98
Country DEI # of projects SD
Nepal 5.84 19 1.74
Bangladesh 6.16 39 1.70
Pakistan 6.21 45 1.72
India 6.24 94 1.86
Sri Lanka 6.24 23 1.28
SAR 6.24 227 1.74
BANK 6.43 1666 1.87Notes :- the figures refer to the period ARPP exit fiscal year 1990-1998;- averages and standard deviations are computed by project (that is, not weighted by disbursements);- the Development Effectiveness Index (DEI) ranges between 2 ( a project with highly unsatisfactory outcome,unlikely sustainability, and negligible institutional development impact) and 10 (a project with highly satisfactoryoutcome, likely sustainability, and substantial institutional development impact);- projects with less than marginally unsatisfactory outcome score 6 or less in the DEI scale (no matter what ratingsthey get on sustainability and ID impact); conversely, projects with more than marginally satisfactory outcomescore 6 or more in the DEI scale).
Source: OED, 1998 ARDE


