12
Nestlé Group 2011 The World’s leading Nutrition, Health and Wellness Company

Nestlé Group 2011
The World’s leading Nutrition, Health and Wellness Company

In millions of CHF
Sales
Trading operating profit
as % of sales
Profit for the period attributable to shareholders of the parent (Net profit)
as % of sales
Equity attributable to shareholders of the parent (a)
Market capitalisation, end December
Operating cash flow
Free cash flow (b)
Capital expenditure
as % of sales
Net financial debt
Ratio of net financial debt to equity (gearing)
Key figures (consolidated)
2011
83 642
12 538
15.0%
9 487
11.3%
56 797
171 287
9 763
4 491
4 779
5.7%
14 319
25.2%
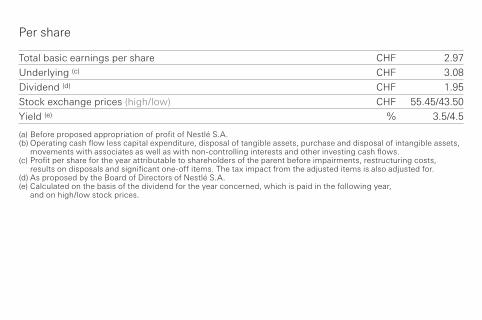
Total basic earnings per share CHF
Underlying (c) CHF
Dividend (d) CHF
Stock exchange prices (high/low) CHF
Yield (e) %
(a) Before proposed appropriation of profit of Nestlé S.A.(b) Operating cash flow less capital expenditure, disposal of tangible assets, purchase and disposal of intangible assets,
movements with associates as well as with non-controlling interests and other investing cash flows.(c) Profit per share for the year attributable to shareholders of the parent before impairments, restructuring costs,
results on disposals and significant one-off items. The tax impact from the adjusted items is also adjusted for. (d) As proposed by the Board of Directors of Nestlé S.A.(e) Calculated on the basis of the dividend for the year concerned, which is paid in the following year,
and on high/low stock prices.
Per share
2.97
3.08
1.95
55.45/43.50
3.5/4.5

Analysis of sales, trading operating profit and organic growth (OG)
By operating segment
In millions of CHF
Zone Europe
Zone Americas
Zone Asia, Oceania and Africa
Nestlé Waters
Nestlé Nutrition
Other (a)
Unallocated items (b)
Total Group
OG
4.0%
6.2%
11.9%
5.2%
7.3%
11.4%
7.5%
Trading
operatingprofit
2 372
4 922
2 892
520
1 443
2 119
(1 730)
12 538
Sales
15 243
26 756
15 291
6 520
7 233
12 599
83 642

By product
In millions of CHF
Powdered and Liquid Beverages
Water
Milk products and Ice cream
Nutrition and HealthCare (c)
Prepared dishes and cooking aids
Confectionery
PetCare
Unallocated items (b)
Total Group
(a) Mainly Nespresso, Nestlé Professional, Nestlé Health Science, Food and Beverages Joint Ventures and Pharma Joint Ventures managed on a worldwide basis.
(b) Mainly corporate expenses as well as research and development costs. (c) Includes Pharmaceutical products, previously disclosed separately.
OG
13.0%
5.2%
8.4%
7.7%
4.6%
5.4%
4.3%
7.5%
Trading
operatingprofit
4 129
520
2 251
1 820
2 016
1 524
2 008
(1 730)
12 538
Sales
18 204
6 526
16 406
9 744
13 933
9 065
9 764
83 642

www.nestle.com
Contact
MediaNestlé S.A.
Corporate Media Relations
Avenue Nestlé 55
CH-1800 Vevey (Switzerland)
Tel. +41 (0)21 924 22 00
Fax +41 (0)21 922 63 34
InvestorsNestlé S.A.
Investor Relations
Avenue Nestlé 55
CH-1800 Vevey (Switzerland)
Tel. +41 (0)21 924 35 09
Fax +41 (0)21 924 28 13
ShareholdersShare register: registration,
transfers, address changes,
dividends, etc.
Nestlé S.A.
Share Transfer Office
Zugerstrasse 8
CH-6330 Cham (Switzerland)
Tel. +41 (0)41 785 20 20
Fax +41 (0)41 785 20 24

Company profile
Nestlé has 461 factories in 83 countries around the world and 328 000 employees.
Employees by geographic area
Europe (a)
Americas
Asia, Oceania and Africa
Total
(a) 9699 employees in Switzerland in 2011.
Factories by geographic area
Europe
Americas
Asia, Oceania and Africa
Total
2011
152
171
138
461
2011
28.9%
33.7%
37.4%
100.0%

1866 Foundation of Anglo-Swiss Condensed Milk Co. 1867 Henri Nestlé’s Infant cereal developed1905 Nestlé and Anglo-Swiss Condensed Milk Co. (new name after merger)1929 Merger with Peter, Cailler, Kohler Chocolats Suisses S.A.1934 Launch of Milo1938 Launch of Nescafé1947 Nestlé Alimentana S.A. (new name after merger with Maggi)1948 Launch of Nestea and Nesquik1969 Vittel (initially equity interest only)1971 Merger with Ursina-Franck1973 Stouffer (with Lean Cuisine)1974 L’Oréal (associate)1977 Nestlé S.A. (new name), Alcon (disposed in August 2010)1981 Galderma (joint venture with L’Oréal)1985 Carnation (with Coffee-mate and Friskies)1986 Creation of Nestlé Nespresso S.A. and Herta1988 Buitoni-Perugina and Rowntree (with KitKat)1990 Cereal Partners Worldwide (joint venture with General Mills)
The Nestlé Story – all the way to Nutrition, Health and Wellness

1991 Beverage Partners Worldwide (joint venture with Coca-Cola)1992 Perrier (with Poland Spring)1993 Creation of Nestlé Sources Internationales (2002: Nestlé Waters)1997 Creation of Nutrition Strategic Business Division (2006: Nestlé Nutrition)1998 Sanpellegrino and Spillers Petfoods, launch of Nestlé Pure Life2000 PowerBar2001 Ralston Purina2002 Schöller, Chef America and Dairy Partners Americas (joint venture with Fonterra) Laboratoires innéov (joint venture with L’Oréal)2003 Mövenpick and Dreyer’s2005 Wagner, Protéika and Musashi2006 Creation of FoodServices Strategic Business Division (2009: Nestlé Professional) Lactalis Nestlé Produits Frais (associate) Jenny Craig, Uncle Tobys and Delta Ice Cream2007 Novartis Medical Nutrition, Gerber and Henniez2008 Ruzanna2010 Kraft Food’s frozen pizza, Waggin’Train, Malher, Technocom and Vitaflo2011 Creation of Nestlé Health Science and Nestlé Institute of Health Sciences Yinlu, Hsu Fu Chi (partnerships)
Our ambitionAs the leading Nutrition, Health and Wellness Company we enhance lives by offering
tastier and healthier food and beverage choices at all stages of life and at any time of the day,
helping consumers care for themselves and their families. This is the foundation of our
promise of Good Food, Good Life and puts nutrition at the heart of everything we do.
It is our firm belief that, for a company to be successful over time and create value for
its shareholders, it must also create value for society. We call this “Creating Shared Value”.
Built on strong foundations of compliance and sustainable business practices, this is our
way to do business and to be the trusted leader in Nutrition, Health and Wellness.
Our brandsOur unrivalled portfolio of brands and high-quality products enables us to be present in the
day-to-day life of our consumers, from morning to evening and at every stage in their lives.
Around 70% of our total sales come from brands that generate over CHF 1 billion each in sales.

Powdered and Liquid Beverages
Milk products
Prepared dishes and cooking aids
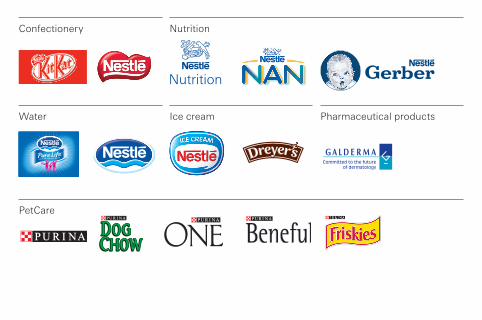
Nutrition
Confectionery
PetCare
Pharmaceutical productsIce cream
Nutrition
Water


