Page 1
14-Nov-17
Key Highlights of the Report:
52wk Range H/L
Mkt Capital (Rs Cr)
Av. Volume (,000)
Financials/Valu
ation
CY15 CY16 CY17E CY18E FY19ENet Sales 8,175 9,224 10,016 11,178 12,851
EBITDA 1,555 1,807 2,085 2,333 2,772
EBIT 1,208 1,453 1,740 1,979 2,419
PAT 563 927 1,180 1,353 1,663
3QCY17 2QCY17 1QCY17 EPS (Rs) 58 96 122 140 173
Promoters 62.8 62.8 62.8 EPS growth (%) -52% 64% 27% 15% 23%
Public 37.2 37.2 37.2 ROE (%) 32% 31% 34% 36% 39%
Total 100.0 100.0 100.0 ROCE (%) 43% 48% 50% 52% 57%
BV 292 313 346 384 430
P/B (X) 17 20 21 22 20
1Mn 3Mn 1Yr P/E (x) 99 68 63 55 45
Absolute 5.8 14.6 19.6
Rel.to Nifty 3.4 12.9 (0.1) Recent development and launches:
INDUSTRY - Con. Staples
The company has launched Maggi Nutri-licious Noodles, Milkybar and Kit
Kat dessert delight in this quarter.
NESTLE SA has set up Nestle Food Safety Institute (NFSI) in India in
Q3CY17.
It has tied up with e-commerce player Amazon for the launch of its new
range of popular Maggi noodles.
BLOOMBERG -
10225
NEST IN
BSE Code - 500790
NSE Code - NESTLEIND
Nestle India has launched new range of Noodles Maggi Masala in India in
Q2CY17. The new range of MAGGI noodles includes four new flavors.
The Company has introduced Milo Ready to drink – the sports partner for
kids in 1QCY17.
Domestic revenue grew by 3.7% (on comparable basis at 9.1%) led by
increase in volume supported by new launches and better realization.
Exports has shown recovery and grew by 2.6% to Rs 160 cr as compared
to decline of 12% in Q2CY17.
EBITDA margin improved by 334 bps YoY and 465 bps QoQ led by lower
other expenses and GST related changes.
Company’s thrust on launching new products in each category, focus on
cost efficiency with rationalization of process and benefits driven by urban
demand recovery makes us positive on NESTLE. We value it at 49 times
of FY19’s expected EPS and maintain BUY with the target price of Rs
8450.
Target Price 8450
Previous Target Price 7500
NIFTY -
CMP 7715
NESTLE has posted result better than our expectations, sales grew by
3% YoY while PAT has shown a handsome growth of 23% YoY.
52
Upside 10%
8000/5750
RoE & ROCE
74,381
RAJEEV [email protected]
Narnolia Securities LtdPlease refer to the Disclaimers at the end of this Report
Company Data
Stock Performance %
Shareholding patterns %
80
85
90
95
100
105
110
115
120
125 NESTLEIND NIFTY
32.3% 31.4%34.4% 35.7%
39.2%
42.6%
47.7%50.3% 51.7%
56.6%
0.0%
10.0%
20.0%
30.0%
40.0%
50.0%
60.0%
70.0%
CY15 CY16 CY17E CY18E FY19E
ROE ROCE
Page 2
Financials 3QCY16 4QCY16 1QCY17 2QCY17 3QCY17 YoY % QoQ% CY15 CY16 YoY %
Net Sales 2,430 2,286 2,592 2,485 2,514 3% 1% 8,175 9,224 13%
Other Income 37 41 42 41 43 15% 4% 110 149 36%
COGS 986 959 1,094 1,079 1,085 10% 1% 3,469 3,880 12%
Net Provi. For Contin. 10 9 10 (3) (0) -101% -97%
Employee Cost 234 294 246 253 263 12% 4% 913 1,073 18%
Other Expenses 620 617 625 611 576 -7% -6% 2,147 2,410 12%
EBITDA 483 403 517 462 584 21% 26% 1,555 1,807 16%
Depreciation 88 87 87 85 86 -2% 1% 347 354 2%
Interest (22) 0 (23) (23) (23) 4% 0% 3 4 34%
PBT 410 276 450 395 518 26% 31% 814 1,440 77%
Tax 132 113 143 131 175 32% 33% 250 519 107%
PAT 278 164 307 263 343 23% 30% 563 921 63%
Better revenue growth led by better domestic business performance
Narnolia Securities LtdPlease refer to the Disclaimers at the end of this Report
Quarterly Performance
NESTLE’s revenue for this quarter grew by 3% YoY to Rs 2514 cr led by better domestic revenue
growth.
Domestic revenue grew by 3.7% (on comparable basis at 9.1%) to Rs 2341 cr led by increase in
volume supported by new launches and better realization.
Exports has shown recovery and grew by 2.6% to Rs 160 cr as compared to decline of 12% in
Q2CY17.
EBITDA margin improved by 334 bps YoY and 465 bps QoQ led by lower other expenses and GST
related changes.Other expenses declined by 261 bps YoY to 22.9%.
The company has reported PAT growth of 23% YoY to Rs 343 cr while PAT margin has improved
by 219 bps YoY to 13.6%.
Provisioning for Taxes has increased by 155 bps YoY to 33.7% in Q3CY17.
21.8%
19.2%
15.3%
18.0%
21.7%20.6%19.9%
17.6%
20.0%18.6%
23.2%
12.3%
-3.3%
7.1%
9.3%
12.1%10.4%
11.5%
7.2%
11.8%10.6%
13.6%
-5.0%
0.0%
5.0%
10.0%
15.0%
20.0%
25.0%
OPM NPM
25
16
19
57
17
42
19
59
23
68
23
17
24
30
22
86
25
92
24
85
25
14
309
-64
124
183
287
240278
164
307
263
343
-100-50050100150200250300350400
0
500
1000
1500
2000
2500
3000
NESTLE's Sales(in cr) PAT(in cr)
Page 3
View & Valuation
Narnolia Securities LtdPlease refer to the Disclaimers at the end of this Report
NESTLE has posted result better than our expectations, sales grew by 3% YoY while PAT has shown
a handsome growth of 23%. Domestic revenue grew by 3.7% (on comparable basis at 9.1%) led by
increase in volume supported by new launches and better realization. The company has launched
more than 40 products in last 1-2 year. Going forward, we expect it to continue as its parent has huge
product portfolio. Secondly, company’s most of the sales come from urban markets, approx. 75%,
hence any recovery in urban demand will impact it positively. Maggi is also doing well and
consolidating its market share. New product launches will reduce company’s overdependence on
single product thus ensure stability of cash flows. Company’s thrust on launching new products in
each category, focus on cost efficiency with rationalization of process and benefits driven by urban
demand recovery makes us positive on NESTLE. We value it at 49 times of FY19’s expected EPS and
maintain BUY with the revised target price of Rs 8450.
Urban demand recovery led growth going forward: For last four years urban demand is
struggling due to higher inflation and lower economic activities which is one of the causes of
company’s dismal performance. As NESTLE’s most of the sales comes from urban areas,
approx. 75%, hence any recovery in urban demand will be huge positive for the company. We
expect better demand scenario for urban market going ahead led by declining inflation and
interest rate. Hence we have positive view on NESTLE.
Smart bounce back by Maggie shows strong brand value: Nestle re-launched Maggie on
9 Nov., 2015 and within 53 days of re-launch, it regained market share of 33% which shows
strong brand power. Presently, Maggie’s market share has reached to 60% versus peak
market share of 75% which is commendable. It shows new management’s aggression and
focus towards NESTLE’s future growth. Going forward we expect brand Maggie to consolidate
further with more market share gain.
NESTLE didn’t take price hike in CY16. Prepared Dishes(includes Maggi) Volume and
growth.
Investment Arguments:
New product launches, the key of future growth:After Maggie fiasco, company’s new
management has become more aggressive in launching new products. The company has
launched more than 40 products in last 1-2 year. NESTLE has strong backing of its parent
with more than 2000 products globally .Going forward, it has plans to launch more new
products from its parent’s global product portfolio. New product launches will improve
company’s volume going forward.
Historically NESTLE has strong pricing power: As in most the FMCG categories input
prices have bottomed out and have started moving up. Hence going forward we expect growth
for FMCG will be pricing led. NESTLE has strong premium product portfolio and strong pricing
power.
8%
5%2%
13%11%
7%9%
31%
-11%
-15%
-10%
-5%
0%
5%
10%
15%
20%
25%
30%
35%
Overall Realization growth YoY
122
159
193
219
237
245
255
103
178
25%30%
22%13%
8% 4% 4%
-59%
73%
-80%
-60%
-40%
-20%
0%
20%
40%
60%
80%
0
50
100
150
200
250
300
Prepared Dishes Vol.(in 000' MT) Vol. Growth YoY
Page 4
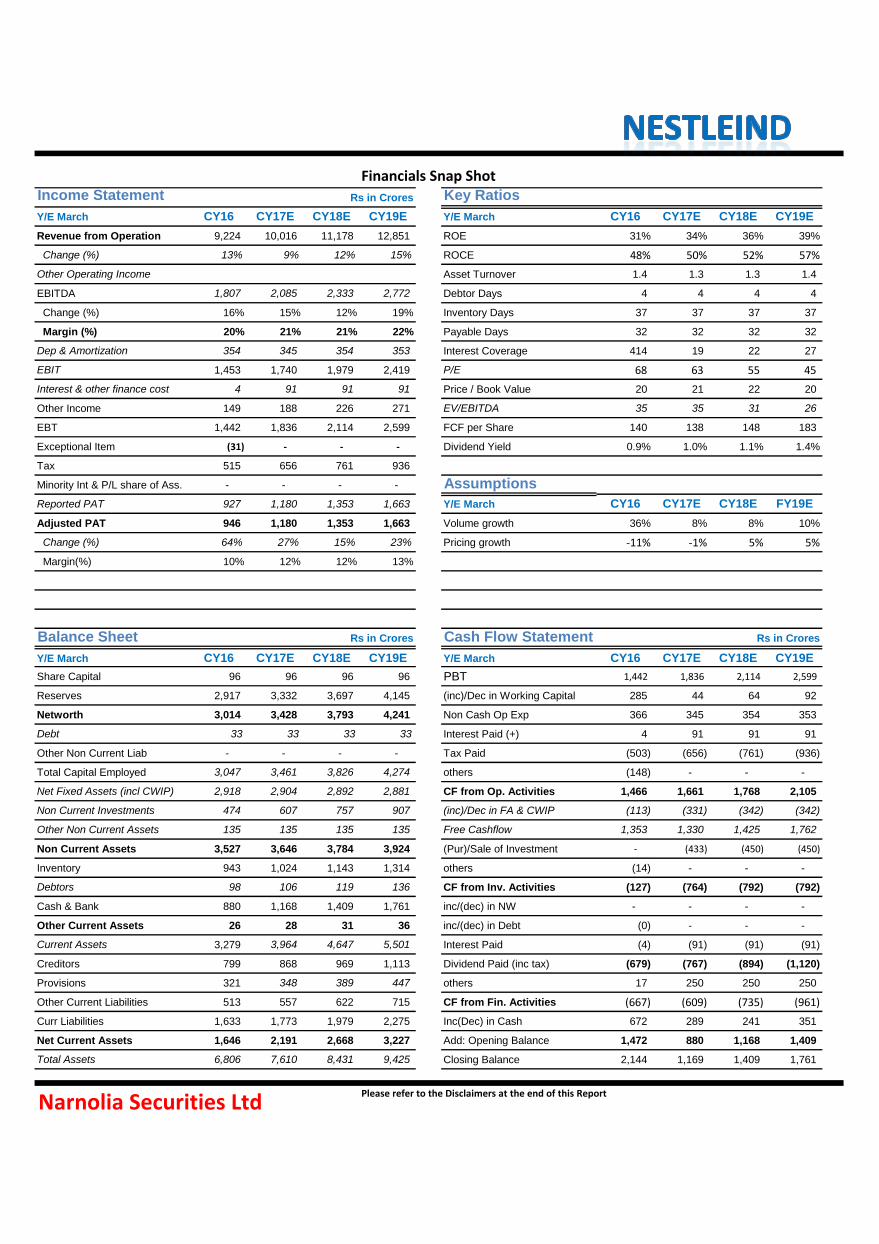
Income Statement Rs in Crores Key Ratios
Y/E March CY16 CY17E CY18E CY19E Y/E March CY16 CY17E CY18E CY19E
Revenue from Operation 9,224 10,016 11,178 12,851 ROE 31% 34% 36% 39%
Change (%) 13% 9% 12% 15% ROCE 48% 50% 52% 57%
Other Operating Income Asset Turnover 1.4 1.3 1.3 1.4
EBITDA 1,807 2,085 2,333 2,772 Debtor Days 4 4 4 4
Change (%) 16% 15% 12% 19% Inventory Days 37 37 37 37
Margin (%) 20% 21% 21% 22% Payable Days 32 32 32 32
Dep & Amortization 354 345 354 353 Interest Coverage 414 19 22 27
EBIT 1,453 1,740 1,979 2,419 P/E 68 63 55 45
Interest & other finance cost 4 91 91 91 Price / Book Value 20 21 22 20
Other Income 149 188 226 271 EV/EBITDA 35 35 31 26
EBT 1,442 1,836 2,114 2,599 FCF per Share 140 138 148 183
Exceptional Item (31) - - - Dividend Yield 0.9% 1.0% 1.1% 1.4%
Tax 515 656 761 936
Minority Int & P/L share of Ass. - - - - Assumptions
Reported PAT 927 1,180 1,353 1,663 Y/E March CY16 CY17E CY18E FY19E
Adjusted PAT 946 1,180 1,353 1,663 Volume growth 36% 8% 8% 10%
Change (%) 64% 27% 15% 23% Pricing growth -11% -1% 5% 5%
Margin(%) 10% 12% 12% 13%
Balance Sheet Rs in Crores Cash Flow Statement Rs in Crores
Y/E March CY16 CY17E CY18E CY19E Y/E March CY16 CY17E CY18E CY19E
Share Capital 96 96 96 96 PBT 1,442 1,836 2,114 2,599
Reserves 2,917 3,332 3,697 4,145 (inc)/Dec in Working Capital 285 44 64 92
Networth 3,014 3,428 3,793 4,241 Non Cash Op Exp 366 345 354 353
Debt 33 33 33 33 Interest Paid (+) 4 91 91 91
Other Non Current Liab - - - - Tax Paid (503) (656) (761) (936)
Total Capital Employed 3,047 3,461 3,826 4,274 others (148) - - -
Net Fixed Assets (incl CWIP) 2,918 2,904 2,892 2,881 CF from Op. Activities 1,466 1,661 1,768 2,105
Non Current Investments 474 607 757 907 (inc)/Dec in FA & CWIP (113) (331) (342) (342)
Other Non Current Assets 135 135 135 135 Free Cashflow 1,353 1,330 1,425 1,762
Non Current Assets 3,527 3,646 3,784 3,924 (Pur)/Sale of Investment - (433) (450) (450)
Inventory 943 1,024 1,143 1,314 others (14) - - -
Debtors 98 106 119 136 CF from Inv. Activities (127) (764) (792) (792)
Cash & Bank 880 1,168 1,409 1,761 inc/(dec) in NW - - - -
Other Current Assets 26 28 31 36 inc/(dec) in Debt (0) - - -
Current Assets 3,279 3,964 4,647 5,501 Interest Paid (4) (91) (91) (91)
Creditors 799 868 969 1,113 Dividend Paid (inc tax) (679) (767) (894) (1,120)
Provisions 321 348 389 447 others 17 250 250 250
Other Current Liabilities 513 557 622 715 CF from Fin. Activities (667) (609) (735) (961)
Curr Liabilities 1,633 1,773 1,979 2,275 Inc(Dec) in Cash 672 289 241 351
Net Current Assets 1,646 2,191 2,668 3,227 Add: Opening Balance 1,472 880 1,168 1,409
Total Assets 6,806 7,610 8,431 9,425 Closing Balance 2,144 1,169 1,409 1,761
Financials Snap Shot
Narnolia Securities LtdPlease refer to the Disclaimers at the end of this Report
Page 5
Narnolia Securities Ltd201 | 2nd Floor | Marble Arch Build ing | 236B-AJC Bose
Road | Kolkata-700 020 , Ph : 033-40501500
email: [email protected] ,
website : www.narnolia.com
Risk Disclosure & Disclaimer: This report/message is for the personal information of
the authorized recipient and does not construe to be any investment, legal or taxation
advice to you. Narnolia Securities Ltd. (Hereinafter referred as NSL) is not soliciting any
action based upon it. This report/message is not for public distribution and has been
furnished to you solely for your information and should not be reproduced or
redistributed to any other person in any from. The report/message is based upon publicly
available information, findings of our research wing “East wind” & information that we
consider reliable, but we do not represent that it is accurate or complete and we do not
provide any express or implied warranty of any kind, and also these are subject to change
without notice. The recipients of this report should rely on their own investigations,
should use their own judgment for taking any investment decisions keeping in mind that
past performance is not necessarily a guide to future performance & that the the value of
any investment or income are subject to market and other risks. Further it will be safe to
assume that NSL and /or its Group or associate Companies, their Directors, affiliates
and/or employees may have interests/ positions, financial or otherwise, individually or
otherwise in the recommended/mentioned securities/mutual funds/ model funds and
other investment products which may be added or disposed including & other mentioned
in this report/message.