50
NetIQ® AppManager® for Cisco Integrated Contact Distribution Management Guide February 2012

NetIQ® AppManager® for Cisco Integrated Contact Distribution
Management Guide
February 2012

Legal Notice
THIS DOCUMENT AND THE SOFTWARE DESCRIBED IN THIS DOCUMENT ARE FURNISHED UNDER AND ARE SUBJECT TO THE TERMS OF A LICENSE AGREEMENT OR A NON-DISCLOSURE AGREEMENT. EXCEPT AS EXPRESSLY SET FORTH IN SUCH LICENSE AGREEMENT OR NON-DISCLOSURE AGREEMENT, NETIQ CORPORATION PROVIDES THIS DOCUMENT AND THE SOFTWARE DESCRIBED IN THIS DOCUMENT "AS IS" WITHOUT WARRANTY OF ANY KIND, EITHER EXPRESS OR IMPLIED, INCLUDING, BUT NOT LIMITED TO, THE IMPLIED WARRANTIES OF MERCHANTABILITY OR FITNESS FOR A PARTICULAR PURPOSE. SOME STATES DO NOT ALLOW DISCLAIMERS OF EXPRESS OR IMPLIED WARRANTIES IN CERTAIN TRANSACTIONS; THEREFORE, THIS STATEMENT MAY NOT APPLY TO YOU.
This document and the software described in this document may not be lent, sold, or given away without the prior written permission of NetIQ Corporation, except as otherwise permitted by law. Except as expressly set forth in such license agreement or non-disclosure agreement, no part of this document or the software described in this document may be reproduced, stored in a retrieval system, or transmitted in any form or by any means, electronic, mechanical, or otherwise, without the prior written consent of NetIQ Corporation. Some companies, names, and data in this document are used for illustration purposes and may not represent real companies, individuals, or data.
This document could include technical inaccuracies or typographical errors. Changes are periodically made to the information herein. These changes may be incorporated in new editions of this document. NetIQ Corporation may make improvements in or changes to the software described in this document at any time.
© 2012 NetIQ Corporation. All rights reserved.
U.S. Government Restricted Rights: If the software and documentation are being acquired by or on behalf of the U.S. Government or by a U.S. Government prime contractor or subcontractor (at any tier), in accordance with 48 C.F.R. 227.7202-4 (for Department of Defense (DOD) acquisitions) and 48 C.F.R. 2.101 and 12.212 (for non-DOD acquisitions), the government’s rights in the software and documentation, including its rights to use, modify, reproduce, release, perform, display or disclose the software or documentation, will be subject in all respects to the commercial license rights and restrictions provided in the license agreement.
Check Point, FireWall-1, VPN-1, Provider-1, and SiteManager-1 are trademarks or registered trademarks of Check Point Software Technologies Ltd.
ActiveAudit, ActiveView, Aegis, AppManager, Change Administrator, Change Guardian, Compliance Suite, the cube logo design, Directory and Resource Administrator, Directory Security Administrator, Domain Migration Administrator, Exchange Administrator, File Security Administrator, Group Policy Administrator, Group Policy Guardian, Group Policy Suite, IntelliPolicy, Knowledge Scripts, NetConnect, NetIQ, the NetIQ logo, PSAudit, PSDetect, PSPasswordManager, PSSecure, Secure Configuration Manager, Security Administration Suite, Security Manager, Server Consolidator, VigilEnt, and Vivinet are trademarks or registered trademarks of NetIQ Corporation or its subsidiaries in the USA. All other company and product names mentioned are used only for identification purposes and may be trademarks or registered trademarks of their respective companies.
For purposes of clarity, any module, adapter or other similar material ("Module") is licensed under the terms and conditions of the End User License Agreement for the applicable version of the NetIQ product or software to which it relates or interoperates with, and by accessing, copying or using a Module you agree to be bound by such terms. If you do not agree to the terms of the End User License Agreement you are not authorized to use, access or copy a Module and you must destroy all copies of the Module and contact NetIQ for further instructions.

Contents
About this Book and the Library 5About NetIQ Corporation 7
1 Introducing AppManager for Cisco Integrated Contact Distribution 9
1.1 Features and Benefits . . . . . . . . . . . . . . . . . . . . . . . . . . . . . . . . . . . . . . . . . . . . . . . . . . . . . . . . . . . . . 91.2 Counting AppManager Licenses . . . . . . . . . . . . . . . . . . . . . . . . . . . . . . . . . . . . . . . . . . . . . . . . . . . . . 9
2 Installing AppManager for Cisco Integrated Contact Distribution 11
2.1 System Requirements . . . . . . . . . . . . . . . . . . . . . . . . . . . . . . . . . . . . . . . . . . . . . . . . . . . . . . . . . . . . 112.2 Installing the Module . . . . . . . . . . . . . . . . . . . . . . . . . . . . . . . . . . . . . . . . . . . . . . . . . . . . . . . . . . . . . 122.3 Deploying the Module with Control Center. . . . . . . . . . . . . . . . . . . . . . . . . . . . . . . . . . . . . . . . . . . . . 132.4 Silently Installing the Module . . . . . . . . . . . . . . . . . . . . . . . . . . . . . . . . . . . . . . . . . . . . . . . . . . . . . . . 132.5 Discovering Cisco UCCX Resources . . . . . . . . . . . . . . . . . . . . . . . . . . . . . . . . . . . . . . . . . . . . . . . . . 142.6 Upgrading Knowledge Script Jobs . . . . . . . . . . . . . . . . . . . . . . . . . . . . . . . . . . . . . . . . . . . . . . . . . . . 14
3 CiscoICD Knowledge Scripts 17
3.1 AgentsLoggedOn . . . . . . . . . . . . . . . . . . . . . . . . . . . . . . . . . . . . . . . . . . . . . . . . . . . . . . . . . . . . . . . . 183.2 CallStatistics. . . . . . . . . . . . . . . . . . . . . . . . . . . . . . . . . . . . . . . . . . . . . . . . . . . . . . . . . . . . . . . . . . . . 193.3 CSQ_ServiceLevel . . . . . . . . . . . . . . . . . . . . . . . . . . . . . . . . . . . . . . . . . . . . . . . . . . . . . . . . . . . . . . . 213.4 ICD_CpuHigh . . . . . . . . . . . . . . . . . . . . . . . . . . . . . . . . . . . . . . . . . . . . . . . . . . . . . . . . . . . . . . . . . . . 233.5 ICD_EventLog . . . . . . . . . . . . . . . . . . . . . . . . . . . . . . . . . . . . . . . . . . . . . . . . . . . . . . . . . . . . . . . . . . 263.6 ICD_HealthCheck . . . . . . . . . . . . . . . . . . . . . . . . . . . . . . . . . . . . . . . . . . . . . . . . . . . . . . . . . . . . . . . 283.7 ICD_MemoryHigh. . . . . . . . . . . . . . . . . . . . . . . . . . . . . . . . . . . . . . . . . . . . . . . . . . . . . . . . . . . . . . . . 303.8 ICD_RestartService . . . . . . . . . . . . . . . . . . . . . . . . . . . . . . . . . . . . . . . . . . . . . . . . . . . . . . . . . . . . . . 343.9 ICD_SystemUsage. . . . . . . . . . . . . . . . . . . . . . . . . . . . . . . . . . . . . . . . . . . . . . . . . . . . . . . . . . . . . . . 373.10 IIS_CpuHigh. . . . . . . . . . . . . . . . . . . . . . . . . . . . . . . . . . . . . . . . . . . . . . . . . . . . . . . . . . . . . . . . . . . . 383.11 IIS_HealthCheck . . . . . . . . . . . . . . . . . . . . . . . . . . . . . . . . . . . . . . . . . . . . . . . . . . . . . . . . . . . . . . . . 393.12 IIS_KillTopCPUProcs . . . . . . . . . . . . . . . . . . . . . . . . . . . . . . . . . . . . . . . . . . . . . . . . . . . . . . . . . . . . . 393.13 IIS_MemoryHigh . . . . . . . . . . . . . . . . . . . . . . . . . . . . . . . . . . . . . . . . . . . . . . . . . . . . . . . . . . . . . . . . 403.14 IIS_ServiceUpTime . . . . . . . . . . . . . . . . . . . . . . . . . . . . . . . . . . . . . . . . . . . . . . . . . . . . . . . . . . . . . . 413.15 SQL_Accessibility . . . . . . . . . . . . . . . . . . . . . . . . . . . . . . . . . . . . . . . . . . . . . . . . . . . . . . . . . . . . . . . 423.16 SQL_CPUUtil . . . . . . . . . . . . . . . . . . . . . . . . . . . . . . . . . . . . . . . . . . . . . . . . . . . . . . . . . . . . . . . . . . . 433.17 SQL_DataGrowthRate . . . . . . . . . . . . . . . . . . . . . . . . . . . . . . . . . . . . . . . . . . . . . . . . . . . . . . . . . . . . 443.18 SQL_DBGrowthRate . . . . . . . . . . . . . . . . . . . . . . . . . . . . . . . . . . . . . . . . . . . . . . . . . . . . . . . . . . . . . 463.19 SQL_MemUtil . . . . . . . . . . . . . . . . . . . . . . . . . . . . . . . . . . . . . . . . . . . . . . . . . . . . . . . . . . . . . . . . . . . 473.20 SQL_RestartServer . . . . . . . . . . . . . . . . . . . . . . . . . . . . . . . . . . . . . . . . . . . . . . . . . . . . . . . . . . . . . . 483.21 Recommended Knowledge Script Group. . . . . . . . . . . . . . . . . . . . . . . . . . . . . . . . . . . . . . . . . . . . . . 49
Contents 3

4 NetIQ AppManager for Cisco Integrated Contact Distribution Management Guide

About this Book and the Library
The NetIQ AppManager product (AppManager) is a comprehensive solution for managing, diagnosing, and analyzing performance, availability, and health for a broad spectrum of operating environments, applications, services, and server hardware.
AppManager provides system administrators with a central, easy-to-use console to view critical server and application resources across the enterprise. With AppManager, administrative staff can monitor computer and application resources, check for potential problems, initiate responsive actions, automate routine tasks, and gather performance data for real-time and historical reporting and analysis.
Intended AudienceThis guide provides information for individuals responsible for installing an AppManager module and monitoring specific applications with AppManager.
Other Information in the LibraryThe library provides the following information resources:
Installation Guide for AppManager Provides complete information about AppManager pre-installation requirements and step-by-step installation procedures for all AppManager components.
User Guide for AppManager Control Center Provides complete information about managing groups of computers, including running jobs, responding to events, creating reports, and working with Control Center. A separate guide is available for the AppManager Operator Console.
Administrator Guide for AppManager Provides information about maintaining an AppManager management site, managing security, using scripts to handle AppManager tasks, and leveraging advanced configuration options.
Upgrade and Migration Guide for AppManager Provides complete information about how to upgrade from a previous version of AppManager.
Management guides Provide information about installing and monitoring specific applications with AppManager.
Help Provides context-sensitive information and step-by-step guidance for common tasks, as well as definitions for each field on each window.
The AppManager library is available in Adobe Acrobat (PDF) format from the NetIQ Web site: www.netiq.com/support/am/extended/documentation/default.asp?version=AMDocumentation.
About this Book and the Library 5

6 NetIQ AppManager for Cisco Integrated Contact Distribution Management Guide
About NetIQ Corporation
NetIQ, an Attachmate business, is a global leader in systems and security management. With more than 12,000 customers in over 60 countries, NetIQ solutions maximize technology investments and enable IT process improvements to achieve measureable cost savings. The company’s portfolio includes award-winning management products for IT Process Automation, Systems Management, Security Management, Configuration Audit and Control, Enterprise Administration, and Unified Communications Management. For more information, please visit www.netiq.com.
Contacting Sales SupportFor questions about products, pricing, and capabilities, please contact your local partner. If you cannot contact your partner, please contact our Sales Support team.
Contacting Technical SupportFor specific product issues, please contact our Technical Support team.
Contacting Documentation SupportOur goal is to provide documentation that meets your needs. If you have suggestions for improvements, please email [email protected]. We value your input and look forward to hearing from you.
Worldwide: www.netiq.com/about_netiq/officelocations.asp
United States and Canada: 888-323-6768
Email: [email protected]
Web Site: www.netiq.com
Worldwide: www.netiq.com/Support/contactinfo.asp
North and South America: 1-713-418-5555
Europe, Middle East, and Africa: +353 (0) 91-782 677
Email: [email protected]
Web Site: www.netiq.com/support
About NetIQ Corporation 7

Contacting the Online User CommunityQmunity, the NetIQ online community, is a collaborative network connecting you to your peers and NetIQ experts. By providing more immediate information, useful links to helpful resources, and access to NetIQ experts, Qmunity helps ensure you are mastering the knowledge you need to realize the full potential of IT investments upon which you rely. For more information, please visit http://community.netiq.com.
8 NetIQ AppManager for Cisco Integrated Contact Distribution Management Guide

1 1Introducing AppManager for Cisco Integrated Contact Distribution
Cisco Integrated Contact Distribution is an IP-based automated call distribution (ACD) system that queues and distributes incoming calls destined for groups of Cisco Unified Communications Manager users. Cisco Integrated Contact Distribution is currently known as Cisco Unified Contact Center Express (UCCX).
1.1 Features and BenefitsWith AppManager for Cisco Integrated Contact Distribution (the module), administrators gain access to a new set of tools they can leverage to gather a wide range of diagnostic and management data, which can help prevent outages and keep things running smoothly.
AppManager is designed to help you gain easy access to UCCX data, and to help you analyze and manage that data. The module minimizes the cost of maintaining UCCX resources, aids in capacity planning, and can prevent downtime.
The module includes Knowledge Scripts for creating jobs that monitor the health, availability, and performance of key devices. These scripts allow you to monitor and manage crucial device properties at a depth unparalleled by any other solution. Each Knowledge Script can be configured to send an alert, collect data for reporting, and perform automated problem management when an event occurs.
The following are just a few of the features and benefits of monitoring UCCX with AppManager:
Reduces the time that you spend diagnosing and resolving issues Monitors Cisco UCCX resources, including UCCX agents and the Contact Service Queue Monitors the CPU and memory usage for the UCCX server, and monitors CPU usage, memory
usage, and availability for UCCX services Identifies the percentage of calls that do not meet the service level agreement (SLA) for the
Contact Service Queue Monitors the number of agents logged on and the number of callers waiting in queue Automates system management issues that could affect device performance Pinpoints problems wherever they originate Provides Knowledge Scripts for day-to-day and diagnostic monitoring
1.2 Counting AppManager LicensesThe module is licensed by the maximum number of agents logged on. For instance, if, at discovery, two agents are logged on, then the license count is two. If, at a subsequent discovery, five agents are logged on, then the license count is five. If the number of logged-on agents is reduced, the license count remains at five.
Introducing AppManager for Cisco Integrated Contact Distribution 9

10 NetIQ AppManager for Cisco Integrated Contact Distribution Management Guide
2 2Installing AppManager for Cisco Integrated Contact Distribution
This chapter provides installation instructions and describes system requirements for AppManager for Cisco Integrated Contact Distribution.
For the latest information about supported software versions and the availability of module updates, visit the AppManager Supported Products page. Unless noted otherwise, this module supports all updates, hotfixes, and service packs for the releases listed below.
Only the following AppManager modules should be installed on a Cisco UCCX server:
Cisco ICD (qCiscoICDa4.dll) CIM (qcima4.dll) Dell (qdella4.dll) IBM Netfinity (qnfda4.dll) NT (qnta4.dll) WTS (qwtsa4.dll) SQL (qsqla4.dll)
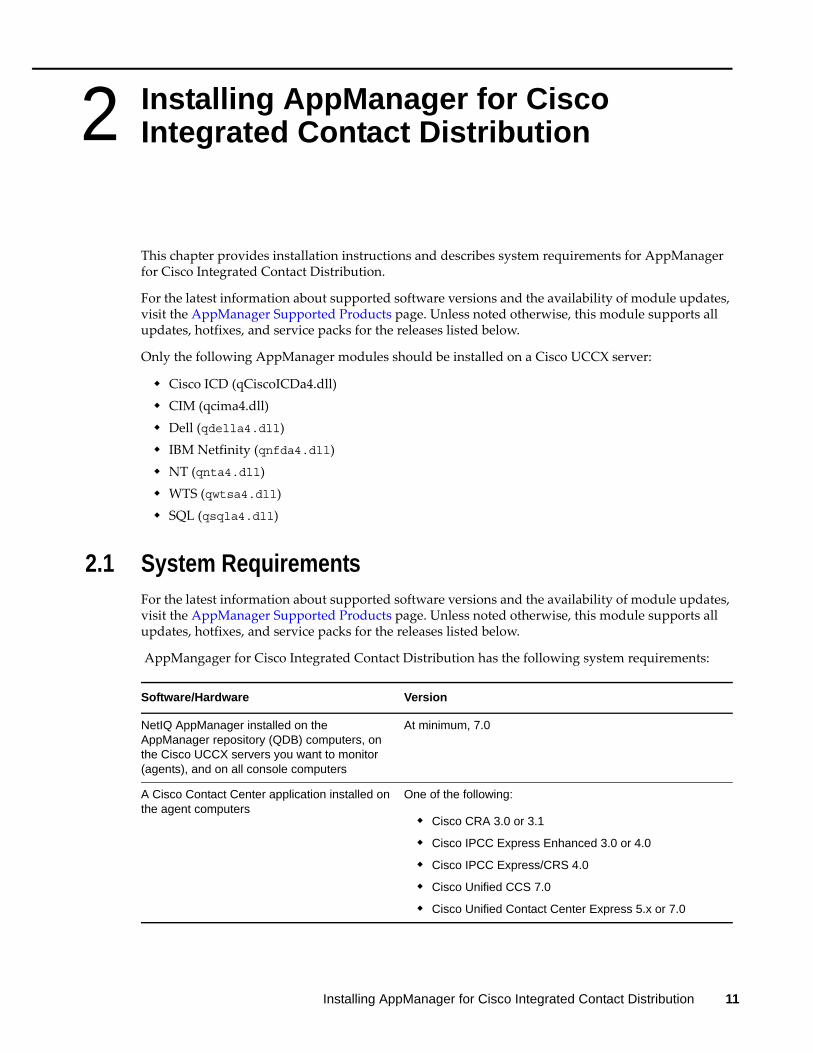
2.1 System RequirementsFor the latest information about supported software versions and the availability of module updates, visit the AppManager Supported Products page. Unless noted otherwise, this module supports all updates, hotfixes, and service packs for the releases listed below.
AppMangager for Cisco Integrated Contact Distribution has the following system requirements:
Software/Hardware Version
NetIQ AppManager installed on the AppManager repository (QDB) computers, on the Cisco UCCX servers you want to monitor (agents), and on all console computers
At minimum, 7.0
A Cisco Contact Center application installed on the agent computers
One of the following:
Cisco CRA 3.0 or 3.1
Cisco IPCC Express Enhanced 3.0 or 4.0
Cisco IPCC Express/CRS 4.0
Cisco Unified CCS 7.0
Cisco Unified Contact Center Express 5.x or 7.0
Installing AppManager for Cisco Integrated Contact Distribution 11

If you encounter problems using this module with a later version of your application, contact NetIQ Technical Support.
2.2 Installing the ModuleThe setup program automatically identifies and updates all relevant AppManager components on a computer. Therefore, run the setup program only once on any computer. The pre-installation check also runs automatically when you launch the setup program.
You can install the module in one of the following ways:
Run the module setup program, AM70-CiscoICD-7.x.x.0.msi, which you downloaded from the Web. Save the module setup files on the distribution computer, and then delete the older versions of the module setup files. For more information about the distribution computer, see the Installation Guide for AppManager.
Use Control Center to install the module on the remote computer where an agent is installed. For more information, see Section 2.3, “Deploying the Module with Control Center,” on page 13.
To install the module:
1 Stop the Cisco Security Agent (CSA) service on each Cisco UCCX server you want to monitor.2 Run the module setup program on all AppManager repository (QDB) computers to install the
Knowledge Scripts and reports. Run the setup program on the primary repository computer first. Then run the setup
program on all other repository computers. For repositories running in active/active and active/passive clusters, run the setup program
on the active node. Then, copy the following Registry key to the non-active node.
HKEY_LOCAL_MACHINE\SOFTWARE\NetIQ\AppManager\4.0
3 Install the module on the Cisco UCCX server you want to monitor. Use one of the following methods: Run the module setup program. Use Control Center to deploy the installation package.
4 Run the module setup program on all Operator Console and Control Center computers to install the Help and console extensions.
5 Restart the CSA service on the agent computers where you installed the module. 6 If you have not already discovered Cisco UCCX resources, run the Discovery_CiscoICD
Knowledge Script on all agent computers where you installed the module. For more information, see Section 2.5, “Discovering Cisco UCCX Resources,” on page 14.
After the installation has completed, you can find a record of problems encountered in the CiscoICD_Install.log file, located in the \NetIQ\Temp\NetIQ_Debug\<ServerName> folder.
Microsoft operating system on the agent computers
32-bit Windows Server 2003
Software/Hardware Version
12 NetIQ AppManager for Cisco Integrated Contact Distribution Management Guide
2.3 Deploying the Module with Control CenterYou can use Control Center to deploy the module on a remote computer where an agent is installed. This topic briefly describes the steps involved in deploying a module and provides instructions for checking in the module installation package. For more information, see the Control Center User Guide for AppManager, which is available on the AppManager Documentation Web site: www.netiq.com/support/am/extended/documentation/default.asp.
2.3.1 Deployment Overview
This section describes the tasks required to deploy the module on an agent computer.
To deploy the module on an agent computer:
1 Verify the default deployment credentials. 2 Check in an installation package. 3 Configure an email address to receive notification of a deployment. 4 Create a deployment rule or modify an out-of-the-box deployment rule. 5 Approve the deployment task. 6 View the results.
2.3.2 Checking In the Installation Package
You must check in the installation package, AM70-CiscoICD-7.x.x.0.xml, before you can deploy the module on an agent computer.
To check in a module installation package:
1 Log on to Control Center and navigate to the Administration pane.2 In the Deployment folder, select Packages.3 On the Tasks pane, click Check in Packages.4 Navigate to the folder where you saved AM70-CiscoICD-7.x.x.0.xml and select the file. 5 Click Open. The Deployment Package Check in Status dialog box displays the status of the
package check in.
2.4 Silently Installing the ModuleTo silently (without user intervention) install a module, create an initialization file (.ini) for this module that includes the required property names and values to use during the installation.
To create and use an initialization file for a silent installation:
1 Create a new text file and change the filename extension from .txt to .ini.2 To specify the community string required to access hardware resources, include the following
text in the .ini file:
MO_CommunityString=string name
where string name is the name of the community string, such as public.3 Save and close the .ini file.
Installing AppManager for Cisco Integrated Contact Distribution 13

4 Run the following command from the folder in which you saved the module installer:
msiexec.exe /i "AM70-CiscoICD-7.x.x.0.msi" /qn MO_CONFIGOUTINI="full path to the initialization file"
where x.x is the actual version number of the module installer.
To create a log file that describes the operations of the module installer, add the following flag to the command noted above:
/L* "AM70-CiscoICD-7.x.x.0.msi.log"
The log file is created in the folder in which you saved the module installer.
2.5 Discovering Cisco UCCX ResourcesUse the Discovery_CiscoICD Knowledge Script to discover Cisco Unified Contact Center Express (UCCX) configuration and resources. By default, the script runs once each day.
Set the parameters on the Values tab as needed:
2.6 Upgrading Knowledge Script JobsThis release of AppManager for Cisco Unified Contact Center Express may contain updated Knowledge Scripts. You can push the changes for updated scripts to running Knowledge Script jobs in one of the following ways:
Use the AMAdmin_UpgradeJobs Knowledge Script. Use the Properties Propagation feature.
Description How To Set It
Event Notification
Raise event if discovery succeeds?
Select Yes to raise an event when discovery succeeds. The default is unselected.
Event severity when discovery succeeds
Set the severity level, from 1 to 40, to reflect the importance of an event in which discovery succeeds. The default is 25.
Raise event if discovery fails? Select Yes to raise an event when discovery fails. The default is Yes.
Event severity when discovery fails
Set the event severity level, from 1 to 40, to reflect the importance of an event in which discovery fails. The default is 5.
Raise event if discovery partially succeeds?
Select Yes to raise an event when discovery returns some data but also generates warning messages. The default is Yes.
Event severity when discovery partially succeeds
Set the event severity level, from 1 to 40, to reflect the importance of an event in which discovery is only partially successful. The default is 15.
Discovery
SQL username If appropriate, enter your SQL username. Leave this field blank to use Windows Authentication. The default is blank.
NOTE: If a SQL username is required, you must configure the username into AppManager Security Manager.
14 NetIQ AppManager for Cisco Integrated Contact Distribution Management Guide
2.6.1 Running AMAdmin_UpgradeJobs
The AMAdmin_UpgradeJobs Knowledge Script can push changes to running Knowledge Script jobs. Your AppManager repository (QDB) must be at version 7.0 or later. In addition, the repository computer must have hotfix 72040 installed, or the most recent AppManager Repository hotfix. To download the hotfix, see the AppManager Suite Hotfixes Web page.
Upgrading jobs to use the most recent script version allows the jobs to take advantage of the latest script logic while maintaining existing parameter values for the job.
For more information, see the Help for the AMAdmin_UpgradeJobs Knowledge Script.
2.6.2 Propagating Knowledge Script Changes
You can propagate script changes to jobs that are running and to Knowledge Script Groups, including recommended Knowledge Script Groups and renamed Knowledge Scripts.
Before propagating script changes, verify that the script parameters are set to your specifications. Customized script parameters may have reverted to default parameters during the installation of the module. New parameters may need to be set appropriately for your environment or application.
You can choose to propagate only properties (specified in the Schedule and Values tabs), only the script (which is the logic of the Knowledge Script), or both. Unless you know specifically that changes affect only the script logic, you should propagate both properties and the script.
For more information about propagating Knowledge Script changes, see the “Running Monitoring Jobs” chapter of the Operator Console User Guide for AppManager.
Propagating Changes to Ad Hoc Jobs
You can propagate the properties and the logic (script) of a Knowledge Script to ad hoc jobs started by that Knowledge Script. Corresponding jobs are stopped and restarted with the Knowledge Script changes.
To propagate changes to ad hoc Knowledge Script jobs:
1 In the Knowledge Script view, select the Knowledge Script for which you want to propagate changes.
2 Click Properties Propagation > Ad Hoc Jobs.3 Select the components of the Knowledge Script that you want to propagate to associated ad hoc
jobs:
Select To propagate
Script The logic of the Knowledge Script.
Properties Values from the Knowledge Script Schedule and Values tabs, such as schedule, monitoring values, actions, and advanced options.
Installing AppManager for Cisco Integrated Contact Distribution 15

Propagating Changes to Knowledge Script Groups
You can propagate the properties and logic (script) of a Knowledge Script to corresponding Knowledge Script Group members.
After you propagate script changes to Knowledge Script Group members, you can propagate the updated Knowledge Script Group members to associated running jobs. For more information, see “Propagating Changes to Ad Hoc Jobs” on page 15.
To propagate Knowledge Script changes to Knowledge Script Groups:
1 In the Knowledge Script view, select the Knowledge Script Group for which you want to propagate changes.
2 On the KS menu, select Properties propagation > Ad Hoc Jobs.
3 If you want to exclude a Knowledge Script member from properties propagation, deselect that member from the list in the Properties Propagation dialog box.
4 Select the components of the Knowledge Script that you want to propagate to associated Knowledge Script Groups:
5 Click OK. Any monitoring jobs started by a Knowledge Script Group member are restarted with the job properties of the Knowledge Script Group member.
Select To propagate
Script The logic of the Knowledge Script.
Properties Values from the Knowledge Script Schedule and Values tabs, including the schedule, actions, and Advanced properties.
16 NetIQ AppManager for Cisco Integrated Contact Distribution Management Guide
3 3CiscoICD Knowledge Scripts
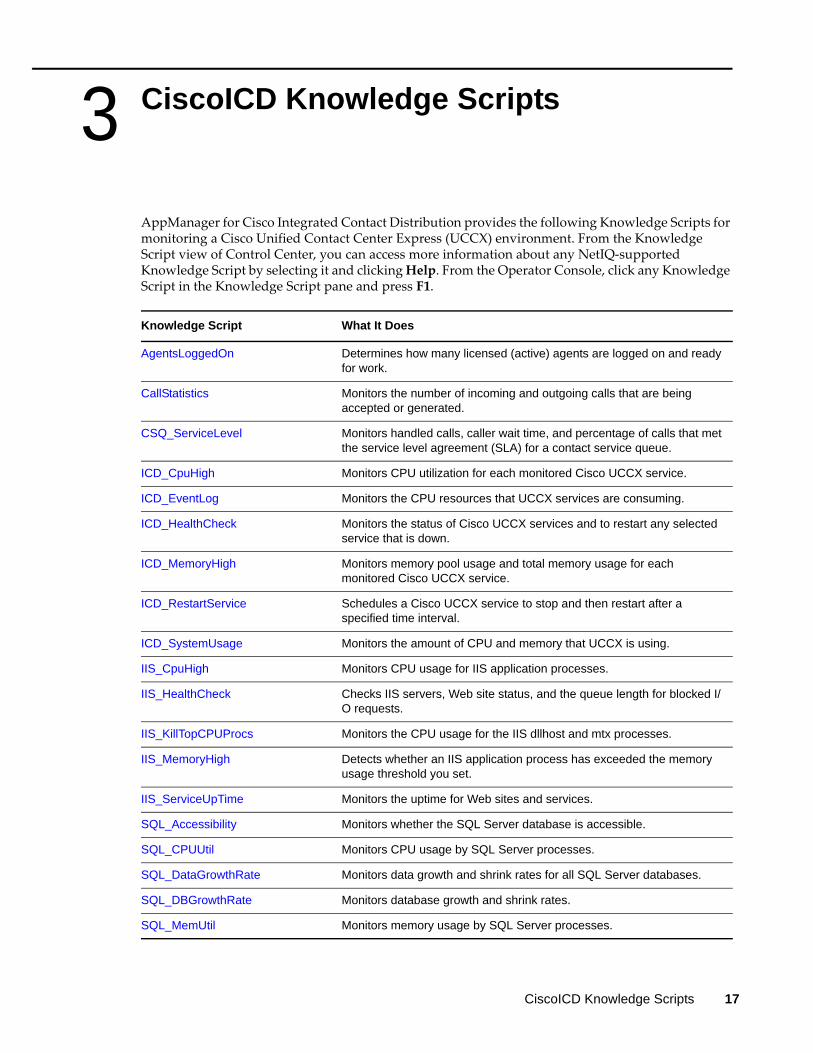
AppManager for Cisco Integrated Contact Distribution provides the following Knowledge Scripts for monitoring a Cisco Unified Contact Center Express (UCCX) environment. From the Knowledge Script view of Control Center, you can access more information about any NetIQ-supported Knowledge Script by selecting it and clicking Help. From the Operator Console, click any Knowledge Script in the Knowledge Script pane and press F1.
Knowledge Script What It Does
AgentsLoggedOn Determines how many licensed (active) agents are logged on and ready for work.
CallStatistics Monitors the number of incoming and outgoing calls that are being accepted or generated.
CSQ_ServiceLevel Monitors handled calls, caller wait time, and percentage of calls that met the service level agreement (SLA) for a contact service queue.
ICD_CpuHigh Monitors CPU utilization for each monitored Cisco UCCX service.
ICD_EventLog Monitors the CPU resources that UCCX services are consuming.
ICD_HealthCheck Monitors the status of Cisco UCCX services and to restart any selected service that is down.
ICD_MemoryHigh Monitors memory pool usage and total memory usage for each monitored Cisco UCCX service.
ICD_RestartService Schedules a Cisco UCCX service to stop and then restart after a specified time interval.
ICD_SystemUsage Monitors the amount of CPU and memory that UCCX is using.
IIS_CpuHigh Monitors CPU usage for IIS application processes.
IIS_HealthCheck Checks IIS servers, Web site status, and the queue length for blocked I/O requests.
IIS_KillTopCPUProcs Monitors the CPU usage for the IIS dllhost and mtx processes.
IIS_MemoryHigh Detects whether an IIS application process has exceeded the memory usage threshold you set.
IIS_ServiceUpTime Monitors the uptime for Web sites and services.
SQL_Accessibility Monitors whether the SQL Server database is accessible.
SQL_CPUUtil Monitors CPU usage by SQL Server processes.
SQL_DataGrowthRate Monitors data growth and shrink rates for all SQL Server databases.
SQL_DBGrowthRate Monitors database growth and shrink rates.
SQL_MemUtil Monitors memory usage by SQL Server processes.
CiscoICD Knowledge Scripts 17

3.1 AgentsLoggedOnUse this Knowledge Script to determine how many licensed (active) agents are logged on and ready for work. This script raises an event if a monitored value exceeds or falls below a threshold. In addition, this script can generate data streams for total number of agents and number of agents logged on.
3.1.1 Resource Object
Agent child object under the CiscoICD parent object
3.1.2 Default Schedule
By default, this script runs every 15 minutes.
3.1.3 Setting Parameter Values
Set the following parameters as needed:
SQL_RestartServer Restarts a SQL server.
Recommended Knowledge Script Group
Performs essential monitoring of your Cisco UCCX environment.
Knowledge Script What It Does
Parameter How To Set It
Event Notification
Raise event if logged-on agents exceed the threshold?
Select Yes to raise an event if the percentage of logged-on agents exceeds the maximum threshold you set. The default is Yes.
Severity when logged-on agents exceed the threshold
Set the severity level, from 1 to 40, to indicate the importance of an event in which the percentage of logged-on agents exceeds the maximum threshold you set. The default is 15.
Raise event if logged-on agents fall below the threshold
Select Yes to raise an event when the percentage of logged-on agents is less than the minimum threshold you set. The default is Yes.
Severity when logged-on agents fall below the threshold
Set the severity level, from 1 to 40, to indicate the importance of an event in which the percentage of logged-on agents is less than the minimum threshold you set. The default is 15.
Data Collection
Collect data? Select Yes to collect data for charts and graphs. The default is unselected. This script generates two data streams:
Total number of agents
Number of agents logged on
Monitoring
18 NetIQ AppManager for Cisco Integrated Contact Distribution Management Guide
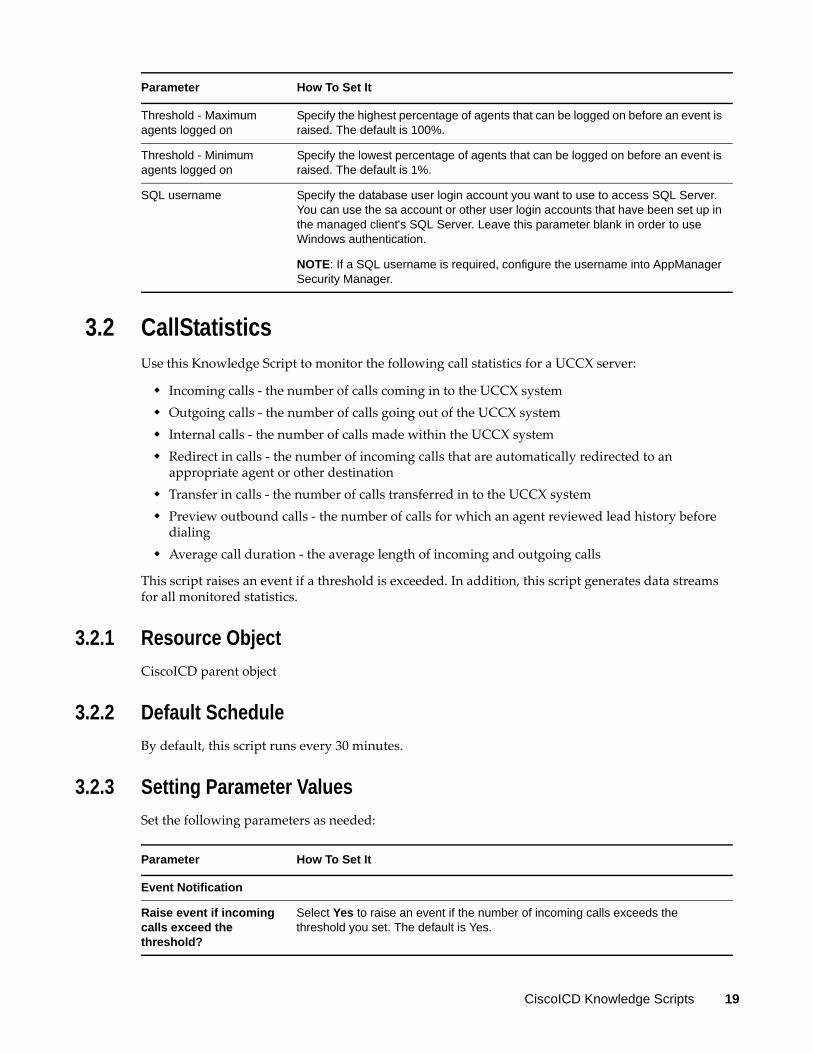
3.2 CallStatisticsUse this Knowledge Script to monitor the following call statistics for a UCCX server:
Incoming calls - the number of calls coming in to the UCCX system Outgoing calls - the number of calls going out of the UCCX system Internal calls - the number of calls made within the UCCX system Redirect in calls - the number of incoming calls that are automatically redirected to an
appropriate agent or other destination Transfer in calls - the number of calls transferred in to the UCCX system Preview outbound calls - the number of calls for which an agent reviewed lead history before
dialing Average call duration - the average length of incoming and outgoing calls
This script raises an event if a threshold is exceeded. In addition, this script generates data streams for all monitored statistics.
3.2.1 Resource Object
CiscoICD parent object
3.2.2 Default Schedule
By default, this script runs every 30 minutes.
3.2.3 Setting Parameter Values
Set the following parameters as needed:
Threshold - Maximum agents logged on
Specify the highest percentage of agents that can be logged on before an event is raised. The default is 100%.
Threshold - Minimum agents logged on
Specify the lowest percentage of agents that can be logged on before an event is raised. The default is 1%.
SQL username Specify the database user login account you want to use to access SQL Server. You can use the sa account or other user login accounts that have been set up in the managed client's SQL Server. Leave this parameter blank in order to use Windows authentication.
NOTE: If a SQL username is required, configure the username into AppManager Security Manager.
Parameter How To Set It
Parameter How To Set It
Event Notification
Raise event if incoming calls exceed the threshold?
Select Yes to raise an event if the number of incoming calls exceeds the threshold you set. The default is Yes.
CiscoICD Knowledge Scripts 19
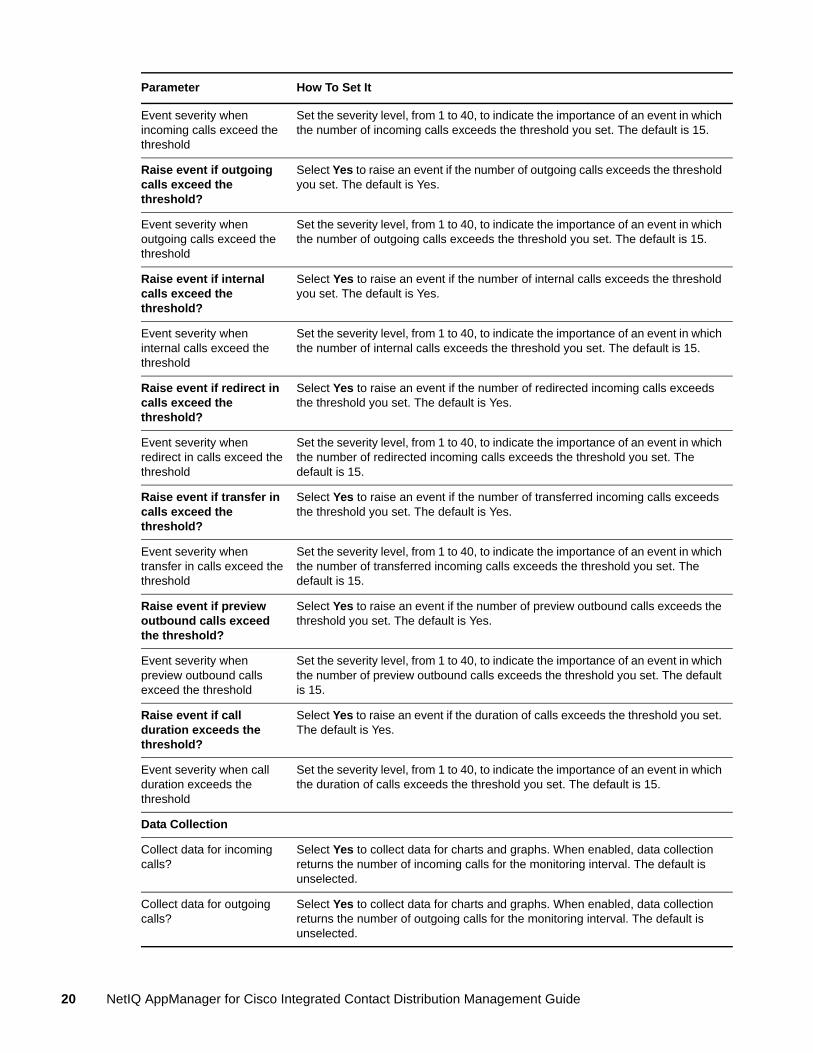
Event severity when incoming calls exceed the threshold
Set the severity level, from 1 to 40, to indicate the importance of an event in which the number of incoming calls exceeds the threshold you set. The default is 15.
Raise event if outgoing calls exceed the threshold?
Select Yes to raise an event if the number of outgoing calls exceeds the threshold you set. The default is Yes.
Event severity when outgoing calls exceed the threshold
Set the severity level, from 1 to 40, to indicate the importance of an event in which the number of outgoing calls exceeds the threshold you set. The default is 15.
Raise event if internal calls exceed the threshold?
Select Yes to raise an event if the number of internal calls exceeds the threshold you set. The default is Yes.
Event severity when internal calls exceed the threshold
Set the severity level, from 1 to 40, to indicate the importance of an event in which the number of internal calls exceeds the threshold you set. The default is 15.
Raise event if redirect in calls exceed the threshold?
Select Yes to raise an event if the number of redirected incoming calls exceeds the threshold you set. The default is Yes.
Event severity when redirect in calls exceed the threshold
Set the severity level, from 1 to 40, to indicate the importance of an event in which the number of redirected incoming calls exceeds the threshold you set. The default is 15.
Raise event if transfer in calls exceed the threshold?
Select Yes to raise an event if the number of transferred incoming calls exceeds the threshold you set. The default is Yes.
Event severity when transfer in calls exceed the threshold
Set the severity level, from 1 to 40, to indicate the importance of an event in which the number of transferred incoming calls exceeds the threshold you set. The default is 15.
Raise event if preview outbound calls exceed the threshold?
Select Yes to raise an event if the number of preview outbound calls exceeds the threshold you set. The default is Yes.
Event severity when preview outbound calls exceed the threshold
Set the severity level, from 1 to 40, to indicate the importance of an event in which the number of preview outbound calls exceeds the threshold you set. The default is 15.
Raise event if call duration exceeds the threshold?
Select Yes to raise an event if the duration of calls exceeds the threshold you set. The default is Yes.
Event severity when call duration exceeds the threshold
Set the severity level, from 1 to 40, to indicate the importance of an event in which the duration of calls exceeds the threshold you set. The default is 15.
Data Collection
Collect data for incoming calls?
Select Yes to collect data for charts and graphs. When enabled, data collection returns the number of incoming calls for the monitoring interval. The default is unselected.
Collect data for outgoing calls?
Select Yes to collect data for charts and graphs. When enabled, data collection returns the number of outgoing calls for the monitoring interval. The default is unselected.
Parameter How To Set It
20 NetIQ AppManager for Cisco Integrated Contact Distribution Management Guide

3.3 CSQ_ServiceLevelUse this Knowledge Script to monitor handled calls, caller wait time, and percentage of calls that do not meet the service level agreement (SLA) for the Contact Service queue. This script raises an event if a threshold is exceeded. In addition, this script can generate data streams for the number of handled calls, the total amount of caller wait time, and the number of calls not meeting SLA.
Collect data for internal calls?
Select Yes to collect data for charts and graphs. When enabled, data collection returns the number of internal calls for the monitoring interval. The default is unselected.
Collect data for redirect in calls?
Select Yes to collect data for charts and graphs. When enabled, data collection returns the number of redirected incoming calls for the monitoring interval. The default is unselected.
Collect data for transfer in calls?
Select Yes to collect data for charts and graphs. When enabled, data collection returns the number of transferred incoming calls for the monitoring interval. The default is unselected.
Collect data for preview outbound calls?
Select Yes to collect data for charts and graphs. When enabled, data collection returns the number of preview outbound calls for the monitoring interval. The default is unselected.
Collect data for call duration?
Select Yes to collect data for charts and graphs. When enabled, data collection returns the average length of incoming and outgoing calls for the monitoring interval. The default is unselected.
Monitoring
Threshold - Maximum incoming calls
Specify the highest number of incoming calls that can be received before an event is raised. The default is 100 calls.
Threshold - Maximum outgoing calls
Specify the highest number of outgoing calls that can be made before an event is raised. The default is 100 calls.
Threshold - Maximum internal calls
Specify the highest number of internal calls that can be made before an event is raised. The default is 100 calls.
Threshold - Maximum redirect in calls
Specify the highest number of incoming calls that can be redirected before an event is raised. The default is 100 calls.
Threshold - Maximum transfer in calls
Specify the highest number of incoming calls that can be transferred before an event is raised. The default is 100 calls.
Threshold - Maximum preview outbound calls
Specify the highest number of preview outbound calls that can be made before an event is raised. The default is 100 calls.
Threshold - Maximum call duration
Specify the longest duration for incoming and outgoing calls that can occur before an event is raised. The default is 5 minutes.
SQL username Enter the database user login account you want to use to access the UCCX SQL Server database. You can use the sa account or other user login account that has been configured on the agent computer. Leave this parameter blank in order to use Windows authentication.
NOTE: If a SQL username is required, configure the username into AppManager Security Manager.
Parameter How To Set It
CiscoICD Knowledge Scripts 21

3.3.1 Resource Object
Cisco ICD Contact Service queue object
3.3.2 Default Schedule
By default, this script runs every 15 minutes.
3.3.3 Setting Parameter Values
Set the following parameters as needed:
Parameter How To Set It
Event Notification
Raise event if handled calls exceed the threshold?
Select Yes to raise an event if the number of handled calls exceeds the threshold you set. The default is Yes.
Event severity when handled calls exceed threshold
Set the severity level, from 1 to 40, to indicate the importance of an event in which the number of handled calls exceeds the threshold you set. The default is 15.
Raise event if caller wait time exceeds the threshold?
Select Yes to raise an event if the caller wait time exceeds the threshold you set. The default is Yes.
Event severity when caller wait time exceeds threshold
Set the severity level, from 1 to 40, to indicate the importance of an event in which the amount of caller wait time exceeds the threshold you set. The default is 15.
Raise event if calls not meeting the SLA exceed the threshold?
Select Yes to raise an event when the percentage of calls not meeting the SLA exceeds the threshold you set. The default is Yes.
Event severity when calls not meeting SLA exceed the threshold
Set the severity level, from 1 to 40, to indicate the importance of an event in which the percentage of calls that do not meet the SLA exceeds the threshold you set. The default is 15.
Data Collection
Collect data for handled calls?
Select Yes to collect data for charts and graphs. When enabled, data collection returns the number of calls that were handled during the monitoring interval. The default is unselected.
Collect data for caller wait time?
Select Yes to collect data for charts and graphs. When enabled, data collection returns the average amount of time that callers waited during the monitoring interval. The default is unselected.
Collect data for calls not meeting the SLA?
Select Yes to collect data for charts and graphs. When enabled, data collection returns the percentage of calls that did not meed the SLA during the monitoring interval. The default is unselected.
Monitoring
Threshold - Maximum handled calls
Specify the highest number calls that can be handled before an event is raised. The default is 20 calls.
Threshold - Maximum caller wait time
Specify the longest amount of time a caller can wait before an event is raised. The default is 5 minutes.
22 NetIQ AppManager for Cisco Integrated Contact Distribution Management Guide
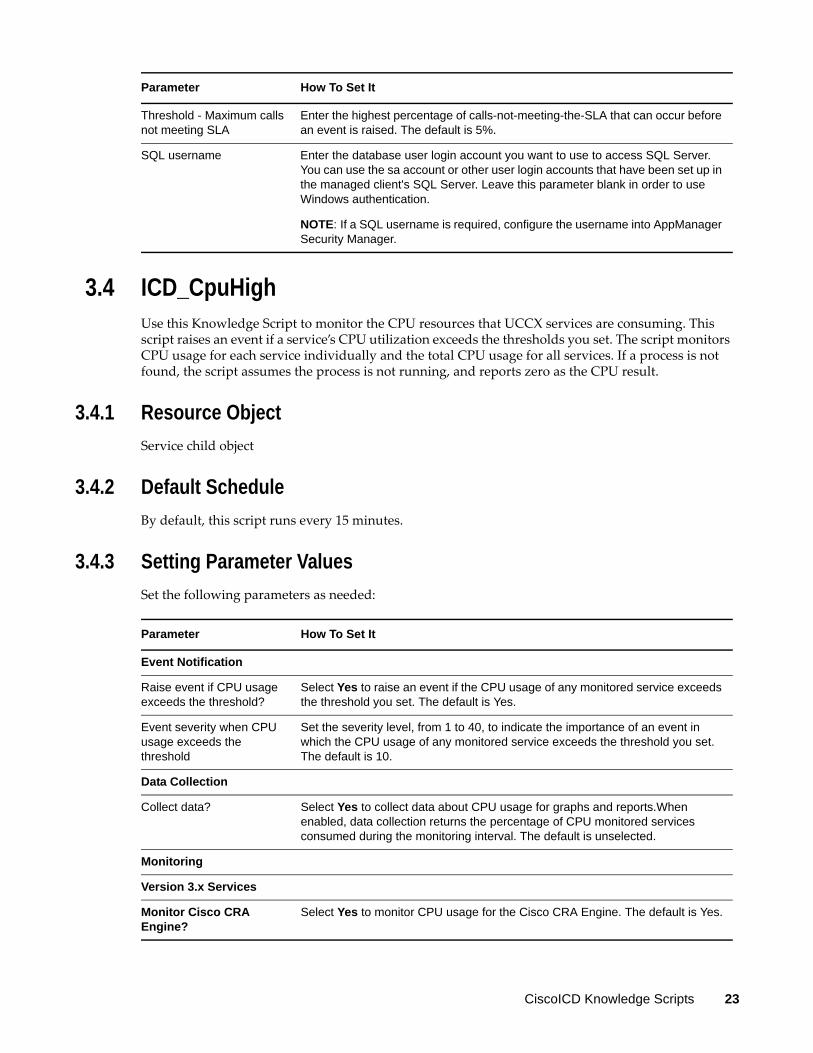
3.4 ICD_CpuHighUse this Knowledge Script to monitor the CPU resources that UCCX services are consuming. This script raises an event if a service’s CPU utilization exceeds the thresholds you set. The script monitors CPU usage for each service individually and the total CPU usage for all services. If a process is not found, the script assumes the process is not running, and reports zero as the CPU result.
3.4.1 Resource Object
Service child object
3.4.2 Default Schedule
By default, this script runs every 15 minutes.
3.4.3 Setting Parameter Values
Set the following parameters as needed:
Threshold - Maximum calls not meeting SLA
Enter the highest percentage of calls-not-meeting-the-SLA that can occur before an event is raised. The default is 5%.
SQL username Enter the database user login account you want to use to access SQL Server. You can use the sa account or other user login accounts that have been set up in the managed client's SQL Server. Leave this parameter blank in order to use Windows authentication.
NOTE: If a SQL username is required, configure the username into AppManager Security Manager.
Parameter How To Set It
Parameter How To Set It
Event Notification
Raise event if CPU usage exceeds the threshold?
Select Yes to raise an event if the CPU usage of any monitored service exceeds the threshold you set. The default is Yes.
Event severity when CPU usage exceeds the threshold
Set the severity level, from 1 to 40, to indicate the importance of an event in which the CPU usage of any monitored service exceeds the threshold you set. The default is 10.
Data Collection
Collect data? Select Yes to collect data about CPU usage for graphs and reports.When enabled, data collection returns the percentage of CPU monitored services consumed during the monitoring interval. The default is unselected.
Monitoring
Version 3.x Services
Monitor Cisco CRA Engine?
Select Yes to monitor CPU usage for the Cisco CRA Engine. The default is Yes.
CiscoICD Knowledge Scripts 23

Threshold: Maximum Cisco CRA Engine CPU usage
Specify the highest percentage of CPU that the CRA Engine can use before an event is raised. The default is 80%.
Monitor Cisco AVVID Alarm?
Select Yes to monitor CPU usage for the Cisco AVVID Alarm. The default is Yes.
Threshold: Maximum Cisco AVVID Alarm CPU usage
Specify the highest percentage of CPU that the AVVID Alarm can use before an event is raised. The default is 20%.
Monitor Cisco Purging Scheduler?
Select Yes to monitor CPU usage for the Cisco Purging Scheduler. The default is Yes.
Threshold: Maximum Cisco Purging Scheduler CPU usage
Specify the highest percentage of CPU that the Purging Scheduler can use before an event is raised. The default is 20%.
Monitor Cisco CRA Servlet Engine?
Select Yes to monitor CPU usage for the Cisco CRA Servlet Engine. The default is Yes.
Threshold: Maximum Cisco CRA Servlet Engine CPU usage
Specify the highest percentage of CPU that the CRA Servlet Engine can use before an event is raised. The default is 20%.
Monitor Cisco Desktop Enterprise Service?
Select Yes to monitor CPU usage for the Cisco Desktop Enterprise Service. The default is Yes.
Threshold: Maximum Cisco Desktop Enterprise Service CPU usage
Specify the highest percentage of CPU that the Desktop Enterprise Service can use before an event is raised. The default is 20%.
Monitor Cisco Desktop RASCAL Service?
Select Yes to monitor CPU usage for the Cisco Desktop RASCAL Service. The default is Yes.
Threshold: Maximum Cisco Desktop RASCAL Service CPU usage
Specify the highest percentage of CPU that the Desktop RASCAL Service can use before an event is raised. The default is 20%.
Monitor Cisco Desktop Sync Service?
Select Yes to monitor CPU usage for the Cisco Desktop Sync Service. The default is Yes.
Threshold: Maximum Cisco Desktop Sync Service CPU usage
Specify the highest percentage of CPU that the Desktop Sync Service can use before an event is raised. The default is 20%.
Monitor Cisco Desktop TAI Service?
Select Yes to monitor CPU usage for the Cisco Desktop TAI Service. The default is Yes.
Threshold: Maximum Cisco Desktop TAI Service CPU usage
Specify the highest percentage of CPU that the Desktop TAI Service can use before an event is raised. The default is 20%.
Monitor Cisco Desktop VoIP Monitor Service?
Select Yes to monitor CPU usage for the Cisco Desktop VoIP Monitor Service. The default is Yes.
Threshold: Maximum Cisco Desktop VoIP Monitor Service CPU usage
Specify the highest percentage of CPU that the Desktop VoIP Monitor Service can use before an event is raised. The default is 20%.
Version 4.x Services
Monitor Cisco CRS Node Manager?
Select Yes to monitor CPU usage for the Cisco CRS Node Manager. The default is Yes.
Parameter How To Set It
24 NetIQ AppManager for Cisco Integrated Contact Distribution Management Guide
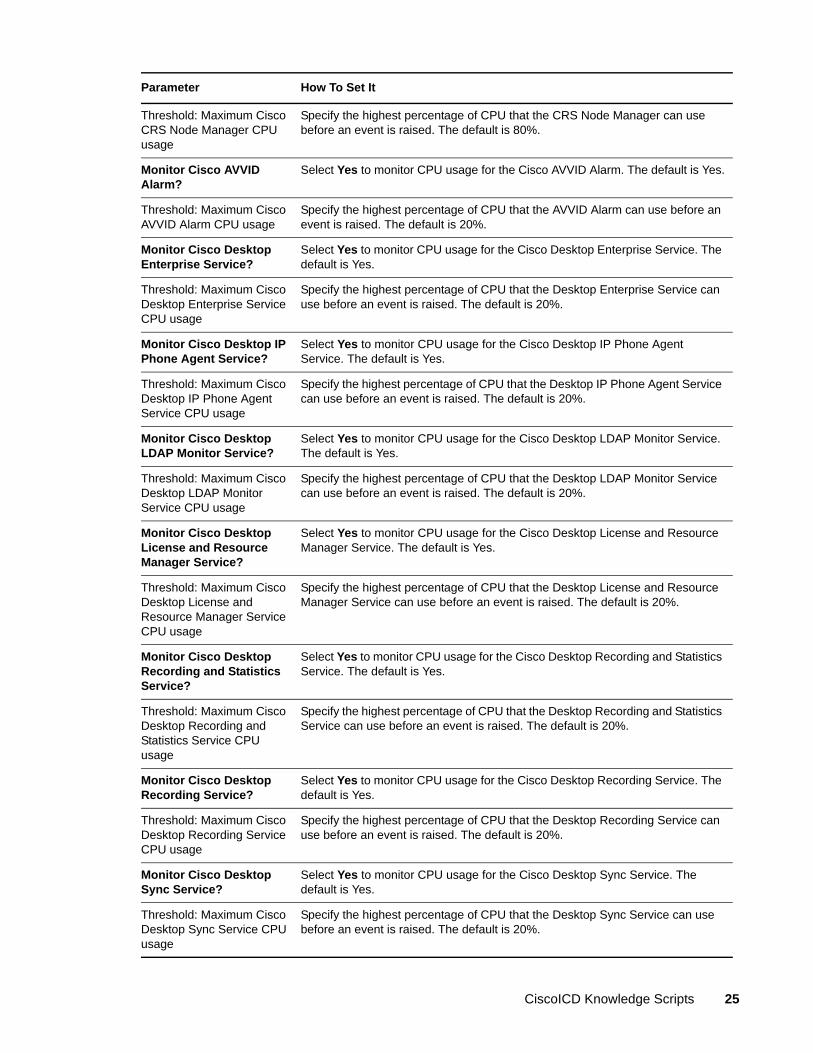
Threshold: Maximum Cisco CRS Node Manager CPU usage
Specify the highest percentage of CPU that the CRS Node Manager can use before an event is raised. The default is 80%.
Monitor Cisco AVVID Alarm?
Select Yes to monitor CPU usage for the Cisco AVVID Alarm. The default is Yes.
Threshold: Maximum Cisco AVVID Alarm CPU usage
Specify the highest percentage of CPU that the AVVID Alarm can use before an event is raised. The default is 20%.
Monitor Cisco Desktop Enterprise Service?
Select Yes to monitor CPU usage for the Cisco Desktop Enterprise Service. The default is Yes.
Threshold: Maximum Cisco Desktop Enterprise Service CPU usage
Specify the highest percentage of CPU that the Desktop Enterprise Service can use before an event is raised. The default is 20%.
Monitor Cisco Desktop IP Phone Agent Service?
Select Yes to monitor CPU usage for the Cisco Desktop IP Phone Agent Service. The default is Yes.
Threshold: Maximum Cisco Desktop IP Phone Agent Service CPU usage
Specify the highest percentage of CPU that the Desktop IP Phone Agent Service can use before an event is raised. The default is 20%.
Monitor Cisco Desktop LDAP Monitor Service?
Select Yes to monitor CPU usage for the Cisco Desktop LDAP Monitor Service. The default is Yes.
Threshold: Maximum Cisco Desktop LDAP Monitor Service CPU usage
Specify the highest percentage of CPU that the Desktop LDAP Monitor Service can use before an event is raised. The default is 20%.
Monitor Cisco Desktop License and Resource Manager Service?
Select Yes to monitor CPU usage for the Cisco Desktop License and Resource Manager Service. The default is Yes.
Threshold: Maximum Cisco Desktop License and Resource Manager Service CPU usage
Specify the highest percentage of CPU that the Desktop License and Resource Manager Service can use before an event is raised. The default is 20%.
Monitor Cisco Desktop Recording and Statistics Service?
Select Yes to monitor CPU usage for the Cisco Desktop Recording and Statistics Service. The default is Yes.
Threshold: Maximum Cisco Desktop Recording and Statistics Service CPU usage
Specify the highest percentage of CPU that the Desktop Recording and Statistics Service can use before an event is raised. The default is 20%.
Monitor Cisco Desktop Recording Service?
Select Yes to monitor CPU usage for the Cisco Desktop Recording Service. The default is Yes.
Threshold: Maximum Cisco Desktop Recording Service CPU usage
Specify the highest percentage of CPU that the Desktop Recording Service can use before an event is raised. The default is 20%.
Monitor Cisco Desktop Sync Service?
Select Yes to monitor CPU usage for the Cisco Desktop Sync Service. The default is Yes.
Threshold: Maximum Cisco Desktop Sync Service CPU usage
Specify the highest percentage of CPU that the Desktop Sync Service can use before an event is raised. The default is 20%.
Parameter How To Set It
CiscoICD Knowledge Scripts 25

3.5 ICD_EventLogUse this Knowledge Script to monitor Windows event log entries from Cisco UCCX during the past n hours. This script raises an event if log entries are detected. In addition, this script generates data streams for entries from different log files.
3.5.1 Resource Object
CiscoICD parent object
3.5.2 Default Schedule
By default, this script runs every 10 minutes.
3.5.3 Setting Parameter Values
Set the following parameters as needed:
Monitor Cisco Desktop VoIP Monitor Service?
Select Yes to monitor CPU usage for the Cisco Desktop VoIP Monitor Service. The default is Yes.
Threshold: Maximum Cisco Desktop VoIP Monitor Service CPU usage
Specify the highest percentage of CPU that the Desktop VoIP Monitor Service can use before an event is raised. The default is 20%.
Parameter How To Set It
Parameter How To Set It
Raise event for log entries? Select y to raise an event when the log contains entries that match your filtering criteria. The default is y.
Collect data? Select y to collect data about log entries for charts and graphs. When enabled, data collection returns the number of entries placed in different log files during the monitoring interval. The default is n.
Separate data? Select y to separate events entries from different log files into different data streams. If n selected, all event entries matching your filtering criteria are placed in the same data stream and the data detail message may include event entries from multiple log sources. The default is n.
For example, if you are monitoring both the System and Application logs, you can set this parameter to y so that events in the System log are tracked separately from events in the Application log.
Log source Specify the event log you want to monitor. You can specify multiple event logs, separated by commas. For example: System,Application. The default is Application.
Type: Error Select y to monitor for error events. If n is selected, this entry does not raise an event, is not returned in an event detail message, and is not collected as data if you specified y for Collect data? The default is y.
26 NetIQ AppManager for Cisco Integrated Contact Distribution Management Guide
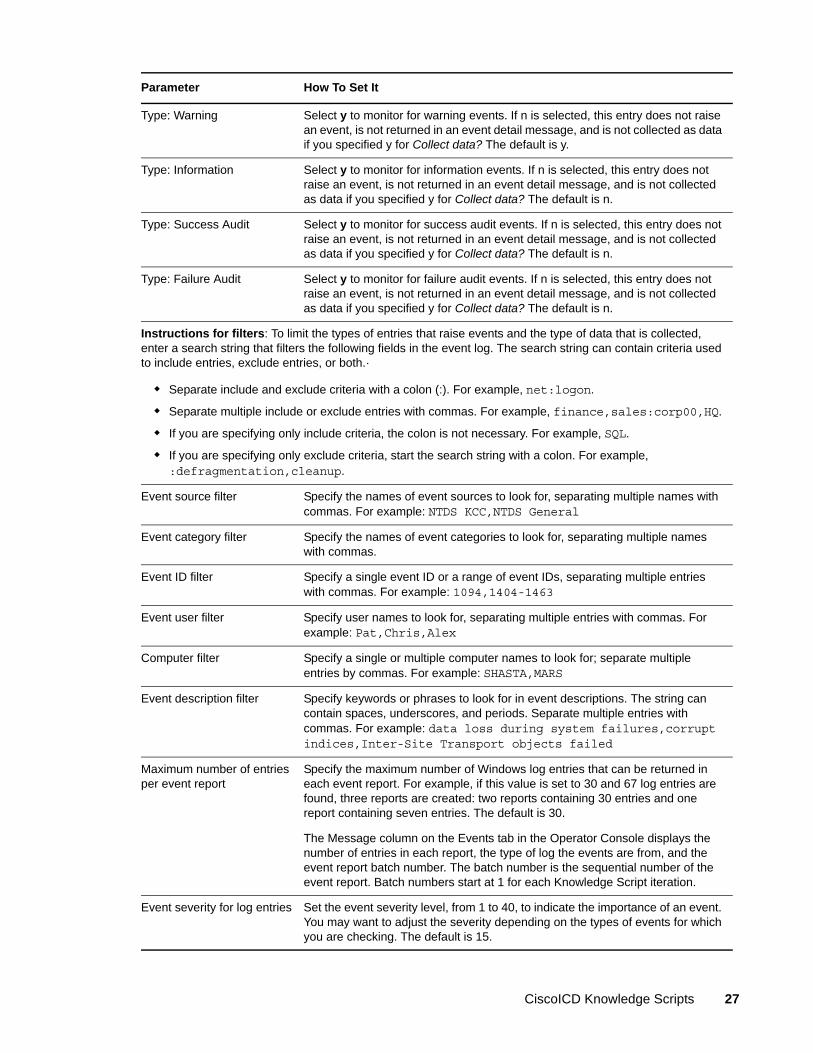
Type: Warning Select y to monitor for warning events. If n is selected, this entry does not raise an event, is not returned in an event detail message, and is not collected as data if you specified y for Collect data? The default is y.
Type: Information Select y to monitor for information events. If n is selected, this entry does not raise an event, is not returned in an event detail message, and is not collected as data if you specified y for Collect data? The default is n.
Type: Success Audit Select y to monitor for success audit events. If n is selected, this entry does not raise an event, is not returned in an event detail message, and is not collected as data if you specified y for Collect data? The default is n.
Type: Failure Audit Select y to monitor for failure audit events. If n is selected, this entry does not raise an event, is not returned in an event detail message, and is not collected as data if you specified y for Collect data? The default is n.
Instructions for filters: To limit the types of entries that raise events and the type of data that is collected, enter a search string that filters the following fields in the event log. The search string can contain criteria used to include entries, exclude entries, or both.·
Separate include and exclude criteria with a colon (:). For example, net:logon.
Separate multiple include or exclude entries with commas. For example, finance,sales:corp00,HQ.
If you are specifying only include criteria, the colon is not necessary. For example, SQL.
If you are specifying only exclude criteria, start the search string with a colon. For example, :defragmentation,cleanup.
Event source filter Specify the names of event sources to look for, separating multiple names with commas. For example: NTDS KCC,NTDS General
Event category filter Specify the names of event categories to look for, separating multiple names with commas.
Event ID filter Specify a single event ID or a range of event IDs, separating multiple entries with commas. For example: 1094,1404-1463
Event user filter Specify user names to look for, separating multiple entries with commas. For example: Pat,Chris,Alex
Computer filter Specify a single or multiple computer names to look for; separate multiple entries by commas. For example: SHASTA,MARS
Event description filter Specify keywords or phrases to look for in event descriptions. The string can contain spaces, underscores, and periods. Separate multiple entries with commas. For example: data loss during system failures,corrupt indices,Inter-Site Transport objects failed
Maximum number of entries per event report
Specify the maximum number of Windows log entries that can be returned in each event report. For example, if this value is set to 30 and 67 log entries are found, three reports are created: two reports containing 30 entries and one report containing seven entries. The default is 30.
The Message column on the Events tab in the Operator Console displays the number of entries in each report, the type of log the events are from, and the event report batch number. The batch number is the sequential number of the event report. Batch numbers start at 1 for each Knowledge Script iteration.
Event severity for log entries Set the event severity level, from 1 to 40, to indicate the importance of an event. You may want to adjust the severity depending on the types of events for which you are checking. The default is 15.
Parameter How To Set It
CiscoICD Knowledge Scripts 27

3.6 ICD_HealthCheckUse this Knowledge Script to monitor the status of Cisco UCCX services and to restart any selected service that is down. This script raises an event if a service is not running, if a service does not restart automatically, if a service successfully restarts, if a service has been set to not restart, or if a selected service does not exist.
3.6.1 Resource Object
Contact Service Queue child object
3.6.2 Default Schedule
By default, this script runs every one minute.
3.6.3 Setting Parameter Values
Set the following parameters as needed:
Parameter How To Set It
Event Notification
Raise event if service is not running?
Select Yes to raise an event if a monitored services is not running. The default is Yes.
Event severity when service is not running
Set the severity level, from 1 to 40, to indicate the importance of an event in which a monitored service is not running. The default is 15.
Raise event if service auto-start fails?
Select Yes to raise an event when a monitored service fails to restart. The default is Yes.
Event severity when service auto-start fails
Set the severity level, from 1 to 40, to indicate the importance of an event in which the a monitored service fails to restart. The default is 5.
Raise event if service auto-start succeeds?
Select Yes to raise an event when a monitored service successfully restarts. The default is Yes.
Event severity when service auto-start succeeds
Set the severity level, from 1 to 40, to indicate the importance of an event in which a monitored service successfully restarts. The default is 25.
Raise event if service auto-start is set to "n"?
Select Yes to raise an event when the Auto-start the monitored services? parameter is disabled. The default is Yes.
Event severity when service auto-start set to "n"
Set the severity level, from 1 to 40, to indicate the importance of an event in which the a Auto-start the monitored services? parameter is disabled. The default is 5.
Raise event if service doesn't exist?
Select Yes to raise an event when a monitored service does not exist. The default is Yes.
Event severity when service doesn't exist
Set the severity level, from 1 to 40, to indicate the importance of an event in which a monitored service does not exist. The default is 15.
Data Collection
Collect data? Select Yes to collect data for charts and reports. When enabled, data collection returns information about service status. The default is unselected.
28 NetIQ AppManager for Cisco Integrated Contact Distribution Management Guide

Monitoring
Auto-start the monitored services?
Select Yes to automatically start any monitored service that is down. The default is Yes.
Monitor Cisco CRA Engine? (V3.x)
Select Yes to monitor the Cisco CRA Engine for Cisco UCCX version 3.x. The default is Yes.
Monitor Cisco CRS Node Manager? (V4.x)
Select Yes to monitor the Cisco CRS Node Manager for Cisco UCCX version 4.x. The default is Yes.
Additional V3.x Services
Monitor Cisco AVVID Alarm? Select Yes to monitor the Cisco AVVID Alarm. The default is unselected.
Monitor Cisco Purging Scheduler?
Select Yes to monitor the Cisco Purging Scheduler. The default is unselected.
Monitor Cisco CRA Servlet Engine?
Select Yes to monitor the Cisco CRA Servlet Engine. The default is unselected.
Monitor Cisco Desktop Enterprise Service?
Select Yes to monitor the Cisco Desktop Enterprise Service. The default is unselected.
Monitor Cisco Desktop RASCAL Service?
Select Yes to monitor the Cisco Desktop RASCAL Service. The default is unselected.
Monitor Cisco Desktop Sync Service?
Select Yes to monitor the Cisco Desktop Sync Service. The default is unselected.
Monitor Cisco Desktop TAI Service?
Select Yes to monitor the Cisco Desktop TAI Service. The default is unselected.
Monitor Cisco Desktop VoIP Monitor Service?
Select Yes to monitor the Cisco Desktop VoIP Monitor Service. The default is unselected.
Additional V4.x Services
Monitor Cisco AVVID Alarm? Select Yes to monitor the Cisco AVVID Alarm. The default is unselected.
Monitor Cisco Desktop Enterprise Service?
Select Yes to monitor the Cisco Desktop Enterprise Service. The default is unselected.
Monitor Cisco Desktop IP Phone Agent Service?
Select Yes to monitor the Cisco Desktop IP Phone Agent Service. The default is unselected.
Monitor Cisco Desktop LDAP Monitor Service?
Select Yes to monitor the Cisco Desktop LDAP Monitor Service. The default is unselected.
Monitor Cisco Desktop License and Resource Manager Service?
Select Yes to monitor the Cisco Desktop License and Resource Manager Service. The default is unselected.
Monitor Cisco Desktop Recording and Statistics Service?
Select Yes to monitor the Cisco Desktop Recording and Statistics Service. The default is unselected.
Monitor Cisco Desktop Recording Service?
Select Yes to monitor the Cisco Desktop Recording Service. The default is unselected.
Monitor Cisco Desktop Sync Service?
Select Yes to monitor the Cisco Desktop Sync Service. The default is unselected.
Parameter How To Set It
CiscoICD Knowledge Scripts 29
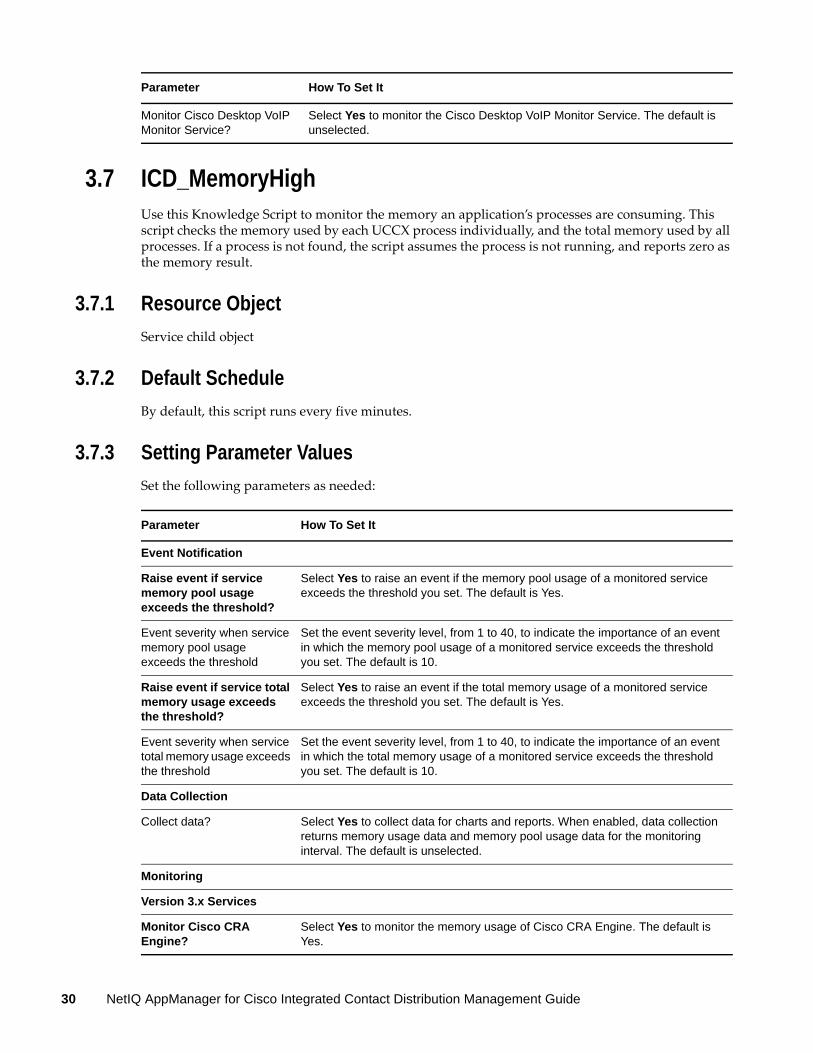
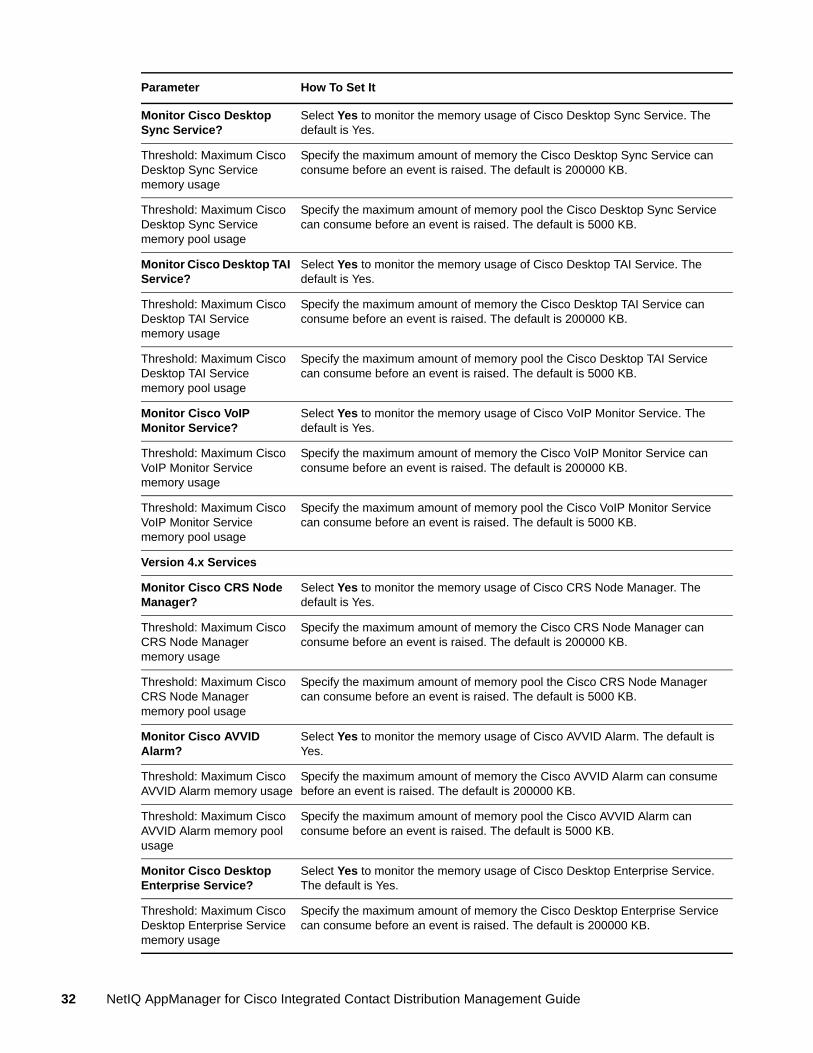
3.7 ICD_MemoryHighUse this Knowledge Script to monitor the memory an application’s processes are consuming. This script checks the memory used by each UCCX process individually, and the total memory used by all processes. If a process is not found, the script assumes the process is not running, and reports zero as the memory result.
3.7.1 Resource Object
Service child object
3.7.2 Default Schedule
By default, this script runs every five minutes.
3.7.3 Setting Parameter Values
Set the following parameters as needed:
Monitor Cisco Desktop VoIP Monitor Service?
Select Yes to monitor the Cisco Desktop VoIP Monitor Service. The default is unselected.
Parameter How To Set It
Parameter How To Set It
Event Notification
Raise event if service memory pool usage exceeds the threshold?
Select Yes to raise an event if the memory pool usage of a monitored service exceeds the threshold you set. The default is Yes.
Event severity when service memory pool usage exceeds the threshold
Set the event severity level, from 1 to 40, to indicate the importance of an event in which the memory pool usage of a monitored service exceeds the threshold you set. The default is 10.
Raise event if service total memory usage exceeds the threshold?
Select Yes to raise an event if the total memory usage of a monitored service exceeds the threshold you set. The default is Yes.
Event severity when service total memory usage exceeds the threshold
Set the event severity level, from 1 to 40, to indicate the importance of an event in which the total memory usage of a monitored service exceeds the threshold you set. The default is 10.
Data Collection
Collect data? Select Yes to collect data for charts and reports. When enabled, data collection returns memory usage data and memory pool usage data for the monitoring interval. The default is unselected.
Monitoring
Version 3.x Services
Monitor Cisco CRA Engine?
Select Yes to monitor the memory usage of Cisco CRA Engine. The default is Yes.
30 NetIQ AppManager for Cisco Integrated Contact Distribution Management Guide
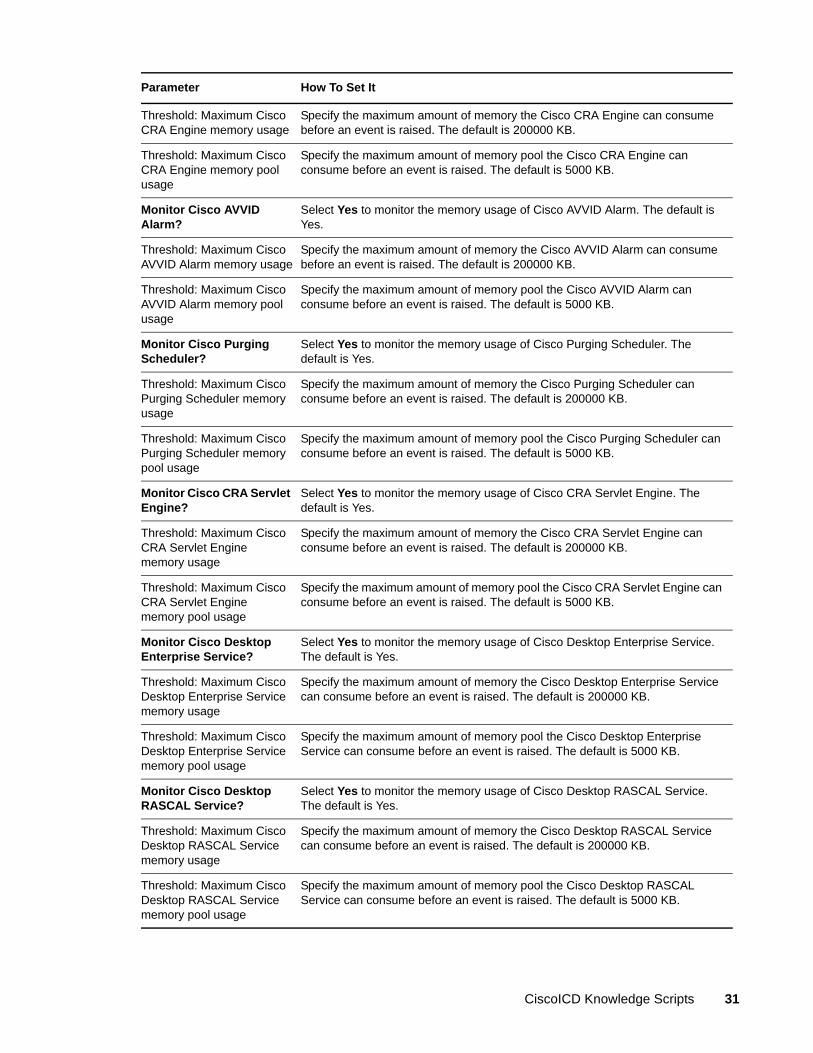
Threshold: Maximum Cisco CRA Engine memory usage
Specify the maximum amount of memory the Cisco CRA Engine can consume before an event is raised. The default is 200000 KB.
Threshold: Maximum Cisco CRA Engine memory pool usage
Specify the maximum amount of memory pool the Cisco CRA Engine can consume before an event is raised. The default is 5000 KB.
Monitor Cisco AVVID Alarm?
Select Yes to monitor the memory usage of Cisco AVVID Alarm. The default is Yes.
Threshold: Maximum Cisco AVVID Alarm memory usage
Specify the maximum amount of memory the Cisco AVVID Alarm can consume before an event is raised. The default is 200000 KB.
Threshold: Maximum Cisco AVVID Alarm memory pool usage
Specify the maximum amount of memory pool the Cisco AVVID Alarm can consume before an event is raised. The default is 5000 KB.
Monitor Cisco Purging Scheduler?
Select Yes to monitor the memory usage of Cisco Purging Scheduler. The default is Yes.
Threshold: Maximum Cisco Purging Scheduler memory usage
Specify the maximum amount of memory the Cisco Purging Scheduler can consume before an event is raised. The default is 200000 KB.
Threshold: Maximum Cisco Purging Scheduler memory pool usage
Specify the maximum amount of memory pool the Cisco Purging Scheduler can consume before an event is raised. The default is 5000 KB.
Monitor Cisco CRA Servlet Engine?
Select Yes to monitor the memory usage of Cisco CRA Servlet Engine. The default is Yes.
Threshold: Maximum Cisco CRA Servlet Engine memory usage
Specify the maximum amount of memory the Cisco CRA Servlet Engine can consume before an event is raised. The default is 200000 KB.
Threshold: Maximum Cisco CRA Servlet Engine memory pool usage
Specify the maximum amount of memory pool the Cisco CRA Servlet Engine can consume before an event is raised. The default is 5000 KB.
Monitor Cisco Desktop Enterprise Service?
Select Yes to monitor the memory usage of Cisco Desktop Enterprise Service. The default is Yes.
Threshold: Maximum Cisco Desktop Enterprise Service memory usage
Specify the maximum amount of memory the Cisco Desktop Enterprise Service can consume before an event is raised. The default is 200000 KB.
Threshold: Maximum Cisco Desktop Enterprise Service memory pool usage
Specify the maximum amount of memory pool the Cisco Desktop Enterprise Service can consume before an event is raised. The default is 5000 KB.
Monitor Cisco Desktop RASCAL Service?
Select Yes to monitor the memory usage of Cisco Desktop RASCAL Service. The default is Yes.
Threshold: Maximum Cisco Desktop RASCAL Service memory usage
Specify the maximum amount of memory the Cisco Desktop RASCAL Service can consume before an event is raised. The default is 200000 KB.
Threshold: Maximum Cisco Desktop RASCAL Service memory pool usage
Specify the maximum amount of memory pool the Cisco Desktop RASCAL Service can consume before an event is raised. The default is 5000 KB.
Parameter How To Set It
CiscoICD Knowledge Scripts 31
Monitor Cisco Desktop Sync Service?
Select Yes to monitor the memory usage of Cisco Desktop Sync Service. The default is Yes.
Threshold: Maximum Cisco Desktop Sync Service memory usage
Specify the maximum amount of memory the Cisco Desktop Sync Service can consume before an event is raised. The default is 200000 KB.
Threshold: Maximum Cisco Desktop Sync Service memory pool usage
Specify the maximum amount of memory pool the Cisco Desktop Sync Service can consume before an event is raised. The default is 5000 KB.
Monitor Cisco Desktop TAI Service?
Select Yes to monitor the memory usage of Cisco Desktop TAI Service. The default is Yes.
Threshold: Maximum Cisco Desktop TAI Service memory usage
Specify the maximum amount of memory the Cisco Desktop TAI Service can consume before an event is raised. The default is 200000 KB.
Threshold: Maximum Cisco Desktop TAI Service memory pool usage
Specify the maximum amount of memory pool the Cisco Desktop TAI Service can consume before an event is raised. The default is 5000 KB.
Monitor Cisco VoIP Monitor Service?
Select Yes to monitor the memory usage of Cisco VoIP Monitor Service. The default is Yes.
Threshold: Maximum Cisco VoIP Monitor Service memory usage
Specify the maximum amount of memory the Cisco VoIP Monitor Service can consume before an event is raised. The default is 200000 KB.
Threshold: Maximum Cisco VoIP Monitor Service memory pool usage
Specify the maximum amount of memory pool the Cisco VoIP Monitor Service can consume before an event is raised. The default is 5000 KB.
Version 4.x Services
Monitor Cisco CRS Node Manager?
Select Yes to monitor the memory usage of Cisco CRS Node Manager. The default is Yes.
Threshold: Maximum Cisco CRS Node Manager memory usage
Specify the maximum amount of memory the Cisco CRS Node Manager can consume before an event is raised. The default is 200000 KB.
Threshold: Maximum Cisco CRS Node Manager memory pool usage
Specify the maximum amount of memory pool the Cisco CRS Node Manager can consume before an event is raised. The default is 5000 KB.
Monitor Cisco AVVID Alarm?
Select Yes to monitor the memory usage of Cisco AVVID Alarm. The default is Yes.
Threshold: Maximum Cisco AVVID Alarm memory usage
Specify the maximum amount of memory the Cisco AVVID Alarm can consume before an event is raised. The default is 200000 KB.
Threshold: Maximum Cisco AVVID Alarm memory pool usage
Specify the maximum amount of memory pool the Cisco AVVID Alarm can consume before an event is raised. The default is 5000 KB.
Monitor Cisco Desktop Enterprise Service?
Select Yes to monitor the memory usage of Cisco Desktop Enterprise Service. The default is Yes.
Threshold: Maximum Cisco Desktop Enterprise Service memory usage
Specify the maximum amount of memory the Cisco Desktop Enterprise Service can consume before an event is raised. The default is 200000 KB.
Parameter How To Set It
32 NetIQ AppManager for Cisco Integrated Contact Distribution Management Guide
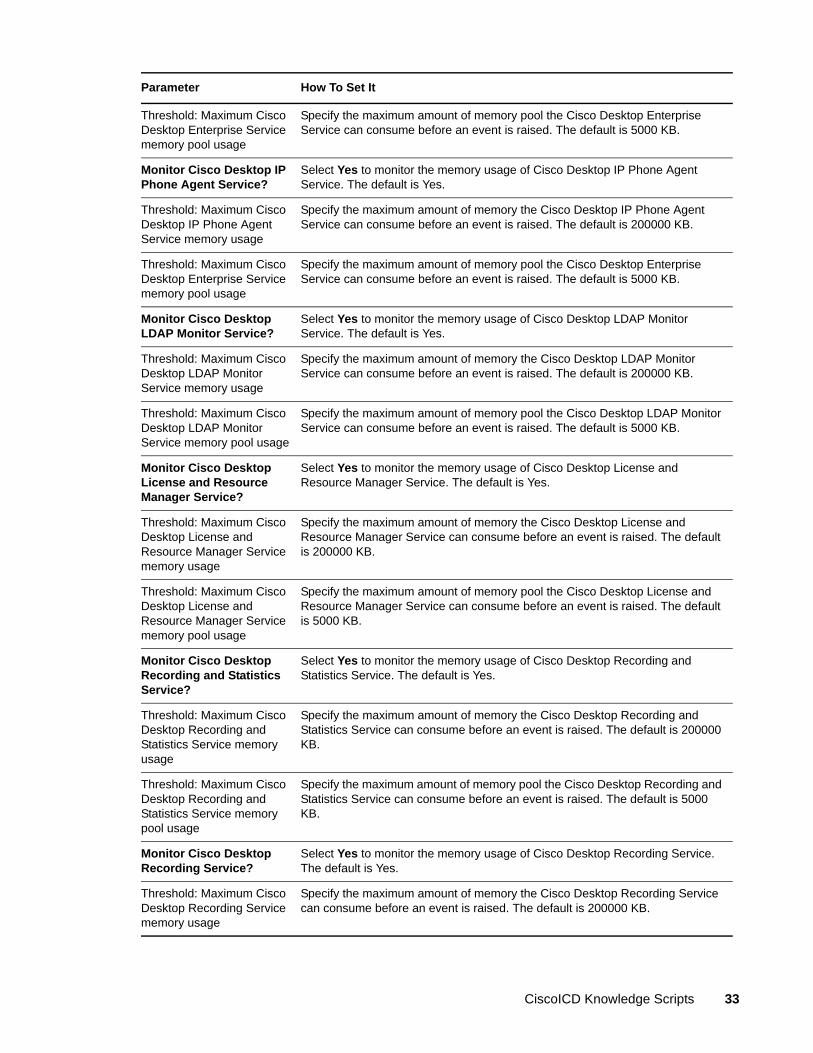
Threshold: Maximum Cisco Desktop Enterprise Service memory pool usage
Specify the maximum amount of memory pool the Cisco Desktop Enterprise Service can consume before an event is raised. The default is 5000 KB.
Monitor Cisco Desktop IP Phone Agent Service?
Select Yes to monitor the memory usage of Cisco Desktop IP Phone Agent Service. The default is Yes.
Threshold: Maximum Cisco Desktop IP Phone Agent Service memory usage
Specify the maximum amount of memory the Cisco Desktop IP Phone Agent Service can consume before an event is raised. The default is 200000 KB.
Threshold: Maximum Cisco Desktop Enterprise Service memory pool usage
Specify the maximum amount of memory pool the Cisco Desktop Enterprise Service can consume before an event is raised. The default is 5000 KB.
Monitor Cisco Desktop LDAP Monitor Service?
Select Yes to monitor the memory usage of Cisco Desktop LDAP Monitor Service. The default is Yes.
Threshold: Maximum Cisco Desktop LDAP Monitor Service memory usage
Specify the maximum amount of memory the Cisco Desktop LDAP Monitor Service can consume before an event is raised. The default is 200000 KB.
Threshold: Maximum Cisco Desktop LDAP Monitor Service memory pool usage
Specify the maximum amount of memory pool the Cisco Desktop LDAP Monitor Service can consume before an event is raised. The default is 5000 KB.
Monitor Cisco Desktop License and Resource Manager Service?
Select Yes to monitor the memory usage of Cisco Desktop License and Resource Manager Service. The default is Yes.
Threshold: Maximum Cisco Desktop License and Resource Manager Service memory usage
Specify the maximum amount of memory the Cisco Desktop License and Resource Manager Service can consume before an event is raised. The default is 200000 KB.
Threshold: Maximum Cisco Desktop License and Resource Manager Service memory pool usage
Specify the maximum amount of memory pool the Cisco Desktop License and Resource Manager Service can consume before an event is raised. The default is 5000 KB.
Monitor Cisco Desktop Recording and Statistics Service?
Select Yes to monitor the memory usage of Cisco Desktop Recording and Statistics Service. The default is Yes.
Threshold: Maximum Cisco Desktop Recording and Statistics Service memory usage
Specify the maximum amount of memory the Cisco Desktop Recording and Statistics Service can consume before an event is raised. The default is 200000 KB.
Threshold: Maximum Cisco Desktop Recording and Statistics Service memory pool usage
Specify the maximum amount of memory pool the Cisco Desktop Recording and Statistics Service can consume before an event is raised. The default is 5000 KB.
Monitor Cisco Desktop Recording Service?
Select Yes to monitor the memory usage of Cisco Desktop Recording Service. The default is Yes.
Threshold: Maximum Cisco Desktop Recording Service memory usage
Specify the maximum amount of memory the Cisco Desktop Recording Service can consume before an event is raised. The default is 200000 KB.
Parameter How To Set It
CiscoICD Knowledge Scripts 33
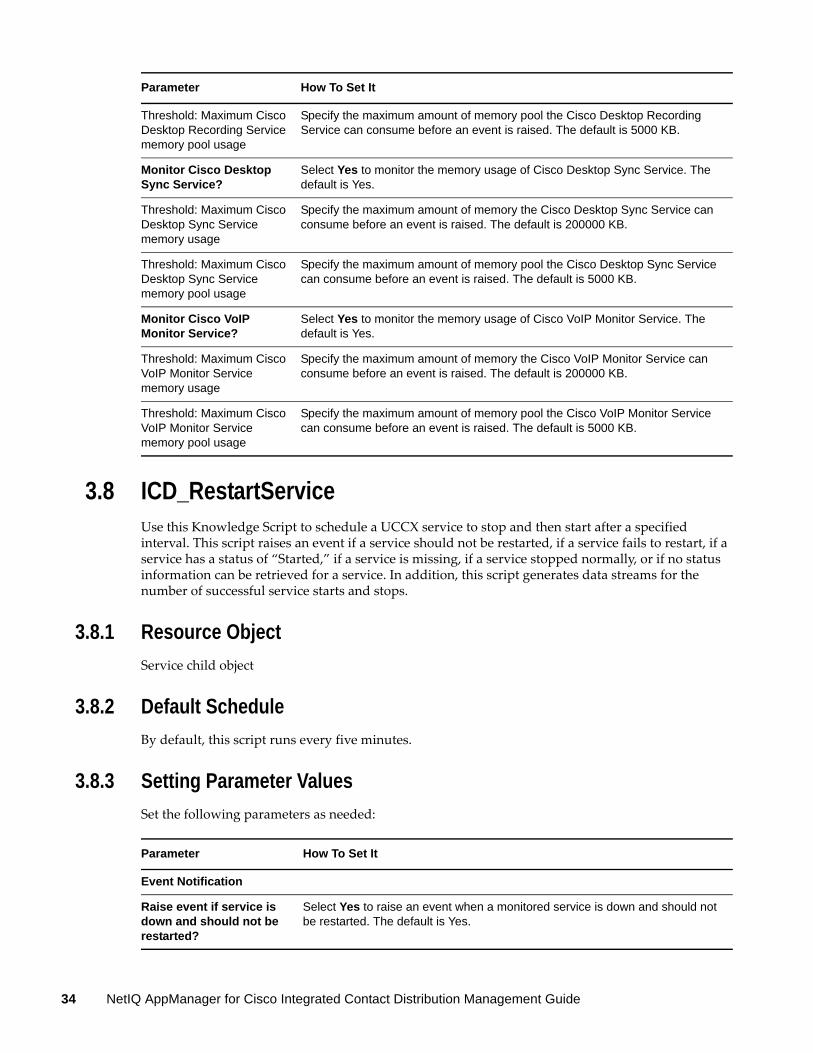
3.8 ICD_RestartServiceUse this Knowledge Script to schedule a UCCX service to stop and then start after a specified interval. This script raises an event if a service should not be restarted, if a service fails to restart, if a service has a status of “Started,” if a service is missing, if a service stopped normally, or if no status information can be retrieved for a service. In addition, this script generates data streams for the number of successful service starts and stops.
3.8.1 Resource Object
Service child object
3.8.2 Default Schedule
By default, this script runs every five minutes.
3.8.3 Setting Parameter Values
Set the following parameters as needed:
Threshold: Maximum Cisco Desktop Recording Service memory pool usage
Specify the maximum amount of memory pool the Cisco Desktop Recording Service can consume before an event is raised. The default is 5000 KB.
Monitor Cisco Desktop Sync Service?
Select Yes to monitor the memory usage of Cisco Desktop Sync Service. The default is Yes.
Threshold: Maximum Cisco Desktop Sync Service memory usage
Specify the maximum amount of memory the Cisco Desktop Sync Service can consume before an event is raised. The default is 200000 KB.
Threshold: Maximum Cisco Desktop Sync Service memory pool usage
Specify the maximum amount of memory pool the Cisco Desktop Sync Service can consume before an event is raised. The default is 5000 KB.
Monitor Cisco VoIP Monitor Service?
Select Yes to monitor the memory usage of Cisco VoIP Monitor Service. The default is Yes.
Threshold: Maximum Cisco VoIP Monitor Service memory usage
Specify the maximum amount of memory the Cisco VoIP Monitor Service can consume before an event is raised. The default is 200000 KB.
Threshold: Maximum Cisco VoIP Monitor Service memory pool usage
Specify the maximum amount of memory pool the Cisco VoIP Monitor Service can consume before an event is raised. The default is 5000 KB.
Parameter How To Set It
Parameter How To Set It
Event Notification
Raise event if service is down and should not be restarted?
Select Yes to raise an event when a monitored service is down and should not be restarted. The default is Yes.
34 NetIQ AppManager for Cisco Integrated Contact Distribution Management Guide
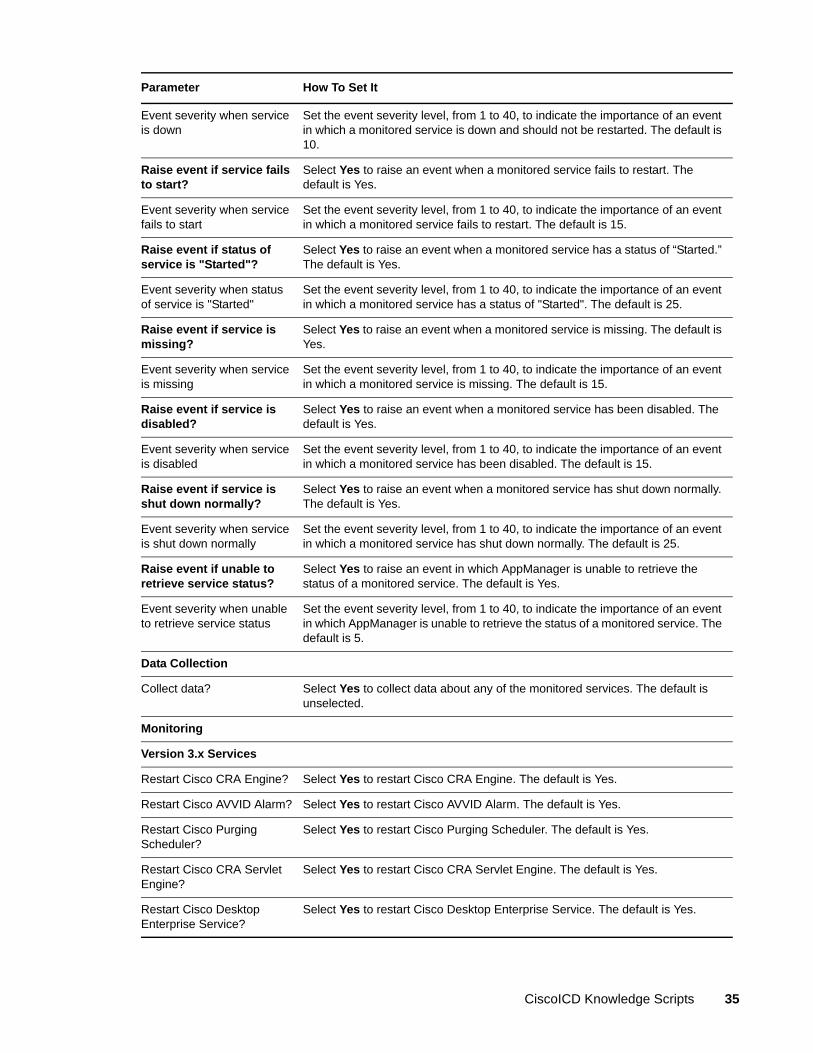
Event severity when service is down
Set the event severity level, from 1 to 40, to indicate the importance of an event in which a monitored service is down and should not be restarted. The default is 10.
Raise event if service fails to start?
Select Yes to raise an event when a monitored service fails to restart. The default is Yes.
Event severity when service fails to start
Set the event severity level, from 1 to 40, to indicate the importance of an event in which a monitored service fails to restart. The default is 15.
Raise event if status of service is "Started"?
Select Yes to raise an event when a monitored service has a status of “Started.” The default is Yes.
Event severity when status of service is "Started"
Set the event severity level, from 1 to 40, to indicate the importance of an event in which a monitored service has a status of "Started". The default is 25.
Raise event if service is missing?
Select Yes to raise an event when a monitored service is missing. The default is Yes.
Event severity when service is missing
Set the event severity level, from 1 to 40, to indicate the importance of an event in which a monitored service is missing. The default is 15.
Raise event if service is disabled?
Select Yes to raise an event when a monitored service has been disabled. The default is Yes.
Event severity when service is disabled
Set the event severity level, from 1 to 40, to indicate the importance of an event in which a monitored service has been disabled. The default is 15.
Raise event if service is shut down normally?
Select Yes to raise an event when a monitored service has shut down normally. The default is Yes.
Event severity when service is shut down normally
Set the event severity level, from 1 to 40, to indicate the importance of an event in which a monitored service has shut down normally. The default is 25.
Raise event if unable to retrieve service status?
Select Yes to raise an event in which AppManager is unable to retrieve the status of a monitored service. The default is Yes.
Event severity when unable to retrieve service status
Set the event severity level, from 1 to 40, to indicate the importance of an event in which AppManager is unable to retrieve the status of a monitored service. The default is 5.
Data Collection
Collect data? Select Yes to collect data about any of the monitored services. The default is unselected.
Monitoring
Version 3.x Services
Restart Cisco CRA Engine? Select Yes to restart Cisco CRA Engine. The default is Yes.
Restart Cisco AVVID Alarm? Select Yes to restart Cisco AVVID Alarm. The default is Yes.
Restart Cisco Purging Scheduler?
Select Yes to restart Cisco Purging Scheduler. The default is Yes.
Restart Cisco CRA Servlet Engine?
Select Yes to restart Cisco CRA Servlet Engine. The default is Yes.
Restart Cisco Desktop Enterprise Service?
Select Yes to restart Cisco Desktop Enterprise Service. The default is Yes.
Parameter How To Set It
CiscoICD Knowledge Scripts 35

Restart Cisco Desktop RASCAL Service?
Select Yes to restart Cisco Desktop RASCAL Service. The default is Yes.
Restart Cisco Desktop Sync Service?
Select Yes to restart Cisco Desktop Sync Service. The default is Yes.
Restart Cisco Desktop TAI Service?
Select Yes to restart Cisco Desktop TAI Service. The default is Yes.
Restart Cisco Desktop VoIP Monitor Service?
Select Yes to restart Cisco Desktop VoIP Monitor Service. The default is Yes.
Version 4.x Services
Restart Cisco CRS Node Manager?
Select Yes to restart Cisco CRS Node Manager. The default is Yes.
Restart Cisco AVVID Alarm? Select Yes to restart Cisco AVVID Alarm. The default is Yes.
Restart Cisco Desktop Enterprise Service?
Select Yes to restart Cisco Desktop Enterprise Service. The default is Yes.
Restart Cisco Desktop IP Phone Agent Service?
Select Yes to restart Cisco Desktop IP Phone Agent Service. The default is Yes.
Restart Cisco Desktop LDAP Monitor Service?
Select Yes to restart Cisco Desktop LDAP Monitor Service. The default is Yes.
Restart Cisco Desktop License and Resource Manager Service?
Select Yes to restart Cisco Desktop License and Resource Manager Service. The default is Yes.
Restart Cisco Desktop Recording and Statistics Service?
Select Yes to restart Cisco Desktop Recording and Statistics Service. The default is Yes.
Restart Cisco Desktop Recording Service?
Select Yes to restart Cisco Desktop Recording Service. The default is Yes.
Restart Cisco Desktop Sync Service?
Select Yes to restart Cisco Desktop Sync Service. The default is Yes.
Restart Cisco Desktop VoIP Monitor Service?
Select Yes to restart Cisco Desktop VoIP Monitor Service. The default is Yes.
Start down services? Select Yes to start any monitored service that is down. The default is Yes.
Start dependent services? (6.0+)
Select Yes to start any dependent service that is down. The default is Yes.
Applies only to versions 6.0 and above.
Service start timeout Specify the maximum number of seconds that are allowed for a service to restart. If the specified time elapses and the service has not restarted, an event will be raised. The default is 30 seconds.
Restart service if shutdown is normal?
Select Yes to restart a service that has shut down normally. The default is Yes.
Wait N seconds before restarting service
Specify the number of seconds that should elapse before a service is restarted. The default is 10 seconds.
Parameter How To Set It
36 NetIQ AppManager for Cisco Integrated Contact Distribution Management Guide
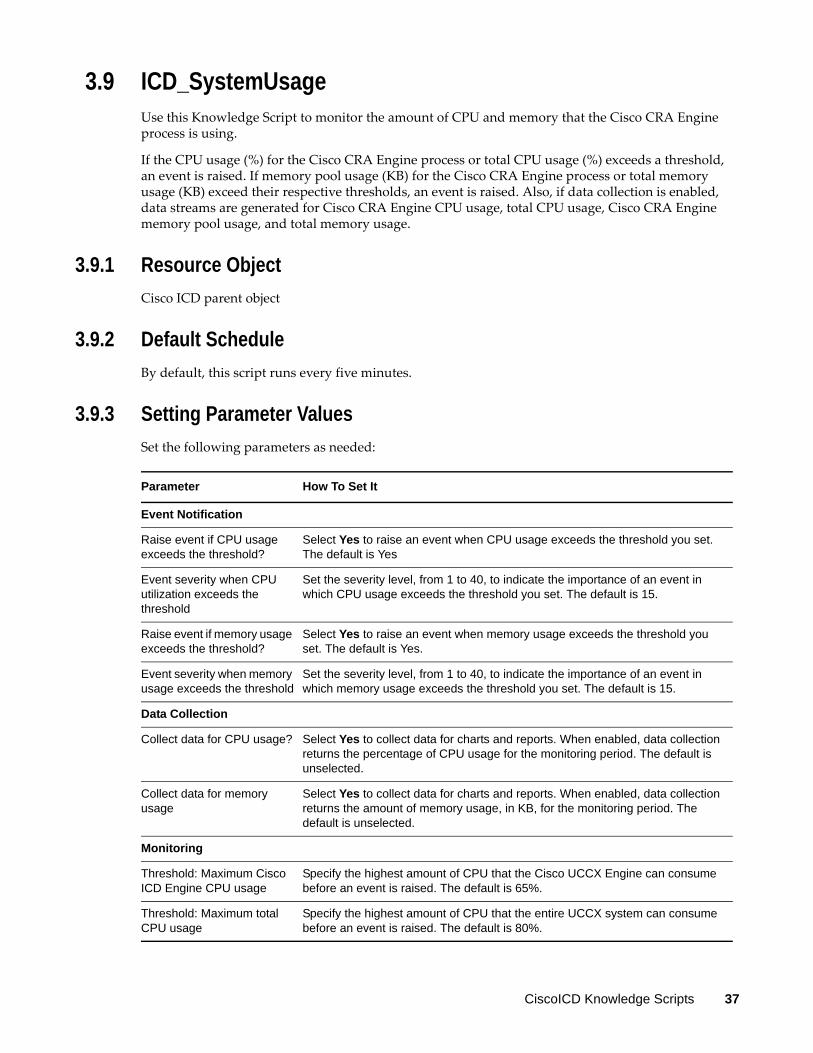
3.9 ICD_SystemUsageUse this Knowledge Script to monitor the amount of CPU and memory that the Cisco CRA Engine process is using.
If the CPU usage (%) for the Cisco CRA Engine process or total CPU usage (%) exceeds a threshold, an event is raised. If memory pool usage (KB) for the Cisco CRA Engine process or total memory usage (KB) exceed their respective thresholds, an event is raised. Also, if data collection is enabled, data streams are generated for Cisco CRA Engine CPU usage, total CPU usage, Cisco CRA Engine memory pool usage, and total memory usage.
3.9.1 Resource Object
Cisco ICD parent object
3.9.2 Default Schedule
By default, this script runs every five minutes.
3.9.3 Setting Parameter Values
Set the following parameters as needed:
Parameter How To Set It
Event Notification
Raise event if CPU usage exceeds the threshold?
Select Yes to raise an event when CPU usage exceeds the threshold you set. The default is Yes
Event severity when CPU utilization exceeds the threshold
Set the severity level, from 1 to 40, to indicate the importance of an event in which CPU usage exceeds the threshold you set. The default is 15.
Raise event if memory usage exceeds the threshold?
Select Yes to raise an event when memory usage exceeds the threshold you set. The default is Yes.
Event severity when memory usage exceeds the threshold
Set the severity level, from 1 to 40, to indicate the importance of an event in which memory usage exceeds the threshold you set. The default is 15.
Data Collection
Collect data for CPU usage? Select Yes to collect data for charts and reports. When enabled, data collection returns the percentage of CPU usage for the monitoring period. The default is unselected.
Collect data for memory usage
Select Yes to collect data for charts and reports. When enabled, data collection returns the amount of memory usage, in KB, for the monitoring period. The default is unselected.
Monitoring
Threshold: Maximum Cisco ICD Engine CPU usage
Specify the highest amount of CPU that the Cisco UCCX Engine can consume before an event is raised. The default is 65%.
Threshold: Maximum total CPU usage
Specify the highest amount of CPU that the entire UCCX system can consume before an event is raised. The default is 80%.
CiscoICD Knowledge Scripts 37
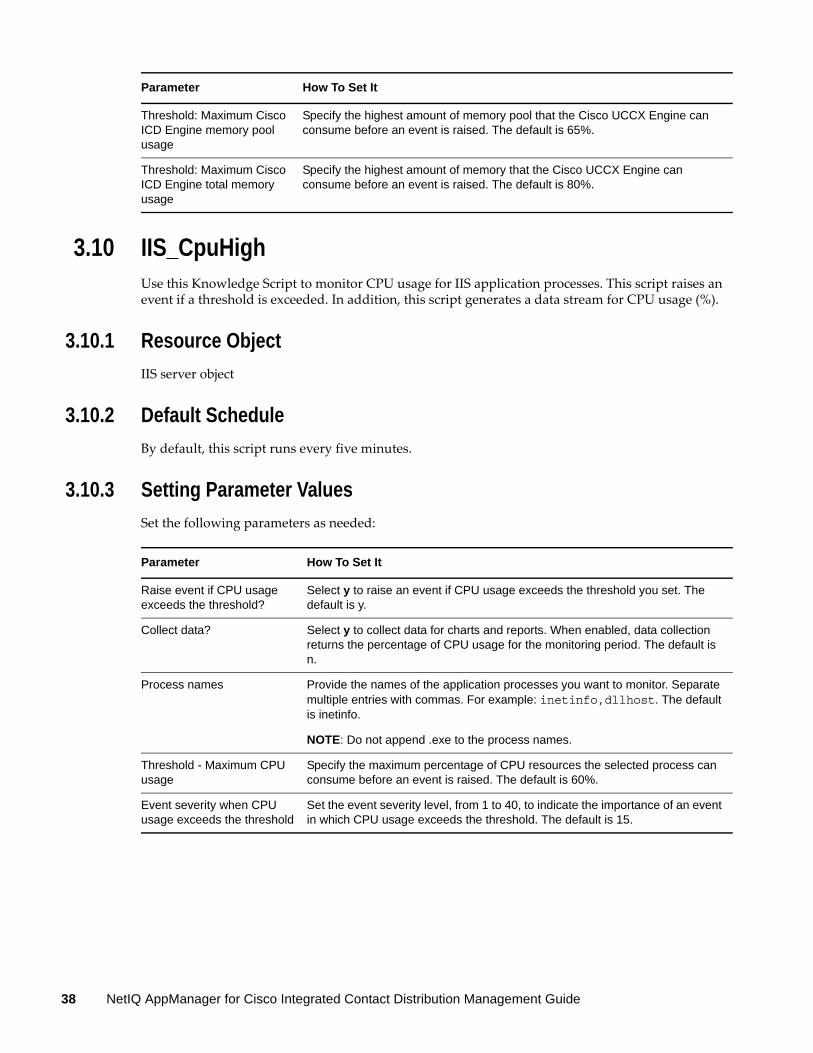
3.10 IIS_CpuHighUse this Knowledge Script to monitor CPU usage for IIS application processes. This script raises an event if a threshold is exceeded. In addition, this script generates a data stream for CPU usage (%).
3.10.1 Resource Object
IIS server object
3.10.2 Default Schedule
By default, this script runs every five minutes.
3.10.3 Setting Parameter Values
Set the following parameters as needed:
Threshold: Maximum Cisco ICD Engine memory pool usage
Specify the highest amount of memory pool that the Cisco UCCX Engine can consume before an event is raised. The default is 65%.
Threshold: Maximum Cisco ICD Engine total memory usage
Specify the highest amount of memory that the Cisco UCCX Engine can consume before an event is raised. The default is 80%.
Parameter How To Set It
Parameter How To Set It
Raise event if CPU usage exceeds the threshold?
Select y to raise an event if CPU usage exceeds the threshold you set. The default is y.
Collect data? Select y to collect data for charts and reports. When enabled, data collection returns the percentage of CPU usage for the monitoring period. The default is n.
Process names Provide the names of the application processes you want to monitor. Separate multiple entries with commas. For example: inetinfo,dllhost. The default is inetinfo.
NOTE: Do not append .exe to the process names.
Threshold - Maximum CPU usage
Specify the maximum percentage of CPU resources the selected process can consume before an event is raised. The default is 60%.
Event severity when CPU usage exceeds the threshold
Set the event severity level, from 1 to 40, to indicate the importance of an event in which CPU usage exceeds the threshold. The default is 15.
38 NetIQ AppManager for Cisco Integrated Contact Distribution Management Guide

3.11 IIS_HealthCheckUse this Knowledge Script to check IIS servers, Web site status, and the queue length for blocked I/O requests. If any server or Web site is not running, an event is raised. In addition, you can choose to automatically restart the IIS server or Web site. This script raises an event if the blocked I/O queue length is longer than the specified threshold.
This script monitors only Web sites (servers), not FTP sites, NNTP sites, or SMTP sites.
3.11.1 Resource Object
IIS server object
3.11.2 Default Schedule
By default, this script runs every five minutes.
3.11.3 Setting Parameter Values
Set the following parameters as needed:
3.12 IIS_KillTopCPUProcsUse this Knowledge Script to monitor the CPU usage for the IIS dllhost and mtx processes. This script raises an event if a threshold is exceeded. You can set this script to automatically stop a process that exceeds the CPU usage threshold.
Parameter How To Set It
Auto-start monitored server(s)?
Select y to automatically restart down servers. The default is y.
Event severity when auto-start fails
Set the severity level, from 1 to 40, to indicate the importance of an event in which monitored server fails to start. The default is 5.
Event severity when auto-start succeeds
Set the severity level, from 1 to 40, to indicate the importance of an event in which a monitored server starts successfully. The default is 25.
Event severity when auto-start is set to "n"
Set the severity level, from 1 to 40, to indicate the importance of an event in which the server is down and the Auto-start monitored servers? parameter is set to n. The default is 18.
Event severity for blocked I/O requests
Set the event severity level, from 1 to 40, to indicate the importance of an event in which blocked I/O requests are in queue. The default is 5.
Threshold - Maximum blocked I/O requests
Specify the maximum number of blocked I/O requests that can be in the queue before an event is raised. The default is zero requests.
Monitor IIS server? Select y to monitor the IIS server. The default is y.
Monitor FTP server? Select y to monitor the FTP server. The default is n.
CiscoICD Knowledge Scripts 39

3.12.1 Resource Object
IIS server object
3.12.2 Default Schedule
By default, this script runs every three minutes.
3.12.3 Setting Parameter Values
Set the following parameters as needed:
3.13 IIS_MemoryHighUse this Knowledge Script to monitor memory usage for selected IIS application processes. This script raises an event memory usage exceeds the threshold you set. In addition, this script generates a data stream for memory usage (%).
3.13.1 Resource Object
IIS server object
3.13.2 Default Schedule
By default, this script runs every five minutes.
Parameter How To Set It
Raise event if kill is successful or unsuccessful?
Select y to raise an event if the stop process is successful or unsuccessful. The default is y.
Kill CPU-intensive processes?
Select y to automatically stop any process that exceeds the CPU usage threshold. The default is n.
Threshold - Maximum CPU usage allowed
Specify the maximum percentage of CPU the dllhost and mtx processes can consume before an event is raised. The default is 90%.
Event severity when CPU usage exceeds threshold
Set the severity level, from 1 to 40, to indicate the importance of an event in which CPU usage exceeds the threshold. The default is 10.
Event severity when kill fails Set the severity level, from 1 to 40, to indicate the importance of an event in which a process exceeds the threshold and AppManager cannot stop the process. The default is 10.
Event severity when kill succeeds
Set the severity level, from 1 to 40, to indicate the importance of an event in which a process exceeds the threshold and AppManager has successfully stopped the process. The default is 20.
40 NetIQ AppManager for Cisco Integrated Contact Distribution Management Guide
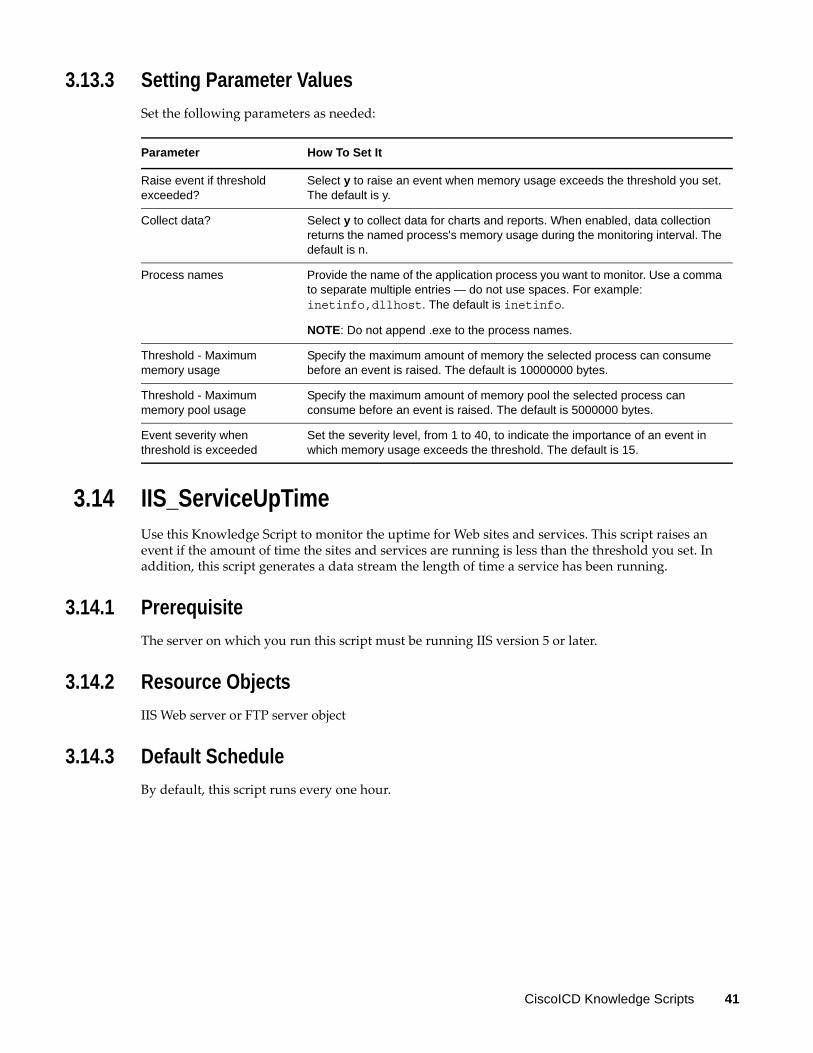
3.13.3 Setting Parameter Values
Set the following parameters as needed:
3.14 IIS_ServiceUpTimeUse this Knowledge Script to monitor the uptime for Web sites and services. This script raises an event if the amount of time the sites and services are running is less than the threshold you set. In addition, this script generates a data stream the length of time a service has been running.
3.14.1 Prerequisite
The server on which you run this script must be running IIS version 5 or later.
3.14.2 Resource Objects
IIS Web server or FTP server object
3.14.3 Default Schedule
By default, this script runs every one hour.
Parameter How To Set It
Raise event if threshold exceeded?
Select y to raise an event when memory usage exceeds the threshold you set. The default is y.
Collect data? Select y to collect data for charts and reports. When enabled, data collection returns the named process's memory usage during the monitoring interval. The default is n.
Process names Provide the name of the application process you want to monitor. Use a comma to separate multiple entries — do not use spaces. For example: inetinfo,dllhost. The default is inetinfo.
NOTE: Do not append .exe to the process names.
Threshold - Maximum memory usage
Specify the maximum amount of memory the selected process can consume before an event is raised. The default is 10000000 bytes.
Threshold - Maximum memory pool usage
Specify the maximum amount of memory pool the selected process can consume before an event is raised. The default is 5000000 bytes.
Event severity when threshold is exceeded
Set the severity level, from 1 to 40, to indicate the importance of an event in which memory usage exceeds the threshold. The default is 15.
CiscoICD Knowledge Scripts 41

3.14.4 Setting Parameter Values
Set the following parameters as needed:
3.15 SQL_AccessibilityUse this Knowledge Script to monitor SQL Server and database accessibility. This script raises an event if a SQL Server or a specified database is not accessible. In addition, this script can generate data streams for database accessibility.
3.15.1 Resource Object
Cisco ICD SQL Server object
3.15.2 Default Schedule
By default, this script runs every hour.
3.15.3 Setting Parameter Values
Set the following parameters as needed:
Parameter How To Set It
Raise event if uptime falls below threshold?
Select y to raise an event if uptime falls below the threshold. The default is y.
Collect data? Select y to collect data for charts and reports. When enabled, data collection returns the number of seconds a service has been running during the monitoring interval. The default is n.
Threshold - Minimum uptime Specify the minimum amount of time that discovered Web site/services and FTP sites/services are required to be running to prevent an event from being raised. The default is 10000 seconds.
Event severity when uptime falls below threshold
Set the severity level, from 1 to 40, to indicate the importance of an event in which uptime falls below the threshold. The default is 5.
Parameter How To Set It
Event Notification
Raise event if SQL Server or specified database not accessible
Select Yes to raise an event if SQL Server or the specified database is not accessible. The default is s.
Event severity when SQL Server or specified database not accessible
Set the severity level, from 1 to 40, to indicate the importance of an event in which SQL Server or the database is not accessible. The default is 5.
Data Collection
42 NetIQ AppManager for Cisco Integrated Contact Distribution Management Guide
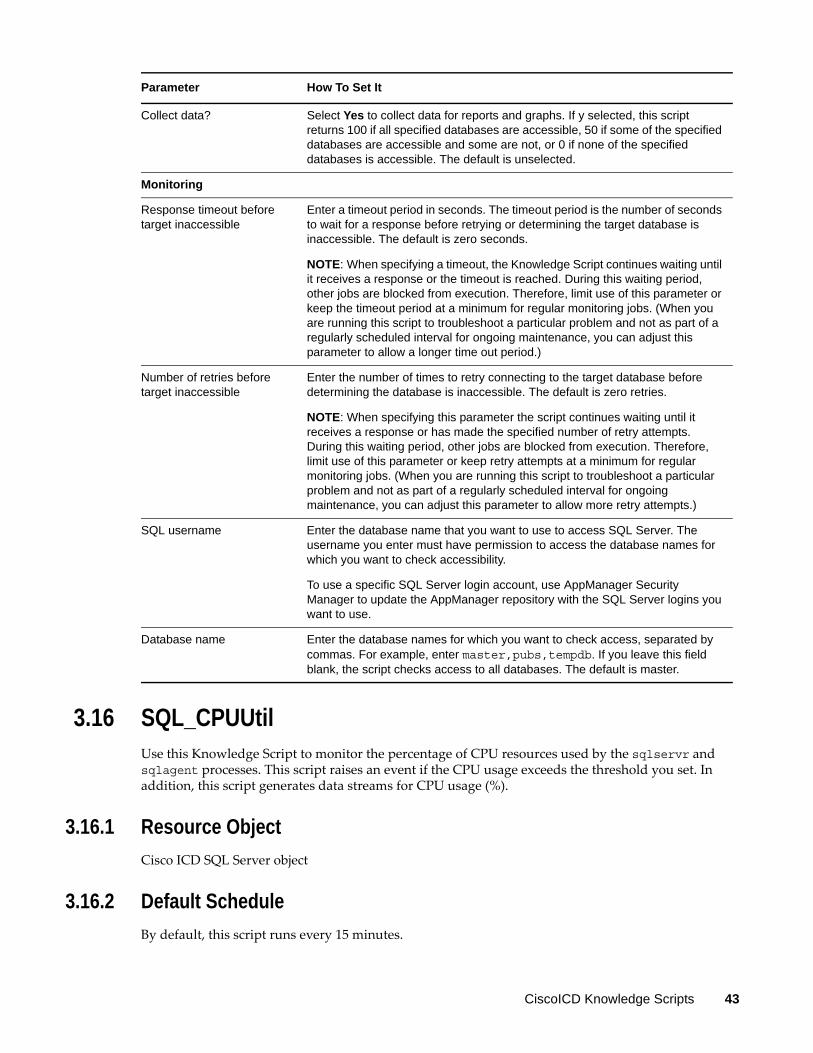
3.16 SQL_CPUUtilUse this Knowledge Script to monitor the percentage of CPU resources used by the sqlservr and sqlagent processes. This script raises an event if the CPU usage exceeds the threshold you set. In addition, this script generates data streams for CPU usage (%).
3.16.1 Resource Object
Cisco ICD SQL Server object
3.16.2 Default Schedule
By default, this script runs every 15 minutes.
Collect data? Select Yes to collect data for reports and graphs. If y selected, this script returns 100 if all specified databases are accessible, 50 if some of the specified databases are accessible and some are not, or 0 if none of the specified databases is accessible. The default is unselected.
Monitoring
Response timeout before target inaccessible
Enter a timeout period in seconds. The timeout period is the number of seconds to wait for a response before retrying or determining the target database is inaccessible. The default is zero seconds.
NOTE: When specifying a timeout, the Knowledge Script continues waiting until it receives a response or the timeout is reached. During this waiting period, other jobs are blocked from execution. Therefore, limit use of this parameter or keep the timeout period at a minimum for regular monitoring jobs. (When you are running this script to troubleshoot a particular problem and not as part of a regularly scheduled interval for ongoing maintenance, you can adjust this parameter to allow a longer time out period.)
Number of retries before target inaccessible
Enter the number of times to retry connecting to the target database before determining the database is inaccessible. The default is zero retries.
NOTE: When specifying this parameter the script continues waiting until it receives a response or has made the specified number of retry attempts. During this waiting period, other jobs are blocked from execution. Therefore, limit use of this parameter or keep retry attempts at a minimum for regular monitoring jobs. (When you are running this script to troubleshoot a particular problem and not as part of a regularly scheduled interval for ongoing maintenance, you can adjust this parameter to allow more retry attempts.)
SQL username Enter the database name that you want to use to access SQL Server. The username you enter must have permission to access the database names for which you want to check accessibility.
To use a specific SQL Server login account, use AppManager Security Manager to update the AppManager repository with the SQL Server logins you want to use.
Database name Enter the database names for which you want to check access, separated by commas. For example, enter master,pubs,tempdb. If you leave this field blank, the script checks access to all databases. The default is master.
Parameter How To Set It
CiscoICD Knowledge Scripts 43

3.16.3 Setting Parameter Values
Set the following parameters as needed:
3.17 SQL_DataGrowthRateUse this Knowledge Script to monitor the data growth and shrink rates for all SQL Server databases. Growth and shrink rates are calculated by taking the difference between the data space utilization from the current interval and the data space utilization from the last interval. This script raises an event if a threshold is exceeded. In addition, this script generates data streams for growth and shrink rates.
3.17.1 Resource Object
Cisco ICD SQL Server database object
3.17.2 Default Schedule
By default, this script runs every hour.
Parameter How To Set It
Event Notification
Raise event if the SQL Server process exceeds the threshold?
Select Yes to raise an event if SQL Server CPU usage exceeds the threshold. The default is y.
Event severity when the SQL Server process exceeds the threshold
Set the event severity level, from 1 to 40, to indicate the importance of an event in which SQL Server CPU usage exceeds the threshold. The default is 8.
Raise event if the SQL Agent process exceeds the threshold?
Select Yes to raise an event if SQL Agent CPU usage exceeds the threshold. The default is y.
Event severity when SQL Agent process exceeds the threshold
Set the event severity level, from 1 to 40, to indicate the importance of an event in which SQL Agent CPU usage exceeds the threshold. The default is 8.
Data Collection
Collect data? Select Yes to collect data for charts and reports. When enabled, data collection returns process CPU usage for the monitoring period. The default is unselected.
Monitoring
Threshold - Maximum CPU usage for SQL Server process
Specify the maximum amount of CPU that the SQL Server process can consume before an event is raised. The default is 10%.
Threshold - Maximum CPU usage for SQL Agent process
Specify the maximum amount of CPU that the SQL Agent process can consume before an event is raised. The default is 10%.
44 NetIQ AppManager for Cisco Integrated Contact Distribution Management Guide

3.17.3 Setting Parameter Values
Set the following parameters as needed:
Parameter How To Set It
Event Notification
Raise event if data growth rate exceeds the threshold
Select Yes to raise an event if the data growth rate exceeds the threshold. The default is Yes.
Event severity when data growth rate exceeds the threshold
Set the event severity level, from 1 to 40, to indicate the importance of an event in which the data growth rate exceeds the threshold. The default is 5.
Raise event if data shrink rate exceeds the threshold
Select Yes to raise an event if the data shrink rate exceeds the threshold. The default is Yes.
Event severity when data shrink rate exceeds the threshold
Set the event severity level, from 1 to 40, to indicate the importance of an event in which the data shrink rate exceeds the threshold. The default is 5.
Data Collection
Collect data? Select Yes to collect data about growth and shrink rates for reports and graphs. The default is unselected.
Monitoring
Dynamically enumerate at each interval
Select Yes to dynamically enumerate databases at each monitoring interval. The default is y.
To dynamically enumerate a database means that each time it runs, AppManager automatically determines and reports on all existing databases. Information is returned even for databases that are not yet discovered.
Exclude these objects Provide the names of objects you want to exclude from dynamic enumeration. You can exclude multiple objects, separated by commas with no spaces. For example, enter master,model,mdb
NOTE: Ignore this parameter if you are not dynamically enumerating databases.
Threshold - Maximum data growth rate
Specify the maximum percentage of data growth that is allowed between the last and current interval before an event is raised. Enter 0 to ignore this parameter. The default is 25%.
Threshold - Maximum data shrink rate
Specify the maximum percentage of data shrinkage that is allowed between the last and current intervals before an event is raised. Enter 0 to ignore this parameter. The default is 25%.
SQL username Specify the database username account that you want to use to access SQL Server. You can use the "sa" account or other user login accounts that have been set up in the managed client's SQL Server.
If you want to use a specific SQL Server login account, use AppManager Security Manager to update the AppManager repository with the SQL Server logins you want to use.
NOTE: If you are monitoring SQL Server 7, to use a sysadmin role account. Only members of the sysadmin role can retrieve file statistics on SQL Server 7.0.
CiscoICD Knowledge Scripts 45

3.18 SQL_DBGrowthRateUse this Knowledge Script to monitor database growth and shrink rates. Growth and shrink rates are calculated by taking the difference between the database space utilization from the current interval and the database space utilization from the last interval. This script raises an event if a threshold is exceeded. In addition, this script generates data streams for growth and shrink rates.
3.18.1 Resource Object
Cisco ICD SQL Server database object
3.18.2 Default Schedule
By default, this script runs every hour.
3.18.3 Setting Parameter Values
Set the following parameters as needed:
Parameter How To Set It
Event Notification
Raise event if database growth rate exceeds the threshold?
Select Yes to raise an event if the database growth rate exceeds the threshold. The default is Yes.
Event severity when database growth rate exceeds the threshold
Set the event severity level, from 1 to 40, to indicate the importance of an event in which the database growth rate exceeds the threshold. The default is 5.
Raise event if database shrink rate exceeds the threshold?
Select Yes to raise an event if the database shrink rate exceeds the threshold. The default is Yes.
Event severity when database shrink rate exceeds the threshold
Set the event severity level, from 1 to 40, to indicate the importance of an event in which the database shrink rate exceeds the threshold. The default is 5.
Data Collection
Collect data? Select Yes to collect data about growth and shrink rates for reports and graphs. The default is Yes.
Monitoring
Dynamically enumerate at each interval
Select Yes to dynamically enumerate databases at each monitoring interval. The default is y.
To dynamically enumerate a database means that each time it runs, AppManager automatically determines and reports on all existing databases. Information will be returned even for databases that are not yet discovered in the TreeView pane.
46 NetIQ AppManager for Cisco Integrated Contact Distribution Management Guide

3.19 SQL_MemUtilUse this Knowledge Script to monitor the amount of memory that is used by the processes: sqlservr and sqlagent processes
If using SQL Server 7.0 or 2000, you can use this script to monitor total server memory usage, number of free buffers, and memory usage.
This script raises an event if the amount of memory used by SQL Server exceeds the threshold you set. In addition, this script can generate data streams for memory usage (%).
3.19.1 Resource Object
Cisco ICD SQL Server object
3.19.2 Default Schedule
By default, this script runs every 10 minutes.
Exclude these objects Provide the names of objects you want to exclude from dynamic enumeration. You can exclude multiple objects, separated by commas with no spaces. For example, enter master,model,mdb
NOTE: Ignore this parameter if you are not dynamically enumerating databases.
Threshold - Maximum database growth rate
Specify the maximum percentage of database growth that is allowed between the last and current intervals before an event is raised. Enter 0 to ignore this parameter. The default is 25%.
Threshold - Maximum database shrink rate
Specify the maximum percentage of database shrinkage that is allowed between the last and current intervals before an event is raised. Enter 0 to ignore this parameter. The default is 25%.
SQL username Specify the database username that you want to use to access SQL Server. You can use the "sa" account or other user login accounts that have been set up in the managed client's SQL Server.
If you want to use a specific SQL Server login account, use AppManager Security Manager to update the AppManager repository with the SQL Server logins you want to use.
NOTE: If you are monitoring SQL Server 7, use a sysadmin role account. Only members of the sysadmin role can retrieve file statistics on SQL Server 7.0.
Update usage? Select Yes to have SQL Server recalculate the space usage. The default is unselected.
Parameter How To Set It
CiscoICD Knowledge Scripts 47
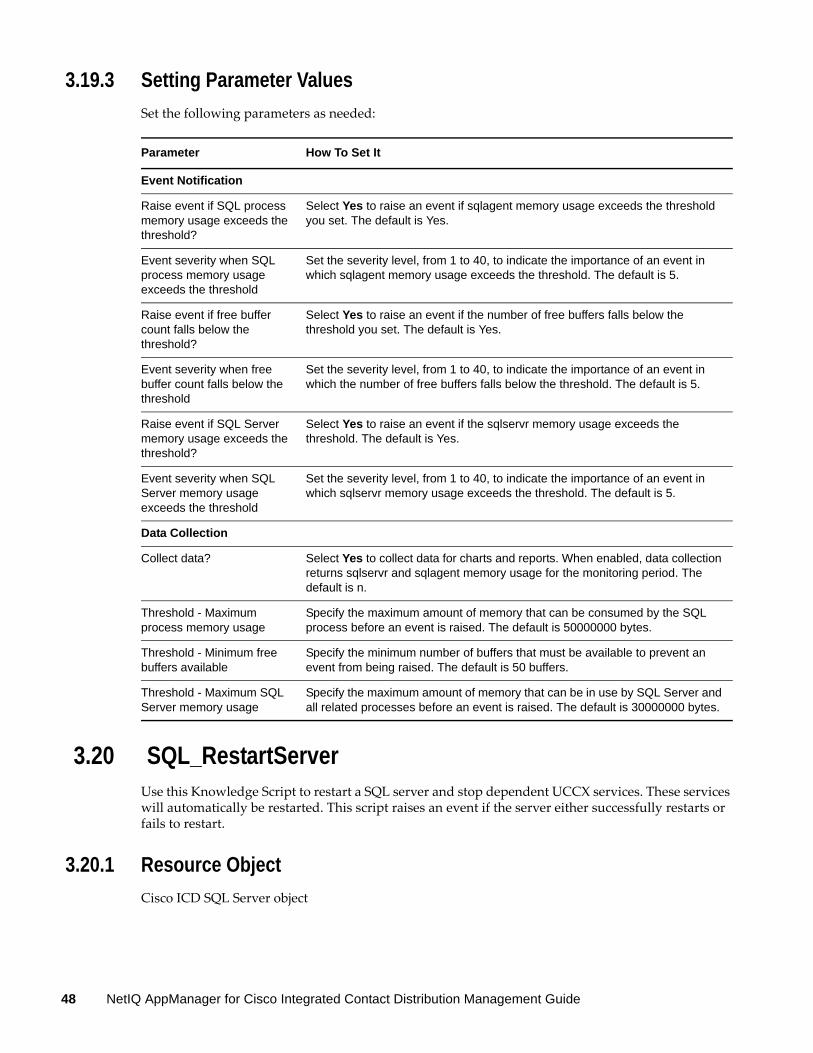
3.19.3 Setting Parameter Values
Set the following parameters as needed:
3.20 SQL_RestartServerUse this Knowledge Script to restart a SQL server and stop dependent UCCX services. These services will automatically be restarted. This script raises an event if the server either successfully restarts or fails to restart.
3.20.1 Resource Object
Cisco ICD SQL Server object
Parameter How To Set It
Event Notification
Raise event if SQL process memory usage exceeds the threshold?
Select Yes to raise an event if sqlagent memory usage exceeds the threshold you set. The default is Yes.
Event severity when SQL process memory usage exceeds the threshold
Set the severity level, from 1 to 40, to indicate the importance of an event in which sqlagent memory usage exceeds the threshold. The default is 5.
Raise event if free buffer count falls below the threshold?
Select Yes to raise an event if the number of free buffers falls below the threshold you set. The default is Yes.
Event severity when free buffer count falls below the threshold
Set the severity level, from 1 to 40, to indicate the importance of an event in which the number of free buffers falls below the threshold. The default is 5.
Raise event if SQL Server memory usage exceeds the threshold?
Select Yes to raise an event if the sqlservr memory usage exceeds the threshold. The default is Yes.
Event severity when SQL Server memory usage exceeds the threshold
Set the severity level, from 1 to 40, to indicate the importance of an event in which sqlservr memory usage exceeds the threshold. The default is 5.
Data Collection
Collect data? Select Yes to collect data for charts and reports. When enabled, data collection returns sqlservr and sqlagent memory usage for the monitoring period. The default is n.
Threshold - Maximum process memory usage
Specify the maximum amount of memory that can be consumed by the SQL process before an event is raised. The default is 50000000 bytes.
Threshold - Minimum free buffers available
Specify the minimum number of buffers that must be available to prevent an event from being raised. The default is 50 buffers.
Threshold - Maximum SQL Server memory usage
Specify the maximum amount of memory that can be in use by SQL Server and all related processes before an event is raised. The default is 30000000 bytes.
48 NetIQ AppManager for Cisco Integrated Contact Distribution Management Guide
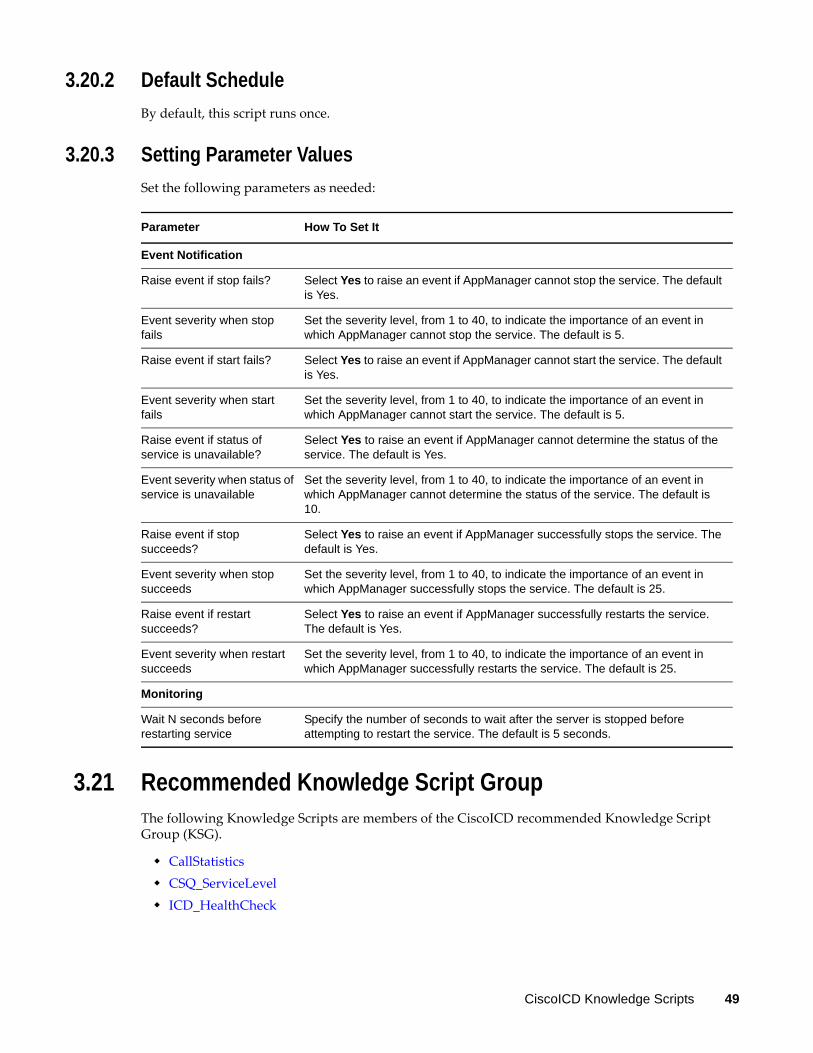
3.20.2 Default Schedule
By default, this script runs once.
3.20.3 Setting Parameter Values
Set the following parameters as needed:
3.21 Recommended Knowledge Script GroupThe following Knowledge Scripts are members of the CiscoICD recommended Knowledge Script Group (KSG).
CallStatistics CSQ_ServiceLevel ICD_HealthCheck
Parameter How To Set It
Event Notification
Raise event if stop fails? Select Yes to raise an event if AppManager cannot stop the service. The default is Yes.
Event severity when stop fails
Set the severity level, from 1 to 40, to indicate the importance of an event in which AppManager cannot stop the service. The default is 5.
Raise event if start fails? Select Yes to raise an event if AppManager cannot start the service. The default is Yes.
Event severity when start fails
Set the severity level, from 1 to 40, to indicate the importance of an event in which AppManager cannot start the service. The default is 5.
Raise event if status of service is unavailable?
Select Yes to raise an event if AppManager cannot determine the status of the service. The default is Yes.
Event severity when status of service is unavailable
Set the severity level, from 1 to 40, to indicate the importance of an event in which AppManager cannot determine the status of the service. The default is 10.
Raise event if stop succeeds?
Select Yes to raise an event if AppManager successfully stops the service. The default is Yes.
Event severity when stop succeeds
Set the severity level, from 1 to 40, to indicate the importance of an event in which AppManager successfully stops the service. The default is 25.
Raise event if restart succeeds?
Select Yes to raise an event if AppManager successfully restarts the service. The default is Yes.
Event severity when restart succeeds
Set the severity level, from 1 to 40, to indicate the importance of an event in which AppManager successfully restarts the service. The default is 25.
Monitoring
Wait N seconds before restarting service
Specify the number of seconds to wait after the server is stopped before attempting to restart the service. The default is 5 seconds.
CiscoICD Knowledge Scripts 49
ICD_SystemUsage SQL_DBGrowthRate
The parameters of all scripts in the KSG are set to recommended values. To run all of the recommended scripts at one time, click the RECOMMENDED tab and run the CiscoICD group on a Unified Contact Center Express (UCCX) resource.
Run the KSG on only one cluster at a time. Running the KSG on multiple clusters all at once hinders the proxy agent’s ability to spread out processing over time. You can monitor multiple clusters by running the KSG on the first cluster, and then repeating the process for each additional cluster.
The CiscoICD KSG provides a “best practices” usage of AppManager for monitoring your UCCX environment. You can use this KSG with AppManager monitoring policies. A monitoring policy, which enables you to efficiently and consistently monitor all the resources in your environment, uses a set of pre-configured Knowledge Scripts to automatically monitor resources as they appear in the TreeView. For more information, see “About Policy-Based Monitoring” in the AppManager Help.
A KSG is composed of a subset of a module’s Knowledge Scripts. The script that belongs to a KSG is a different copy of the original script you access from the CiscoICD tab. If you modify a script that belongs to a KSG, the parameter settings of the original script in the CiscoICD tab are not affected.
When deployed as part of a KSG, a script’s default script parameter settings may differ from when the script is deployed alone. The default settings of a script within a group depend on its monitoring purpose within the larger group, and on the intended monitoring scope of that group.
If you modify or remove a script associated with the CiscoICD KSG and want to restore it to its original form, you can reinstall the AppManager for Cisco Integrated Contact Distribution module on the repository computer or check in the appropriate script from the AppManager\qdb\kp\CiscoICD\RECOMMENDED_CiscoICD directory.
50 NetIQ AppManager for Cisco Integrated Contact Distribution Management Guide


